Crystal Bay, NV Map & Demographics
Crystal Bay Map
Crystal Bay Overview
$295,845
PER CAPITA INCOME
$250,001
AVG FAMILY INCOME
$201,094
AVG HOUSEHOLD INCOME
0.48
INEQUALITY / GINI INDEX
184
TOTAL POPULATION
100
MALE POPULATION
84
FEMALE POPULATION
119.05
MALES / 100 FEMALES
84.00
FEMALES / 100 MALES
72.2
MEDIAN AGE
2.0
AVG FAMILY SIZE
1.9
AVG HOUSEHOLD SIZE
13
LABOR FORCE [ PEOPLE ]
7.1%
PERCENT IN LABOR FORCE
Crystal Bay Zip Codes
Crystal Bay Area Codes
Income in Crystal Bay
Income Overview in Crystal Bay
Per Capita Income in Crystal Bay is $295,845, while median incomes of families and households are $250,001 and $201,094 respectively.
| Characteristic | Number | Measure |
| Per Capita Income | 184 | $295,845 |
| Median Family Income | 84 | $250,001 |
| Mean Family Income | 84 | $630,602 |
| Median Household Income | 97 | $201,094 |
| Mean Household Income | 97 | $564,693 |
| Income Deficit | 84 | $0 |
| Wage / Income Gap (%) | 184 | 0.00% |
| Wage / Income Gap ($) | 184 | 100.00¢ per $1 |
| Gini / Inequality Index | 184 | 0.48 |
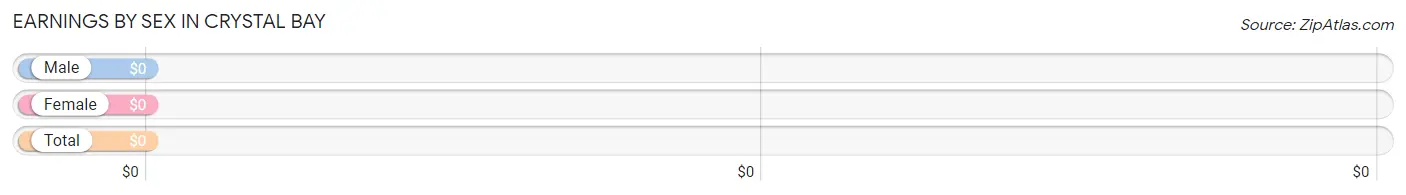
Earnings by Sex in Crystal Bay
| Sex | Number | Average Earnings |
| Male | 18 (39.1%) | $0 |
| Female | 28 (60.9%) | $0 |
| Total | 46 (100.0%) | $0 |
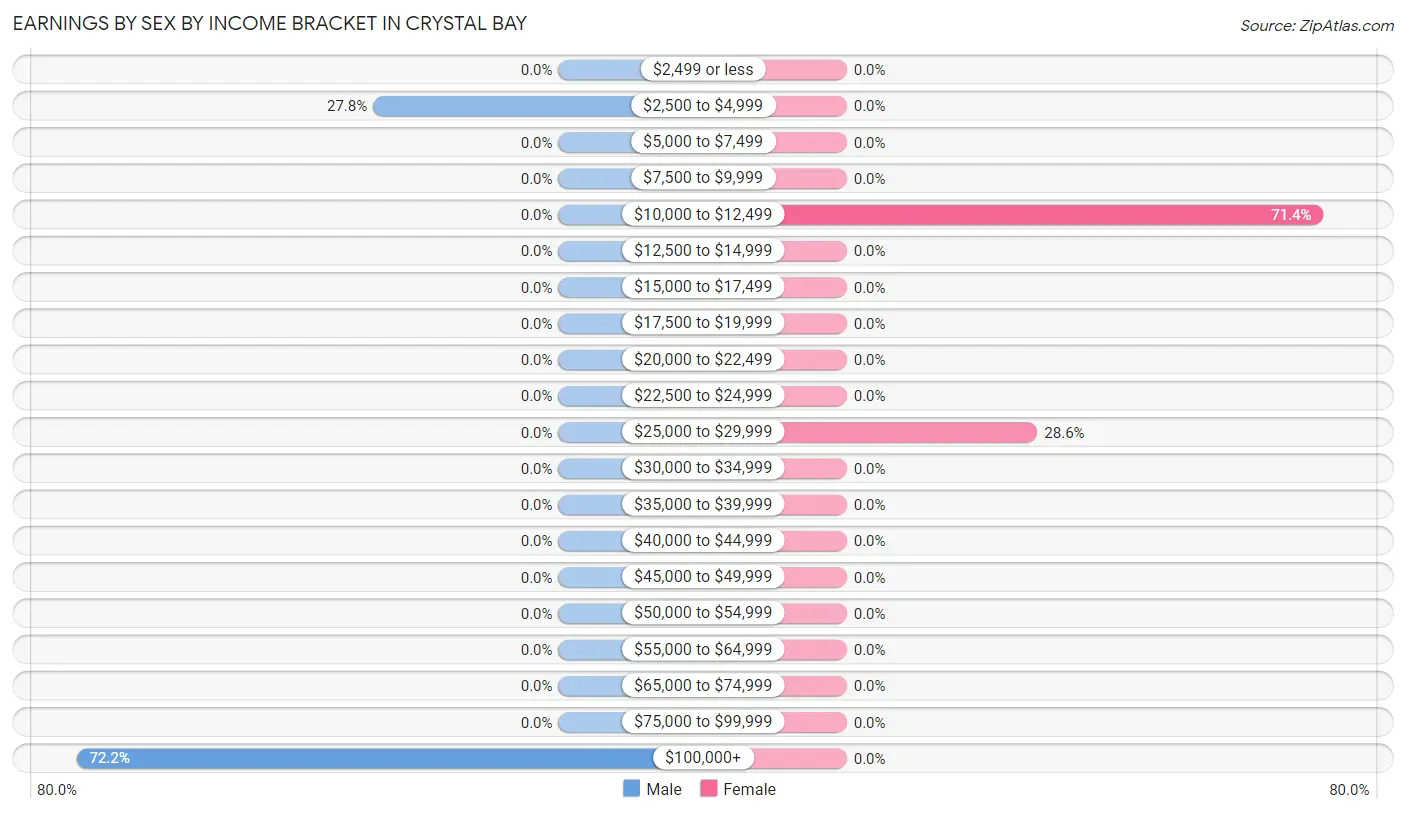
Earnings by Sex by Income Bracket in Crystal Bay
The most common earnings brackets in Crystal Bay are $100,000+ for men (13 | 72.2%) and $10,000 to $12,499 for women (20 | 71.4%).
| Income | Male | Female |
| $2,499 or less | 0 (0.0%) | 0 (0.0%) |
| $2,500 to $4,999 | 5 (27.8%) | 0 (0.0%) |
| $5,000 to $7,499 | 0 (0.0%) | 0 (0.0%) |
| $7,500 to $9,999 | 0 (0.0%) | 0 (0.0%) |
| $10,000 to $12,499 | 0 (0.0%) | 20 (71.4%) |
| $12,500 to $14,999 | 0 (0.0%) | 0 (0.0%) |
| $15,000 to $17,499 | 0 (0.0%) | 0 (0.0%) |
| $17,500 to $19,999 | 0 (0.0%) | 0 (0.0%) |
| $20,000 to $22,499 | 0 (0.0%) | 0 (0.0%) |
| $22,500 to $24,999 | 0 (0.0%) | 0 (0.0%) |
| $25,000 to $29,999 | 0 (0.0%) | 8 (28.6%) |
| $30,000 to $34,999 | 0 (0.0%) | 0 (0.0%) |
| $35,000 to $39,999 | 0 (0.0%) | 0 (0.0%) |
| $40,000 to $44,999 | 0 (0.0%) | 0 (0.0%) |
| $45,000 to $49,999 | 0 (0.0%) | 0 (0.0%) |
| $50,000 to $54,999 | 0 (0.0%) | 0 (0.0%) |
| $55,000 to $64,999 | 0 (0.0%) | 0 (0.0%) |
| $65,000 to $74,999 | 0 (0.0%) | 0 (0.0%) |
| $75,000 to $99,999 | 0 (0.0%) | 0 (0.0%) |
| $100,000+ | 13 (72.2%) | 0 (0.0%) |
| Total | 18 (100.0%) | 28 (100.0%) |
Earnings by Sex by Educational Attainment in Crystal Bay
| Educational Attainment | Male Income | Female Income |
| Less than High School | - | - |
| High School Diploma | - | - |
| College or Associate's Degree | - | - |
| Bachelor's Degree | - | - |
| Graduate Degree | - | - |
| Total | - | - |
Family Income in Crystal Bay
Family Income Brackets in Crystal Bay
According to the Crystal Bay family income data, there are 52 families falling into the $200,000+ income range, which is the most common income bracket and makes up 61.9% of all families.
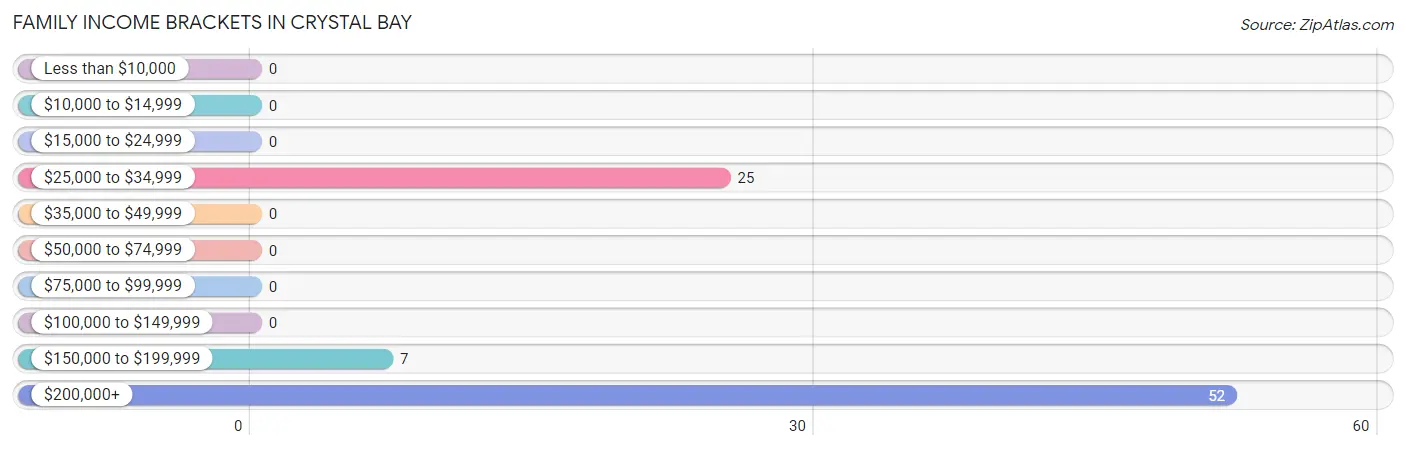
| Income Bracket | # Families | % Families |
| Less than $10,000 | 0 | 0.0% |
| $10,000 to $14,999 | 0 | 0.0% |
| $15,000 to $24,999 | 0 | 0.0% |
| $25,000 to $34,999 | 25 | 29.8% |
| $35,000 to $49,999 | 0 | 0.0% |
| $50,000 to $74,999 | 0 | 0.0% |
| $75,000 to $99,999 | 0 | 0.0% |
| $100,000 to $149,999 | 0 | 0.0% |
| $150,000 to $199,999 | 7 | 8.3% |
| $200,000+ | 52 | 61.9% |
Family Income by Famaliy Size in Crystal Bay
2-person families (84 | 100.0%) account for the highest median family income in Crystal Bay with $250,001 per family, while 2-person families (84 | 100.0%) have the highest median income of $125,000 per family member.
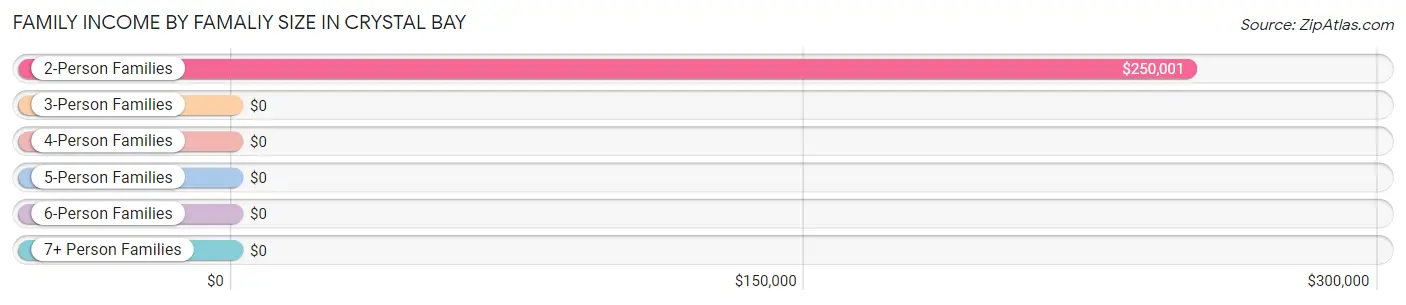
| Income Bracket | # Families | Median Income |
| 2-Person Families | 84 (100.0%) | $250,001 |
| 3-Person Families | 0 (0.0%) | $0 |
| 4-Person Families | 0 (0.0%) | $0 |
| 5-Person Families | 0 (0.0%) | $0 |
| 6-Person Families | 0 (0.0%) | $0 |
| 7+ Person Families | 0 (0.0%) | $0 |
| Total | 84 (100.0%) | $250,001 |
Family Income by Number of Earners in Crystal Bay
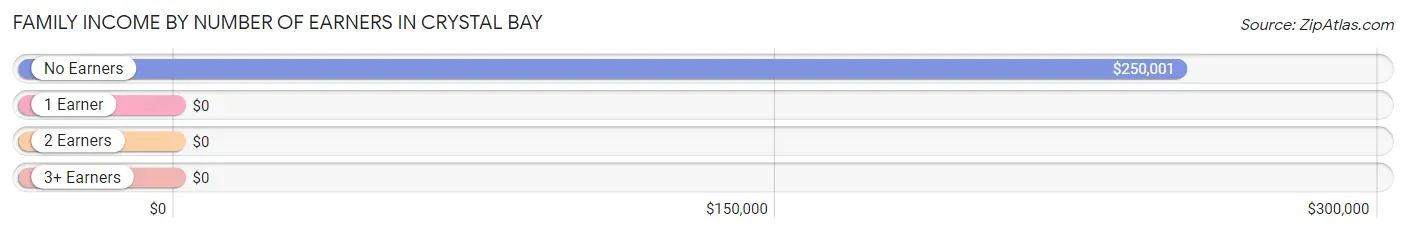
| Number of Earners | # Families | Median Income |
| No Earners | 51 (60.7%) | $250,001 |
| 1 Earner | 33 (39.3%) | $0 |
| 2 Earners | 0 (0.0%) | $0 |
| 3+ Earners | 0 (0.0%) | $0 |
| Total | 84 (100.0%) | $250,001 |
Household Income in Crystal Bay
Household Income Brackets in Crystal Bay
With 52 households falling in the category, the $200,000+ income range is the most frequent in Crystal Bay, accounting for 53.6% of all households.
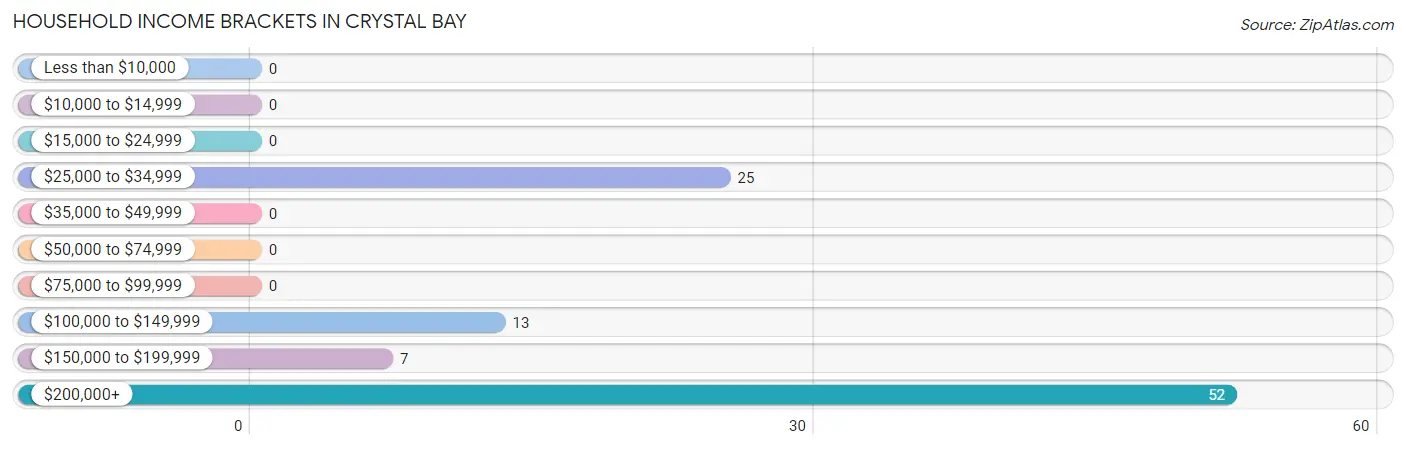
| Income Bracket | # Households | % Households |
| Less than $10,000 | 0 | 0.0% |
| $10,000 to $14,999 | 0 | 0.0% |
| $15,000 to $24,999 | 0 | 0.0% |
| $25,000 to $34,999 | 25 | 25.8% |
| $35,000 to $49,999 | 0 | 0.0% |
| $50,000 to $74,999 | 0 | 0.0% |
| $75,000 to $99,999 | 0 | 0.0% |
| $100,000 to $149,999 | 13 | 13.4% |
| $150,000 to $199,999 | 7 | 7.2% |
| $200,000+ | 52 | 53.6% |
Household Income by Householder Age in Crystal Bay
The median household income in Crystal Bay is $201,094, with the highest median household income of $250,001 found in the 65+ years age bracket for the primary householder. A total of 84 households (86.6%) fall into this category.
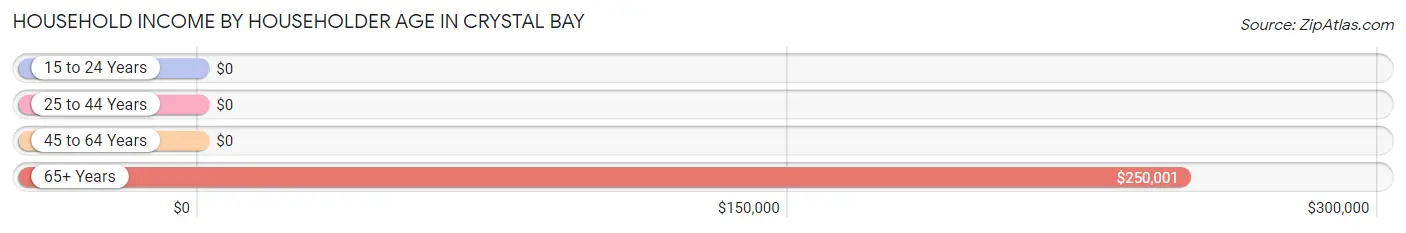
| Income Bracket | # Households | Median Income |
| 15 to 24 Years | 0 (0.0%) | $0 |
| 25 to 44 Years | 13 (13.4%) | $0 |
| 45 to 64 Years | 0 (0.0%) | $0 |
| 65+ Years | 84 (86.6%) | $250,001 |
| Total | 97 (100.0%) | $201,094 |
Poverty in Crystal Bay
Income Below Poverty by Sex and Age in Crystal Bay
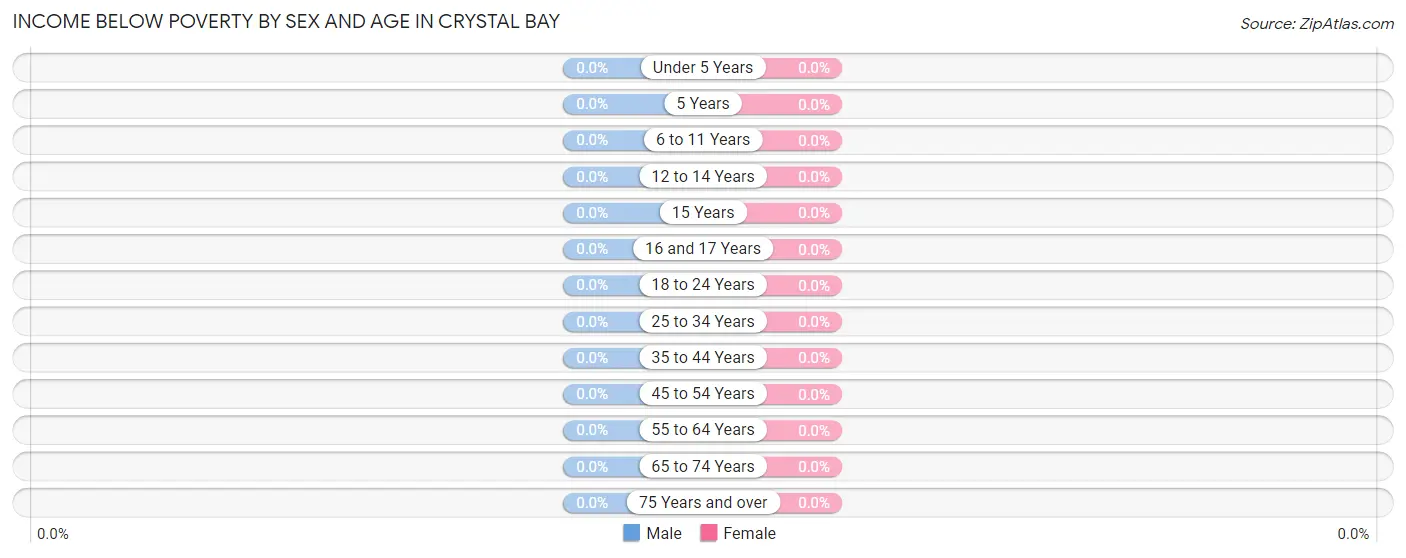
| Age Bracket | Male | Female |
| Under 5 Years | 0 (0.0%) | 0 (0.0%) |
| 5 Years | 0 (0.0%) | 0 (0.0%) |
| 6 to 11 Years | 0 (0.0%) | 0 (0.0%) |
| 12 to 14 Years | 0 (0.0%) | 0 (0.0%) |
| 15 Years | 0 (0.0%) | 0 (0.0%) |
| 16 and 17 Years | 0 (0.0%) | 0 (0.0%) |
| 18 to 24 Years | 0 (0.0%) | 0 (0.0%) |
| 25 to 34 Years | 0 (0.0%) | 0 (0.0%) |
| 35 to 44 Years | 0 (0.0%) | 0 (0.0%) |
| 45 to 54 Years | 0 (0.0%) | 0 (0.0%) |
| 55 to 64 Years | 0 (0.0%) | 0 (0.0%) |
| 65 to 74 Years | 0 (0.0%) | 0 (0.0%) |
| 75 Years and over | 0 (0.0%) | 0 (0.0%) |
| Total | 0 (0.0%) | 0 (0.0%) |
Income Above Poverty by Sex and Age in Crystal Bay
According to the poverty statistics in Crystal Bay, males aged 35 to 44 years and females aged 55 to 64 years are the age groups that are most secure financially, with 100.0% of males and 100.0% of females in these age groups living above the poverty line.
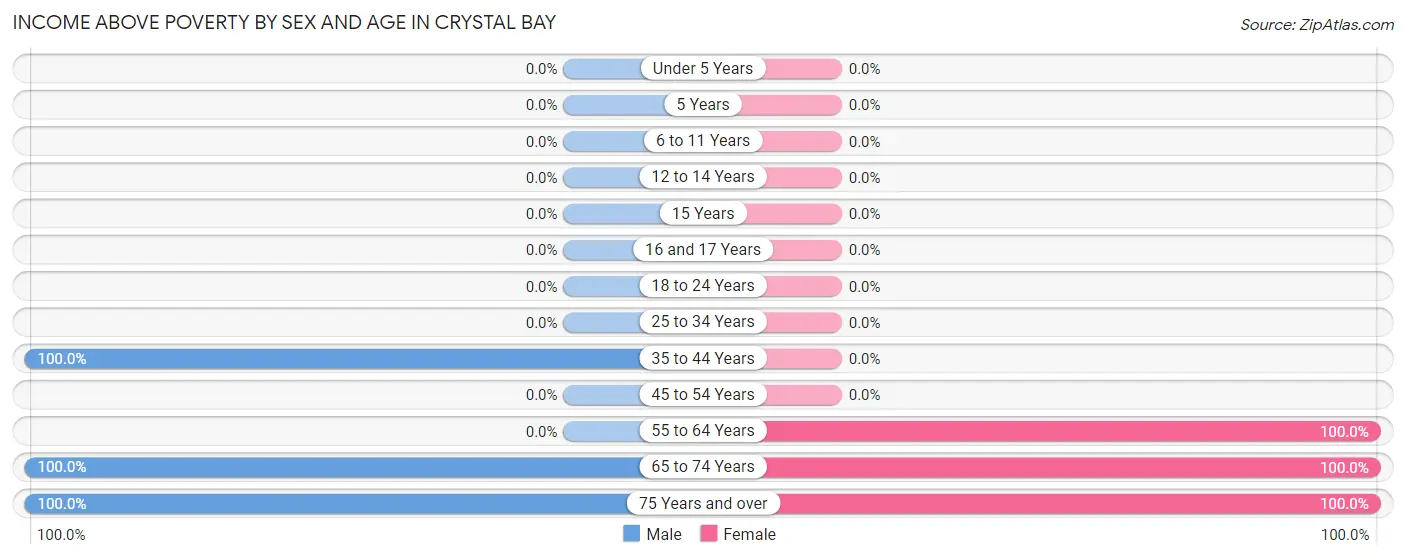
| Age Bracket | Male | Female |
| Under 5 Years | 0 (0.0%) | 0 (0.0%) |
| 5 Years | 0 (0.0%) | 0 (0.0%) |
| 6 to 11 Years | 0 (0.0%) | 0 (0.0%) |
| 12 to 14 Years | 0 (0.0%) | 0 (0.0%) |
| 15 Years | 0 (0.0%) | 0 (0.0%) |
| 16 and 17 Years | 0 (0.0%) | 0 (0.0%) |
| 18 to 24 Years | 0 (0.0%) | 0 (0.0%) |
| 25 to 34 Years | 0 (0.0%) | 0 (0.0%) |
| 35 to 44 Years | 13 (100.0%) | 0 (0.0%) |
| 45 to 54 Years | 0 (0.0%) | 0 (0.0%) |
| 55 to 64 Years | 0 (0.0%) | 8 (100.0%) |
| 65 to 74 Years | 58 (100.0%) | 47 (100.0%) |
| 75 Years and over | 29 (100.0%) | 29 (100.0%) |
| Total | 100 (100.0%) | 84 (100.0%) |
Income Below Poverty Among Married-Couple Families in Crystal Bay
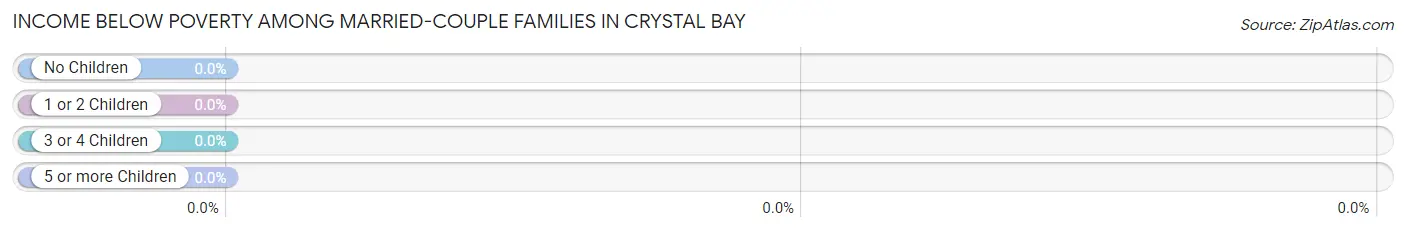
| Children | Above Poverty | Below Poverty |
| No Children | 84 (100.0%) | 0 (0.0%) |
| 1 or 2 Children | 0 (0.0%) | 0 (0.0%) |
| 3 or 4 Children | 0 (0.0%) | 0 (0.0%) |
| 5 or more Children | 0 (0.0%) | 0 (0.0%) |
| Total | 84 (100.0%) | 0 (0.0%) |
Income Below Poverty Among Single-Parent Households in Crystal Bay
| Children | Single Father | Single Mother |
| No Children | 0 (0.0%) | 0 (0.0%) |
| 1 or 2 Children | 0 (0.0%) | 0 (0.0%) |
| 3 or 4 Children | 0 (0.0%) | 0 (0.0%) |
| 5 or more Children | 0 (0.0%) | 0 (0.0%) |
| Total | 0 (0.0%) | 0 (0.0%) |
Income Below Poverty Among Married-Couple vs Single-Parent Households in Crystal Bay
| Children | Married-Couple Families | Single-Parent Households |
| No Children | 0 (0.0%) | 0 (0.0%) |
| 1 or 2 Children | 0 (0.0%) | 0 (0.0%) |
| 3 or 4 Children | 0 (0.0%) | 0 (0.0%) |
| 5 or more Children | 0 (0.0%) | 0 (0.0%) |
| Total | 0 (0.0%) | 0 (0.0%) |
Race in Crystal Bay
The most populous races in Crystal Bay are , and White / Caucasian (184 | 100.0%).
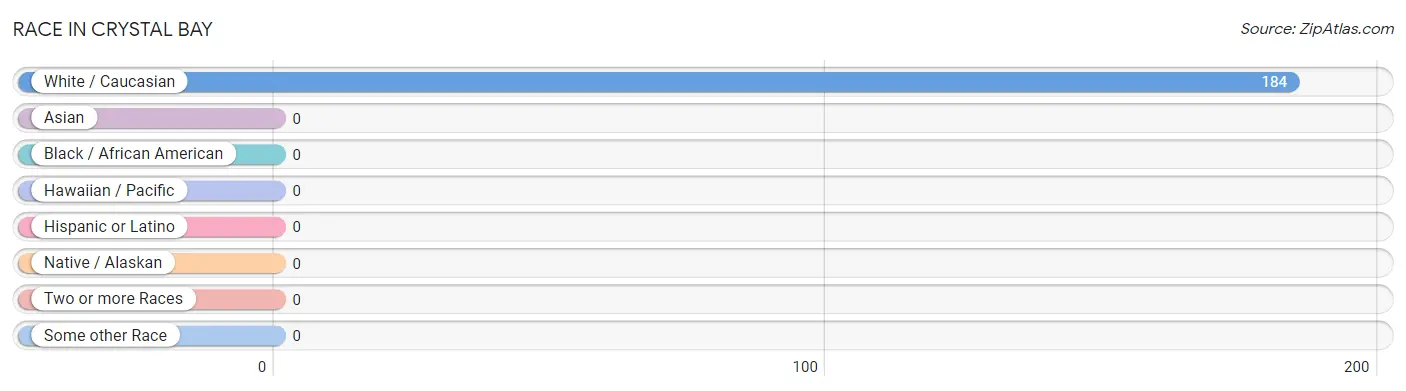
| Race | # Population | % Population |
| Asian | 0 | 0.0% |
| Black / African American | 0 | 0.0% |
| Hawaiian / Pacific | 0 | 0.0% |
| Hispanic or Latino | 0 | 0.0% |
| Native / Alaskan | 0 | 0.0% |
| White / Caucasian | 184 | 100.0% |
| Two or more Races | 0 | 0.0% |
| Some other Race | 0 | 0.0% |
| Total | 184 | 100.0% |
Ancestry in Crystal Bay
The most populous ancestries reported in Crystal Bay are German (57 | 31.0%), French (49 | 26.6%), English (45 | 24.5%), Northern European (35 | 19.0%), and Scottish (23 | 12.5%), together accounting for 113.6% of all Crystal Bay residents.
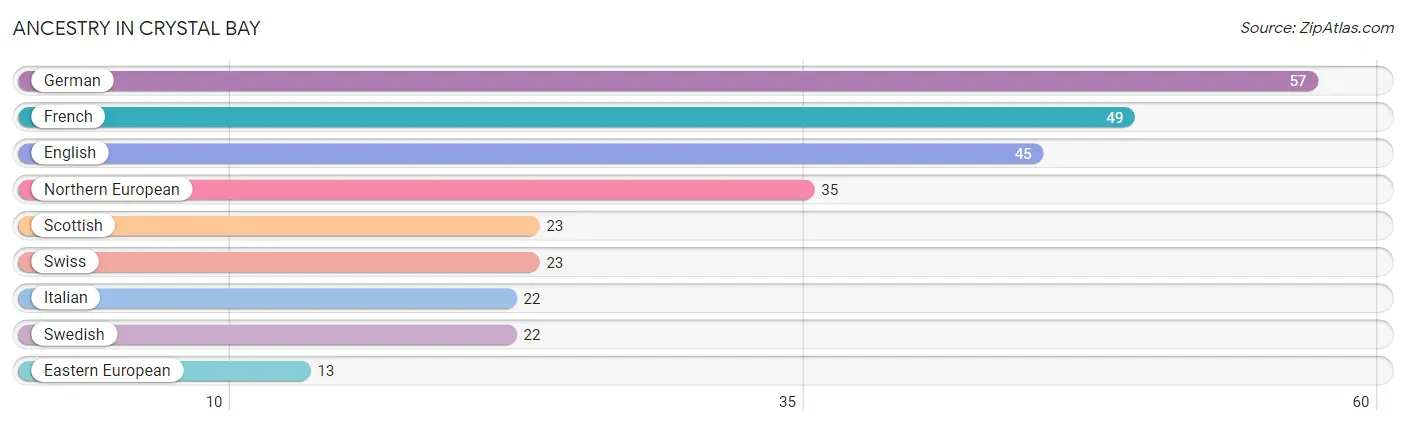
| Ancestry | # Population | % Population |
| Eastern European | 13 | 7.1% |
| English | 45 | 24.5% |
| French | 49 | 26.6% |
| German | 57 | 31.0% |
| Italian | 22 | 12.0% |
| Northern European | 35 | 19.0% |
| Scottish | 23 | 12.5% |
| Swedish | 22 | 12.0% |
| Swiss | 23 | 12.5% | View All 9 Rows |
Immigrants in Crystal Bay
The most numerous immigrant groups reported in Crystal Bay came from , and Oceania (21 | 11.4%), together accounting for 11.4% of all Crystal Bay residents.

| Immigration Origin | # Population | % Population |
| Oceania | 21 | 11.4% | View All 1 Rows |
Sex and Age in Crystal Bay
Sex and Age in Crystal Bay
The most populous age groups in Crystal Bay are 65 to 69 Years (35 | 35.0%) for men and 75 to 79 Years (29 | 34.5%) for women.
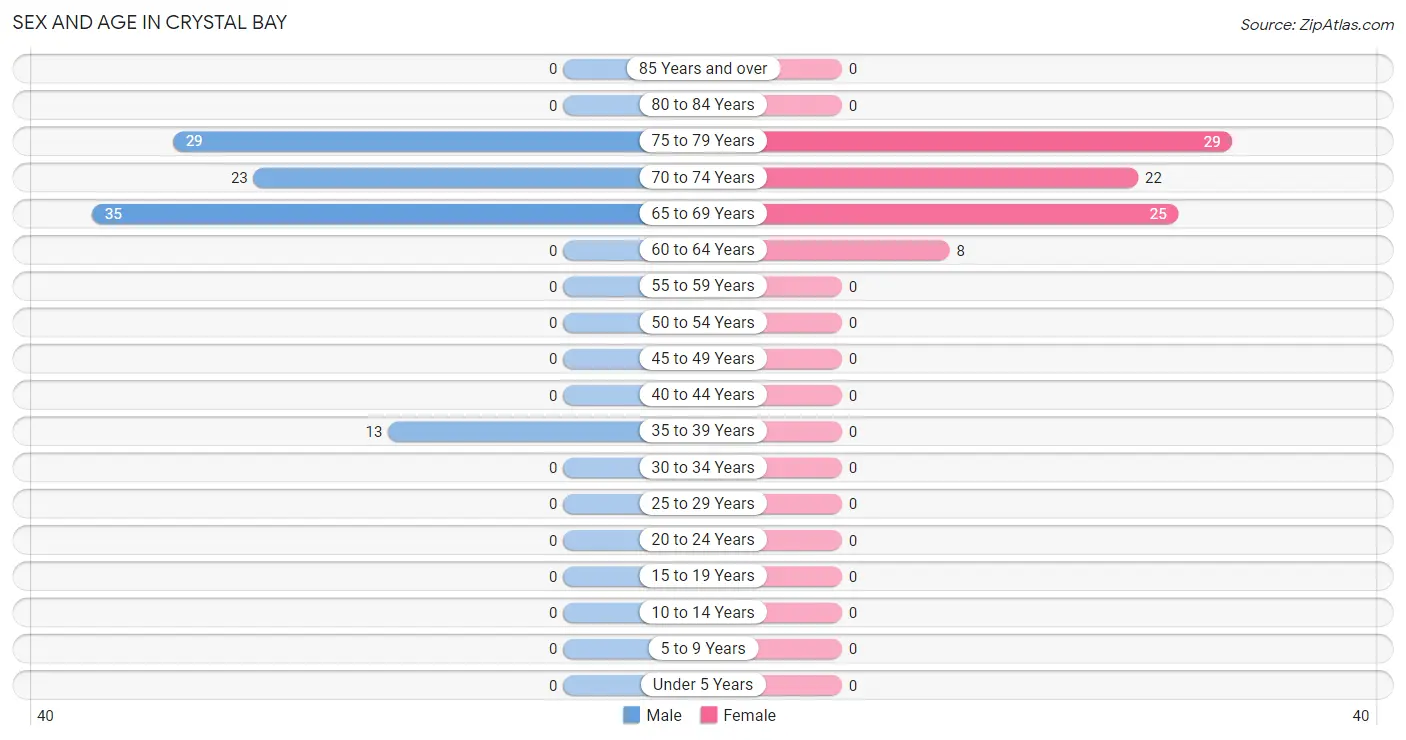
| Age Bracket | Male | Female |
| Under 5 Years | 0 (0.0%) | 0 (0.0%) |
| 5 to 9 Years | 0 (0.0%) | 0 (0.0%) |
| 10 to 14 Years | 0 (0.0%) | 0 (0.0%) |
| 15 to 19 Years | 0 (0.0%) | 0 (0.0%) |
| 20 to 24 Years | 0 (0.0%) | 0 (0.0%) |
| 25 to 29 Years | 0 (0.0%) | 0 (0.0%) |
| 30 to 34 Years | 0 (0.0%) | 0 (0.0%) |
| 35 to 39 Years | 13 (13.0%) | 0 (0.0%) |
| 40 to 44 Years | 0 (0.0%) | 0 (0.0%) |
| 45 to 49 Years | 0 (0.0%) | 0 (0.0%) |
| 50 to 54 Years | 0 (0.0%) | 0 (0.0%) |
| 55 to 59 Years | 0 (0.0%) | 0 (0.0%) |
| 60 to 64 Years | 0 (0.0%) | 8 (9.5%) |
| 65 to 69 Years | 35 (35.0%) | 25 (29.8%) |
| 70 to 74 Years | 23 (23.0%) | 22 (26.2%) |
| 75 to 79 Years | 29 (29.0%) | 29 (34.5%) |
| 80 to 84 Years | 0 (0.0%) | 0 (0.0%) |
| 85 Years and over | 0 (0.0%) | 0 (0.0%) |
| Total | 100 (100.0%) | 84 (100.0%) |
Families and Households in Crystal Bay
Median Family Size in Crystal Bay
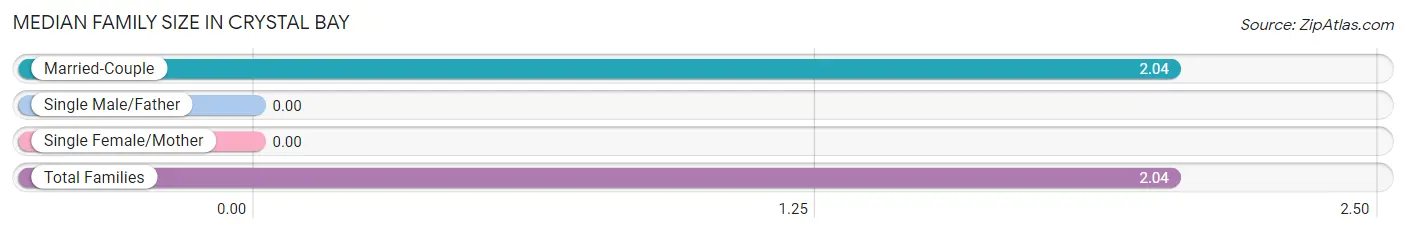
| Family Type | # Families | Family Size |
| Married-Couple | 84 (100.0%) | 2.04 |
| Single Male/Father | 0 (0.0%) | - |
| Single Female/Mother | 0 (0.0%) | - |
| Total Families | 84 (100.0%) | 2.04 |
Median Household Size in Crystal Bay
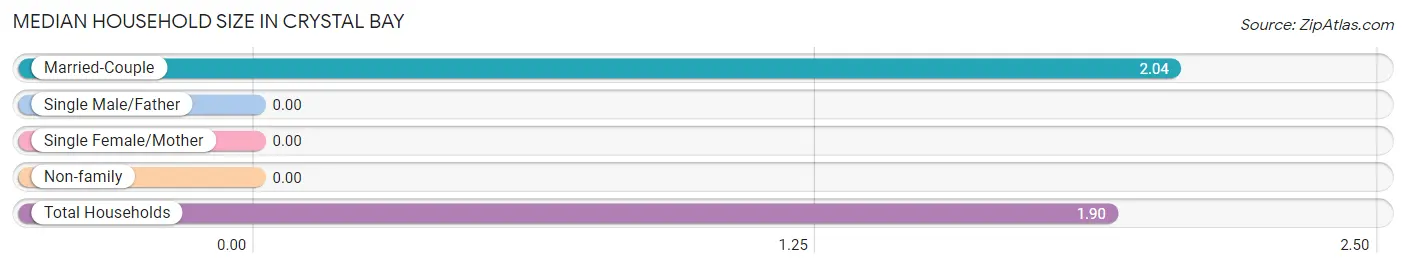
| Household Type | # Households | Household Size |
| Married-Couple | 84 (86.6%) | 2.04 |
| Single Male/Father | 0 (0.0%) | - |
| Single Female/Mother | 0 (0.0%) | - |
| Non-family | 13 (13.4%) | - |
| Total Households | 97 (100.0%) | 1.90 |
Household Size by Marriage Status in Crystal Bay
Out of a total of 97 households in Crystal Bay, 84 (86.6%) are family households, while 13 (13.4%) are nonfamily households. The most numerous type of family households are 2-person households, comprising 84, and the most common type of nonfamily households are 1-person households, comprising 13.
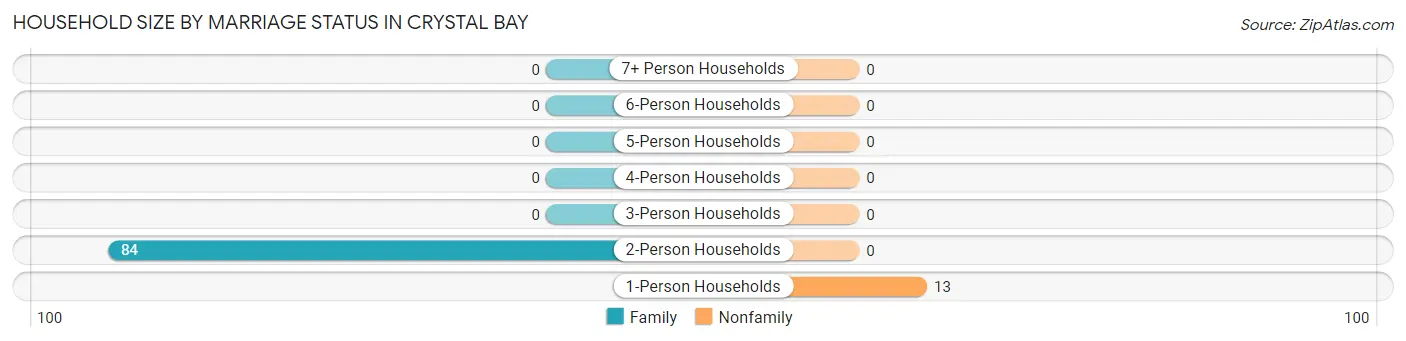
| Household Size | Family Households | Nonfamily Households |
| 1-Person Households | - | 13 (13.4%) |
| 2-Person Households | 84 (86.6%) | 0 (0.0%) |
| 3-Person Households | 0 (0.0%) | 0 (0.0%) |
| 4-Person Households | 0 (0.0%) | 0 (0.0%) |
| 5-Person Households | 0 (0.0%) | 0 (0.0%) |
| 6-Person Households | 0 (0.0%) | 0 (0.0%) |
| 7+ Person Households | 0 (0.0%) | 0 (0.0%) |
| Total | 84 (86.6%) | 13 (13.4%) |
Female Fertility in Crystal Bay
Fertility by Age in Crystal Bay
| Age Bracket | Women with Births | Births / 1,000 Women |
| 15 to 19 years | 0 (0.0%) | 0.0 |
| 20 to 34 years | 0 (0.0%) | 0.0 |
| 35 to 50 years | 0 (0.0%) | 0.0 |
| Total | 0 (0.0%) | 0.0 |
Fertility by Age by Marriage Status in Crystal Bay
| Age Bracket | Married | Unmarried |
| 15 to 19 years | 0 (0.0%) | 0 (0.0%) |
| 20 to 34 years | 0 (0.0%) | 0 (0.0%) |
| 35 to 50 years | 0 (0.0%) | 0 (0.0%) |
| Total | 0 (0.0%) | 0 (0.0%) |
Fertility by Education in Crystal Bay
| Educational Attainment | Women with Births | Births / 1,000 Women |
| Less than High School | 0 (0.0%) | 0.0 |
| High School Diploma | 0 (0.0%) | 0.0 |
| College or Associate's Degree | 0 (0.0%) | 0.0 |
| Bachelor's Degree | 0 (0.0%) | 0.0 |
| Graduate Degree | 0 (0.0%) | 0.0 |
| Total | 0 (0.0%) | 0.0 |
Fertility by Education by Marriage Status in Crystal Bay
| Educational Attainment | Married | Unmarried |
| Less than High School | 0 (0.0%) | 0 (0.0%) |
| High School Diploma | 0 (0.0%) | 0 (0.0%) |
| College or Associate's Degree | 0 (0.0%) | 0 (0.0%) |
| Bachelor's Degree | 0 (0.0%) | 0 (0.0%) |
| Graduate Degree | 0 (0.0%) | 0 (0.0%) |
| Total | 0 (0.0%) | 0 (0.0%) |
Employment Characteristics in Crystal Bay
Employment by Class of Employer in Crystal Bay
Among the 13 employed individuals in Crystal Bay, , and self-employed (incorporated) (13 | 100.0%) make up the most common classes of employment.
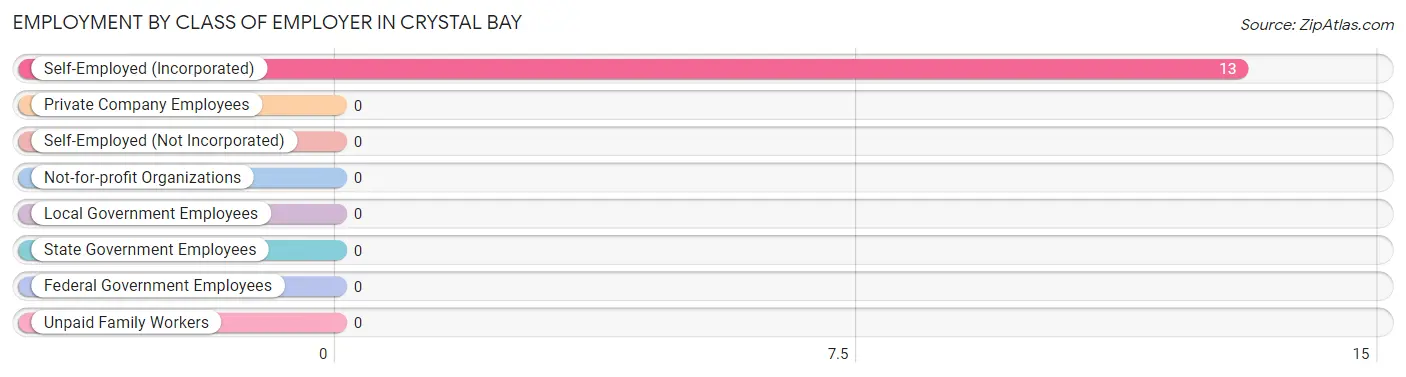
| Employer Class | # Employees | % Employees |
| Private Company Employees | 0 | 0.0% |
| Self-Employed (Incorporated) | 13 | 100.0% |
| Self-Employed (Not Incorporated) | 0 | 0.0% |
| Not-for-profit Organizations | 0 | 0.0% |
| Local Government Employees | 0 | 0.0% |
| State Government Employees | 0 | 0.0% |
| Federal Government Employees | 0 | 0.0% |
| Unpaid Family Workers | 0 | 0.0% |
| Total | 13 | 100.0% |
Employment Status by Age in Crystal Bay
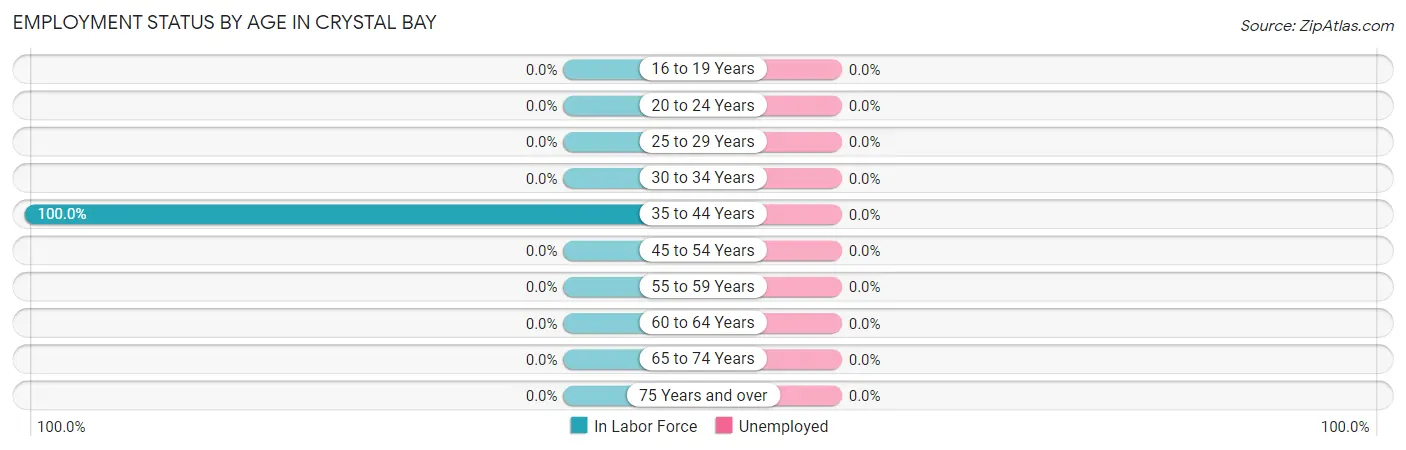
| Age Bracket | In Labor Force | Unemployed |
| 16 to 19 Years | 0 (0.0%) | 0 (0.0%) |
| 20 to 24 Years | 0 (0.0%) | 0 (0.0%) |
| 25 to 29 Years | 0 (0.0%) | 0 (0.0%) |
| 30 to 34 Years | 0 (0.0%) | 0 (0.0%) |
| 35 to 44 Years | 13 (100.0%) | 0 (0.0%) |
| 45 to 54 Years | 0 (0.0%) | 0 (0.0%) |
| 55 to 59 Years | 0 (0.0%) | 0 (0.0%) |
| 60 to 64 Years | 0 (0.0%) | 0 (0.0%) |
| 65 to 74 Years | 0 (0.0%) | 0 (0.0%) |
| 75 Years and over | 0 (0.0%) | 0 (0.0%) |
| Total | 13 (7.1%) | 0 (0.0%) |
Employment Status by Educational Attainment in Crystal Bay
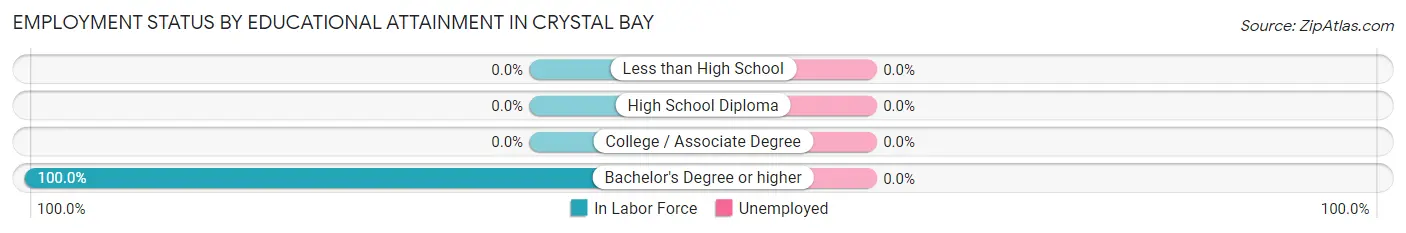
| Educational Attainment | In Labor Force | Unemployed |
| Less than High School | 0 (0.0%) | 0 (0.0%) |
| High School Diploma | 0 (0.0%) | 0 (0.0%) |
| College / Associate Degree | 0 (0.0%) | 0 (0.0%) |
| Bachelor's Degree or higher | 13 (100.0%) | 0 (0.0%) |
| Total | 13 (61.9%) | 0 (0.0%) |
Employment Occupations by Sex in Crystal Bay
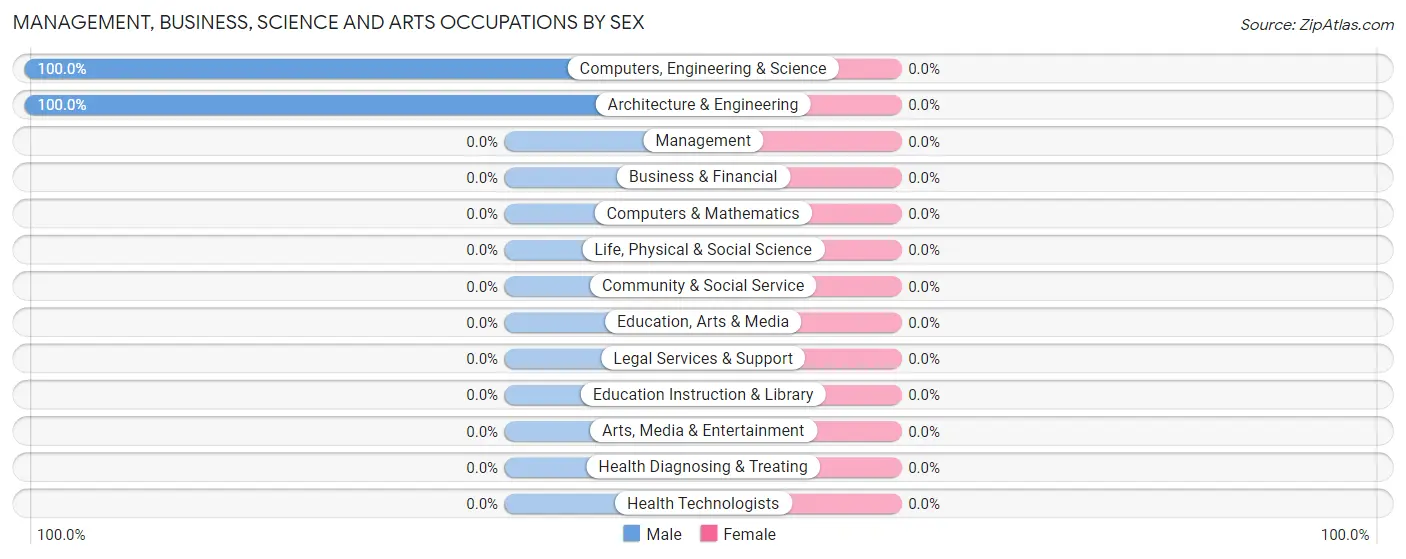
Management, Business, Science and Arts Occupations
The most common Management, Business, Science and Arts occupations in Crystal Bay are Computers, Engineering & Science (13 | 100.0%), and Architecture & Engineering (13 | 100.0%).
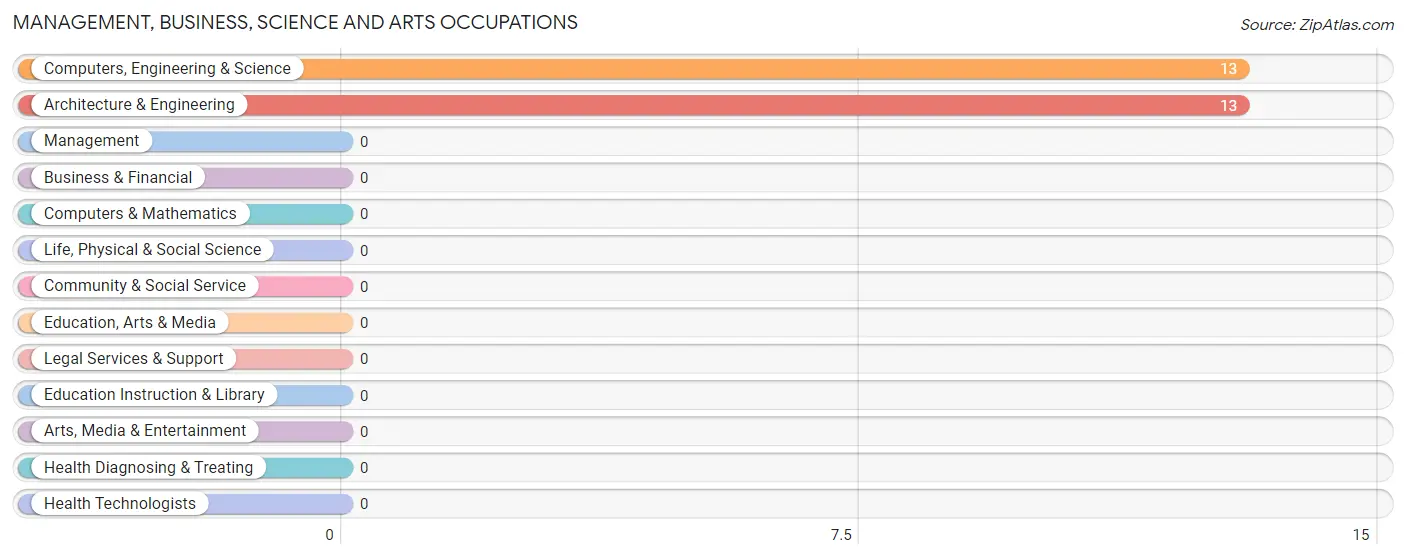
Management, Business, Science and Arts Occupations by Sex
| Occupation | Male | Female |
| Management | 0 (0.0%) | 0 (0.0%) |
| Business & Financial | 0 (0.0%) | 0 (0.0%) |
| Computers, Engineering & Science | 13 (100.0%) | 0 (0.0%) |
| Computers & Mathematics | 0 (0.0%) | 0 (0.0%) |
| Architecture & Engineering | 13 (100.0%) | 0 (0.0%) |
| Life, Physical & Social Science | 0 (0.0%) | 0 (0.0%) |
| Community & Social Service | 0 (0.0%) | 0 (0.0%) |
| Education, Arts & Media | 0 (0.0%) | 0 (0.0%) |
| Legal Services & Support | 0 (0.0%) | 0 (0.0%) |
| Education Instruction & Library | 0 (0.0%) | 0 (0.0%) |
| Arts, Media & Entertainment | 0 (0.0%) | 0 (0.0%) |
| Health Diagnosing & Treating | 0 (0.0%) | 0 (0.0%) |
| Health Technologists | 0 (0.0%) | 0 (0.0%) |
| Total (Category) | 13 (100.0%) | 0 (0.0%) |
| Total (Overall) | 13 (100.0%) | 0 (0.0%) |
Services Occupations
Services Occupations by Sex
| Occupation | Male | Female |
| Healthcare Support | 0 (0.0%) | 0 (0.0%) |
| Security & Protection | 0 (0.0%) | 0 (0.0%) |
| Firefighting & Prevention | 0 (0.0%) | 0 (0.0%) |
| Law Enforcement | 0 (0.0%) | 0 (0.0%) |
| Food Preparation & Serving | 0 (0.0%) | 0 (0.0%) |
| Cleaning & Maintenance | 0 (0.0%) | 0 (0.0%) |
| Personal Care & Service | 0 (0.0%) | 0 (0.0%) |
| Total (Category) | 0 (0.0%) | 0 (0.0%) |
| Total (Overall) | 13 (100.0%) | 0 (0.0%) |
Sales and Office Occupations
Sales and Office Occupations by Sex
| Occupation | Male | Female |
| Sales & Related | 0 (0.0%) | 0 (0.0%) |
| Office & Administration | 0 (0.0%) | 0 (0.0%) |
| Total (Category) | 0 (0.0%) | 0 (0.0%) |
| Total (Overall) | 13 (100.0%) | 0 (0.0%) |
Natural Resources, Construction and Maintenance Occupations
Natural Resources, Construction and Maintenance Occupations by Sex
| Occupation | Male | Female |
| Farming, Fishing & Forestry | 0 (0.0%) | 0 (0.0%) |
| Construction & Extraction | 0 (0.0%) | 0 (0.0%) |
| Installation, Maintenance & Repair | 0 (0.0%) | 0 (0.0%) |
| Total (Category) | 0 (0.0%) | 0 (0.0%) |
| Total (Overall) | 13 (100.0%) | 0 (0.0%) |
Production, Transportation and Moving Occupations
Production, Transportation and Moving Occupations by Sex
| Occupation | Male | Female |
| Production | 0 (0.0%) | 0 (0.0%) |
| Transportation | 0 (0.0%) | 0 (0.0%) |
| Material Moving | 0 (0.0%) | 0 (0.0%) |
| Total (Category) | 0 (0.0%) | 0 (0.0%) |
| Total (Overall) | 13 (100.0%) | 0 (0.0%) |
Employment Industries by Sex in Crystal Bay
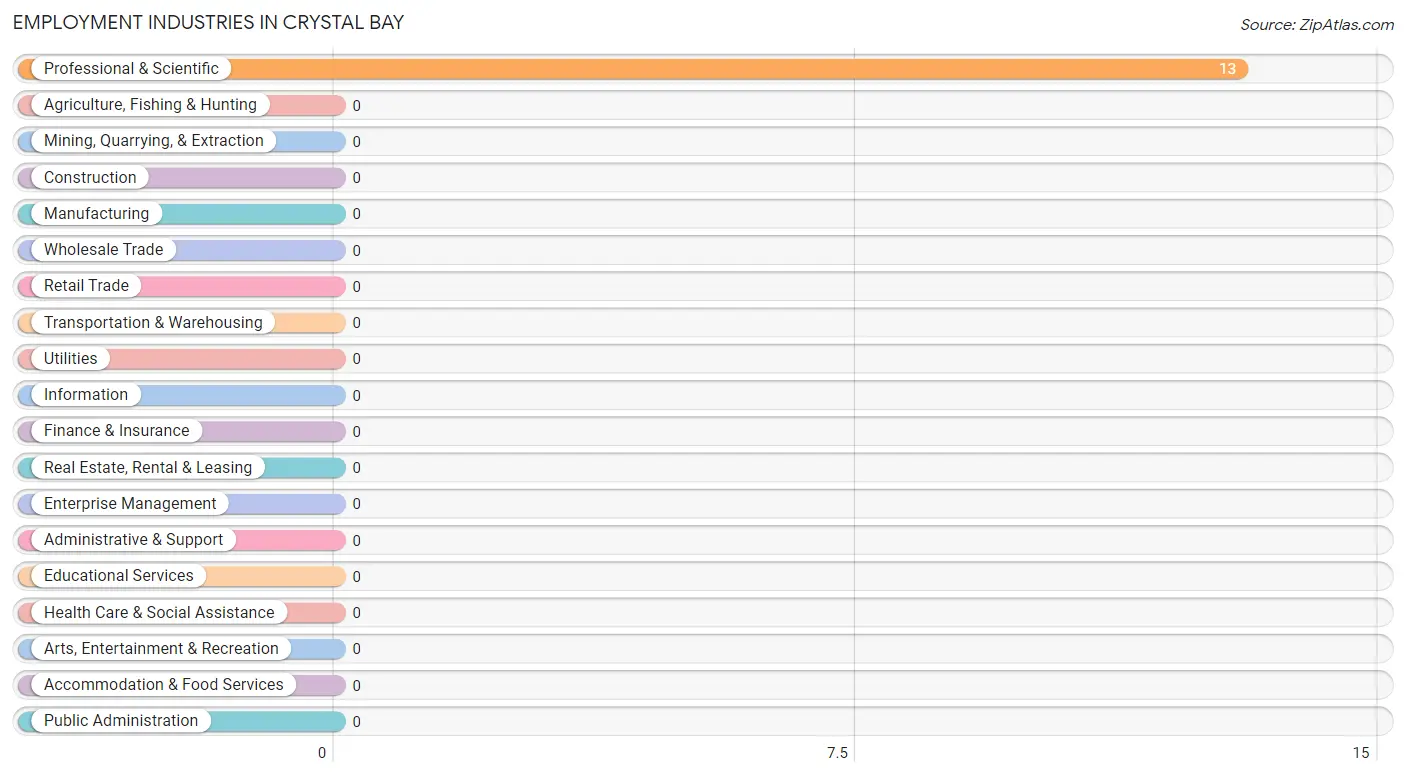
Employment Industries in Crystal Bay
The major employment industries in Crystal Bay include , and Professional & Scientific (13 | 100.0%).
Employment Industries by Sex in Crystal Bay
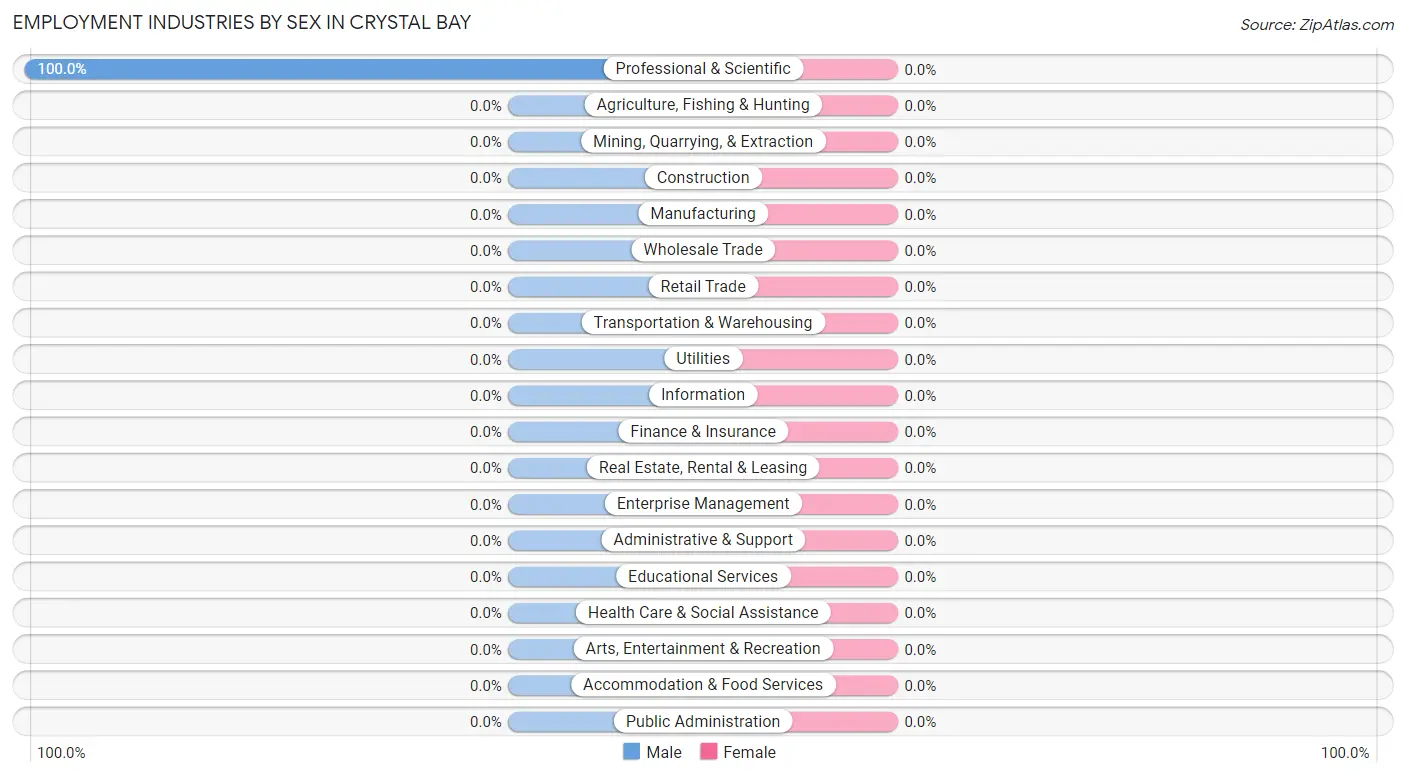
| Industry | Male | Female |
| Agriculture, Fishing & Hunting | 0 (0.0%) | 0 (0.0%) |
| Mining, Quarrying, & Extraction | 0 (0.0%) | 0 (0.0%) |
| Construction | 0 (0.0%) | 0 (0.0%) |
| Manufacturing | 0 (0.0%) | 0 (0.0%) |
| Wholesale Trade | 0 (0.0%) | 0 (0.0%) |
| Retail Trade | 0 (0.0%) | 0 (0.0%) |
| Transportation & Warehousing | 0 (0.0%) | 0 (0.0%) |
| Utilities | 0 (0.0%) | 0 (0.0%) |
| Information | 0 (0.0%) | 0 (0.0%) |
| Finance & Insurance | 0 (0.0%) | 0 (0.0%) |
| Real Estate, Rental & Leasing | 0 (0.0%) | 0 (0.0%) |
| Professional & Scientific | 13 (100.0%) | 0 (0.0%) |
| Enterprise Management | 0 (0.0%) | 0 (0.0%) |
| Administrative & Support | 0 (0.0%) | 0 (0.0%) |
| Educational Services | 0 (0.0%) | 0 (0.0%) |
| Health Care & Social Assistance | 0 (0.0%) | 0 (0.0%) |
| Arts, Entertainment & Recreation | 0 (0.0%) | 0 (0.0%) |
| Accommodation & Food Services | 0 (0.0%) | 0 (0.0%) |
| Public Administration | 0 (0.0%) | 0 (0.0%) |
| Total | 13 (100.0%) | 0 (0.0%) |
Education in Crystal Bay
School Enrollment in Crystal Bay
| School Level | # Students | % Students |
| Nursery / Preschool | 0 | 0.0% |
| Kindergarten | 0 | 0.0% |
| Elementary School | 0 | 0.0% |
| Middle School | 0 | 0.0% |
| High School | 0 | 0.0% |
| College / Undergraduate | 0 | 0.0% |
| Graduate / Professional | 0 | 0.0% |
| Total | 0 | 0.0% |
School Enrollment by Age by Funding Source in Crystal Bay
| Age Bracket | Public School | Private School |
| 3 to 4 Year Olds | 0 (0.0%) | 0 (0.0%) |
| 5 to 9 Year Old | 0 (0.0%) | 0 (0.0%) |
| 10 to 14 Year Olds | 0 (0.0%) | 0 (0.0%) |
| 15 to 17 Year Olds | 0 (0.0%) | 0 (0.0%) |
| 18 to 19 Year Olds | 0 (0.0%) | 0 (0.0%) |
| 20 to 24 Year Olds | 0 (0.0%) | 0 (0.0%) |
| 25 to 34 Year Olds | 0 (0.0%) | 0 (0.0%) |
| 35 Years and over | 0 (0.0%) | 0 (0.0%) |
| Total | 0 (0.0%) | 0 (0.0%) |
Educational Attainment by Field of Study in Crystal Bay
Business (54 | 32.3%), engineering (42 | 25.2%), arts & humanities (23 | 13.8%), education (22 | 13.2%), and liberal arts & history (13 | 7.8%) are the most common fields of study among 167 individuals in Crystal Bay who have obtained a bachelor's degree or higher.
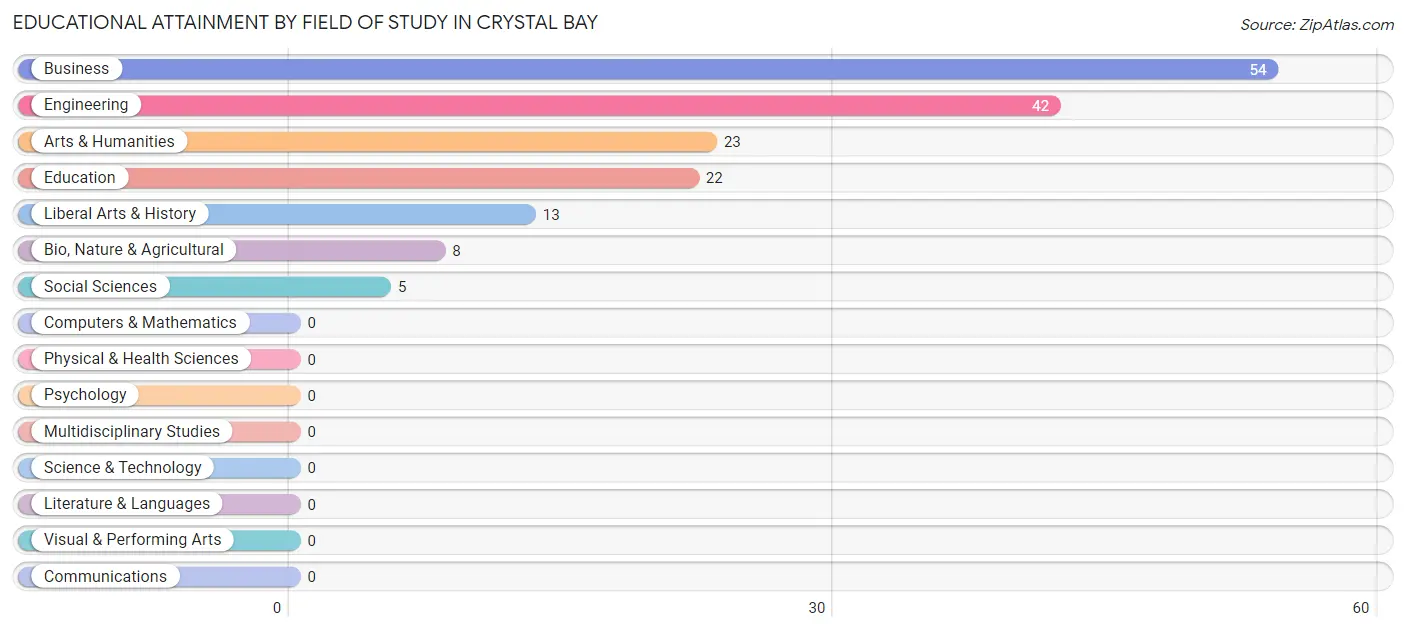
| Field of Study | # Graduates | % Graduates |
| Computers & Mathematics | 0 | 0.0% |
| Bio, Nature & Agricultural | 8 | 4.8% |
| Physical & Health Sciences | 0 | 0.0% |
| Psychology | 0 | 0.0% |
| Social Sciences | 5 | 3.0% |
| Engineering | 42 | 25.2% |
| Multidisciplinary Studies | 0 | 0.0% |
| Science & Technology | 0 | 0.0% |
| Business | 54 | 32.3% |
| Education | 22 | 13.2% |
| Literature & Languages | 0 | 0.0% |
| Liberal Arts & History | 13 | 7.8% |
| Visual & Performing Arts | 0 | 0.0% |
| Communications | 0 | 0.0% |
| Arts & Humanities | 23 | 13.8% |
| Total | 167 | 100.0% |
Transportation & Commute in Crystal Bay
Vehicle Availability by Sex in Crystal Bay
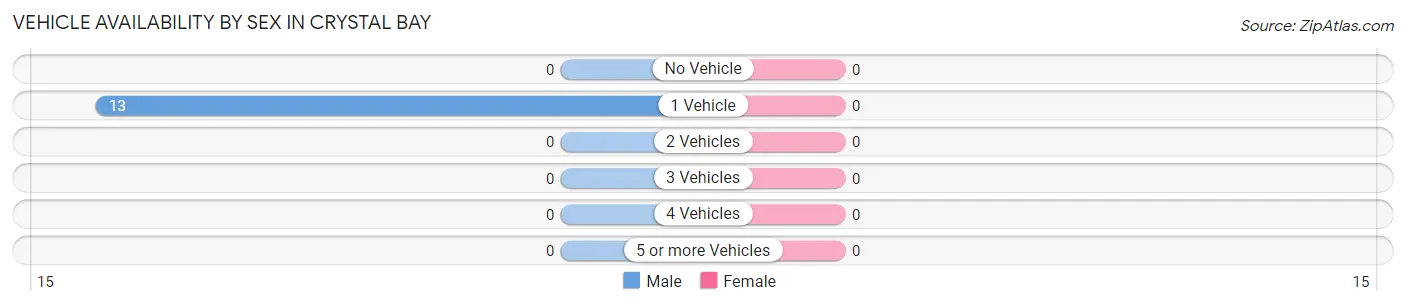
| Vehicles Available | Male | Female |
| No Vehicle | 0 (0.0%) | 0 (0.0%) |
| 1 Vehicle | 13 (100.0%) | 0 (0.0%) |
| 2 Vehicles | 0 (0.0%) | 0 (0.0%) |
| 3 Vehicles | 0 (0.0%) | 0 (0.0%) |
| 4 Vehicles | 0 (0.0%) | 0 (0.0%) |
| 5 or more Vehicles | 0 (0.0%) | 0 (0.0%) |
| Total | 13 (100.0%) | 0 (0.0%) |
Commute Time in Crystal Bay
| Commute Time | # Commuters | % Commuters |
| Less than 5 Minutes | 0 | 0.0% |
| 5 to 9 Minutes | 0 | 0.0% |
| 10 to 14 Minutes | 0 | 0.0% |
| 15 to 19 Minutes | 0 | 0.0% |
| 20 to 24 Minutes | 0 | 0.0% |
| 25 to 29 Minutes | 0 | 0.0% |
| 30 to 34 Minutes | 0 | 0.0% |
| 35 to 39 Minutes | 0 | 0.0% |
| 40 to 44 Minutes | 0 | 0.0% |
| 45 to 59 Minutes | 0 | 0.0% |
| 60 to 89 Minutes | 0 | 0.0% |
| 90 or more Minutes | 0 | 0.0% |
Commute Time by Sex in Crystal Bay
| Commute Time | Male | Female |
| Less than 5 Minutes | 0 (0.0%) | 0 (0.0%) |
| 5 to 9 Minutes | 0 (0.0%) | 0 (0.0%) |
| 10 to 14 Minutes | 0 (0.0%) | 0 (0.0%) |
| 15 to 19 Minutes | 0 (0.0%) | 0 (0.0%) |
| 20 to 24 Minutes | 0 (0.0%) | 0 (0.0%) |
| 25 to 29 Minutes | 0 (0.0%) | 0 (0.0%) |
| 30 to 34 Minutes | 0 (0.0%) | 0 (0.0%) |
| 35 to 39 Minutes | 0 (0.0%) | 0 (0.0%) |
| 40 to 44 Minutes | 0 (0.0%) | 0 (0.0%) |
| 45 to 59 Minutes | 0 (0.0%) | 0 (0.0%) |
| 60 to 89 Minutes | 0 (0.0%) | 0 (0.0%) |
| 90 or more Minutes | 0 (0.0%) | 0 (0.0%) |
Time of Departure to Work by Sex in Crystal Bay
| Time of Departure | Male | Female |
| 12:00 AM to 4:59 AM | 0 (0.0%) | 0 (0.0%) |
| 5:00 AM to 5:29 AM | 0 (0.0%) | 0 (0.0%) |
| 5:30 AM to 5:59 AM | 0 (0.0%) | 0 (0.0%) |
| 6:00 AM to 6:29 AM | 0 (0.0%) | 0 (0.0%) |
| 6:30 AM to 6:59 AM | 0 (0.0%) | 0 (0.0%) |
| 7:00 AM to 7:29 AM | 0 (0.0%) | 0 (0.0%) |
| 7:30 AM to 7:59 AM | 0 (0.0%) | 0 (0.0%) |
| 8:00 AM to 8:29 AM | 0 (0.0%) | 0 (0.0%) |
| 8:30 AM to 8:59 AM | 0 (0.0%) | 0 (0.0%) |
| 9:00 AM to 9:59 AM | 0 (0.0%) | 0 (0.0%) |
| 10:00 AM to 10:59 AM | 0 (0.0%) | 0 (0.0%) |
| 11:00 AM to 11:59 AM | 0 (0.0%) | 0 (0.0%) |
| 12:00 PM to 3:59 PM | 0 (0.0%) | 0 (0.0%) |
| 4:00 PM to 11:59 PM | 0 (0.0%) | 0 (0.0%) |
| Total | 0 (0.0%) | 0 (0.0%) |
Housing Occupancy in Crystal Bay
Occupancy by Ownership in Crystal Bay
Of the total 97 dwellings in Crystal Bay, owner-occupied units account for 72 (74.2%), while renter-occupied units make up 25 (25.8%).
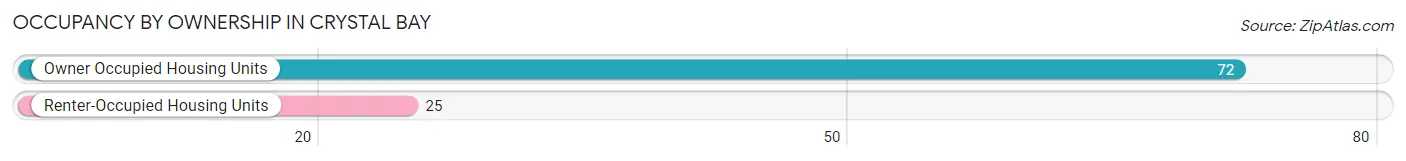
| Occupancy | # Housing Units | % Housing Units |
| Owner Occupied Housing Units | 72 | 74.2% |
| Renter-Occupied Housing Units | 25 | 25.8% |
| Total Occupied Housing Units | 97 | 100.0% |
Occupancy by Household Size in Crystal Bay
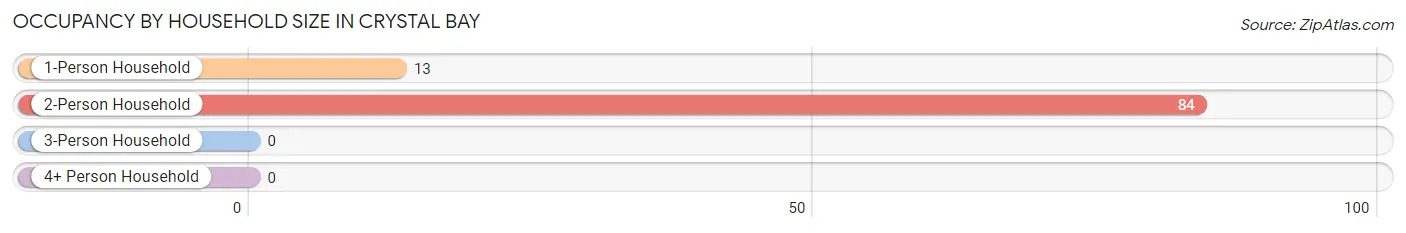
| Household Size | # Housing Units | % Housing Units |
| 1-Person Household | 13 | 13.4% |
| 2-Person Household | 84 | 86.6% |
| 3-Person Household | 0 | 0.0% |
| 4+ Person Household | 0 | 0.0% |
| Total Housing Units | 97 | 100.0% |
Occupancy by Ownership by Household Size in Crystal Bay
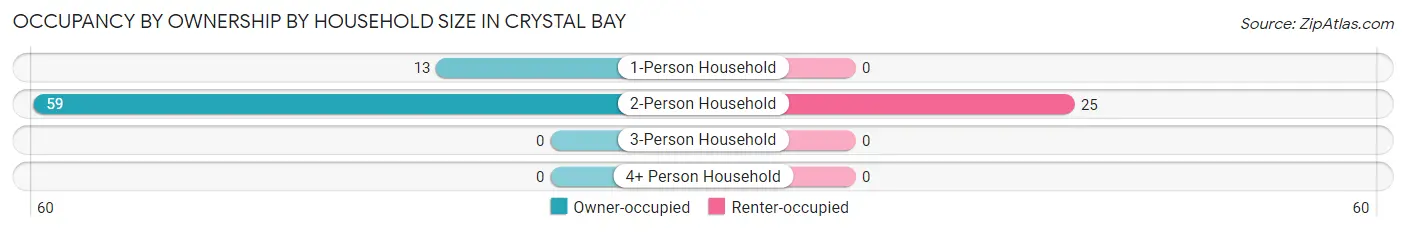
| Household Size | Owner-occupied | Renter-occupied |
| 1-Person Household | 13 (100.0%) | 0 (0.0%) |
| 2-Person Household | 59 (70.2%) | 25 (29.8%) |
| 3-Person Household | 0 (0.0%) | 0 (0.0%) |
| 4+ Person Household | 0 (0.0%) | 0 (0.0%) |
| Total Housing Units | 72 (74.2%) | 25 (25.8%) |
Occupancy by Educational Attainment in Crystal Bay
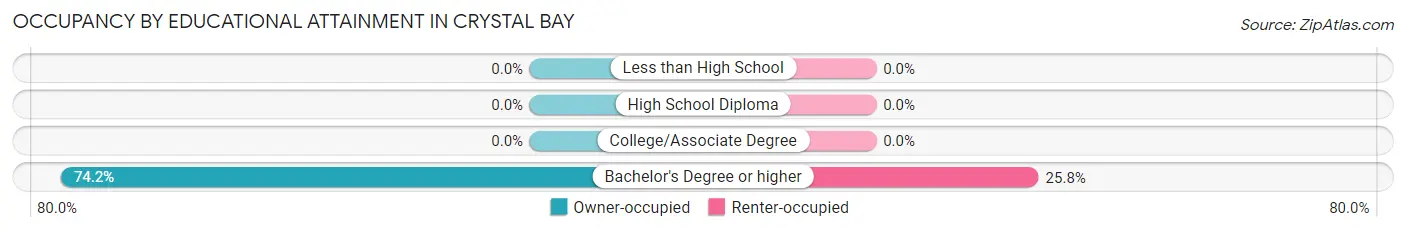
| Household Size | Owner-occupied | Renter-occupied |
| Less than High School | 0 (0.0%) | 0 (0.0%) |
| High School Diploma | 0 (0.0%) | 0 (0.0%) |
| College/Associate Degree | 0 (0.0%) | 0 (0.0%) |
| Bachelor's Degree or higher | 72 (74.2%) | 25 (25.8%) |
Occupancy by Age of Householder in Crystal Bay
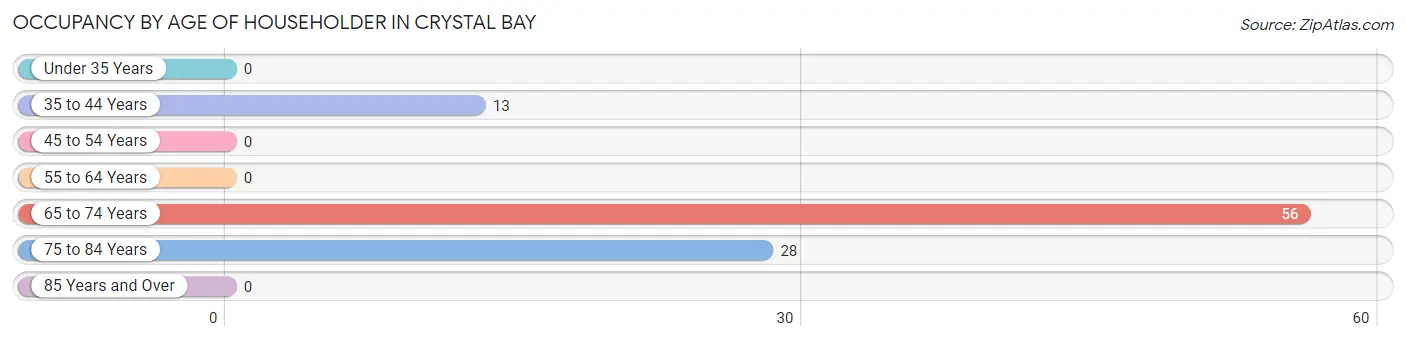
| Age Bracket | # Households | % Households |
| Under 35 Years | 0 | 0.0% |
| 35 to 44 Years | 13 | 13.4% |
| 45 to 54 Years | 0 | 0.0% |
| 55 to 64 Years | 0 | 0.0% |
| 65 to 74 Years | 56 | 57.7% |
| 75 to 84 Years | 28 | 28.9% |
| 85 Years and Over | 0 | 0.0% |
| Total | 97 | 100.0% |
Housing Finances in Crystal Bay
Median Income by Occupancy in Crystal Bay
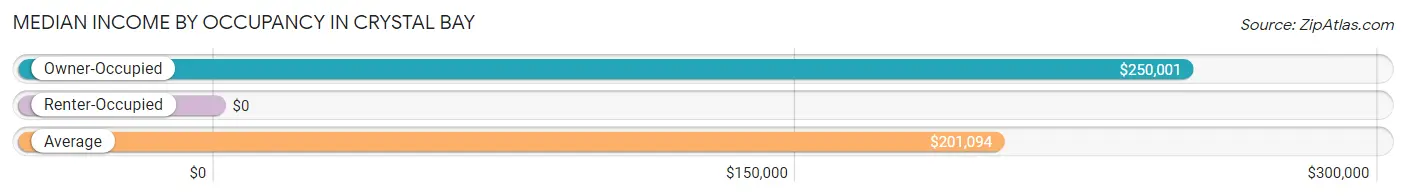
| Occupancy Type | # Households | Median Income |
| Owner-Occupied | 72 (74.2%) | $250,001 |
| Renter-Occupied | 25 (25.8%) | $0 |
| Average | 97 (100.0%) | $201,094 |
Occupancy by Householder Income Bracket in Crystal Bay
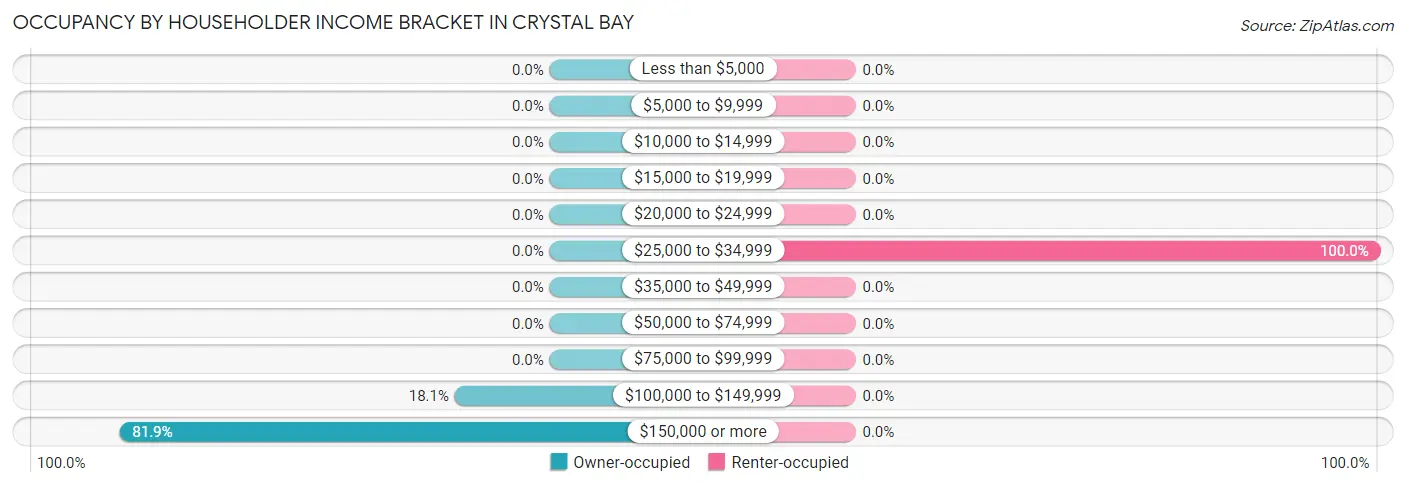
| Income Bracket | Owner-occupied | Renter-occupied |
| Less than $5,000 | 0 (0.0%) | 0 (0.0%) |
| $5,000 to $9,999 | 0 (0.0%) | 0 (0.0%) |
| $10,000 to $14,999 | 0 (0.0%) | 0 (0.0%) |
| $15,000 to $19,999 | 0 (0.0%) | 0 (0.0%) |
| $20,000 to $24,999 | 0 (0.0%) | 0 (0.0%) |
| $25,000 to $34,999 | 0 (0.0%) | 25 (100.0%) |
| $35,000 to $49,999 | 0 (0.0%) | 0 (0.0%) |
| $50,000 to $74,999 | 0 (0.0%) | 0 (0.0%) |
| $75,000 to $99,999 | 0 (0.0%) | 0 (0.0%) |
| $100,000 to $149,999 | 13 (18.1%) | 0 (0.0%) |
| $150,000 or more | 59 (81.9%) | 0 (0.0%) |
| Total | 72 (100.0%) | 25 (100.0%) |
Monthly Housing Cost Tiers in Crystal Bay
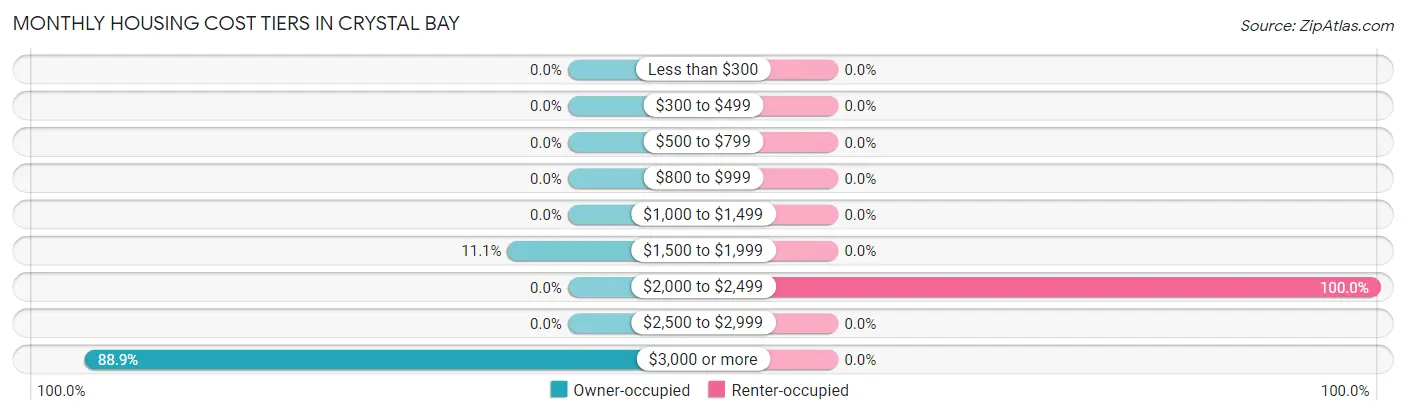
| Monthly Cost | Owner-occupied | Renter-occupied |
| Less than $300 | 0 (0.0%) | 0 (0.0%) |
| $300 to $499 | 0 (0.0%) | 0 (0.0%) |
| $500 to $799 | 0 (0.0%) | 0 (0.0%) |
| $800 to $999 | 0 (0.0%) | 0 (0.0%) |
| $1,000 to $1,499 | 0 (0.0%) | 0 (0.0%) |
| $1,500 to $1,999 | 8 (11.1%) | 0 (0.0%) |
| $2,000 to $2,499 | 0 (0.0%) | 25 (100.0%) |
| $2,500 to $2,999 | 0 (0.0%) | 0 (0.0%) |
| $3,000 or more | 64 (88.9%) | 0 (0.0%) |
| Total | 72 (100.0%) | 25 (100.0%) |
Physical Housing Characteristics in Crystal Bay
Housing Structures in Crystal Bay
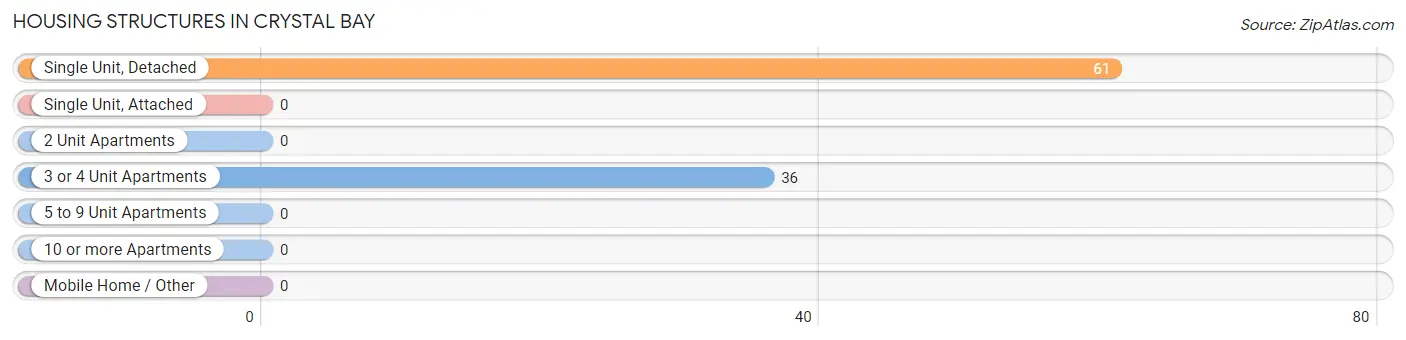
| Structure Type | # Housing Units | % Housing Units |
| Single Unit, Detached | 61 | 62.9% |
| Single Unit, Attached | 0 | 0.0% |
| 2 Unit Apartments | 0 | 0.0% |
| 3 or 4 Unit Apartments | 36 | 37.1% |
| 5 to 9 Unit Apartments | 0 | 0.0% |
| 10 or more Apartments | 0 | 0.0% |
| Mobile Home / Other | 0 | 0.0% |
| Total | 97 | 100.0% |
Housing Structures by Occupancy in Crystal Bay
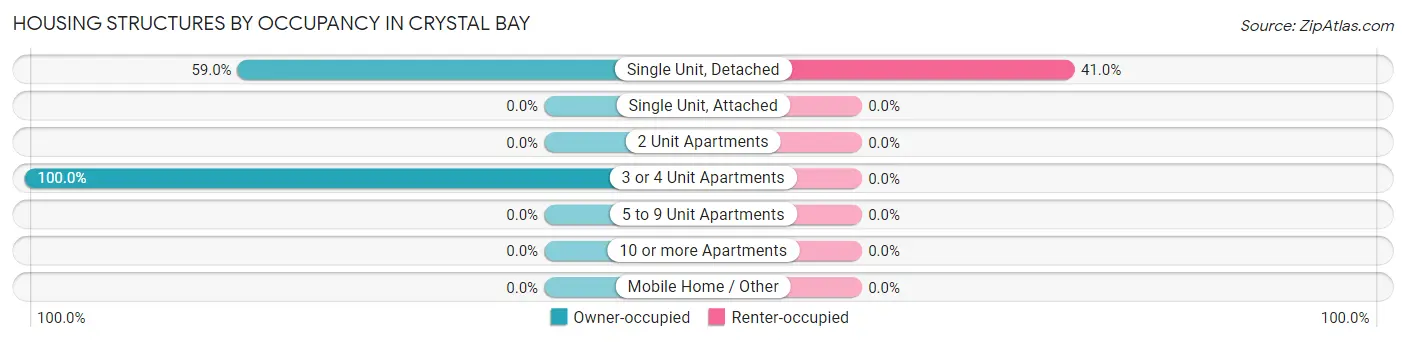
| Structure Type | Owner-occupied | Renter-occupied |
| Single Unit, Detached | 36 (59.0%) | 25 (41.0%) |
| Single Unit, Attached | 0 (0.0%) | 0 (0.0%) |
| 2 Unit Apartments | 0 (0.0%) | 0 (0.0%) |
| 3 or 4 Unit Apartments | 36 (100.0%) | 0 (0.0%) |
| 5 to 9 Unit Apartments | 0 (0.0%) | 0 (0.0%) |
| 10 or more Apartments | 0 (0.0%) | 0 (0.0%) |
| Mobile Home / Other | 0 (0.0%) | 0 (0.0%) |
| Total | 72 (74.2%) | 25 (25.8%) |
Housing Structures by Number of Rooms in Crystal Bay
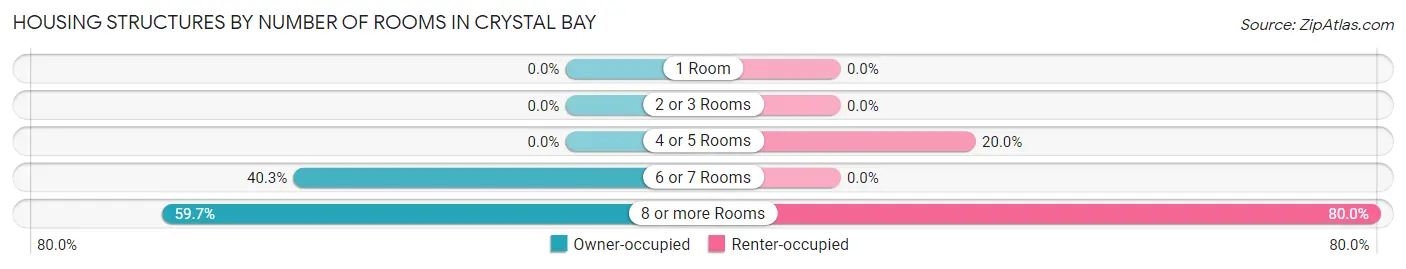
| Number of Rooms | Owner-occupied | Renter-occupied |
| 1 Room | 0 (0.0%) | 0 (0.0%) |
| 2 or 3 Rooms | 0 (0.0%) | 0 (0.0%) |
| 4 or 5 Rooms | 0 (0.0%) | 5 (20.0%) |
| 6 or 7 Rooms | 29 (40.3%) | 0 (0.0%) |
| 8 or more Rooms | 43 (59.7%) | 20 (80.0%) |
| Total | 72 (100.0%) | 25 (100.0%) |
Housing Structure by Heating Type in Crystal Bay
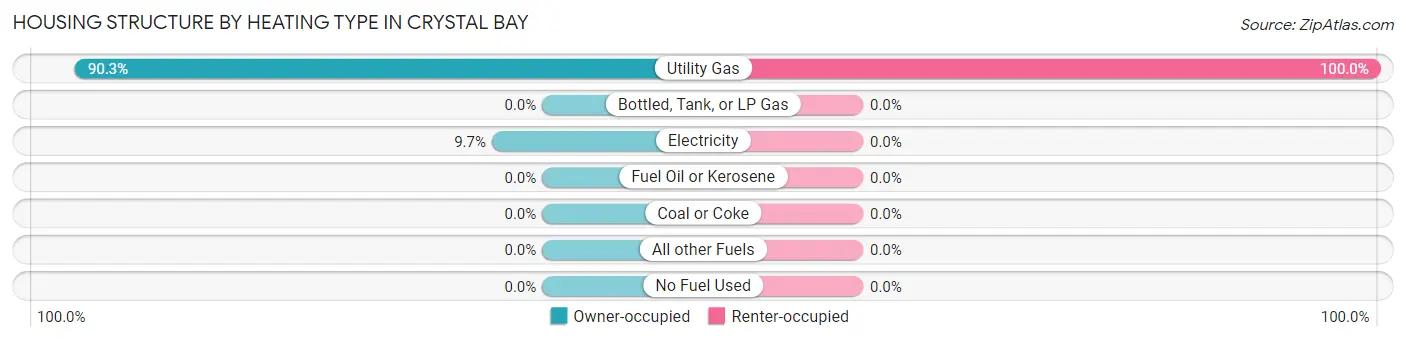
| Heating Type | Owner-occupied | Renter-occupied |
| Utility Gas | 65 (90.3%) | 25 (100.0%) |
| Bottled, Tank, or LP Gas | 0 (0.0%) | 0 (0.0%) |
| Electricity | 7 (9.7%) | 0 (0.0%) |
| Fuel Oil or Kerosene | 0 (0.0%) | 0 (0.0%) |
| Coal or Coke | 0 (0.0%) | 0 (0.0%) |
| All other Fuels | 0 (0.0%) | 0 (0.0%) |
| No Fuel Used | 0 (0.0%) | 0 (0.0%) |
| Total | 72 (100.0%) | 25 (100.0%) |
Household Vehicle Usage in Crystal Bay
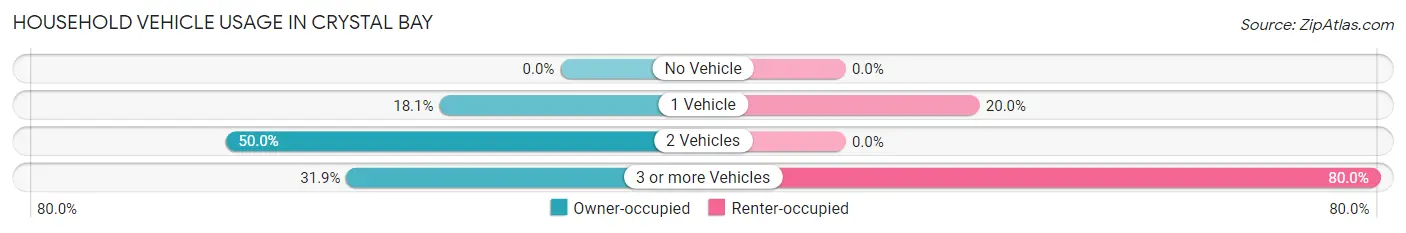
| Vehicles per Household | Owner-occupied | Renter-occupied |
| No Vehicle | 0 (0.0%) | 0 (0.0%) |
| 1 Vehicle | 13 (18.1%) | 5 (20.0%) |
| 2 Vehicles | 36 (50.0%) | 0 (0.0%) |
| 3 or more Vehicles | 23 (31.9%) | 20 (80.0%) |
| Total | 72 (100.0%) | 25 (100.0%) |
Real Estate & Mortgages in Crystal Bay
Real Estate and Mortgage Overview in Crystal Bay
| Characteristic | Without Mortgage | With Mortgage |
| Housing Units | 38 | 34 |
| Median Property Value | $2,000,001 | $0 |
| Median Household Income | $250,001 | $21 |
| Monthly Housing Costs | $1,501 | $34 |
| Real Estate Taxes | $10,001 | $0 |
Property Value by Mortgage Status in Crystal Bay
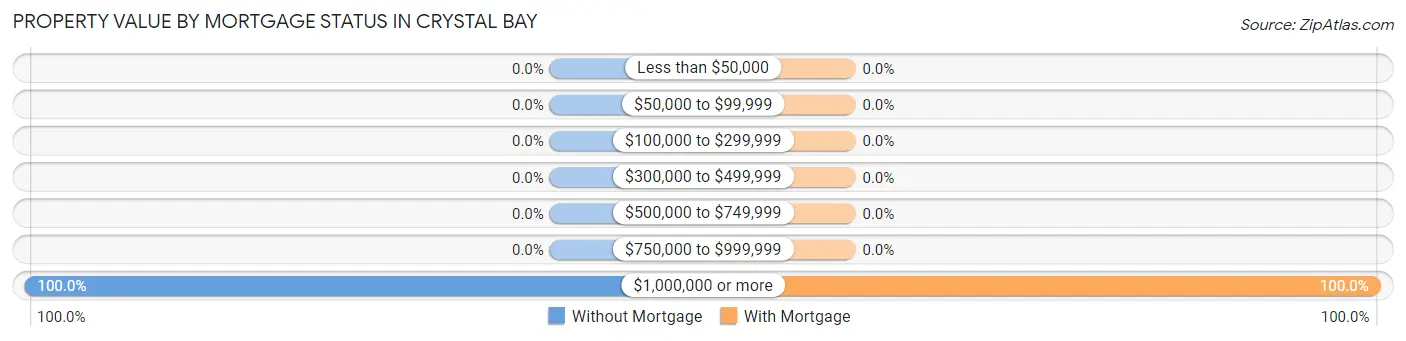
| Property Value | Without Mortgage | With Mortgage |
| Less than $50,000 | 0 (0.0%) | 0 (0.0%) |
| $50,000 to $99,999 | 0 (0.0%) | 0 (0.0%) |
| $100,000 to $299,999 | 0 (0.0%) | 0 (0.0%) |
| $300,000 to $499,999 | 0 (0.0%) | 0 (0.0%) |
| $500,000 to $749,999 | 0 (0.0%) | 0 (0.0%) |
| $750,000 to $999,999 | 0 (0.0%) | 0 (0.0%) |
| $1,000,000 or more | 38 (100.0%) | 34 (100.0%) |
| Total | 38 (100.0%) | 34 (100.0%) |
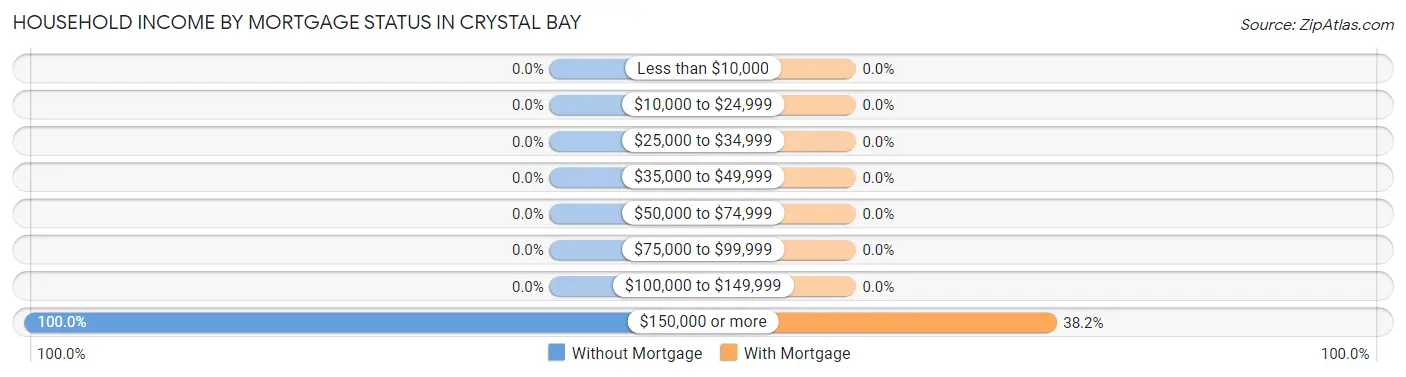
Household Income by Mortgage Status in Crystal Bay
| Household Income | Without Mortgage | With Mortgage |
| Less than $10,000 | 0 (0.0%) | 0 (0.0%) |
| $10,000 to $24,999 | 0 (0.0%) | 0 (0.0%) |
| $25,000 to $34,999 | 0 (0.0%) | 0 (0.0%) |
| $35,000 to $49,999 | 0 (0.0%) | 0 (0.0%) |
| $50,000 to $74,999 | 0 (0.0%) | 0 (0.0%) |
| $75,000 to $99,999 | 0 (0.0%) | 0 (0.0%) |
| $100,000 to $149,999 | 0 (0.0%) | 0 (0.0%) |
| $150,000 or more | 38 (100.0%) | 13 (38.2%) |
| Total | 38 (100.0%) | 34 (100.0%) |
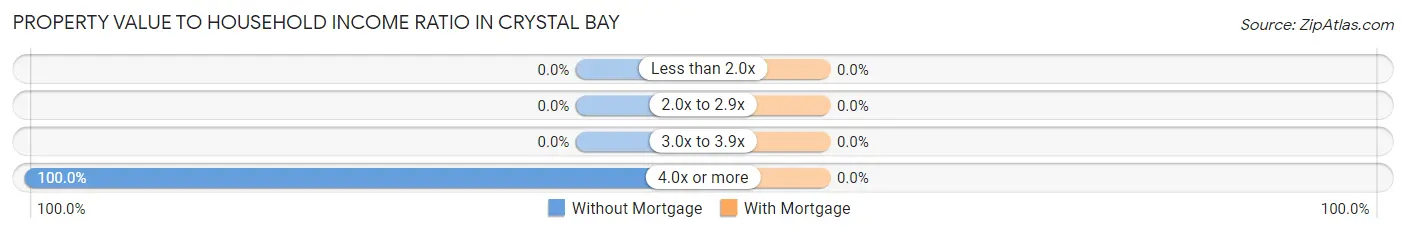
Property Value to Household Income Ratio in Crystal Bay
| Value-to-Income Ratio | Without Mortgage | With Mortgage |
| Less than 2.0x | 0 (0.0%) | 0 (0.0%) |
| 2.0x to 2.9x | 0 (0.0%) | 0 (0.0%) |
| 3.0x to 3.9x | 0 (0.0%) | 0 (0.0%) |
| 4.0x or more | 38 (100.0%) | 0 (0.0%) |
| Total | 38 (100.0%) | 34 (100.0%) |
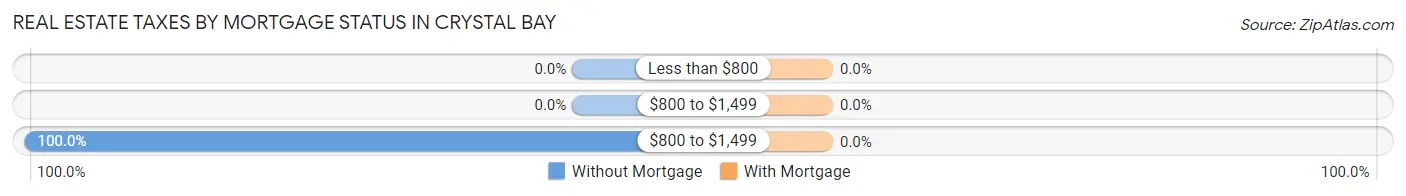
Real Estate Taxes by Mortgage Status in Crystal Bay
| Property Taxes | Without Mortgage | With Mortgage |
| Less than $800 | 0 (0.0%) | 0 (0.0%) |
| $800 to $1,499 | 0 (0.0%) | 0 (0.0%) |
| $800 to $1,499 | 38 (100.0%) | 0 (0.0%) |
| Total | 38 (100.0%) | 34 (100.0%) |
Health & Disability in Crystal Bay
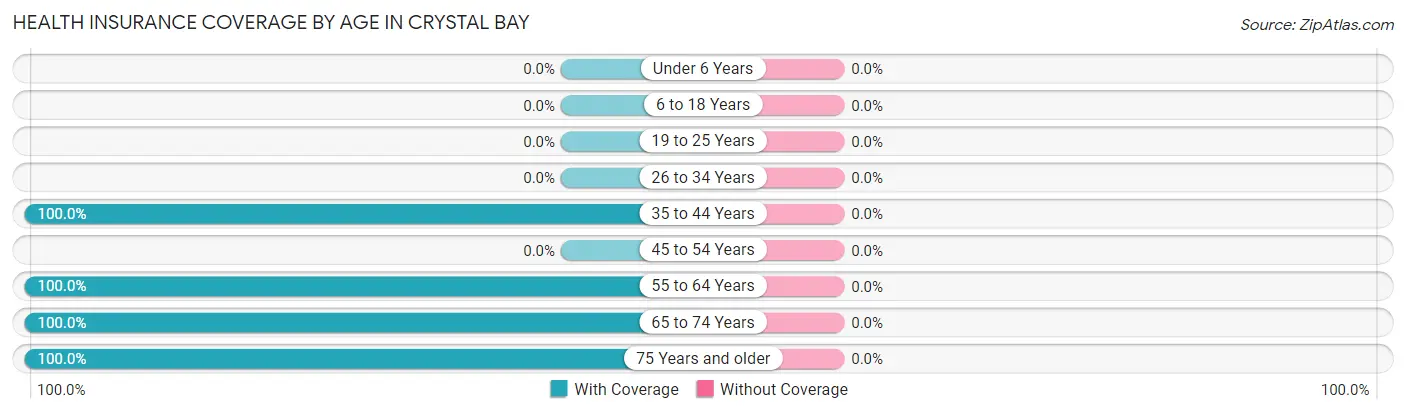
Health Insurance Coverage by Age in Crystal Bay
| Age Bracket | With Coverage | Without Coverage |
| Under 6 Years | 0 (0.0%) | 0 (0.0%) |
| 6 to 18 Years | 0 (0.0%) | 0 (0.0%) |
| 19 to 25 Years | 0 (0.0%) | 0 (0.0%) |
| 26 to 34 Years | 0 (0.0%) | 0 (0.0%) |
| 35 to 44 Years | 13 (100.0%) | 0 (0.0%) |
| 45 to 54 Years | 0 (0.0%) | 0 (0.0%) |
| 55 to 64 Years | 8 (100.0%) | 0 (0.0%) |
| 65 to 74 Years | 105 (100.0%) | 0 (0.0%) |
| 75 Years and older | 58 (100.0%) | 0 (0.0%) |
| Total | 184 (100.0%) | 0 (0.0%) |
Health Insurance Coverage by Citizenship Status in Crystal Bay
| Citizenship Status | With Coverage | Without Coverage |
| Native Born | 0 (0.0%) | 0 (0.0%) |
| Foreign Born, Citizen | 0 (0.0%) | 0 (0.0%) |
| Foreign Born, not a Citizen | 0 (0.0%) | 0 (0.0%) |
Health Insurance Coverage by Household Income in Crystal Bay
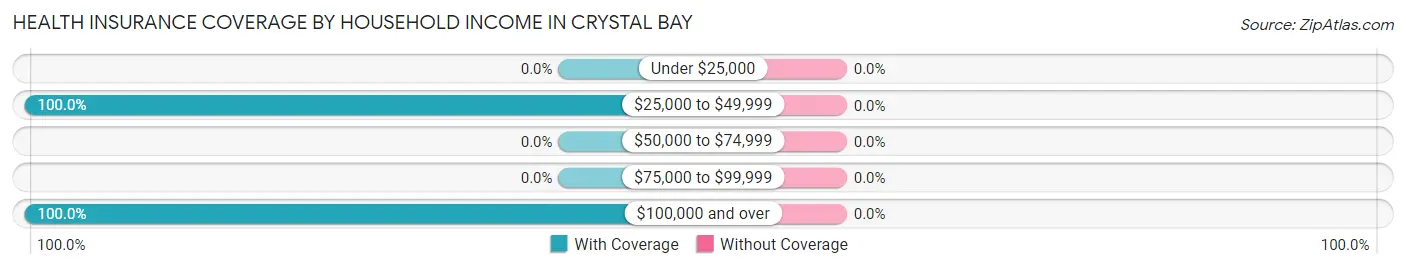
| Household Income | With Coverage | Without Coverage |
| Under $25,000 | 0 (0.0%) | 0 (0.0%) |
| $25,000 to $49,999 | 52 (100.0%) | 0 (0.0%) |
| $50,000 to $74,999 | 0 (0.0%) | 0 (0.0%) |
| $75,000 to $99,999 | 0 (0.0%) | 0 (0.0%) |
| $100,000 and over | 132 (100.0%) | 0 (0.0%) |
Public vs Private Health Insurance Coverage by Age in Crystal Bay
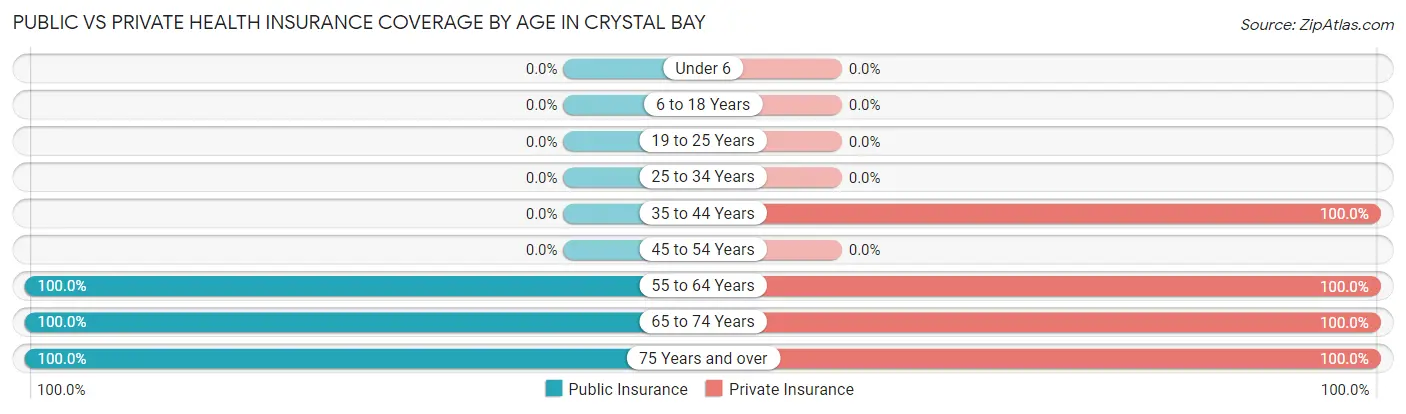
| Age Bracket | Public Insurance | Private Insurance |
| Under 6 | 0 (0.0%) | 0 (0.0%) |
| 6 to 18 Years | 0 (0.0%) | 0 (0.0%) |
| 19 to 25 Years | 0 (0.0%) | 0 (0.0%) |
| 25 to 34 Years | 0 (0.0%) | 0 (0.0%) |
| 35 to 44 Years | 0 (0.0%) | 13 (100.0%) |
| 45 to 54 Years | 0 (0.0%) | 0 (0.0%) |
| 55 to 64 Years | 8 (100.0%) | 8 (100.0%) |
| 65 to 74 Years | 105 (100.0%) | 105 (100.0%) |
| 75 Years and over | 58 (100.0%) | 58 (100.0%) |
| Total | 171 (92.9%) | 184 (100.0%) |
Disability Status by Sex by Age in Crystal Bay
| Age Bracket | Male | Female |
| Under 5 Years | 0 (0.0%) | 0 (0.0%) |
| 5 to 17 Years | 0 (0.0%) | 0 (0.0%) |
| 18 to 34 Years | 0 (0.0%) | 0 (0.0%) |
| 35 to 64 Years | 0 (0.0%) | 0 (0.0%) |
| 65 to 74 Years | 0 (0.0%) | 0 (0.0%) |
| 75 Years and over | 0 (0.0%) | 0 (0.0%) |
Disability Class by Sex by Age in Crystal Bay
Disability Class: Hearing Difficulty
| Age Bracket | Male | Female |
| Under 5 Years | 0 (0.0%) | 0 (0.0%) |
| 5 to 17 Years | 0 (0.0%) | 0 (0.0%) |
| 18 to 34 Years | 0 (0.0%) | 0 (0.0%) |
| 35 to 64 Years | 0 (0.0%) | 0 (0.0%) |
| 65 to 74 Years | 0 (0.0%) | 0 (0.0%) |
| 75 Years and over | 0 (0.0%) | 0 (0.0%) |
Disability Class: Vision Difficulty
| Age Bracket | Male | Female |
| Under 5 Years | 0 (0.0%) | 0 (0.0%) |
| 5 to 17 Years | 0 (0.0%) | 0 (0.0%) |
| 18 to 34 Years | 0 (0.0%) | 0 (0.0%) |
| 35 to 64 Years | 0 (0.0%) | 0 (0.0%) |
| 65 to 74 Years | 0 (0.0%) | 0 (0.0%) |
| 75 Years and over | 0 (0.0%) | 0 (0.0%) |
Disability Class: Cognitive Difficulty
| Age Bracket | Male | Female |
| 5 to 17 Years | 0 (0.0%) | 0 (0.0%) |
| 18 to 34 Years | 0 (0.0%) | 0 (0.0%) |
| 35 to 64 Years | 0 (0.0%) | 0 (0.0%) |
| 65 to 74 Years | 0 (0.0%) | 0 (0.0%) |
| 75 Years and over | 0 (0.0%) | 0 (0.0%) |
Disability Class: Ambulatory Difficulty
| Age Bracket | Male | Female |
| 5 to 17 Years | 0 (0.0%) | 0 (0.0%) |
| 18 to 34 Years | 0 (0.0%) | 0 (0.0%) |
| 35 to 64 Years | 0 (0.0%) | 0 (0.0%) |
| 65 to 74 Years | 0 (0.0%) | 0 (0.0%) |
| 75 Years and over | 0 (0.0%) | 0 (0.0%) |
Disability Class: Self-Care Difficulty
| Age Bracket | Male | Female |
| 5 to 17 Years | 0 (0.0%) | 0 (0.0%) |
| 18 to 34 Years | 0 (0.0%) | 0 (0.0%) |
| 35 to 64 Years | 0 (0.0%) | 0 (0.0%) |
| 65 to 74 Years | 0 (0.0%) | 0 (0.0%) |
| 75 Years and over | 0 (0.0%) | 0 (0.0%) |
Technology Access in Crystal Bay
Computing Device Access in Crystal Bay
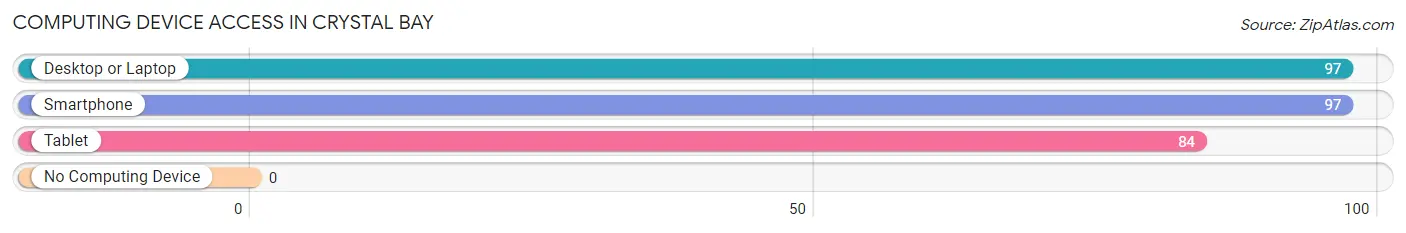
| Device Type | # Households | % Households |
| Desktop or Laptop | 97 | 100.0% |
| Smartphone | 97 | 100.0% |
| Tablet | 84 | 86.6% |
| No Computing Device | 0 | 0.0% |
| Total | 97 | 100.0% |
Internet Access in Crystal Bay
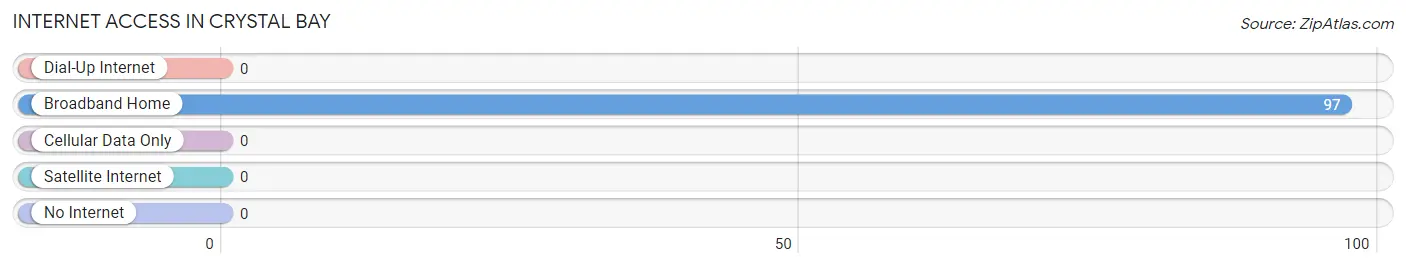
| Internet Type | # Households | % Households |
| Dial-Up Internet | 0 | 0.0% |
| Broadband Home | 97 | 100.0% |
| Cellular Data Only | 0 | 0.0% |
| Satellite Internet | 0 | 0.0% |
| No Internet | 0 | 0.0% |
| Total | 97 | 100.0% |
Crystal Bay Summary
Bay, NV is a small unincorporated community located in Washoe County, Nevada. It is situated on the north shore of Lake Tahoe, approximately 20 miles south of Reno. The population of Crystal Bay was estimated to be around 1,000 people in 2020.
History
The area that is now Crystal Bay was first inhabited by the Washoe people, who lived in the area for thousands of years before the arrival of European settlers. The first recorded European settlers in the area were miners who arrived in the late 1800s. The area was originally known as Crystal Bay Station, and was a stop on the Virginia and Truckee Railroad. The railroad was used to transport ore from the mines in the area to the smelters in Reno.
In the early 1900s, the area began to attract tourists, and the first hotel was built in Crystal Bay in 1906. The hotel was called the Crystal Bay Hotel, and it was a popular destination for visitors to the area. The hotel was destroyed by a fire in the 1920s, but was rebuilt and is still in operation today.
In the 1950s, the area began to attract more visitors, and the first casino was built in Crystal Bay in 1955. The casino, called the Crystal Bay Club, was a popular destination for gamblers and tourists alike. The casino is still in operation today.
Geography
Crystal Bay is located on the north shore of Lake Tahoe, approximately 20 miles south of Reno. The area is surrounded by the Sierra Nevada mountain range, and is known for its stunning views of the lake and the surrounding mountains. The area is also known for its mild climate, with temperatures rarely dropping below freezing in the winter months.
The area is home to several parks and recreational areas, including the Crystal Bay State Park, which offers camping, hiking, and other outdoor activities. The area is also home to several ski resorts, including the popular Northstar California Resort.
Economy
The economy of Crystal Bay is largely based on tourism and recreation. The area is home to several casinos, hotels, and restaurants, which attract visitors from all over the world. The area is also home to several ski resorts, which attract skiers and snowboarders from all over the world.
The area is also home to several businesses, including a marina, a golf course, and several retail stores. The area is also home to several art galleries, which showcase the work of local artists.
Demographics
The population of Crystal Bay was estimated to be around 1,000 people in 2020. The population is largely white, with a small percentage of African Americans, Asians, and Hispanics. The median household income in the area is around $50,000, and the median home value is around $400,000. The area is home to several schools, including the Crystal Bay Elementary School and the Crystal Bay High School.
Common Questions
What is Per Capita Income in Crystal Bay?
Per Capita income in Crystal Bay is $295,845.
What is the Median Family Income in Crystal Bay?
Median Family Income in Crystal Bay is $250,001.
What is the Median Household income in Crystal Bay?
Median Household Income in Crystal Bay is $201,094.
What is Inequality or Gini Index in Crystal Bay?
Inequality or Gini Index in Crystal Bay is 0.48.
What is the Total Population of Crystal Bay?
Total Population of Crystal Bay is 184.
What is the Total Male Population of Crystal Bay?
Total Male Population of Crystal Bay is 100.
What is the Total Female Population of Crystal Bay?
Total Female Population of Crystal Bay is 84.
What is the Ratio of Males per 100 Females in Crystal Bay?
There are 119.05 Males per 100 Females in Crystal Bay.
What is the Ratio of Females per 100 Males in Crystal Bay?
There are 84.00 Females per 100 Males in Crystal Bay.
What is the Median Population Age in Crystal Bay?
Median Population Age in Crystal Bay is 72.2 Years.
What is the Average Family Size in Crystal Bay
Average Family Size in Crystal Bay is 2.0 People.
What is the Average Household Size in Crystal Bay
Average Household Size in Crystal Bay is 1.9 People.
How Large is the Labor Force in Crystal Bay?
There are 13 People in the Labor Forcein in Crystal Bay.
What is the Percentage of People in the Labor Force in Crystal Bay?
7.1% of People are in the Labor Force in Crystal Bay.