Zip Codes with the Highest Percentage of Population Employed in Community & Social Service in Maryland
RELATED REPORTS & OPTIONS
Community & Social Service
Maryland
Compare Zip Codes
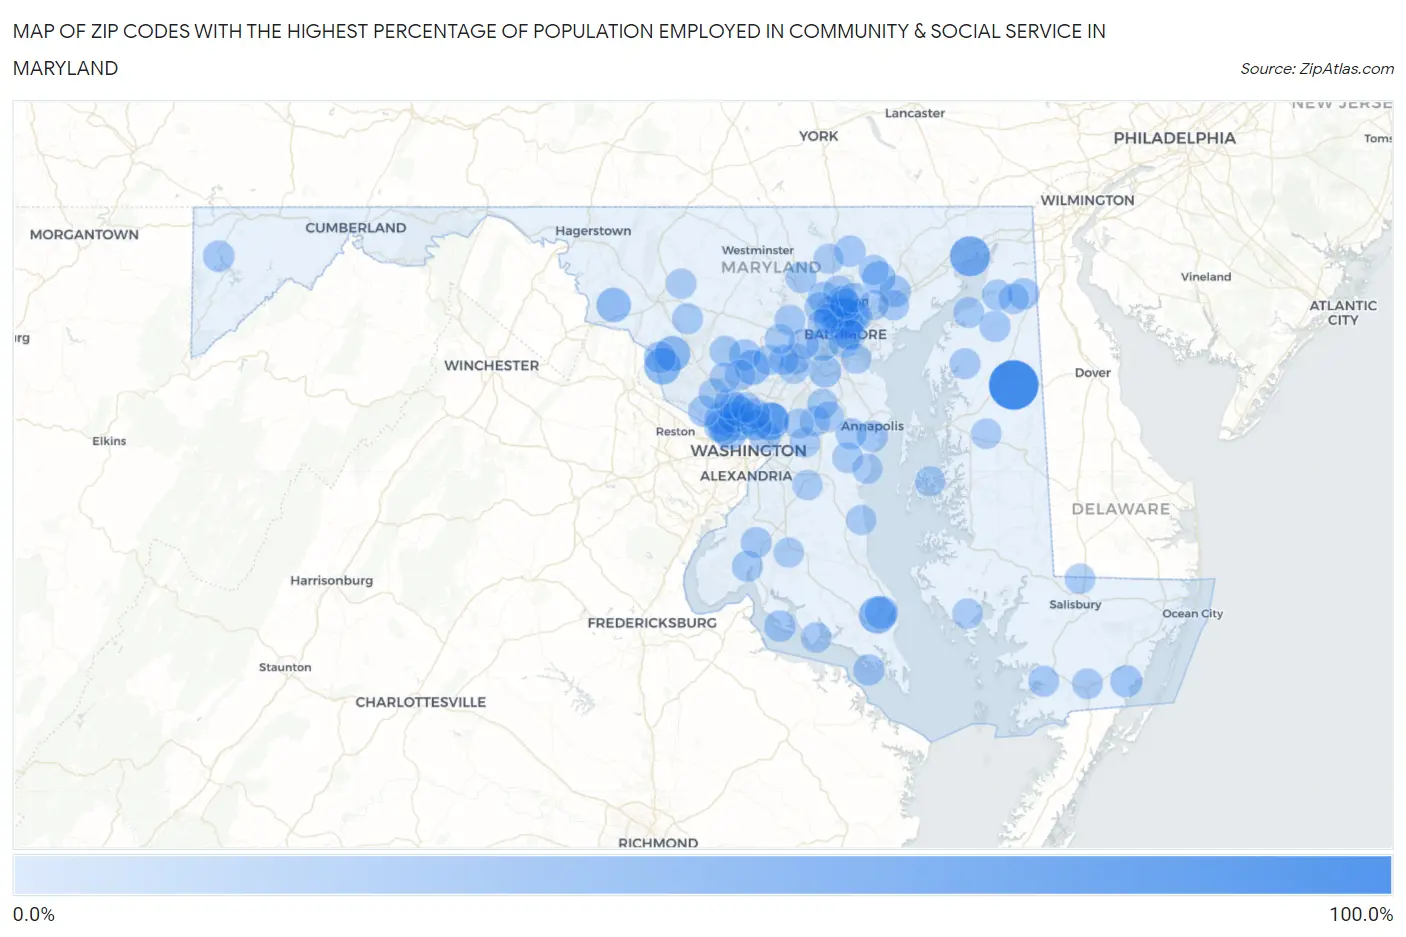
Map of Zip Codes with the Highest Percentage of Population Employed in Community & Social Service in Maryland
0.0%
100.0%
Zip Codes with the Highest Percentage of Population Employed in Community & Social Service in Maryland
| Zip Code | % Employed | vs State | vs National | |
| 1. | 21644 | 100.0% | 12.6%(+87.4)#1 | 11.2%(+88.8)#15 |
| 2. | 21902 | 57.5% | 12.6%(+44.9)#2 | 11.2%(+46.3)#96 |
| 3. | 20742 | 47.9% | 12.6%(+35.3)#3 | 11.2%(+36.7)#184 |
| 4. | 20688 | 43.9% | 12.6%(+31.3)#4 | 11.2%(+32.7)#236 |
| 5. | 20839 | 41.3% | 12.6%(+28.7)#5 | 11.2%(+30.1)#271 |
| 6. | 20838 | 37.2% | 12.6%(+24.6)#6 | 11.2%(+26.0)#347 |
| 7. | 20862 | 34.2% | 12.6%(+21.6)#7 | 11.2%(+23.0)#413 |
| 8. | 21718 | 32.4% | 12.6%(+19.8)#8 | 11.2%(+21.2)#472 |
| 9. | 20816 | 31.7% | 12.6%(+19.1)#9 | 11.2%(+20.5)#504 |
| 10. | 20815 | 28.9% | 12.6%(+16.3)#10 | 11.2%(+17.7)#640 |
| 11. | 21210 | 28.2% | 12.6%(+15.6)#11 | 11.2%(+17.0)#680 |
| 12. | 20629 | 27.1% | 12.6%(+14.5)#12 | 11.2%(+15.9)#761 |
| 13. | 21082 | 26.1% | 12.6%(+13.4)#13 | 11.2%(+14.8)#866 |
| 14. | 21077 | 24.2% | 12.6%(+11.6)#14 | 11.2%(+13.0)#1,078 |
| 15. | 20817 | 24.1% | 12.6%(+11.5)#15 | 11.2%(+12.9)#1,093 |
| 16. | 20812 | 24.1% | 12.6%(+11.5)#16 | 11.2%(+12.9)#1,097 |
| 17. | 21251 | 24.0% | 12.6%(+11.4)#17 | 11.2%(+12.7)#1,117 |
| 18. | 20896 | 23.3% | 12.6%(+10.7)#18 | 11.2%(+12.1)#1,228 |
| 19. | 20910 | 23.1% | 12.6%(+10.5)#19 | 11.2%(+11.9)#1,254 |
| 20. | 21218 | 22.6% | 12.6%(+9.96)#20 | 11.2%(+11.4)#1,352 |
| 21. | 21211 | 22.5% | 12.6%(+9.86)#21 | 11.2%(+11.3)#1,373 |
| 22. | 20842 | 22.4% | 12.6%(+9.81)#22 | 11.2%(+11.2)#1,381 |
| 23. | 21829 | 22.4% | 12.6%(+9.81)#23 | 11.2%(+11.2)#1,384 |
| 24. | 21250 | 22.1% | 12.6%(+9.45)#24 | 11.2%(+10.8)#1,468 |
| 25. | 21209 | 21.9% | 12.6%(+9.31)#25 | 11.2%(+10.7)#1,495 |
| 26. | 21202 | 21.9% | 12.6%(+9.30)#26 | 11.2%(+10.7)#1,497 |
| 27. | 20712 | 21.4% | 12.6%(+8.84)#27 | 11.2%(+10.2)#1,603 |
| 28. | 20740 | 21.3% | 12.6%(+8.74)#28 | 11.2%(+10.1)#1,628 |
| 29. | 21153 | 21.2% | 12.6%(+8.64)#29 | 11.2%(+10.0)#1,650 |
| 30. | 20814 | 21.2% | 12.6%(+8.58)#30 | 11.2%(+9.97)#1,665 |
| 31. | 21212 | 21.0% | 12.6%(+8.42)#31 | 11.2%(+9.81)#1,712 |
| 32. | 20818 | 20.9% | 12.6%(+8.29)#32 | 11.2%(+9.68)#1,747 |
| 33. | 21156 | 20.8% | 12.6%(+8.19)#33 | 11.2%(+9.58)#1,779 |
| 34. | 20912 | 20.2% | 12.6%(+7.63)#34 | 11.2%(+9.02)#1,943 |
| 35. | 21093 | 20.0% | 12.6%(+7.39)#35 | 11.2%(+8.79)#2,009 |
| 36. | 21541 | 20.0% | 12.6%(+7.39)#36 | 11.2%(+8.79)#2,012 |
| 37. | 20645 | 19.8% | 12.6%(+7.23)#37 | 11.2%(+8.62)#2,072 |
| 38. | 21214 | 19.6% | 12.6%(+7.00)#38 | 11.2%(+8.39)#2,161 |
| 39. | 20895 | 19.5% | 12.6%(+6.91)#39 | 11.2%(+8.30)#2,190 |
| 40. | 20833 | 19.5% | 12.6%(+6.90)#40 | 11.2%(+8.29)#2,197 |
| 41. | 21912 | 19.4% | 12.6%(+6.75)#41 | 11.2%(+8.15)#2,253 |
| 42. | 21111 | 19.3% | 12.6%(+6.74)#42 | 11.2%(+8.13)#2,258 |
| 43. | 20854 | 18.8% | 12.6%(+6.17)#43 | 11.2%(+7.57)#2,478 |
| 44. | 21204 | 18.7% | 12.6%(+6.14)#44 | 11.2%(+7.53)#2,497 |
| 45. | 21645 | 18.5% | 12.6%(+5.89)#45 | 11.2%(+7.28)#2,594 |
| 46. | 21403 | 18.3% | 12.6%(+5.72)#46 | 11.2%(+7.11)#2,663 |
| 47. | 20674 | 18.2% | 12.6%(+5.60)#47 | 11.2%(+6.99)#2,713 |
| 48. | 20677 | 18.1% | 12.6%(+5.53)#48 | 11.2%(+6.92)#2,758 |
| 49. | 21071 | 18.1% | 12.6%(+5.47)#49 | 11.2%(+6.86)#2,778 |
| 50. | 20675 | 17.9% | 12.6%(+5.27)#50 | 11.2%(+6.66)#2,885 |
| 51. | 21140 | 17.9% | 12.6%(+5.27)#51 | 11.2%(+6.66)#2,890 |
| 52. | 21208 | 17.7% | 12.6%(+5.08)#52 | 11.2%(+6.47)#2,979 |
| 53. | 21610 | 17.5% | 12.6%(+4.89)#53 | 11.2%(+6.29)#3,062 |
| 54. | 20852 | 17.4% | 12.6%(+4.84)#54 | 11.2%(+6.23)#3,086 |
| 55. | 21871 | 17.3% | 12.6%(+4.65)#55 | 11.2%(+6.04)#3,211 |
| 56. | 21620 | 17.2% | 12.6%(+4.55)#56 | 11.2%(+5.94)#3,278 |
| 57. | 21919 | 17.0% | 12.6%(+4.44)#57 | 11.2%(+5.84)#3,345 |
| 58. | 21754 | 17.0% | 12.6%(+4.44)#58 | 11.2%(+5.83)#3,346 |
| 59. | 20882 | 17.0% | 12.6%(+4.39)#59 | 11.2%(+5.79)#3,378 |
| 60. | 20776 | 16.9% | 12.6%(+4.27)#60 | 11.2%(+5.66)#3,465 |
| 61. | 20901 | 16.5% | 12.6%(+3.88)#61 | 11.2%(+5.27)#3,700 |
| 62. | 21045 | 16.5% | 12.6%(+3.86)#62 | 11.2%(+5.25)#3,727 |
| 63. | 21163 | 16.2% | 12.6%(+3.55)#63 | 11.2%(+4.94)#3,951 |
| 64. | 21230 | 16.1% | 12.6%(+3.54)#64 | 11.2%(+4.93)#3,958 |
| 65. | 21231 | 16.1% | 12.6%(+3.52)#65 | 11.2%(+4.91)#3,976 |
| 66. | 21162 | 16.1% | 12.6%(+3.50)#66 | 11.2%(+4.89)#3,994 |
| 67. | 21851 | 16.1% | 12.6%(+3.50)#67 | 11.2%(+4.89)#3,997 |
| 68. | 21913 | 16.0% | 12.6%(+3.43)#68 | 11.2%(+4.82)#4,048 |
| 69. | 21043 | 16.0% | 12.6%(+3.40)#69 | 11.2%(+4.79)#4,066 |
| 70. | 21215 | 16.0% | 12.6%(+3.36)#70 | 11.2%(+4.75)#4,096 |
| 71. | 20832 | 15.8% | 12.6%(+3.19)#71 | 11.2%(+4.58)#4,240 |
| 72. | 20606 | 15.8% | 12.6%(+3.18)#72 | 11.2%(+4.58)#4,249 |
| 73. | 20850 | 15.7% | 12.6%(+3.14)#73 | 11.2%(+4.53)#4,300 |
| 74. | 21252 | 15.7% | 12.6%(+3.13)#74 | 11.2%(+4.52)#4,308 |
| 75. | 21046 | 15.5% | 12.6%(+2.94)#75 | 11.2%(+4.33)#4,459 |
| 76. | 21029 | 15.4% | 12.6%(+2.83)#76 | 11.2%(+4.22)#4,577 |
| 77. | 20902 | 15.4% | 12.6%(+2.81)#77 | 11.2%(+4.20)#4,586 |
| 78. | 21286 | 15.4% | 12.6%(+2.76)#78 | 11.2%(+4.16)#4,639 |
| 79. | 20715 | 15.4% | 12.6%(+2.76)#79 | 11.2%(+4.15)#4,641 |
| 80. | 21113 | 15.3% | 12.6%(+2.69)#80 | 11.2%(+4.08)#4,701 |
| 81. | 21626 | 15.2% | 12.6%(+2.55)#81 | 11.2%(+3.94)#4,829 |
| 82. | 21663 | 15.1% | 12.6%(+2.47)#82 | 11.2%(+3.87)#4,895 |
| 83. | 21657 | 15.1% | 12.6%(+2.45)#83 | 11.2%(+3.84)#4,913 |
| 84. | 20855 | 15.1% | 12.6%(+2.44)#84 | 11.2%(+3.84)#4,920 |
| 85. | 21701 | 15.0% | 12.6%(+2.44)#85 | 11.2%(+3.83)#4,929 |
| 86. | 21044 | 15.0% | 12.6%(+2.41)#86 | 11.2%(+3.80)#4,948 |
| 87. | 21114 | 15.0% | 12.6%(+2.37)#87 | 11.2%(+3.76)#4,987 |
| 88. | 21875 | 15.0% | 12.6%(+2.36)#88 | 11.2%(+3.75)#4,997 |
| 89. | 21042 | 14.9% | 12.6%(+2.34)#89 | 11.2%(+3.73)#5,020 |
| 90. | 21152 | 14.9% | 12.6%(+2.33)#90 | 11.2%(+3.72)#5,030 |
| 91. | 20721 | 14.8% | 12.6%(+2.15)#91 | 11.2%(+3.54)#5,209 |
| 92. | 21013 | 14.7% | 12.6%(+2.13)#92 | 11.2%(+3.52)#5,228 |
| 93. | 20772 | 14.7% | 12.6%(+2.11)#93 | 11.2%(+3.50)#5,250 |
| 94. | 20769 | 14.6% | 12.6%(+2.03)#94 | 11.2%(+3.42)#5,324 |
| 95. | 21236 | 14.6% | 12.6%(+1.97)#95 | 11.2%(+3.36)#5,403 |
| 96. | 20764 | 14.6% | 12.6%(+1.96)#96 | 11.2%(+3.36)#5,404 |
| 97. | 21226 | 14.5% | 12.6%(+1.91)#97 | 11.2%(+3.31)#5,456 |
| 98. | 20617 | 14.4% | 12.6%(+1.83)#98 | 11.2%(+3.22)#5,550 |
| 99. | 20732 | 14.4% | 12.6%(+1.82)#99 | 11.2%(+3.21)#5,561 |
| 100. | 21207 | 14.4% | 12.6%(+1.80)#100 | 11.2%(+3.20)#5,578 |
Common Questions
What are the Top 10 Zip Codes with the Highest Percentage of Population Employed in Community & Social Service in Maryland?
Top 10 Zip Codes with the Highest Percentage of Population Employed in Community & Social Service in Maryland are:
What zip code has the Highest Percentage of Population Employed in Community & Social Service in Maryland?
21644 has the Highest Percentage of Population Employed in Community & Social Service in Maryland with 100.0%.
What is the Percentage of Population Employed in Community & Social Service in the State of Maryland?
Percentage of Population Employed in Community & Social Service in Maryland is 12.6%.
What is the Percentage of Population Employed in Community & Social Service in the United States?
Percentage of Population Employed in Community & Social Service in the United States is 11.2%.