Zip Codes with the Highest Percentage of Population Employed in Community & Social Service in Bowie, MD
RELATED REPORTS & OPTIONS
Community & Social Service
Bowie
Compare Zip Codes
Map of Zip Codes with the Highest Percentage of Population Employed in Community & Social Service in Bowie
13.6%
15.4%
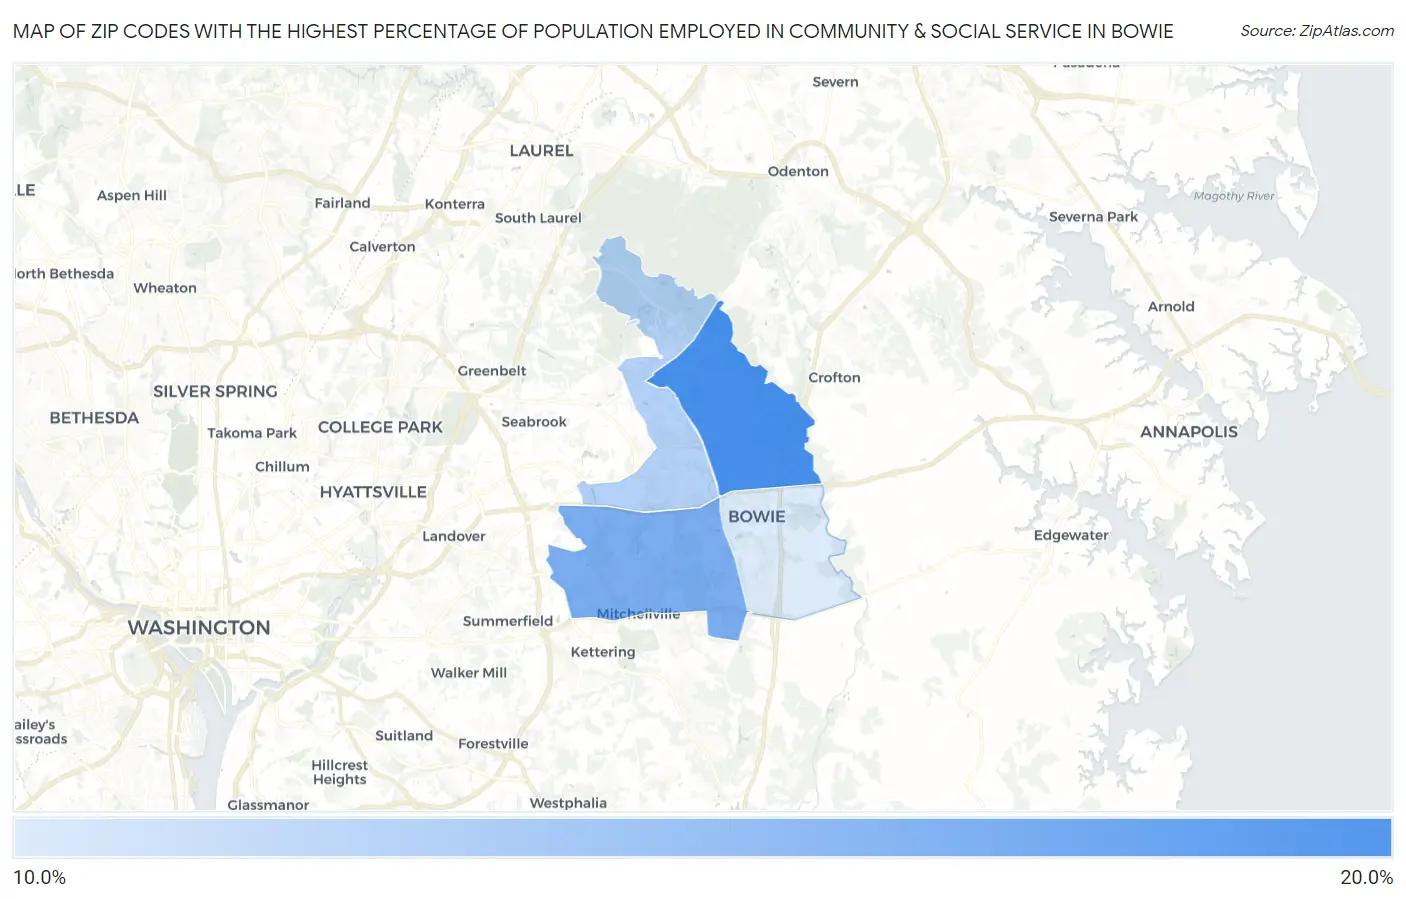
Zip Codes with the Highest Percentage of Population Employed in Community & Social Service in Bowie, MD
| Zip Code | % Employed | vs State | vs National | |
| 1. | 20715 | 15.4% | 12.6%(+2.76)#79 | 11.2%(+4.15)#4,641 |
| 2. | 20721 | 14.8% | 12.6%(+2.15)#91 | 11.2%(+3.54)#5,209 |
| 3. | 20720 | 14.1% | 12.6%(+1.45)#117 | 11.2%(+2.84)#6,023 |
| 4. | 20716 | 13.6% | 12.6%(+0.966)#132 | 11.2%(+2.36)#6,651 |
1
Common Questions
What are the Top 3 Zip Codes with the Highest Percentage of Population Employed in Community & Social Service in Bowie, MD?
Top 3 Zip Codes with the Highest Percentage of Population Employed in Community & Social Service in Bowie, MD are:
What zip code has the Highest Percentage of Population Employed in Community & Social Service in Bowie, MD?
20715 has the Highest Percentage of Population Employed in Community & Social Service in Bowie, MD with 15.4%.
What is the Percentage of Population Employed in Community & Social Service in Bowie, MD?
Percentage of Population Employed in Community & Social Service in Bowie is 14.6%.
What is the Percentage of Population Employed in Community & Social Service in Maryland?
Percentage of Population Employed in Community & Social Service in Maryland is 12.6%.
What is the Percentage of Population Employed in Community & Social Service in the United States?
Percentage of Population Employed in Community & Social Service in the United States is 11.2%.