Zip Codes with the Highest Percentage of Population Employed in Accommodation & Food Services in Baltimore, MD
RELATED REPORTS & OPTIONS
Accommodation & Food Services
Baltimore
Compare Zip Codes
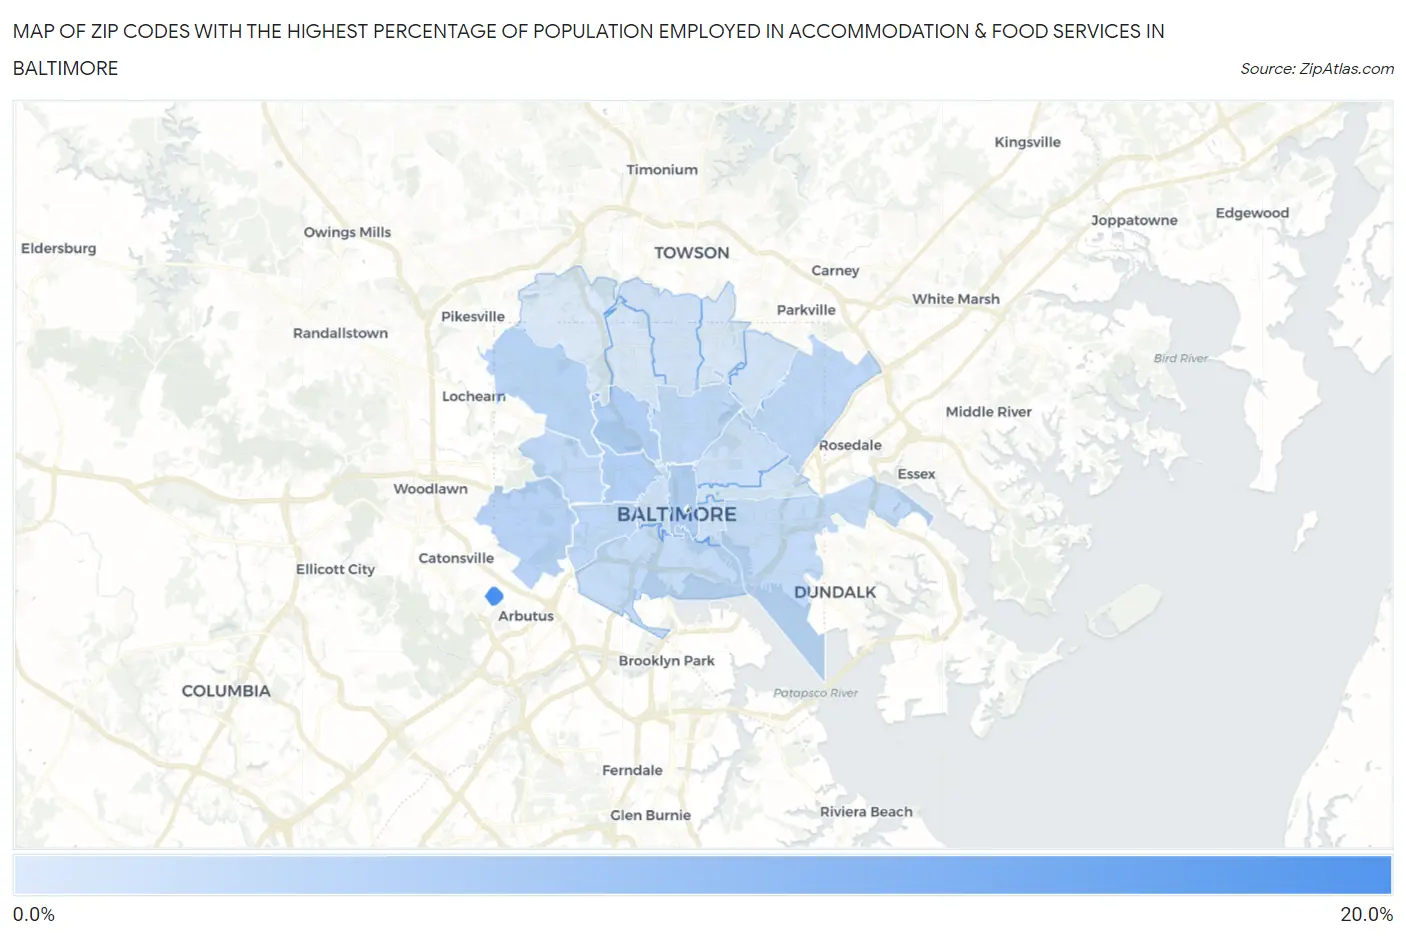
Map of Zip Codes with the Highest Percentage of Population Employed in Accommodation & Food Services in Baltimore
2.8%
17.8%
Zip Codes with the Highest Percentage of Population Employed in Accommodation & Food Services in Baltimore, MD
| Zip Code | % Employed | vs State | vs National | |
| 1. | 21250 | 17.8% | 5.8%(+12.0)#10 | 6.9%(+10.9)#1,123 |
| 2. | 21202 | 7.0% | 5.8%(+1.20)#107 | 6.9%(+0.166)#10,184 |
| 3. | 21211 | 6.8% | 5.8%(+0.991)#120 | 6.9%(-0.043)#10,757 |
| 4. | 21217 | 6.7% | 5.8%(+0.876)#125 | 6.9%(-0.158)#11,131 |
| 5. | 21229 | 6.3% | 5.8%(+0.444)#140 | 6.9%(-0.590)#12,510 |
| 6. | 21215 | 6.1% | 5.8%(+0.232)#154 | 6.9%(-0.802)#13,211 |
| 7. | 21218 | 5.6% | 5.8%(-0.258)#177 | 6.9%(-1.29)#14,741 |
| 8. | 21206 | 5.5% | 5.8%(-0.309)#179 | 6.9%(-1.34)#14,930 |
| 9. | 21223 | 5.5% | 5.8%(-0.311)#180 | 6.9%(-1.34)#14,936 |
| 10. | 21216 | 5.4% | 5.8%(-0.432)#190 | 6.9%(-1.47)#15,359 |
| 11. | 21224 | 5.3% | 5.8%(-0.568)#200 | 6.9%(-1.60)#15,853 |
| 12. | 21230 | 4.9% | 5.8%(-0.916)#222 | 6.9%(-1.95)#17,051 |
| 13. | 21201 | 4.3% | 5.8%(-1.56)#260 | 6.9%(-2.59)#19,223 |
| 14. | 21213 | 4.3% | 5.8%(-1.57)#261 | 6.9%(-2.60)#19,255 |
| 15. | 21251 | 4.2% | 5.8%(-1.68)#272 | 6.9%(-2.71)#19,615 |
| 16. | 21231 | 4.0% | 5.8%(-1.85)#283 | 6.9%(-2.89)#20,181 |
| 17. | 21212 | 4.0% | 5.8%(-1.88)#287 | 6.9%(-2.92)#20,271 |
| 18. | 21214 | 3.8% | 5.8%(-2.09)#303 | 6.9%(-3.13)#20,943 |
| 19. | 21205 | 3.6% | 5.8%(-2.21)#311 | 6.9%(-3.24)#21,320 |
| 20. | 21239 | 3.2% | 5.8%(-2.64)#333 | 6.9%(-3.67)#22,684 |
| 21. | 21210 | 3.2% | 5.8%(-2.64)#335 | 6.9%(-3.68)#22,697 |
| 22. | 21209 | 2.8% | 5.8%(-3.06)#353 | 6.9%(-4.09)#23,783 |
1
Common Questions
What are the Top 10 Zip Codes with the Highest Percentage of Population Employed in Accommodation & Food Services in Baltimore, MD?
Top 10 Zip Codes with the Highest Percentage of Population Employed in Accommodation & Food Services in Baltimore, MD are:
What zip code has the Highest Percentage of Population Employed in Accommodation & Food Services in Baltimore, MD?
21250 has the Highest Percentage of Population Employed in Accommodation & Food Services in Baltimore, MD with 17.8%.
What is the Percentage of Population Employed in Accommodation & Food Services in Baltimore, MD?
Percentage of Population Employed in Accommodation & Food Services in Baltimore is 5.5%.
What is the Percentage of Population Employed in Accommodation & Food Services in Maryland?
Percentage of Population Employed in Accommodation & Food Services in Maryland is 5.8%.
What is the Percentage of Population Employed in Accommodation & Food Services in the United States?
Percentage of Population Employed in Accommodation & Food Services in the United States is 6.9%.