Zip Codes with the Highest Percentage of Population Employed in Accommodation & Food Services in Silver Spring, MD
RELATED REPORTS & OPTIONS
Accommodation & Food Services
Silver Spring
Compare Zip Codes
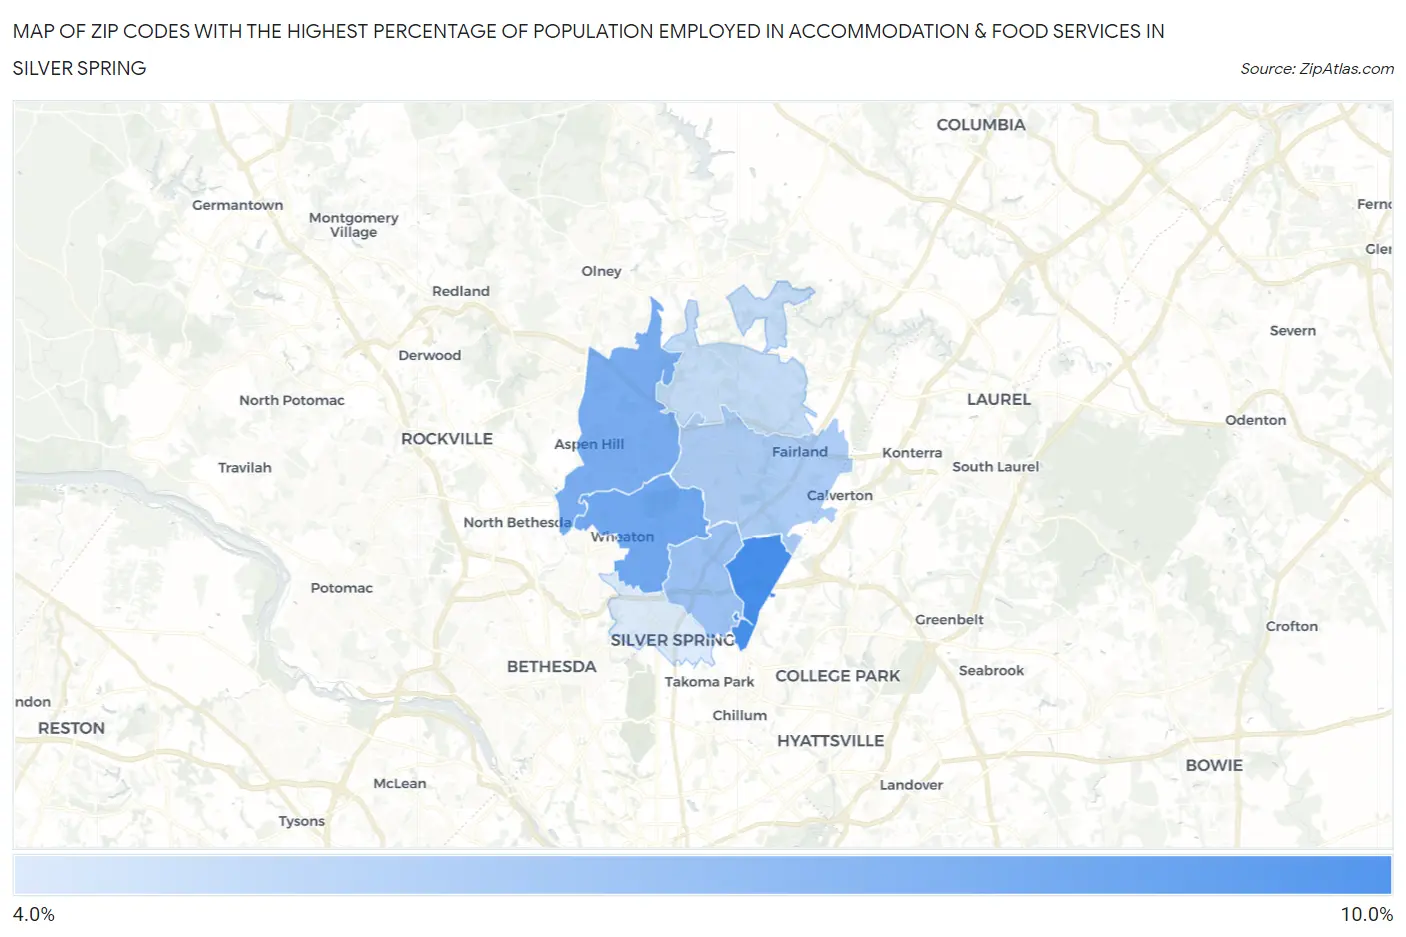
Map of Zip Codes with the Highest Percentage of Population Employed in Accommodation & Food Services in Silver Spring
4.2%
8.7%
Zip Codes with the Highest Percentage of Population Employed in Accommodation & Food Services in Silver Spring, MD
| Zip Code | % Employed | vs State | vs National | |
| 1. | 20903 | 8.7% | 5.8%(+2.88)#58 | 6.9%(+1.85)#6,429 |
| 2. | 20902 | 7.5% | 5.8%(+1.61)#86 | 6.9%(+0.578)#9,084 |
| 3. | 20906 | 7.1% | 5.8%(+1.29)#99 | 6.9%(+0.255)#9,965 |
| 4. | 20901 | 6.2% | 5.8%(+0.334)#149 | 6.9%(-0.701)#12,865 |
| 5. | 20904 | 5.7% | 5.8%(-0.195)#172 | 6.9%(-1.23)#14,540 |
| 6. | 20905 | 4.8% | 5.8%(-1.01)#225 | 6.9%(-2.04)#17,344 |
| 7. | 20910 | 4.2% | 5.8%(-1.67)#270 | 6.9%(-2.70)#19,576 |
1
Common Questions
What are the Top 5 Zip Codes with the Highest Percentage of Population Employed in Accommodation & Food Services in Silver Spring, MD?
Top 5 Zip Codes with the Highest Percentage of Population Employed in Accommodation & Food Services in Silver Spring, MD are:
What zip code has the Highest Percentage of Population Employed in Accommodation & Food Services in Silver Spring, MD?
20903 has the Highest Percentage of Population Employed in Accommodation & Food Services in Silver Spring, MD with 8.7%.
What is the Percentage of Population Employed in Accommodation & Food Services in Silver Spring, MD?
Percentage of Population Employed in Accommodation & Food Services in Silver Spring is 5.5%.
What is the Percentage of Population Employed in Accommodation & Food Services in Maryland?
Percentage of Population Employed in Accommodation & Food Services in Maryland is 5.8%.
What is the Percentage of Population Employed in Accommodation & Food Services in the United States?
Percentage of Population Employed in Accommodation & Food Services in the United States is 6.9%.