Zip Codes with the Highest Percentage of Population Employed in Accommodation & Food Services in Bethesda, MD
RELATED REPORTS & OPTIONS
Accommodation & Food Services
Bethesda
Compare Zip Codes
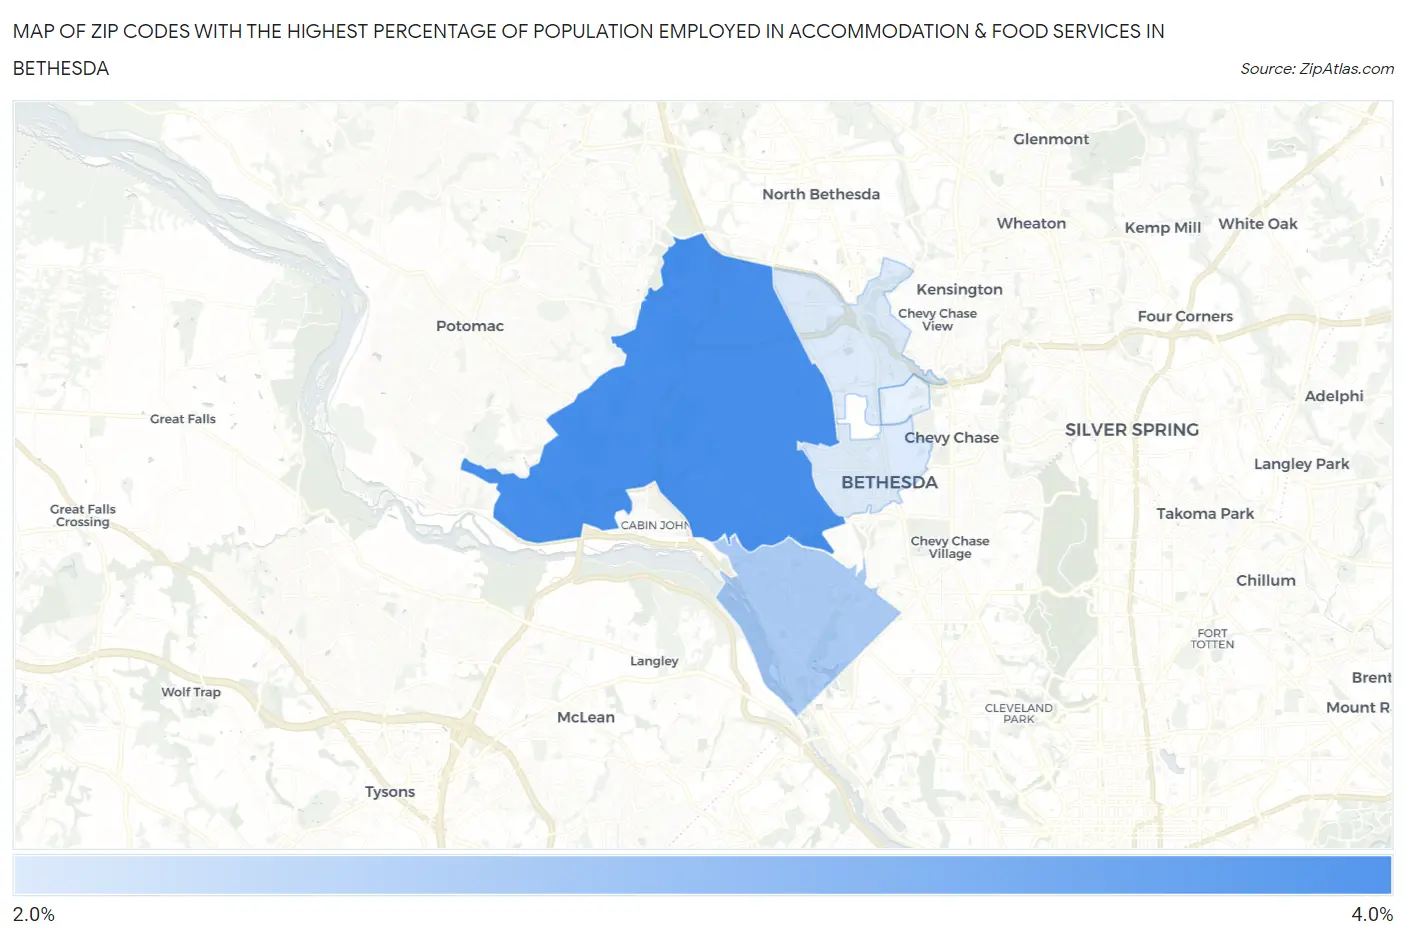
Map of Zip Codes with the Highest Percentage of Population Employed in Accommodation & Food Services in Bethesda
2.3%
4.0%
Zip Codes with the Highest Percentage of Population Employed in Accommodation & Food Services in Bethesda, MD
| Zip Code | % Employed | vs State | vs National | |
| 1. | 20817 | 4.0% | 5.8%(-1.86)#285 | 6.9%(-2.90)#20,207 |
| 2. | 20816 | 2.9% | 5.8%(-2.95)#350 | 6.9%(-3.99)#23,516 |
| 3. | 20814 | 2.3% | 5.8%(-3.51)#362 | 6.9%(-4.54)#24,855 |
1
Common Questions
What are the Top 3 Zip Codes with the Highest Percentage of Population Employed in Accommodation & Food Services in Bethesda, MD?
Top 3 Zip Codes with the Highest Percentage of Population Employed in Accommodation & Food Services in Bethesda, MD are:
What zip code has the Highest Percentage of Population Employed in Accommodation & Food Services in Bethesda, MD?
20817 has the Highest Percentage of Population Employed in Accommodation & Food Services in Bethesda, MD with 4.0%.
What is the Percentage of Population Employed in Accommodation & Food Services in Bethesda, MD?
Percentage of Population Employed in Accommodation & Food Services in Bethesda is 3.1%.
What is the Percentage of Population Employed in Accommodation & Food Services in Maryland?
Percentage of Population Employed in Accommodation & Food Services in Maryland is 5.8%.
What is the Percentage of Population Employed in Accommodation & Food Services in the United States?
Percentage of Population Employed in Accommodation & Food Services in the United States is 6.9%.