Cities with the Highest Percentage of Russian Population in Indiana
RELATED REPORTS & OPTIONS
Russian
Indiana
Compare Cities
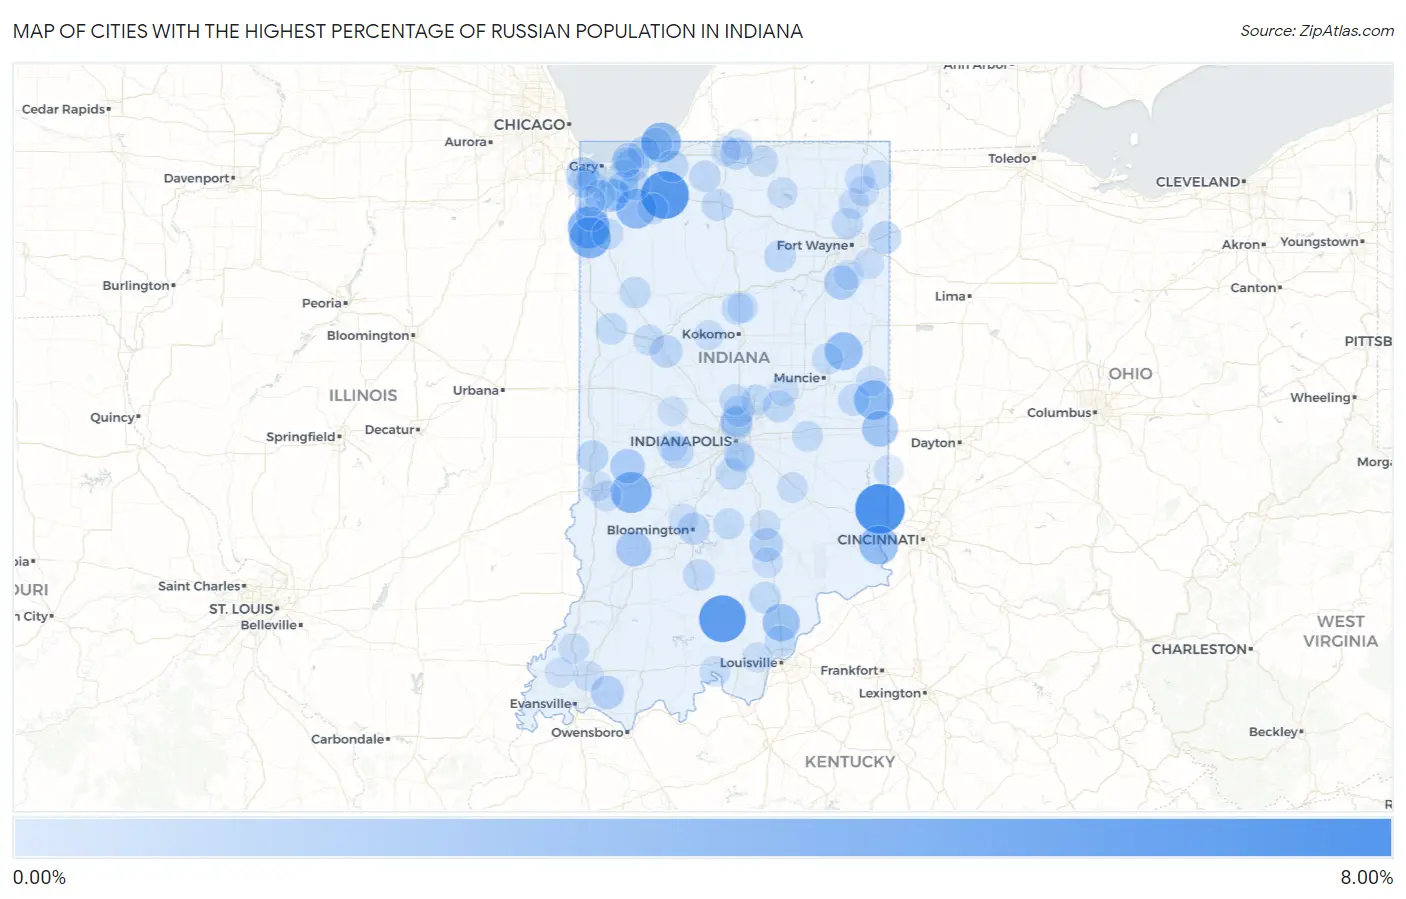
Map of Cities with the Highest Percentage of Russian Population in Indiana
0.00%
8.00%
Cities with the Highest Percentage of Russian Population in Indiana
| City | Russian | vs State | vs National | |
| 1. | New Trenton | 6.98% | 0.28%(+6.70)#1 | 0.72%(+6.26)#345 |
| 2. | Hanna | 6.36% | 0.28%(+6.08)#2 | 0.72%(+5.63)#405 |
| 3. | Livonia | 6.02% | 0.28%(+5.75)#3 | 0.72%(+5.30)#442 |
| 4. | Duneland Beach | 5.59% | 0.28%(+5.31)#4 | 0.72%(+4.87)#496 |
| 5. | Schneider | 4.28% | 0.28%(+4.00)#5 | 0.72%(+3.56)#759 |
| 6. | Lake Village | 4.15% | 0.28%(+3.87)#6 | 0.72%(+3.42)#799 |
| 7. | Center Point | 3.98% | 0.28%(+3.70)#7 | 0.72%(+3.26)#864 |
| 8. | Chain-O-Lakes | 3.93% | 0.28%(+3.65)#8 | 0.72%(+3.21)#878 |
| 9. | Michiana Shores | 3.57% | 0.28%(+3.29)#9 | 0.72%(+2.85)#1,024 |
| 10. | Kouts | 3.56% | 0.28%(+3.28)#10 | 0.72%(+2.84)#1,030 |
| 11. | Lyford | 3.47% | 0.28%(+3.19)#11 | 0.72%(+2.75)#1,076 |
| 12. | Lynn | 3.39% | 0.28%(+3.12)#12 | 0.72%(+2.67)#1,116 |
| 13. | Aurora | 3.30% | 0.28%(+3.02)#13 | 0.72%(+2.58)#1,155 |
| 14. | Dunkirk | 2.90% | 0.28%(+2.62)#14 | 0.72%(+2.18)#1,369 |
| 15. | Henryville | 2.72% | 0.28%(+2.44)#15 | 0.72%(+2.00)#1,484 |
| 16. | Spring Grove | 2.34% | 0.28%(+2.06)#16 | 0.72%(+1.62)#1,811 |
| 17. | Switz City | 2.11% | 0.28%(+1.83)#17 | 0.72%(+1.39)#2,072 |
| 18. | Carbon | 1.83% | 0.28%(+1.55)#18 | 0.72%(+1.11)#2,479 |
| 19. | Uniondale | 1.79% | 0.28%(+1.52)#19 | 0.72%(+1.07)#2,533 |
| 20. | Winfield | 1.77% | 0.28%(+1.50)#20 | 0.72%(+1.05)#2,563 |
| 21. | Chesterton | 1.54% | 0.28%(+1.27)#21 | 0.72%(+0.822)#2,994 |
| 22. | Jonesville | 1.53% | 0.28%(+1.25)#22 | 0.72%(+0.810)#3,018 |
| 23. | Boonville | 1.45% | 0.28%(+1.18)#23 | 0.72%(+0.733)#3,213 |
| 24. | Snow Lake | 1.38% | 0.28%(+1.10)#24 | 0.72%(+0.658)#3,408 |
| 25. | Munster | 1.37% | 0.28%(+1.09)#25 | 0.72%(+0.648)#3,433 |
| 26. | Meridian Hills | 1.32% | 0.28%(+1.04)#26 | 0.72%(+0.597)#3,560 |
| 27. | Woodburn | 1.22% | 0.28%(+0.944)#27 | 0.72%(+0.500)#3,852 |
| 28. | Dayton | 1.18% | 0.28%(+0.905)#28 | 0.72%(+0.462)#3,979 |
| 29. | Bloomington | 1.06% | 0.28%(+0.787)#29 | 0.72%(+0.343)#4,356 |
| 30. | Mishawaka | 1.05% | 0.28%(+0.775)#30 | 0.72%(+0.332)#4,397 |
| 31. | Beverly Shores | 1.04% | 0.28%(+0.760)#31 | 0.72%(+0.317)#4,451 |
| 32. | Dune Acres | 1.02% | 0.28%(+0.746)#32 | 0.72%(+0.303)#4,501 |
| 33. | Clinton | 1.02% | 0.28%(+0.739)#33 | 0.72%(+0.295)#4,531 |
| 34. | Long Beach | 1.01% | 0.28%(+0.736)#34 | 0.72%(+0.292)#4,539 |
| 35. | La Porte | 1.01% | 0.28%(+0.731)#35 | 0.72%(+0.287)#4,568 |
| 36. | Pendleton | 0.99% | 0.28%(+0.715)#36 | 0.72%(+0.271)#4,641 |
| 37. | Coatesville | 0.99% | 0.28%(+0.714)#37 | 0.72%(+0.271)#4,642 |
| 38. | Lowell | 0.98% | 0.28%(+0.701)#38 | 0.72%(+0.258)#4,691 |
| 39. | North Manchester | 0.96% | 0.28%(+0.679)#39 | 0.72%(+0.236)#4,772 |
| 40. | Plymouth | 0.95% | 0.28%(+0.677)#40 | 0.72%(+0.234)#4,787 |
| 41. | Bedford | 0.93% | 0.28%(+0.657)#41 | 0.72%(+0.214)#4,879 |
| 42. | North Liberty | 0.93% | 0.28%(+0.649)#42 | 0.72%(+0.206)#4,912 |
| 43. | Little York | 0.90% | 0.28%(+0.627)#43 | 0.72%(+0.184)#5,010 |
| 44. | Griffith | 0.90% | 0.28%(+0.625)#44 | 0.72%(+0.181)#5,026 |
| 45. | Oxford | 0.90% | 0.28%(+0.619)#45 | 0.72%(+0.176)#5,047 |
| 46. | Modoc | 0.90% | 0.28%(+0.619)#46 | 0.72%(+0.176)#5,049 |
| 47. | Williams Creek | 0.89% | 0.28%(+0.611)#47 | 0.72%(+0.168)#5,091 |
| 48. | Grissom Afb | 0.88% | 0.28%(+0.600)#48 | 0.72%(+0.157)#5,148 |
| 49. | Bargersville | 0.86% | 0.28%(+0.584)#49 | 0.72%(+0.140)#5,227 |
| 50. | Schererville | 0.83% | 0.28%(+0.554)#50 | 0.72%(+0.111)#5,365 |
| 51. | Wolcott | 0.83% | 0.28%(+0.552)#51 | 0.72%(+0.108)#5,379 |
| 52. | Huntertown | 0.83% | 0.28%(+0.547)#52 | 0.72%(+0.104)#5,399 |
| 53. | Shorewood Forest | 0.81% | 0.28%(+0.531)#53 | 0.72%(+0.088)#5,492 |
| 54. | Roselawn | 0.80% | 0.28%(+0.520)#54 | 0.72%(+0.077)#5,553 |
| 55. | Lakes Of The Four Seasons | 0.79% | 0.28%(+0.513)#55 | 0.72%(+0.070)#5,601 |
| 56. | Dunlap | 0.78% | 0.28%(+0.502)#56 | 0.72%(+0.058)#5,662 |
| 57. | South Haven | 0.77% | 0.28%(+0.496)#57 | 0.72%(+0.053)#5,696 |
| 58. | Carmel | 0.77% | 0.28%(+0.494)#58 | 0.72%(+0.051)#5,705 |
| 59. | Eaton | 0.77% | 0.28%(+0.493)#59 | 0.72%(+0.049)#5,712 |
| 60. | Westfield | 0.74% | 0.28%(+0.464)#60 | 0.72%(+0.021)#5,872 |
| 61. | Sellersburg | 0.73% | 0.28%(+0.456)#61 | 0.72%(+0.013)#5,917 |
| 62. | Nashville | 0.72% | 0.28%(+0.442)#62 | 0.72%(-0.001)#5,996 |
| 63. | La Crosse | 0.70% | 0.28%(+0.426)#63 | 0.72%(-0.017)#6,084 |
| 64. | Valparaiso | 0.70% | 0.28%(+0.422)#64 | 0.72%(-0.021)#6,111 |
| 65. | Noblesville | 0.70% | 0.28%(+0.418)#65 | 0.72%(-0.026)#6,145 |
| 66. | Knightstown | 0.69% | 0.28%(+0.412)#66 | 0.72%(-0.031)#6,180 |
| 67. | Homecroft | 0.68% | 0.28%(+0.401)#67 | 0.72%(-0.043)#6,245 |
| 68. | West Lafayette | 0.68% | 0.28%(+0.400)#68 | 0.72%(-0.043)#6,249 |
| 69. | Heritage Lake | 0.61% | 0.28%(+0.336)#69 | 0.72%(-0.107)#6,632 |
| 70. | Crown Point | 0.61% | 0.28%(+0.336)#70 | 0.72%(-0.108)#6,633 |
| 71. | Waldron | 0.61% | 0.28%(+0.333)#71 | 0.72%(-0.111)#6,652 |
| 72. | Leavenworth | 0.61% | 0.28%(+0.332)#72 | 0.72%(-0.111)#6,659 |
| 73. | Garrett | 0.61% | 0.28%(+0.328)#73 | 0.72%(-0.115)#6,682 |
| 74. | Princeton | 0.60% | 0.28%(+0.322)#74 | 0.72%(-0.122)#6,725 |
| 75. | Bunker Hill | 0.59% | 0.28%(+0.312)#75 | 0.72%(-0.131)#6,795 |
| 76. | Riley | 0.59% | 0.28%(+0.309)#76 | 0.72%(-0.134)#6,814 |
| 77. | Syracuse | 0.58% | 0.28%(+0.306)#77 | 0.72%(-0.137)#6,837 |
| 78. | Elberfeld | 0.58% | 0.28%(+0.298)#78 | 0.72%(-0.145)#6,908 |
| 79. | Hoagland | 0.57% | 0.28%(+0.292)#79 | 0.72%(-0.152)#6,948 |
| 80. | Waterloo | 0.56% | 0.28%(+0.284)#80 | 0.72%(-0.159)#7,005 |
| 81. | Winchester | 0.56% | 0.28%(+0.281)#81 | 0.72%(-0.162)#7,024 |
| 82. | Cedar Lake | 0.56% | 0.28%(+0.278)#82 | 0.72%(-0.165)#7,052 |
| 83. | Burns Harbor | 0.54% | 0.28%(+0.262)#83 | 0.72%(-0.181)#7,169 |
| 84. | Ashley | 0.53% | 0.28%(+0.251)#84 | 0.72%(-0.192)#7,257 |
| 85. | Granger | 0.51% | 0.28%(+0.229)#85 | 0.72%(-0.215)#7,421 |
| 86. | Seymour | 0.49% | 0.28%(+0.214)#86 | 0.72%(-0.230)#7,528 |
| 87. | Burlington | 0.47% | 0.28%(+0.196)#87 | 0.72%(-0.247)#7,670 |
| 88. | Dyer | 0.47% | 0.28%(+0.192)#88 | 0.72%(-0.252)#7,699 |
| 89. | Notre Dame | 0.46% | 0.28%(+0.185)#89 | 0.72%(-0.258)#7,747 |
| 90. | Edgewood | 0.46% | 0.28%(+0.179)#90 | 0.72%(-0.264)#7,798 |
| 91. | Georgetown | 0.45% | 0.28%(+0.176)#91 | 0.72%(-0.268)#7,828 |
| 92. | Ossian | 0.45% | 0.28%(+0.172)#92 | 0.72%(-0.272)#7,849 |
| 93. | Terre Haute | 0.44% | 0.28%(+0.166)#93 | 0.72%(-0.277)#7,899 |
| 94. | Ellettsville | 0.44% | 0.28%(+0.158)#94 | 0.72%(-0.285)#7,977 |
| 95. | Southport | 0.43% | 0.28%(+0.153)#95 | 0.72%(-0.290)#8,021 |
| 96. | Cynthiana | 0.43% | 0.28%(+0.150)#96 | 0.72%(-0.294)#8,046 |
| 97. | New Ross | 0.42% | 0.28%(+0.147)#97 | 0.72%(-0.296)#8,066 |
| 98. | Columbus | 0.42% | 0.28%(+0.145)#98 | 0.72%(-0.299)#8,079 |
| 99. | West College Corner | 0.42% | 0.28%(+0.140)#99 | 0.72%(-0.304)#8,114 |
| 100. | Hamilton | 0.41% | 0.28%(+0.136)#100 | 0.72%(-0.308)#8,139 |
Common Questions
What are the Top 10 Cities with the Highest Percentage of Russian Population in Indiana?
Top 10 Cities with the Highest Percentage of Russian Population in Indiana are:
#1
6.98%
#2
6.36%
#3
6.02%
#4
4.28%
#5
4.15%
#6
3.98%
#7
3.57%
#8
3.56%
#9
3.39%
#10
3.30%
What city has the Highest Percentage of Russian Population in Indiana?
New Trenton has the Highest Percentage of Russian Population in Indiana with 6.98%.
What is the Percentage of Russian Population in the State of Indiana?
Percentage of Russian Population in Indiana is 0.28%.
What is the Percentage of Russian Population in the United States?
Percentage of Russian Population in the United States is 0.72%.