East Chicago, IN Map & Demographics
East Chicago Map
East Chicago Overview
$22,539
PER CAPITA INCOME
$44,928
AVG FAMILY INCOME
$39,434
AVG HOUSEHOLD INCOME
16.8%
WAGE / INCOME GAP [ % ]
83.2¢/ $1
WAGE / INCOME GAP [ $ ]
$10,736
FAMILY INCOME DEFICIT
0.49
INEQUALITY / GINI INDEX
26,363
TOTAL POPULATION
12,994
MALE POPULATION
13,369
FEMALE POPULATION
97.20
MALES / 100 FEMALES
102.89
FEMALES / 100 MALES
36.0
MEDIAN AGE
3.5
AVG FAMILY SIZE
2.6
AVG HOUSEHOLD SIZE
11,525
LABOR FORCE [ PEOPLE ]
56.0%
PERCENT IN LABOR FORCE
6.5%
UNEMPLOYMENT RATE
East Chicago Zip Codes
East Chicago Area Codes
Income in East Chicago
Income Overview in East Chicago
Per Capita Income in East Chicago is $22,539, while median incomes of families and households are $44,928 and $39,434 respectively.
| Characteristic | Number | Measure |
| Per Capita Income | 26,363 | $22,539 |
| Median Family Income | 5,851 | $44,928 |
| Mean Family Income | 5,851 | $65,399 |
| Median Household Income | 10,147 | $39,434 |
| Mean Household Income | 10,147 | $55,347 |
| Income Deficit | 5,851 | $10,736 |
| Wage / Income Gap (%) | 26,363 | 16.76% |
| Wage / Income Gap ($) | 26,363 | 83.24¢ per $1 |
| Gini / Inequality Index | 26,363 | 0.49 |
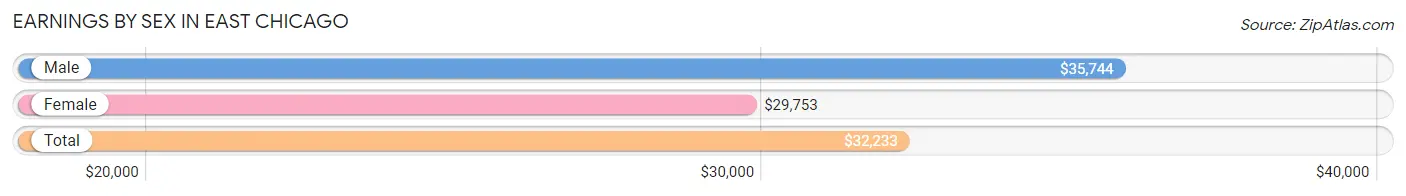
Earnings by Sex in East Chicago
Average Earnings in East Chicago are $32,233, $35,744 for men and $29,753 for women, a difference of 16.8%.
| Sex | Number | Average Earnings |
| Male | 6,418 (54.6%) | $35,744 |
| Female | 5,343 (45.4%) | $29,753 |
| Total | 11,761 (100.0%) | $32,233 |
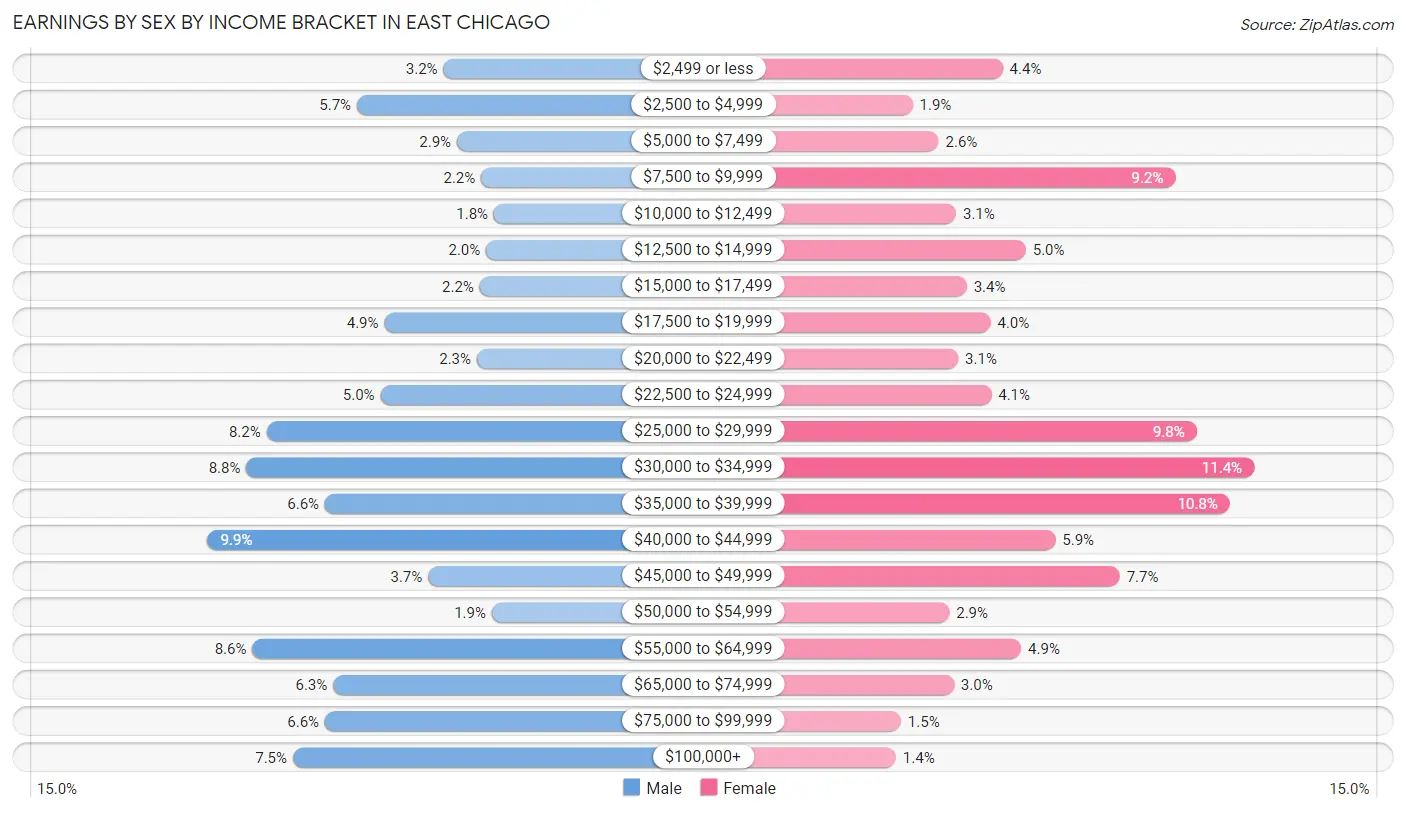
Earnings by Sex by Income Bracket in East Chicago
The most common earnings brackets in East Chicago are $40,000 to $44,999 for men (633 | 9.9%) and $30,000 to $34,999 for women (611 | 11.4%).
| Income | Male | Female |
| $2,499 or less | 207 (3.2%) | 234 (4.4%) |
| $2,500 to $4,999 | 363 (5.7%) | 99 (1.8%) |
| $5,000 to $7,499 | 183 (2.9%) | 138 (2.6%) |
| $7,500 to $9,999 | 139 (2.2%) | 493 (9.2%) |
| $10,000 to $12,499 | 116 (1.8%) | 164 (3.1%) |
| $12,500 to $14,999 | 130 (2.0%) | 269 (5.0%) |
| $15,000 to $17,499 | 142 (2.2%) | 180 (3.4%) |
| $17,500 to $19,999 | 314 (4.9%) | 216 (4.0%) |
| $20,000 to $22,499 | 147 (2.3%) | 167 (3.1%) |
| $22,500 to $24,999 | 321 (5.0%) | 217 (4.1%) |
| $25,000 to $29,999 | 526 (8.2%) | 525 (9.8%) |
| $30,000 to $34,999 | 563 (8.8%) | 611 (11.4%) |
| $35,000 to $39,999 | 421 (6.6%) | 575 (10.8%) |
| $40,000 to $44,999 | 633 (9.9%) | 313 (5.9%) |
| $45,000 to $49,999 | 235 (3.7%) | 410 (7.7%) |
| $50,000 to $54,999 | 120 (1.9%) | 154 (2.9%) |
| $55,000 to $64,999 | 552 (8.6%) | 262 (4.9%) |
| $65,000 to $74,999 | 406 (6.3%) | 161 (3.0%) |
| $75,000 to $99,999 | 421 (6.6%) | 81 (1.5%) |
| $100,000+ | 479 (7.5%) | 74 (1.4%) |
| Total | 6,418 (100.0%) | 5,343 (100.0%) |
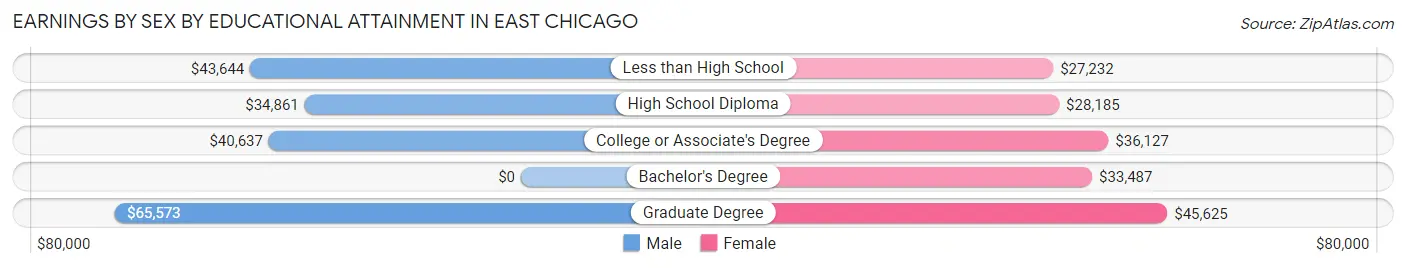
Earnings by Sex by Educational Attainment in East Chicago
Average earnings in East Chicago are $40,438 for men and $31,014 for women, a difference of 23.3%. Men with an educational attainment of graduate degree enjoy the highest average annual earnings of $65,573, while those with high school diploma education earn the least with $34,861. Women with an educational attainment of graduate degree earn the most with the average annual earnings of $45,625, while those with less than high school education have the smallest earnings of $27,232.
| Educational Attainment | Male Income | Female Income |
| Less than High School | $43,644 | $27,232 |
| High School Diploma | $34,861 | $28,185 |
| College or Associate's Degree | $40,637 | $36,127 |
| Bachelor's Degree | - | - |
| Graduate Degree | $65,573 | $45,625 |
| Total | $40,438 | $31,014 |
Family Income in East Chicago
Family Income Brackets in East Chicago
According to the East Chicago family income data, there are 965 families falling into the $35,000 to $49,999 income range, which is the most common income bracket and makes up 16.5% of all families. Conversely, the $10,000 to $14,999 income bracket is the least frequent group with only 170 families (2.9%) belonging to this category.
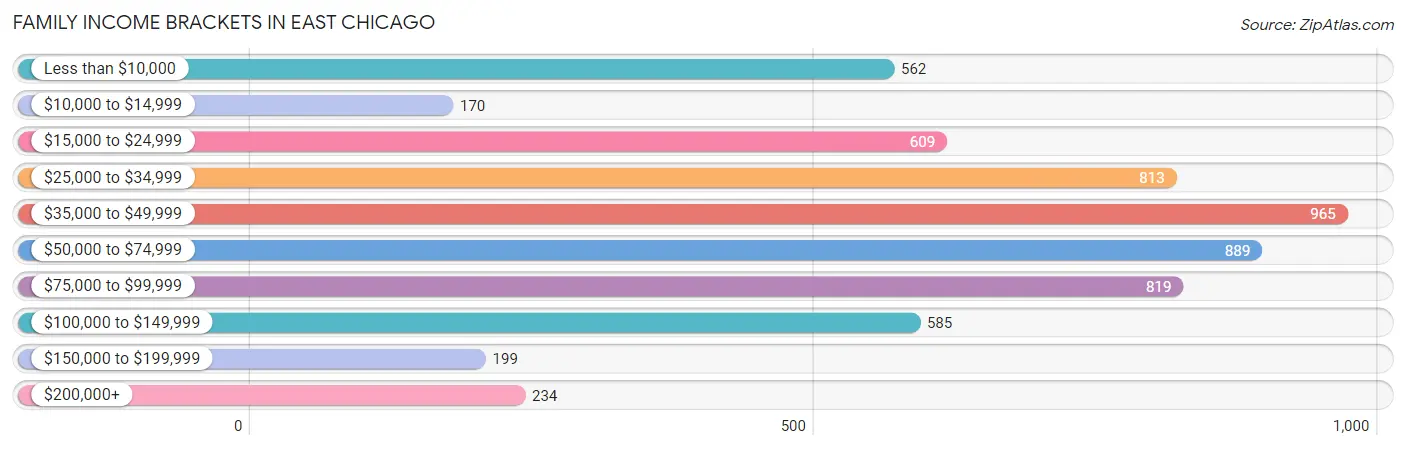
| Income Bracket | # Families | % Families |
| Less than $10,000 | 562 | 9.6% |
| $10,000 to $14,999 | 170 | 2.9% |
| $15,000 to $24,999 | 609 | 10.4% |
| $25,000 to $34,999 | 813 | 13.9% |
| $35,000 to $49,999 | 965 | 16.5% |
| $50,000 to $74,999 | 889 | 15.2% |
| $75,000 to $99,999 | 819 | 14.0% |
| $100,000 to $149,999 | 585 | 10.0% |
| $150,000 to $199,999 | 199 | 3.4% |
| $200,000+ | 234 | 4.0% |
Family Income by Famaliy Size in East Chicago
6-person families (297 | 5.1%) account for the highest median family income in East Chicago with $108,625 per family, while 2-person families (2,290 | 39.1%) have the highest median income of $18,216 per family member.
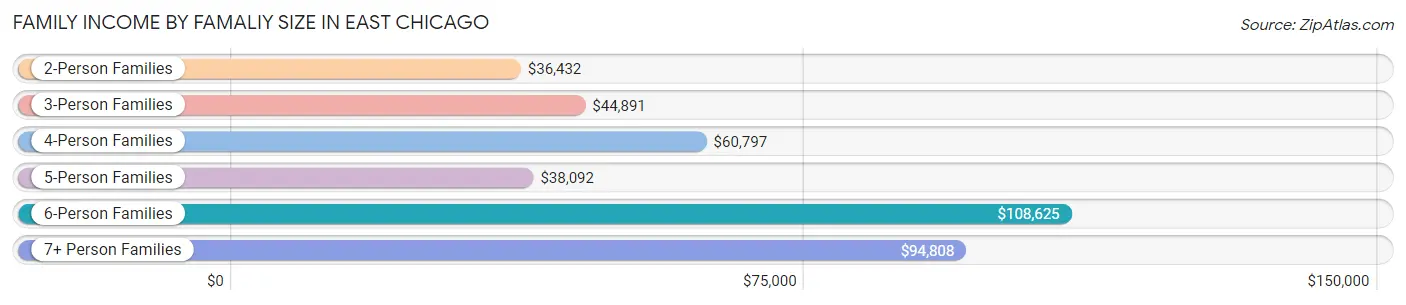
| Income Bracket | # Families | Median Income |
| 2-Person Families | 2,290 (39.1%) | $36,432 |
| 3-Person Families | 1,410 (24.1%) | $44,891 |
| 4-Person Families | 1,165 (19.9%) | $60,797 |
| 5-Person Families | 481 (8.2%) | $38,092 |
| 6-Person Families | 297 (5.1%) | $108,625 |
| 7+ Person Families | 208 (3.5%) | $94,808 |
| Total | 5,851 (100.0%) | $44,928 |
Family Income by Number of Earners in East Chicago
The median family income in East Chicago is $44,928, with families comprising 3+ earners (756) having the highest median family income of $128,333, while families with no earners (1,253) have the lowest median family income of $21,740, accounting for 12.9% and 21.4% of families, respectively.
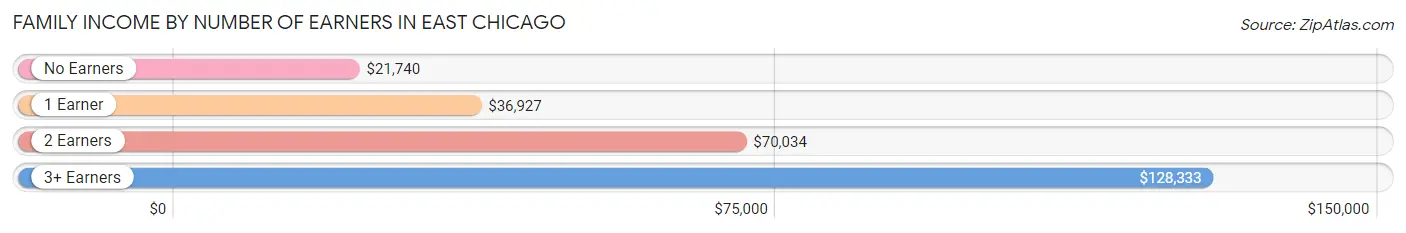
| Number of Earners | # Families | Median Income |
| No Earners | 1,253 (21.4%) | $21,740 |
| 1 Earner | 2,437 (41.6%) | $36,927 |
| 2 Earners | 1,405 (24.0%) | $70,034 |
| 3+ Earners | 756 (12.9%) | $128,333 |
| Total | 5,851 (100.0%) | $44,928 |
Household Income in East Chicago
Household Income Brackets in East Chicago
With 1,563 households falling in the category, the $50,000 to $74,999 income range is the most frequent in East Chicago, accounting for 15.4% of all households. In contrast, only 233 households (2.3%) fall into the $150,000 to $199,999 income bracket, making it the least populous group.
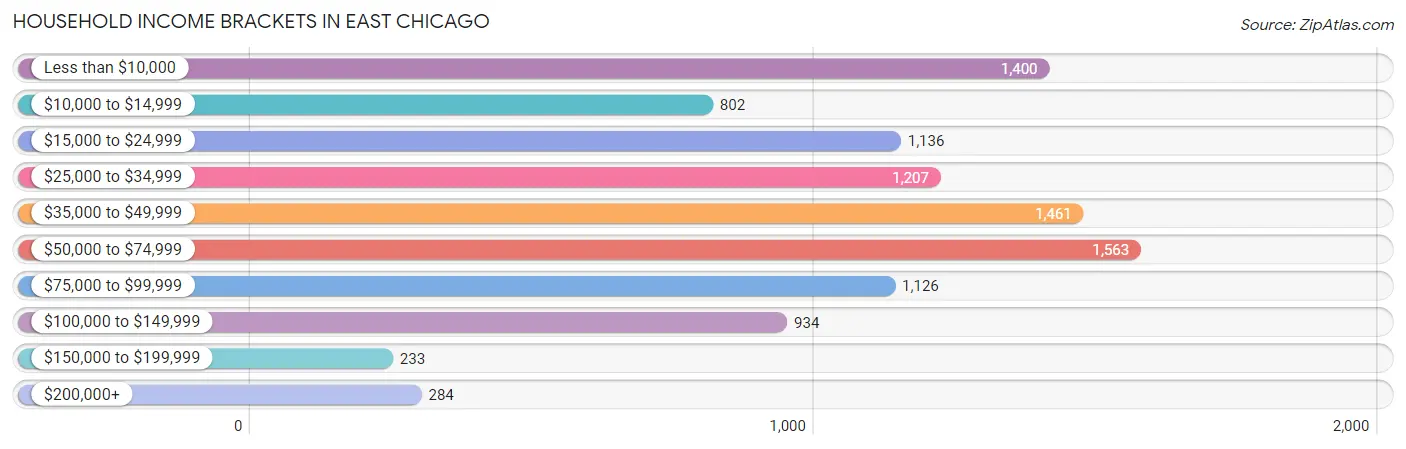
| Income Bracket | # Households | % Households |
| Less than $10,000 | 1,400 | 13.8% |
| $10,000 to $14,999 | 802 | 7.9% |
| $15,000 to $24,999 | 1,136 | 11.2% |
| $25,000 to $34,999 | 1,207 | 11.9% |
| $35,000 to $49,999 | 1,461 | 14.4% |
| $50,000 to $74,999 | 1,563 | 15.4% |
| $75,000 to $99,999 | 1,126 | 11.1% |
| $100,000 to $149,999 | 934 | 9.2% |
| $150,000 to $199,999 | 233 | 2.3% |
| $200,000+ | 284 | 2.8% |
Household Income by Householder Age in East Chicago
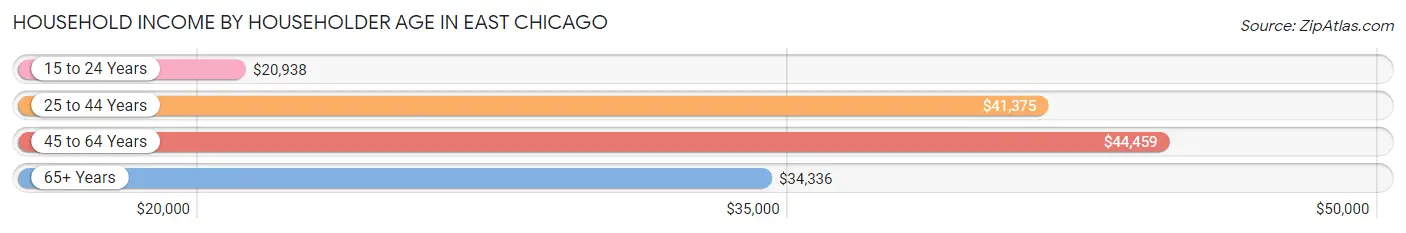
The median household income in East Chicago is $39,434, with the highest median household income of $44,459 found in the 45 to 64 years age bracket for the primary householder. A total of 3,650 households (36.0%) fall into this category. Meanwhile, the 15 to 24 years age bracket for the primary householder has the lowest median household income of $20,938, with 403 households (4.0%) in this group.
| Income Bracket | # Households | Median Income |
| 15 to 24 Years | 403 (4.0%) | $20,938 |
| 25 to 44 Years | 3,500 (34.5%) | $41,375 |
| 45 to 64 Years | 3,650 (36.0%) | $44,459 |
| 65+ Years | 2,594 (25.6%) | $34,336 |
| Total | 10,147 (100.0%) | $39,434 |
Poverty in East Chicago
Income Below Poverty by Sex and Age in East Chicago
With 22.8% poverty level for males and 31.1% for females among the residents of East Chicago, under 5 year old males and 5 year old females are the most vulnerable to poverty, with 426 males (52.7%) and 109 females (62.6%) in their respective age groups living below the poverty level.
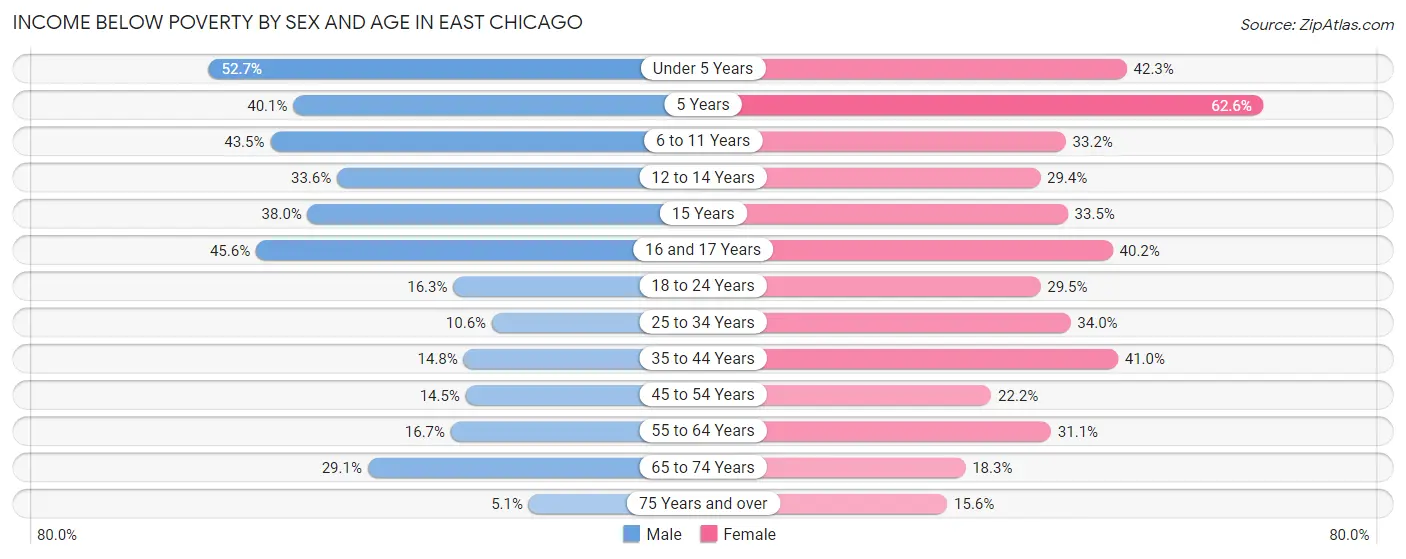
| Age Bracket | Male | Female |
| Under 5 Years | 426 (52.7%) | 370 (42.3%) |
| 5 Years | 81 (40.1%) | 109 (62.6%) |
| 6 to 11 Years | 469 (43.5%) | 359 (33.2%) |
| 12 to 14 Years | 200 (33.6%) | 164 (29.4%) |
| 15 Years | 60 (38.0%) | 53 (33.5%) |
| 16 and 17 Years | 225 (45.6%) | 156 (40.2%) |
| 18 to 24 Years | 241 (16.3%) | 298 (29.5%) |
| 25 to 34 Years | 173 (10.6%) | 647 (34.0%) |
| 35 to 44 Years | 267 (14.8%) | 768 (41.0%) |
| 45 to 54 Years | 212 (14.5%) | 365 (22.2%) |
| 55 to 64 Years | 230 (16.7%) | 472 (31.0%) |
| 65 to 74 Years | 332 (29.0%) | 220 (18.3%) |
| 75 Years and over | 36 (5.1%) | 134 (15.6%) |
| Total | 2,952 (22.8%) | 4,115 (31.1%) |
Income Above Poverty by Sex and Age in East Chicago
According to the poverty statistics in East Chicago, males aged 75 years and over and females aged 75 years and over are the age groups that are most secure financially, with 94.9% of males and 84.4% of females in these age groups living above the poverty line.
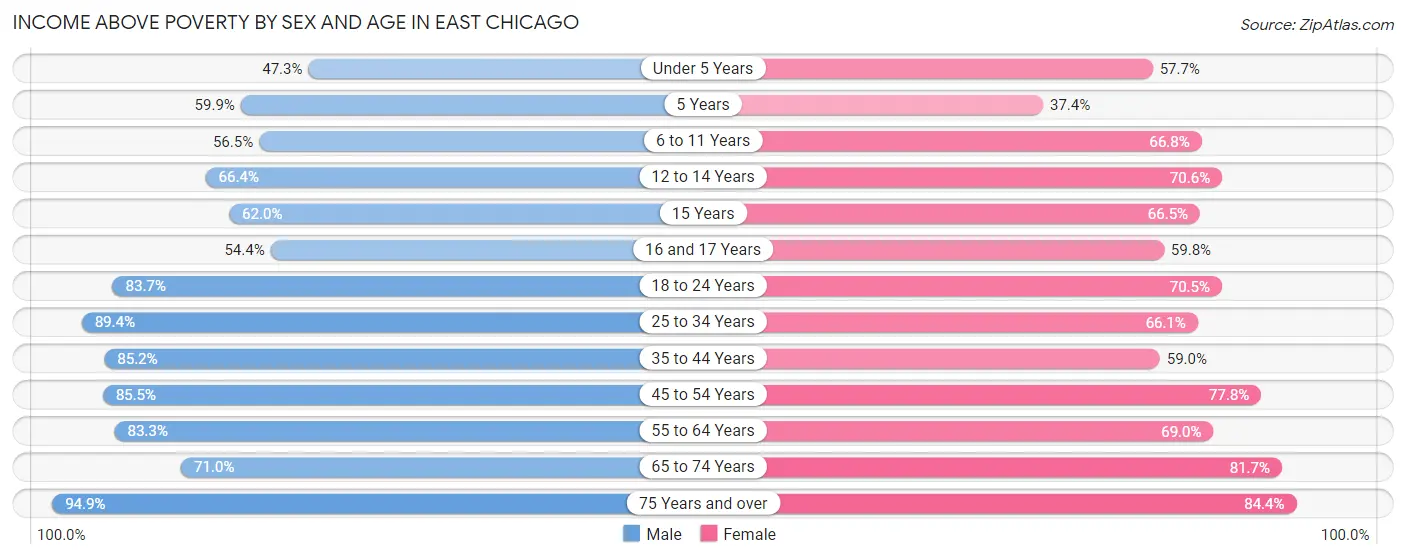
| Age Bracket | Male | Female |
| Under 5 Years | 383 (47.3%) | 505 (57.7%) |
| 5 Years | 121 (59.9%) | 65 (37.4%) |
| 6 to 11 Years | 609 (56.5%) | 721 (66.8%) |
| 12 to 14 Years | 395 (66.4%) | 393 (70.6%) |
| 15 Years | 98 (62.0%) | 105 (66.5%) |
| 16 and 17 Years | 268 (54.4%) | 232 (59.8%) |
| 18 to 24 Years | 1,234 (83.7%) | 713 (70.5%) |
| 25 to 34 Years | 1,457 (89.4%) | 1,259 (66.0%) |
| 35 to 44 Years | 1,536 (85.2%) | 1,106 (59.0%) |
| 45 to 54 Years | 1,250 (85.5%) | 1,281 (77.8%) |
| 55 to 64 Years | 1,147 (83.3%) | 1,048 (69.0%) |
| 65 to 74 Years | 811 (71.0%) | 980 (81.7%) |
| 75 Years and over | 666 (94.9%) | 723 (84.4%) |
| Total | 9,975 (77.2%) | 9,131 (68.9%) |
Income Below Poverty Among Married-Couple Families in East Chicago
The poverty statistics for married-couple families in East Chicago show that 11.8% or 298 of the total 2,520 families live below the poverty line. Families with 5 or more children have the highest poverty rate of 44.4%, comprising of 32 families. On the other hand, families with no children have the lowest poverty rate of 4.3%, which includes 58 families.
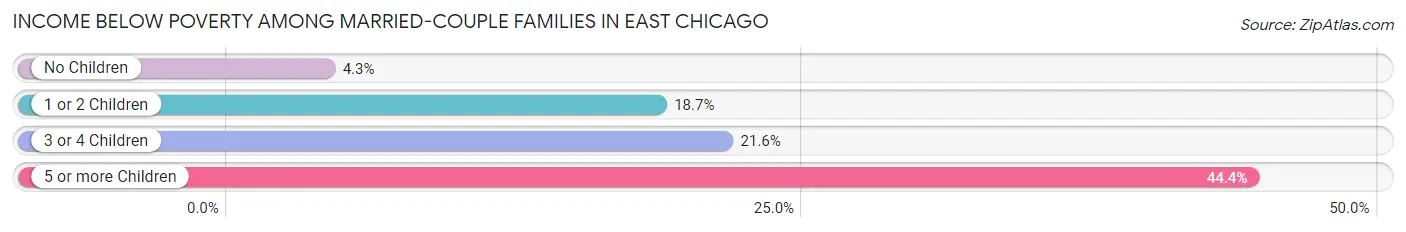
| Children | Above Poverty | Below Poverty |
| No Children | 1,308 (95.8%) | 58 (4.3%) |
| 1 or 2 Children | 714 (81.3%) | 164 (18.7%) |
| 3 or 4 Children | 160 (78.4%) | 44 (21.6%) |
| 5 or more Children | 40 (55.6%) | 32 (44.4%) |
| Total | 2,222 (88.2%) | 298 (11.8%) |
Income Below Poverty Among Single-Parent Households in East Chicago
According to the poverty data in East Chicago, 22.9% or 215 single-father households and 38.1% or 912 single-mother households are living below the poverty line. Among single-father households, those with 3 or 4 children have the highest poverty rate, with 88 households (59.5%) experiencing poverty. Likewise, among single-mother households, those with 5 or more children have the highest poverty rate, with 18 households (100.0%) falling below the poverty line.
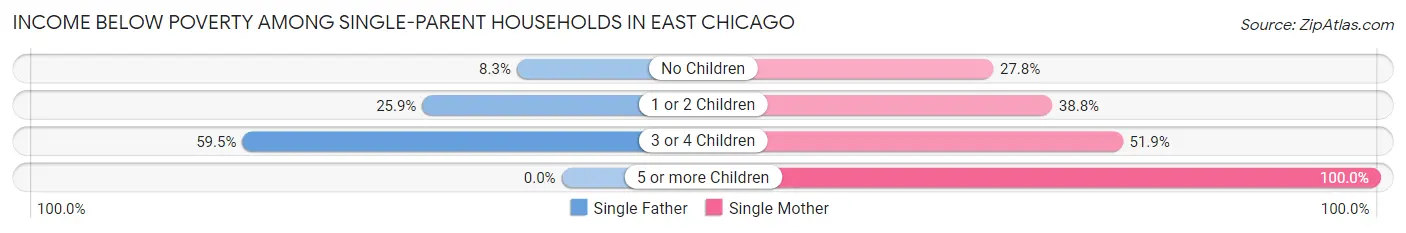
| Children | Single Father | Single Mother |
| No Children | 37 (8.3%) | 180 (27.8%) |
| 1 or 2 Children | 90 (25.9%) | 540 (38.8%) |
| 3 or 4 Children | 88 (59.5%) | 174 (51.9%) |
| 5 or more Children | 0 (0.0%) | 18 (100.0%) |
| Total | 215 (22.9%) | 912 (38.1%) |
Income Below Poverty Among Married-Couple vs Single-Parent Households in East Chicago
The poverty data for East Chicago shows that 298 of the married-couple family households (11.8%) and 1,127 of the single-parent households (33.8%) are living below the poverty level. Within the married-couple family households, those with 5 or more children have the highest poverty rate, with 32 households (44.4%) falling below the poverty line. Among the single-parent households, those with 5 or more children have the highest poverty rate, with 18 household (100.0%) living below poverty.
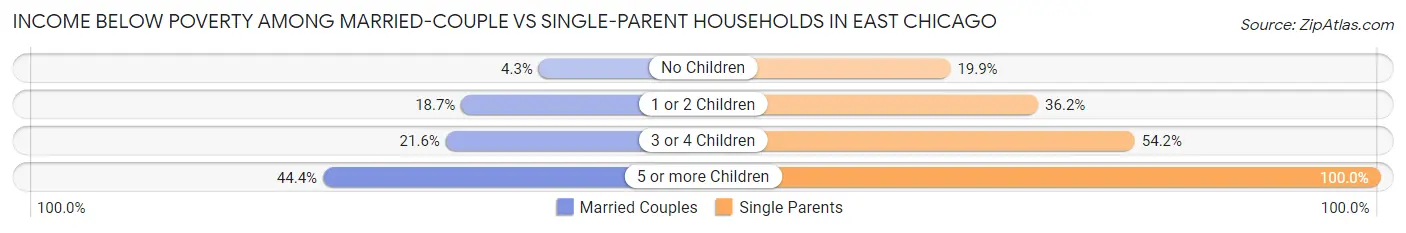
| Children | Married-Couple Families | Single-Parent Households |
| No Children | 58 (4.3%) | 217 (19.9%) |
| 1 or 2 Children | 164 (18.7%) | 630 (36.2%) |
| 3 or 4 Children | 44 (21.6%) | 262 (54.2%) |
| 5 or more Children | 32 (44.4%) | 18 (100.0%) |
| Total | 298 (11.8%) | 1,127 (33.8%) |
Race in East Chicago
The most populous races in East Chicago are Hispanic or Latino (14,438 | 54.8%), Black / African American (10,136 | 38.5%), and Some other Race (8,660 | 32.9%).
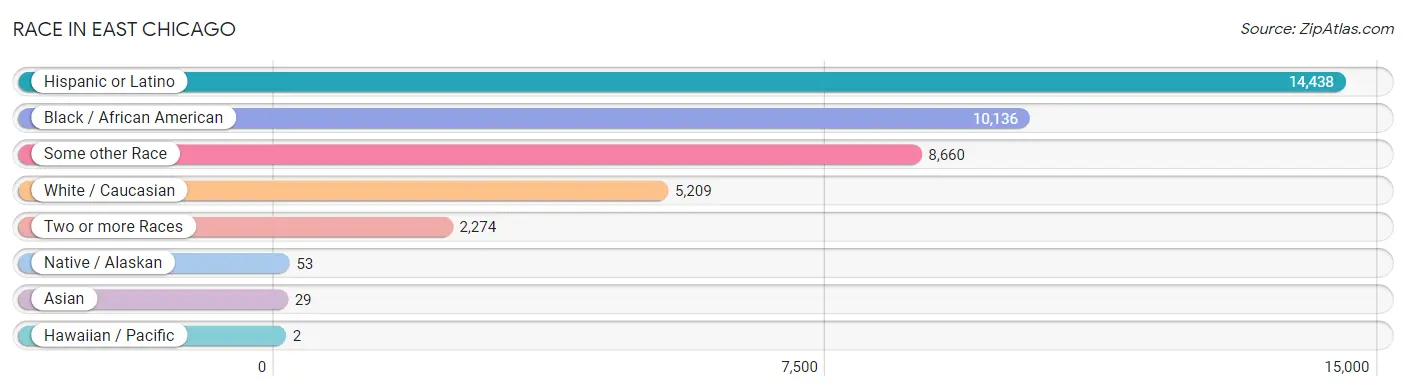
| Race | # Population | % Population |
| Asian | 29 | 0.1% |
| Black / African American | 10,136 | 38.5% |
| Hawaiian / Pacific | 2 | 0.0% |
| Hispanic or Latino | 14,438 | 54.8% |
| Native / Alaskan | 53 | 0.2% |
| White / Caucasian | 5,209 | 19.8% |
| Two or more Races | 2,274 | 8.6% |
| Some other Race | 8,660 | 32.9% |
| Total | 26,363 | 100.0% |
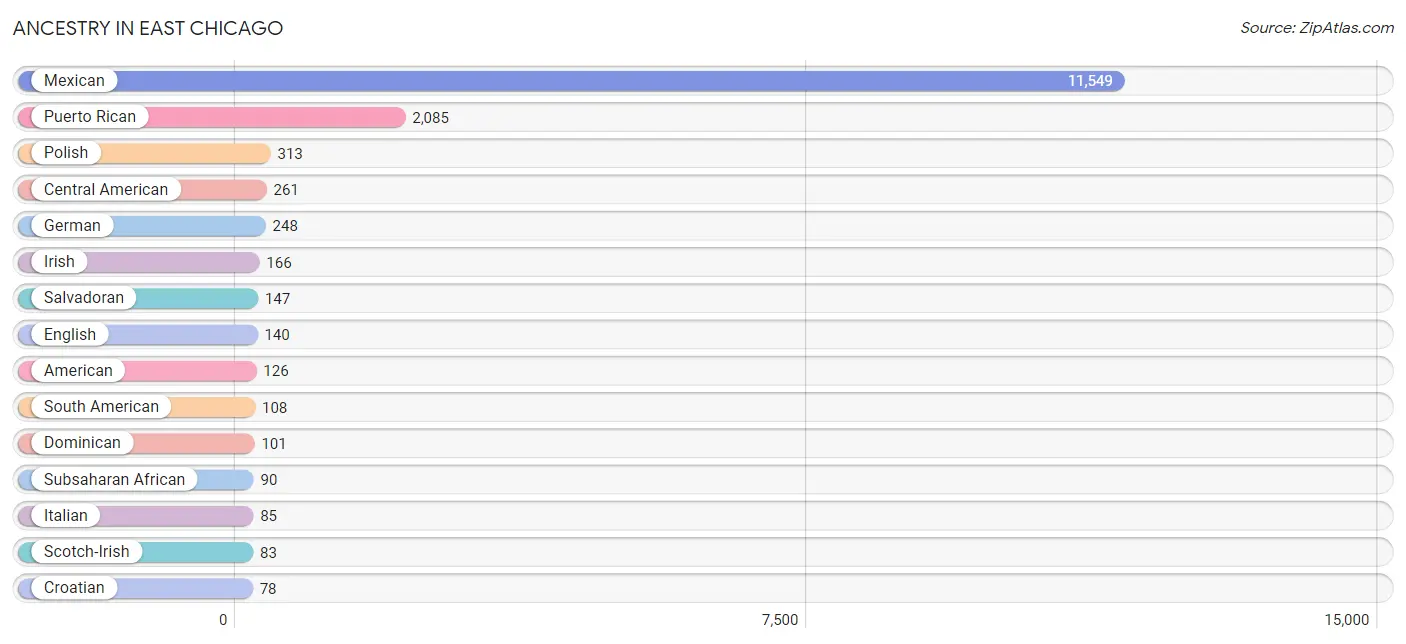
Ancestry in East Chicago
The most populous ancestries reported in East Chicago are Mexican (11,549 | 43.8%), Puerto Rican (2,085 | 7.9%), Polish (313 | 1.2%), Central American (261 | 1.0%), and German (248 | 0.9%), together accounting for 54.8% of all East Chicago residents.
| Ancestry | # Population | % Population |
| African | 58 | 0.2% |
| American | 126 | 0.5% |
| Apache | 23 | 0.1% |
| Arab | 30 | 0.1% |
| Austrian | 7 | 0.0% |
| Bhutanese | 1 | 0.0% |
| Blackfeet | 11 | 0.0% |
| Burmese | 28 | 0.1% |
| Central American | 261 | 1.0% |
| Cherokee | 11 | 0.0% |
| Colombian | 20 | 0.1% |
| Croatian | 78 | 0.3% |
| Cuban | 40 | 0.2% |
| Czech | 4 | 0.0% |
| Dominican | 101 | 0.4% |
| Dutch | 8 | 0.0% |
| English | 140 | 0.5% |
| European | 24 | 0.1% |
| French | 50 | 0.2% |
| German | 248 | 0.9% |
| Ghanaian | 18 | 0.1% |
| Greek | 10 | 0.0% |
| Guatemalan | 59 | 0.2% |
| Guyanese | 12 | 0.1% |
| Honduran | 55 | 0.2% |
| Hungarian | 72 | 0.3% |
| Irish | 166 | 0.6% |
| Italian | 85 | 0.3% |
| Jamaican | 38 | 0.1% |
| Lithuanian | 12 | 0.1% |
| Mexican | 11,549 | 43.8% |
| Mexican American Indian | 44 | 0.2% |
| Nigerian | 14 | 0.1% |
| Peruvian | 58 | 0.2% |
| Polish | 313 | 1.2% |
| Portuguese | 12 | 0.1% |
| Puerto Rican | 2,085 | 7.9% |
| Romanian | 10 | 0.0% |
| Russian | 74 | 0.3% |
| Salvadoran | 147 | 0.6% |
| Samoan | 2 | 0.0% |
| Scandinavian | 10 | 0.0% |
| Scotch-Irish | 83 | 0.3% |
| Scottish | 12 | 0.1% |
| Serbian | 22 | 0.1% |
| Slovak | 33 | 0.1% |
| South American | 108 | 0.4% |
| Spaniard | 12 | 0.1% |
| Spanish | 20 | 0.1% |
| Spanish American Indian | 32 | 0.1% |
| Subsaharan African | 90 | 0.3% |
| Swedish | 20 | 0.1% |
| Venezuelan | 30 | 0.1% |
| Yugoslavian | 27 | 0.1% | View All 54 Rows |
Immigrants in East Chicago
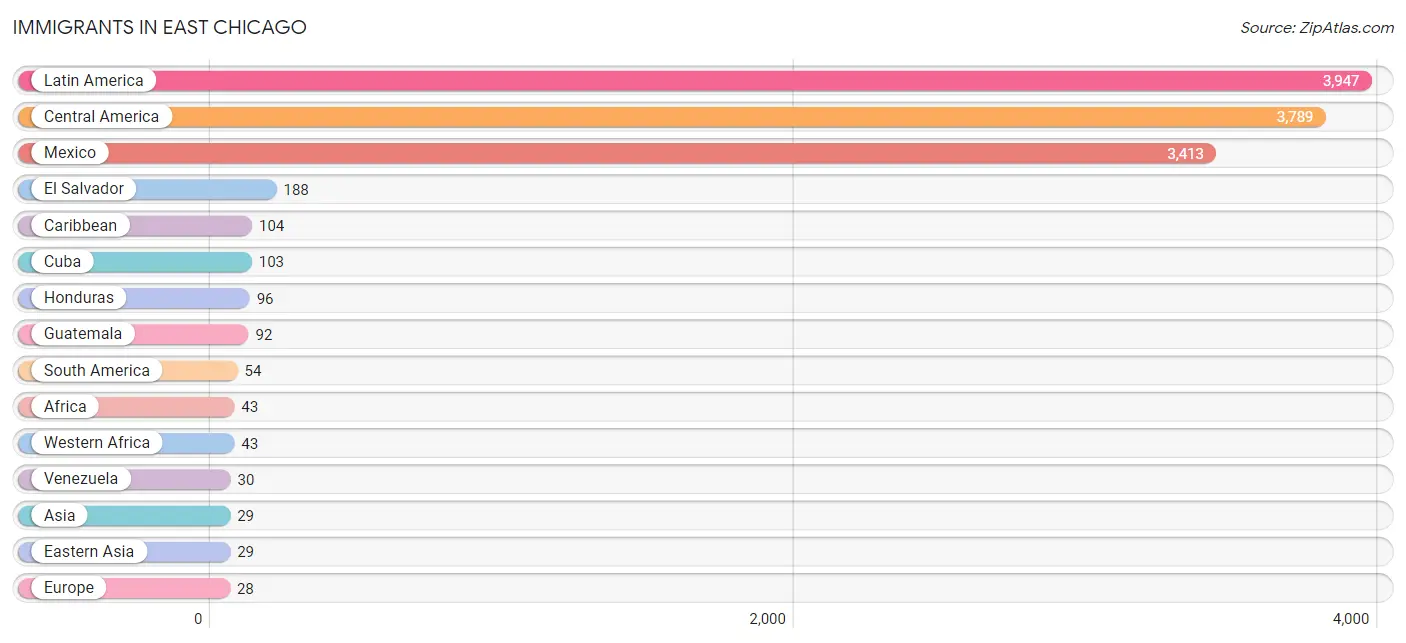
The most numerous immigrant groups reported in East Chicago came from Latin America (3,947 | 15.0%), Central America (3,789 | 14.4%), Mexico (3,413 | 13.0%), El Salvador (188 | 0.7%), and Caribbean (104 | 0.4%), together accounting for 43.4% of all East Chicago residents.
| Immigration Origin | # Population | % Population |
| Africa | 43 | 0.2% |
| Asia | 29 | 0.1% |
| Bosnia and Herzegovina | 12 | 0.1% |
| Caribbean | 104 | 0.4% |
| Central America | 3,789 | 14.4% |
| Colombia | 12 | 0.1% |
| Cuba | 103 | 0.4% |
| Dominican Republic | 1 | 0.0% |
| Eastern Asia | 29 | 0.1% |
| Eastern Europe | 23 | 0.1% |
| El Salvador | 188 | 0.7% |
| Europe | 28 | 0.1% |
| Ghana | 18 | 0.1% |
| Guatemala | 92 | 0.4% |
| Guyana | 12 | 0.1% |
| Honduras | 96 | 0.4% |
| Hungary | 11 | 0.0% |
| Japan | 1 | 0.0% |
| Korea | 28 | 0.1% |
| Latin America | 3,947 | 15.0% |
| Mexico | 3,413 | 13.0% |
| Nigeria | 25 | 0.1% |
| Oceania | 2 | 0.0% |
| South America | 54 | 0.2% |
| Southern Europe | 5 | 0.0% |
| Spain | 5 | 0.0% |
| Venezuela | 30 | 0.1% |
| Western Africa | 43 | 0.2% | View All 28 Rows |
Sex and Age in East Chicago
Sex and Age in East Chicago
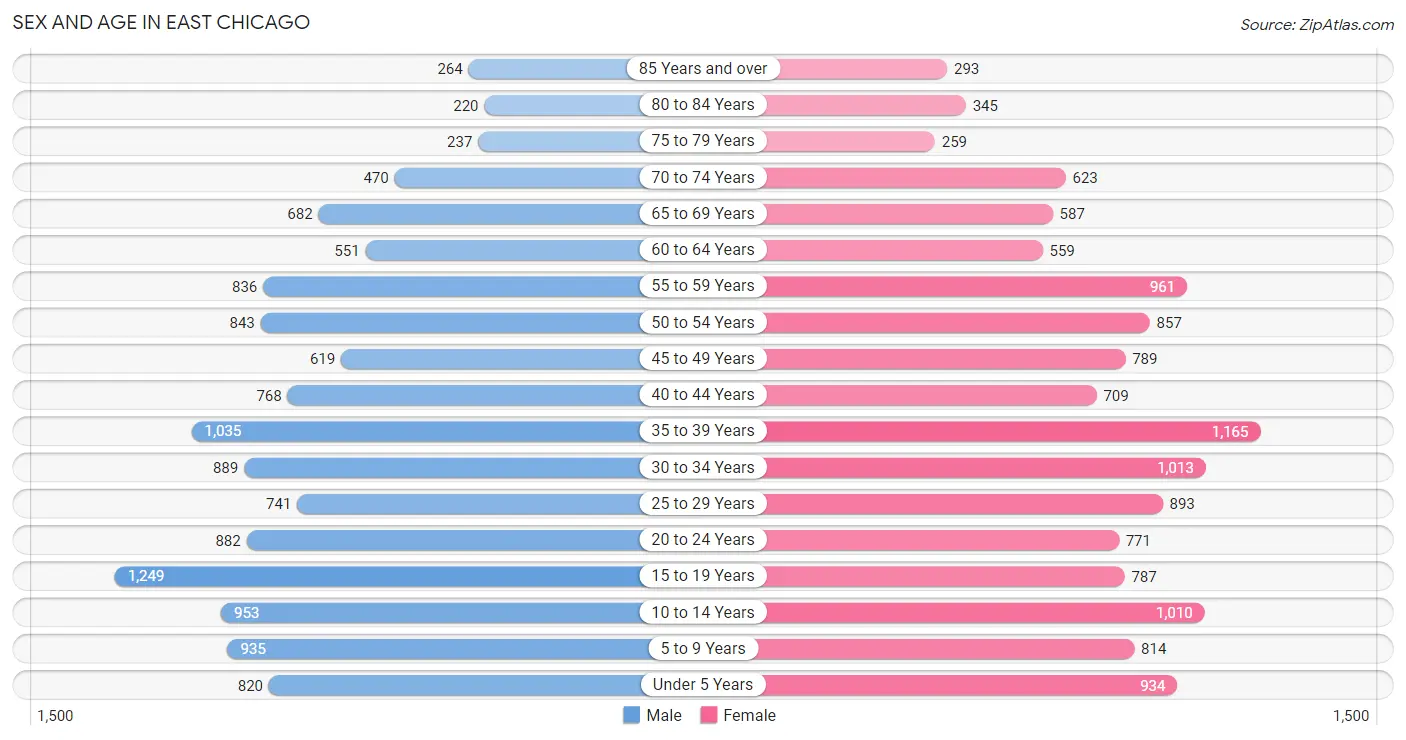
The most populous age groups in East Chicago are 15 to 19 Years (1,249 | 9.6%) for men and 35 to 39 Years (1,165 | 8.7%) for women.
| Age Bracket | Male | Female |
| Under 5 Years | 820 (6.3%) | 934 (7.0%) |
| 5 to 9 Years | 935 (7.2%) | 814 (6.1%) |
| 10 to 14 Years | 953 (7.3%) | 1,010 (7.5%) |
| 15 to 19 Years | 1,249 (9.6%) | 787 (5.9%) |
| 20 to 24 Years | 882 (6.8%) | 771 (5.8%) |
| 25 to 29 Years | 741 (5.7%) | 893 (6.7%) |
| 30 to 34 Years | 889 (6.8%) | 1,013 (7.6%) |
| 35 to 39 Years | 1,035 (8.0%) | 1,165 (8.7%) |
| 40 to 44 Years | 768 (5.9%) | 709 (5.3%) |
| 45 to 49 Years | 619 (4.8%) | 789 (5.9%) |
| 50 to 54 Years | 843 (6.5%) | 857 (6.4%) |
| 55 to 59 Years | 836 (6.4%) | 961 (7.2%) |
| 60 to 64 Years | 551 (4.2%) | 559 (4.2%) |
| 65 to 69 Years | 682 (5.2%) | 587 (4.4%) |
| 70 to 74 Years | 470 (3.6%) | 623 (4.7%) |
| 75 to 79 Years | 237 (1.8%) | 259 (1.9%) |
| 80 to 84 Years | 220 (1.7%) | 345 (2.6%) |
| 85 Years and over | 264 (2.0%) | 293 (2.2%) |
| Total | 12,994 (100.0%) | 13,369 (100.0%) |
Families and Households in East Chicago
Median Family Size in East Chicago
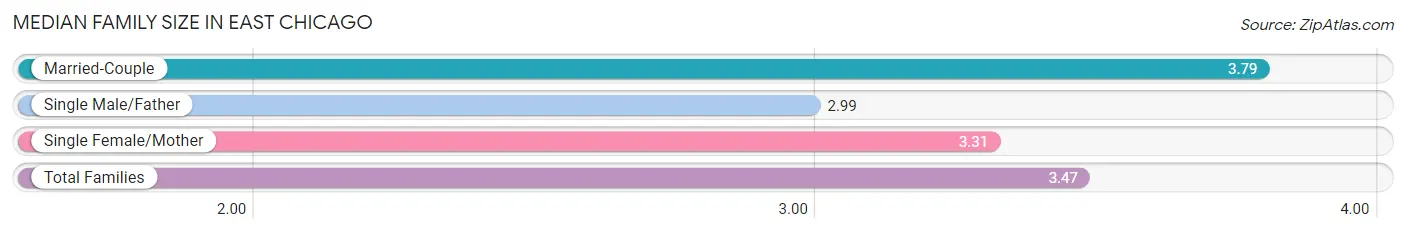
The median family size in East Chicago is 3.47 persons per family, with married-couple families (2,520 | 43.1%) accounting for the largest median family size of 3.79 persons per family. On the other hand, single male/father families (939 | 16.1%) represent the smallest median family size with 2.99 persons per family.
| Family Type | # Families | Family Size |
| Married-Couple | 2,520 (43.1%) | 3.79 |
| Single Male/Father | 939 (16.1%) | 2.99 |
| Single Female/Mother | 2,392 (40.9%) | 3.31 |
| Total Families | 5,851 (100.0%) | 3.47 |
Median Household Size in East Chicago
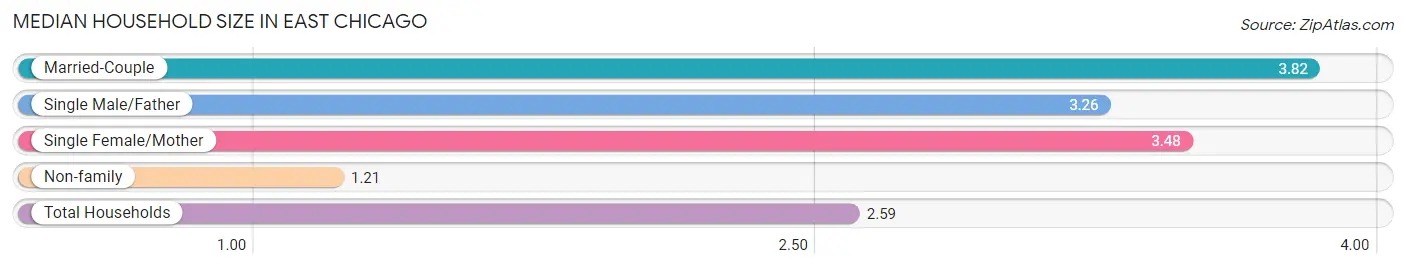
The median household size in East Chicago is 2.59 persons per household, with married-couple households (2,520 | 24.8%) accounting for the largest median household size of 3.82 persons per household. non-family households (4,296 | 42.3%) represent the smallest median household size with 1.21 persons per household.
| Household Type | # Households | Household Size |
| Married-Couple | 2,520 (24.8%) | 3.82 |
| Single Male/Father | 939 (9.2%) | 3.26 |
| Single Female/Mother | 2,392 (23.6%) | 3.48 |
| Non-family | 4,296 (42.3%) | 1.21 |
| Total Households | 10,147 (100.0%) | 2.59 |
Household Size by Marriage Status in East Chicago
Out of a total of 10,147 households in East Chicago, 5,851 (57.7%) are family households, while 4,296 (42.3%) are nonfamily households. The most numerous type of family households are 2-person households, comprising 2,089, and the most common type of nonfamily households are 1-person households, comprising 3,713.
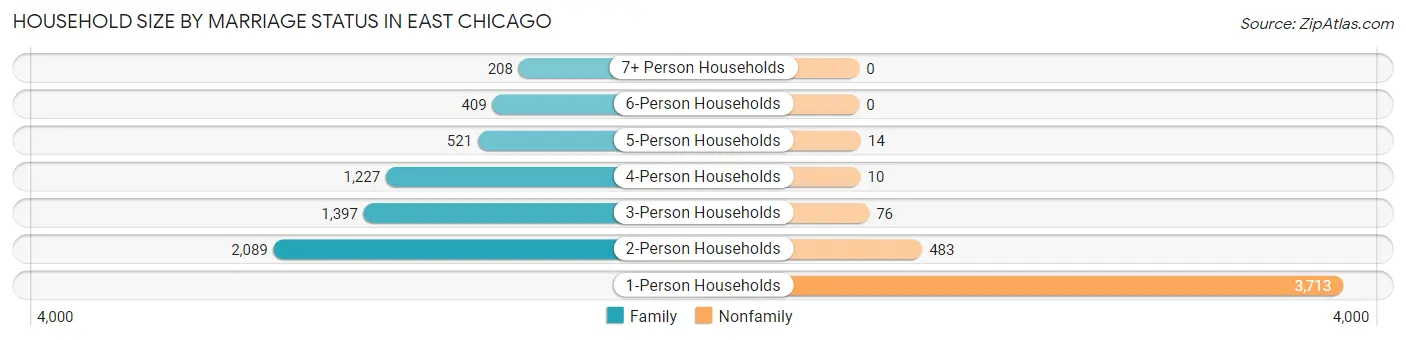
| Household Size | Family Households | Nonfamily Households |
| 1-Person Households | - | 3,713 (36.6%) |
| 2-Person Households | 2,089 (20.6%) | 483 (4.8%) |
| 3-Person Households | 1,397 (13.8%) | 76 (0.7%) |
| 4-Person Households | 1,227 (12.1%) | 10 (0.1%) |
| 5-Person Households | 521 (5.1%) | 14 (0.1%) |
| 6-Person Households | 409 (4.0%) | 0 (0.0%) |
| 7+ Person Households | 208 (2.1%) | 0 (0.0%) |
| Total | 5,851 (57.7%) | 4,296 (42.3%) |
Female Fertility in East Chicago
Fertility by Age in East Chicago
Average fertility rate in East Chicago is 66.0 births per 1,000 women. Women in the age bracket of 20 to 34 years have the highest fertility rate with 117.0 births per 1,000 women. Women in the age bracket of 20 to 34 years acount for 75.6% of all women with births.
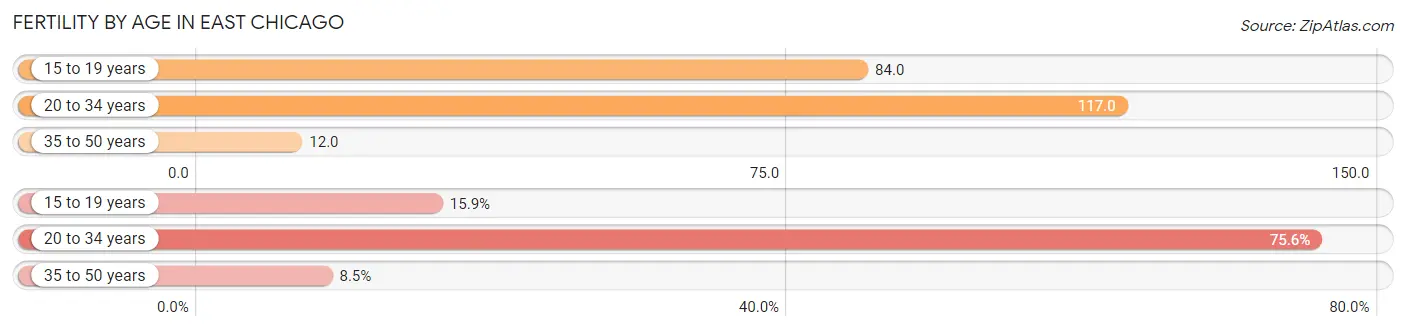
| Age Bracket | Women with Births | Births / 1,000 Women |
| 15 to 19 years | 66 (15.9%) | 84.0 |
| 20 to 34 years | 313 (75.6%) | 117.0 |
| 35 to 50 years | 35 (8.5%) | 12.0 |
| Total | 414 (100.0%) | 66.0 |
Fertility by Age by Marriage Status in East Chicago
17.6% of women with births (414) in East Chicago are married. The highest percentage of unmarried women with births falls into 15 to 19 years age bracket with 100.0% of them unmarried at the time of birth, while the lowest percentage of unmarried women with births belong to 35 to 50 years age bracket with 57.1% of them unmarried.
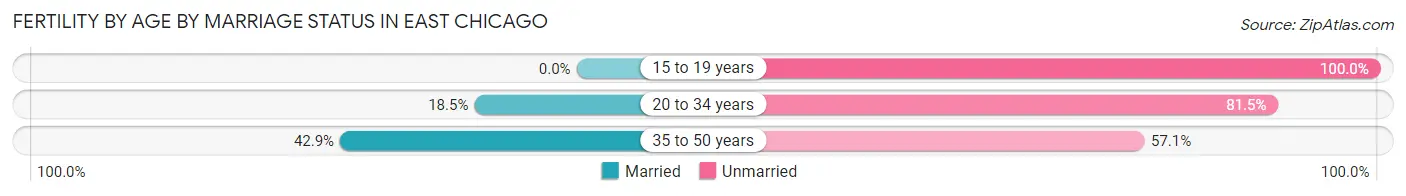
| Age Bracket | Married | Unmarried |
| 15 to 19 years | 0 (0.0%) | 66 (100.0%) |
| 20 to 34 years | 58 (18.5%) | 255 (81.5%) |
| 35 to 50 years | 15 (42.9%) | 20 (57.1%) |
| Total | 73 (17.6%) | 341 (82.4%) |
Fertility by Education in East Chicago
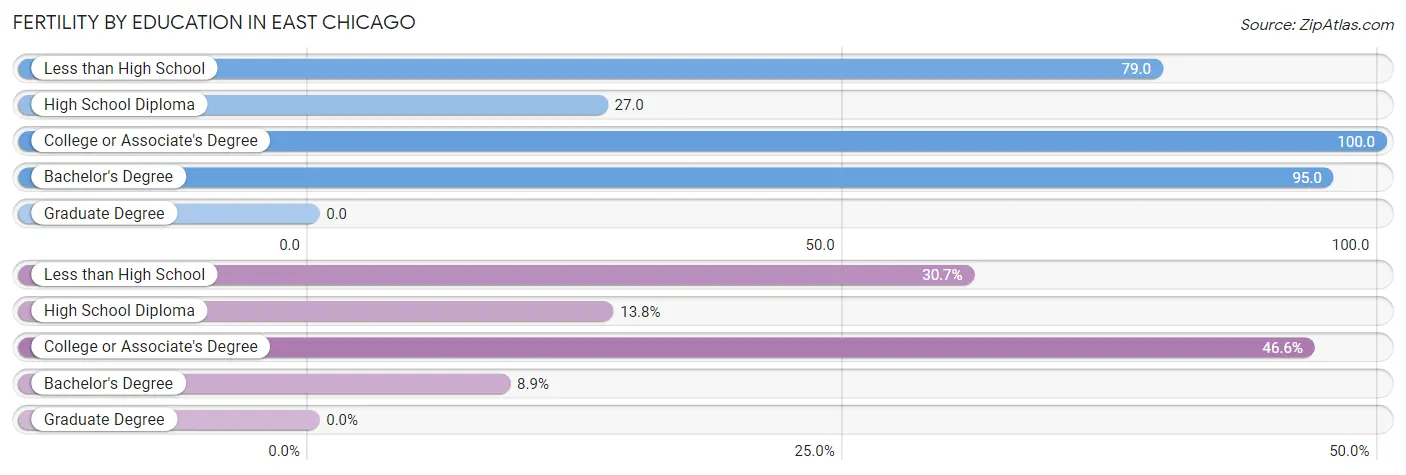
| Educational Attainment | Women with Births | Births / 1,000 Women |
| Less than High School | 127 (30.7%) | 79.0 |
| High School Diploma | 57 (13.8%) | 27.0 |
| College or Associate's Degree | 193 (46.6%) | 100.0 |
| Bachelor's Degree | 37 (8.9%) | 95.0 |
| Graduate Degree | 0 (0.0%) | 0.0 |
| Total | 414 (100.0%) | 66.0 |
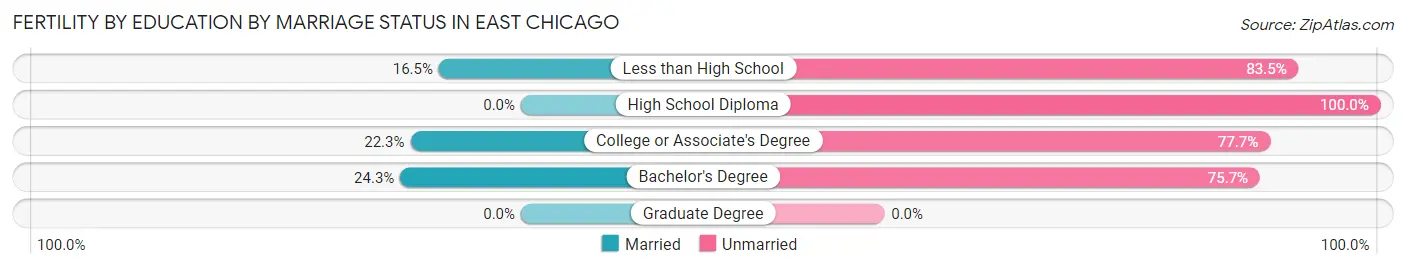
Fertility by Education by Marriage Status in East Chicago
82.4% of women with births in East Chicago are unmarried. Women with the educational attainment of bachelor's degree are most likely to be married with 24.3% of them married at childbirth, while women with the educational attainment of high school diploma are least likely to be married with 100.0% of them unmarried at childbirth.
| Educational Attainment | Married | Unmarried |
| Less than High School | 21 (16.5%) | 106 (83.5%) |
| High School Diploma | 0 (0.0%) | 57 (100.0%) |
| College or Associate's Degree | 43 (22.3%) | 150 (77.7%) |
| Bachelor's Degree | 9 (24.3%) | 28 (75.7%) |
| Graduate Degree | 0 (0.0%) | 0 (0.0%) |
| Total | 73 (17.6%) | 341 (82.4%) |
Employment Characteristics in East Chicago
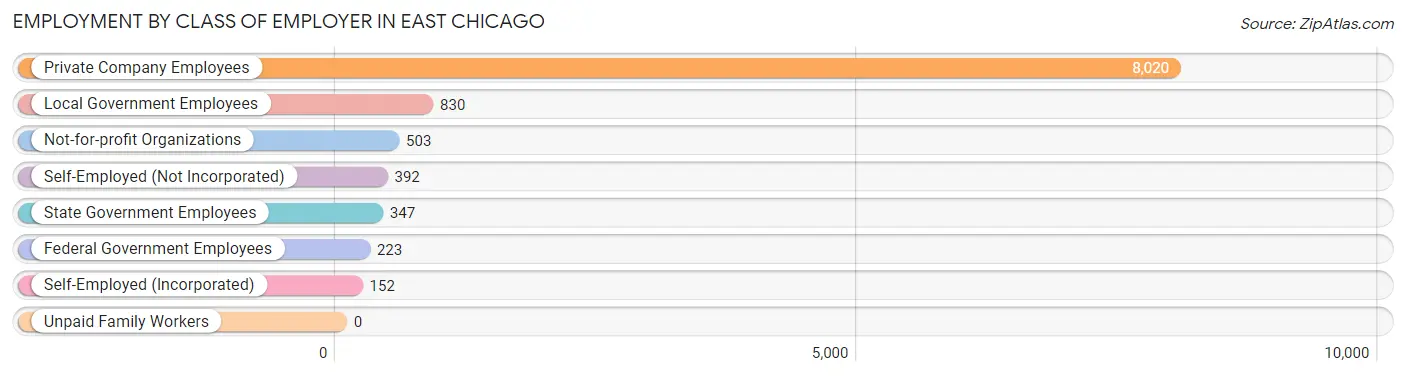
Employment by Class of Employer in East Chicago
Among the 10,467 employed individuals in East Chicago, private company employees (8,020 | 76.6%), local government employees (830 | 7.9%), and not-for-profit organizations (503 | 4.8%) make up the most common classes of employment.
| Employer Class | # Employees | % Employees |
| Private Company Employees | 8,020 | 76.6% |
| Self-Employed (Incorporated) | 152 | 1.5% |
| Self-Employed (Not Incorporated) | 392 | 3.7% |
| Not-for-profit Organizations | 503 | 4.8% |
| Local Government Employees | 830 | 7.9% |
| State Government Employees | 347 | 3.3% |
| Federal Government Employees | 223 | 2.1% |
| Unpaid Family Workers | 0 | 0.0% |
| Total | 10,467 | 100.0% |
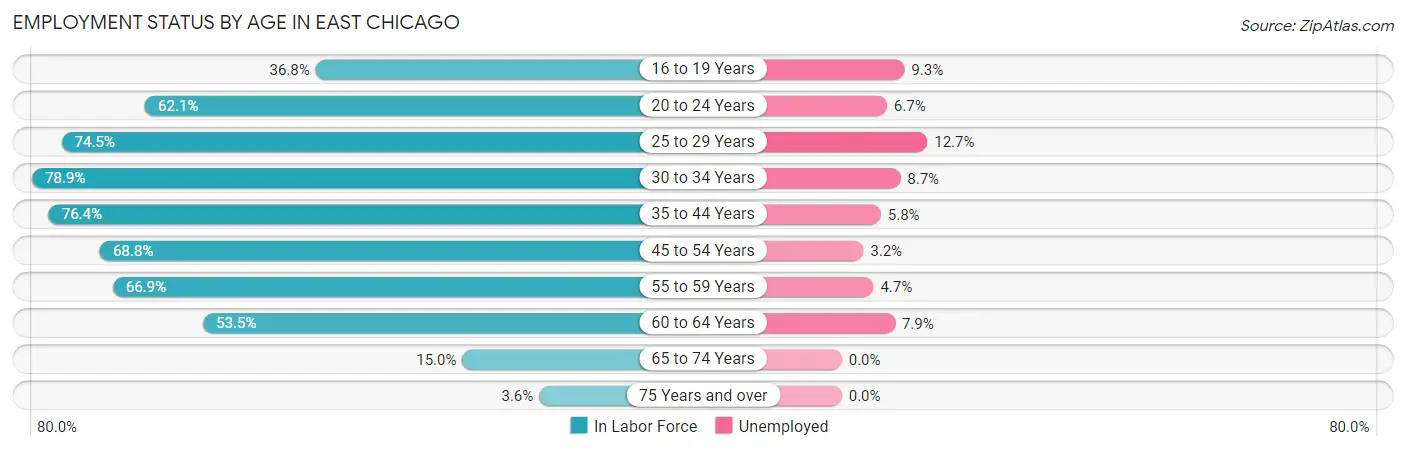
Employment Status by Age in East Chicago
According to the labor force statistics for East Chicago, out of the total population over 16 years of age (20,580), 56.0% or 11,525 individuals are in the labor force, with 6.5% or 749 of them unemployed. The age group with the highest labor force participation rate is 30 to 34 years, with 78.9% or 1,501 individuals in the labor force. Within the labor force, the 25 to 29 years age range has the highest percentage of unemployed individuals, with 12.7% or 155 of them being unemployed.
| Age Bracket | In Labor Force | Unemployed |
| 16 to 19 Years | 633 (36.8%) | 59 (9.3%) |
| 20 to 24 Years | 1,027 (62.1%) | 69 (6.7%) |
| 25 to 29 Years | 1,217 (74.5%) | 155 (12.7%) |
| 30 to 34 Years | 1,501 (78.9%) | 131 (8.7%) |
| 35 to 44 Years | 2,809 (76.4%) | 163 (5.8%) |
| 45 to 54 Years | 2,138 (68.8%) | 68 (3.2%) |
| 55 to 59 Years | 1,202 (66.9%) | 56 (4.7%) |
| 60 to 64 Years | 594 (53.5%) | 47 (7.9%) |
| 65 to 74 Years | 354 (15.0%) | 0 (0.0%) |
| 75 Years and over | 58 (3.6%) | 0 (0.0%) |
| Total | 11,525 (56.0%) | 749 (6.5%) |
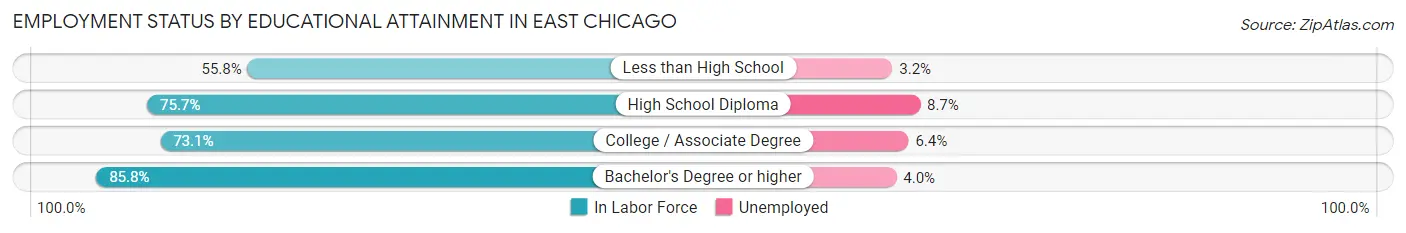
Employment Status by Educational Attainment in East Chicago
According to labor force statistics for East Chicago, 71.5% of individuals (9,458) out of the total population between 25 and 64 years of age (13,228) are in the labor force, with 6.5% or 615 of them being unemployed. The group with the highest labor force participation rate are those with the educational attainment of bachelor's degree or higher, with 85.8% or 1,187 individuals in the labor force. Within the labor force, individuals with high school diploma education have the highest percentage of unemployment, with 8.7% or 355 of them being unemployed.
| Educational Attainment | In Labor Force | Unemployed |
| Less than High School | 1,686 (55.8%) | 97 (3.2%) |
| High School Diploma | 4,085 (75.7%) | 469 (8.7%) |
| College / Associate Degree | 2,505 (73.1%) | 219 (6.4%) |
| Bachelor's Degree or higher | 1,187 (85.8%) | 55 (4.0%) |
| Total | 9,458 (71.5%) | 860 (6.5%) |
Employment Occupations by Sex in East Chicago
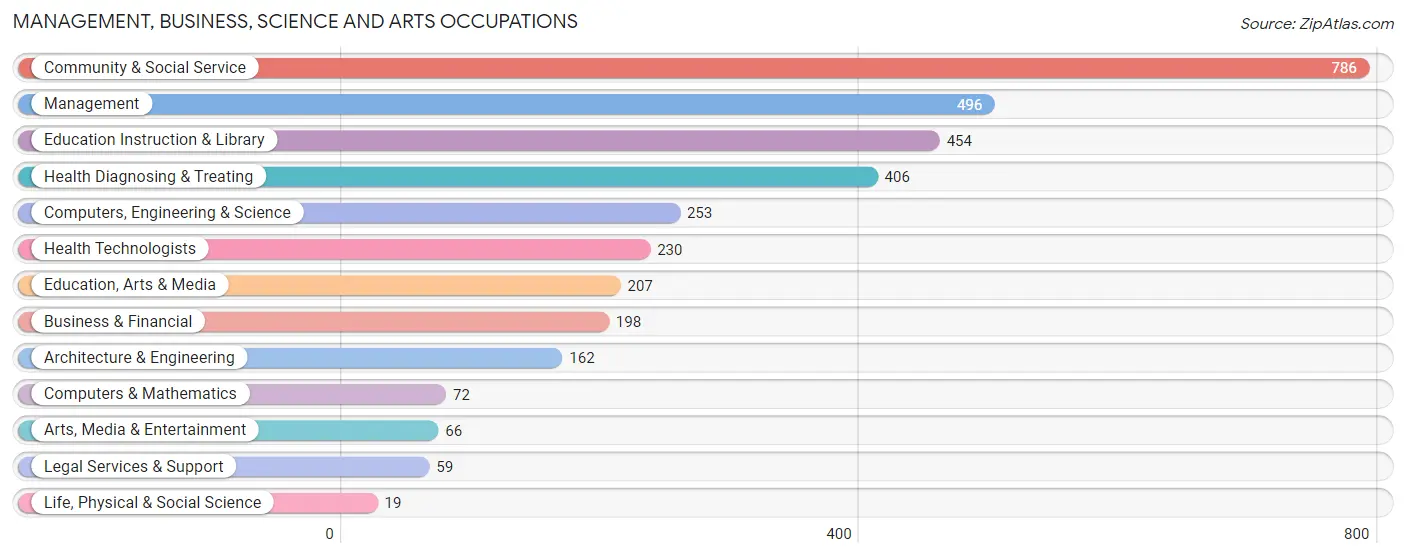
Management, Business, Science and Arts Occupations
The most common Management, Business, Science and Arts occupations in East Chicago are Community & Social Service (786 | 7.3%), Management (496 | 4.6%), Education Instruction & Library (454 | 4.2%), Health Diagnosing & Treating (406 | 3.8%), and Computers, Engineering & Science (253 | 2.4%).
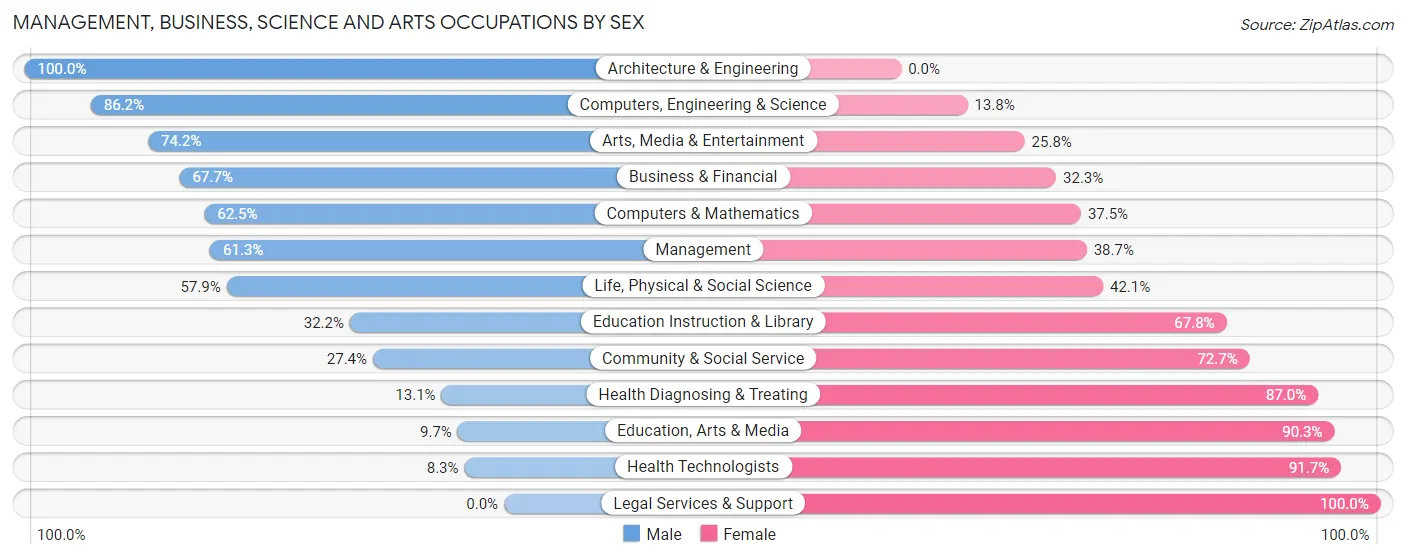
Management, Business, Science and Arts Occupations by Sex
Within the Management, Business, Science and Arts occupations in East Chicago, the most male-oriented occupations are Architecture & Engineering (100.0%), Computers, Engineering & Science (86.2%), and Arts, Media & Entertainment (74.2%), while the most female-oriented occupations are Legal Services & Support (100.0%), Health Technologists (91.7%), and Education, Arts & Media (90.3%).
| Occupation | Male | Female |
| Management | 304 (61.3%) | 192 (38.7%) |
| Business & Financial | 134 (67.7%) | 64 (32.3%) |
| Computers, Engineering & Science | 218 (86.2%) | 35 (13.8%) |
| Computers & Mathematics | 45 (62.5%) | 27 (37.5%) |
| Architecture & Engineering | 162 (100.0%) | 0 (0.0%) |
| Life, Physical & Social Science | 11 (57.9%) | 8 (42.1%) |
| Community & Social Service | 215 (27.4%) | 571 (72.7%) |
| Education, Arts & Media | 20 (9.7%) | 187 (90.3%) |
| Legal Services & Support | 0 (0.0%) | 59 (100.0%) |
| Education Instruction & Library | 146 (32.2%) | 308 (67.8%) |
| Arts, Media & Entertainment | 49 (74.2%) | 17 (25.8%) |
| Health Diagnosing & Treating | 53 (13.1%) | 353 (87.0%) |
| Health Technologists | 19 (8.3%) | 211 (91.7%) |
| Total (Category) | 924 (43.2%) | 1,215 (56.8%) |
| Total (Overall) | 5,897 (54.7%) | 4,889 (45.3%) |
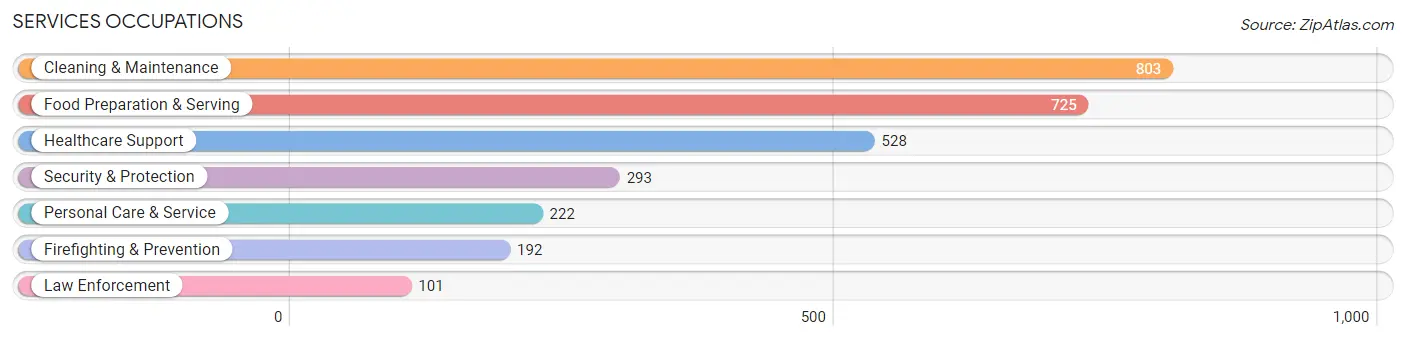
Services Occupations
The most common Services occupations in East Chicago are Cleaning & Maintenance (803 | 7.4%), Food Preparation & Serving (725 | 6.7%), Healthcare Support (528 | 4.9%), Security & Protection (293 | 2.7%), and Personal Care & Service (222 | 2.1%).
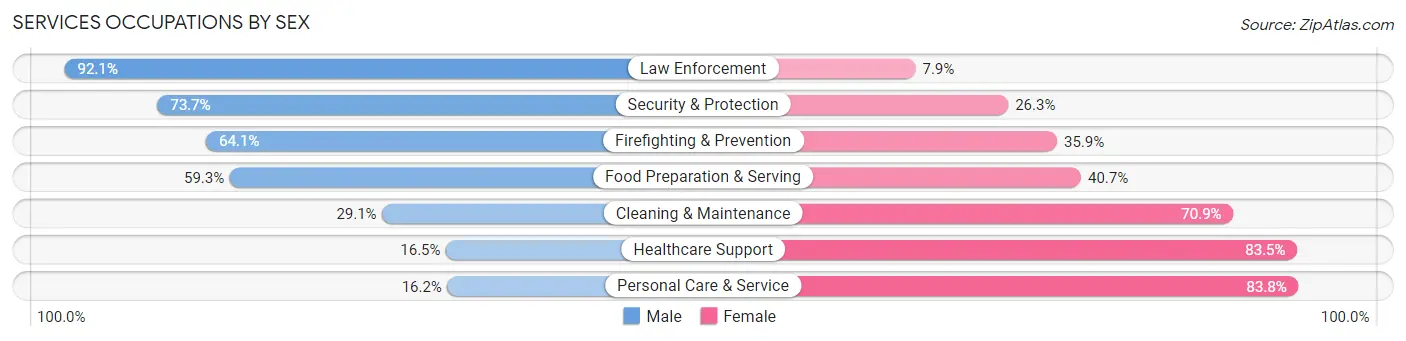
Services Occupations by Sex
Within the Services occupations in East Chicago, the most male-oriented occupations are Law Enforcement (92.1%), Security & Protection (73.7%), and Firefighting & Prevention (64.1%), while the most female-oriented occupations are Personal Care & Service (83.8%), Healthcare Support (83.5%), and Cleaning & Maintenance (70.9%).
| Occupation | Male | Female |
| Healthcare Support | 87 (16.5%) | 441 (83.5%) |
| Security & Protection | 216 (73.7%) | 77 (26.3%) |
| Firefighting & Prevention | 123 (64.1%) | 69 (35.9%) |
| Law Enforcement | 93 (92.1%) | 8 (7.9%) |
| Food Preparation & Serving | 430 (59.3%) | 295 (40.7%) |
| Cleaning & Maintenance | 234 (29.1%) | 569 (70.9%) |
| Personal Care & Service | 36 (16.2%) | 186 (83.8%) |
| Total (Category) | 1,003 (39.0%) | 1,568 (61.0%) |
| Total (Overall) | 5,897 (54.7%) | 4,889 (45.3%) |
Sales and Office Occupations
The most common Sales and Office occupations in East Chicago are Office & Administration (1,280 | 11.9%), and Sales & Related (886 | 8.2%).

Sales and Office Occupations by Sex
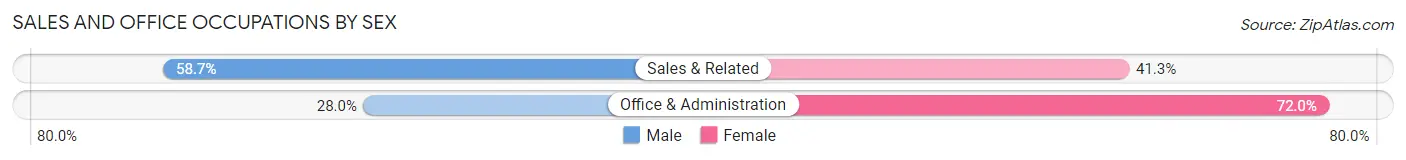
| Occupation | Male | Female |
| Sales & Related | 520 (58.7%) | 366 (41.3%) |
| Office & Administration | 358 (28.0%) | 922 (72.0%) |
| Total (Category) | 878 (40.5%) | 1,288 (59.5%) |
| Total (Overall) | 5,897 (54.7%) | 4,889 (45.3%) |
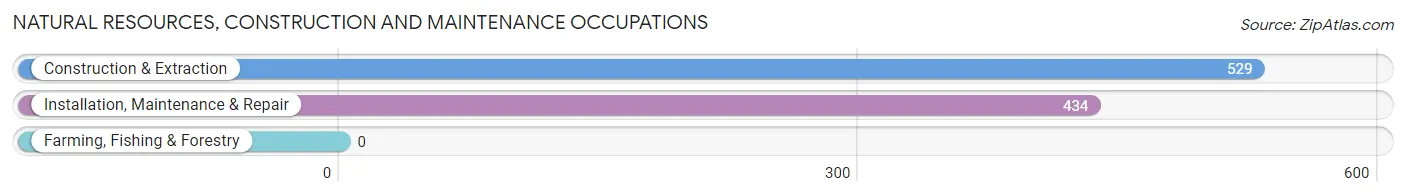
Natural Resources, Construction and Maintenance Occupations
The most common Natural Resources, Construction and Maintenance occupations in East Chicago are Construction & Extraction (529 | 4.9%), and Installation, Maintenance & Repair (434 | 4.0%).
Natural Resources, Construction and Maintenance Occupations by Sex

| Occupation | Male | Female |
| Farming, Fishing & Forestry | 0 (0.0%) | 0 (0.0%) |
| Construction & Extraction | 515 (97.4%) | 14 (2.6%) |
| Installation, Maintenance & Repair | 358 (82.5%) | 76 (17.5%) |
| Total (Category) | 873 (90.6%) | 90 (9.3%) |
| Total (Overall) | 5,897 (54.7%) | 4,889 (45.3%) |
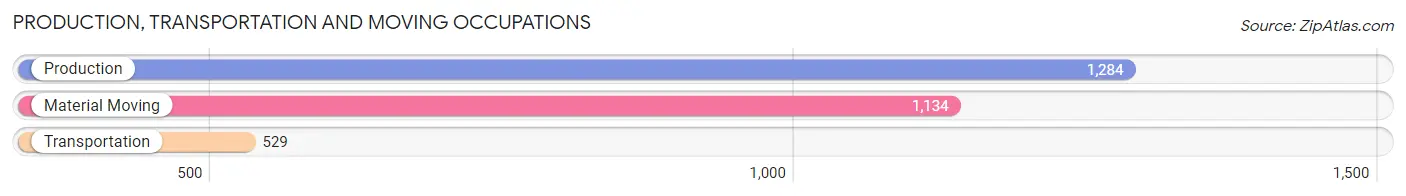
Production, Transportation and Moving Occupations
The most common Production, Transportation and Moving occupations in East Chicago are Production (1,284 | 11.9%), Material Moving (1,134 | 10.5%), and Transportation (529 | 4.9%).
Production, Transportation and Moving Occupations by Sex
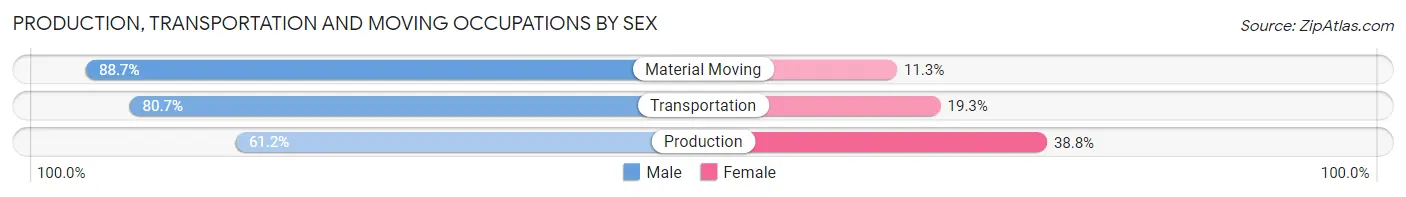
| Occupation | Male | Female |
| Production | 786 (61.2%) | 498 (38.8%) |
| Transportation | 427 (80.7%) | 102 (19.3%) |
| Material Moving | 1,006 (88.7%) | 128 (11.3%) |
| Total (Category) | 2,219 (75.3%) | 728 (24.7%) |
| Total (Overall) | 5,897 (54.7%) | 4,889 (45.3%) |
Employment Industries by Sex in East Chicago
Employment Industries in East Chicago
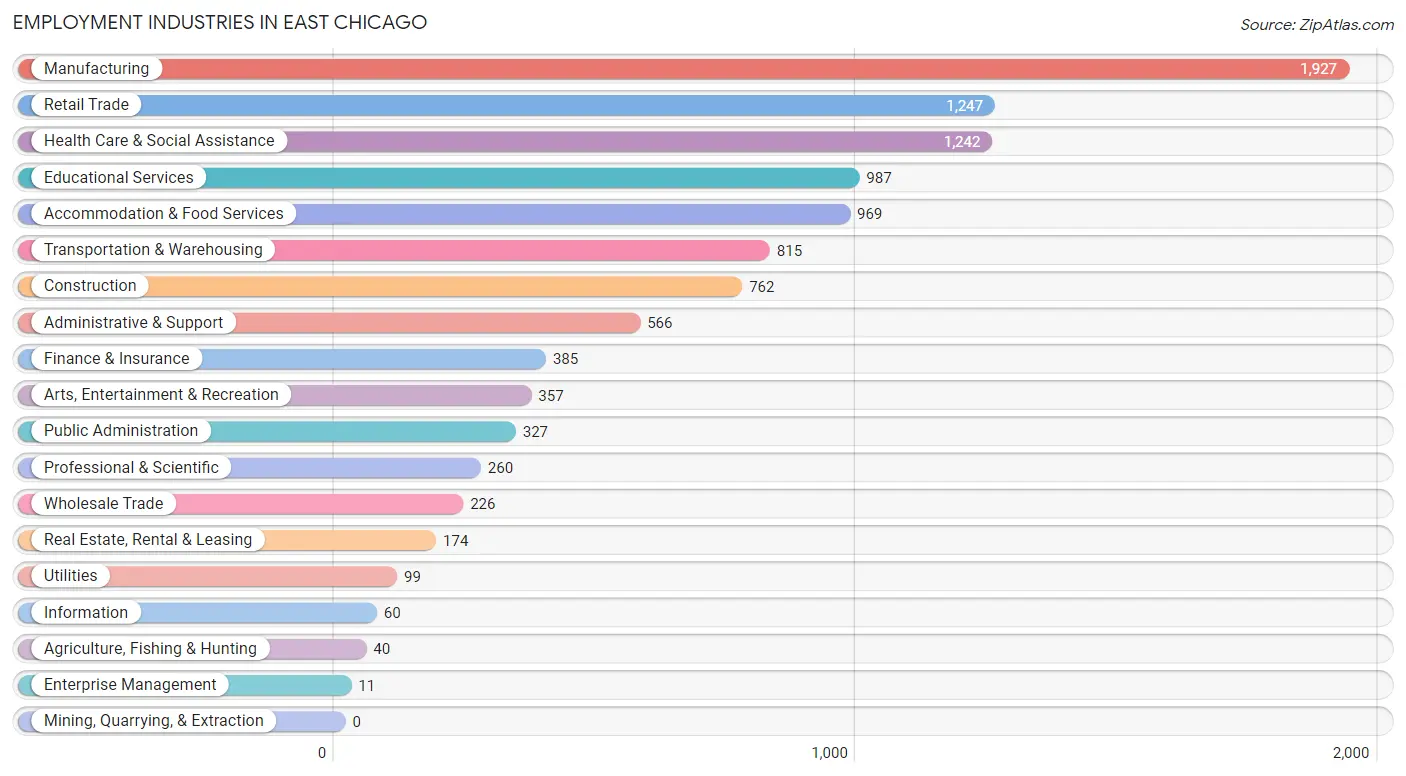
The major employment industries in East Chicago include Manufacturing (1,927 | 17.9%), Retail Trade (1,247 | 11.6%), Health Care & Social Assistance (1,242 | 11.5%), Educational Services (987 | 9.1%), and Accommodation & Food Services (969 | 9.0%).
Employment Industries by Sex in East Chicago
The East Chicago industries that see more men than women are Agriculture, Fishing & Hunting (100.0%), Construction (97.6%), and Wholesale Trade (86.3%), whereas the industries that tend to have a higher number of women are Enterprise Management (100.0%), Health Care & Social Assistance (84.3%), and Finance & Insurance (81.0%).
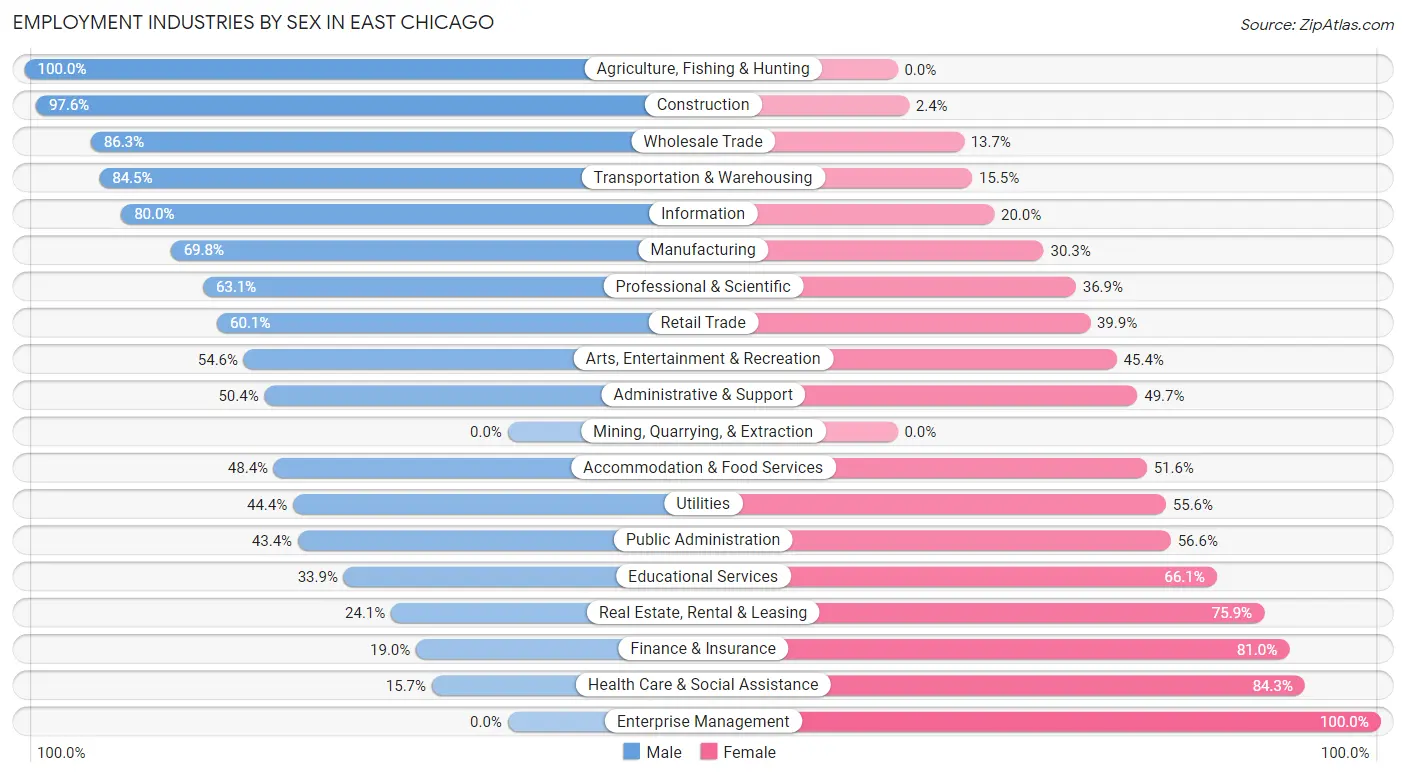
| Industry | Male | Female |
| Agriculture, Fishing & Hunting | 40 (100.0%) | 0 (0.0%) |
| Mining, Quarrying, & Extraction | 0 (0.0%) | 0 (0.0%) |
| Construction | 744 (97.6%) | 18 (2.4%) |
| Manufacturing | 1,344 (69.8%) | 583 (30.2%) |
| Wholesale Trade | 195 (86.3%) | 31 (13.7%) |
| Retail Trade | 750 (60.1%) | 497 (39.9%) |
| Transportation & Warehousing | 689 (84.5%) | 126 (15.5%) |
| Utilities | 44 (44.4%) | 55 (55.6%) |
| Information | 48 (80.0%) | 12 (20.0%) |
| Finance & Insurance | 73 (19.0%) | 312 (81.0%) |
| Real Estate, Rental & Leasing | 42 (24.1%) | 132 (75.9%) |
| Professional & Scientific | 164 (63.1%) | 96 (36.9%) |
| Enterprise Management | 0 (0.0%) | 11 (100.0%) |
| Administrative & Support | 285 (50.3%) | 281 (49.6%) |
| Educational Services | 335 (33.9%) | 652 (66.1%) |
| Health Care & Social Assistance | 195 (15.7%) | 1,047 (84.3%) |
| Arts, Entertainment & Recreation | 195 (54.6%) | 162 (45.4%) |
| Accommodation & Food Services | 469 (48.4%) | 500 (51.6%) |
| Public Administration | 142 (43.4%) | 185 (56.6%) |
| Total | 5,897 (54.7%) | 4,889 (45.3%) |
Education in East Chicago
School Enrollment in East Chicago
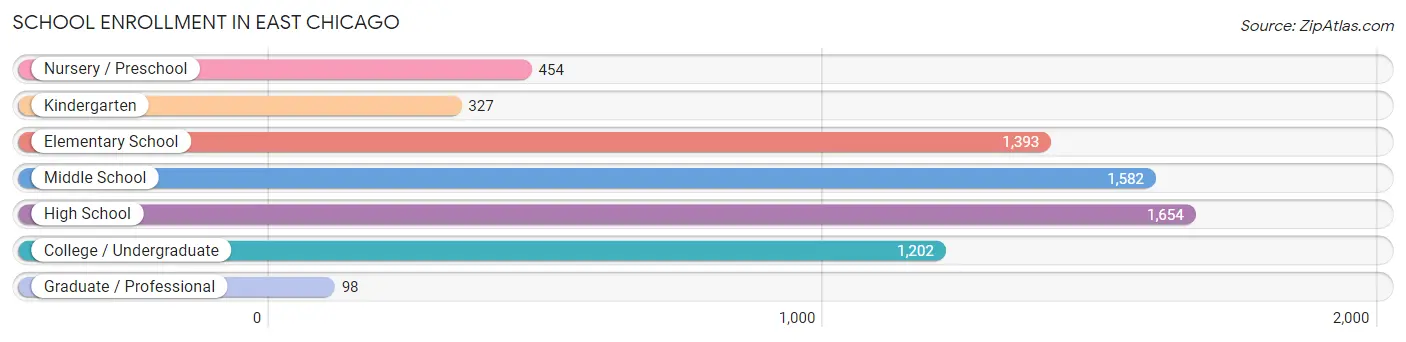
The most common levels of schooling among the 6,710 students in East Chicago are high school (1,654 | 24.6%), middle school (1,582 | 23.6%), and elementary school (1,393 | 20.8%).
| School Level | # Students | % Students |
| Nursery / Preschool | 454 | 6.8% |
| Kindergarten | 327 | 4.9% |
| Elementary School | 1,393 | 20.8% |
| Middle School | 1,582 | 23.6% |
| High School | 1,654 | 24.6% |
| College / Undergraduate | 1,202 | 17.9% |
| Graduate / Professional | 98 | 1.5% |
| Total | 6,710 | 100.0% |
School Enrollment by Age by Funding Source in East Chicago
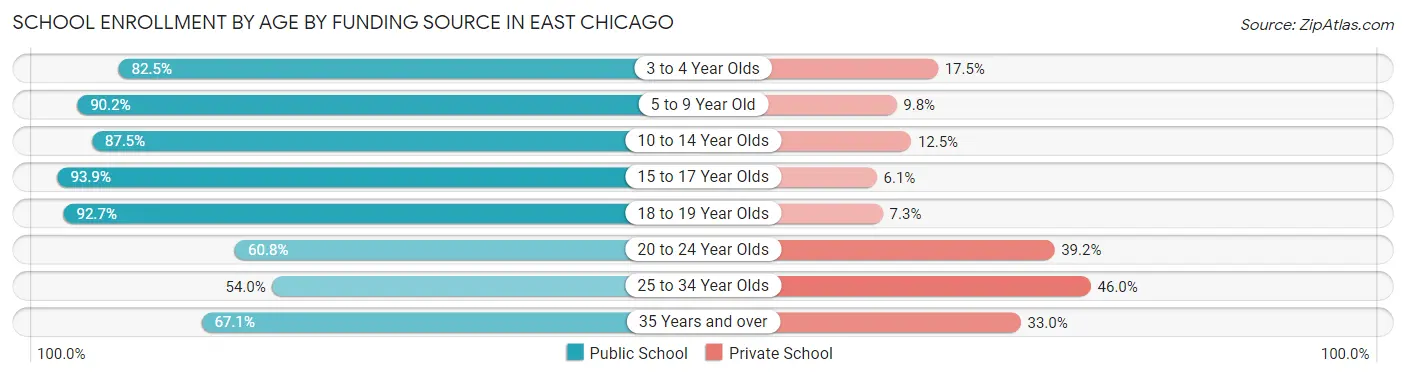
Out of a total of 6,710 students who are enrolled in schools in East Chicago, 1,013 (15.1%) attend a private institution, while the remaining 5,697 (84.9%) are enrolled in public schools. The age group of 25 to 34 year olds has the highest likelihood of being enrolled in private schools, with 161 (46.0% in the age bracket) enrolled. Conversely, the age group of 15 to 17 year olds has the lowest likelihood of being enrolled in a private school, with 1,056 (93.9% in the age bracket) attending a public institution.
| Age Bracket | Public School | Private School |
| 3 to 4 Year Olds | 278 (82.5%) | 59 (17.5%) |
| 5 to 9 Year Old | 1,452 (90.2%) | 158 (9.8%) |
| 10 to 14 Year Olds | 1,689 (87.5%) | 242 (12.5%) |
| 15 to 17 Year Olds | 1,056 (93.9%) | 69 (6.1%) |
| 18 to 19 Year Olds | 575 (92.7%) | 45 (7.3%) |
| 20 to 24 Year Olds | 341 (60.8%) | 220 (39.2%) |
| 25 to 34 Year Olds | 189 (54.0%) | 161 (46.0%) |
| 35 Years and over | 118 (67.0%) | 58 (33.0%) |
| Total | 5,697 (84.9%) | 1,013 (15.1%) |
Educational Attainment by Field of Study in East Chicago
Business (378 | 21.0%), education (340 | 18.9%), arts & humanities (333 | 18.5%), science & technology (114 | 6.3%), and social sciences (96 | 5.3%) are the most common fields of study among 1,800 individuals in East Chicago who have obtained a bachelor's degree or higher.
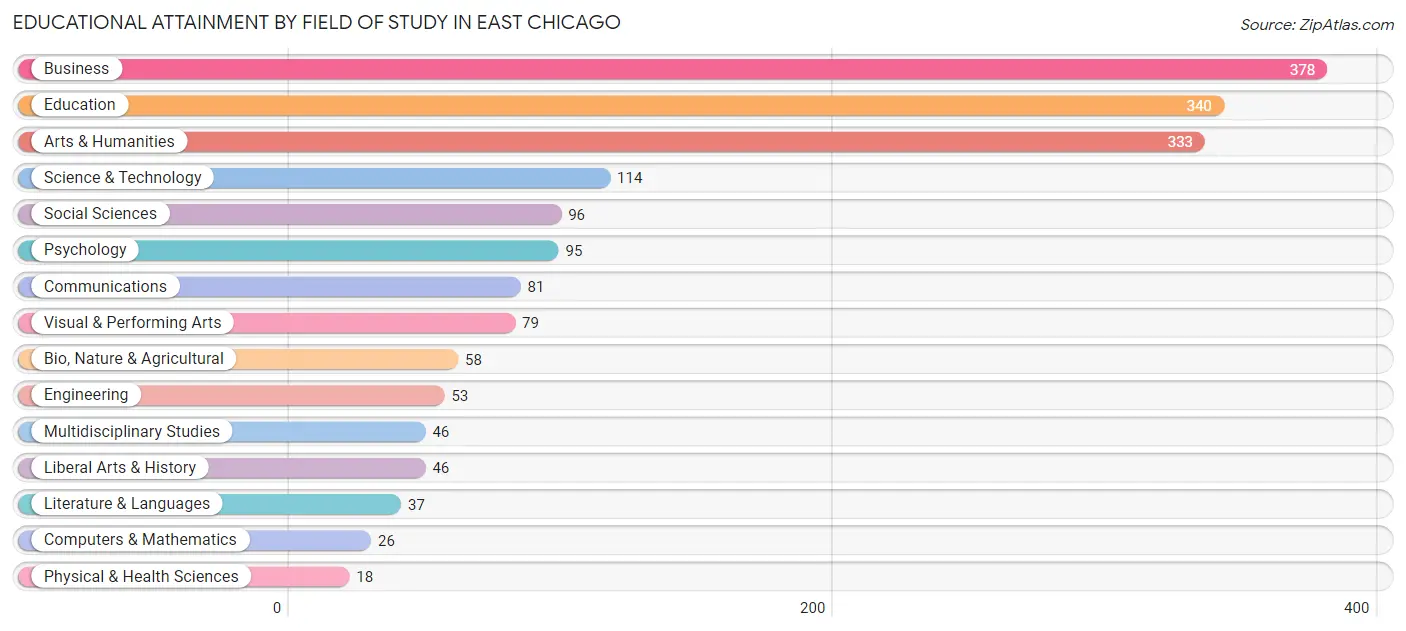
| Field of Study | # Graduates | % Graduates |
| Computers & Mathematics | 26 | 1.4% |
| Bio, Nature & Agricultural | 58 | 3.2% |
| Physical & Health Sciences | 18 | 1.0% |
| Psychology | 95 | 5.3% |
| Social Sciences | 96 | 5.3% |
| Engineering | 53 | 2.9% |
| Multidisciplinary Studies | 46 | 2.6% |
| Science & Technology | 114 | 6.3% |
| Business | 378 | 21.0% |
| Education | 340 | 18.9% |
| Literature & Languages | 37 | 2.1% |
| Liberal Arts & History | 46 | 2.6% |
| Visual & Performing Arts | 79 | 4.4% |
| Communications | 81 | 4.5% |
| Arts & Humanities | 333 | 18.5% |
| Total | 1,800 | 100.0% |
Transportation & Commute in East Chicago
Vehicle Availability by Sex in East Chicago
The most prevalent vehicle ownership categories in East Chicago are males with 2 vehicles (2,163, accounting for 37.2%) and females with 2 vehicles (1,343, making up 46.6%).
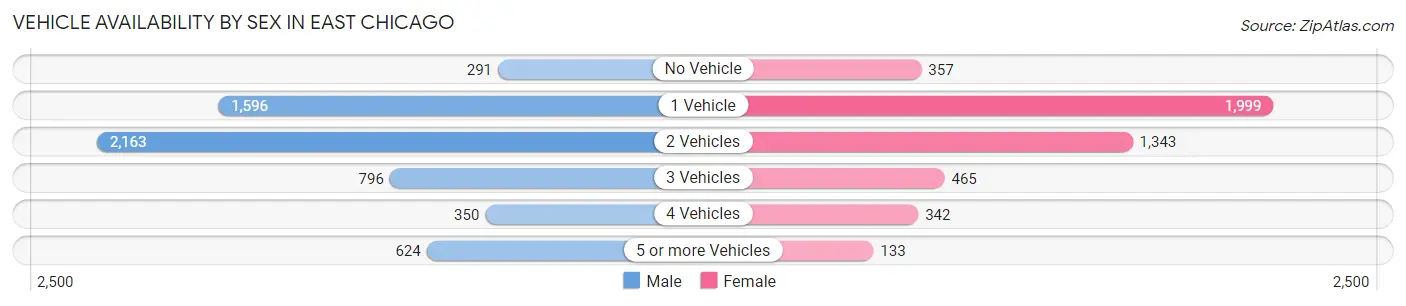
| Vehicles Available | Male | Female |
| No Vehicle | 291 (5.0%) | 357 (7.7%) |
| 1 Vehicle | 1,596 (27.4%) | 1,999 (43.1%) |
| 2 Vehicles | 2,163 (37.2%) | 1,343 (28.9%) |
| 3 Vehicles | 796 (13.7%) | 465 (10.0%) |
| 4 Vehicles | 350 (6.0%) | 342 (7.4%) |
| 5 or more Vehicles | 624 (10.7%) | 133 (2.9%) |
| Total | 5,820 (100.0%) | 4,639 (100.0%) |
Commute Time in East Chicago
The most frequently occuring commute durations in East Chicago are 5 to 9 minutes (1,671 commuters, 16.6%), 15 to 19 minutes (1,632 commuters, 16.2%), and 30 to 34 minutes (1,615 commuters, 16.0%).
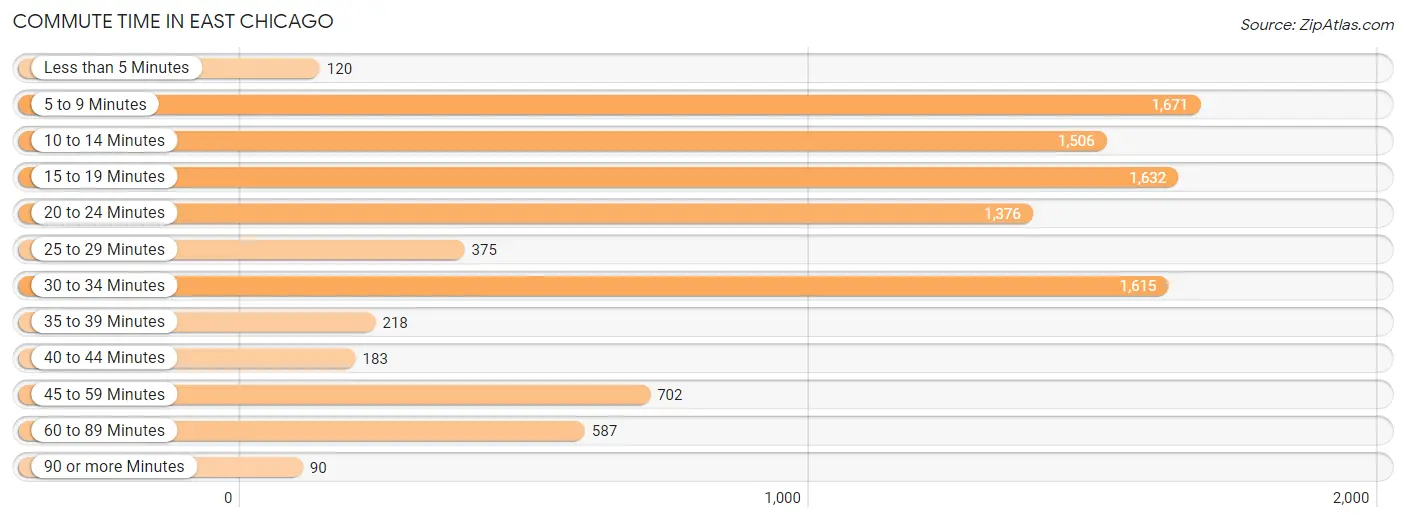
| Commute Time | # Commuters | % Commuters |
| Less than 5 Minutes | 120 | 1.2% |
| 5 to 9 Minutes | 1,671 | 16.6% |
| 10 to 14 Minutes | 1,506 | 14.9% |
| 15 to 19 Minutes | 1,632 | 16.2% |
| 20 to 24 Minutes | 1,376 | 13.7% |
| 25 to 29 Minutes | 375 | 3.7% |
| 30 to 34 Minutes | 1,615 | 16.0% |
| 35 to 39 Minutes | 218 | 2.2% |
| 40 to 44 Minutes | 183 | 1.8% |
| 45 to 59 Minutes | 702 | 7.0% |
| 60 to 89 Minutes | 587 | 5.8% |
| 90 or more Minutes | 90 | 0.9% |
Commute Time by Sex in East Chicago
The most common commute times in East Chicago are 30 to 34 minutes (921 commuters, 16.4%) for males and 5 to 9 minutes (953 commuters, 21.3%) for females.
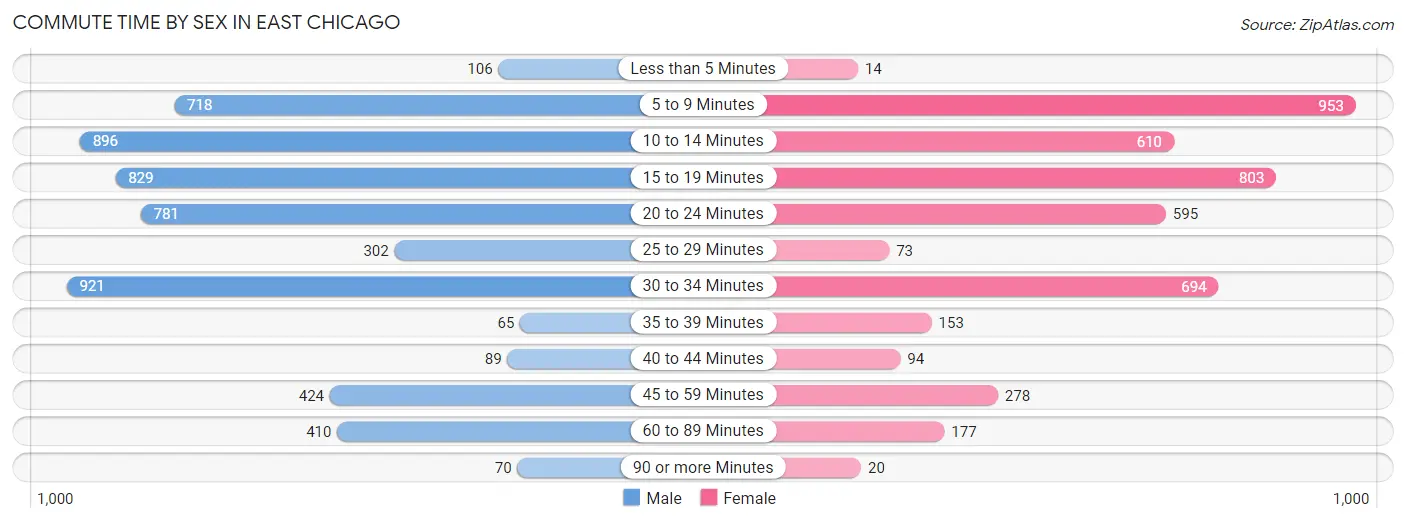
| Commute Time | Male | Female |
| Less than 5 Minutes | 106 (1.9%) | 14 (0.3%) |
| 5 to 9 Minutes | 718 (12.8%) | 953 (21.3%) |
| 10 to 14 Minutes | 896 (16.0%) | 610 (13.7%) |
| 15 to 19 Minutes | 829 (14.8%) | 803 (18.0%) |
| 20 to 24 Minutes | 781 (13.9%) | 595 (13.3%) |
| 25 to 29 Minutes | 302 (5.4%) | 73 (1.6%) |
| 30 to 34 Minutes | 921 (16.4%) | 694 (15.5%) |
| 35 to 39 Minutes | 65 (1.2%) | 153 (3.4%) |
| 40 to 44 Minutes | 89 (1.6%) | 94 (2.1%) |
| 45 to 59 Minutes | 424 (7.6%) | 278 (6.2%) |
| 60 to 89 Minutes | 410 (7.3%) | 177 (4.0%) |
| 90 or more Minutes | 70 (1.3%) | 20 (0.4%) |
Time of Departure to Work by Sex in East Chicago
The most frequent times of departure to work in East Chicago are 6:00 AM to 6:29 AM (674, 12.0%) for males and 7:30 AM to 7:59 AM (661, 14.8%) for females.
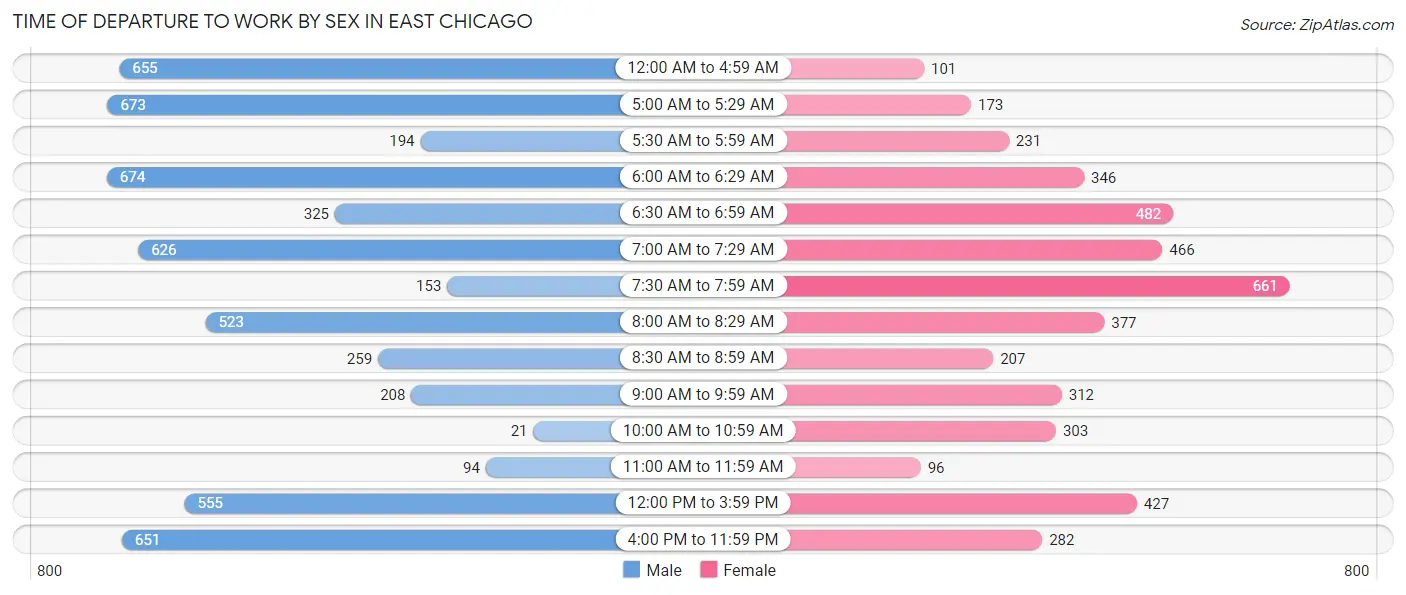
| Time of Departure | Male | Female |
| 12:00 AM to 4:59 AM | 655 (11.7%) | 101 (2.3%) |
| 5:00 AM to 5:29 AM | 673 (12.0%) | 173 (3.9%) |
| 5:30 AM to 5:59 AM | 194 (3.5%) | 231 (5.2%) |
| 6:00 AM to 6:29 AM | 674 (12.0%) | 346 (7.7%) |
| 6:30 AM to 6:59 AM | 325 (5.8%) | 482 (10.8%) |
| 7:00 AM to 7:29 AM | 626 (11.2%) | 466 (10.4%) |
| 7:30 AM to 7:59 AM | 153 (2.7%) | 661 (14.8%) |
| 8:00 AM to 8:29 AM | 523 (9.3%) | 377 (8.5%) |
| 8:30 AM to 8:59 AM | 259 (4.6%) | 207 (4.6%) |
| 9:00 AM to 9:59 AM | 208 (3.7%) | 312 (7.0%) |
| 10:00 AM to 10:59 AM | 21 (0.4%) | 303 (6.8%) |
| 11:00 AM to 11:59 AM | 94 (1.7%) | 96 (2.1%) |
| 12:00 PM to 3:59 PM | 555 (9.9%) | 427 (9.6%) |
| 4:00 PM to 11:59 PM | 651 (11.6%) | 282 (6.3%) |
| Total | 5,611 (100.0%) | 4,464 (100.0%) |
Housing Occupancy in East Chicago
Occupancy by Ownership in East Chicago
Of the total 10,147 dwellings in East Chicago, owner-occupied units account for 4,447 (43.8%), while renter-occupied units make up 5,700 (56.2%).
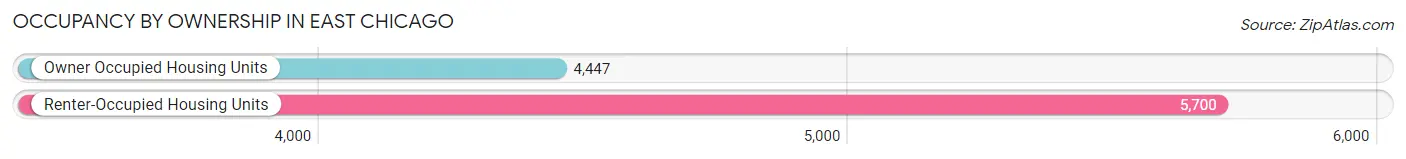
| Occupancy | # Housing Units | % Housing Units |
| Owner Occupied Housing Units | 4,447 | 43.8% |
| Renter-Occupied Housing Units | 5,700 | 56.2% |
| Total Occupied Housing Units | 10,147 | 100.0% |
Occupancy by Household Size in East Chicago
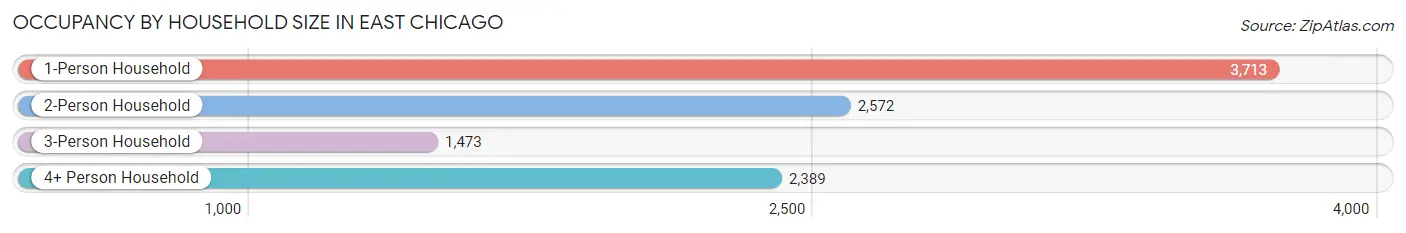
| Household Size | # Housing Units | % Housing Units |
| 1-Person Household | 3,713 | 36.6% |
| 2-Person Household | 2,572 | 25.4% |
| 3-Person Household | 1,473 | 14.5% |
| 4+ Person Household | 2,389 | 23.5% |
| Total Housing Units | 10,147 | 100.0% |
Occupancy by Ownership by Household Size in East Chicago
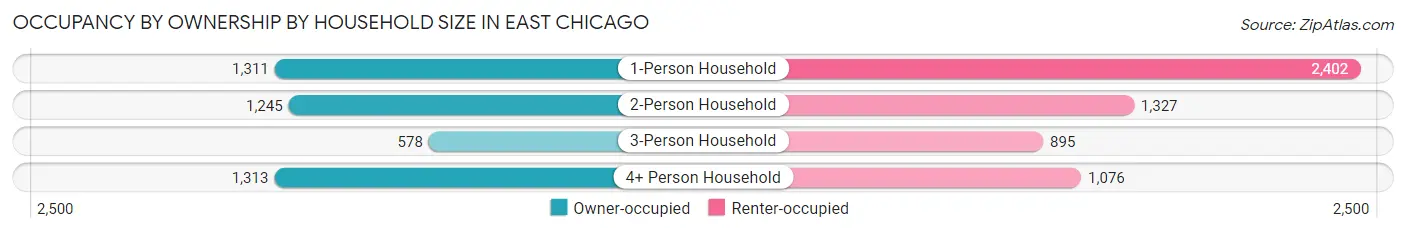
| Household Size | Owner-occupied | Renter-occupied |
| 1-Person Household | 1,311 (35.3%) | 2,402 (64.7%) |
| 2-Person Household | 1,245 (48.4%) | 1,327 (51.6%) |
| 3-Person Household | 578 (39.2%) | 895 (60.8%) |
| 4+ Person Household | 1,313 (55.0%) | 1,076 (45.0%) |
| Total Housing Units | 4,447 (43.8%) | 5,700 (56.2%) |
Occupancy by Educational Attainment in East Chicago
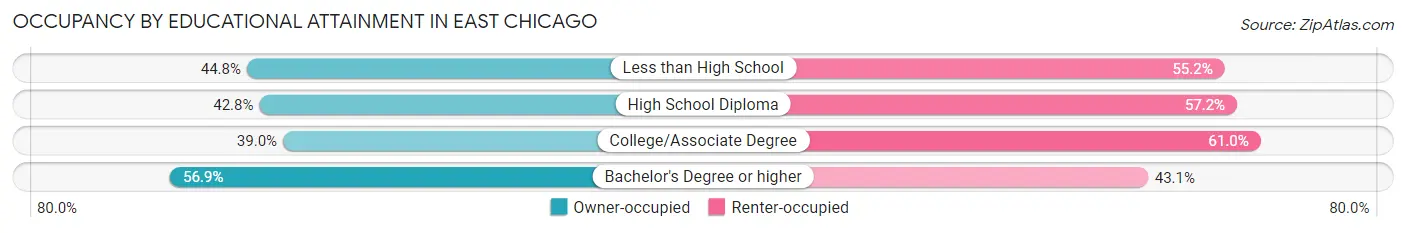
| Household Size | Owner-occupied | Renter-occupied |
| Less than High School | 1,136 (44.8%) | 1,402 (55.2%) |
| High School Diploma | 1,651 (42.8%) | 2,208 (57.2%) |
| College/Associate Degree | 1,035 (39.0%) | 1,617 (61.0%) |
| Bachelor's Degree or higher | 625 (56.9%) | 473 (43.1%) |
Occupancy by Age of Householder in East Chicago
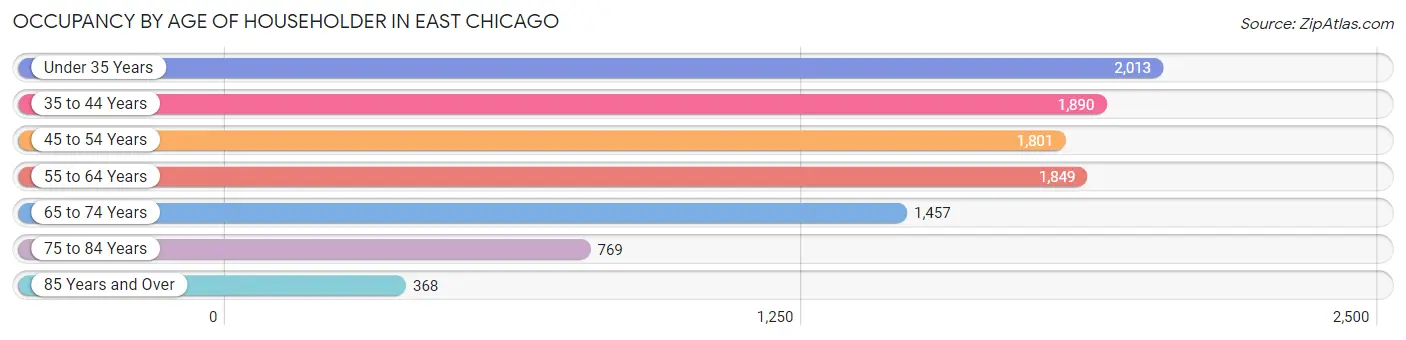
| Age Bracket | # Households | % Households |
| Under 35 Years | 2,013 | 19.8% |
| 35 to 44 Years | 1,890 | 18.6% |
| 45 to 54 Years | 1,801 | 17.7% |
| 55 to 64 Years | 1,849 | 18.2% |
| 65 to 74 Years | 1,457 | 14.4% |
| 75 to 84 Years | 769 | 7.6% |
| 85 Years and Over | 368 | 3.6% |
| Total | 10,147 | 100.0% |
Housing Finances in East Chicago
Median Income by Occupancy in East Chicago
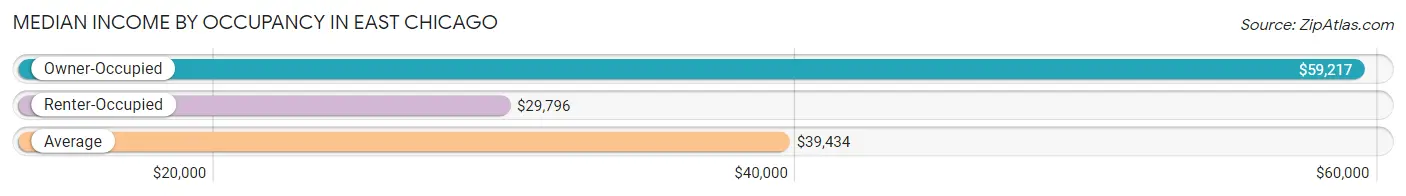
| Occupancy Type | # Households | Median Income |
| Owner-Occupied | 4,447 (43.8%) | $59,217 |
| Renter-Occupied | 5,700 (56.2%) | $29,796 |
| Average | 10,147 (100.0%) | $39,434 |
Occupancy by Householder Income Bracket in East Chicago
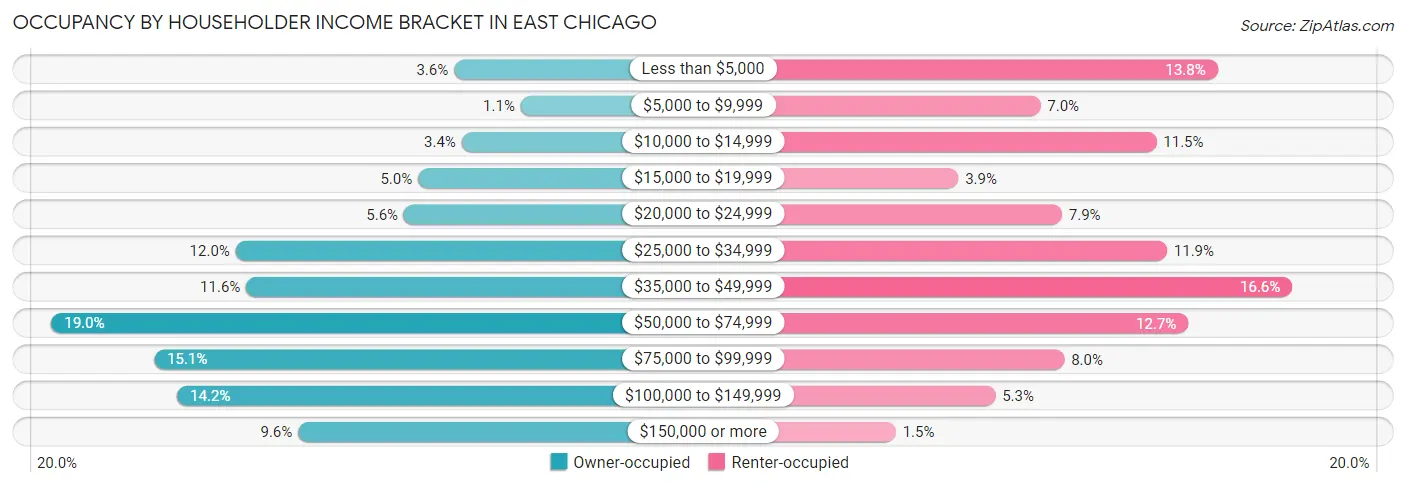
| Income Bracket | Owner-occupied | Renter-occupied |
| Less than $5,000 | 162 (3.6%) | 786 (13.8%) |
| $5,000 to $9,999 | 49 (1.1%) | 401 (7.0%) |
| $10,000 to $14,999 | 149 (3.4%) | 653 (11.5%) |
| $15,000 to $19,999 | 223 (5.0%) | 223 (3.9%) |
| $20,000 to $24,999 | 247 (5.6%) | 448 (7.9%) |
| $25,000 to $34,999 | 532 (12.0%) | 676 (11.9%) |
| $35,000 to $49,999 | 514 (11.6%) | 948 (16.6%) |
| $50,000 to $74,999 | 844 (19.0%) | 722 (12.7%) |
| $75,000 to $99,999 | 670 (15.1%) | 453 (8.0%) |
| $100,000 to $149,999 | 631 (14.2%) | 303 (5.3%) |
| $150,000 or more | 426 (9.6%) | 87 (1.5%) |
| Total | 4,447 (100.0%) | 5,700 (100.0%) |
Monthly Housing Cost Tiers in East Chicago
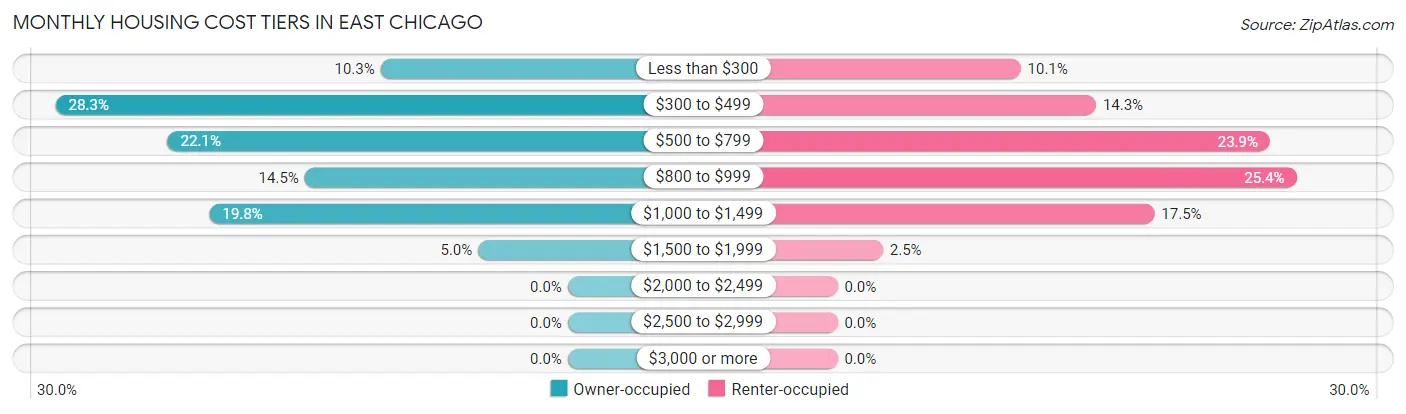
| Monthly Cost | Owner-occupied | Renter-occupied |
| Less than $300 | 460 (10.3%) | 577 (10.1%) |
| $300 to $499 | 1,258 (28.3%) | 814 (14.3%) |
| $500 to $799 | 983 (22.1%) | 1,361 (23.9%) |
| $800 to $999 | 646 (14.5%) | 1,445 (25.4%) |
| $1,000 to $1,499 | 880 (19.8%) | 998 (17.5%) |
| $1,500 to $1,999 | 220 (5.0%) | 143 (2.5%) |
| $2,000 to $2,499 | 0 (0.0%) | 0 (0.0%) |
| $2,500 to $2,999 | 0 (0.0%) | 0 (0.0%) |
| $3,000 or more | 0 (0.0%) | 0 (0.0%) |
| Total | 4,447 (100.0%) | 5,700 (100.0%) |
Physical Housing Characteristics in East Chicago
Housing Structures in East Chicago
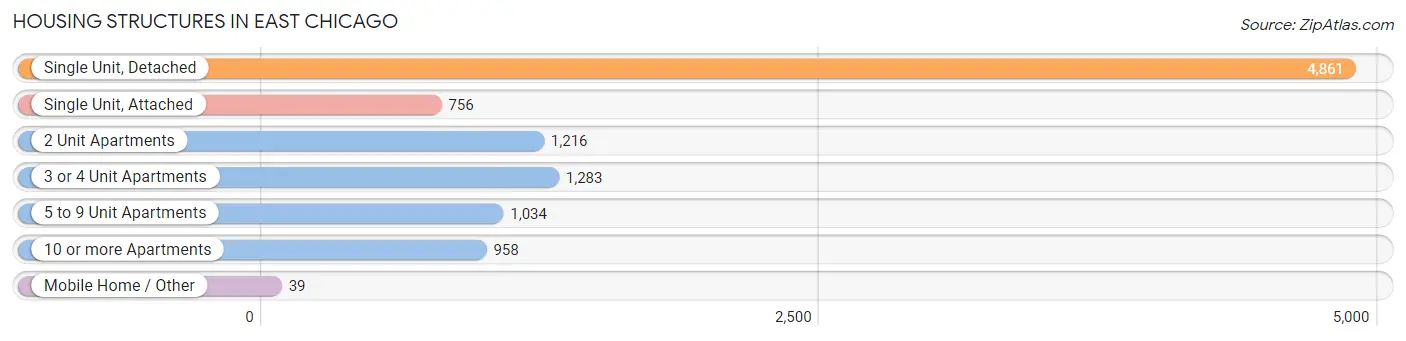
| Structure Type | # Housing Units | % Housing Units |
| Single Unit, Detached | 4,861 | 47.9% |
| Single Unit, Attached | 756 | 7.4% |
| 2 Unit Apartments | 1,216 | 12.0% |
| 3 or 4 Unit Apartments | 1,283 | 12.6% |
| 5 to 9 Unit Apartments | 1,034 | 10.2% |
| 10 or more Apartments | 958 | 9.4% |
| Mobile Home / Other | 39 | 0.4% |
| Total | 10,147 | 100.0% |
Housing Structures by Occupancy in East Chicago
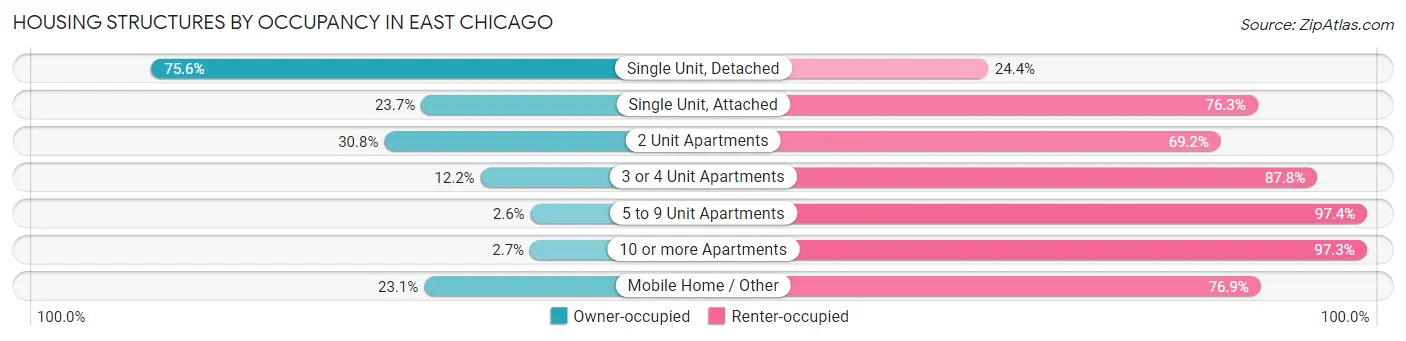
| Structure Type | Owner-occupied | Renter-occupied |
| Single Unit, Detached | 3,675 (75.6%) | 1,186 (24.4%) |
| Single Unit, Attached | 179 (23.7%) | 577 (76.3%) |
| 2 Unit Apartments | 374 (30.8%) | 842 (69.2%) |
| 3 or 4 Unit Apartments | 157 (12.2%) | 1,126 (87.8%) |
| 5 to 9 Unit Apartments | 27 (2.6%) | 1,007 (97.4%) |
| 10 or more Apartments | 26 (2.7%) | 932 (97.3%) |
| Mobile Home / Other | 9 (23.1%) | 30 (76.9%) |
| Total | 4,447 (43.8%) | 5,700 (56.2%) |
Housing Structures by Number of Rooms in East Chicago
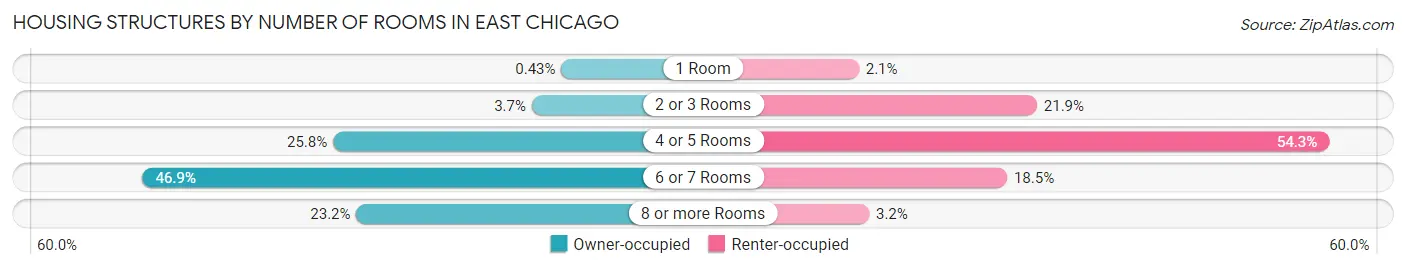
| Number of Rooms | Owner-occupied | Renter-occupied |
| 1 Room | 19 (0.4%) | 119 (2.1%) |
| 2 or 3 Rooms | 165 (3.7%) | 1,246 (21.9%) |
| 4 or 5 Rooms | 1,146 (25.8%) | 3,094 (54.3%) |
| 6 or 7 Rooms | 2,086 (46.9%) | 1,057 (18.5%) |
| 8 or more Rooms | 1,031 (23.2%) | 184 (3.2%) |
| Total | 4,447 (100.0%) | 5,700 (100.0%) |
Housing Structure by Heating Type in East Chicago
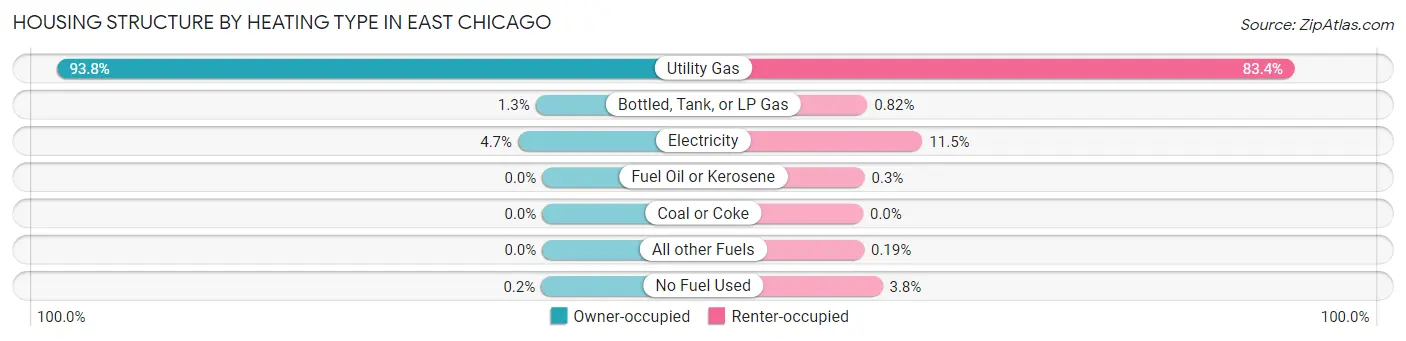
| Heating Type | Owner-occupied | Renter-occupied |
| Utility Gas | 4,173 (93.8%) | 4,756 (83.4%) |
| Bottled, Tank, or LP Gas | 57 (1.3%) | 47 (0.8%) |
| Electricity | 208 (4.7%) | 654 (11.5%) |
| Fuel Oil or Kerosene | 0 (0.0%) | 17 (0.3%) |
| Coal or Coke | 0 (0.0%) | 0 (0.0%) |
| All other Fuels | 0 (0.0%) | 11 (0.2%) |
| No Fuel Used | 9 (0.2%) | 215 (3.8%) |
| Total | 4,447 (100.0%) | 5,700 (100.0%) |
Household Vehicle Usage in East Chicago
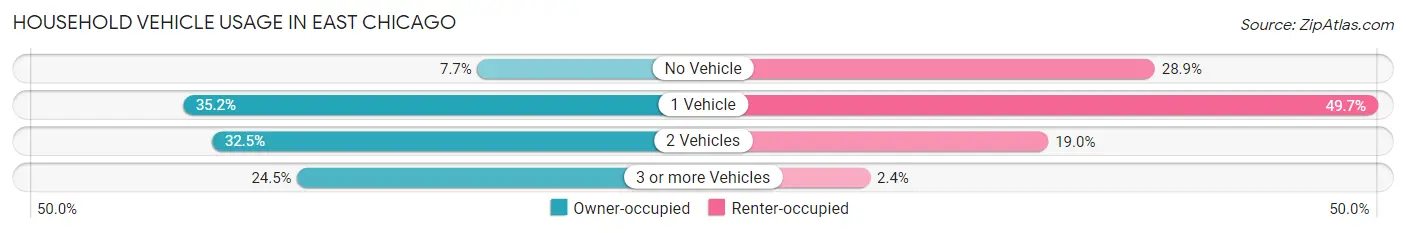
| Vehicles per Household | Owner-occupied | Renter-occupied |
| No Vehicle | 343 (7.7%) | 1,649 (28.9%) |
| 1 Vehicle | 1,567 (35.2%) | 2,835 (49.7%) |
| 2 Vehicles | 1,446 (32.5%) | 1,082 (19.0%) |
| 3 or more Vehicles | 1,091 (24.5%) | 134 (2.4%) |
| Total | 4,447 (100.0%) | 5,700 (100.0%) |
Real Estate & Mortgages in East Chicago
Real Estate and Mortgage Overview in East Chicago
| Characteristic | Without Mortgage | With Mortgage |
| Housing Units | 2,550 | 1,897 |
| Median Property Value | $75,600 | $97,400 |
| Median Household Income | $49,405 | $198 |
| Monthly Housing Costs | $441 | $0 |
| Real Estate Taxes | $902 | $60 |
Property Value by Mortgage Status in East Chicago
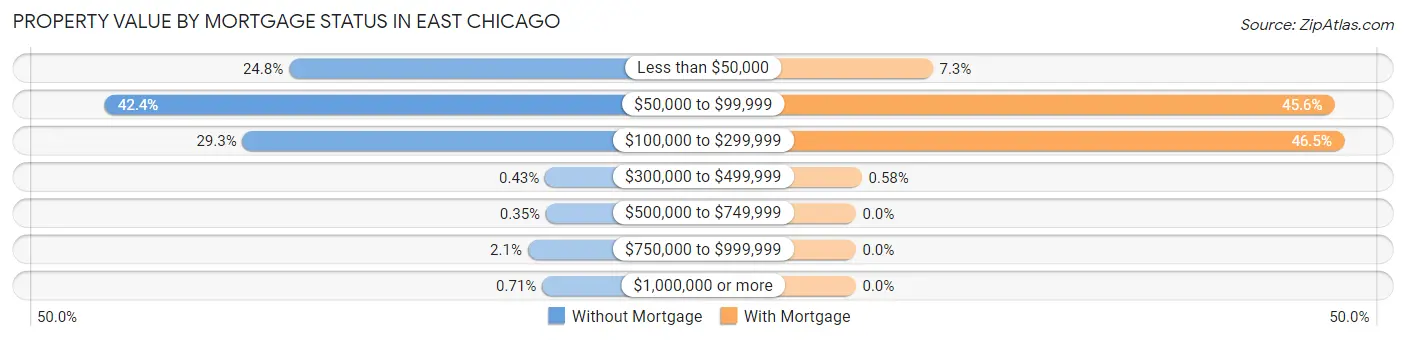
| Property Value | Without Mortgage | With Mortgage |
| Less than $50,000 | 633 (24.8%) | 139 (7.3%) |
| $50,000 to $99,999 | 1,080 (42.3%) | 865 (45.6%) |
| $100,000 to $299,999 | 746 (29.2%) | 882 (46.5%) |
| $300,000 to $499,999 | 11 (0.4%) | 11 (0.6%) |
| $500,000 to $749,999 | 9 (0.4%) | 0 (0.0%) |
| $750,000 to $999,999 | 53 (2.1%) | 0 (0.0%) |
| $1,000,000 or more | 18 (0.7%) | 0 (0.0%) |
| Total | 2,550 (100.0%) | 1,897 (100.0%) |
Household Income by Mortgage Status in East Chicago
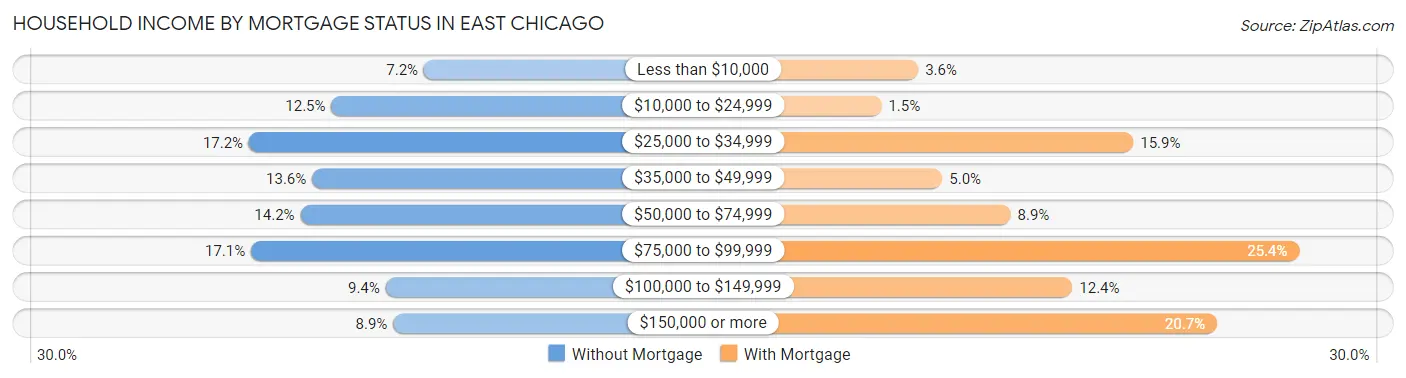
| Household Income | Without Mortgage | With Mortgage |
| Less than $10,000 | 183 (7.2%) | 68 (3.6%) |
| $10,000 to $24,999 | 318 (12.5%) | 28 (1.5%) |
| $25,000 to $34,999 | 438 (17.2%) | 301 (15.9%) |
| $35,000 to $49,999 | 346 (13.6%) | 94 (5.0%) |
| $50,000 to $74,999 | 363 (14.2%) | 168 (8.9%) |
| $75,000 to $99,999 | 435 (17.1%) | 481 (25.4%) |
| $100,000 to $149,999 | 239 (9.4%) | 235 (12.4%) |
| $150,000 or more | 228 (8.9%) | 392 (20.7%) |
| Total | 2,550 (100.0%) | 1,897 (100.0%) |
Property Value to Household Income Ratio in East Chicago
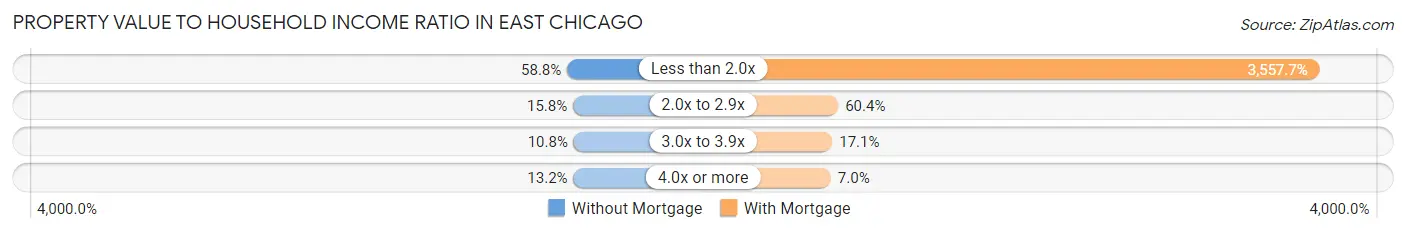
| Value-to-Income Ratio | Without Mortgage | With Mortgage |
| Less than 2.0x | 1,499 (58.8%) | 67,490 (3,557.7%) |
| 2.0x to 2.9x | 404 (15.8%) | 1,145 (60.4%) |
| 3.0x to 3.9x | 275 (10.8%) | 325 (17.1%) |
| 4.0x or more | 337 (13.2%) | 132 (7.0%) |
| Total | 2,550 (100.0%) | 1,897 (100.0%) |
Real Estate Taxes by Mortgage Status in East Chicago
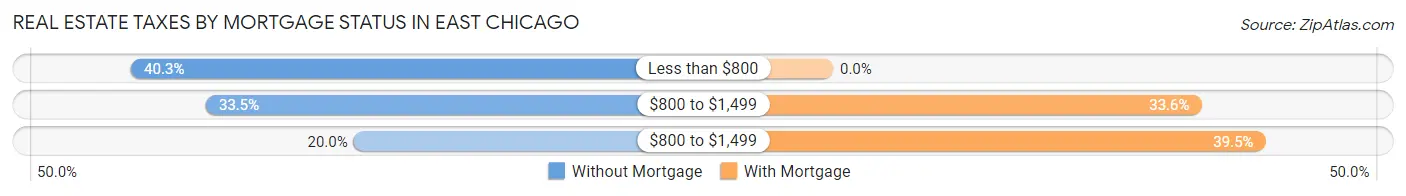
| Property Taxes | Without Mortgage | With Mortgage |
| Less than $800 | 1,027 (40.3%) | 0 (0.0%) |
| $800 to $1,499 | 853 (33.5%) | 638 (33.6%) |
| $800 to $1,499 | 509 (20.0%) | 749 (39.5%) |
| Total | 2,550 (100.0%) | 1,897 (100.0%) |
Health & Disability in East Chicago
Health Insurance Coverage by Age in East Chicago
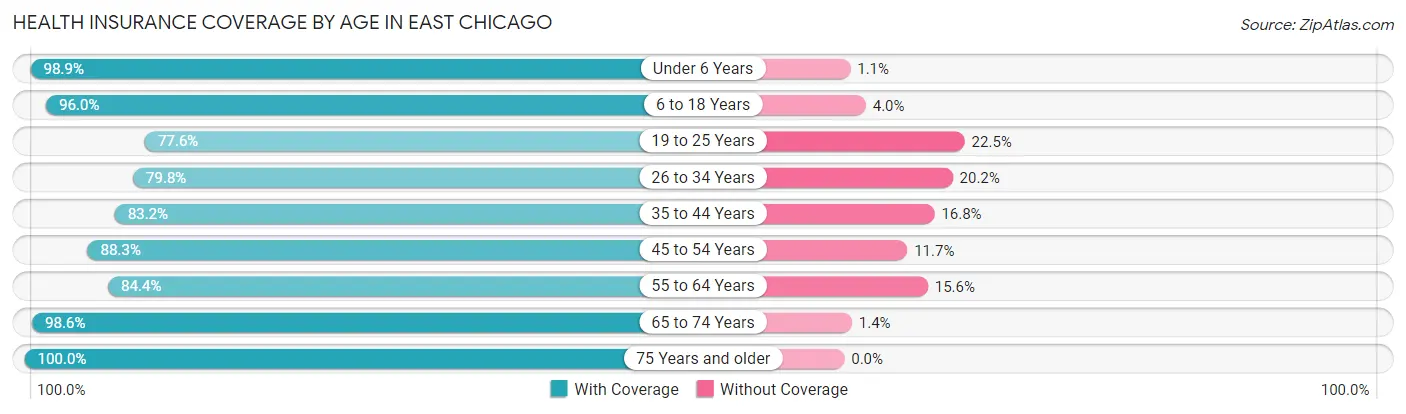
| Age Bracket | With Coverage | Without Coverage |
| Under 6 Years | 2,113 (98.9%) | 24 (1.1%) |
| 6 to 18 Years | 4,766 (96.0%) | 199 (4.0%) |
| 19 to 25 Years | 1,896 (77.5%) | 549 (22.5%) |
| 26 to 34 Years | 2,504 (79.8%) | 634 (20.2%) |
| 35 to 44 Years | 3,059 (83.2%) | 618 (16.8%) |
| 45 to 54 Years | 2,743 (88.3%) | 365 (11.7%) |
| 55 to 64 Years | 2,446 (84.4%) | 451 (15.6%) |
| 65 to 74 Years | 2,310 (98.6%) | 33 (1.4%) |
| 75 Years and older | 1,559 (100.0%) | 0 (0.0%) |
| Total | 23,396 (89.1%) | 2,873 (10.9%) |
Health Insurance Coverage by Citizenship Status in East Chicago

| Citizenship Status | With Coverage | Without Coverage |
| Native Born | 2,113 (98.9%) | 24 (1.1%) |
| Foreign Born, Citizen | 4,766 (96.0%) | 199 (4.0%) |
| Foreign Born, not a Citizen | 1,896 (77.5%) | 549 (22.5%) |
Health Insurance Coverage by Household Income in East Chicago
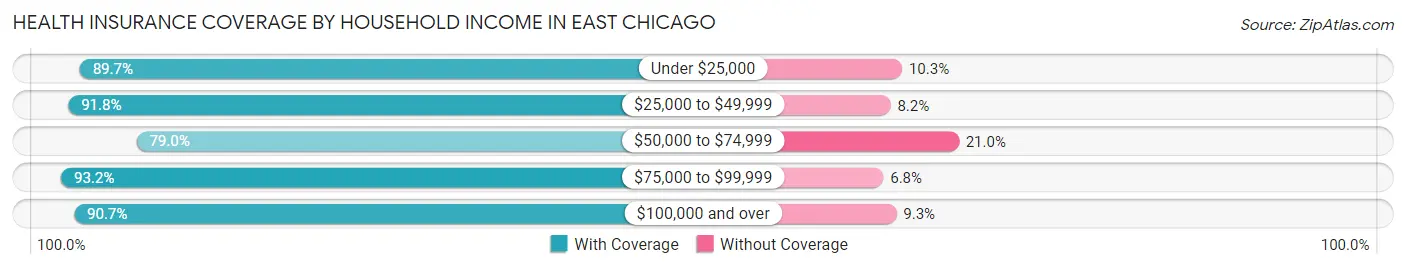
| Household Income | With Coverage | Without Coverage |
| Under $25,000 | 5,133 (89.7%) | 592 (10.3%) |
| $25,000 to $49,999 | 5,962 (91.8%) | 531 (8.2%) |
| $50,000 to $74,999 | 3,666 (79.0%) | 973 (21.0%) |
| $75,000 to $99,999 | 3,690 (93.2%) | 271 (6.8%) |
| $100,000 and over | 4,925 (90.7%) | 504 (9.3%) |
Public vs Private Health Insurance Coverage by Age in East Chicago
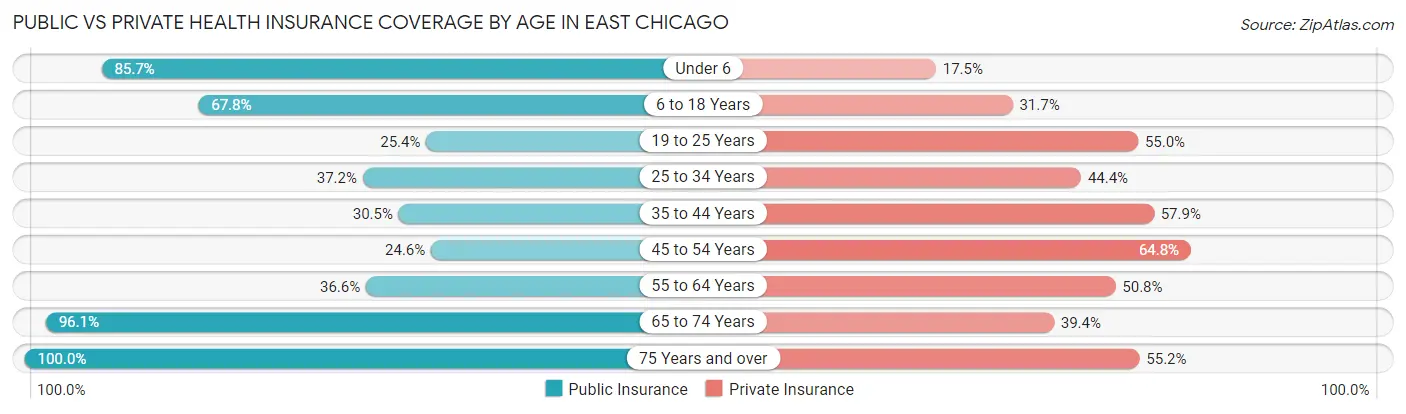
| Age Bracket | Public Insurance | Private Insurance |
| Under 6 | 1,832 (85.7%) | 373 (17.4%) |
| 6 to 18 Years | 3,364 (67.7%) | 1,573 (31.7%) |
| 19 to 25 Years | 622 (25.4%) | 1,344 (55.0%) |
| 25 to 34 Years | 1,168 (37.2%) | 1,393 (44.4%) |
| 35 to 44 Years | 1,123 (30.5%) | 2,129 (57.9%) |
| 45 to 54 Years | 763 (24.5%) | 2,014 (64.8%) |
| 55 to 64 Years | 1,061 (36.6%) | 1,471 (50.8%) |
| 65 to 74 Years | 2,251 (96.1%) | 922 (39.4%) |
| 75 Years and over | 1,559 (100.0%) | 861 (55.2%) |
| Total | 13,743 (52.3%) | 12,080 (46.0%) |
Disability Status by Sex by Age in East Chicago
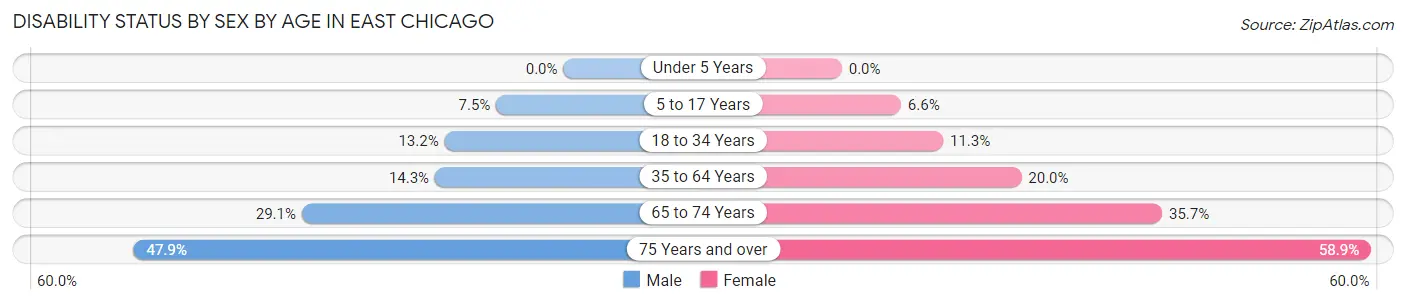
| Age Bracket | Male | Female |
| Under 5 Years | 0 (0.0%) | 0 (0.0%) |
| 5 to 17 Years | 190 (7.5%) | 156 (6.6%) |
| 18 to 34 Years | 411 (13.2%) | 329 (11.3%) |
| 35 to 64 Years | 664 (14.3%) | 1,008 (20.0%) |
| 65 to 74 Years | 333 (29.1%) | 428 (35.7%) |
| 75 Years and over | 336 (47.9%) | 505 (58.9%) |
Disability Class by Sex by Age in East Chicago
Disability Class: Hearing Difficulty
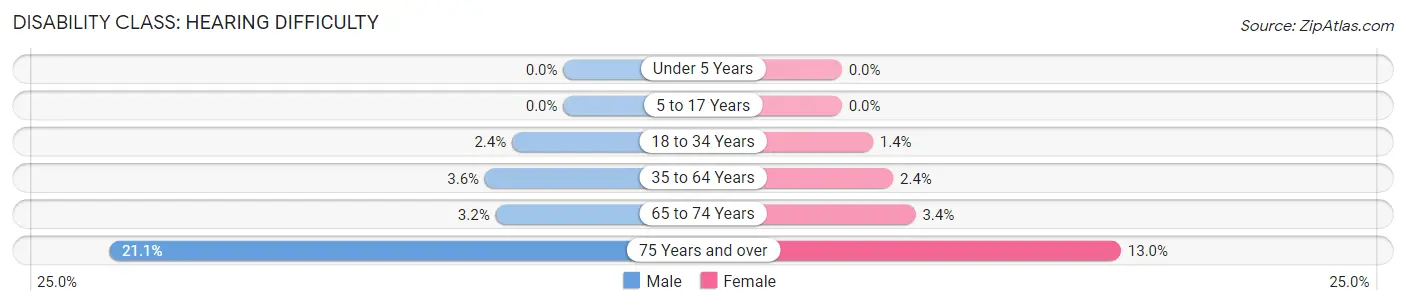
| Age Bracket | Male | Female |
| Under 5 Years | 0 (0.0%) | 0 (0.0%) |
| 5 to 17 Years | 0 (0.0%) | 0 (0.0%) |
| 18 to 34 Years | 74 (2.4%) | 42 (1.4%) |
| 35 to 64 Years | 169 (3.6%) | 120 (2.4%) |
| 65 to 74 Years | 36 (3.2%) | 41 (3.4%) |
| 75 Years and over | 148 (21.1%) | 111 (13.0%) |
Disability Class: Vision Difficulty
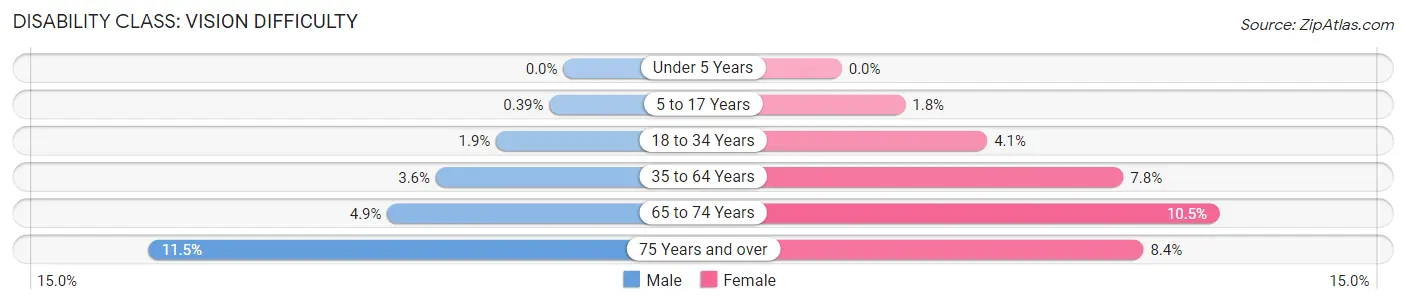
| Age Bracket | Male | Female |
| Under 5 Years | 0 (0.0%) | 0 (0.0%) |
| 5 to 17 Years | 10 (0.4%) | 42 (1.8%) |
| 18 to 34 Years | 58 (1.9%) | 118 (4.1%) |
| 35 to 64 Years | 165 (3.5%) | 395 (7.8%) |
| 65 to 74 Years | 56 (4.9%) | 126 (10.5%) |
| 75 Years and over | 81 (11.5%) | 72 (8.4%) |
Disability Class: Cognitive Difficulty
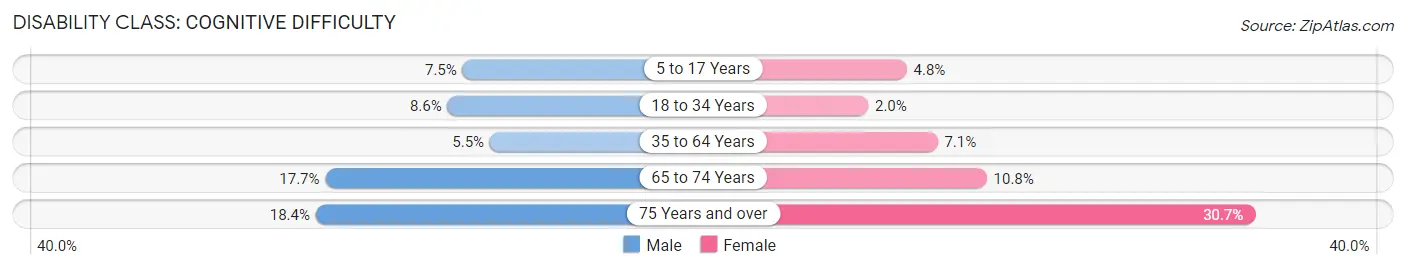
| Age Bracket | Male | Female |
| 5 to 17 Years | 190 (7.5%) | 114 (4.8%) |
| 18 to 34 Years | 267 (8.6%) | 57 (1.9%) |
| 35 to 64 Years | 253 (5.4%) | 358 (7.1%) |
| 65 to 74 Years | 202 (17.7%) | 129 (10.7%) |
| 75 Years and over | 129 (18.4%) | 263 (30.7%) |
Disability Class: Ambulatory Difficulty
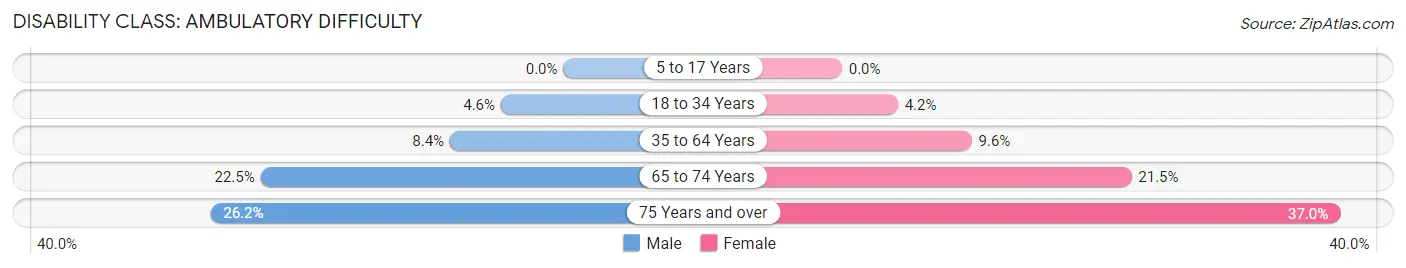
| Age Bracket | Male | Female |
| 5 to 17 Years | 0 (0.0%) | 0 (0.0%) |
| 18 to 34 Years | 144 (4.6%) | 121 (4.2%) |
| 35 to 64 Years | 391 (8.4%) | 486 (9.6%) |
| 65 to 74 Years | 257 (22.5%) | 258 (21.5%) |
| 75 Years and over | 184 (26.2%) | 317 (37.0%) |
Disability Class: Self-Care Difficulty
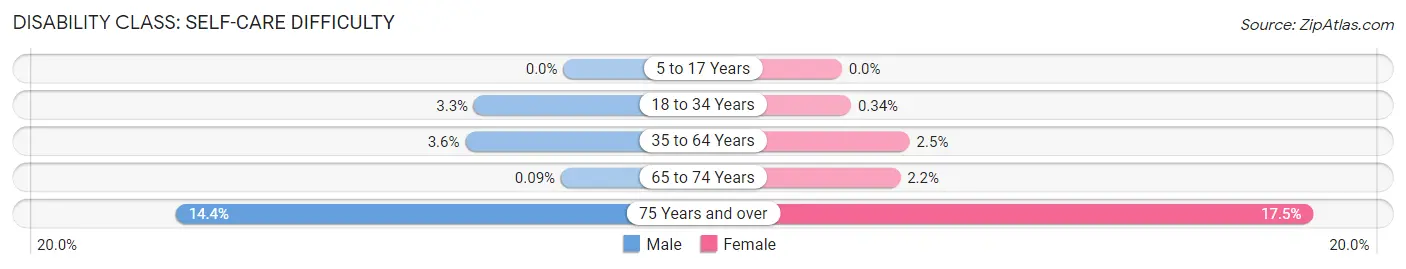
| Age Bracket | Male | Female |
| 5 to 17 Years | 0 (0.0%) | 0 (0.0%) |
| 18 to 34 Years | 103 (3.3%) | 10 (0.3%) |
| 35 to 64 Years | 169 (3.6%) | 127 (2.5%) |
| 65 to 74 Years | 1 (0.1%) | 26 (2.2%) |
| 75 Years and over | 101 (14.4%) | 150 (17.5%) |
Technology Access in East Chicago
Computing Device Access in East Chicago
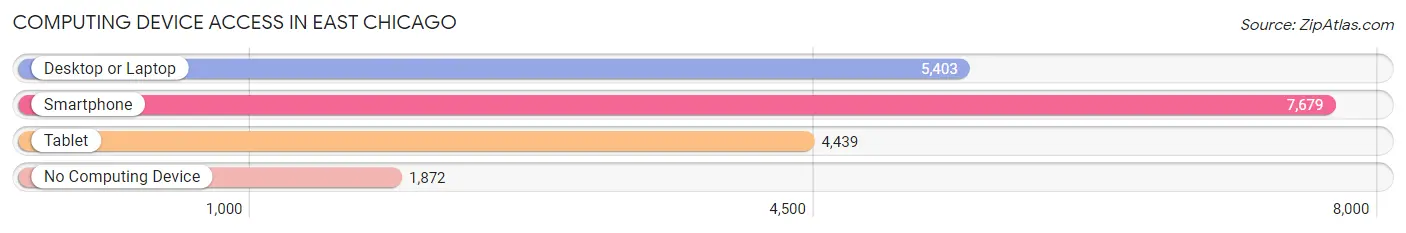
| Device Type | # Households | % Households |
| Desktop or Laptop | 5,403 | 53.2% |
| Smartphone | 7,679 | 75.7% |
| Tablet | 4,439 | 43.8% |
| No Computing Device | 1,872 | 18.4% |
| Total | 10,147 | 100.0% |
Internet Access in East Chicago
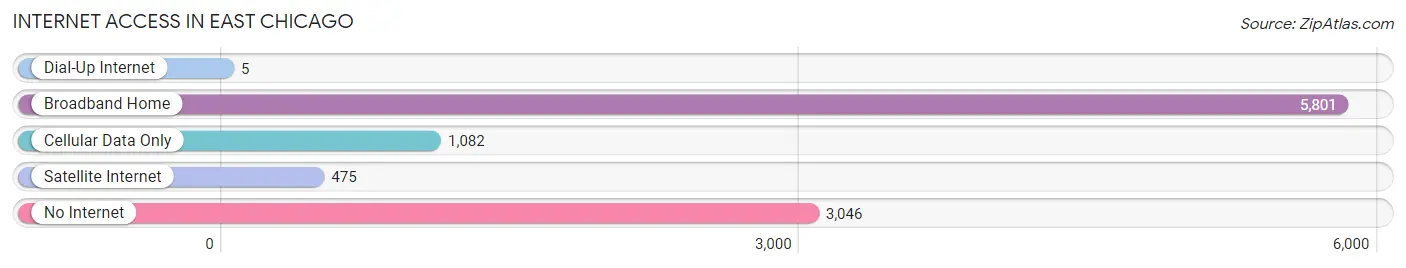
| Internet Type | # Households | % Households |
| Dial-Up Internet | 5 | 0.1% |
| Broadband Home | 5,801 | 57.2% |
| Cellular Data Only | 1,082 | 10.7% |
| Satellite Internet | 475 | 4.7% |
| No Internet | 3,046 | 30.0% |
| Total | 10,147 | 100.0% |
East Chicago Summary
History
East Chicago, Indiana is a city located in Lake County, Indiana, United States. It is part of the Chicago metropolitan area. The city was founded in 1889 and incorporated in 1893. It is located on the southern shore of Lake Michigan, just east of the Indiana-Illinois state line.
East Chicago was originally a small farming community, but it quickly grew into an industrial center due to its proximity to the steel mills of Gary, Indiana. The city was home to several steel mills, including the Inland Steel Company, which was the largest employer in the city. The steel industry provided jobs for thousands of East Chicago residents, and the city’s population grew rapidly.
In the early 20th century, East Chicago was a major center of immigration. Many immigrants from Eastern Europe, including Poles, Ukrainians, and Lithuanians, settled in the city. These immigrants brought with them their own culture and traditions, which have had a lasting impact on the city.
In the 1950s, East Chicago experienced a period of rapid growth and development. The city’s population increased from around 30,000 in 1950 to over 70,000 in 1960. This growth was largely due to the influx of African-American residents from the South, who were attracted to the city’s industrial jobs.
In the late 1960s and early 1970s, East Chicago experienced a period of economic decline. The steel industry began to decline, and many of the city’s factories closed. This led to a decrease in the city’s population, as many residents moved away in search of better job opportunities.
In the 1980s, East Chicago began to experience a period of revitalization. The city’s population began to increase again, and new businesses began to open. The city also began to attract new residents, including many Hispanic immigrants.
Today, East Chicago is a diverse city with a population of around 29,000. The city is home to a variety of businesses, including manufacturing, retail, and healthcare. The city is also home to several universities, including Purdue University Northwest and Indiana University Northwest.
Geography
East Chicago is located in Lake County, Indiana, on the southern shore of Lake Michigan. The city is bordered by the cities of Hammond to the west, Gary to the north, and Whiting to the east. The city is located approximately 25 miles southeast of downtown Chicago.
The city has a total area of 8.3 square miles, of which 8.2 square miles is land and 0.1 square miles is water. The city is located at an elevation of 590 feet above sea level.
The climate in East Chicago is classified as humid continental, with hot, humid summers and cold, snowy winters. The average temperature in the summer is around 75 degrees Fahrenheit, and the average temperature in the winter is around 25 degrees Fahrenheit.
Economy
East Chicago’s economy is largely based on manufacturing and retail. The city is home to several large manufacturing companies, including ArcelorMittal, U.S. Steel, and Inland Steel. These companies provide jobs for thousands of East Chicago residents.
The city is also home to several retail businesses, including grocery stores, restaurants, and clothing stores. The city’s retail sector is largely supported by the nearby cities of Gary and Hammond.
East Chicago is also home to several universities, including Purdue University Northwest and Indiana University Northwest. These universities provide jobs for faculty and staff, as well as educational opportunities for students.
Demographics
As of the 2010 census, East Chicago had a population of 29,698. The racial makeup of the city was 57.3% African American, 28.2% White, 0.5% Native American, 0.7% Asian, 0.1% Pacific Islander, 10.2% from other races, and 3.0% from two or more races. Hispanic or Latino of any race were 24.3% of the population.
The median household income in East Chicago was $30,945, and the median family income was $36,945. The per capita income in the city was $15,945. About 22.3% of the population was below the poverty line.
Common Questions
What is Per Capita Income in East Chicago?
Per Capita income in East Chicago is $22,539.
What is the Median Family Income in East Chicago?
Median Family Income in East Chicago is $44,928.
What is the Median Household income in East Chicago?
Median Household Income in East Chicago is $39,434.
What is Income or Wage Gap in East Chicago?
Income or Wage Gap in East Chicago is 16.8%.
Women in East Chicago earn 83.2 cents for every dollar earned by a man.
What is Family Income Deficit in East Chicago?
Family Income Deficit in East Chicago is $10,736.
Families that are below poverty line in East Chicago earn $10,736 less on average than the poverty threshold level.
What is Inequality or Gini Index in East Chicago?
Inequality or Gini Index in East Chicago is 0.49.
What is the Total Population of East Chicago?
Total Population of East Chicago is 26,363.
What is the Total Male Population of East Chicago?
Total Male Population of East Chicago is 12,994.
What is the Total Female Population of East Chicago?
Total Female Population of East Chicago is 13,369.
What is the Ratio of Males per 100 Females in East Chicago?
There are 97.20 Males per 100 Females in East Chicago.
What is the Ratio of Females per 100 Males in East Chicago?
There are 102.89 Females per 100 Males in East Chicago.
What is the Median Population Age in East Chicago?
Median Population Age in East Chicago is 36.0 Years.
What is the Average Family Size in East Chicago
Average Family Size in East Chicago is 3.5 People.
What is the Average Household Size in East Chicago
Average Household Size in East Chicago is 2.6 People.
How Large is the Labor Force in East Chicago?
There are 11,525 People in the Labor Forcein in East Chicago.
What is the Percentage of People in the Labor Force in East Chicago?
56.0% of People are in the Labor Force in East Chicago.
What is the Unemployment Rate in East Chicago?
Unemployment Rate in East Chicago is 6.5%.