Corozal, PR Map & Demographics
Corozal Map
Corozal Overview
$10,085
PER CAPITA INCOME
$22,255
AVG FAMILY INCOME
$20,681
AVG HOUSEHOLD INCOME
26.6%
WAGE / INCOME GAP [ % ]
73.4¢/ $1
WAGE / INCOME GAP [ $ ]
$12,328
FAMILY INCOME DEFICIT
0.48
INEQUALITY / GINI INDEX
10,019
TOTAL POPULATION
4,823
MALE POPULATION
5,196
FEMALE POPULATION
92.82
MALES / 100 FEMALES
107.73
FEMALES / 100 MALES
39.6
MEDIAN AGE
3.8
AVG FAMILY SIZE
3.0
AVG HOUSEHOLD SIZE
3,407
LABOR FORCE [ PEOPLE ]
41.1%
PERCENT IN LABOR FORCE
15.7%
UNEMPLOYMENT RATE
Corozal Zip Codes
Corozal Area Codes
Income in Corozal
Income Overview in Corozal
Per Capita Income in Corozal is $10,085, while median incomes of families and households are $22,255 and $20,681 respectively.
| Characteristic | Number | Measure |
| Per Capita Income | 10,019 | $10,085 |
| Median Family Income | 2,225 | $22,255 |
| Mean Family Income | 2,225 | $29,336 |
| Median Household Income | 3,341 | $20,681 |
| Mean Household Income | 3,341 | $26,331 |
| Income Deficit | 2,225 | $12,328 |
| Wage / Income Gap (%) | 10,019 | 26.64% |
| Wage / Income Gap ($) | 10,019 | 73.36¢ per $1 |
| Gini / Inequality Index | 10,019 | 0.48 |
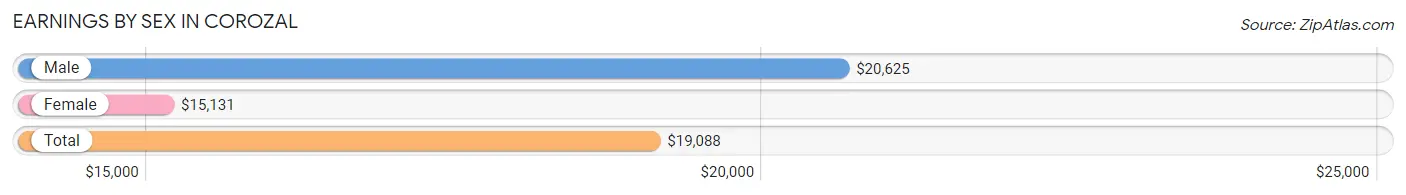
Earnings by Sex in Corozal
Average Earnings in Corozal are $19,088, $20,625 for men and $15,131 for women, a difference of 26.6%.
| Sex | Number | Average Earnings |
| Male | 1,831 (57.6%) | $20,625 |
| Female | 1,347 (42.4%) | $15,131 |
| Total | 3,178 (100.0%) | $19,088 |
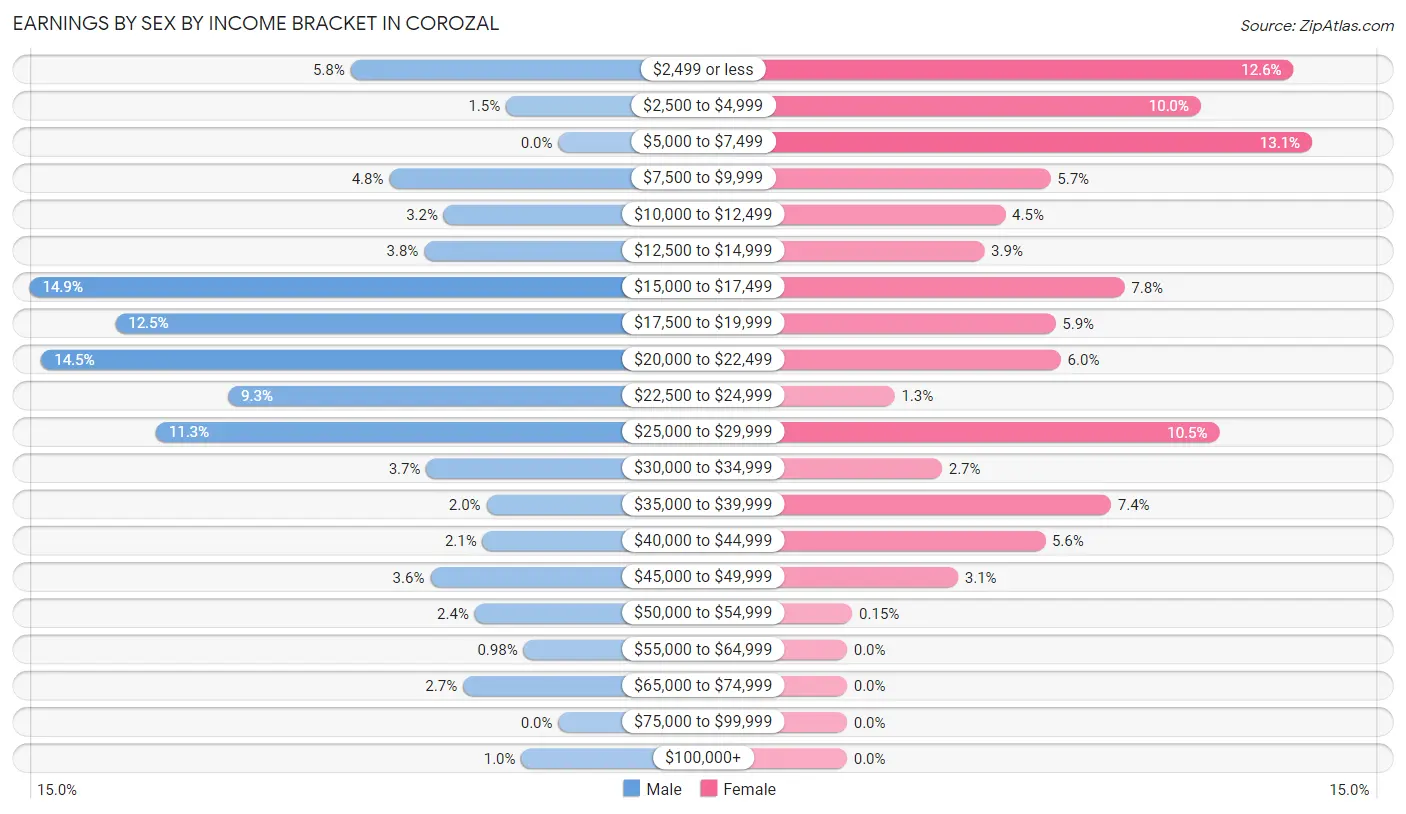
Earnings by Sex by Income Bracket in Corozal
The most common earnings brackets in Corozal are $15,000 to $17,499 for men (272 | 14.9%) and $5,000 to $7,499 for women (176 | 13.1%).
| Income | Male | Female |
| $2,499 or less | 107 (5.8%) | 169 (12.6%) |
| $2,500 to $4,999 | 27 (1.5%) | 134 (10.0%) |
| $5,000 to $7,499 | 0 (0.0%) | 176 (13.1%) |
| $7,500 to $9,999 | 87 (4.8%) | 77 (5.7%) |
| $10,000 to $12,499 | 59 (3.2%) | 60 (4.4%) |
| $12,500 to $14,999 | 69 (3.8%) | 52 (3.9%) |
| $15,000 to $17,499 | 272 (14.9%) | 105 (7.8%) |
| $17,500 to $19,999 | 228 (12.4%) | 79 (5.9%) |
| $20,000 to $22,499 | 266 (14.5%) | 81 (6.0%) |
| $22,500 to $24,999 | 170 (9.3%) | 18 (1.3%) |
| $25,000 to $29,999 | 207 (11.3%) | 141 (10.5%) |
| $30,000 to $34,999 | 68 (3.7%) | 36 (2.7%) |
| $35,000 to $39,999 | 37 (2.0%) | 100 (7.4%) |
| $40,000 to $44,999 | 39 (2.1%) | 75 (5.6%) |
| $45,000 to $49,999 | 66 (3.6%) | 42 (3.1%) |
| $50,000 to $54,999 | 43 (2.4%) | 2 (0.2%) |
| $55,000 to $64,999 | 18 (1.0%) | 0 (0.0%) |
| $65,000 to $74,999 | 49 (2.7%) | 0 (0.0%) |
| $75,000 to $99,999 | 0 (0.0%) | 0 (0.0%) |
| $100,000+ | 19 (1.0%) | 0 (0.0%) |
| Total | 1,831 (100.0%) | 1,347 (100.0%) |
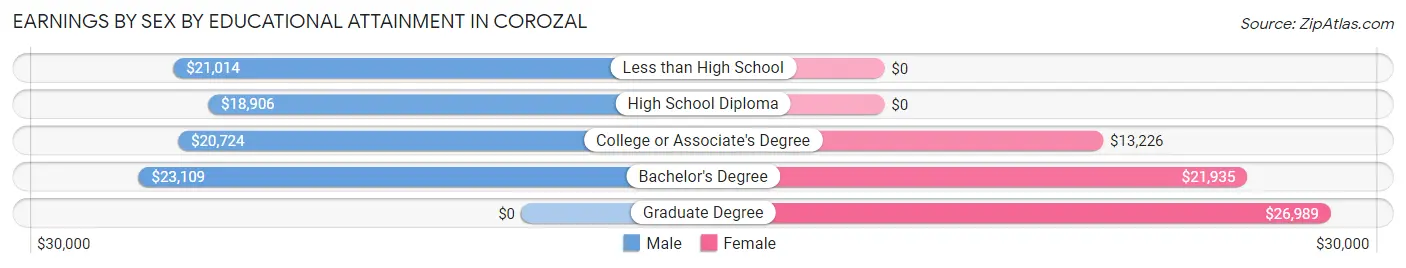
Earnings by Sex by Educational Attainment in Corozal
Average earnings in Corozal are $21,183 for men and $15,726 for women, a difference of 25.8%. Men with an educational attainment of bachelor's degree enjoy the highest average annual earnings of $23,109, while those with high school diploma education earn the least with $18,906. Women with an educational attainment of graduate degree earn the most with the average annual earnings of $26,989, while those with college or associate's degree education have the smallest earnings of $13,226.
| Educational Attainment | Male Income | Female Income |
| Less than High School | $21,014 | $0 |
| High School Diploma | $18,906 | $0 |
| College or Associate's Degree | $20,724 | $13,226 |
| Bachelor's Degree | $23,109 | $21,935 |
| Graduate Degree | - | - |
| Total | $21,183 | $15,726 |
Family Income in Corozal
Family Income Brackets in Corozal
According to the Corozal family income data, there are 574 families falling into the $15,000 to $24,999 income range, which is the most common income bracket and makes up 25.8% of all families.
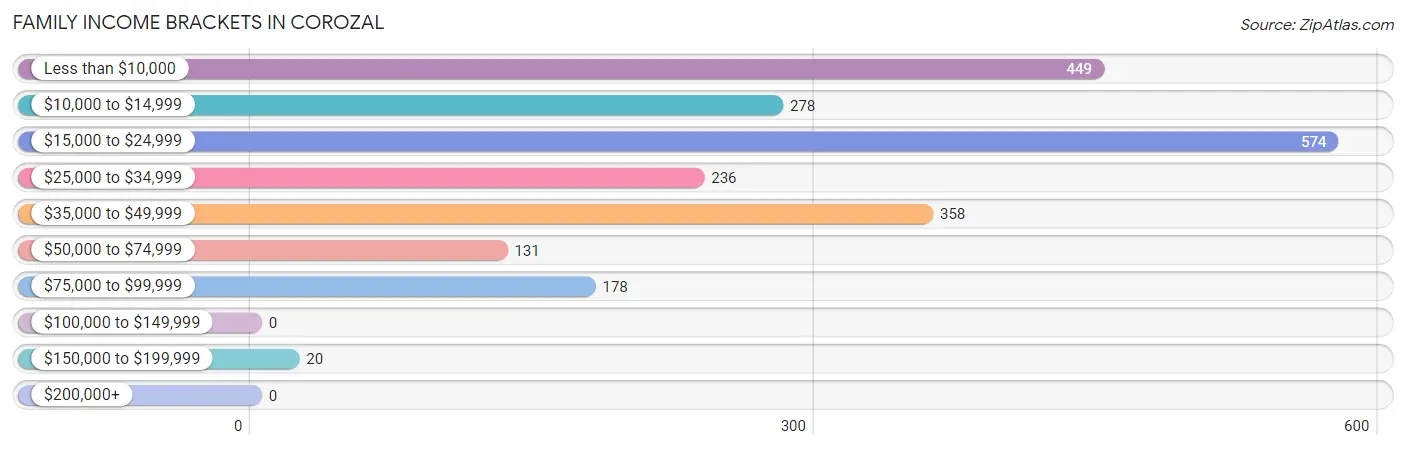
| Income Bracket | # Families | % Families |
| Less than $10,000 | 449 | 20.2% |
| $10,000 to $14,999 | 278 | 12.5% |
| $15,000 to $24,999 | 574 | 25.8% |
| $25,000 to $34,999 | 236 | 10.6% |
| $35,000 to $49,999 | 358 | 16.1% |
| $50,000 to $74,999 | 131 | 5.9% |
| $75,000 to $99,999 | 178 | 8.0% |
| $100,000 to $149,999 | 0 | 0.0% |
| $150,000 to $199,999 | 20 | 0.9% |
| $200,000+ | 0 | 0.0% |
Family Income by Famaliy Size in Corozal
4-person families (470 | 21.1%) account for the highest median family income in Corozal with $24,315 per family, while 2-person families (1,022 | 45.9%) have the highest median income of $11,174 per family member.
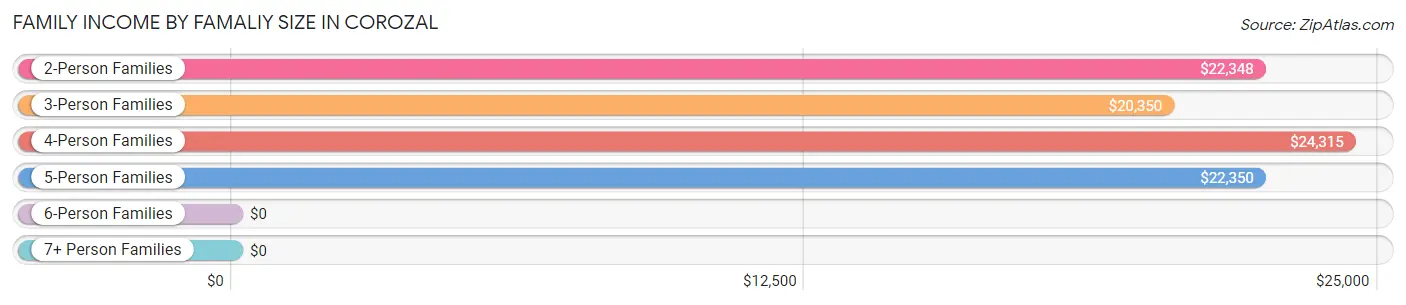
| Income Bracket | # Families | Median Income |
| 2-Person Families | 1,022 (45.9%) | $22,348 |
| 3-Person Families | 505 (22.7%) | $20,350 |
| 4-Person Families | 470 (21.1%) | $24,315 |
| 5-Person Families | 187 (8.4%) | $22,350 |
| 6-Person Families | 8 (0.4%) | $0 |
| 7+ Person Families | 33 (1.5%) | $0 |
| Total | 2,225 (100.0%) | $22,255 |
Family Income by Number of Earners in Corozal
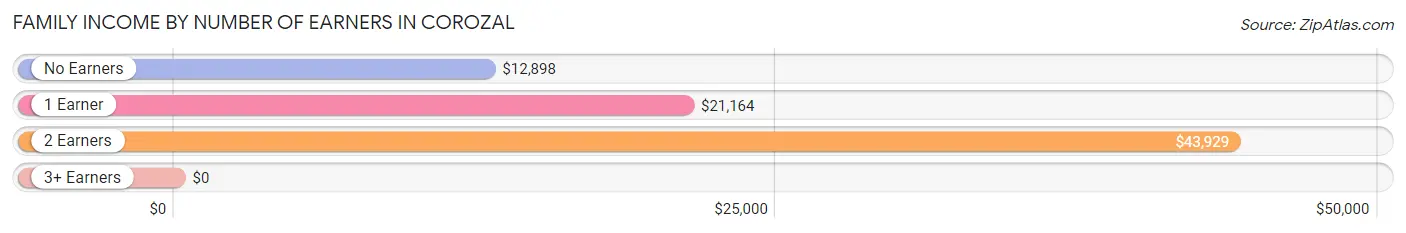
| Number of Earners | # Families | Median Income |
| No Earners | 801 (36.0%) | $12,898 |
| 1 Earner | 826 (37.1%) | $21,164 |
| 2 Earners | 548 (24.6%) | $43,929 |
| 3+ Earners | 50 (2.2%) | $0 |
| Total | 2,225 (100.0%) | $22,255 |
Household Income in Corozal
Household Income Brackets in Corozal
With 842 households falling in the category, the less than $10,000 income range is the most frequent in Corozal, accounting for 25.2% of all households.
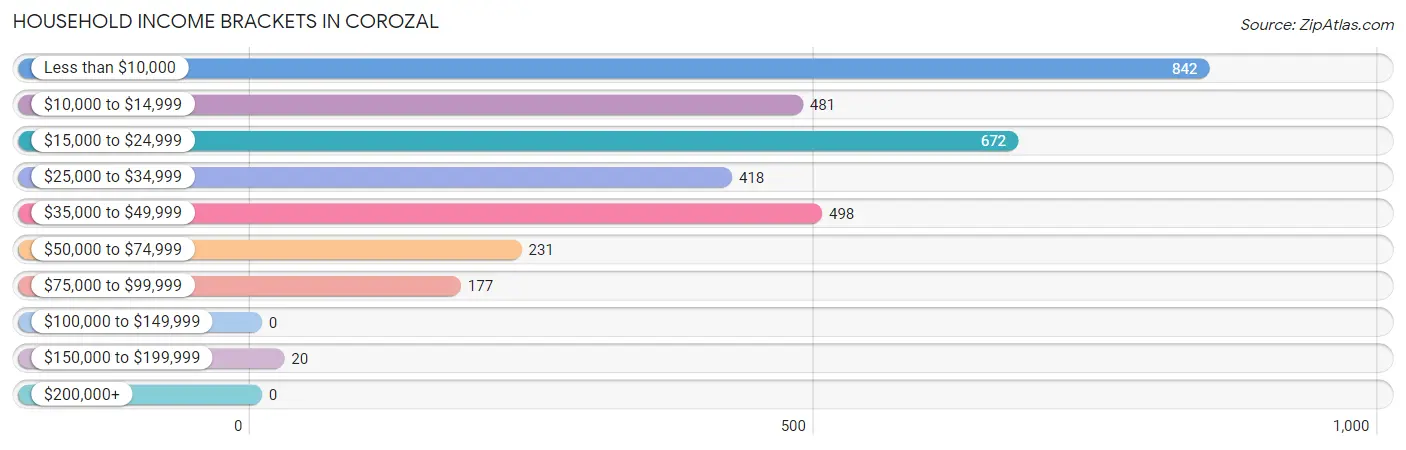
| Income Bracket | # Households | % Households |
| Less than $10,000 | 842 | 25.2% |
| $10,000 to $14,999 | 481 | 14.4% |
| $15,000 to $24,999 | 672 | 20.1% |
| $25,000 to $34,999 | 418 | 12.5% |
| $35,000 to $49,999 | 498 | 14.9% |
| $50,000 to $74,999 | 231 | 6.9% |
| $75,000 to $99,999 | 177 | 5.3% |
| $100,000 to $149,999 | 0 | 0.0% |
| $150,000 to $199,999 | 20 | 0.6% |
| $200,000+ | 0 | 0.0% |
Household Income by Householder Age in Corozal
The median household income in Corozal is $20,681, with the highest median household income of $28,017 found in the 25 to 44 years age bracket for the primary householder. A total of 892 households (26.7%) fall into this category. Meanwhile, the 15 to 24 years age bracket for the primary householder has the lowest median household income of $0, with 42 households (1.3%) in this group.
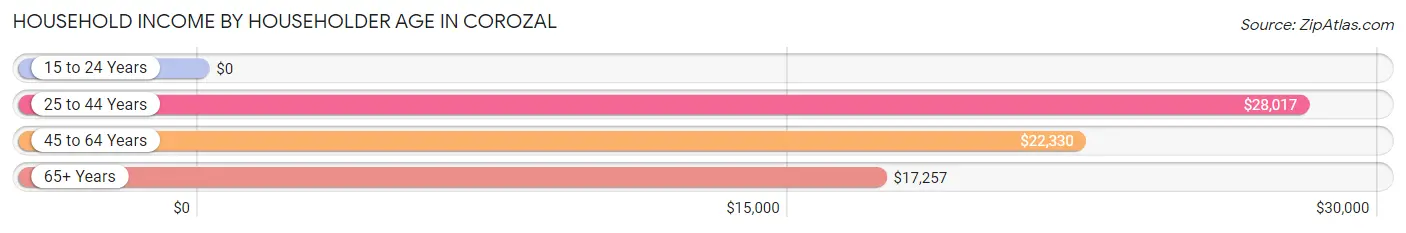
| Income Bracket | # Households | Median Income |
| 15 to 24 Years | 42 (1.3%) | $0 |
| 25 to 44 Years | 892 (26.7%) | $28,017 |
| 45 to 64 Years | 994 (29.7%) | $22,330 |
| 65+ Years | 1,413 (42.3%) | $17,257 |
| Total | 3,341 (100.0%) | $20,681 |
Poverty in Corozal
Income Below Poverty by Sex and Age in Corozal
With 51.2% poverty level for males and 60.4% for females among the residents of Corozal, 16 and 17 year old males and 15 year old females are the most vulnerable to poverty, with 151 males (79.9%) and 27 females (100.0%) in their respective age groups living below the poverty level.
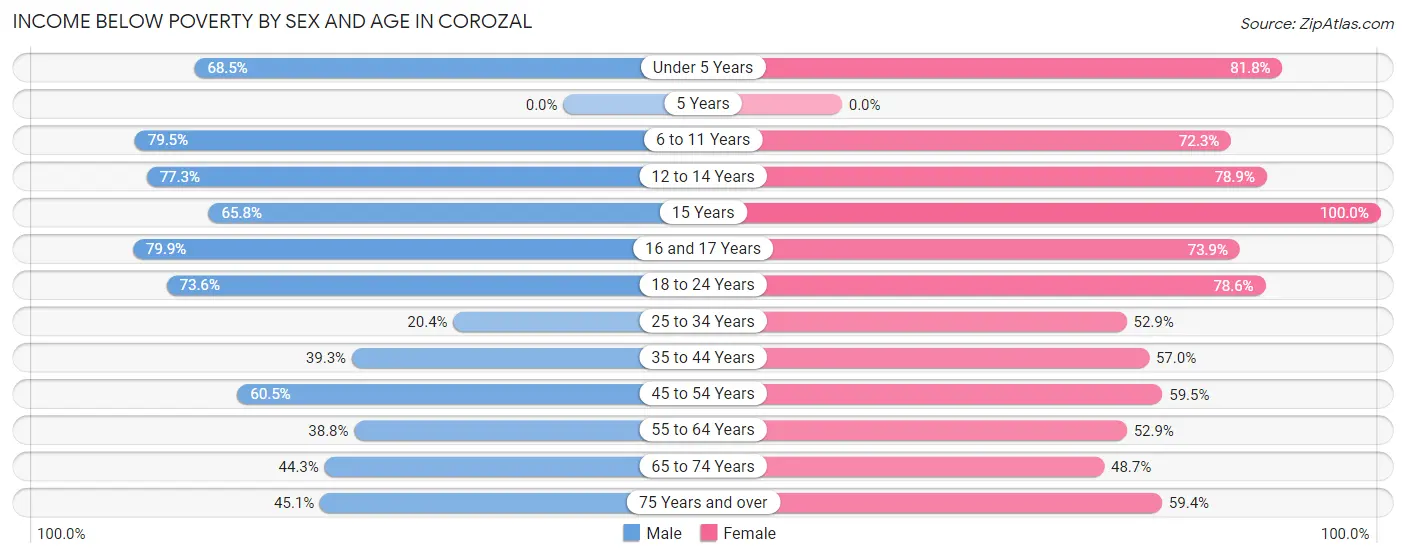
| Age Bracket | Male | Female |
| Under 5 Years | 76 (68.5%) | 193 (81.8%) |
| 5 Years | 0 (0.0%) | 0 (0.0%) |
| 6 to 11 Years | 272 (79.5%) | 349 (72.3%) |
| 12 to 14 Years | 116 (77.3%) | 153 (78.9%) |
| 15 Years | 79 (65.8%) | 27 (100.0%) |
| 16 and 17 Years | 151 (79.9%) | 82 (73.9%) |
| 18 to 24 Years | 553 (73.6%) | 206 (78.6%) |
| 25 to 34 Years | 138 (20.4%) | 370 (52.9%) |
| 35 to 44 Years | 261 (39.3%) | 333 (57.0%) |
| 45 to 54 Years | 274 (60.5%) | 370 (59.5%) |
| 55 to 64 Years | 192 (38.8%) | 376 (52.9%) |
| 65 to 74 Years | 187 (44.3%) | 329 (48.7%) |
| 75 Years and over | 172 (45.1%) | 350 (59.4%) |
| Total | 2,471 (51.2%) | 3,138 (60.4%) |
Income Above Poverty by Sex and Age in Corozal
According to the poverty statistics in Corozal, males aged 5 years and females aged 65 to 74 years are the age groups that are most secure financially, with 100.0% of males and 51.3% of females in these age groups living above the poverty line.
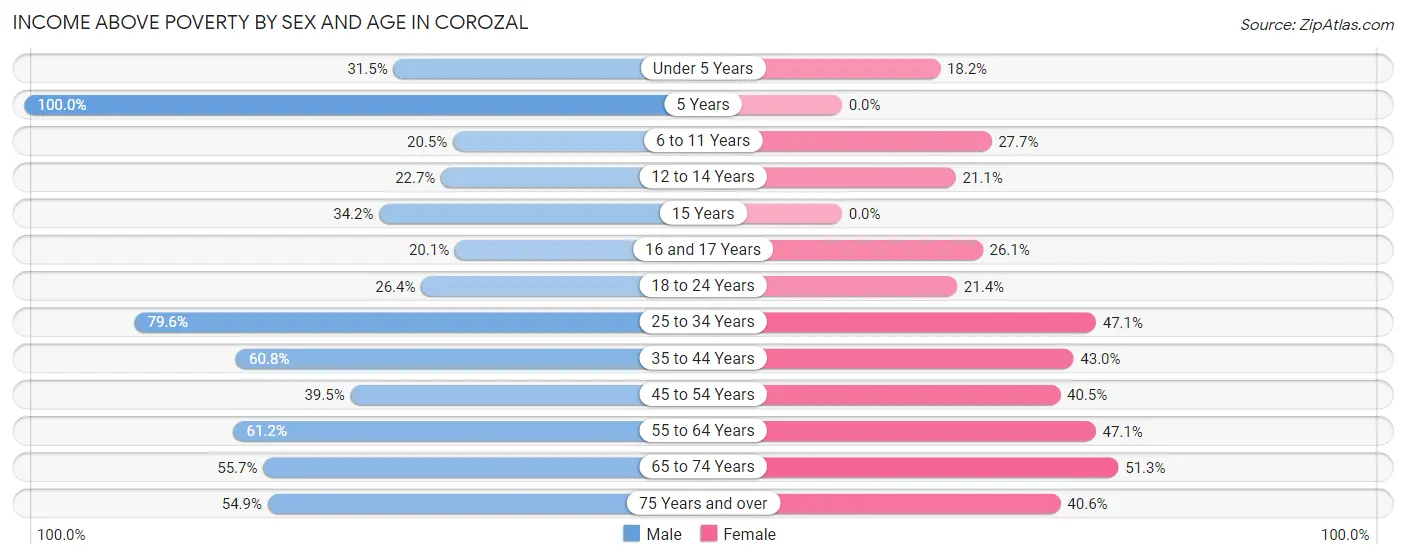
| Age Bracket | Male | Female |
| Under 5 Years | 35 (31.5%) | 43 (18.2%) |
| 5 Years | 67 (100.0%) | 0 (0.0%) |
| 6 to 11 Years | 70 (20.5%) | 134 (27.7%) |
| 12 to 14 Years | 34 (22.7%) | 41 (21.1%) |
| 15 Years | 41 (34.2%) | 0 (0.0%) |
| 16 and 17 Years | 38 (20.1%) | 29 (26.1%) |
| 18 to 24 Years | 198 (26.4%) | 56 (21.4%) |
| 25 to 34 Years | 538 (79.6%) | 330 (47.1%) |
| 35 to 44 Years | 404 (60.8%) | 251 (43.0%) |
| 45 to 54 Years | 179 (39.5%) | 252 (40.5%) |
| 55 to 64 Years | 303 (61.2%) | 335 (47.1%) |
| 65 to 74 Years | 235 (55.7%) | 347 (51.3%) |
| 75 Years and over | 209 (54.9%) | 239 (40.6%) |
| Total | 2,351 (48.8%) | 2,057 (39.6%) |
Income Below Poverty Among Married-Couple Families in Corozal
The poverty statistics for married-couple families in Corozal show that 42.9% or 514 of the total 1,198 families live below the poverty line. Families with 3 or 4 children have the highest poverty rate of 100.0%, comprising of 25 families. On the other hand, families with no children have the lowest poverty rate of 40.1%, which includes 363 families.
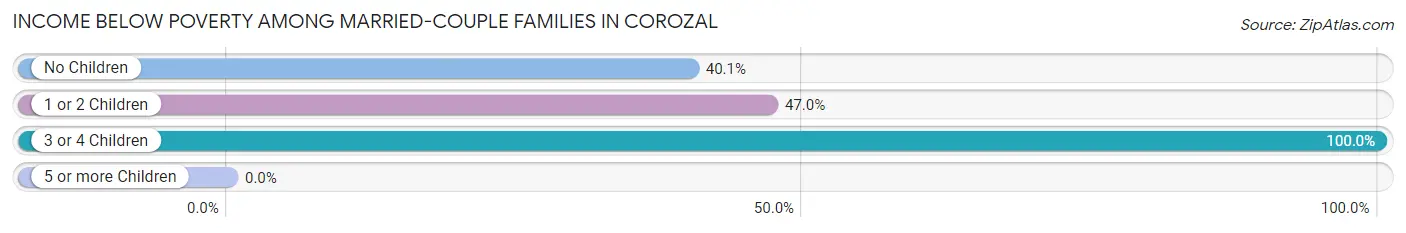
| Children | Above Poverty | Below Poverty |
| No Children | 542 (59.9%) | 363 (40.1%) |
| 1 or 2 Children | 142 (53.0%) | 126 (47.0%) |
| 3 or 4 Children | 0 (0.0%) | 25 (100.0%) |
| 5 or more Children | 0 (0.0%) | 0 (0.0%) |
| Total | 684 (57.1%) | 514 (42.9%) |
Income Below Poverty Among Single-Parent Households in Corozal
According to the poverty data in Corozal, 46.3% or 126 single-father households and 67.5% or 510 single-mother households are living below the poverty line. Among single-father households, those with 1 or 2 children have the highest poverty rate, with 95 households (85.6%) experiencing poverty. Likewise, among single-mother households, those with 3 or 4 children have the highest poverty rate, with 78 households (100.0%) falling below the poverty line.
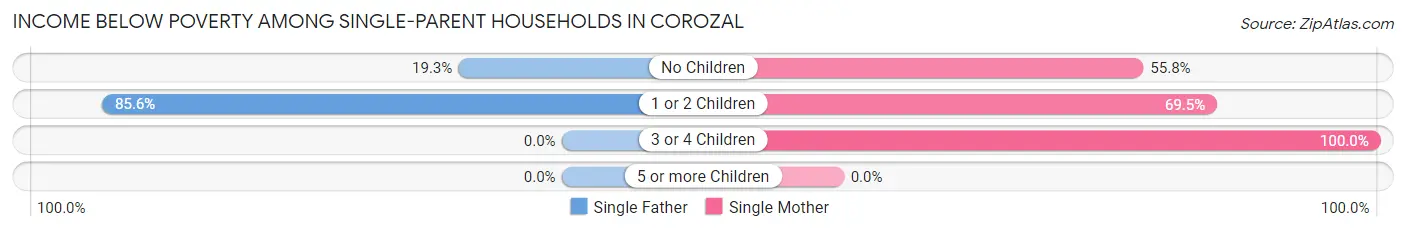
| Children | Single Father | Single Mother |
| No Children | 31 (19.3%) | 158 (55.8%) |
| 1 or 2 Children | 95 (85.6%) | 274 (69.5%) |
| 3 or 4 Children | 0 (0.0%) | 78 (100.0%) |
| 5 or more Children | 0 (0.0%) | 0 (0.0%) |
| Total | 126 (46.3%) | 510 (67.5%) |
Income Below Poverty Among Married-Couple vs Single-Parent Households in Corozal
The poverty data for Corozal shows that 514 of the married-couple family households (42.9%) and 636 of the single-parent households (61.9%) are living below the poverty level. Within the married-couple family households, those with 3 or 4 children have the highest poverty rate, with 25 households (100.0%) falling below the poverty line. Among the single-parent households, those with 3 or 4 children have the highest poverty rate, with 78 household (100.0%) living below poverty.
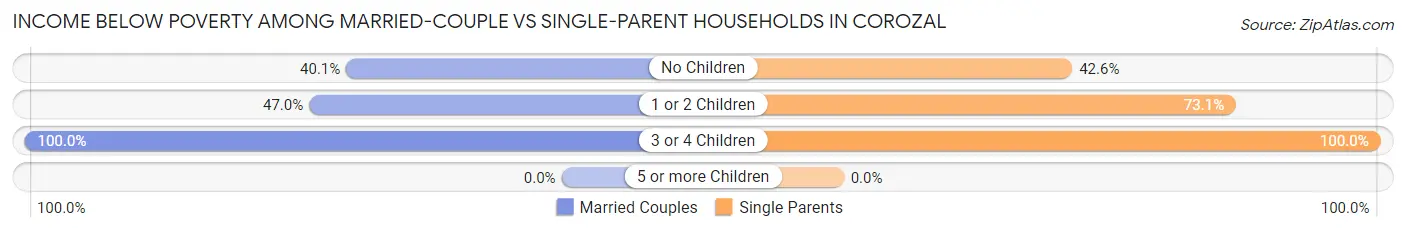
| Children | Married-Couple Families | Single-Parent Households |
| No Children | 363 (40.1%) | 189 (42.6%) |
| 1 or 2 Children | 126 (47.0%) | 369 (73.1%) |
| 3 or 4 Children | 25 (100.0%) | 78 (100.0%) |
| 5 or more Children | 0 (0.0%) | 0 (0.0%) |
| Total | 514 (42.9%) | 636 (61.9%) |
Race in Corozal
The most populous races in Corozal are Hispanic or Latino (9,964 | 99.5%), White / Caucasian (4,609 | 46.0%), and Two or more Races (3,404 | 34.0%).
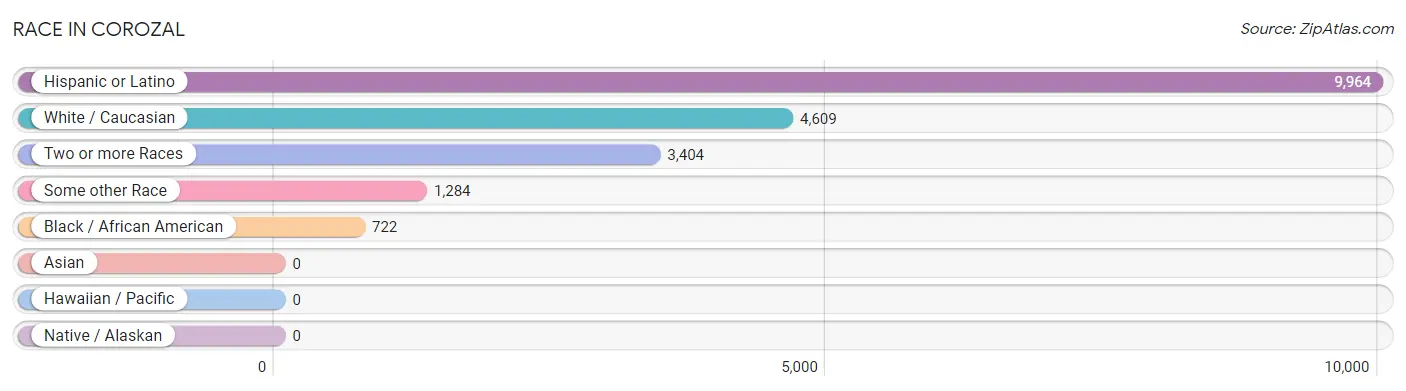
| Race | # Population | % Population |
| Asian | 0 | 0.0% |
| Black / African American | 722 | 7.2% |
| Hawaiian / Pacific | 0 | 0.0% |
| Hispanic or Latino | 9,964 | 99.5% |
| Native / Alaskan | 0 | 0.0% |
| White / Caucasian | 4,609 | 46.0% |
| Two or more Races | 3,404 | 34.0% |
| Some other Race | 1,284 | 12.8% |
| Total | 10,019 | 100.0% |
Ancestry in Corozal
The most populous ancestries reported in Corozal are Puerto Rican (9,862 | 98.4%), Central American Indian (64 | 0.6%), Arab (55 | 0.5%), Mexican (54 | 0.5%), and Dominican (38 | 0.4%), together accounting for 100.5% of all Corozal residents.
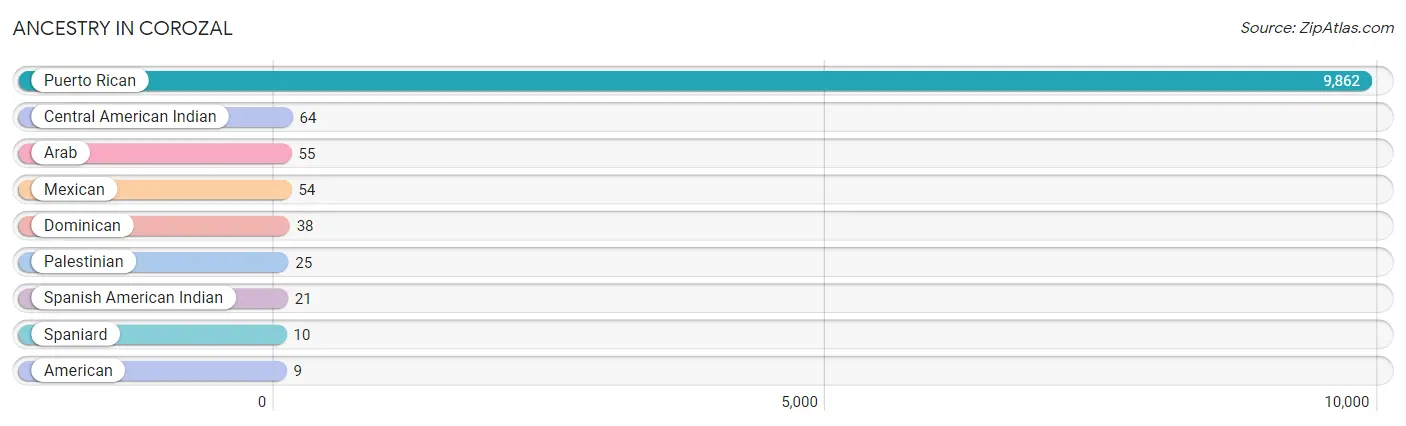
| Ancestry | # Population | % Population |
| American | 9 | 0.1% |
| Arab | 55 | 0.5% |
| Central American Indian | 64 | 0.6% |
| Dominican | 38 | 0.4% |
| Mexican | 54 | 0.5% |
| Palestinian | 25 | 0.3% |
| Puerto Rican | 9,862 | 98.4% |
| Spaniard | 10 | 0.1% |
| Spanish American Indian | 21 | 0.2% | View All 9 Rows |
Immigrants in Corozal

| Immigration Origin | # Population | % Population | View All 0 Rows |
Sex and Age in Corozal
Sex and Age in Corozal
The most populous age groups in Corozal are 15 to 19 Years (550 | 11.4%) for men and 30 to 34 Years (447 | 8.6%) for women.
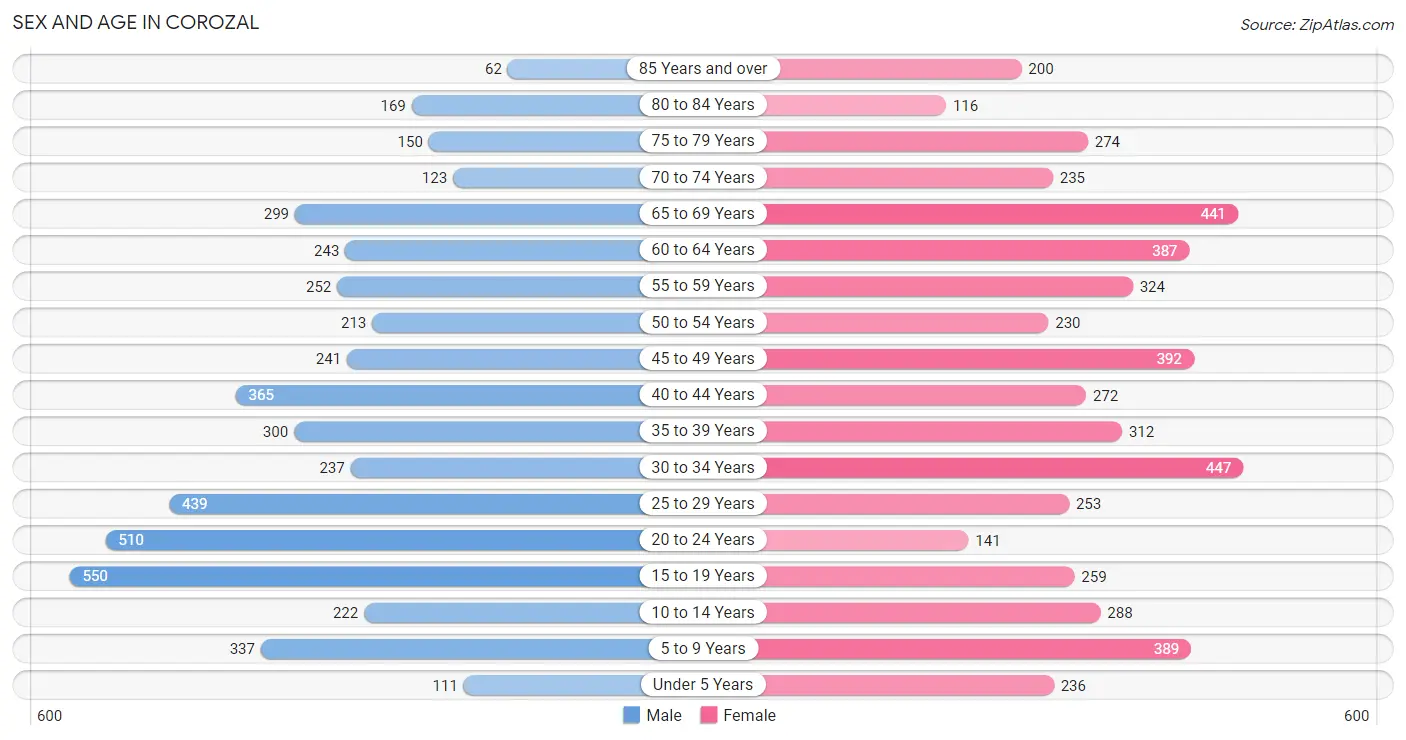
| Age Bracket | Male | Female |
| Under 5 Years | 111 (2.3%) | 236 (4.5%) |
| 5 to 9 Years | 337 (7.0%) | 389 (7.5%) |
| 10 to 14 Years | 222 (4.6%) | 288 (5.5%) |
| 15 to 19 Years | 550 (11.4%) | 259 (5.0%) |
| 20 to 24 Years | 510 (10.6%) | 141 (2.7%) |
| 25 to 29 Years | 439 (9.1%) | 253 (4.9%) |
| 30 to 34 Years | 237 (4.9%) | 447 (8.6%) |
| 35 to 39 Years | 300 (6.2%) | 312 (6.0%) |
| 40 to 44 Years | 365 (7.6%) | 272 (5.2%) |
| 45 to 49 Years | 241 (5.0%) | 392 (7.5%) |
| 50 to 54 Years | 213 (4.4%) | 230 (4.4%) |
| 55 to 59 Years | 252 (5.2%) | 324 (6.2%) |
| 60 to 64 Years | 243 (5.0%) | 387 (7.4%) |
| 65 to 69 Years | 299 (6.2%) | 441 (8.5%) |
| 70 to 74 Years | 123 (2.5%) | 235 (4.5%) |
| 75 to 79 Years | 150 (3.1%) | 274 (5.3%) |
| 80 to 84 Years | 169 (3.5%) | 116 (2.2%) |
| 85 Years and over | 62 (1.3%) | 200 (3.8%) |
| Total | 4,823 (100.0%) | 5,196 (100.0%) |
Families and Households in Corozal
Median Family Size in Corozal
The median family size in Corozal is 3.80 persons per family, with single male/father families (272 | 12.2%) accounting for the largest median family size of 4.42 persons per family. On the other hand, married-couple families (1,198 | 53.8%) represent the smallest median family size with 3.45 persons per family.
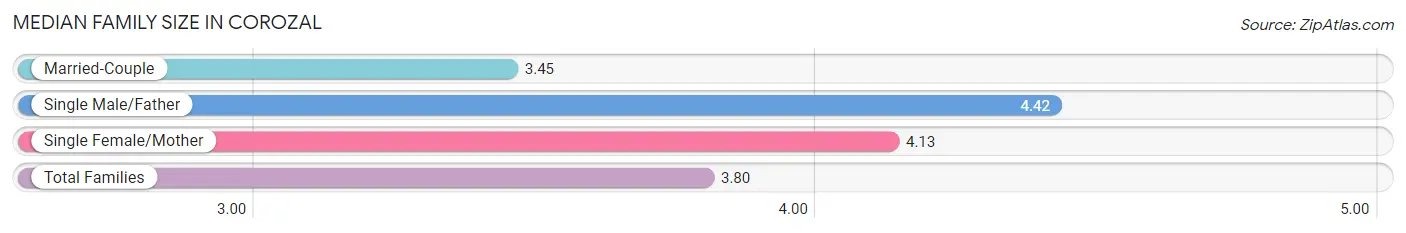
| Family Type | # Families | Family Size |
| Married-Couple | 1,198 (53.8%) | 3.45 |
| Single Male/Father | 272 (12.2%) | 4.42 |
| Single Female/Mother | 755 (33.9%) | 4.13 |
| Total Families | 2,225 (100.0%) | 3.80 |
Median Household Size in Corozal
The median household size in Corozal is 2.99 persons per household, with single male/father households (272 | 8.1%) accounting for the largest median household size of 4.87 persons per household. non-family households (1,116 | 33.4%) represent the smallest median household size with 1.09 persons per household.
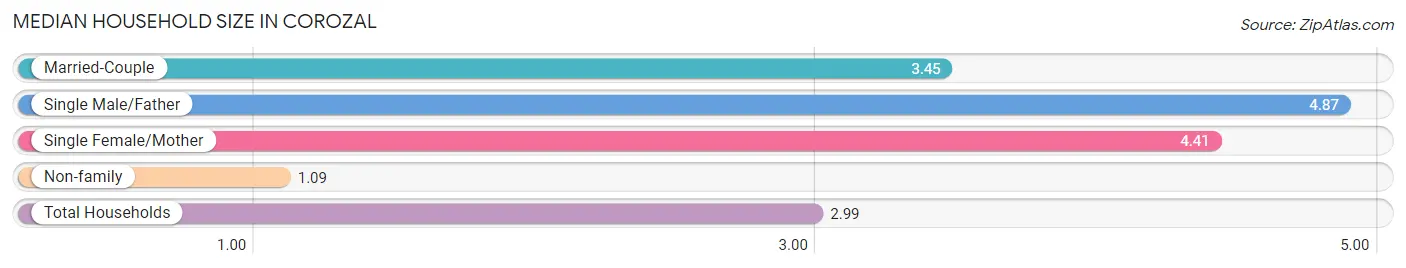
| Household Type | # Households | Household Size |
| Married-Couple | 1,198 (35.9%) | 3.45 |
| Single Male/Father | 272 (8.1%) | 4.87 |
| Single Female/Mother | 755 (22.6%) | 4.41 |
| Non-family | 1,116 (33.4%) | 1.09 |
| Total Households | 3,341 (100.0%) | 2.99 |
Household Size by Marriage Status in Corozal
Out of a total of 3,341 households in Corozal, 2,225 (66.6%) are family households, while 1,116 (33.4%) are nonfamily households. The most numerous type of family households are 2-person households, comprising 885, and the most common type of nonfamily households are 1-person households, comprising 1,033.
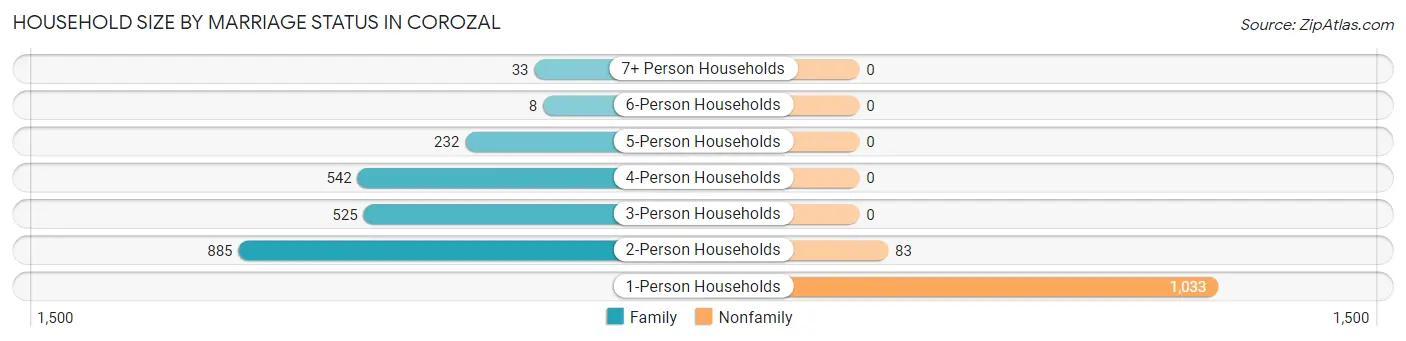
| Household Size | Family Households | Nonfamily Households |
| 1-Person Households | - | 1,033 (30.9%) |
| 2-Person Households | 885 (26.5%) | 83 (2.5%) |
| 3-Person Households | 525 (15.7%) | 0 (0.0%) |
| 4-Person Households | 542 (16.2%) | 0 (0.0%) |
| 5-Person Households | 232 (6.9%) | 0 (0.0%) |
| 6-Person Households | 8 (0.2%) | 0 (0.0%) |
| 7+ Person Households | 33 (1.0%) | 0 (0.0%) |
| Total | 2,225 (66.6%) | 1,116 (33.4%) |
Female Fertility in Corozal
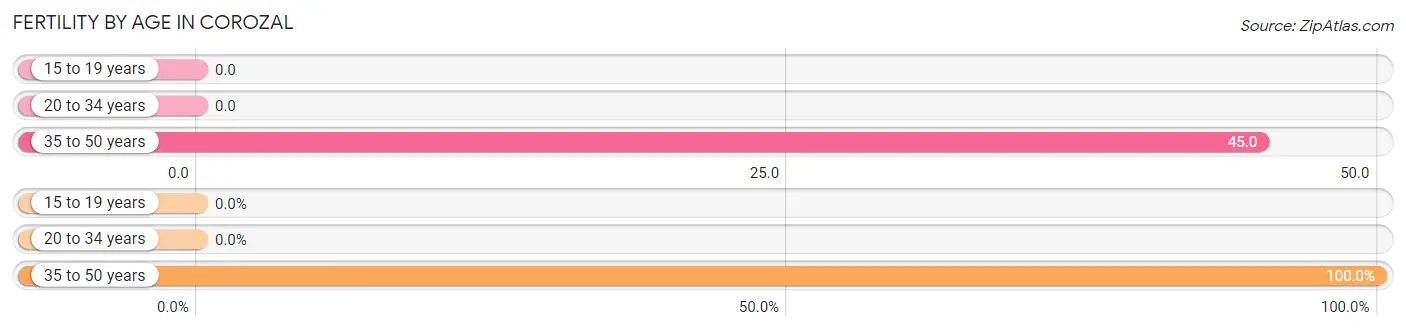
Fertility by Age in Corozal
Average fertility rate in Corozal is 21.0 births per 1,000 women. Women in the age bracket of 35 to 50 years have the highest fertility rate with 45.0 births per 1,000 women. Women in the age bracket of 35 to 50 years acount for 100.0% of all women with births.
| Age Bracket | Women with Births | Births / 1,000 Women |
| 15 to 19 years | 0 (0.0%) | 0.0 |
| 20 to 34 years | 0 (0.0%) | 0.0 |
| 35 to 50 years | 44 (100.0%) | 45.0 |
| Total | 44 (100.0%) | 21.0 |
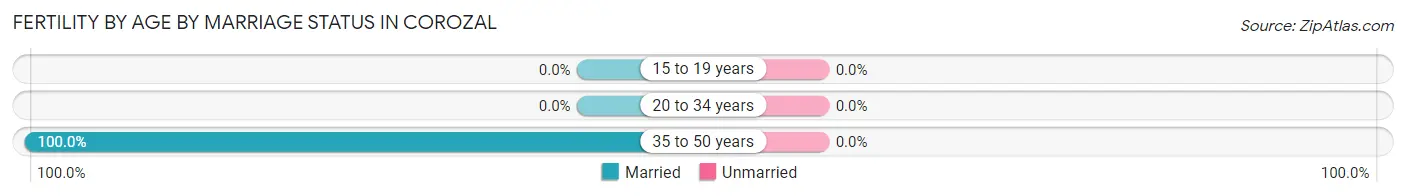
Fertility by Age by Marriage Status in Corozal
| Age Bracket | Married | Unmarried |
| 15 to 19 years | 0 (0.0%) | 0 (0.0%) |
| 20 to 34 years | 0 (0.0%) | 0 (0.0%) |
| 35 to 50 years | 44 (100.0%) | 0 (0.0%) |
| Total | 44 (100.0%) | 0 (0.0%) |
Fertility by Education in Corozal
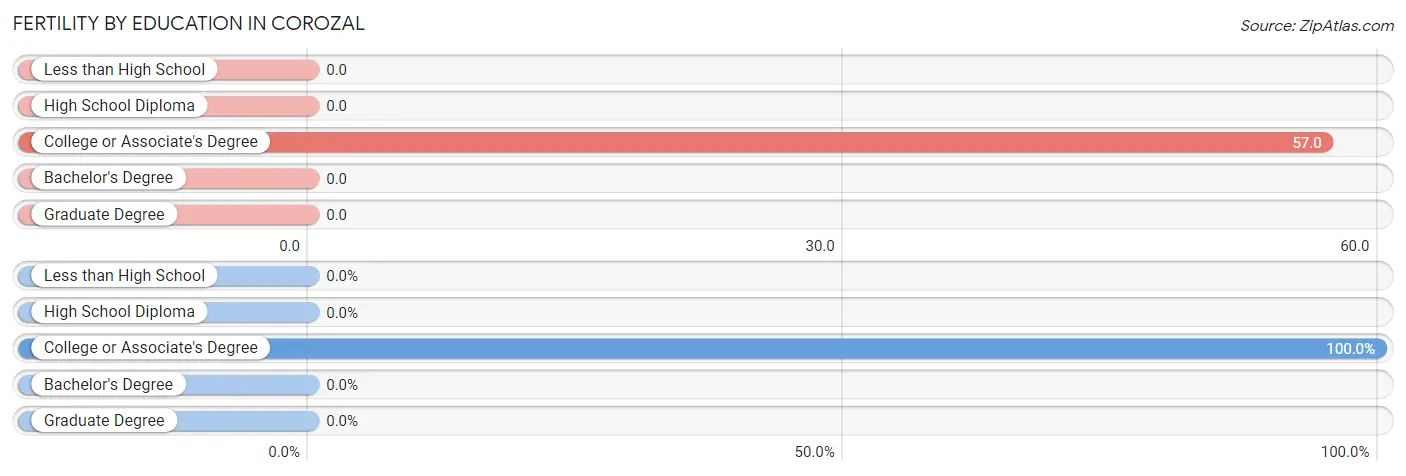
| Educational Attainment | Women with Births | Births / 1,000 Women |
| Less than High School | 0 (0.0%) | 0.0 |
| High School Diploma | 0 (0.0%) | 0.0 |
| College or Associate's Degree | 44 (100.0%) | 57.0 |
| Bachelor's Degree | 0 (0.0%) | 0.0 |
| Graduate Degree | 0 (0.0%) | 0.0 |
| Total | 44 (100.0%) | 21.0 |
Fertility by Education by Marriage Status in Corozal
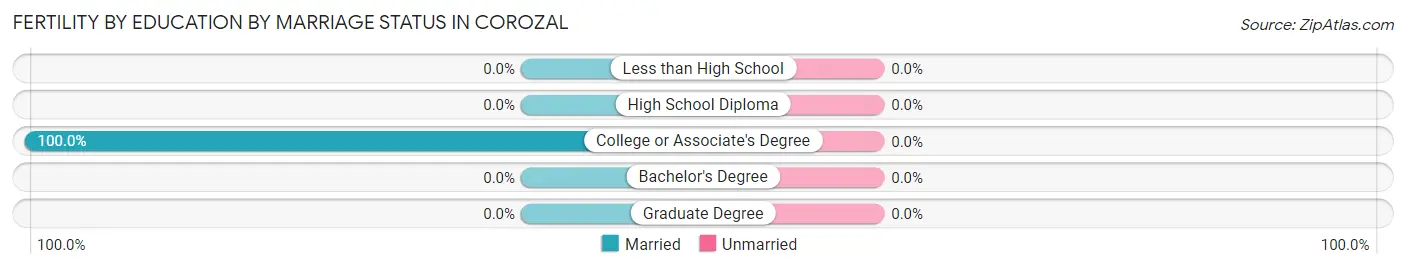
| Educational Attainment | Married | Unmarried |
| Less than High School | 0 (0.0%) | 0 (0.0%) |
| High School Diploma | 0 (0.0%) | 0 (0.0%) |
| College or Associate's Degree | 44 (100.0%) | 0 (0.0%) |
| Bachelor's Degree | 0 (0.0%) | 0 (0.0%) |
| Graduate Degree | 0 (0.0%) | 0 (0.0%) |
| Total | 44 (100.0%) | 0 (0.0%) |
Employment Characteristics in Corozal
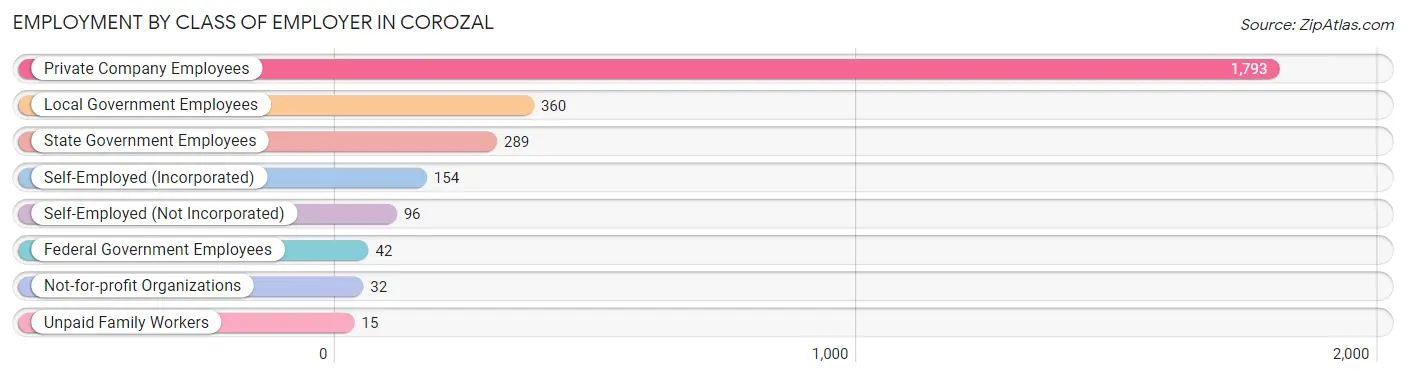
Employment by Class of Employer in Corozal
Among the 2,781 employed individuals in Corozal, private company employees (1,793 | 64.5%), local government employees (360 | 12.9%), and state government employees (289 | 10.4%) make up the most common classes of employment.
| Employer Class | # Employees | % Employees |
| Private Company Employees | 1,793 | 64.5% |
| Self-Employed (Incorporated) | 154 | 5.5% |
| Self-Employed (Not Incorporated) | 96 | 3.5% |
| Not-for-profit Organizations | 32 | 1.1% |
| Local Government Employees | 360 | 12.9% |
| State Government Employees | 289 | 10.4% |
| Federal Government Employees | 42 | 1.5% |
| Unpaid Family Workers | 15 | 0.5% |
| Total | 2,781 | 100.0% |
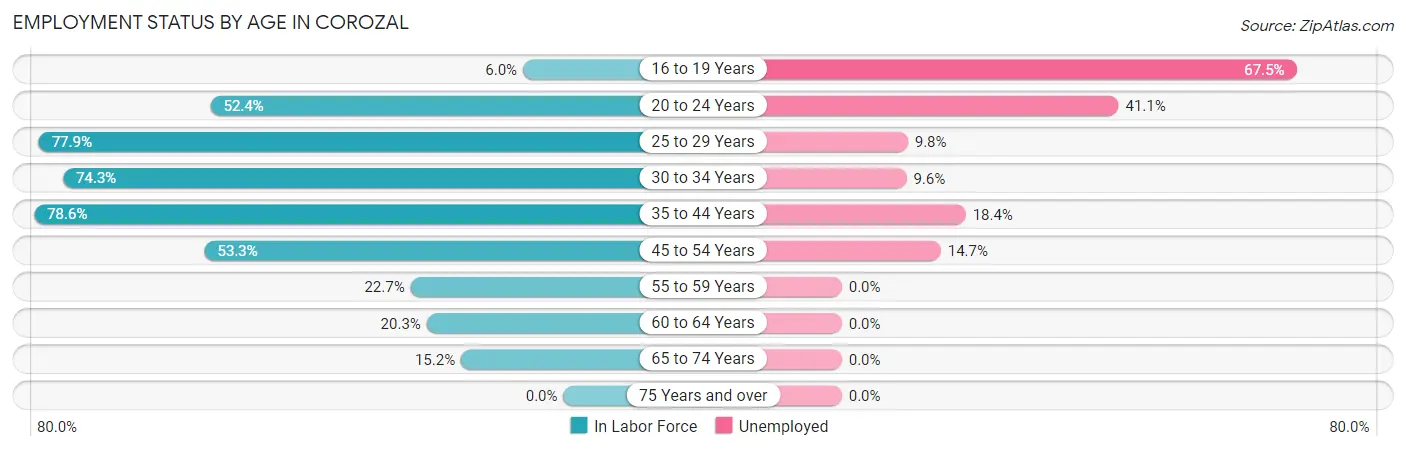
Employment Status by Age in Corozal
According to the labor force statistics for Corozal, out of the total population over 16 years of age (8,289), 41.1% or 3,407 individuals are in the labor force, with 15.7% or 535 of them unemployed. The age group with the highest labor force participation rate is 35 to 44 years, with 78.6% or 982 individuals in the labor force. Within the labor force, the 16 to 19 years age range has the highest percentage of unemployed individuals, with 67.5% or 27 of them being unemployed.
| Age Bracket | In Labor Force | Unemployed |
| 16 to 19 Years | 40 (6.0%) | 27 (67.5%) |
| 20 to 24 Years | 341 (52.4%) | 140 (41.1%) |
| 25 to 29 Years | 539 (77.9%) | 53 (9.8%) |
| 30 to 34 Years | 508 (74.3%) | 49 (9.6%) |
| 35 to 44 Years | 982 (78.6%) | 181 (18.4%) |
| 45 to 54 Years | 574 (53.3%) | 84 (14.7%) |
| 55 to 59 Years | 131 (22.7%) | 0 (0.0%) |
| 60 to 64 Years | 128 (20.3%) | 0 (0.0%) |
| 65 to 74 Years | 167 (15.2%) | 0 (0.0%) |
| 75 Years and over | 0 (0.0%) | 0 (0.0%) |
| Total | 3,407 (41.1%) | 535 (15.7%) |
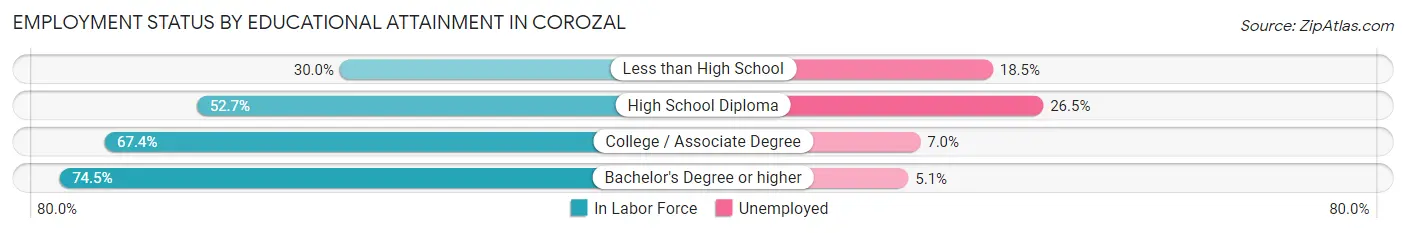
Employment Status by Educational Attainment in Corozal
According to labor force statistics for Corozal, 58.3% of individuals (2,861) out of the total population between 25 and 64 years of age (4,907) are in the labor force, with 12.8% or 366 of them being unemployed. The group with the highest labor force participation rate are those with the educational attainment of bachelor's degree or higher, with 74.5% or 693 individuals in the labor force. Within the labor force, individuals with high school diploma education have the highest percentage of unemployment, with 26.5% or 206 of them being unemployed.
| Educational Attainment | In Labor Force | Unemployed |
| Less than High School | 238 (30.0%) | 147 (18.5%) |
| High School Diploma | 779 (52.7%) | 392 (26.5%) |
| College / Associate Degree | 1,149 (67.4%) | 119 (7.0%) |
| Bachelor's Degree or higher | 693 (74.5%) | 47 (5.1%) |
| Total | 2,861 (58.3%) | 628 (12.8%) |
Employment Occupations by Sex in Corozal
Management, Business, Science and Arts Occupations
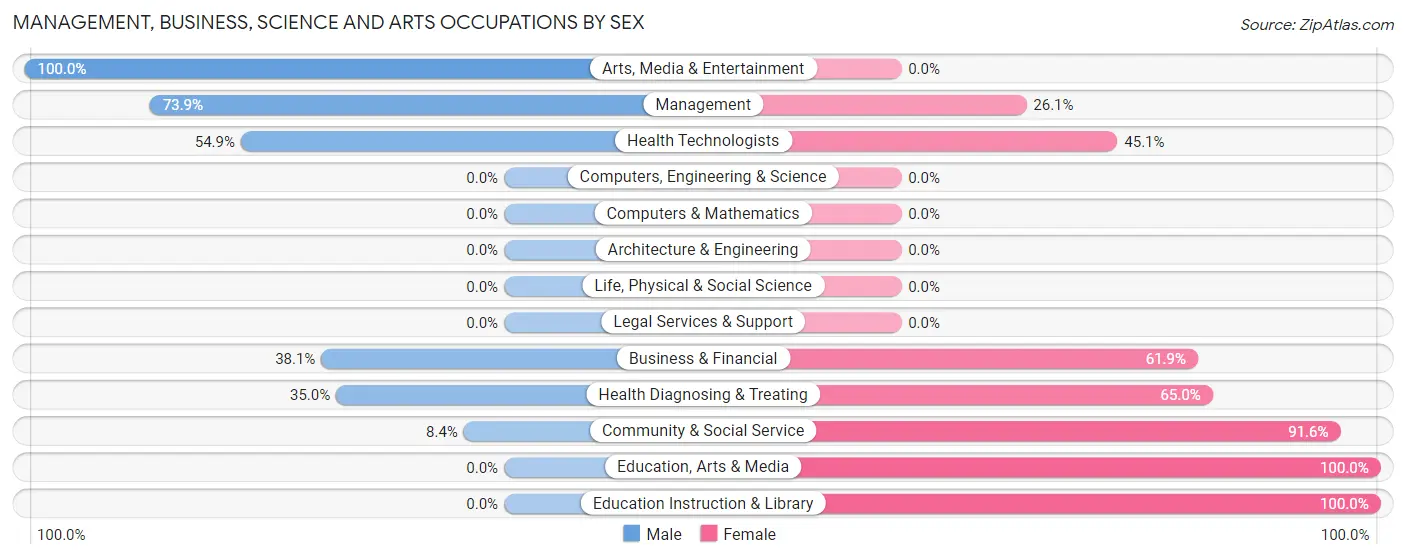
The most common Management, Business, Science and Arts occupations in Corozal are Management (226 | 7.9%), Community & Social Service (214 | 7.4%), Health Diagnosing & Treating (197 | 6.9%), Education Instruction & Library (182 | 6.3%), and Business & Financial (139 | 4.8%).
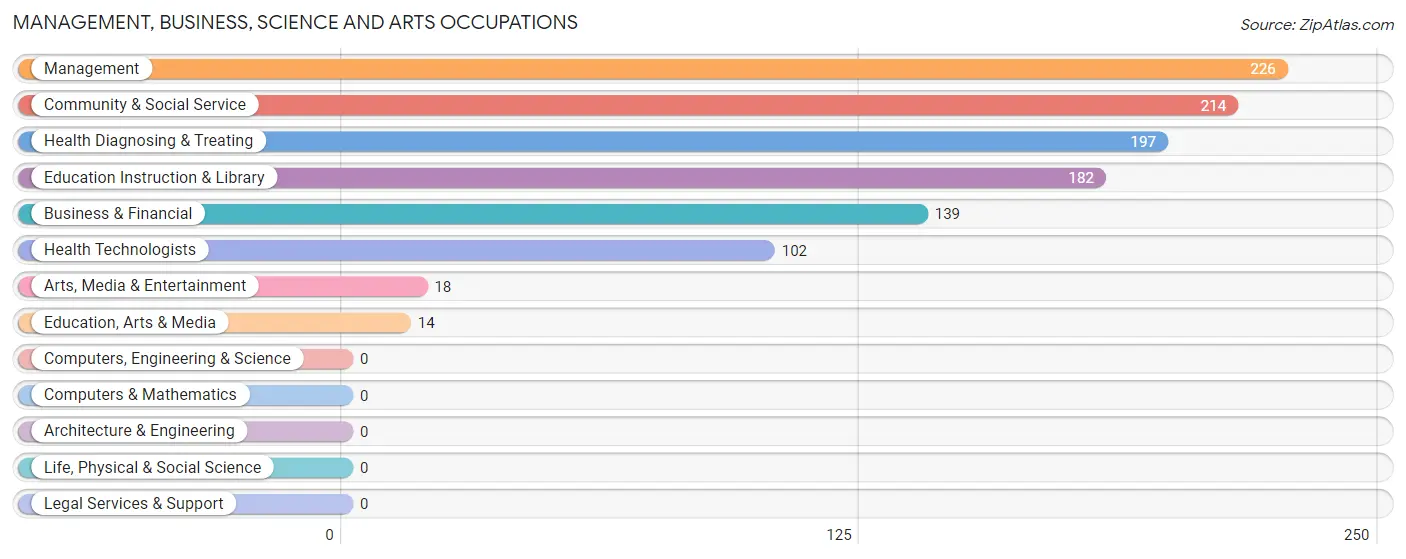
Management, Business, Science and Arts Occupations by Sex
Within the Management, Business, Science and Arts occupations in Corozal, the most male-oriented occupations are Arts, Media & Entertainment (100.0%), Management (73.9%), and Health Technologists (54.9%), while the most female-oriented occupations are Education, Arts & Media (100.0%), Education Instruction & Library (100.0%), and Community & Social Service (91.6%).
| Occupation | Male | Female |
| Management | 167 (73.9%) | 59 (26.1%) |
| Business & Financial | 53 (38.1%) | 86 (61.9%) |
| Computers, Engineering & Science | 0 (0.0%) | 0 (0.0%) |
| Computers & Mathematics | 0 (0.0%) | 0 (0.0%) |
| Architecture & Engineering | 0 (0.0%) | 0 (0.0%) |
| Life, Physical & Social Science | 0 (0.0%) | 0 (0.0%) |
| Community & Social Service | 18 (8.4%) | 196 (91.6%) |
| Education, Arts & Media | 0 (0.0%) | 14 (100.0%) |
| Legal Services & Support | 0 (0.0%) | 0 (0.0%) |
| Education Instruction & Library | 0 (0.0%) | 182 (100.0%) |
| Arts, Media & Entertainment | 18 (100.0%) | 0 (0.0%) |
| Health Diagnosing & Treating | 69 (35.0%) | 128 (65.0%) |
| Health Technologists | 56 (54.9%) | 46 (45.1%) |
| Total (Category) | 307 (39.6%) | 469 (60.4%) |
| Total (Overall) | 1,734 (60.3%) | 1,141 (39.7%) |
Services Occupations
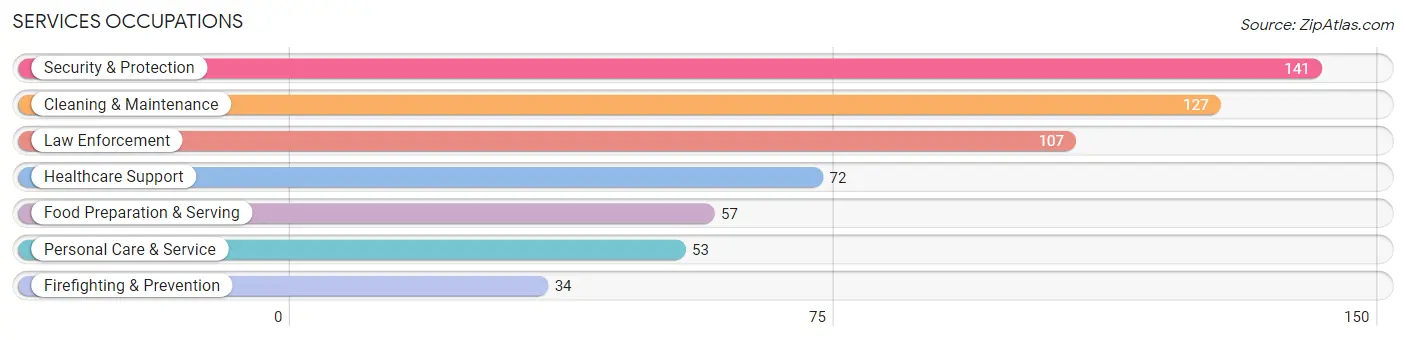
The most common Services occupations in Corozal are Security & Protection (141 | 4.9%), Cleaning & Maintenance (127 | 4.4%), Law Enforcement (107 | 3.7%), Healthcare Support (72 | 2.5%), and Food Preparation & Serving (57 | 2.0%).
Services Occupations by Sex
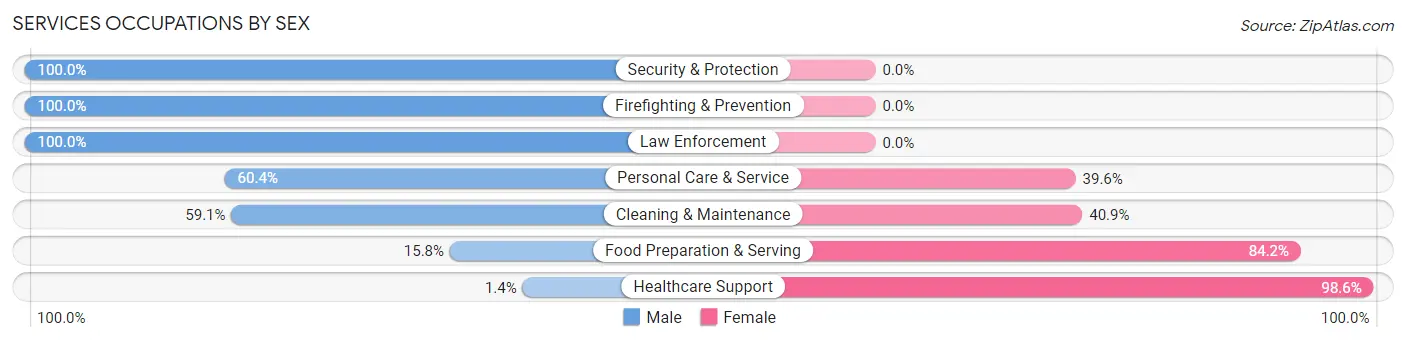
Within the Services occupations in Corozal, the most male-oriented occupations are Security & Protection (100.0%), Firefighting & Prevention (100.0%), and Law Enforcement (100.0%), while the most female-oriented occupations are Healthcare Support (98.6%), Food Preparation & Serving (84.2%), and Cleaning & Maintenance (40.9%).
| Occupation | Male | Female |
| Healthcare Support | 1 (1.4%) | 71 (98.6%) |
| Security & Protection | 141 (100.0%) | 0 (0.0%) |
| Firefighting & Prevention | 34 (100.0%) | 0 (0.0%) |
| Law Enforcement | 107 (100.0%) | 0 (0.0%) |
| Food Preparation & Serving | 9 (15.8%) | 48 (84.2%) |
| Cleaning & Maintenance | 75 (59.1%) | 52 (40.9%) |
| Personal Care & Service | 32 (60.4%) | 21 (39.6%) |
| Total (Category) | 258 (57.3%) | 192 (42.7%) |
| Total (Overall) | 1,734 (60.3%) | 1,141 (39.7%) |
Sales and Office Occupations
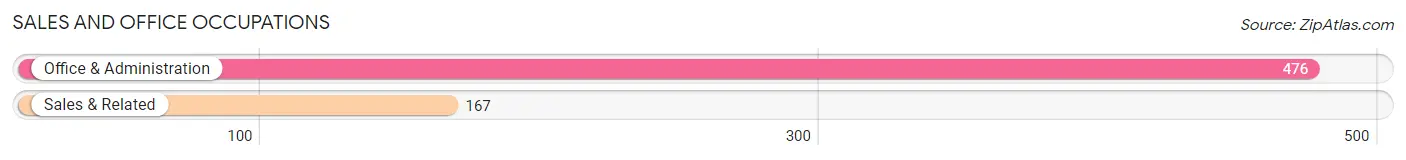
The most common Sales and Office occupations in Corozal are Office & Administration (476 | 16.6%), and Sales & Related (167 | 5.8%).
Sales and Office Occupations by Sex
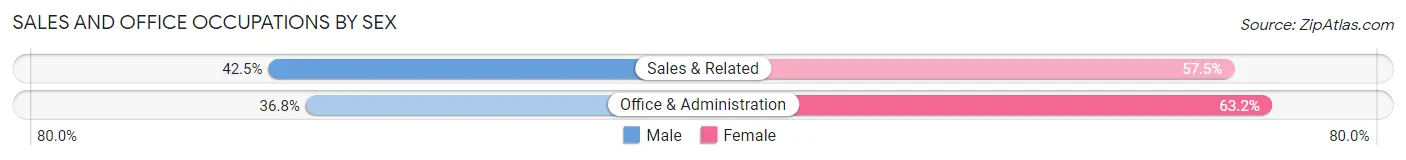
| Occupation | Male | Female |
| Sales & Related | 71 (42.5%) | 96 (57.5%) |
| Office & Administration | 175 (36.8%) | 301 (63.2%) |
| Total (Category) | 246 (38.3%) | 397 (61.7%) |
| Total (Overall) | 1,734 (60.3%) | 1,141 (39.7%) |
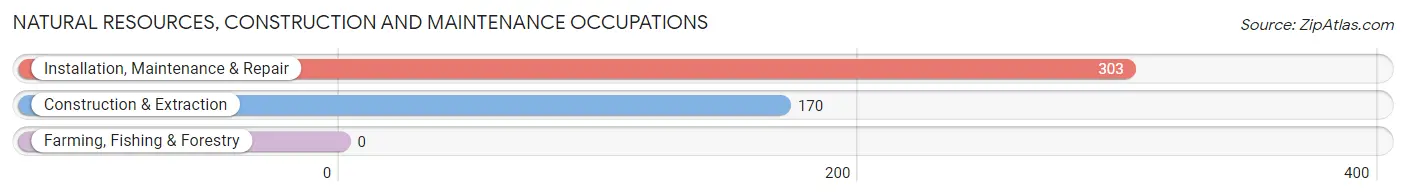
Natural Resources, Construction and Maintenance Occupations
The most common Natural Resources, Construction and Maintenance occupations in Corozal are Installation, Maintenance & Repair (303 | 10.5%), and Construction & Extraction (170 | 5.9%).
Natural Resources, Construction and Maintenance Occupations by Sex
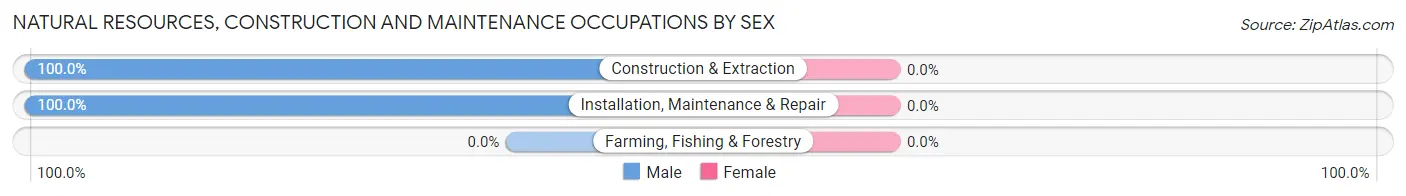
| Occupation | Male | Female |
| Farming, Fishing & Forestry | 0 (0.0%) | 0 (0.0%) |
| Construction & Extraction | 170 (100.0%) | 0 (0.0%) |
| Installation, Maintenance & Repair | 303 (100.0%) | 0 (0.0%) |
| Total (Category) | 473 (100.0%) | 0 (0.0%) |
| Total (Overall) | 1,734 (60.3%) | 1,141 (39.7%) |
Production, Transportation and Moving Occupations
The most common Production, Transportation and Moving occupations in Corozal are Production (198 | 6.9%), Material Moving (188 | 6.5%), and Transportation (147 | 5.1%).
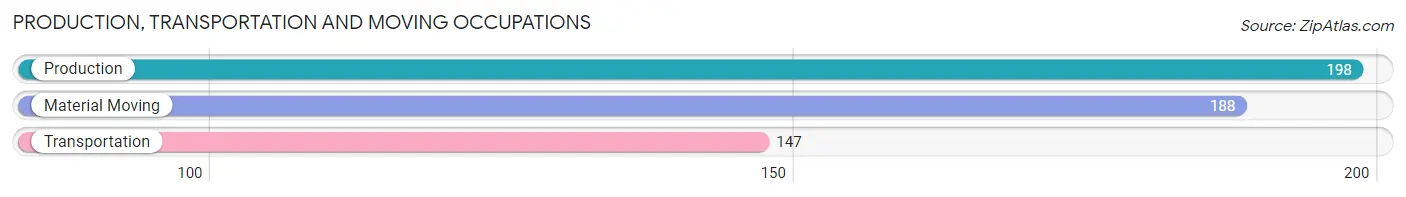
Production, Transportation and Moving Occupations by Sex
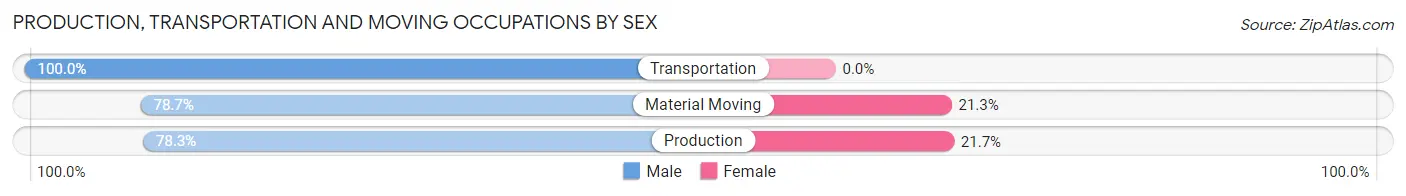
| Occupation | Male | Female |
| Production | 155 (78.3%) | 43 (21.7%) |
| Transportation | 147 (100.0%) | 0 (0.0%) |
| Material Moving | 148 (78.7%) | 40 (21.3%) |
| Total (Category) | 450 (84.4%) | 83 (15.6%) |
| Total (Overall) | 1,734 (60.3%) | 1,141 (39.7%) |
Employment Industries by Sex in Corozal
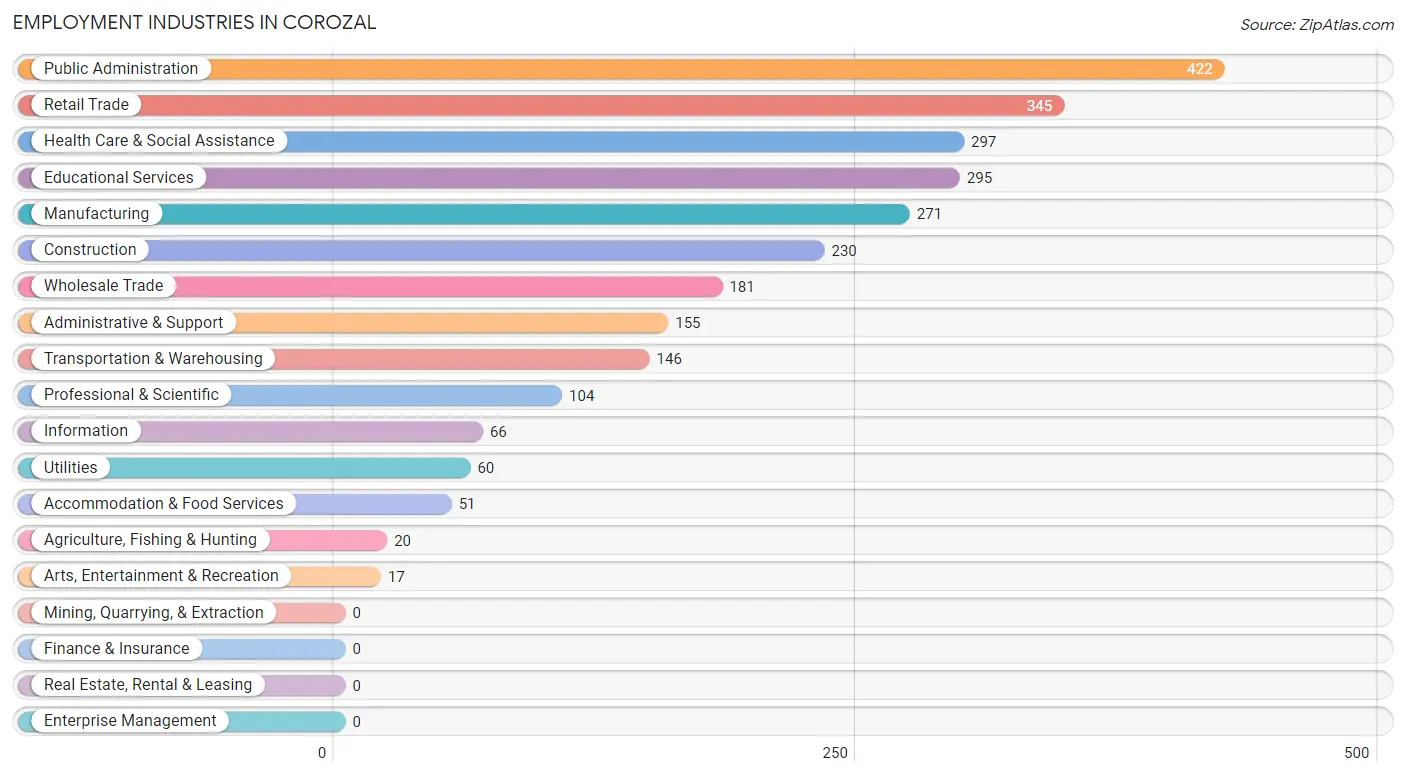
Employment Industries in Corozal
The major employment industries in Corozal include Public Administration (422 | 14.7%), Retail Trade (345 | 12.0%), Health Care & Social Assistance (297 | 10.3%), Educational Services (295 | 10.3%), and Manufacturing (271 | 9.4%).
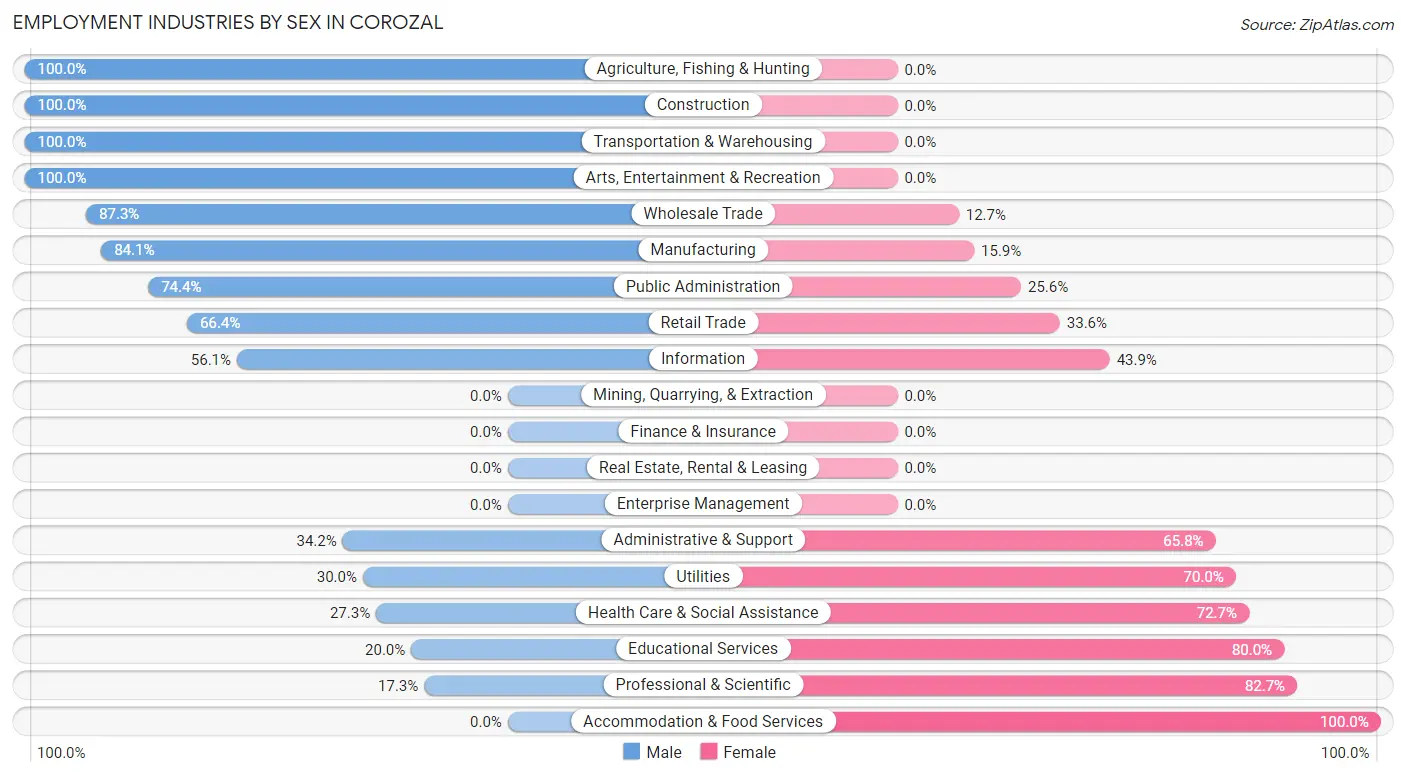
Employment Industries by Sex in Corozal
The Corozal industries that see more men than women are Agriculture, Fishing & Hunting (100.0%), Construction (100.0%), and Transportation & Warehousing (100.0%), whereas the industries that tend to have a higher number of women are Accommodation & Food Services (100.0%), Professional & Scientific (82.7%), and Educational Services (80.0%).
| Industry | Male | Female |
| Agriculture, Fishing & Hunting | 20 (100.0%) | 0 (0.0%) |
| Mining, Quarrying, & Extraction | 0 (0.0%) | 0 (0.0%) |
| Construction | 230 (100.0%) | 0 (0.0%) |
| Manufacturing | 228 (84.1%) | 43 (15.9%) |
| Wholesale Trade | 158 (87.3%) | 23 (12.7%) |
| Retail Trade | 229 (66.4%) | 116 (33.6%) |
| Transportation & Warehousing | 146 (100.0%) | 0 (0.0%) |
| Utilities | 18 (30.0%) | 42 (70.0%) |
| Information | 37 (56.1%) | 29 (43.9%) |
| Finance & Insurance | 0 (0.0%) | 0 (0.0%) |
| Real Estate, Rental & Leasing | 0 (0.0%) | 0 (0.0%) |
| Professional & Scientific | 18 (17.3%) | 86 (82.7%) |
| Enterprise Management | 0 (0.0%) | 0 (0.0%) |
| Administrative & Support | 53 (34.2%) | 102 (65.8%) |
| Educational Services | 59 (20.0%) | 236 (80.0%) |
| Health Care & Social Assistance | 81 (27.3%) | 216 (72.7%) |
| Arts, Entertainment & Recreation | 17 (100.0%) | 0 (0.0%) |
| Accommodation & Food Services | 0 (0.0%) | 51 (100.0%) |
| Public Administration | 314 (74.4%) | 108 (25.6%) |
| Total | 1,734 (60.3%) | 1,141 (39.7%) |
Education in Corozal
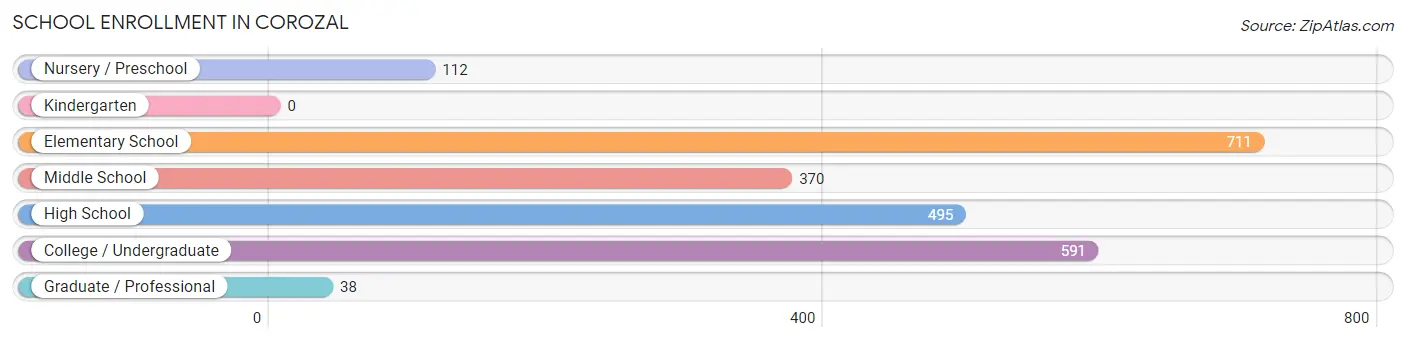
School Enrollment in Corozal
The most common levels of schooling among the 2,317 students in Corozal are elementary school (711 | 30.7%), college / undergraduate (591 | 25.5%), and high school (495 | 21.4%).
| School Level | # Students | % Students |
| Nursery / Preschool | 112 | 4.8% |
| Kindergarten | 0 | 0.0% |
| Elementary School | 711 | 30.7% |
| Middle School | 370 | 16.0% |
| High School | 495 | 21.4% |
| College / Undergraduate | 591 | 25.5% |
| Graduate / Professional | 38 | 1.6% |
| Total | 2,317 | 100.0% |
School Enrollment by Age by Funding Source in Corozal
Out of a total of 2,317 students who are enrolled in schools in Corozal, 505 (21.8%) attend a private institution, while the remaining 1,812 (78.2%) are enrolled in public schools. The age group of 20 to 24 year olds has the highest likelihood of being enrolled in private schools, with 145 (73.2% in the age bracket) enrolled. Conversely, the age group of 5 to 9 year old has the lowest likelihood of being enrolled in a private school, with 711 (100.0% in the age bracket) attending a public institution.
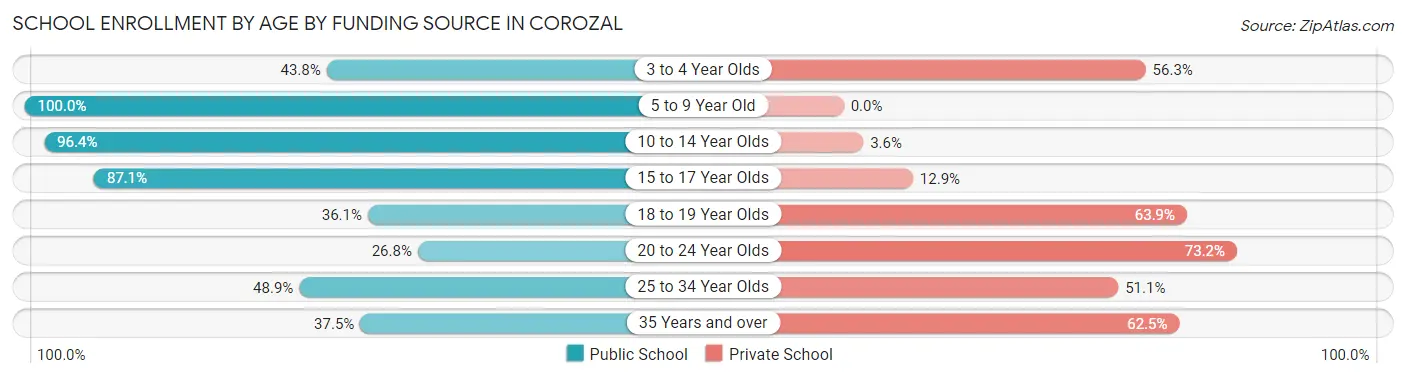
| Age Bracket | Public School | Private School |
| 3 to 4 Year Olds | 49 (43.8%) | 63 (56.2%) |
| 5 to 9 Year Old | 711 (100.0%) | 0 (0.0%) |
| 10 to 14 Year Olds | 477 (96.4%) | 18 (3.6%) |
| 15 to 17 Year Olds | 378 (87.1%) | 56 (12.9%) |
| 18 to 19 Year Olds | 92 (36.1%) | 163 (63.9%) |
| 20 to 24 Year Olds | 53 (26.8%) | 145 (73.2%) |
| 25 to 34 Year Olds | 43 (48.9%) | 45 (51.1%) |
| 35 Years and over | 9 (37.5%) | 15 (62.5%) |
| Total | 1,812 (78.2%) | 505 (21.8%) |
Educational Attainment by Field of Study in Corozal
Education (380 | 31.7%), business (301 | 25.1%), science & technology (167 | 13.9%), arts & humanities (96 | 8.0%), and computers & mathematics (76 | 6.3%) are the most common fields of study among 1,198 individuals in Corozal who have obtained a bachelor's degree or higher.
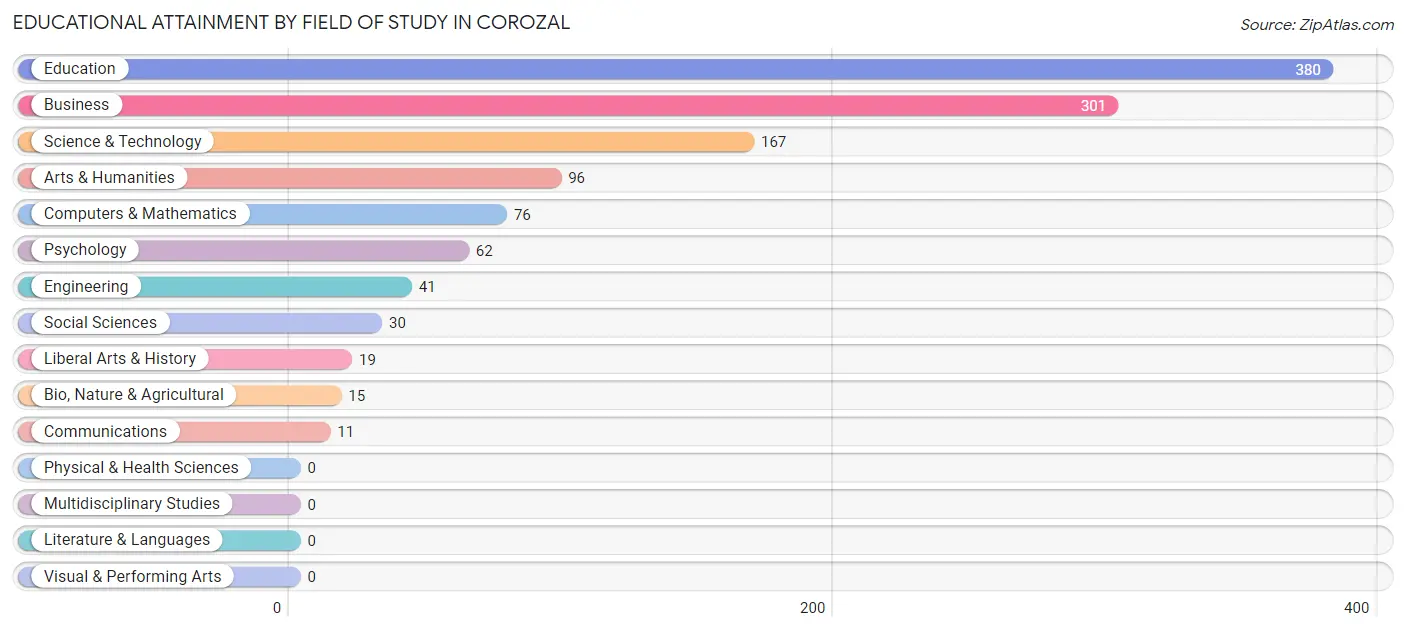
| Field of Study | # Graduates | % Graduates |
| Computers & Mathematics | 76 | 6.3% |
| Bio, Nature & Agricultural | 15 | 1.3% |
| Physical & Health Sciences | 0 | 0.0% |
| Psychology | 62 | 5.2% |
| Social Sciences | 30 | 2.5% |
| Engineering | 41 | 3.4% |
| Multidisciplinary Studies | 0 | 0.0% |
| Science & Technology | 167 | 13.9% |
| Business | 301 | 25.1% |
| Education | 380 | 31.7% |
| Literature & Languages | 0 | 0.0% |
| Liberal Arts & History | 19 | 1.6% |
| Visual & Performing Arts | 0 | 0.0% |
| Communications | 11 | 0.9% |
| Arts & Humanities | 96 | 8.0% |
| Total | 1,198 | 100.0% |
Transportation & Commute in Corozal
Vehicle Availability by Sex in Corozal
The most prevalent vehicle ownership categories in Corozal are males with 2 vehicles (613, accounting for 35.8%) and females with 2 vehicles (391, making up 57.6%).
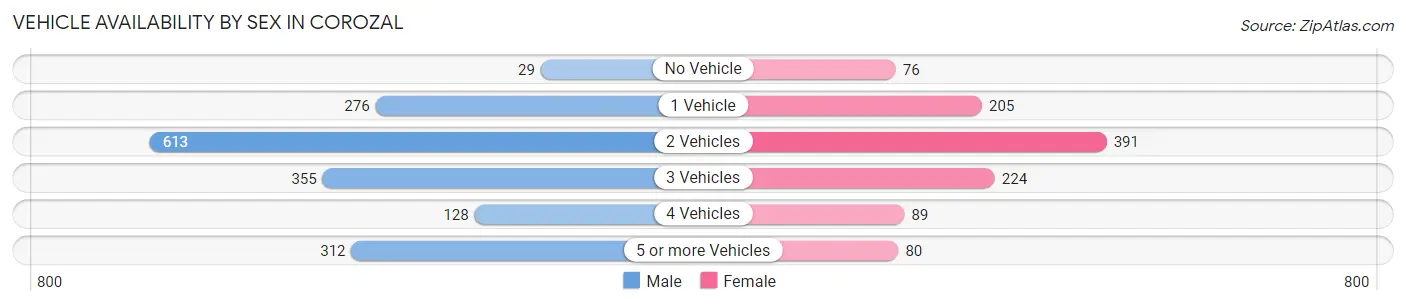
| Vehicles Available | Male | Female |
| No Vehicle | 29 (1.7%) | 76 (7.1%) |
| 1 Vehicle | 276 (16.1%) | 205 (19.3%) |
| 2 Vehicles | 613 (35.8%) | 391 (36.7%) |
| 3 Vehicles | 355 (20.7%) | 224 (21.0%) |
| 4 Vehicles | 128 (7.5%) | 89 (8.4%) |
| 5 or more Vehicles | 312 (18.2%) | 80 (7.5%) |
| Total | 1,713 (100.0%) | 1,065 (100.0%) |
Commute Time in Corozal
The most frequently occuring commute durations in Corozal are 45 to 59 minutes (471 commuters, 17.2%), 30 to 34 minutes (430 commuters, 15.7%), and 60 to 89 minutes (372 commuters, 13.6%).
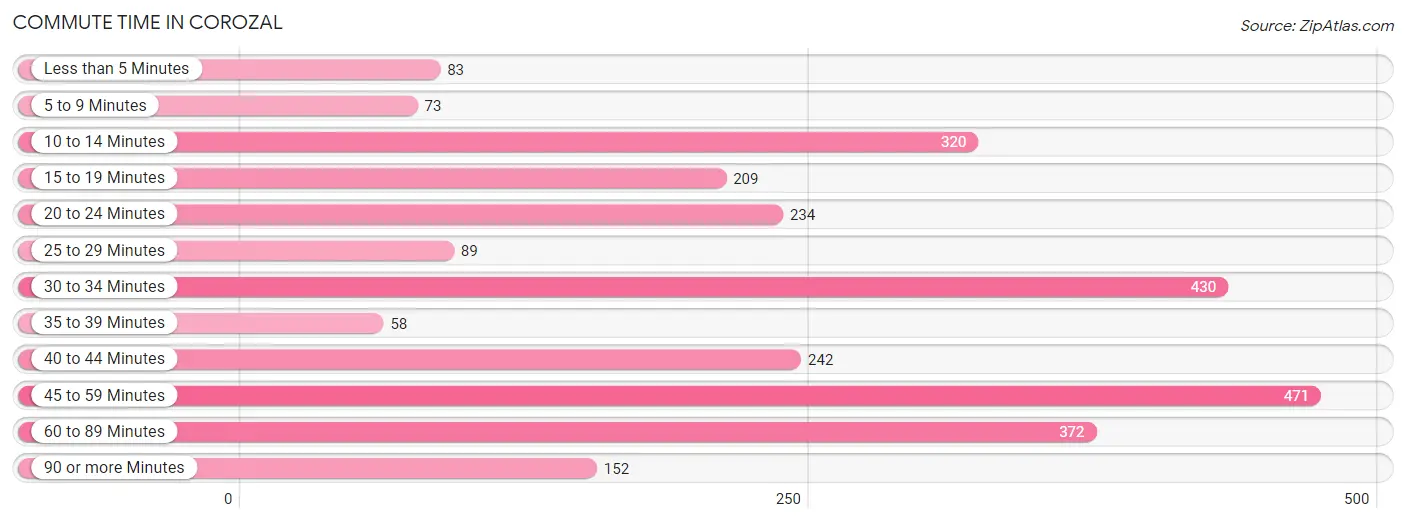
| Commute Time | # Commuters | % Commuters |
| Less than 5 Minutes | 83 | 3.0% |
| 5 to 9 Minutes | 73 | 2.7% |
| 10 to 14 Minutes | 320 | 11.7% |
| 15 to 19 Minutes | 209 | 7.6% |
| 20 to 24 Minutes | 234 | 8.6% |
| 25 to 29 Minutes | 89 | 3.3% |
| 30 to 34 Minutes | 430 | 15.7% |
| 35 to 39 Minutes | 58 | 2.1% |
| 40 to 44 Minutes | 242 | 8.8% |
| 45 to 59 Minutes | 471 | 17.2% |
| 60 to 89 Minutes | 372 | 13.6% |
| 90 or more Minutes | 152 | 5.6% |
Commute Time by Sex in Corozal
The most common commute times in Corozal are 45 to 59 minutes (366 commuters, 21.4%) for males and 10 to 14 minutes (192 commuters, 18.8%) for females.
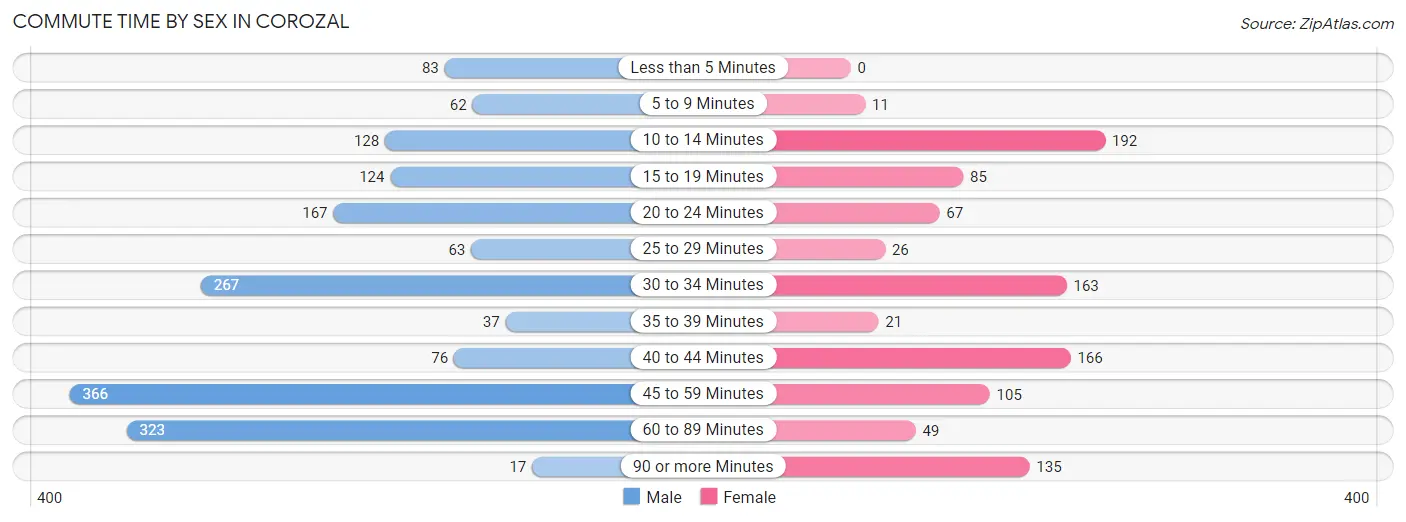
| Commute Time | Male | Female |
| Less than 5 Minutes | 83 (4.9%) | 0 (0.0%) |
| 5 to 9 Minutes | 62 (3.6%) | 11 (1.1%) |
| 10 to 14 Minutes | 128 (7.5%) | 192 (18.8%) |
| 15 to 19 Minutes | 124 (7.2%) | 85 (8.3%) |
| 20 to 24 Minutes | 167 (9.8%) | 67 (6.6%) |
| 25 to 29 Minutes | 63 (3.7%) | 26 (2.5%) |
| 30 to 34 Minutes | 267 (15.6%) | 163 (16.0%) |
| 35 to 39 Minutes | 37 (2.2%) | 21 (2.1%) |
| 40 to 44 Minutes | 76 (4.4%) | 166 (16.3%) |
| 45 to 59 Minutes | 366 (21.4%) | 105 (10.3%) |
| 60 to 89 Minutes | 323 (18.9%) | 49 (4.8%) |
| 90 or more Minutes | 17 (1.0%) | 135 (13.2%) |
Time of Departure to Work by Sex in Corozal
The most frequent times of departure to work in Corozal are 12:00 AM to 4:59 AM (359, 21.0%) for males and 6:30 AM to 6:59 AM (281, 27.6%) for females.
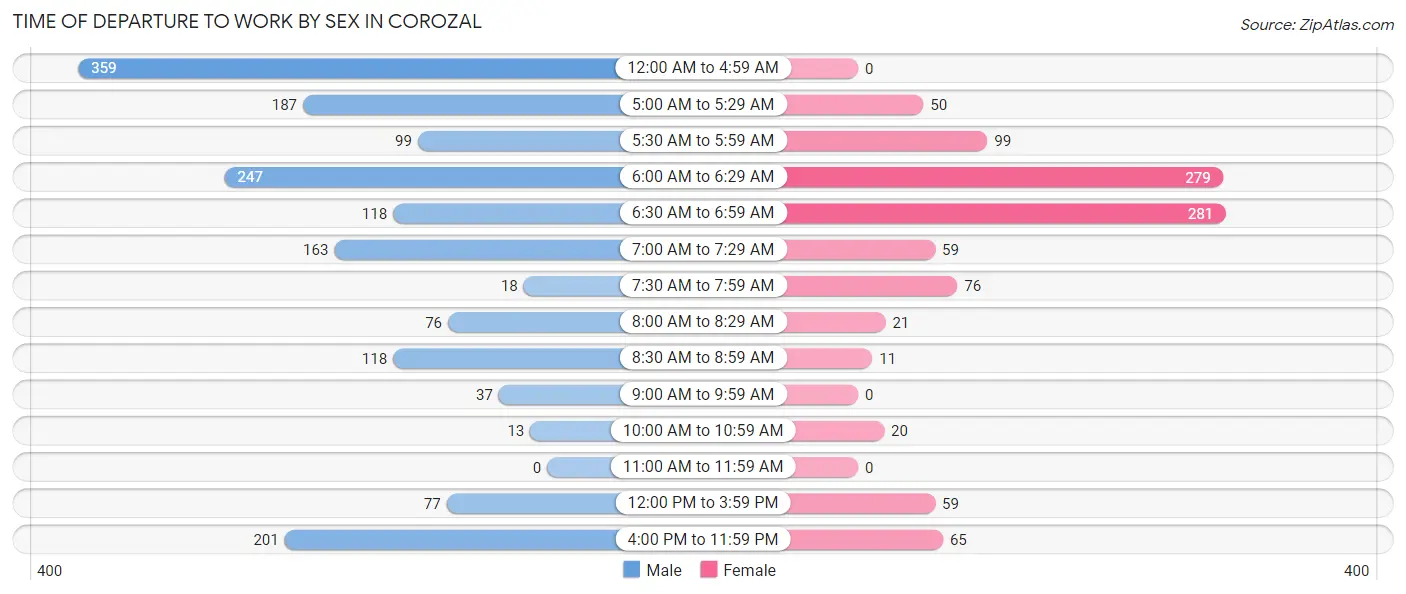
| Time of Departure | Male | Female |
| 12:00 AM to 4:59 AM | 359 (21.0%) | 0 (0.0%) |
| 5:00 AM to 5:29 AM | 187 (10.9%) | 50 (4.9%) |
| 5:30 AM to 5:59 AM | 99 (5.8%) | 99 (9.7%) |
| 6:00 AM to 6:29 AM | 247 (14.4%) | 279 (27.4%) |
| 6:30 AM to 6:59 AM | 118 (6.9%) | 281 (27.6%) |
| 7:00 AM to 7:29 AM | 163 (9.5%) | 59 (5.8%) |
| 7:30 AM to 7:59 AM | 18 (1.1%) | 76 (7.4%) |
| 8:00 AM to 8:29 AM | 76 (4.4%) | 21 (2.1%) |
| 8:30 AM to 8:59 AM | 118 (6.9%) | 11 (1.1%) |
| 9:00 AM to 9:59 AM | 37 (2.2%) | 0 (0.0%) |
| 10:00 AM to 10:59 AM | 13 (0.8%) | 20 (2.0%) |
| 11:00 AM to 11:59 AM | 0 (0.0%) | 0 (0.0%) |
| 12:00 PM to 3:59 PM | 77 (4.5%) | 59 (5.8%) |
| 4:00 PM to 11:59 PM | 201 (11.7%) | 65 (6.4%) |
| Total | 1,713 (100.0%) | 1,020 (100.0%) |
Housing Occupancy in Corozal
Occupancy by Ownership in Corozal
Of the total 3,341 dwellings in Corozal, owner-occupied units account for 2,239 (67.0%), while renter-occupied units make up 1,102 (33.0%).
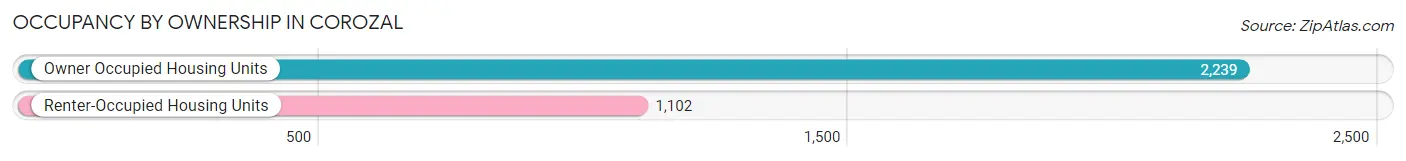
| Occupancy | # Housing Units | % Housing Units |
| Owner Occupied Housing Units | 2,239 | 67.0% |
| Renter-Occupied Housing Units | 1,102 | 33.0% |
| Total Occupied Housing Units | 3,341 | 100.0% |
Occupancy by Household Size in Corozal
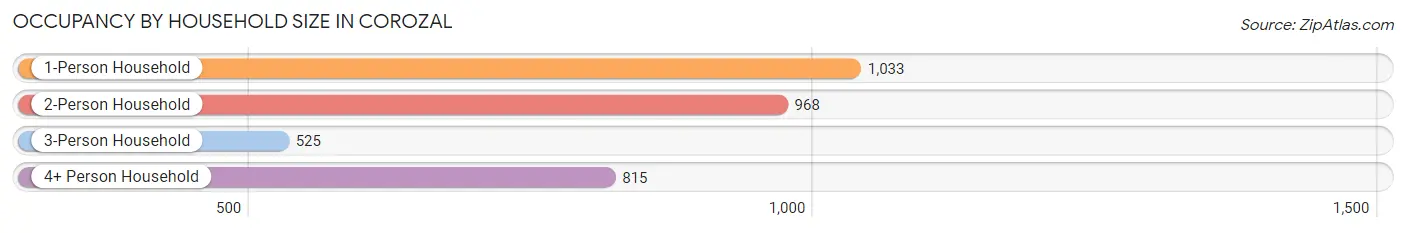
| Household Size | # Housing Units | % Housing Units |
| 1-Person Household | 1,033 | 30.9% |
| 2-Person Household | 968 | 29.0% |
| 3-Person Household | 525 | 15.7% |
| 4+ Person Household | 815 | 24.4% |
| Total Housing Units | 3,341 | 100.0% |
Occupancy by Ownership by Household Size in Corozal
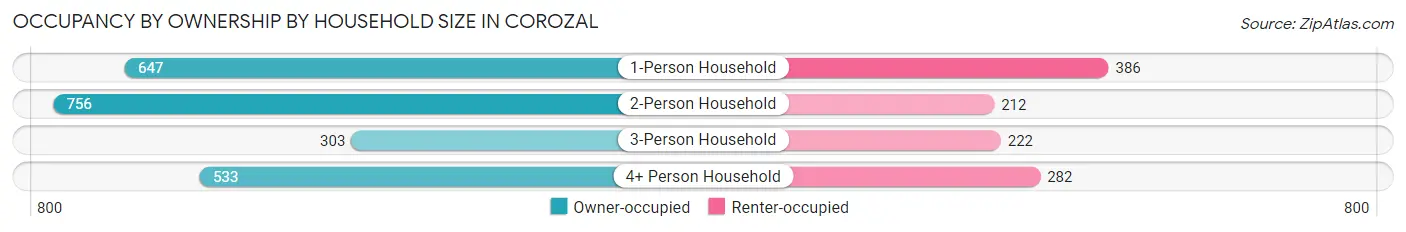
| Household Size | Owner-occupied | Renter-occupied |
| 1-Person Household | 647 (62.6%) | 386 (37.4%) |
| 2-Person Household | 756 (78.1%) | 212 (21.9%) |
| 3-Person Household | 303 (57.7%) | 222 (42.3%) |
| 4+ Person Household | 533 (65.4%) | 282 (34.6%) |
| Total Housing Units | 2,239 (67.0%) | 1,102 (33.0%) |
Occupancy by Educational Attainment in Corozal
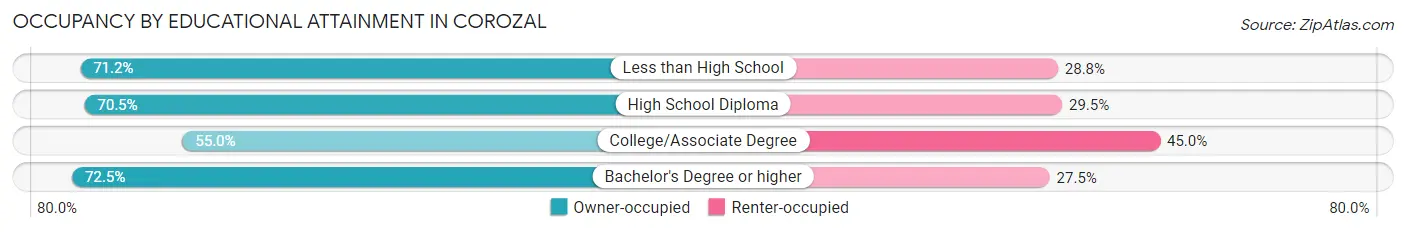
| Household Size | Owner-occupied | Renter-occupied |
| Less than High School | 726 (71.2%) | 294 (28.8%) |
| High School Diploma | 634 (70.5%) | 265 (29.5%) |
| College/Associate Degree | 476 (55.0%) | 390 (45.0%) |
| Bachelor's Degree or higher | 403 (72.5%) | 153 (27.5%) |
Occupancy by Age of Householder in Corozal
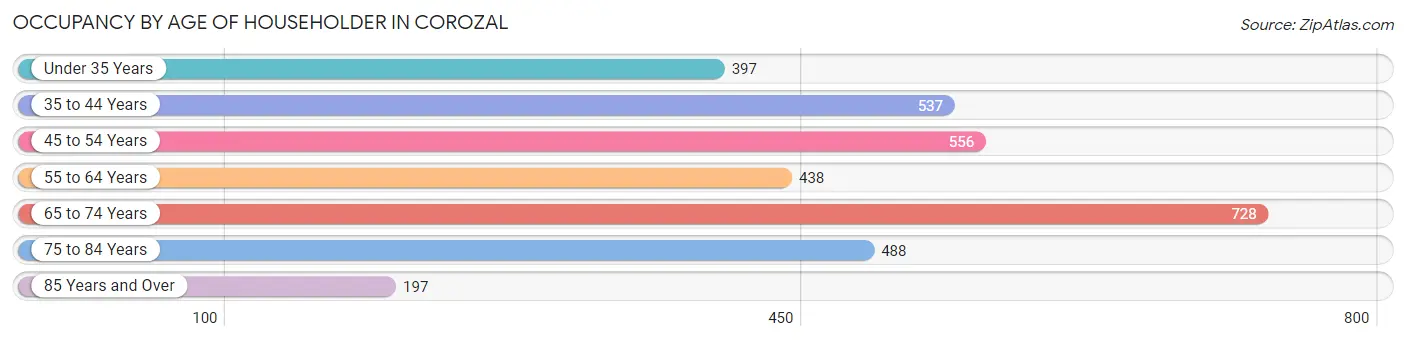
| Age Bracket | # Households | % Households |
| Under 35 Years | 397 | 11.9% |
| 35 to 44 Years | 537 | 16.1% |
| 45 to 54 Years | 556 | 16.6% |
| 55 to 64 Years | 438 | 13.1% |
| 65 to 74 Years | 728 | 21.8% |
| 75 to 84 Years | 488 | 14.6% |
| 85 Years and Over | 197 | 5.9% |
| Total | 3,341 | 100.0% |
Housing Finances in Corozal
Median Income by Occupancy in Corozal
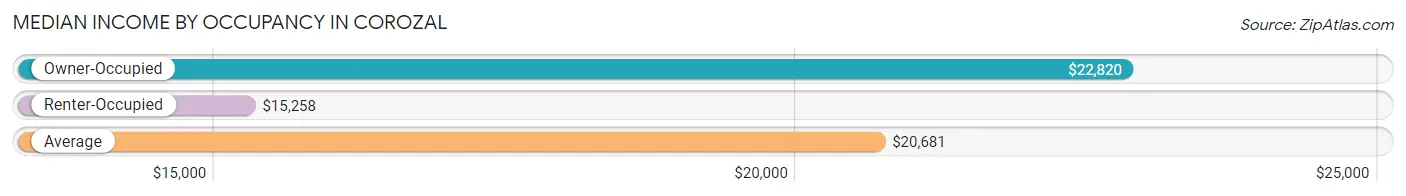
| Occupancy Type | # Households | Median Income |
| Owner-Occupied | 2,239 (67.0%) | $22,820 |
| Renter-Occupied | 1,102 (33.0%) | $15,258 |
| Average | 3,341 (100.0%) | $20,681 |
Occupancy by Householder Income Bracket in Corozal
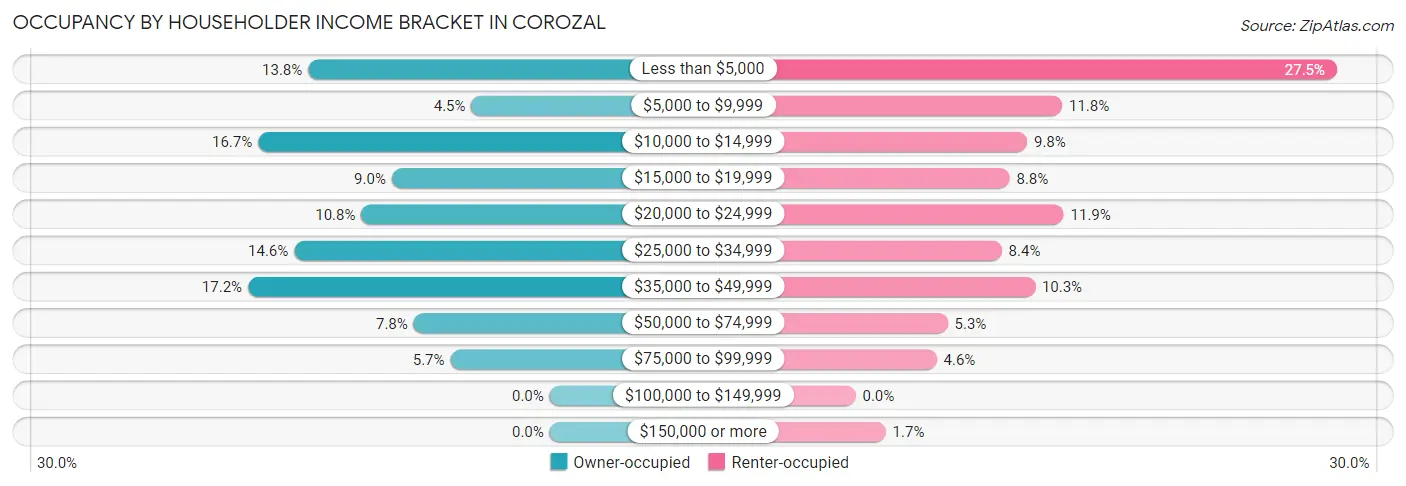
| Income Bracket | Owner-occupied | Renter-occupied |
| Less than $5,000 | 309 (13.8%) | 303 (27.5%) |
| $5,000 to $9,999 | 100 (4.5%) | 130 (11.8%) |
| $10,000 to $14,999 | 373 (16.7%) | 108 (9.8%) |
| $15,000 to $19,999 | 202 (9.0%) | 97 (8.8%) |
| $20,000 to $24,999 | 241 (10.8%) | 131 (11.9%) |
| $25,000 to $34,999 | 327 (14.6%) | 92 (8.4%) |
| $35,000 to $49,999 | 386 (17.2%) | 113 (10.2%) |
| $50,000 to $74,999 | 174 (7.8%) | 58 (5.3%) |
| $75,000 to $99,999 | 127 (5.7%) | 51 (4.6%) |
| $100,000 to $149,999 | 0 (0.0%) | 0 (0.0%) |
| $150,000 or more | 0 (0.0%) | 19 (1.7%) |
| Total | 2,239 (100.0%) | 1,102 (100.0%) |
Monthly Housing Cost Tiers in Corozal
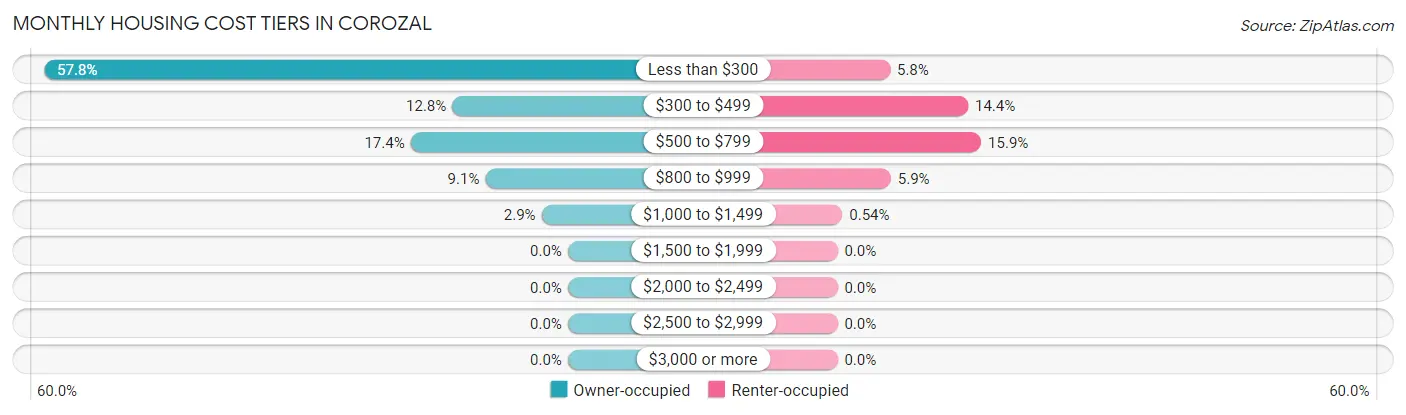
| Monthly Cost | Owner-occupied | Renter-occupied |
| Less than $300 | 1,295 (57.8%) | 64 (5.8%) |
| $300 to $499 | 286 (12.8%) | 159 (14.4%) |
| $500 to $799 | 389 (17.4%) | 175 (15.9%) |
| $800 to $999 | 204 (9.1%) | 65 (5.9%) |
| $1,000 to $1,499 | 65 (2.9%) | 6 (0.5%) |
| $1,500 to $1,999 | 0 (0.0%) | 0 (0.0%) |
| $2,000 to $2,499 | 0 (0.0%) | 0 (0.0%) |
| $2,500 to $2,999 | 0 (0.0%) | 0 (0.0%) |
| $3,000 or more | 0 (0.0%) | 0 (0.0%) |
| Total | 2,239 (100.0%) | 1,102 (100.0%) |
Physical Housing Characteristics in Corozal
Housing Structures in Corozal
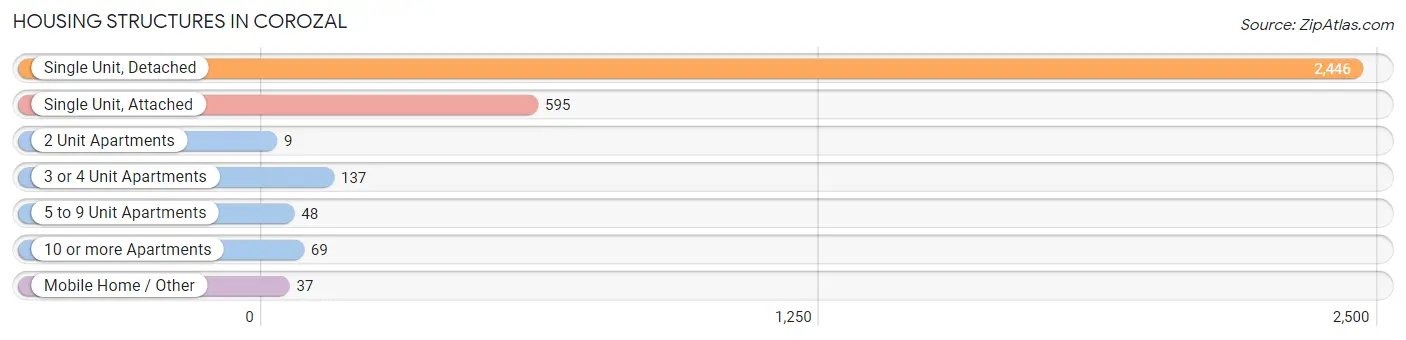
| Structure Type | # Housing Units | % Housing Units |
| Single Unit, Detached | 2,446 | 73.2% |
| Single Unit, Attached | 595 | 17.8% |
| 2 Unit Apartments | 9 | 0.3% |
| 3 or 4 Unit Apartments | 137 | 4.1% |
| 5 to 9 Unit Apartments | 48 | 1.4% |
| 10 or more Apartments | 69 | 2.1% |
| Mobile Home / Other | 37 | 1.1% |
| Total | 3,341 | 100.0% |
Housing Structures by Occupancy in Corozal
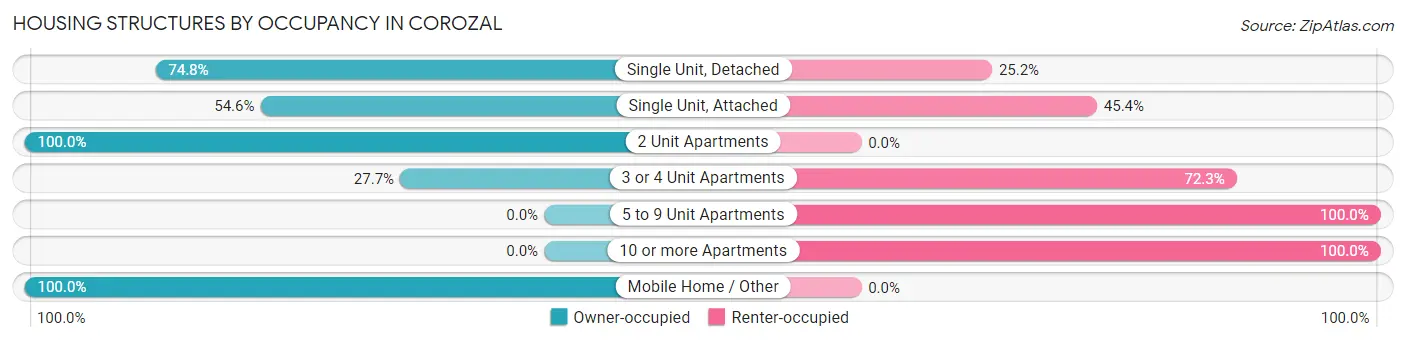
| Structure Type | Owner-occupied | Renter-occupied |
| Single Unit, Detached | 1,830 (74.8%) | 616 (25.2%) |
| Single Unit, Attached | 325 (54.6%) | 270 (45.4%) |
| 2 Unit Apartments | 9 (100.0%) | 0 (0.0%) |
| 3 or 4 Unit Apartments | 38 (27.7%) | 99 (72.3%) |
| 5 to 9 Unit Apartments | 0 (0.0%) | 48 (100.0%) |
| 10 or more Apartments | 0 (0.0%) | 69 (100.0%) |
| Mobile Home / Other | 37 (100.0%) | 0 (0.0%) |
| Total | 2,239 (67.0%) | 1,102 (33.0%) |
Housing Structures by Number of Rooms in Corozal
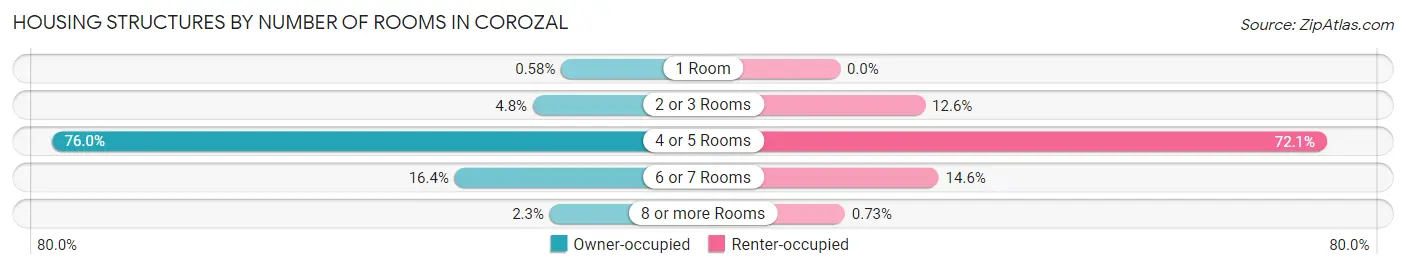
| Number of Rooms | Owner-occupied | Renter-occupied |
| 1 Room | 13 (0.6%) | 0 (0.0%) |
| 2 or 3 Rooms | 107 (4.8%) | 139 (12.6%) |
| 4 or 5 Rooms | 1,702 (76.0%) | 794 (72.1%) |
| 6 or 7 Rooms | 366 (16.4%) | 161 (14.6%) |
| 8 or more Rooms | 51 (2.3%) | 8 (0.7%) |
| Total | 2,239 (100.0%) | 1,102 (100.0%) |
Housing Structure by Heating Type in Corozal
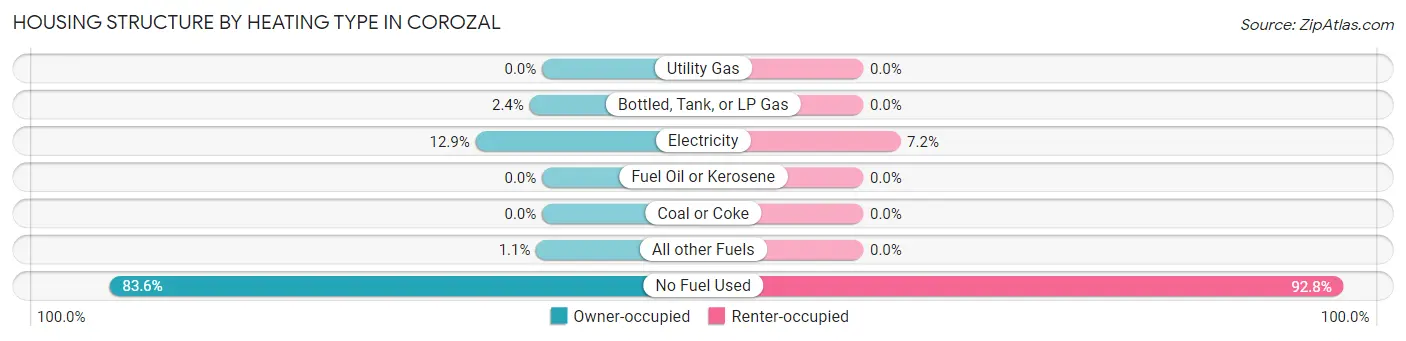
| Heating Type | Owner-occupied | Renter-occupied |
| Utility Gas | 0 (0.0%) | 0 (0.0%) |
| Bottled, Tank, or LP Gas | 54 (2.4%) | 0 (0.0%) |
| Electricity | 288 (12.9%) | 79 (7.2%) |
| Fuel Oil or Kerosene | 0 (0.0%) | 0 (0.0%) |
| Coal or Coke | 0 (0.0%) | 0 (0.0%) |
| All other Fuels | 25 (1.1%) | 0 (0.0%) |
| No Fuel Used | 1,872 (83.6%) | 1,023 (92.8%) |
| Total | 2,239 (100.0%) | 1,102 (100.0%) |
Household Vehicle Usage in Corozal
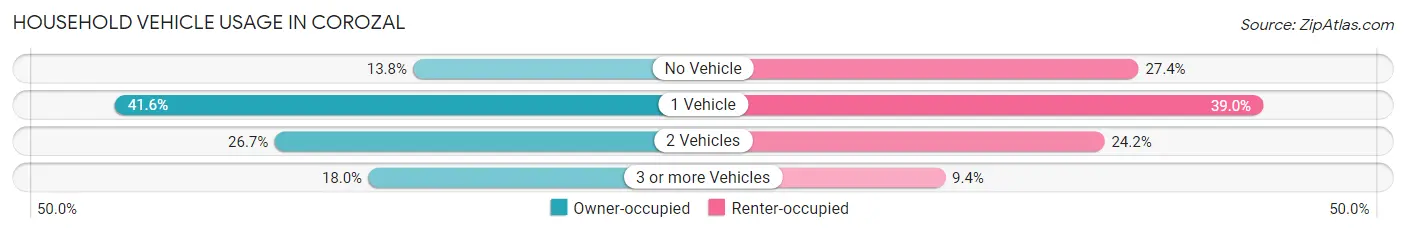
| Vehicles per Household | Owner-occupied | Renter-occupied |
| No Vehicle | 308 (13.8%) | 302 (27.4%) |
| 1 Vehicle | 931 (41.6%) | 430 (39.0%) |
| 2 Vehicles | 598 (26.7%) | 267 (24.2%) |
| 3 or more Vehicles | 402 (17.9%) | 103 (9.3%) |
| Total | 2,239 (100.0%) | 1,102 (100.0%) |
Real Estate & Mortgages in Corozal
Real Estate and Mortgage Overview in Corozal
| Characteristic | Without Mortgage | With Mortgage |
| Housing Units | 1,557 | 682 |
| Median Property Value | $113,500 | $122,700 |
| Median Household Income | $18,098 | $0 |
| Monthly Housing Costs | $151 | $0 |
| Real Estate Taxes | - | - |
Property Value by Mortgage Status in Corozal
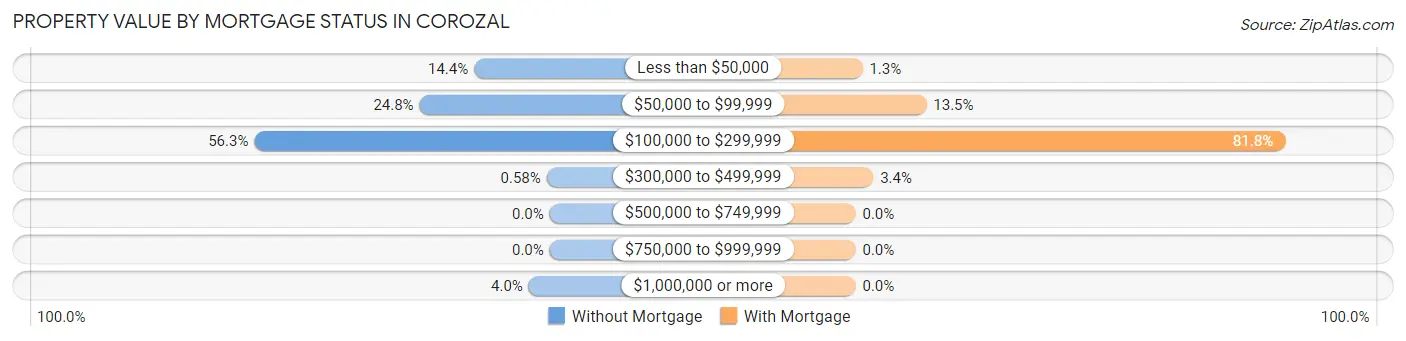
| Property Value | Without Mortgage | With Mortgage |
| Less than $50,000 | 224 (14.4%) | 9 (1.3%) |
| $50,000 to $99,999 | 386 (24.8%) | 92 (13.5%) |
| $100,000 to $299,999 | 876 (56.3%) | 558 (81.8%) |
| $300,000 to $499,999 | 9 (0.6%) | 23 (3.4%) |
| $500,000 to $749,999 | 0 (0.0%) | 0 (0.0%) |
| $750,000 to $999,999 | 0 (0.0%) | 0 (0.0%) |
| $1,000,000 or more | 62 (4.0%) | 0 (0.0%) |
| Total | 1,557 (100.0%) | 682 (100.0%) |
Household Income by Mortgage Status in Corozal
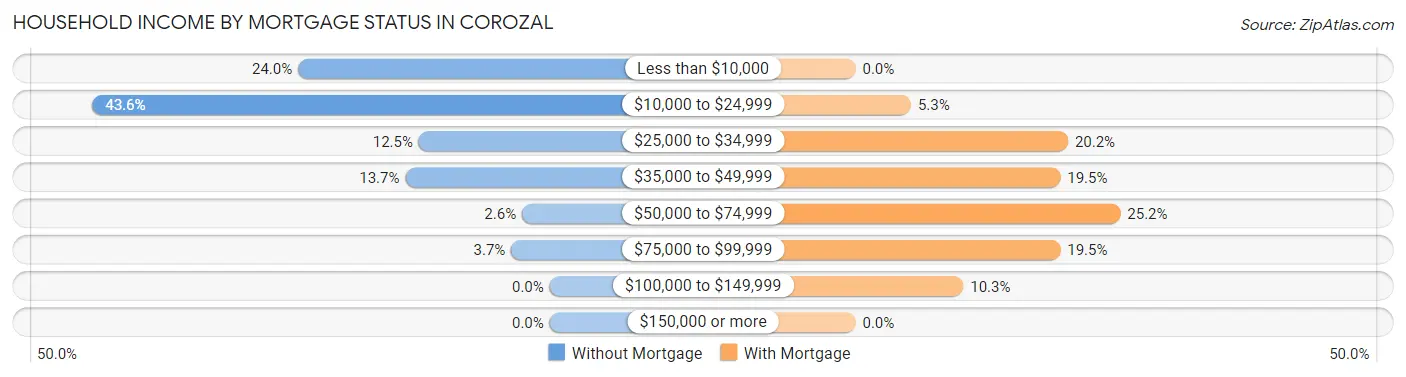
| Household Income | Without Mortgage | With Mortgage |
| Less than $10,000 | 373 (24.0%) | 0 (0.0%) |
| $10,000 to $24,999 | 678 (43.5%) | 36 (5.3%) |
| $25,000 to $34,999 | 194 (12.5%) | 138 (20.2%) |
| $35,000 to $49,999 | 214 (13.7%) | 133 (19.5%) |
| $50,000 to $74,999 | 41 (2.6%) | 172 (25.2%) |
| $75,000 to $99,999 | 57 (3.7%) | 133 (19.5%) |
| $100,000 to $149,999 | 0 (0.0%) | 70 (10.3%) |
| $150,000 or more | 0 (0.0%) | 0 (0.0%) |
| Total | 1,557 (100.0%) | 682 (100.0%) |
Property Value to Household Income Ratio in Corozal
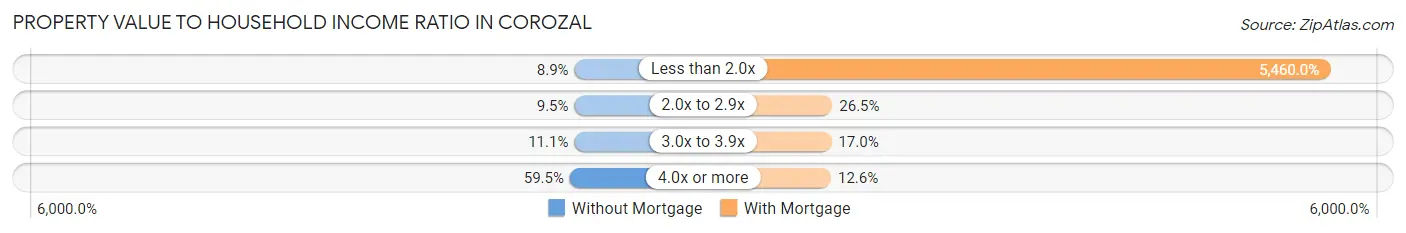
| Value-to-Income Ratio | Without Mortgage | With Mortgage |
| Less than 2.0x | 139 (8.9%) | 37,237 (5,460.0%) |
| 2.0x to 2.9x | 148 (9.5%) | 181 (26.5%) |
| 3.0x to 3.9x | 172 (11.1%) | 116 (17.0%) |
| 4.0x or more | 927 (59.5%) | 86 (12.6%) |
| Total | 1,557 (100.0%) | 682 (100.0%) |
Real Estate Taxes by Mortgage Status in Corozal
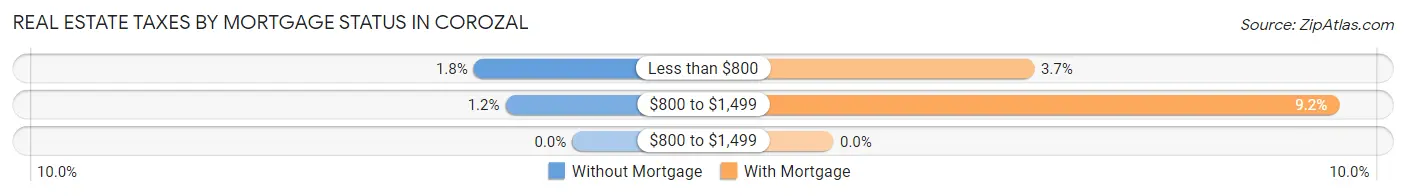
| Property Taxes | Without Mortgage | With Mortgage |
| Less than $800 | 28 (1.8%) | 25 (3.7%) |
| $800 to $1,499 | 19 (1.2%) | 63 (9.2%) |
| $800 to $1,499 | 0 (0.0%) | 0 (0.0%) |
| Total | 1,557 (100.0%) | 682 (100.0%) |
Health & Disability in Corozal
Health Insurance Coverage by Age in Corozal
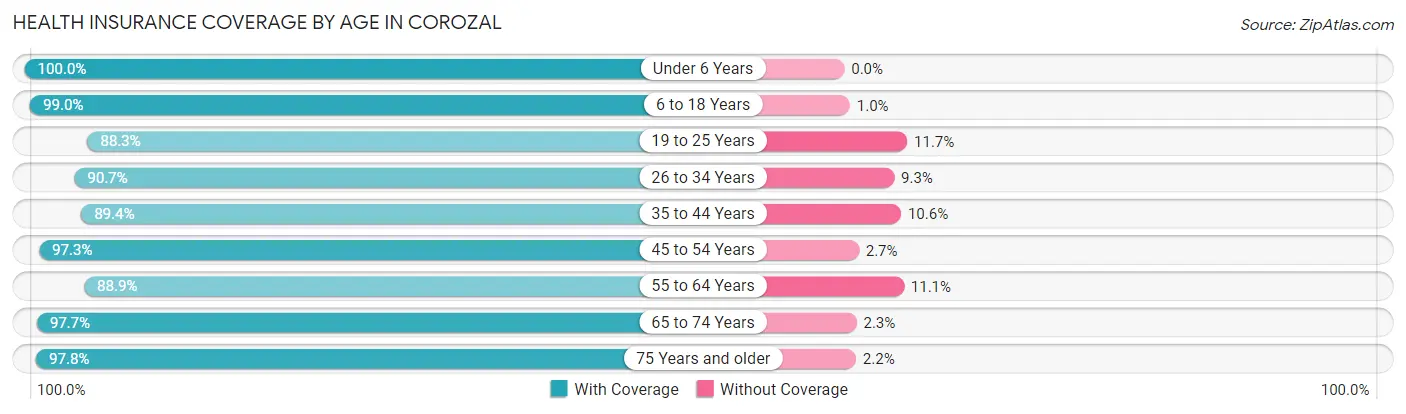
| Age Bracket | With Coverage | Without Coverage |
| Under 6 Years | 414 (100.0%) | 0 (0.0%) |
| 6 to 18 Years | 1,809 (99.0%) | 19 (1.0%) |
| 19 to 25 Years | 905 (88.3%) | 120 (11.7%) |
| 26 to 34 Years | 1,045 (90.7%) | 107 (9.3%) |
| 35 to 44 Years | 1,117 (89.4%) | 132 (10.6%) |
| 45 to 54 Years | 1,046 (97.3%) | 29 (2.7%) |
| 55 to 64 Years | 1,072 (88.9%) | 134 (11.1%) |
| 65 to 74 Years | 1,073 (97.7%) | 25 (2.3%) |
| 75 Years and older | 949 (97.8%) | 21 (2.2%) |
| Total | 9,430 (94.1%) | 587 (5.9%) |
Health Insurance Coverage by Citizenship Status in Corozal
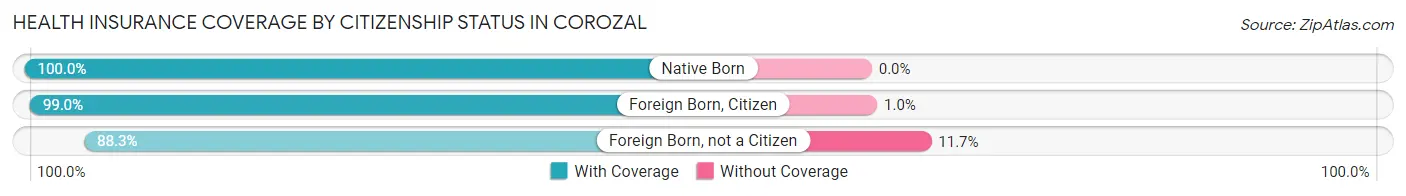
| Citizenship Status | With Coverage | Without Coverage |
| Native Born | 414 (100.0%) | 0 (0.0%) |
| Foreign Born, Citizen | 1,809 (99.0%) | 19 (1.0%) |
| Foreign Born, not a Citizen | 905 (88.3%) | 120 (11.7%) |
Health Insurance Coverage by Household Income in Corozal
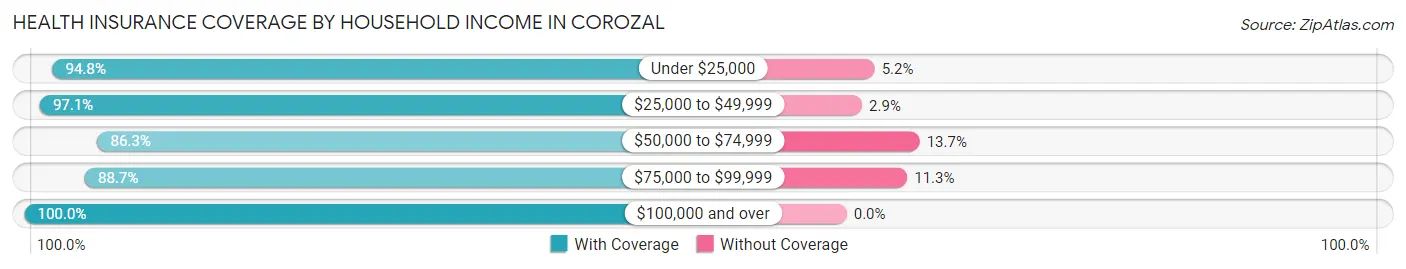
| Household Income | With Coverage | Without Coverage |
| Under $25,000 | 5,240 (94.8%) | 290 (5.2%) |
| $25,000 to $49,999 | 2,493 (97.1%) | 74 (2.9%) |
| $50,000 to $74,999 | 777 (86.3%) | 123 (13.7%) |
| $75,000 to $99,999 | 782 (88.7%) | 100 (11.3%) |
| $100,000 and over | 114 (100.0%) | 0 (0.0%) |
Public vs Private Health Insurance Coverage by Age in Corozal
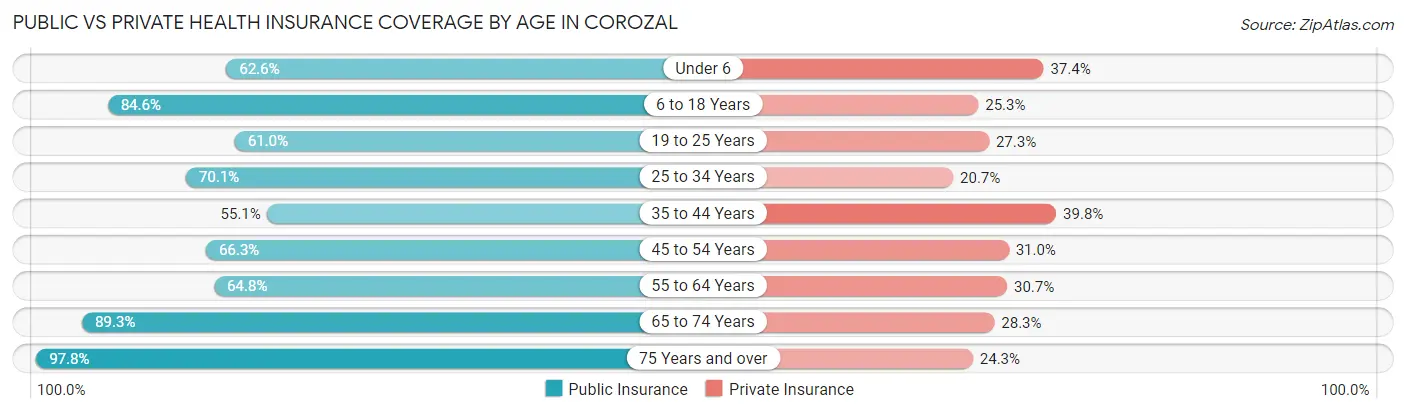
| Age Bracket | Public Insurance | Private Insurance |
| Under 6 | 259 (62.6%) | 155 (37.4%) |
| 6 to 18 Years | 1,546 (84.6%) | 463 (25.3%) |
| 19 to 25 Years | 625 (61.0%) | 280 (27.3%) |
| 25 to 34 Years | 807 (70.1%) | 238 (20.7%) |
| 35 to 44 Years | 688 (55.1%) | 497 (39.8%) |
| 45 to 54 Years | 713 (66.3%) | 333 (31.0%) |
| 55 to 64 Years | 782 (64.8%) | 370 (30.7%) |
| 65 to 74 Years | 981 (89.3%) | 311 (28.3%) |
| 75 Years and over | 949 (97.8%) | 236 (24.3%) |
| Total | 7,350 (73.4%) | 2,883 (28.8%) |
Disability Status by Sex by Age in Corozal
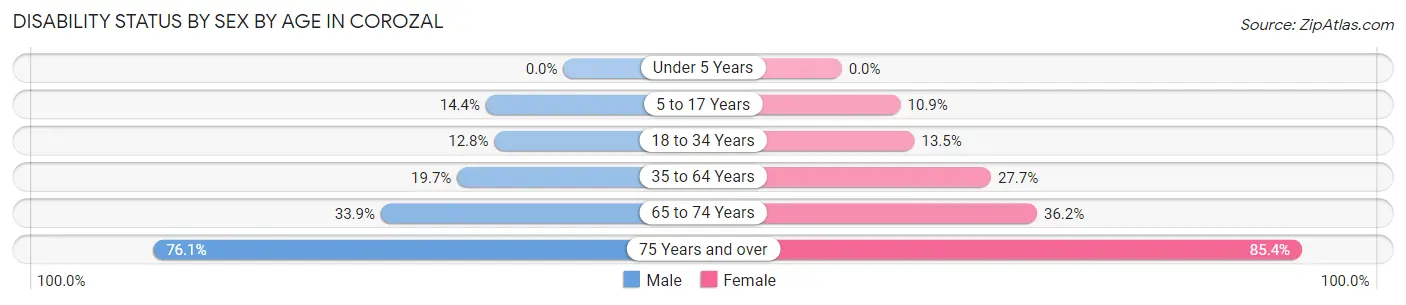
| Age Bracket | Male | Female |
| Under 5 Years | 0 (0.0%) | 0 (0.0%) |
| 5 to 17 Years | 125 (14.4%) | 89 (10.9%) |
| 18 to 34 Years | 183 (12.8%) | 130 (13.5%) |
| 35 to 64 Years | 318 (19.7%) | 531 (27.7%) |
| 65 to 74 Years | 143 (33.9%) | 245 (36.2%) |
| 75 Years and over | 290 (76.1%) | 503 (85.4%) |
Disability Class by Sex by Age in Corozal
Disability Class: Hearing Difficulty
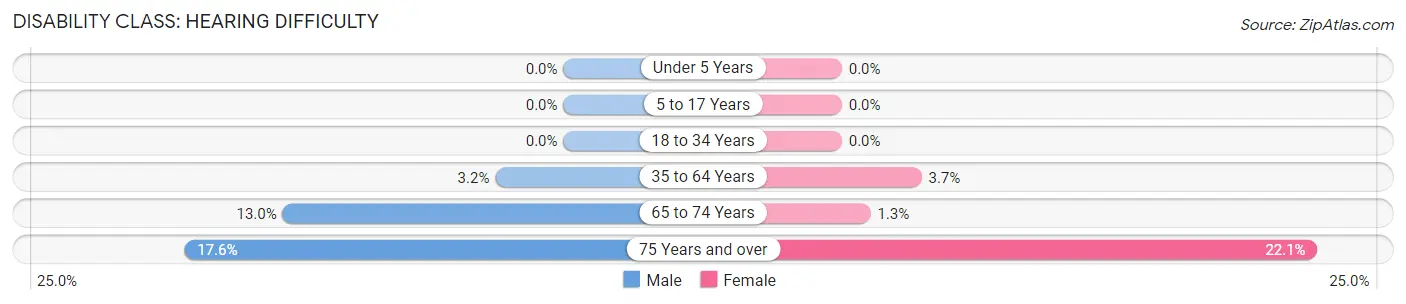
| Age Bracket | Male | Female |
| Under 5 Years | 0 (0.0%) | 0 (0.0%) |
| 5 to 17 Years | 0 (0.0%) | 0 (0.0%) |
| 18 to 34 Years | 0 (0.0%) | 0 (0.0%) |
| 35 to 64 Years | 51 (3.2%) | 71 (3.7%) |
| 65 to 74 Years | 55 (13.0%) | 9 (1.3%) |
| 75 Years and over | 67 (17.6%) | 130 (22.1%) |
Disability Class: Vision Difficulty
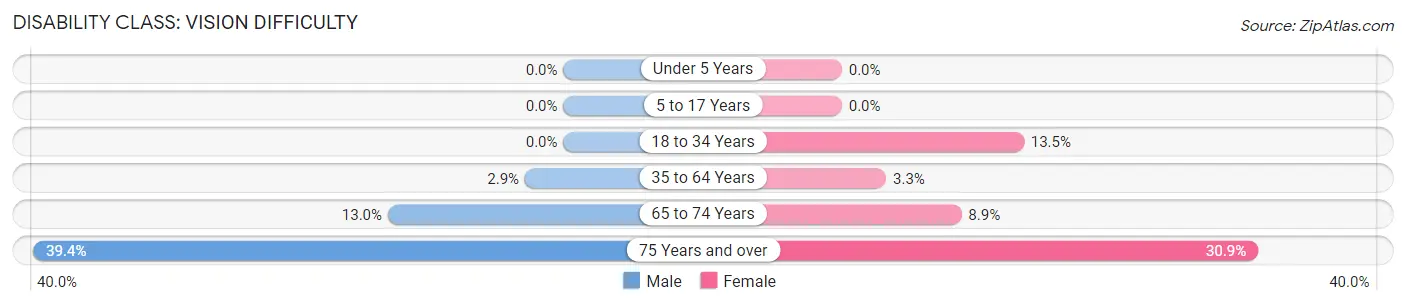
| Age Bracket | Male | Female |
| Under 5 Years | 0 (0.0%) | 0 (0.0%) |
| 5 to 17 Years | 0 (0.0%) | 0 (0.0%) |
| 18 to 34 Years | 0 (0.0%) | 130 (13.5%) |
| 35 to 64 Years | 46 (2.9%) | 63 (3.3%) |
| 65 to 74 Years | 55 (13.0%) | 60 (8.9%) |
| 75 Years and over | 150 (39.4%) | 182 (30.9%) |
Disability Class: Cognitive Difficulty
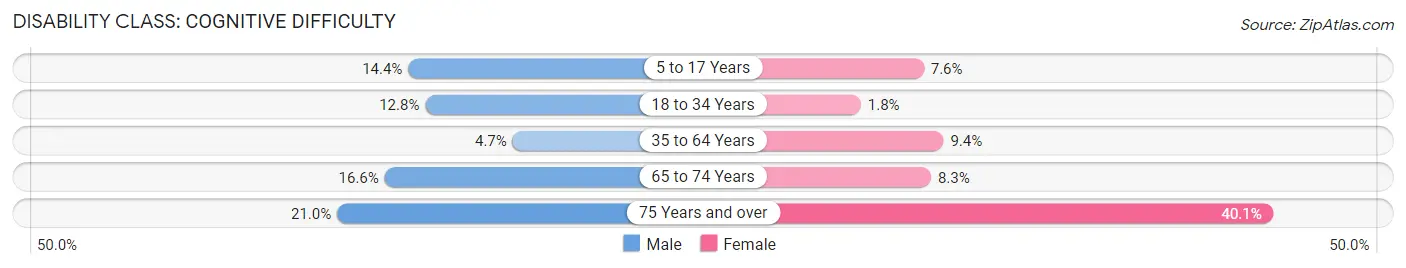
| Age Bracket | Male | Female |
| 5 to 17 Years | 125 (14.4%) | 62 (7.6%) |
| 18 to 34 Years | 183 (12.8%) | 17 (1.8%) |
| 35 to 64 Years | 76 (4.7%) | 181 (9.4%) |
| 65 to 74 Years | 70 (16.6%) | 56 (8.3%) |
| 75 Years and over | 80 (21.0%) | 236 (40.1%) |
Disability Class: Ambulatory Difficulty
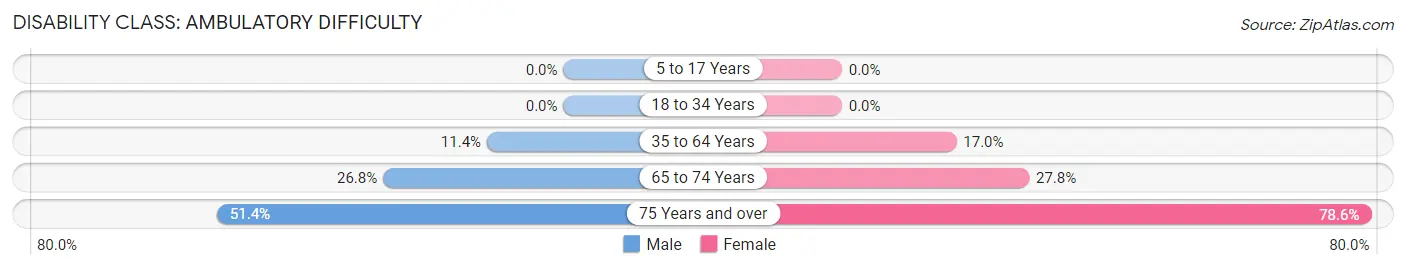
| Age Bracket | Male | Female |
| 5 to 17 Years | 0 (0.0%) | 0 (0.0%) |
| 18 to 34 Years | 0 (0.0%) | 0 (0.0%) |
| 35 to 64 Years | 183 (11.4%) | 326 (17.0%) |
| 65 to 74 Years | 113 (26.8%) | 188 (27.8%) |
| 75 Years and over | 196 (51.4%) | 463 (78.6%) |
Disability Class: Self-Care Difficulty
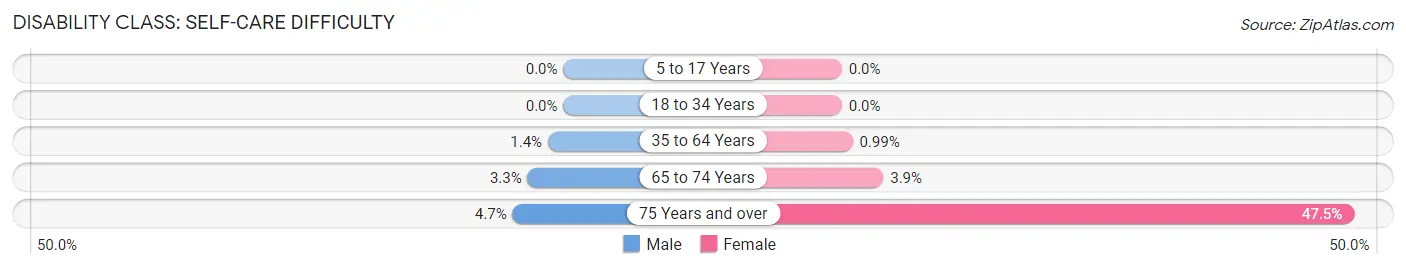
| Age Bracket | Male | Female |
| 5 to 17 Years | 0 (0.0%) | 0 (0.0%) |
| 18 to 34 Years | 0 (0.0%) | 0 (0.0%) |
| 35 to 64 Years | 23 (1.4%) | 19 (1.0%) |
| 65 to 74 Years | 14 (3.3%) | 26 (3.8%) |
| 75 Years and over | 18 (4.7%) | 280 (47.5%) |
Technology Access in Corozal
Computing Device Access in Corozal
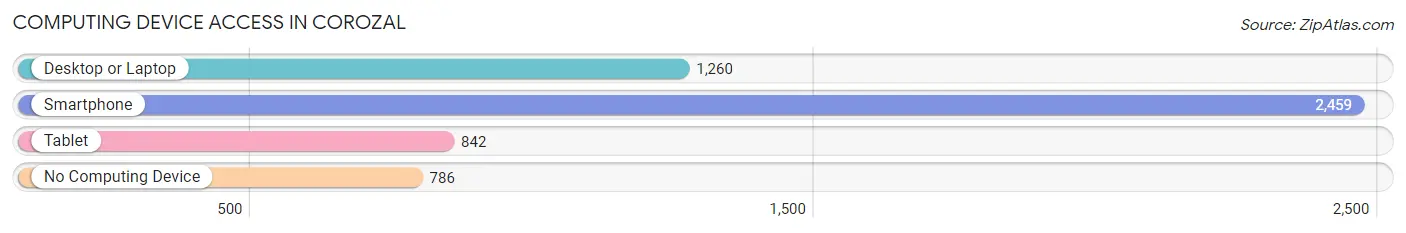
| Device Type | # Households | % Households |
| Desktop or Laptop | 1,260 | 37.7% |
| Smartphone | 2,459 | 73.6% |
| Tablet | 842 | 25.2% |
| No Computing Device | 786 | 23.5% |
| Total | 3,341 | 100.0% |
Internet Access in Corozal
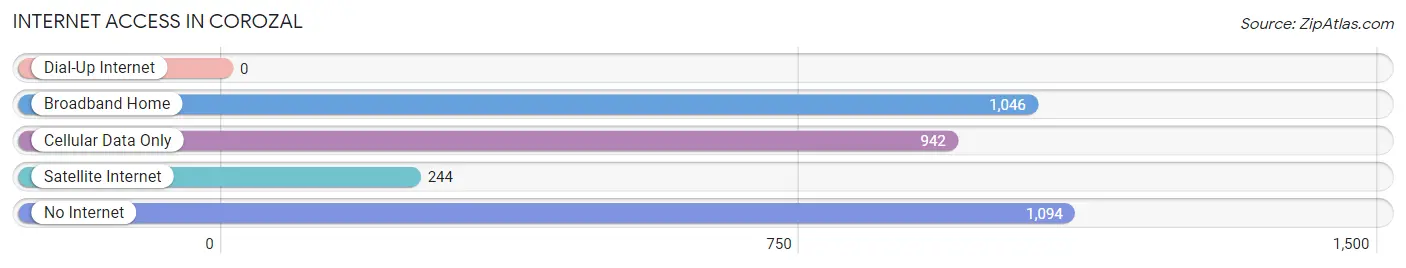
| Internet Type | # Households | % Households |
| Dial-Up Internet | 0 | 0.0% |
| Broadband Home | 1,046 | 31.3% |
| Cellular Data Only | 942 | 28.2% |
| Satellite Internet | 244 | 7.3% |
| No Internet | 1,094 | 32.7% |
| Total | 3,341 | 100.0% |
Corozal Summary
Corozal is a municipality located in the northern region of Puerto Rico. It is bordered by the municipalities of Toa Baja, Bayamón, Naranjito, and Toa Alta. The municipality is part of the San Juan-Caguas-Guaynabo Metropolitan Statistical Area. As of the 2010 census, the population of Corozal was 33,293.
History
The area of Corozal was originally inhabited by the Taíno Indians. The first Spanish settlers arrived in the area in the early 16th century. The area was officially founded in 1795 and was named after the Corozal River. The municipality was officially established in 1808.
During the 19th century, the economy of Corozal was based on the production of sugar cane and tobacco. In the early 20th century, the economy shifted to the production of coffee and other agricultural products.
Geography
Corozal is located in the northern region of Puerto Rico. It is bordered by the municipalities of Toa Baja, Bayamón, Naranjito, and Toa Alta. The municipality covers an area of 39.9 square miles and has a population density of 830.7 people per square mile.
The terrain of Corozal is mostly flat with some hills. The highest point in the municipality is Cerro de la Cruz, which has an elevation of 1,067 feet. The climate of Corozal is tropical with an average temperature of 79°F.
Economy
The economy of Corozal is mainly based on agriculture. The main crops grown in the municipality are coffee, plantains, bananas, and sugar cane. The municipality also has a thriving livestock industry.
The manufacturing sector of Corozal is also important to the local economy. The main industries in the municipality are food processing, textiles, and electronics.
Demographics
As of the 2010 census, the population of Corozal was 33,293. The population is mostly of mixed European and African descent. The majority of the population (90.3%) is of Hispanic or Latino origin. The median household income in Corozal is $17,845.
The majority of the population (90.3%) speaks Spanish as their primary language. English is also spoken by a small percentage of the population (3.2%). The majority of the population (90.3%) is Roman Catholic.
Conclusion
Corozal is a municipality located in the northern region of Puerto Rico. It has a population of 33,293 and is mostly of mixed European and African descent. The economy of Corozal is mainly based on agriculture and manufacturing. The main crops grown in the municipality are coffee, plantains, bananas, and sugar cane. The main industries in the municipality are food processing, textiles, and electronics. The majority of the population speaks Spanish as their primary language and is Roman Catholic.
Common Questions
What is Per Capita Income in Corozal?
Per Capita income in Corozal is $10,085.
What is the Median Family Income in Corozal?
Median Family Income in Corozal is $22,255.
What is the Median Household income in Corozal?
Median Household Income in Corozal is $20,681.
What is Income or Wage Gap in Corozal?
Income or Wage Gap in Corozal is 26.6%.
Women in Corozal earn 73.4 cents for every dollar earned by a man.
What is Family Income Deficit in Corozal?
Family Income Deficit in Corozal is $12,328.
Families that are below poverty line in Corozal earn $12,328 less on average than the poverty threshold level.
What is Inequality or Gini Index in Corozal?
Inequality or Gini Index in Corozal is 0.48.
What is the Total Population of Corozal?
Total Population of Corozal is 10,019.
What is the Total Male Population of Corozal?
Total Male Population of Corozal is 4,823.
What is the Total Female Population of Corozal?
Total Female Population of Corozal is 5,196.
What is the Ratio of Males per 100 Females in Corozal?
There are 92.82 Males per 100 Females in Corozal.
What is the Ratio of Females per 100 Males in Corozal?
There are 107.73 Females per 100 Males in Corozal.
What is the Median Population Age in Corozal?
Median Population Age in Corozal is 39.6 Years.
What is the Average Family Size in Corozal
Average Family Size in Corozal is 3.8 People.
What is the Average Household Size in Corozal
Average Household Size in Corozal is 3.0 People.
How Large is the Labor Force in Corozal?
There are 3,407 People in the Labor Forcein in Corozal.
What is the Percentage of People in the Labor Force in Corozal?
41.1% of People are in the Labor Force in Corozal.
What is the Unemployment Rate in Corozal?
Unemployment Rate in Corozal is 15.7%.