Van Wyck, SC Map & Demographics
Van Wyck Map
Van Wyck Overview
$27,139
PER CAPITA INCOME
$64,940
AVG FAMILY INCOME
0.38
INEQUALITY / GINI INDEX
873
TOTAL POPULATION
360
MALE POPULATION
513
FEMALE POPULATION
70.18
MALES / 100 FEMALES
142.50
FEMALES / 100 MALES
61.4
MEDIAN AGE
2.8
AVG FAMILY SIZE
2.2
AVG HOUSEHOLD SIZE
316
LABOR FORCE [ PEOPLE ]
42.4%
PERCENT IN LABOR FORCE
8.5%
UNEMPLOYMENT RATE
Van Wyck Area Codes
Income in Van Wyck
Income Overview in Van Wyck
| Characteristic | Number | Measure |
| Per Capita Income | 873 | $27,139 |
| Median Family Income | 265 | $64,940 |
| Mean Family Income | 265 | $69,925 |
| Median Household Income | 396 | $0 |
| Mean Household Income | 396 | $56,778 |
| Income Deficit | 265 | $0 |
| Wage / Income Gap (%) | 873 | 0.00% |
| Wage / Income Gap ($) | 873 | 100.00¢ per $1 |
| Gini / Inequality Index | 873 | 0.38 |
Earnings by Sex in Van Wyck
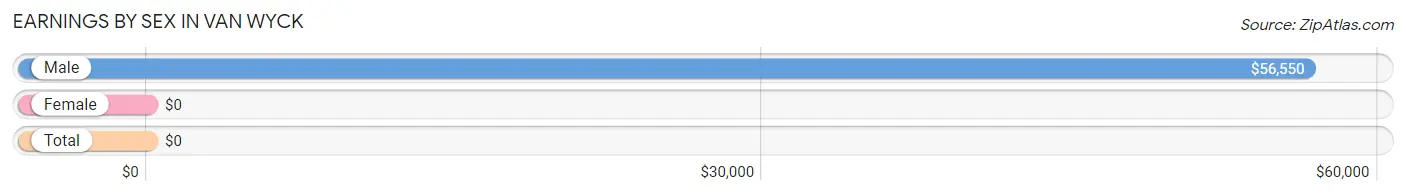
| Sex | Number | Average Earnings |
| Male | 191 (53.5%) | $56,550 |
| Female | 166 (46.5%) | $0 |
| Total | 357 (100.0%) | $0 |
Earnings by Sex by Income Bracket in Van Wyck
The most common earnings brackets in Van Wyck are $75,000 to $99,999 for men (41 | 21.5%) and $2,499 or less for women (44 | 26.5%).
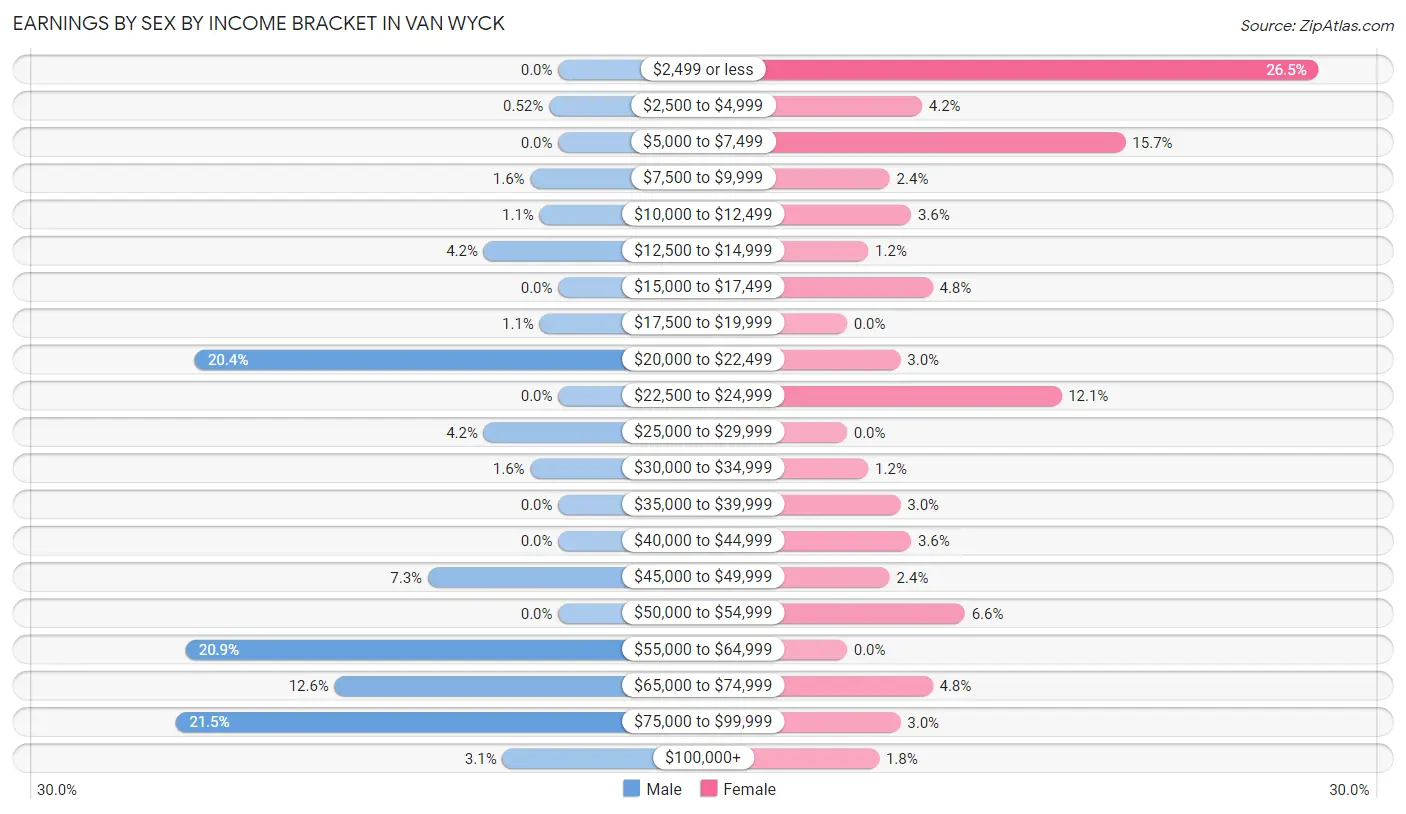
| Income | Male | Female |
| $2,499 or less | 0 (0.0%) | 44 (26.5%) |
| $2,500 to $4,999 | 1 (0.5%) | 7 (4.2%) |
| $5,000 to $7,499 | 0 (0.0%) | 26 (15.7%) |
| $7,500 to $9,999 | 3 (1.6%) | 4 (2.4%) |
| $10,000 to $12,499 | 2 (1.1%) | 6 (3.6%) |
| $12,500 to $14,999 | 8 (4.2%) | 2 (1.2%) |
| $15,000 to $17,499 | 0 (0.0%) | 8 (4.8%) |
| $17,500 to $19,999 | 2 (1.1%) | 0 (0.0%) |
| $20,000 to $22,499 | 39 (20.4%) | 5 (3.0%) |
| $22,500 to $24,999 | 0 (0.0%) | 20 (12.0%) |
| $25,000 to $29,999 | 8 (4.2%) | 0 (0.0%) |
| $30,000 to $34,999 | 3 (1.6%) | 2 (1.2%) |
| $35,000 to $39,999 | 0 (0.0%) | 5 (3.0%) |
| $40,000 to $44,999 | 0 (0.0%) | 6 (3.6%) |
| $45,000 to $49,999 | 14 (7.3%) | 4 (2.4%) |
| $50,000 to $54,999 | 0 (0.0%) | 11 (6.6%) |
| $55,000 to $64,999 | 40 (20.9%) | 0 (0.0%) |
| $65,000 to $74,999 | 24 (12.6%) | 8 (4.8%) |
| $75,000 to $99,999 | 41 (21.5%) | 5 (3.0%) |
| $100,000+ | 6 (3.1%) | 3 (1.8%) |
| Total | 191 (100.0%) | 166 (100.0%) |
Earnings by Sex by Educational Attainment in Van Wyck
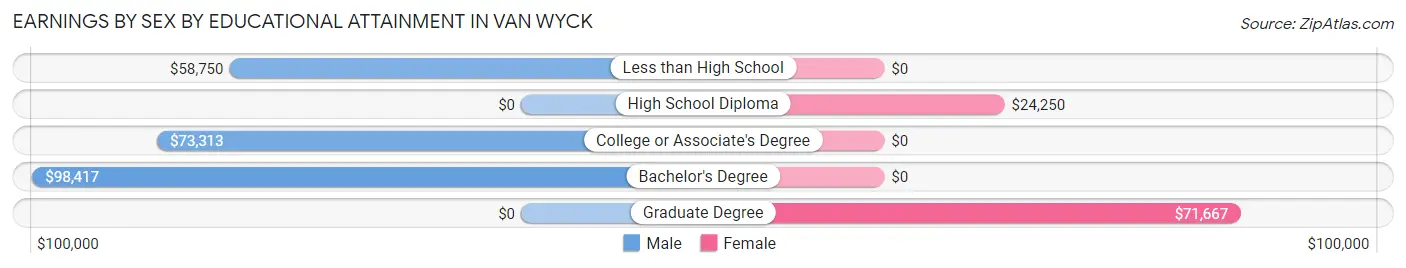
| Educational Attainment | Male Income | Female Income |
| Less than High School | $58,750 | $0 |
| High School Diploma | - | - |
| College or Associate's Degree | $73,313 | $0 |
| Bachelor's Degree | $98,417 | $0 |
| Graduate Degree | - | - |
| Total | $56,500 | $0 |
Family Income in Van Wyck
Family Income Brackets in Van Wyck
According to the Van Wyck family income data, there are 101 families falling into the $75,000 to $99,999 income range, which is the most common income bracket and makes up 38.1% of all families. Conversely, the less than $10,000 income bracket is the least frequent group with only 1 families (0.4%) belonging to this category.
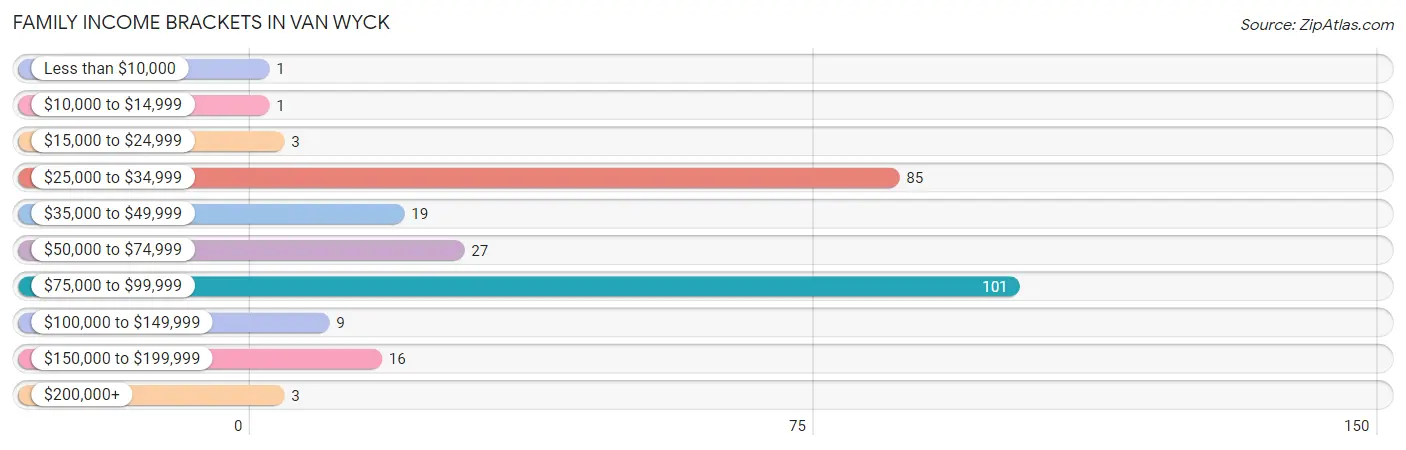
| Income Bracket | # Families | % Families |
| Less than $10,000 | 1 | 0.4% |
| $10,000 to $14,999 | 1 | 0.4% |
| $15,000 to $24,999 | 3 | 1.1% |
| $25,000 to $34,999 | 85 | 32.1% |
| $35,000 to $49,999 | 19 | 7.2% |
| $50,000 to $74,999 | 27 | 10.2% |
| $75,000 to $99,999 | 101 | 38.1% |
| $100,000 to $149,999 | 9 | 3.4% |
| $150,000 to $199,999 | 16 | 6.0% |
| $200,000+ | 3 | 1.1% |
Family Income by Famaliy Size in Van Wyck
5-person families (18 | 6.8%) account for the highest median family income in Van Wyck with $99,231 per family, while 5-person families (18 | 6.8%) have the highest median income of $19,846 per family member.
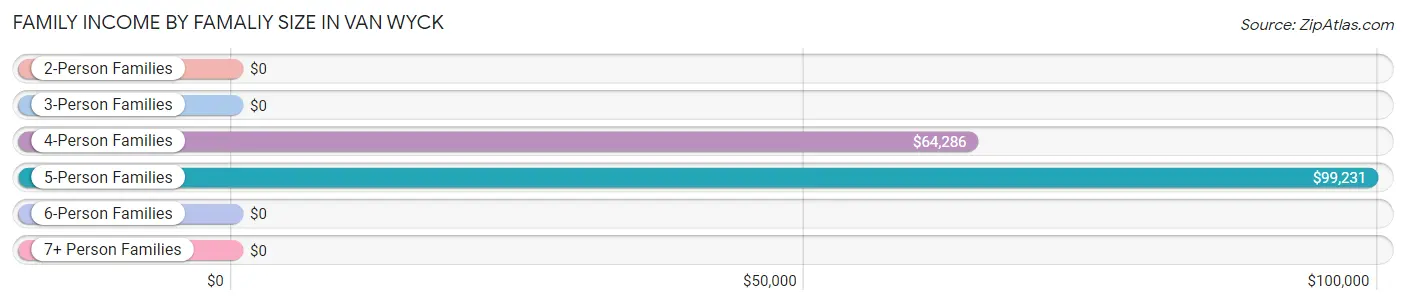
| Income Bracket | # Families | Median Income |
| 2-Person Families | 189 (71.3%) | $0 |
| 3-Person Families | 22 (8.3%) | $0 |
| 4-Person Families | 34 (12.8%) | $64,286 |
| 5-Person Families | 18 (6.8%) | $99,231 |
| 6-Person Families | 0 (0.0%) | $0 |
| 7+ Person Families | 2 (0.7%) | $0 |
| Total | 265 (100.0%) | $64,940 |
Family Income by Number of Earners in Van Wyck
The median family income in Van Wyck is $64,940, with families comprising 3+ earners (10) having the highest median family income of $180,000, while families with no earners (98) have the lowest median family income of $26,353, accounting for 3.8% and 37.0% of families, respectively.
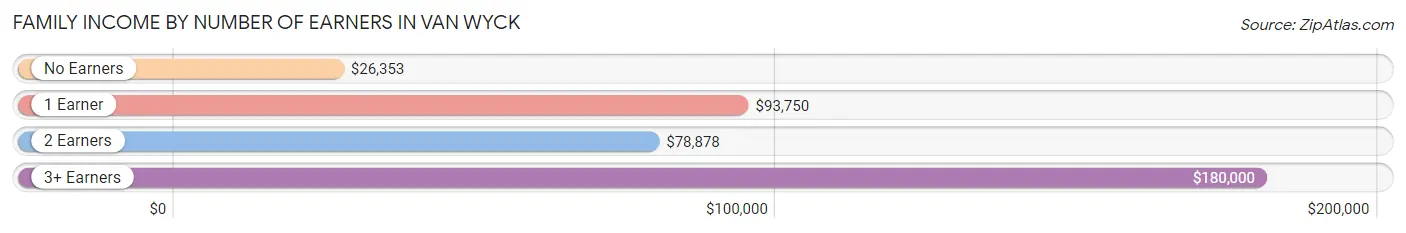
| Number of Earners | # Families | Median Income |
| No Earners | 98 (37.0%) | $26,353 |
| 1 Earner | 52 (19.6%) | $93,750 |
| 2 Earners | 105 (39.6%) | $78,878 |
| 3+ Earners | 10 (3.8%) | $180,000 |
| Total | 265 (100.0%) | $64,940 |
Household Income in Van Wyck
Household Income Brackets in Van Wyck
With 172 households falling in the category, the $25,000 to $34,999 income range is the most frequent in Van Wyck, accounting for 43.4% of all households. In contrast, only 3 households (0.8%) fall into the $200,000+ income bracket, making it the least populous group.
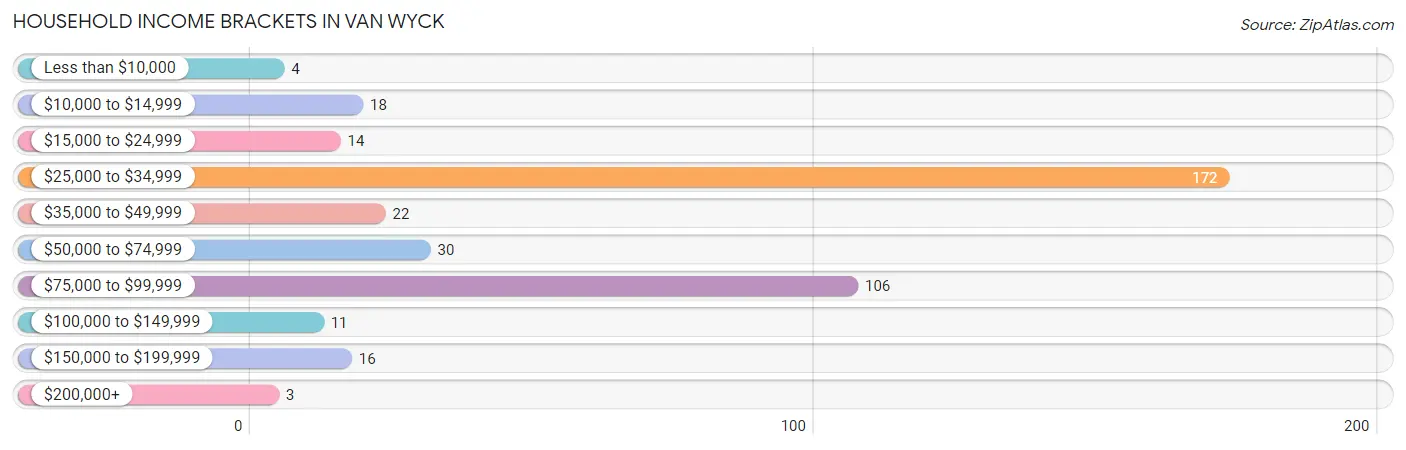
| Income Bracket | # Households | % Households |
| Less than $10,000 | 4 | 1.0% |
| $10,000 to $14,999 | 18 | 4.5% |
| $15,000 to $24,999 | 14 | 3.5% |
| $25,000 to $34,999 | 172 | 43.4% |
| $35,000 to $49,999 | 22 | 5.6% |
| $50,000 to $74,999 | 30 | 7.6% |
| $75,000 to $99,999 | 106 | 26.8% |
| $100,000 to $149,999 | 11 | 2.8% |
| $150,000 to $199,999 | 16 | 4.0% |
| $200,000+ | 3 | 0.8% |
Household Income by Householder Age in Van Wyck
The median household income in Van Wyck is $0, with the highest median household income of $98,750 found in the 25 to 44 years age bracket for the primary householder. A total of 37 households (9.3%) fall into this category. Meanwhile, the 15 to 24 years age bracket for the primary householder has the lowest median household income of $0, with 6 households (1.5%) in this group.
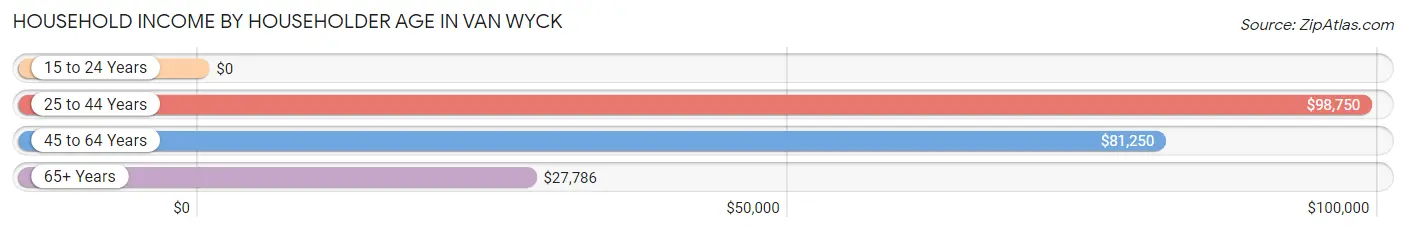
| Income Bracket | # Households | Median Income |
| 15 to 24 Years | 6 (1.5%) | $0 |
| 25 to 44 Years | 37 (9.3%) | $98,750 |
| 45 to 64 Years | 108 (27.3%) | $81,250 |
| 65+ Years | 245 (61.9%) | $27,786 |
| Total | 396 (100.0%) | $0 |
Poverty in Van Wyck
Income Below Poverty by Sex and Age in Van Wyck
With 2.5% poverty level for males and 5.1% for females among the residents of Van Wyck, 45 to 54 year old males and 65 to 74 year old females are the most vulnerable to poverty, with 6 males (12.2%) and 15 females (15.3%) in their respective age groups living below the poverty level.
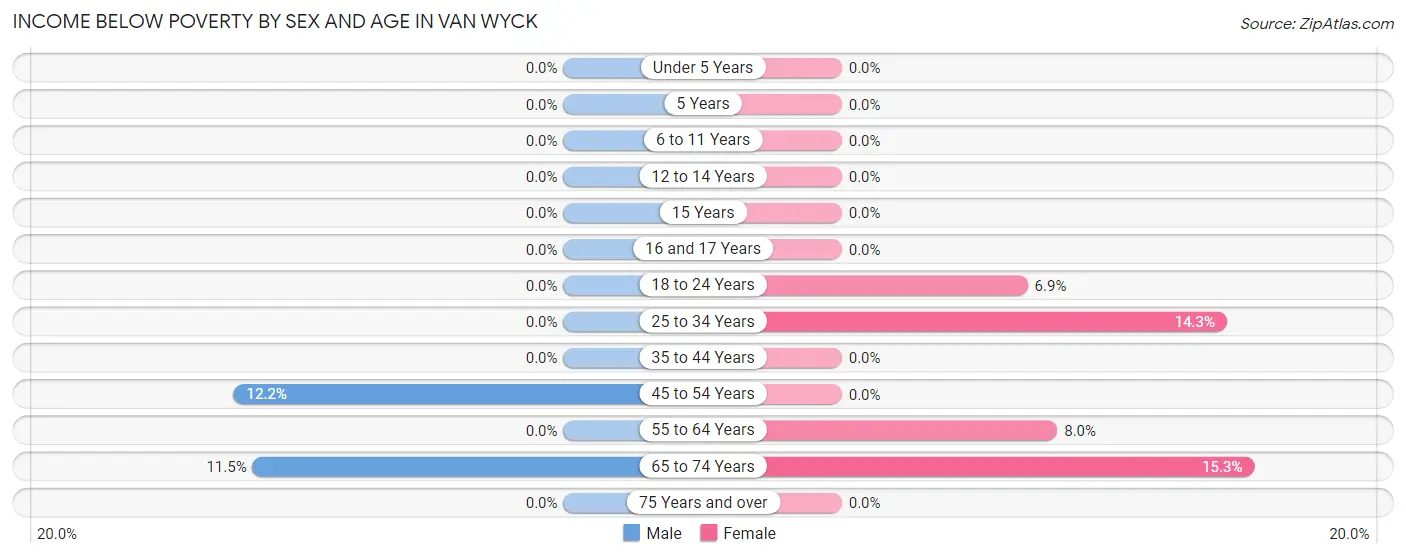
| Age Bracket | Male | Female |
| Under 5 Years | 0 (0.0%) | 0 (0.0%) |
| 5 Years | 0 (0.0%) | 0 (0.0%) |
| 6 to 11 Years | 0 (0.0%) | 0 (0.0%) |
| 12 to 14 Years | 0 (0.0%) | 0 (0.0%) |
| 15 Years | 0 (0.0%) | 0 (0.0%) |
| 16 and 17 Years | 0 (0.0%) | 0 (0.0%) |
| 18 to 24 Years | 0 (0.0%) | 2 (6.9%) |
| 25 to 34 Years | 0 (0.0%) | 3 (14.3%) |
| 35 to 44 Years | 0 (0.0%) | 0 (0.0%) |
| 45 to 54 Years | 6 (12.2%) | 0 (0.0%) |
| 55 to 64 Years | 0 (0.0%) | 6 (8.0%) |
| 65 to 74 Years | 3 (11.5%) | 15 (15.3%) |
| 75 Years and over | 0 (0.0%) | 0 (0.0%) |
| Total | 9 (2.5%) | 26 (5.1%) |
Income Above Poverty by Sex and Age in Van Wyck
According to the poverty statistics in Van Wyck, males aged under 5 years and females aged under 5 years are the age groups that are most secure financially, with 100.0% of males and 100.0% of females in these age groups living above the poverty line.
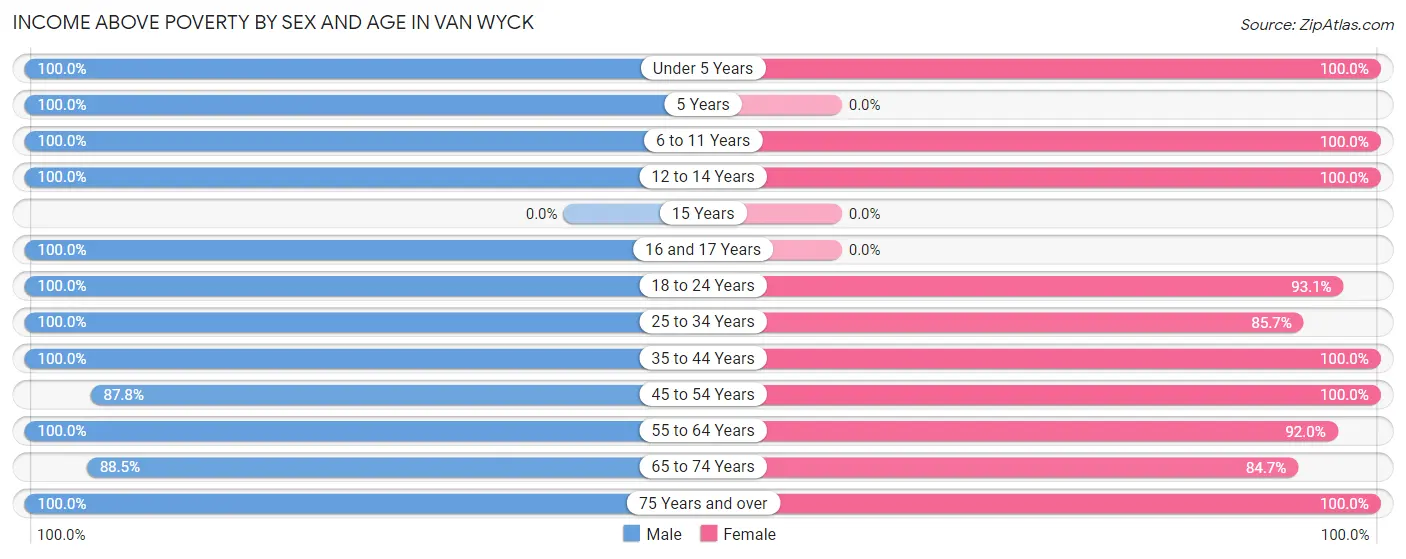
| Age Bracket | Male | Female |
| Under 5 Years | 1 (100.0%) | 2 (100.0%) |
| 5 Years | 3 (100.0%) | 0 (0.0%) |
| 6 to 11 Years | 30 (100.0%) | 69 (100.0%) |
| 12 to 14 Years | 4 (100.0%) | 16 (100.0%) |
| 15 Years | 0 (0.0%) | 0 (0.0%) |
| 16 and 17 Years | 5 (100.0%) | 0 (0.0%) |
| 18 to 24 Years | 24 (100.0%) | 27 (93.1%) |
| 25 to 34 Years | 16 (100.0%) | 18 (85.7%) |
| 35 to 44 Years | 39 (100.0%) | 50 (100.0%) |
| 45 to 54 Years | 43 (87.8%) | 21 (100.0%) |
| 55 to 64 Years | 39 (100.0%) | 69 (92.0%) |
| 65 to 74 Years | 23 (88.5%) | 83 (84.7%) |
| 75 Years and over | 124 (100.0%) | 130 (100.0%) |
| Total | 351 (97.5%) | 485 (94.9%) |
Income Below Poverty Among Married-Couple Families in Van Wyck
The poverty statistics for married-couple families in Van Wyck show that 0.8% or 2 of the total 254 families live below the poverty line. Families with no children have the highest poverty rate of 1.0%, comprising of 2 families. On the other hand, families with 1 or 2 children have the lowest poverty rate of 0.0%, which includes 0 families.
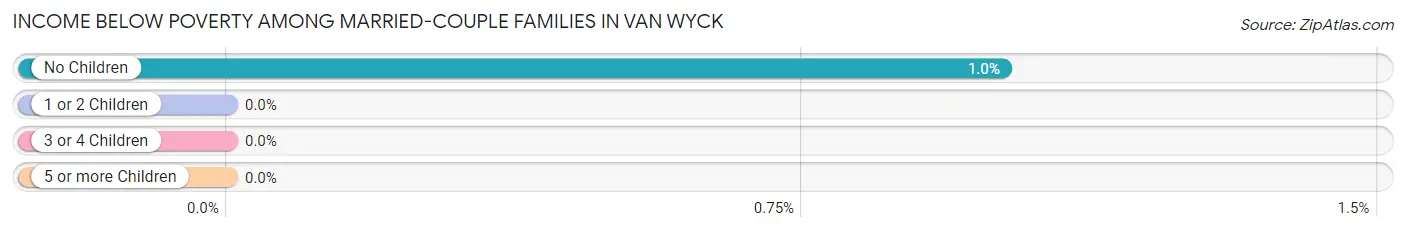
| Children | Above Poverty | Below Poverty |
| No Children | 197 (99.0%) | 2 (1.0%) |
| 1 or 2 Children | 42 (100.0%) | 0 (0.0%) |
| 3 or 4 Children | 13 (100.0%) | 0 (0.0%) |
| 5 or more Children | 0 (0.0%) | 0 (0.0%) |
| Total | 252 (99.2%) | 2 (0.8%) |
Income Below Poverty Among Single-Parent Households in Van Wyck
According to the poverty data in Van Wyck, 20.0% or 1 single-father households and 16.7% or 1 single-mother households are living below the poverty line. Among single-father households, those with no children have the highest poverty rate, with 1 households (20.0%) experiencing poverty. Likewise, among single-mother households, those with no children have the highest poverty rate, with 1 households (50.0%) falling below the poverty line.
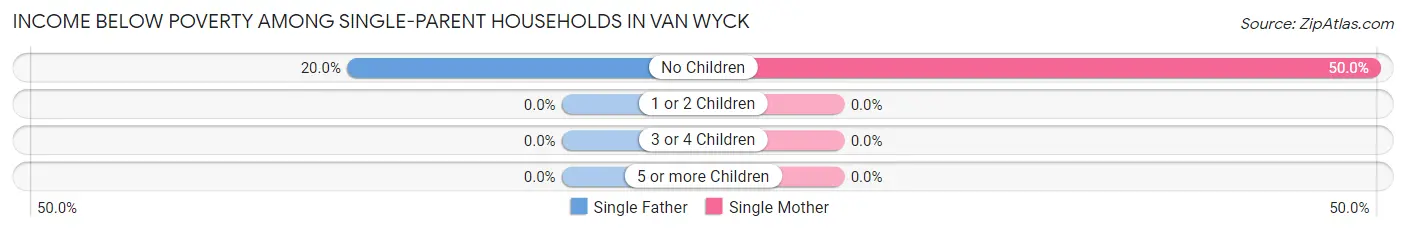
| Children | Single Father | Single Mother |
| No Children | 1 (20.0%) | 1 (50.0%) |
| 1 or 2 Children | 0 (0.0%) | 0 (0.0%) |
| 3 or 4 Children | 0 (0.0%) | 0 (0.0%) |
| 5 or more Children | 0 (0.0%) | 0 (0.0%) |
| Total | 1 (20.0%) | 1 (16.7%) |
Income Below Poverty Among Married-Couple vs Single-Parent Households in Van Wyck
The poverty data for Van Wyck shows that 2 of the married-couple family households (0.8%) and 2 of the single-parent households (18.2%) are living below the poverty level. Within the married-couple family households, those with no children have the highest poverty rate, with 2 households (1.0%) falling below the poverty line. Among the single-parent households, those with no children have the highest poverty rate, with 2 household (28.6%) living below poverty.
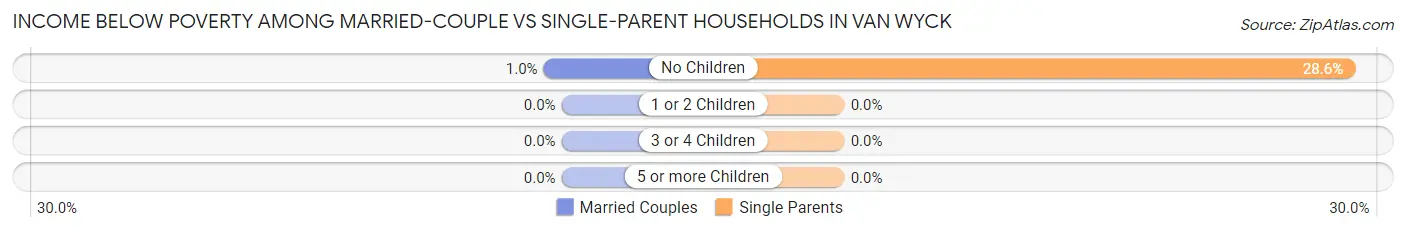
| Children | Married-Couple Families | Single-Parent Households |
| No Children | 2 (1.0%) | 2 (28.6%) |
| 1 or 2 Children | 0 (0.0%) | 0 (0.0%) |
| 3 or 4 Children | 0 (0.0%) | 0 (0.0%) |
| 5 or more Children | 0 (0.0%) | 0 (0.0%) |
| Total | 2 (0.8%) | 2 (18.2%) |
Race in Van Wyck
The most populous races in Van Wyck are White / Caucasian (779 | 89.2%), Black / African American (60 | 6.9%), and Two or more Races (33 | 3.8%).
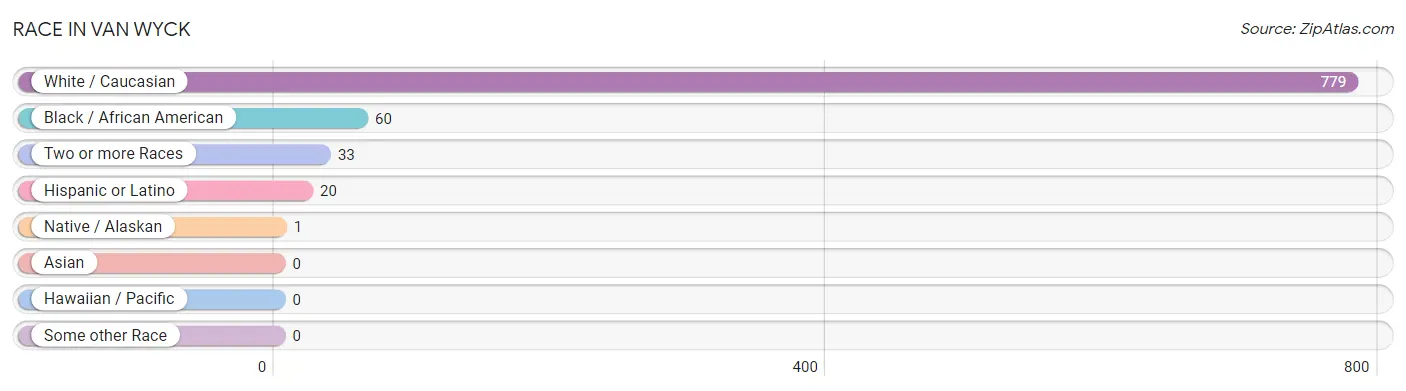
| Race | # Population | % Population |
| Asian | 0 | 0.0% |
| Black / African American | 60 | 6.9% |
| Hawaiian / Pacific | 0 | 0.0% |
| Hispanic or Latino | 20 | 2.3% |
| Native / Alaskan | 1 | 0.1% |
| White / Caucasian | 779 | 89.2% |
| Two or more Races | 33 | 3.8% |
| Some other Race | 0 | 0.0% |
| Total | 873 | 100.0% |
Ancestry in Van Wyck
The most populous ancestries reported in Van Wyck are Irish (256 | 29.3%), German (101 | 11.6%), English (83 | 9.5%), American (57 | 6.5%), and Dutch (21 | 2.4%), together accounting for 59.3% of all Van Wyck residents.
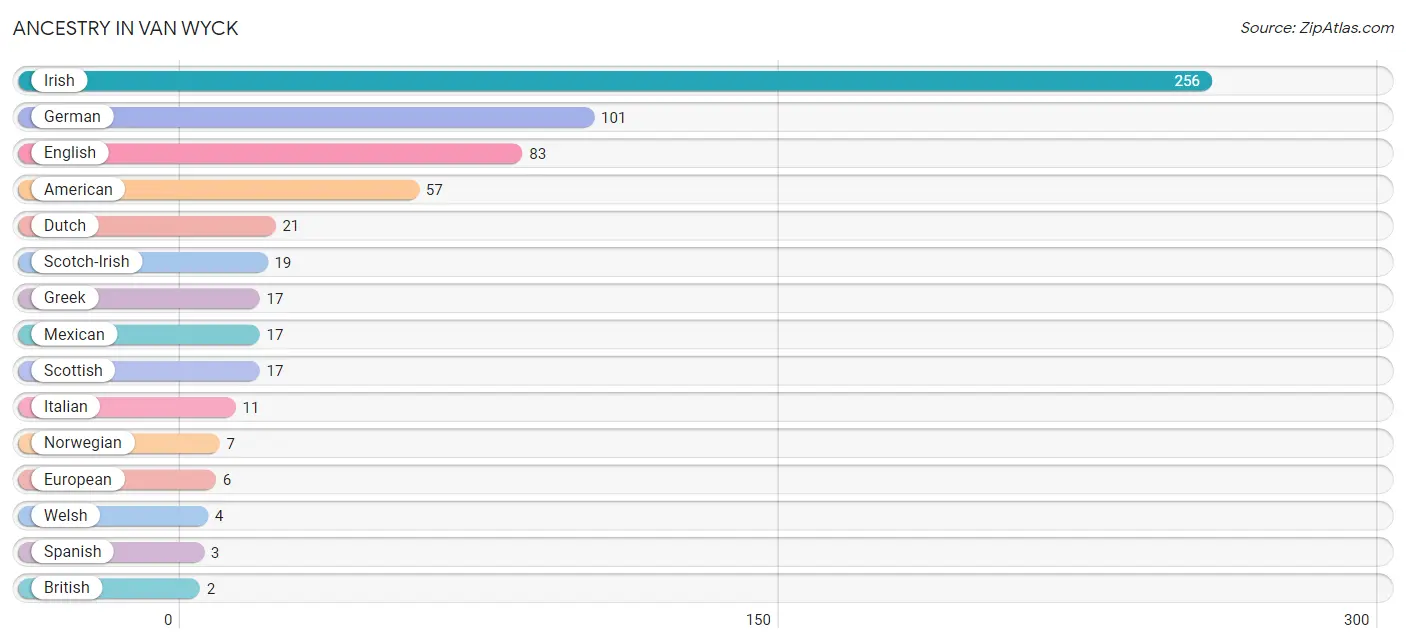
| Ancestry | # Population | % Population |
| American | 57 | 6.5% |
| British | 2 | 0.2% |
| Czech | 2 | 0.2% |
| Dutch | 21 | 2.4% |
| English | 83 | 9.5% |
| European | 6 | 0.7% |
| French | 1 | 0.1% |
| French American Indian | 2 | 0.2% |
| German | 101 | 11.6% |
| Greek | 17 | 1.9% |
| Irish | 256 | 29.3% |
| Italian | 11 | 1.3% |
| Mexican | 17 | 1.9% |
| Norwegian | 7 | 0.8% |
| Scotch-Irish | 19 | 2.2% |
| Scottish | 17 | 1.9% |
| Slovak | 2 | 0.2% |
| Spanish | 3 | 0.3% |
| Spanish American Indian | 1 | 0.1% |
| Swedish | 1 | 0.1% |
| Welsh | 4 | 0.5% | View All 21 Rows |
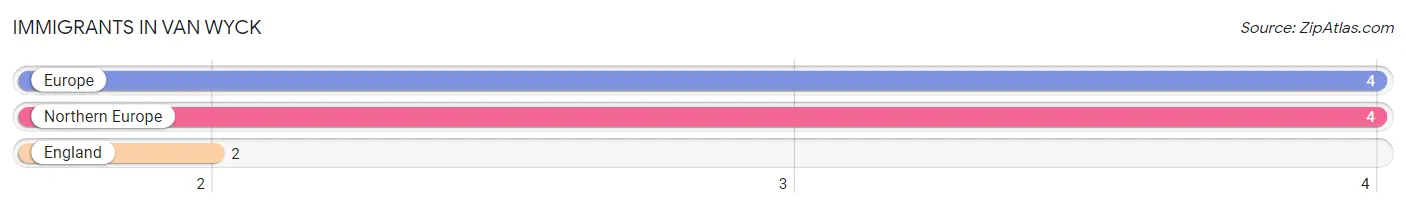
Immigrants in Van Wyck
The most numerous immigrant groups reported in Van Wyck came from Europe (4 | 0.5%), Northern Europe (4 | 0.5%), and England (2 | 0.2%), together accounting for 1.1% of all Van Wyck residents.
| Immigration Origin | # Population | % Population |
| England | 2 | 0.2% |
| Europe | 4 | 0.5% |
| Northern Europe | 4 | 0.5% | View All 3 Rows |
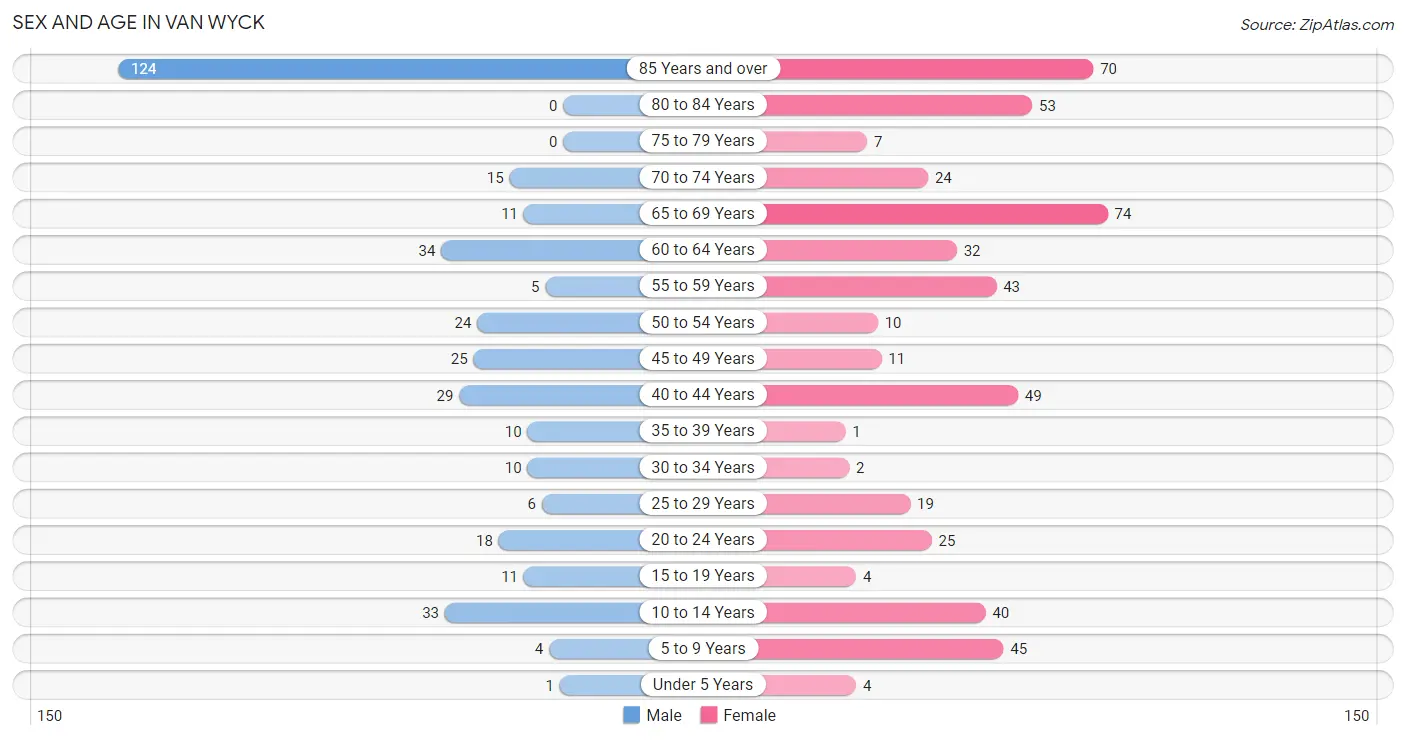
Sex and Age in Van Wyck
Sex and Age in Van Wyck
The most populous age groups in Van Wyck are 85 Years and over (124 | 34.4%) for men and 65 to 69 Years (74 | 14.4%) for women.
| Age Bracket | Male | Female |
| Under 5 Years | 1 (0.3%) | 4 (0.8%) |
| 5 to 9 Years | 4 (1.1%) | 45 (8.8%) |
| 10 to 14 Years | 33 (9.2%) | 40 (7.8%) |
| 15 to 19 Years | 11 (3.1%) | 4 (0.8%) |
| 20 to 24 Years | 18 (5.0%) | 25 (4.9%) |
| 25 to 29 Years | 6 (1.7%) | 19 (3.7%) |
| 30 to 34 Years | 10 (2.8%) | 2 (0.4%) |
| 35 to 39 Years | 10 (2.8%) | 1 (0.2%) |
| 40 to 44 Years | 29 (8.1%) | 49 (9.6%) |
| 45 to 49 Years | 25 (6.9%) | 11 (2.1%) |
| 50 to 54 Years | 24 (6.7%) | 10 (1.9%) |
| 55 to 59 Years | 5 (1.4%) | 43 (8.4%) |
| 60 to 64 Years | 34 (9.4%) | 32 (6.2%) |
| 65 to 69 Years | 11 (3.1%) | 74 (14.4%) |
| 70 to 74 Years | 15 (4.2%) | 24 (4.7%) |
| 75 to 79 Years | 0 (0.0%) | 7 (1.4%) |
| 80 to 84 Years | 0 (0.0%) | 53 (10.3%) |
| 85 Years and over | 124 (34.4%) | 70 (13.7%) |
| Total | 360 (100.0%) | 513 (100.0%) |
Families and Households in Van Wyck
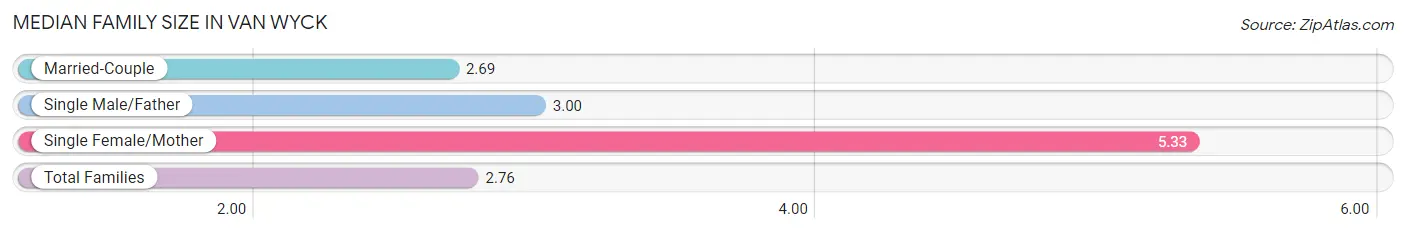
Median Family Size in Van Wyck
The median family size in Van Wyck is 2.76 persons per family, with single female/mother families (6 | 2.3%) accounting for the largest median family size of 5.33 persons per family. On the other hand, married-couple families (254 | 95.9%) represent the smallest median family size with 2.69 persons per family.
| Family Type | # Families | Family Size |
| Married-Couple | 254 (95.9%) | 2.69 |
| Single Male/Father | 5 (1.9%) | 3.00 |
| Single Female/Mother | 6 (2.3%) | 5.33 |
| Total Families | 265 (100.0%) | 2.76 |
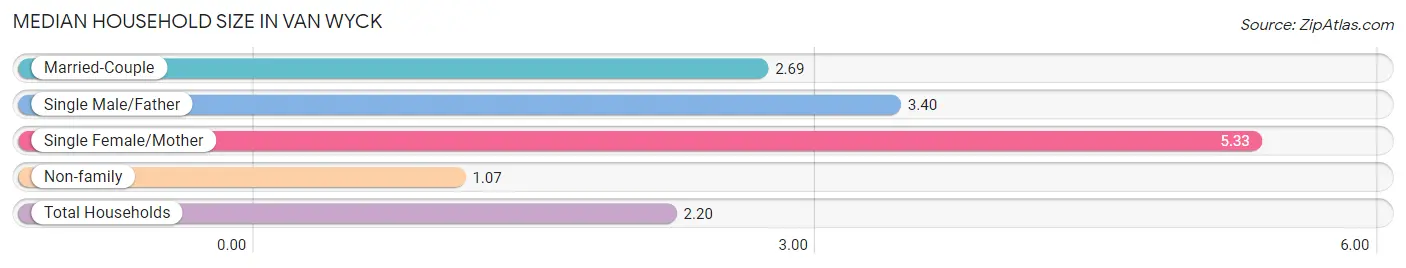
Median Household Size in Van Wyck
The median household size in Van Wyck is 2.20 persons per household, with single female/mother households (6 | 1.5%) accounting for the largest median household size of 5.33 persons per household. non-family households (131 | 33.1%) represent the smallest median household size with 1.07 persons per household.
| Household Type | # Households | Household Size |
| Married-Couple | 254 (64.1%) | 2.69 |
| Single Male/Father | 5 (1.3%) | 3.40 |
| Single Female/Mother | 6 (1.5%) | 5.33 |
| Non-family | 131 (33.1%) | 1.07 |
| Total Households | 396 (100.0%) | 2.20 |
Household Size by Marriage Status in Van Wyck
Out of a total of 396 households in Van Wyck, 265 (66.9%) are family households, while 131 (33.1%) are nonfamily households. The most numerous type of family households are 2-person households, comprising 187, and the most common type of nonfamily households are 1-person households, comprising 122.
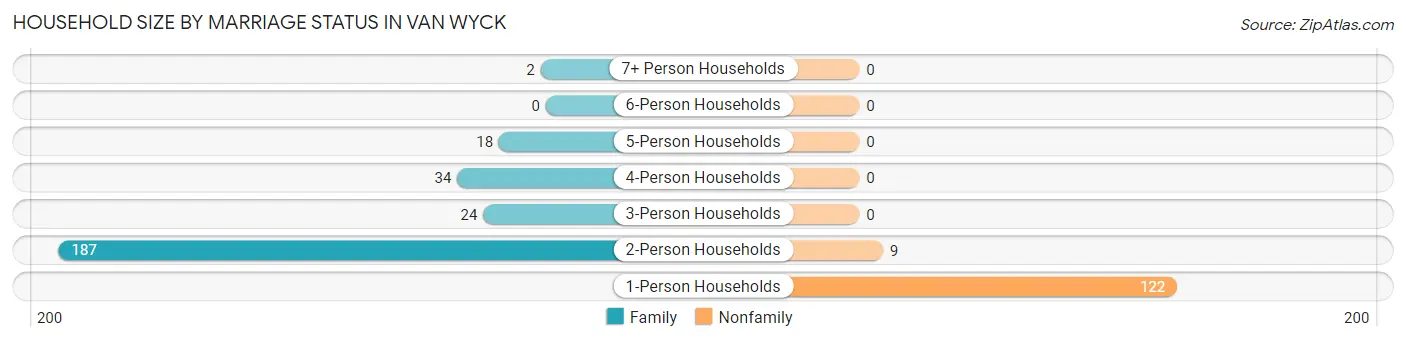
| Household Size | Family Households | Nonfamily Households |
| 1-Person Households | - | 122 (30.8%) |
| 2-Person Households | 187 (47.2%) | 9 (2.3%) |
| 3-Person Households | 24 (6.1%) | 0 (0.0%) |
| 4-Person Households | 34 (8.6%) | 0 (0.0%) |
| 5-Person Households | 18 (4.5%) | 0 (0.0%) |
| 6-Person Households | 0 (0.0%) | 0 (0.0%) |
| 7+ Person Households | 2 (0.5%) | 0 (0.0%) |
| Total | 265 (66.9%) | 131 (33.1%) |
Female Fertility in Van Wyck
Fertility by Age in Van Wyck
| Age Bracket | Women with Births | Births / 1,000 Women |
| 15 to 19 years | 0 (0.0%) | 0.0 |
| 20 to 34 years | 0 (0.0%) | 0.0 |
| 35 to 50 years | 0 (0.0%) | 0.0 |
| Total | 0 (0.0%) | 0.0 |
Fertility by Age by Marriage Status in Van Wyck
| Age Bracket | Married | Unmarried |
| 15 to 19 years | 0 (0.0%) | 0 (0.0%) |
| 20 to 34 years | 0 (0.0%) | 0 (0.0%) |
| 35 to 50 years | 0 (0.0%) | 0 (0.0%) |
| Total | 0 (0.0%) | 0 (0.0%) |
Fertility by Education in Van Wyck
| Educational Attainment | Women with Births | Births / 1,000 Women |
| Less than High School | 0 (0.0%) | 0.0 |
| High School Diploma | 0 (0.0%) | 0.0 |
| College or Associate's Degree | 0 (0.0%) | 0.0 |
| Bachelor's Degree | 0 (0.0%) | 0.0 |
| Graduate Degree | 0 (0.0%) | 0.0 |
| Total | 0 (0.0%) | 0.0 |
Fertility by Education by Marriage Status in Van Wyck
| Educational Attainment | Married | Unmarried |
| Less than High School | 0 (0.0%) | 0 (0.0%) |
| High School Diploma | 0 (0.0%) | 0 (0.0%) |
| College or Associate's Degree | 0 (0.0%) | 0 (0.0%) |
| Bachelor's Degree | 0 (0.0%) | 0 (0.0%) |
| Graduate Degree | 0 (0.0%) | 0 (0.0%) |
| Total | 0 (0.0%) | 0 (0.0%) |
Employment Characteristics in Van Wyck
Employment by Class of Employer in Van Wyck
Among the 278 employed individuals in Van Wyck, private company employees (175 | 62.9%), self-employed (not incorporated) (63 | 22.7%), and not-for-profit organizations (11 | 4.0%) make up the most common classes of employment.
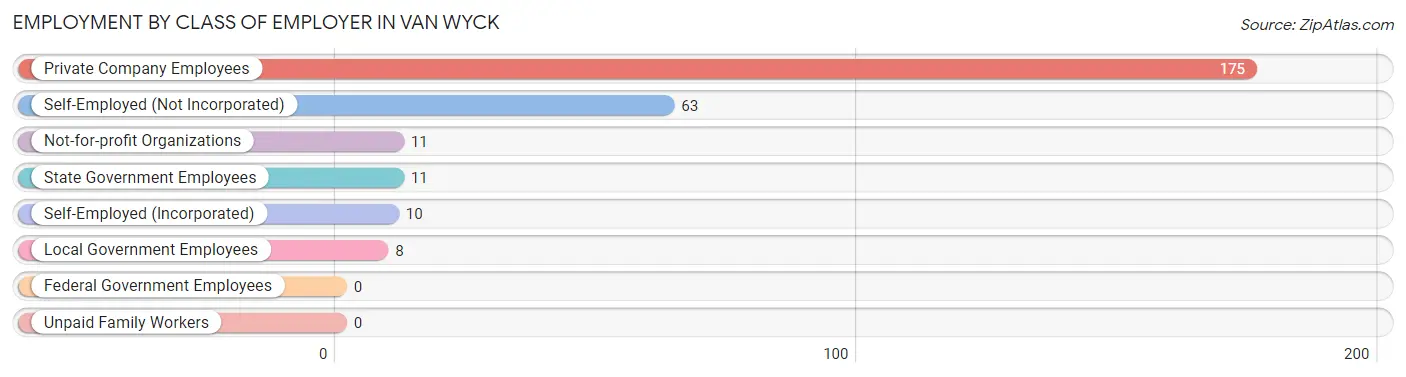
| Employer Class | # Employees | % Employees |
| Private Company Employees | 175 | 62.9% |
| Self-Employed (Incorporated) | 10 | 3.6% |
| Self-Employed (Not Incorporated) | 63 | 22.7% |
| Not-for-profit Organizations | 11 | 4.0% |
| Local Government Employees | 8 | 2.9% |
| State Government Employees | 11 | 4.0% |
| Federal Government Employees | 0 | 0.0% |
| Unpaid Family Workers | 0 | 0.0% |
| Total | 278 | 100.0% |
Employment Status by Age in Van Wyck
According to the labor force statistics for Van Wyck, out of the total population over 16 years of age (746), 42.4% or 316 individuals are in the labor force, with 8.5% or 27 of them unemployed. The age group with the highest labor force participation rate is 30 to 34 years, with 100.0% or 12 individuals in the labor force. Within the labor force, the 35 to 44 years age range has the highest percentage of unemployed individuals, with 35.6% or 26 of them being unemployed.
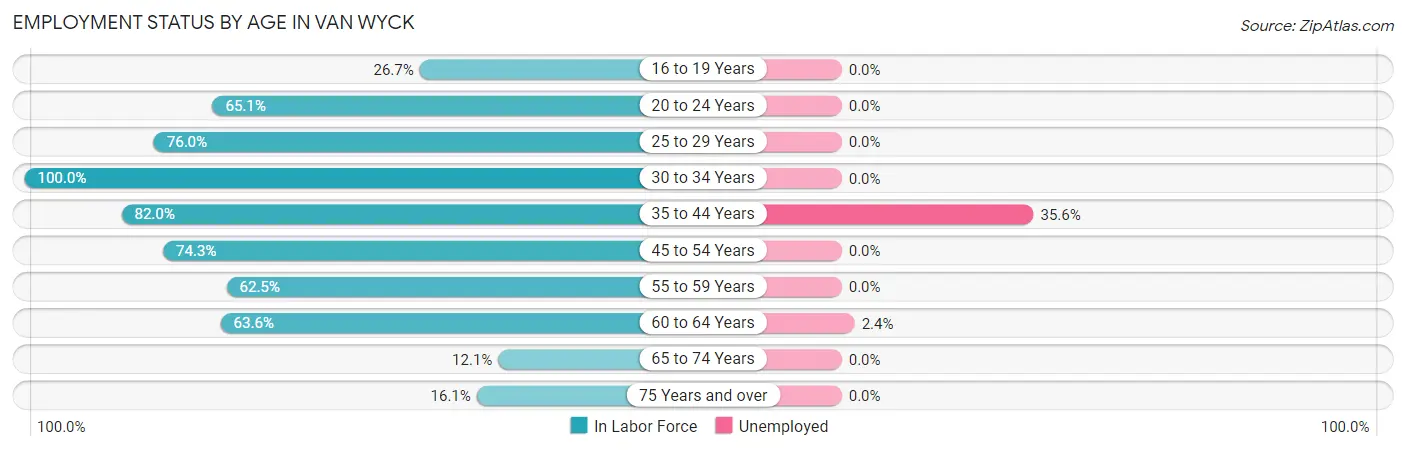
| Age Bracket | In Labor Force | Unemployed |
| 16 to 19 Years | 4 (26.7%) | 0 (0.0%) |
| 20 to 24 Years | 28 (65.1%) | 0 (0.0%) |
| 25 to 29 Years | 19 (76.0%) | 0 (0.0%) |
| 30 to 34 Years | 12 (100.0%) | 0 (0.0%) |
| 35 to 44 Years | 73 (82.0%) | 26 (35.6%) |
| 45 to 54 Years | 52 (74.3%) | 0 (0.0%) |
| 55 to 59 Years | 30 (62.5%) | 0 (0.0%) |
| 60 to 64 Years | 42 (63.6%) | 1 (2.4%) |
| 65 to 74 Years | 15 (12.1%) | 0 (0.0%) |
| 75 Years and over | 41 (16.1%) | 0 (0.0%) |
| Total | 316 (42.4%) | 27 (8.5%) |
Employment Status by Educational Attainment in Van Wyck
According to labor force statistics for Van Wyck, 73.5% of individuals (228) out of the total population between 25 and 64 years of age (310) are in the labor force, with 11.8% or 27 of them being unemployed. The group with the highest labor force participation rate are those with the educational attainment of college / associate degree, with 79.8% or 79 individuals in the labor force. Within the labor force, individuals with college / associate degree education have the highest percentage of unemployment, with 34.2% or 27 of them being unemployed.
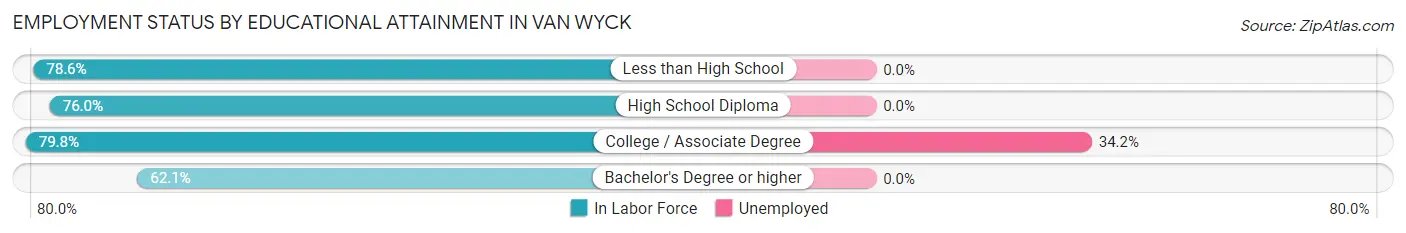
| Educational Attainment | In Labor Force | Unemployed |
| Less than High School | 22 (78.6%) | 0 (0.0%) |
| High School Diploma | 73 (76.0%) | 0 (0.0%) |
| College / Associate Degree | 79 (79.8%) | 34 (34.2%) |
| Bachelor's Degree or higher | 54 (62.1%) | 0 (0.0%) |
| Total | 228 (73.5%) | 37 (11.8%) |
Employment Occupations by Sex in Van Wyck
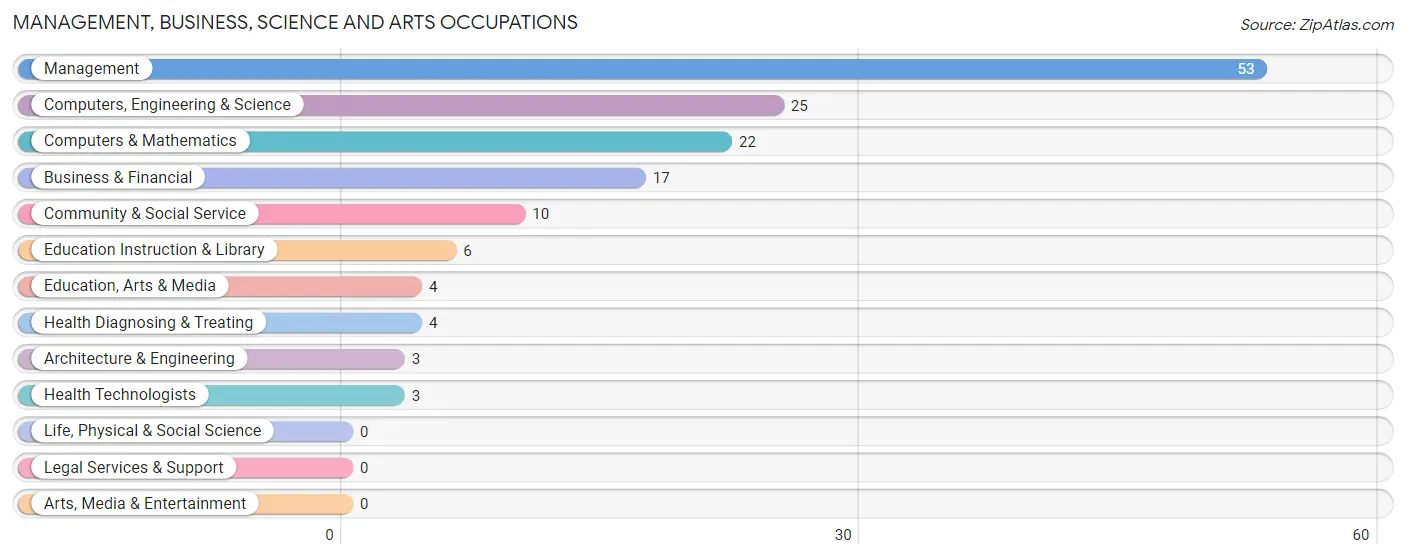
Management, Business, Science and Arts Occupations
The most common Management, Business, Science and Arts occupations in Van Wyck are Management (53 | 18.3%), Computers, Engineering & Science (25 | 8.6%), Computers & Mathematics (22 | 7.6%), Business & Financial (17 | 5.9%), and Community & Social Service (10 | 3.5%).
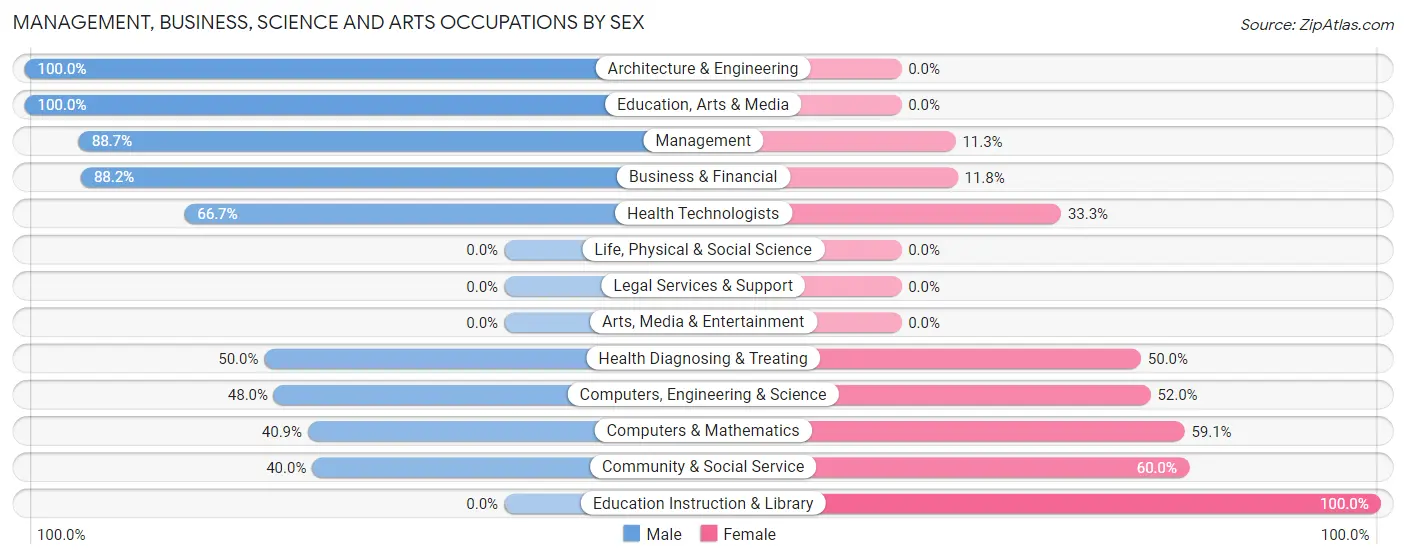
Management, Business, Science and Arts Occupations by Sex
Within the Management, Business, Science and Arts occupations in Van Wyck, the most male-oriented occupations are Architecture & Engineering (100.0%), Education, Arts & Media (100.0%), and Management (88.7%), while the most female-oriented occupations are Education Instruction & Library (100.0%), Community & Social Service (60.0%), and Computers & Mathematics (59.1%).
| Occupation | Male | Female |
| Management | 47 (88.7%) | 6 (11.3%) |
| Business & Financial | 15 (88.2%) | 2 (11.8%) |
| Computers, Engineering & Science | 12 (48.0%) | 13 (52.0%) |
| Computers & Mathematics | 9 (40.9%) | 13 (59.1%) |
| Architecture & Engineering | 3 (100.0%) | 0 (0.0%) |
| Life, Physical & Social Science | 0 (0.0%) | 0 (0.0%) |
| Community & Social Service | 4 (40.0%) | 6 (60.0%) |
| Education, Arts & Media | 4 (100.0%) | 0 (0.0%) |
| Legal Services & Support | 0 (0.0%) | 0 (0.0%) |
| Education Instruction & Library | 0 (0.0%) | 6 (100.0%) |
| Arts, Media & Entertainment | 0 (0.0%) | 0 (0.0%) |
| Health Diagnosing & Treating | 2 (50.0%) | 2 (50.0%) |
| Health Technologists | 2 (66.7%) | 1 (33.3%) |
| Total (Category) | 80 (73.4%) | 29 (26.6%) |
| Total (Overall) | 190 (65.7%) | 99 (34.3%) |
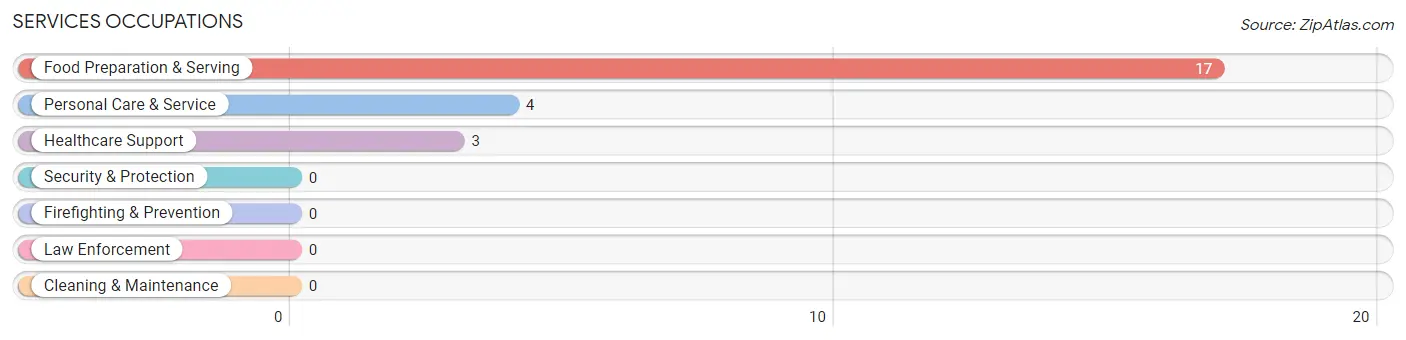
Services Occupations
The most common Services occupations in Van Wyck are Food Preparation & Serving (17 | 5.9%), Personal Care & Service (4 | 1.4%), and Healthcare Support (3 | 1.0%).
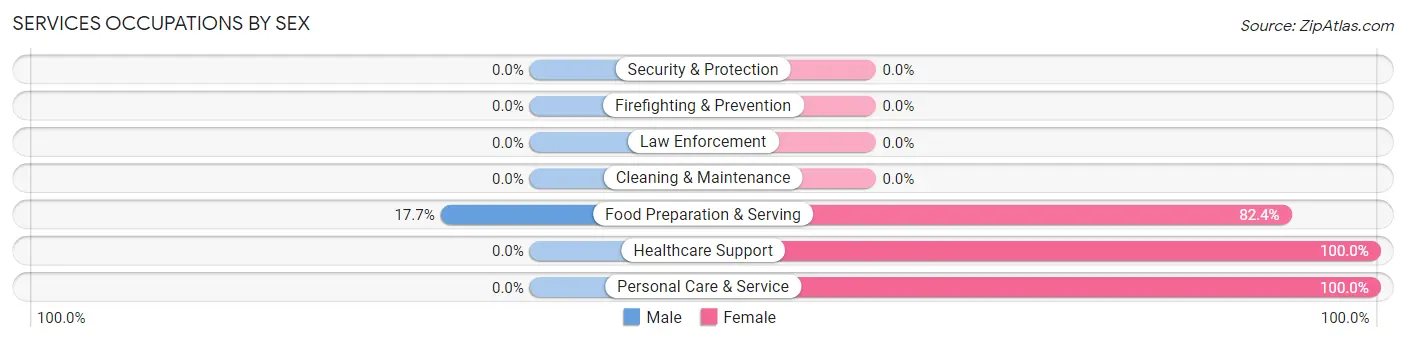
Services Occupations by Sex
| Occupation | Male | Female |
| Healthcare Support | 0 (0.0%) | 3 (100.0%) |
| Security & Protection | 0 (0.0%) | 0 (0.0%) |
| Firefighting & Prevention | 0 (0.0%) | 0 (0.0%) |
| Law Enforcement | 0 (0.0%) | 0 (0.0%) |
| Food Preparation & Serving | 3 (17.6%) | 14 (82.4%) |
| Cleaning & Maintenance | 0 (0.0%) | 0 (0.0%) |
| Personal Care & Service | 0 (0.0%) | 4 (100.0%) |
| Total (Category) | 3 (12.5%) | 21 (87.5%) |
| Total (Overall) | 190 (65.7%) | 99 (34.3%) |
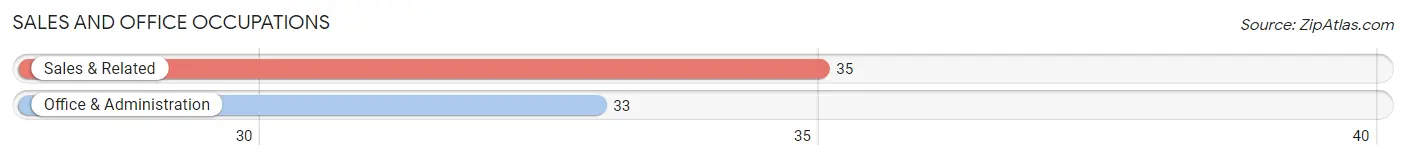
Sales and Office Occupations
The most common Sales and Office occupations in Van Wyck are Sales & Related (35 | 12.1%), and Office & Administration (33 | 11.4%).
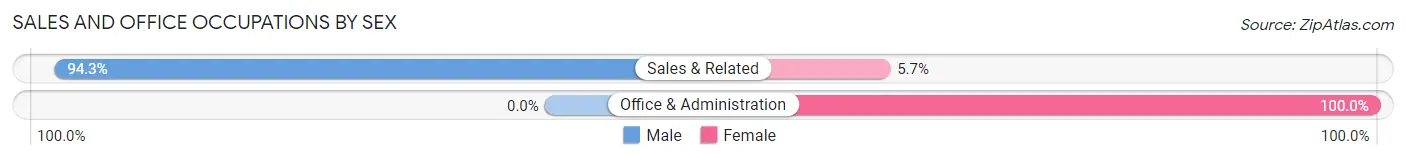
Sales and Office Occupations by Sex
| Occupation | Male | Female |
| Sales & Related | 33 (94.3%) | 2 (5.7%) |
| Office & Administration | 0 (0.0%) | 33 (100.0%) |
| Total (Category) | 33 (48.5%) | 35 (51.5%) |
| Total (Overall) | 190 (65.7%) | 99 (34.3%) |
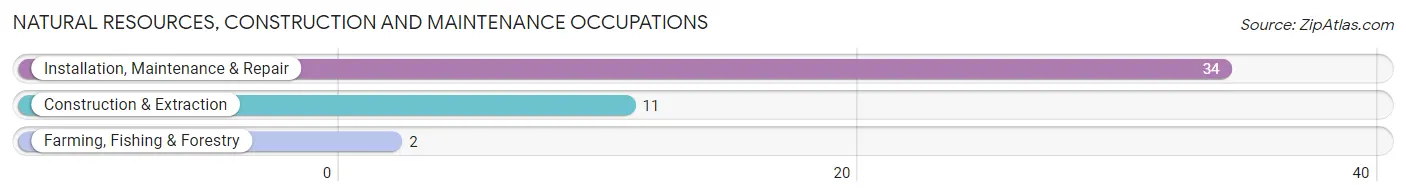
Natural Resources, Construction and Maintenance Occupations
The most common Natural Resources, Construction and Maintenance occupations in Van Wyck are Installation, Maintenance & Repair (34 | 11.8%), Construction & Extraction (11 | 3.8%), and Farming, Fishing & Forestry (2 | 0.7%).
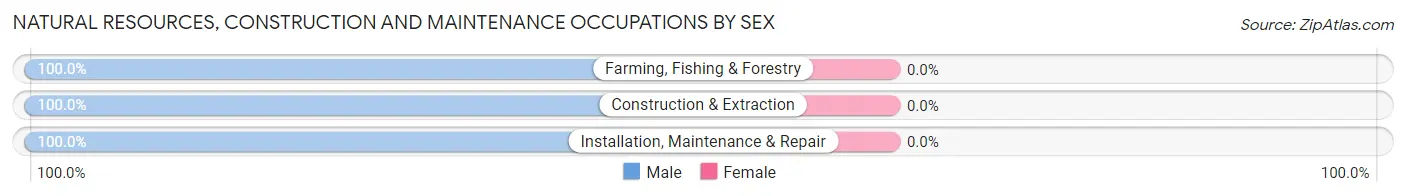
Natural Resources, Construction and Maintenance Occupations by Sex
| Occupation | Male | Female |
| Farming, Fishing & Forestry | 2 (100.0%) | 0 (0.0%) |
| Construction & Extraction | 11 (100.0%) | 0 (0.0%) |
| Installation, Maintenance & Repair | 34 (100.0%) | 0 (0.0%) |
| Total (Category) | 47 (100.0%) | 0 (0.0%) |
| Total (Overall) | 190 (65.7%) | 99 (34.3%) |
Production, Transportation and Moving Occupations
The most common Production, Transportation and Moving occupations in Van Wyck are Material Moving (22 | 7.6%), Production (14 | 4.8%), and Transportation (5 | 1.7%).
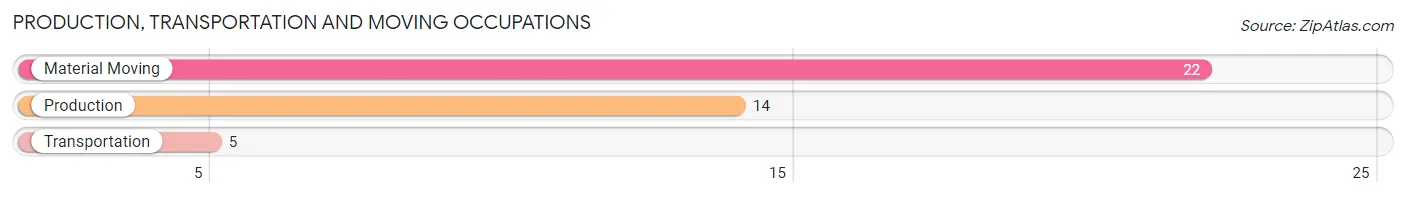
Production, Transportation and Moving Occupations by Sex
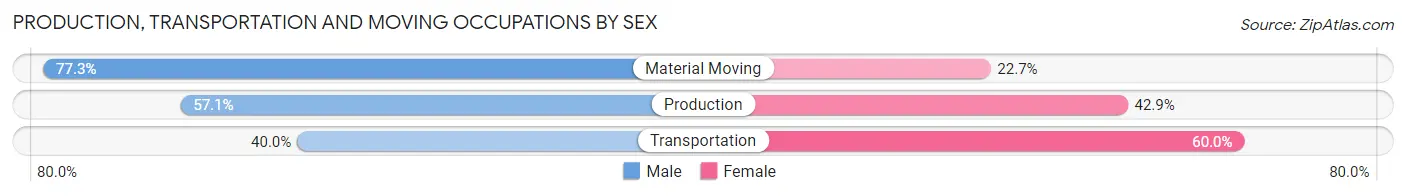
| Occupation | Male | Female |
| Production | 8 (57.1%) | 6 (42.9%) |
| Transportation | 2 (40.0%) | 3 (60.0%) |
| Material Moving | 17 (77.3%) | 5 (22.7%) |
| Total (Category) | 27 (65.8%) | 14 (34.2%) |
| Total (Overall) | 190 (65.7%) | 99 (34.3%) |
Employment Industries by Sex in Van Wyck
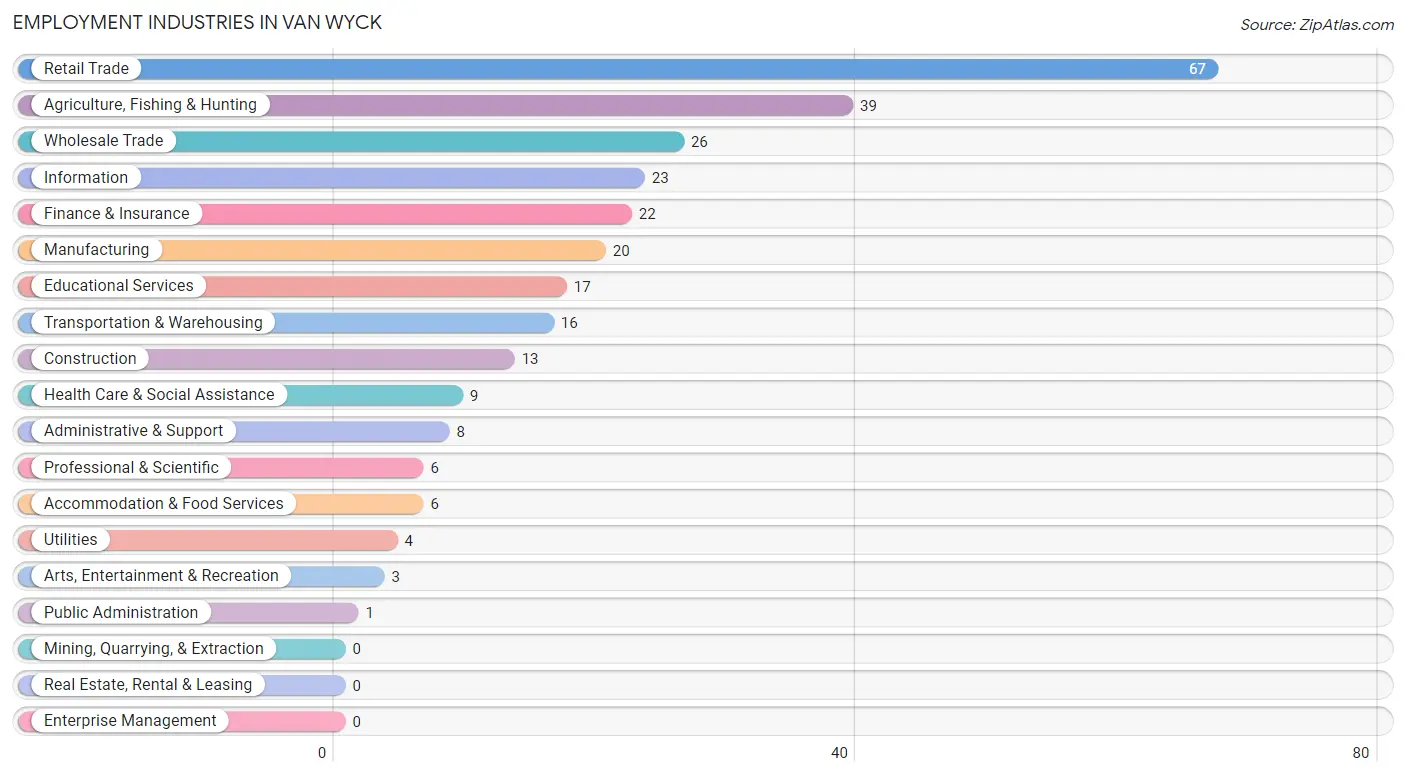
Employment Industries in Van Wyck
The major employment industries in Van Wyck include Retail Trade (67 | 23.2%), Agriculture, Fishing & Hunting (39 | 13.5%), Wholesale Trade (26 | 9.0%), Information (23 | 8.0%), and Finance & Insurance (22 | 7.6%).
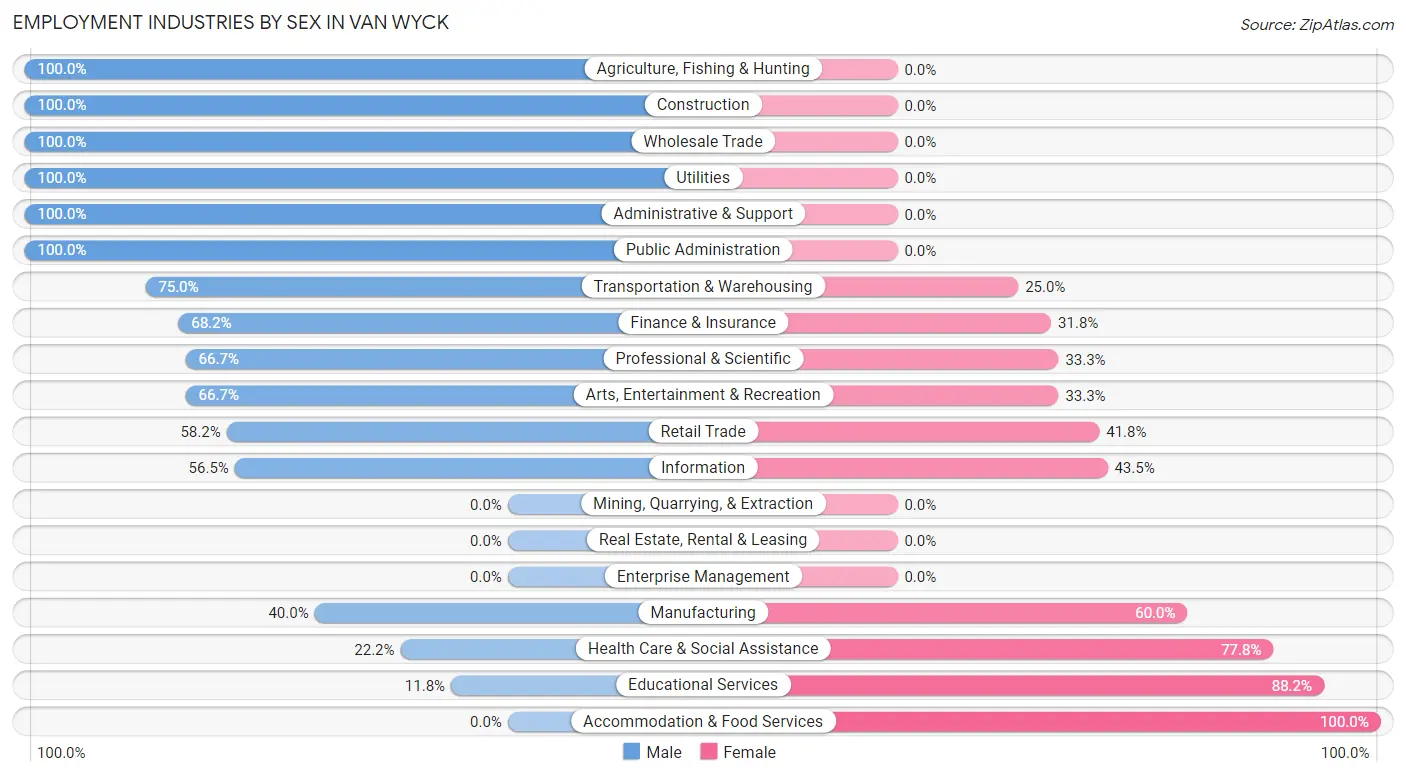
Employment Industries by Sex in Van Wyck
The Van Wyck industries that see more men than women are Agriculture, Fishing & Hunting (100.0%), Construction (100.0%), and Wholesale Trade (100.0%), whereas the industries that tend to have a higher number of women are Accommodation & Food Services (100.0%), Educational Services (88.2%), and Health Care & Social Assistance (77.8%).
| Industry | Male | Female |
| Agriculture, Fishing & Hunting | 39 (100.0%) | 0 (0.0%) |
| Mining, Quarrying, & Extraction | 0 (0.0%) | 0 (0.0%) |
| Construction | 13 (100.0%) | 0 (0.0%) |
| Manufacturing | 8 (40.0%) | 12 (60.0%) |
| Wholesale Trade | 26 (100.0%) | 0 (0.0%) |
| Retail Trade | 39 (58.2%) | 28 (41.8%) |
| Transportation & Warehousing | 12 (75.0%) | 4 (25.0%) |
| Utilities | 4 (100.0%) | 0 (0.0%) |
| Information | 13 (56.5%) | 10 (43.5%) |
| Finance & Insurance | 15 (68.2%) | 7 (31.8%) |
| Real Estate, Rental & Leasing | 0 (0.0%) | 0 (0.0%) |
| Professional & Scientific | 4 (66.7%) | 2 (33.3%) |
| Enterprise Management | 0 (0.0%) | 0 (0.0%) |
| Administrative & Support | 8 (100.0%) | 0 (0.0%) |
| Educational Services | 2 (11.8%) | 15 (88.2%) |
| Health Care & Social Assistance | 2 (22.2%) | 7 (77.8%) |
| Arts, Entertainment & Recreation | 2 (66.7%) | 1 (33.3%) |
| Accommodation & Food Services | 0 (0.0%) | 6 (100.0%) |
| Public Administration | 1 (100.0%) | 0 (0.0%) |
| Total | 190 (65.7%) | 99 (34.3%) |
Education in Van Wyck
School Enrollment in Van Wyck
The most common levels of schooling among the 161 students in Van Wyck are middle school (72 | 44.7%), elementary school (46 | 28.6%), and college / undergraduate (23 | 14.3%).
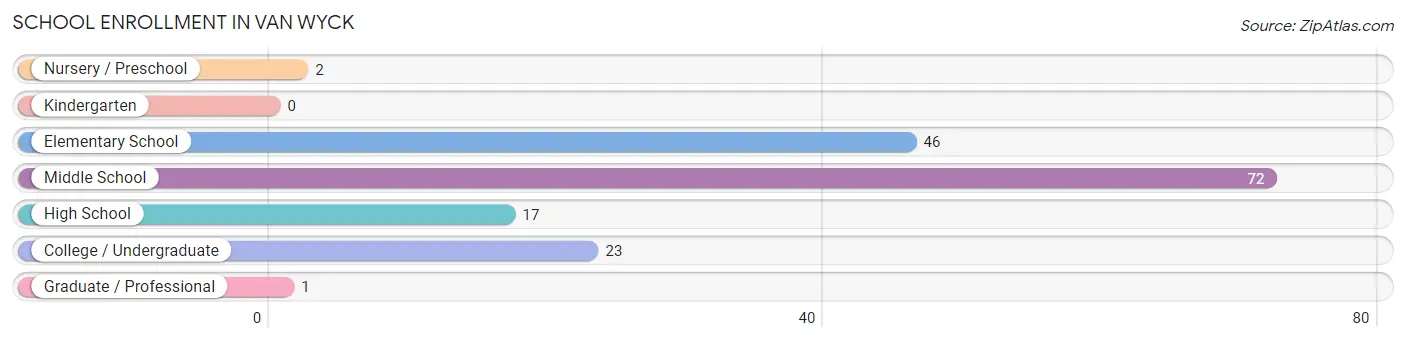
| School Level | # Students | % Students |
| Nursery / Preschool | 2 | 1.2% |
| Kindergarten | 0 | 0.0% |
| Elementary School | 46 | 28.6% |
| Middle School | 72 | 44.7% |
| High School | 17 | 10.6% |
| College / Undergraduate | 23 | 14.3% |
| Graduate / Professional | 1 | 0.6% |
| Total | 161 | 100.0% |
School Enrollment by Age by Funding Source in Van Wyck
Out of a total of 161 students who are enrolled in schools in Van Wyck, 48 (29.8%) attend a private institution, while the remaining 113 (70.2%) are enrolled in public schools. The age group of 3 to 4 year olds has the highest likelihood of being enrolled in private schools, with 1 (100.0% in the age bracket) enrolled. Conversely, the age group of 15 to 17 year olds has the lowest likelihood of being enrolled in a private school, with 5 (100.0% in the age bracket) attending a public institution.
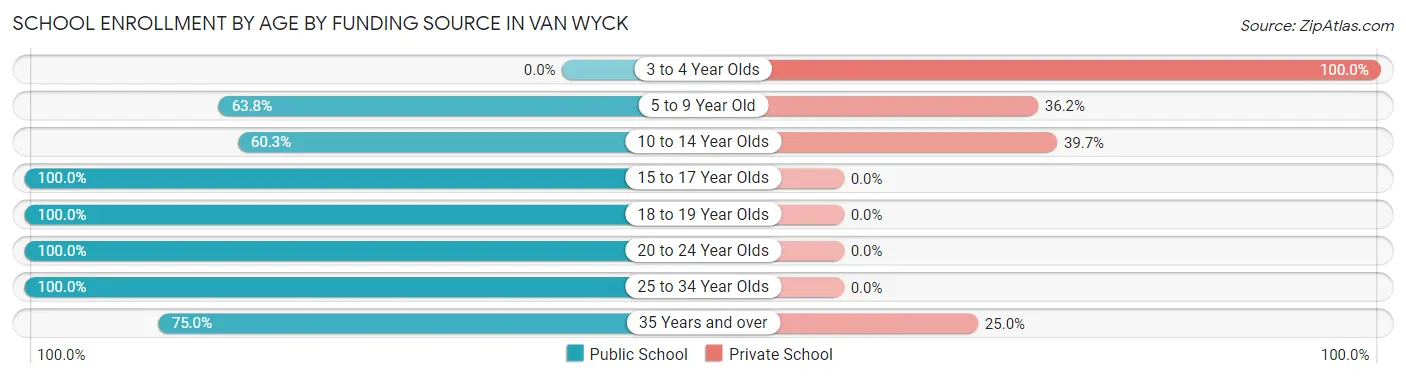
| Age Bracket | Public School | Private School |
| 3 to 4 Year Olds | 0 (0.0%) | 1 (100.0%) |
| 5 to 9 Year Old | 30 (63.8%) | 17 (36.2%) |
| 10 to 14 Year Olds | 44 (60.3%) | 29 (39.7%) |
| 15 to 17 Year Olds | 5 (100.0%) | 0 (0.0%) |
| 18 to 19 Year Olds | 10 (100.0%) | 0 (0.0%) |
| 20 to 24 Year Olds | 16 (100.0%) | 0 (0.0%) |
| 25 to 34 Year Olds | 5 (100.0%) | 0 (0.0%) |
| 35 Years and over | 3 (75.0%) | 1 (25.0%) |
| Total | 113 (70.2%) | 48 (29.8%) |
Educational Attainment by Field of Study in Van Wyck
Business (43 | 36.7%), social sciences (15 | 12.8%), education (15 | 12.8%), communications (15 | 12.8%), and liberal arts & history (14 | 12.0%) are the most common fields of study among 117 individuals in Van Wyck who have obtained a bachelor's degree or higher.
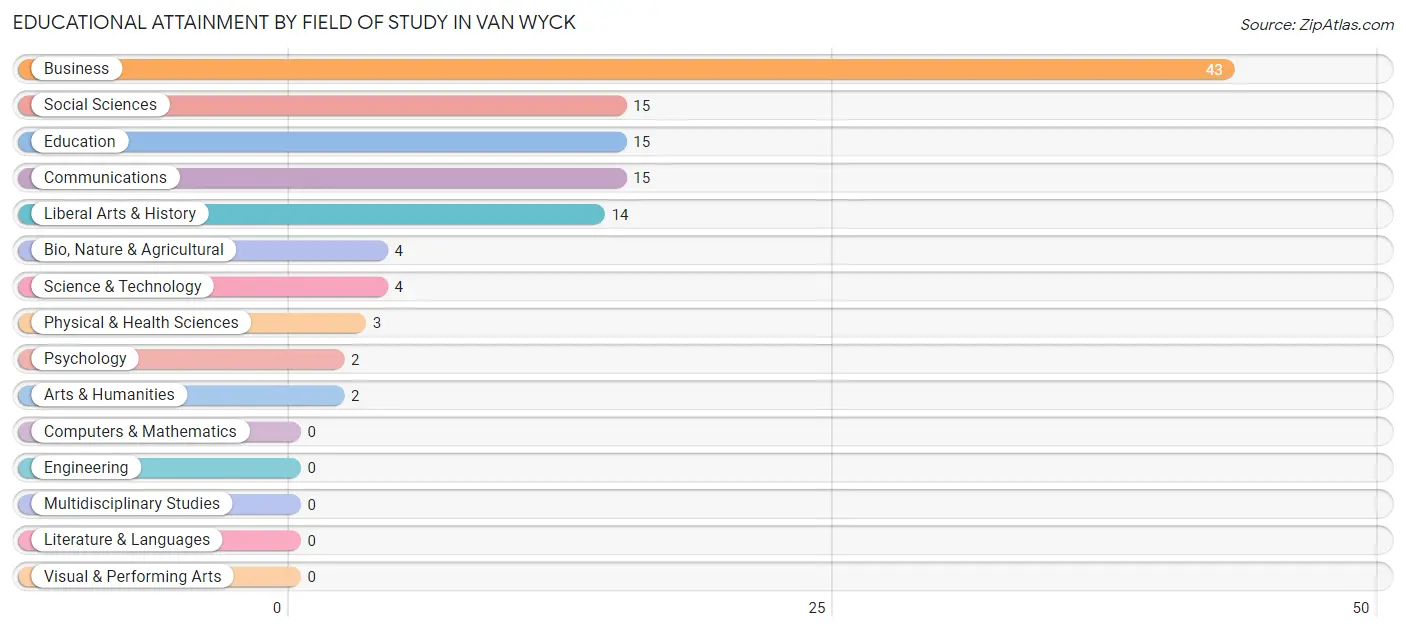
| Field of Study | # Graduates | % Graduates |
| Computers & Mathematics | 0 | 0.0% |
| Bio, Nature & Agricultural | 4 | 3.4% |
| Physical & Health Sciences | 3 | 2.6% |
| Psychology | 2 | 1.7% |
| Social Sciences | 15 | 12.8% |
| Engineering | 0 | 0.0% |
| Multidisciplinary Studies | 0 | 0.0% |
| Science & Technology | 4 | 3.4% |
| Business | 43 | 36.7% |
| Education | 15 | 12.8% |
| Literature & Languages | 0 | 0.0% |
| Liberal Arts & History | 14 | 12.0% |
| Visual & Performing Arts | 0 | 0.0% |
| Communications | 15 | 12.8% |
| Arts & Humanities | 2 | 1.7% |
| Total | 117 | 100.0% |
Transportation & Commute in Van Wyck
Vehicle Availability by Sex in Van Wyck
The most prevalent vehicle ownership categories in Van Wyck are males with 2 vehicles (79, accounting for 43.9%) and females with 2 vehicles (44, making up 80.6%).
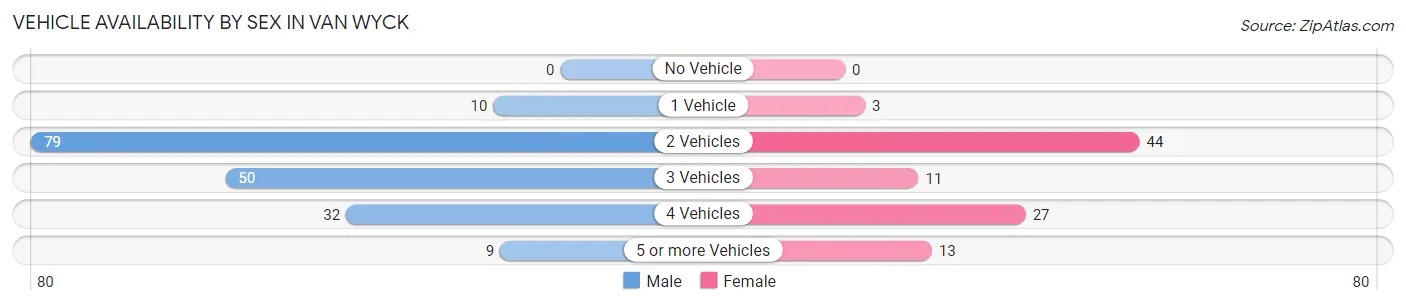
| Vehicles Available | Male | Female |
| No Vehicle | 0 (0.0%) | 0 (0.0%) |
| 1 Vehicle | 10 (5.6%) | 3 (3.1%) |
| 2 Vehicles | 79 (43.9%) | 44 (44.9%) |
| 3 Vehicles | 50 (27.8%) | 11 (11.2%) |
| 4 Vehicles | 32 (17.8%) | 27 (27.6%) |
| 5 or more Vehicles | 9 (5.0%) | 13 (13.3%) |
| Total | 180 (100.0%) | 98 (100.0%) |
Commute Time in Van Wyck
The most frequently occuring commute durations in Van Wyck are 30 to 34 minutes (105 commuters, 39.0%), 45 to 59 minutes (54 commuters, 20.1%), and 60 to 89 minutes (47 commuters, 17.5%).
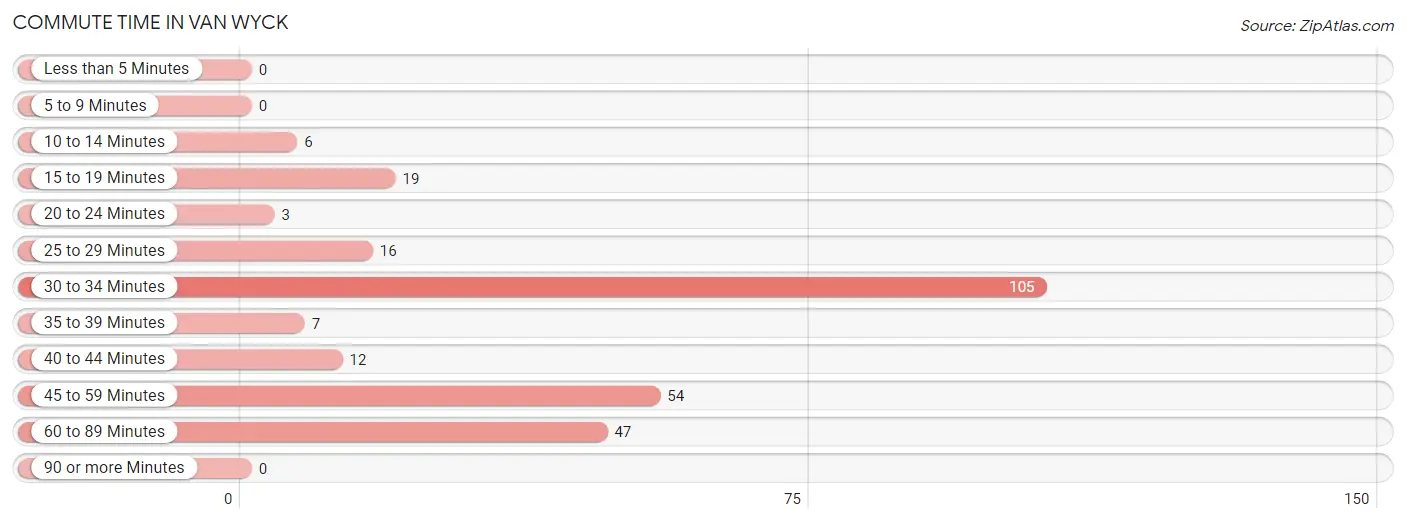
| Commute Time | # Commuters | % Commuters |
| Less than 5 Minutes | 0 | 0.0% |
| 5 to 9 Minutes | 0 | 0.0% |
| 10 to 14 Minutes | 6 | 2.2% |
| 15 to 19 Minutes | 19 | 7.1% |
| 20 to 24 Minutes | 3 | 1.1% |
| 25 to 29 Minutes | 16 | 5.9% |
| 30 to 34 Minutes | 105 | 39.0% |
| 35 to 39 Minutes | 7 | 2.6% |
| 40 to 44 Minutes | 12 | 4.5% |
| 45 to 59 Minutes | 54 | 20.1% |
| 60 to 89 Minutes | 47 | 17.5% |
| 90 or more Minutes | 0 | 0.0% |
Commute Time by Sex in Van Wyck
The most common commute times in Van Wyck are 30 to 34 minutes (61 commuters, 34.3%) for males and 30 to 34 minutes (44 commuters, 48.3%) for females.
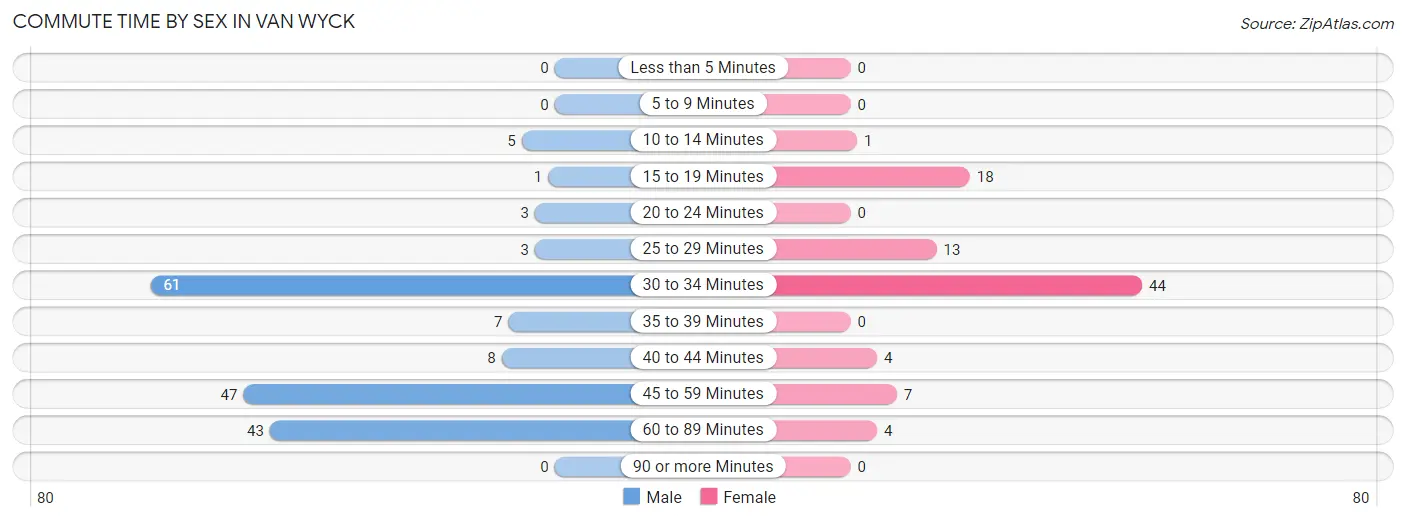
| Commute Time | Male | Female |
| Less than 5 Minutes | 0 (0.0%) | 0 (0.0%) |
| 5 to 9 Minutes | 0 (0.0%) | 0 (0.0%) |
| 10 to 14 Minutes | 5 (2.8%) | 1 (1.1%) |
| 15 to 19 Minutes | 1 (0.6%) | 18 (19.8%) |
| 20 to 24 Minutes | 3 (1.7%) | 0 (0.0%) |
| 25 to 29 Minutes | 3 (1.7%) | 13 (14.3%) |
| 30 to 34 Minutes | 61 (34.3%) | 44 (48.3%) |
| 35 to 39 Minutes | 7 (3.9%) | 0 (0.0%) |
| 40 to 44 Minutes | 8 (4.5%) | 4 (4.4%) |
| 45 to 59 Minutes | 47 (26.4%) | 7 (7.7%) |
| 60 to 89 Minutes | 43 (24.2%) | 4 (4.4%) |
| 90 or more Minutes | 0 (0.0%) | 0 (0.0%) |
Time of Departure to Work by Sex in Van Wyck
The most frequent times of departure to work in Van Wyck are 5:30 AM to 5:59 AM (48, 27.0%) for males and 7:00 AM to 7:29 AM (23, 25.3%) for females.
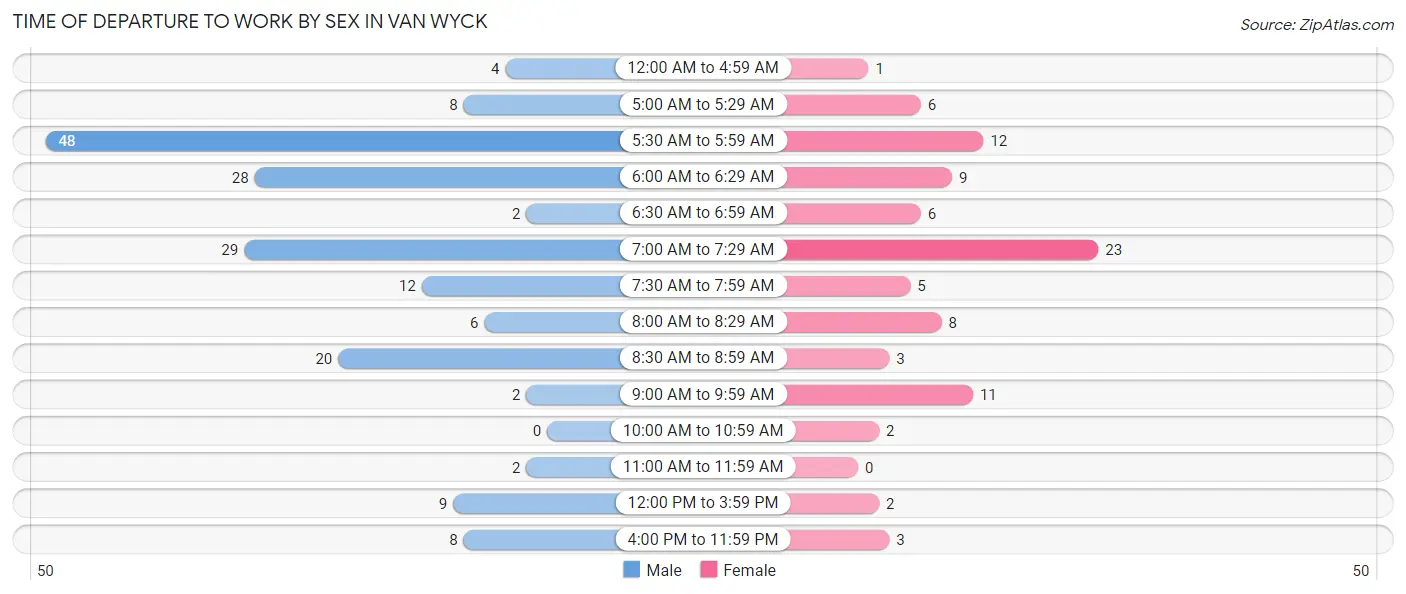
| Time of Departure | Male | Female |
| 12:00 AM to 4:59 AM | 4 (2.2%) | 1 (1.1%) |
| 5:00 AM to 5:29 AM | 8 (4.5%) | 6 (6.6%) |
| 5:30 AM to 5:59 AM | 48 (27.0%) | 12 (13.2%) |
| 6:00 AM to 6:29 AM | 28 (15.7%) | 9 (9.9%) |
| 6:30 AM to 6:59 AM | 2 (1.1%) | 6 (6.6%) |
| 7:00 AM to 7:29 AM | 29 (16.3%) | 23 (25.3%) |
| 7:30 AM to 7:59 AM | 12 (6.7%) | 5 (5.5%) |
| 8:00 AM to 8:29 AM | 6 (3.4%) | 8 (8.8%) |
| 8:30 AM to 8:59 AM | 20 (11.2%) | 3 (3.3%) |
| 9:00 AM to 9:59 AM | 2 (1.1%) | 11 (12.1%) |
| 10:00 AM to 10:59 AM | 0 (0.0%) | 2 (2.2%) |
| 11:00 AM to 11:59 AM | 2 (1.1%) | 0 (0.0%) |
| 12:00 PM to 3:59 PM | 9 (5.1%) | 2 (2.2%) |
| 4:00 PM to 11:59 PM | 8 (4.5%) | 3 (3.3%) |
| Total | 178 (100.0%) | 91 (100.0%) |
Housing Occupancy in Van Wyck
Occupancy by Ownership in Van Wyck
Of the total 396 dwellings in Van Wyck, owner-occupied units account for 387 (97.7%), while renter-occupied units make up 9 (2.3%).
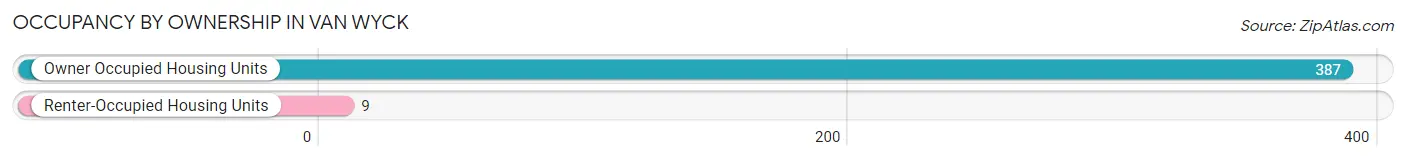
| Occupancy | # Housing Units | % Housing Units |
| Owner Occupied Housing Units | 387 | 97.7% |
| Renter-Occupied Housing Units | 9 | 2.3% |
| Total Occupied Housing Units | 396 | 100.0% |
Occupancy by Household Size in Van Wyck
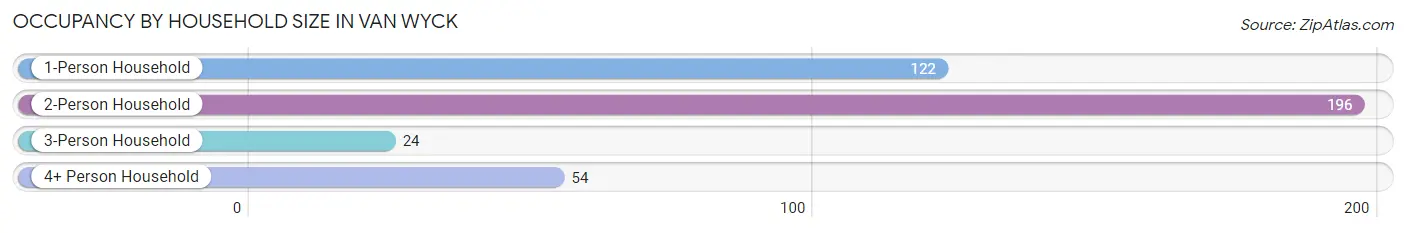
| Household Size | # Housing Units | % Housing Units |
| 1-Person Household | 122 | 30.8% |
| 2-Person Household | 196 | 49.5% |
| 3-Person Household | 24 | 6.1% |
| 4+ Person Household | 54 | 13.6% |
| Total Housing Units | 396 | 100.0% |
Occupancy by Ownership by Household Size in Van Wyck
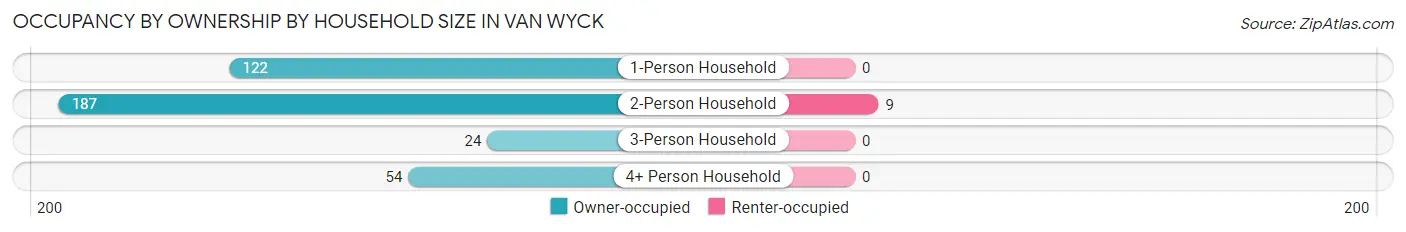
| Household Size | Owner-occupied | Renter-occupied |
| 1-Person Household | 122 (100.0%) | 0 (0.0%) |
| 2-Person Household | 187 (95.4%) | 9 (4.6%) |
| 3-Person Household | 24 (100.0%) | 0 (0.0%) |
| 4+ Person Household | 54 (100.0%) | 0 (0.0%) |
| Total Housing Units | 387 (97.7%) | 9 (2.3%) |
Occupancy by Educational Attainment in Van Wyck
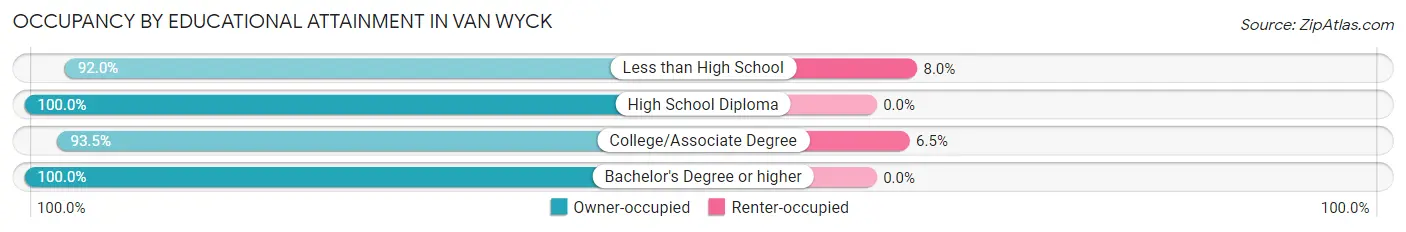
| Household Size | Owner-occupied | Renter-occupied |
| Less than High School | 23 (92.0%) | 2 (8.0%) |
| High School Diploma | 223 (100.0%) | 0 (0.0%) |
| College/Associate Degree | 100 (93.5%) | 7 (6.5%) |
| Bachelor's Degree or higher | 41 (100.0%) | 0 (0.0%) |
Occupancy by Age of Householder in Van Wyck
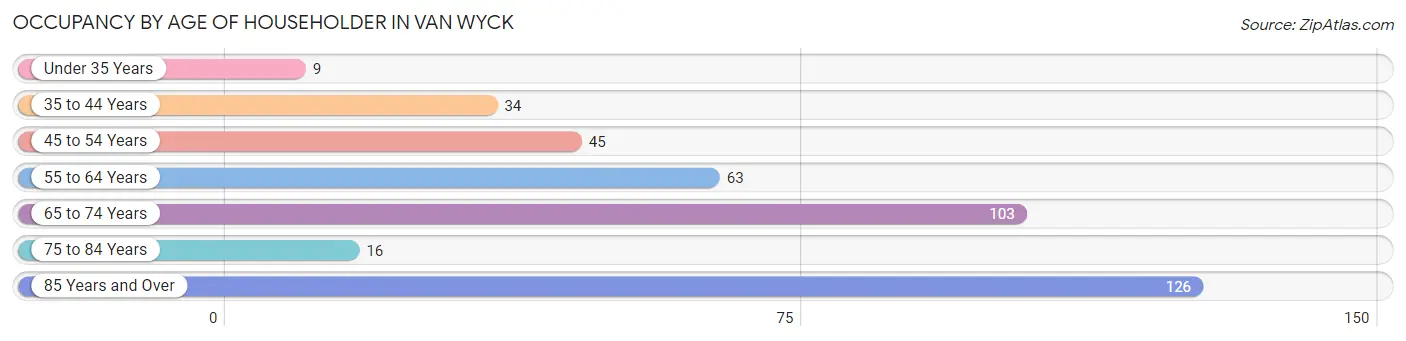
| Age Bracket | # Households | % Households |
| Under 35 Years | 9 | 2.3% |
| 35 to 44 Years | 34 | 8.6% |
| 45 to 54 Years | 45 | 11.4% |
| 55 to 64 Years | 63 | 15.9% |
| 65 to 74 Years | 103 | 26.0% |
| 75 to 84 Years | 16 | 4.0% |
| 85 Years and Over | 126 | 31.8% |
| Total | 396 | 100.0% |
Housing Finances in Van Wyck
Median Income by Occupancy in Van Wyck
| Occupancy Type | # Households | Median Income |
| Owner-Occupied | 387 (97.7%) | $0 |
| Renter-Occupied | 9 (2.3%) | $0 |
| Average | 396 (100.0%) | $0 |
Occupancy by Householder Income Bracket in Van Wyck
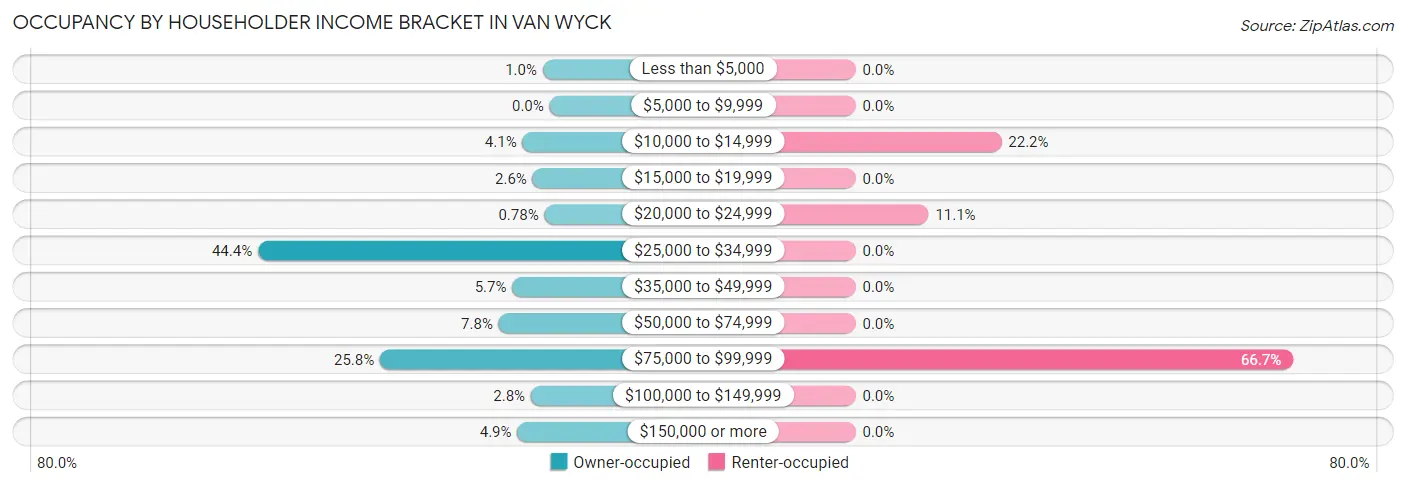
| Income Bracket | Owner-occupied | Renter-occupied |
| Less than $5,000 | 4 (1.0%) | 0 (0.0%) |
| $5,000 to $9,999 | 0 (0.0%) | 0 (0.0%) |
| $10,000 to $14,999 | 16 (4.1%) | 2 (22.2%) |
| $15,000 to $19,999 | 10 (2.6%) | 0 (0.0%) |
| $20,000 to $24,999 | 3 (0.8%) | 1 (11.1%) |
| $25,000 to $34,999 | 172 (44.4%) | 0 (0.0%) |
| $35,000 to $49,999 | 22 (5.7%) | 0 (0.0%) |
| $50,000 to $74,999 | 30 (7.7%) | 0 (0.0%) |
| $75,000 to $99,999 | 100 (25.8%) | 6 (66.7%) |
| $100,000 to $149,999 | 11 (2.8%) | 0 (0.0%) |
| $150,000 or more | 19 (4.9%) | 0 (0.0%) |
| Total | 387 (100.0%) | 9 (100.0%) |
Monthly Housing Cost Tiers in Van Wyck
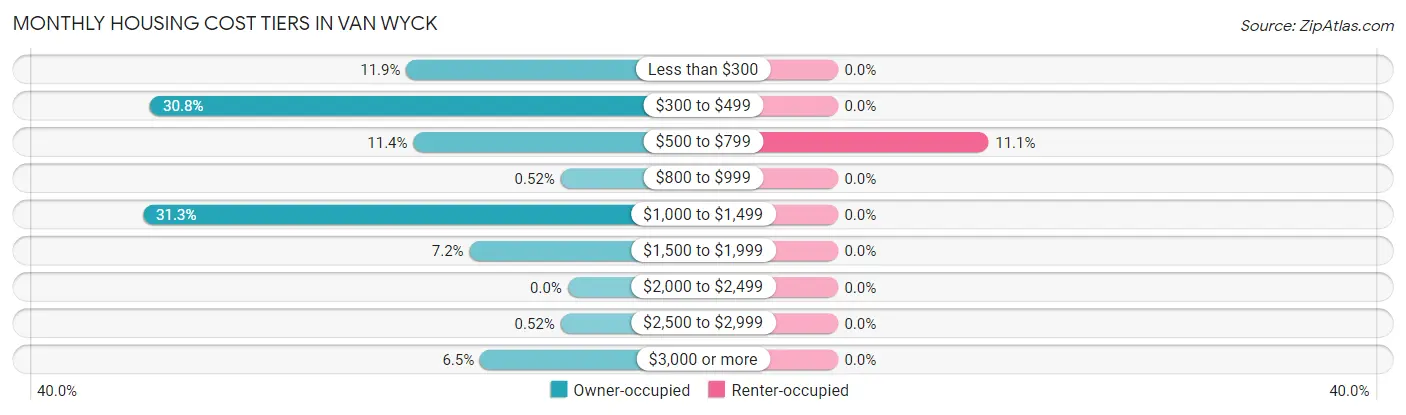
| Monthly Cost | Owner-occupied | Renter-occupied |
| Less than $300 | 46 (11.9%) | 0 (0.0%) |
| $300 to $499 | 119 (30.7%) | 0 (0.0%) |
| $500 to $799 | 44 (11.4%) | 1 (11.1%) |
| $800 to $999 | 2 (0.5%) | 0 (0.0%) |
| $1,000 to $1,499 | 121 (31.3%) | 0 (0.0%) |
| $1,500 to $1,999 | 28 (7.2%) | 0 (0.0%) |
| $2,000 to $2,499 | 0 (0.0%) | 0 (0.0%) |
| $2,500 to $2,999 | 2 (0.5%) | 0 (0.0%) |
| $3,000 or more | 25 (6.5%) | 0 (0.0%) |
| Total | 387 (100.0%) | 9 (100.0%) |
Physical Housing Characteristics in Van Wyck
Housing Structures in Van Wyck
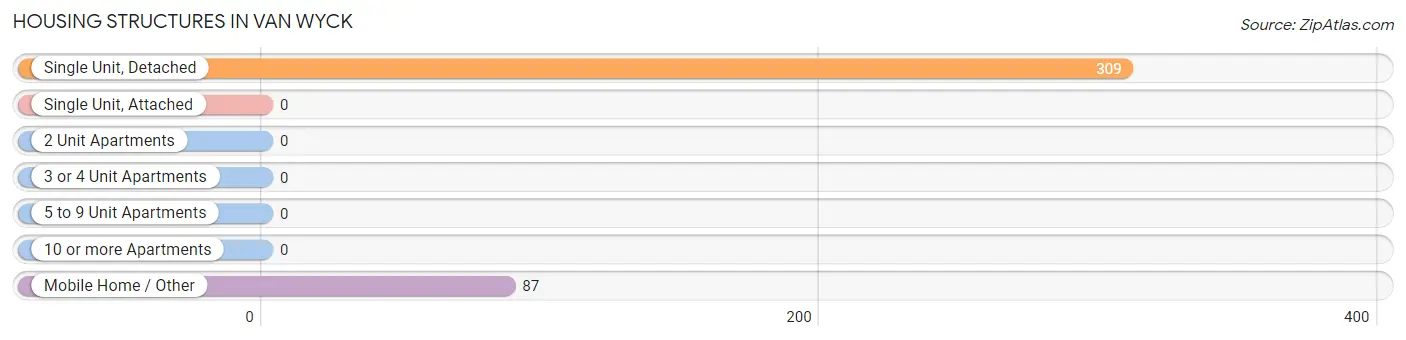
| Structure Type | # Housing Units | % Housing Units |
| Single Unit, Detached | 309 | 78.0% |
| Single Unit, Attached | 0 | 0.0% |
| 2 Unit Apartments | 0 | 0.0% |
| 3 or 4 Unit Apartments | 0 | 0.0% |
| 5 to 9 Unit Apartments | 0 | 0.0% |
| 10 or more Apartments | 0 | 0.0% |
| Mobile Home / Other | 87 | 22.0% |
| Total | 396 | 100.0% |
Housing Structures by Occupancy in Van Wyck
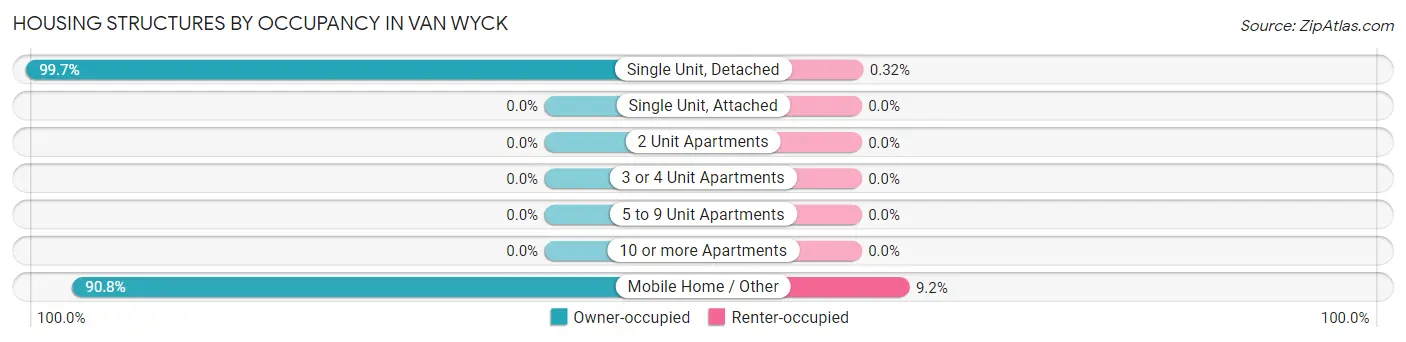
| Structure Type | Owner-occupied | Renter-occupied |
| Single Unit, Detached | 308 (99.7%) | 1 (0.3%) |
| Single Unit, Attached | 0 (0.0%) | 0 (0.0%) |
| 2 Unit Apartments | 0 (0.0%) | 0 (0.0%) |
| 3 or 4 Unit Apartments | 0 (0.0%) | 0 (0.0%) |
| 5 to 9 Unit Apartments | 0 (0.0%) | 0 (0.0%) |
| 10 or more Apartments | 0 (0.0%) | 0 (0.0%) |
| Mobile Home / Other | 79 (90.8%) | 8 (9.2%) |
| Total | 387 (97.7%) | 9 (2.3%) |
Housing Structures by Number of Rooms in Van Wyck
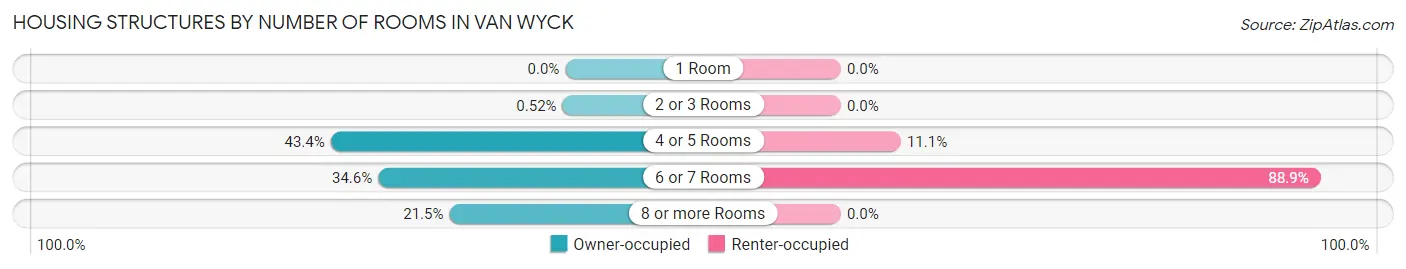
| Number of Rooms | Owner-occupied | Renter-occupied |
| 1 Room | 0 (0.0%) | 0 (0.0%) |
| 2 or 3 Rooms | 2 (0.5%) | 0 (0.0%) |
| 4 or 5 Rooms | 168 (43.4%) | 1 (11.1%) |
| 6 or 7 Rooms | 134 (34.6%) | 8 (88.9%) |
| 8 or more Rooms | 83 (21.4%) | 0 (0.0%) |
| Total | 387 (100.0%) | 9 (100.0%) |
Housing Structure by Heating Type in Van Wyck
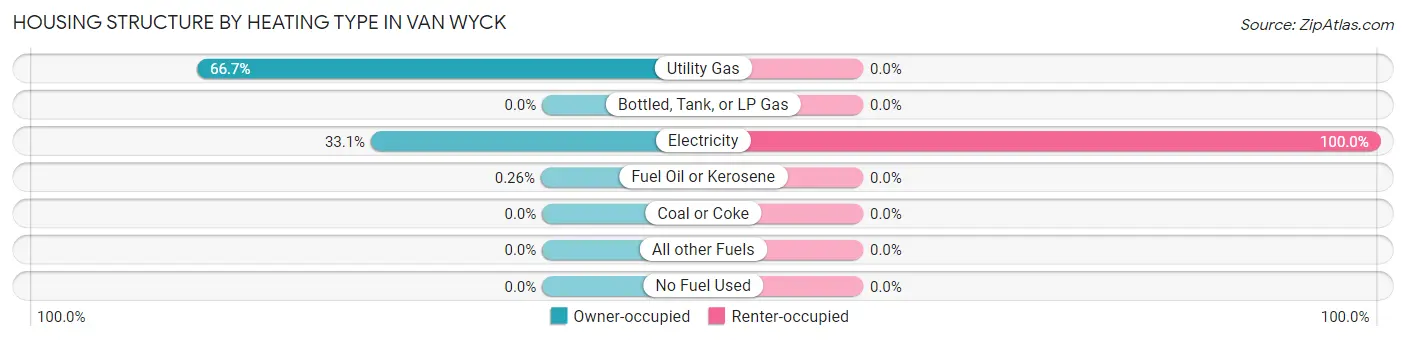
| Heating Type | Owner-occupied | Renter-occupied |
| Utility Gas | 258 (66.7%) | 0 (0.0%) |
| Bottled, Tank, or LP Gas | 0 (0.0%) | 0 (0.0%) |
| Electricity | 128 (33.1%) | 9 (100.0%) |
| Fuel Oil or Kerosene | 1 (0.3%) | 0 (0.0%) |
| Coal or Coke | 0 (0.0%) | 0 (0.0%) |
| All other Fuels | 0 (0.0%) | 0 (0.0%) |
| No Fuel Used | 0 (0.0%) | 0 (0.0%) |
| Total | 387 (100.0%) | 9 (100.0%) |
Household Vehicle Usage in Van Wyck
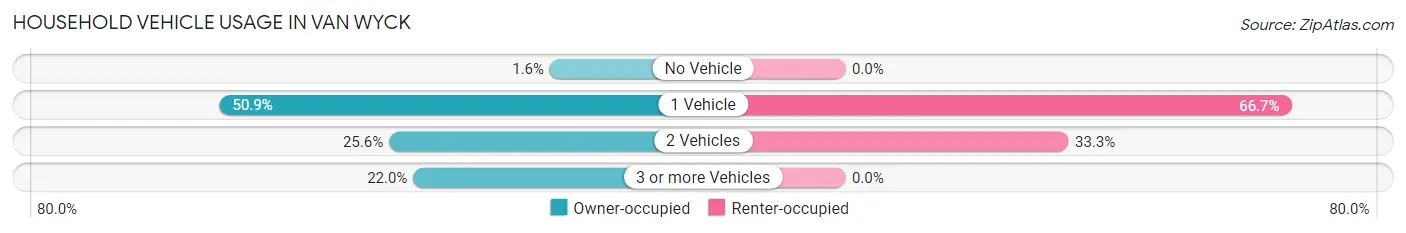
| Vehicles per Household | Owner-occupied | Renter-occupied |
| No Vehicle | 6 (1.5%) | 0 (0.0%) |
| 1 Vehicle | 197 (50.9%) | 6 (66.7%) |
| 2 Vehicles | 99 (25.6%) | 3 (33.3%) |
| 3 or more Vehicles | 85 (22.0%) | 0 (0.0%) |
| Total | 387 (100.0%) | 9 (100.0%) |
Real Estate & Mortgages in Van Wyck
Real Estate and Mortgage Overview in Van Wyck
| Characteristic | Without Mortgage | With Mortgage |
| Housing Units | 242 | 145 |
| Median Property Value | $243,800 | $225,400 |
| Median Household Income | $27,212 | $14 |
| Monthly Housing Costs | $448 | $25 |
| Real Estate Taxes | $1,597 | $8 |
Property Value by Mortgage Status in Van Wyck
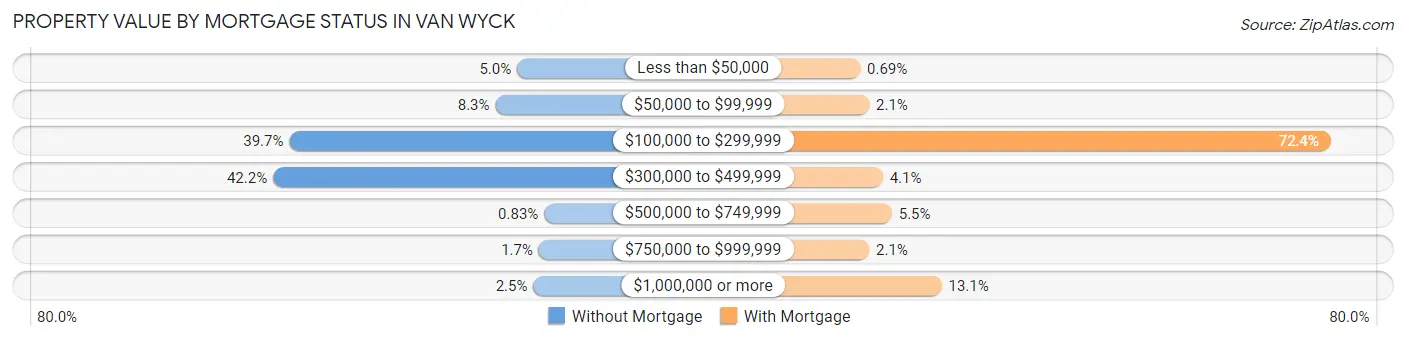
| Property Value | Without Mortgage | With Mortgage |
| Less than $50,000 | 12 (5.0%) | 1 (0.7%) |
| $50,000 to $99,999 | 20 (8.3%) | 3 (2.1%) |
| $100,000 to $299,999 | 96 (39.7%) | 105 (72.4%) |
| $300,000 to $499,999 | 102 (42.1%) | 6 (4.1%) |
| $500,000 to $749,999 | 2 (0.8%) | 8 (5.5%) |
| $750,000 to $999,999 | 4 (1.7%) | 3 (2.1%) |
| $1,000,000 or more | 6 (2.5%) | 19 (13.1%) |
| Total | 242 (100.0%) | 145 (100.0%) |
Household Income by Mortgage Status in Van Wyck
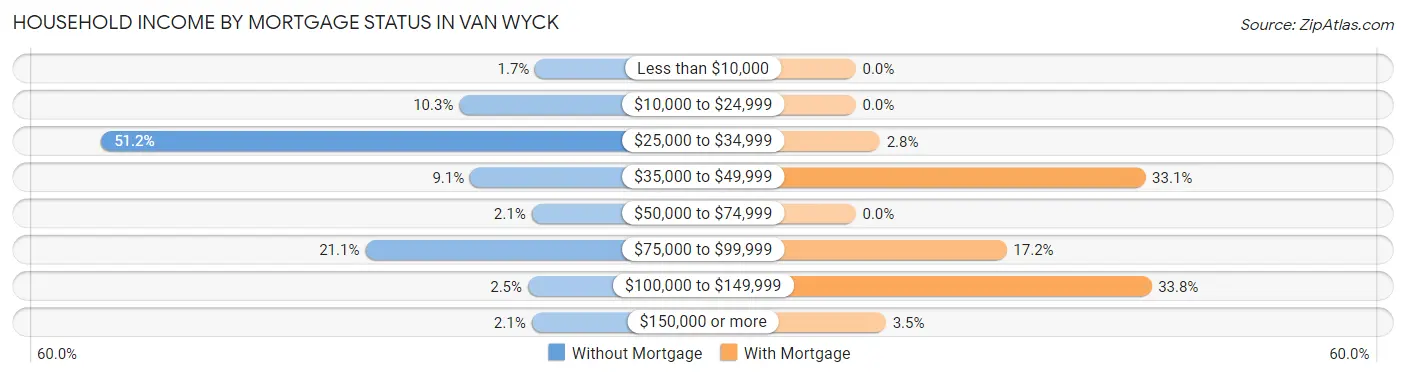
| Household Income | Without Mortgage | With Mortgage |
| Less than $10,000 | 4 (1.7%) | 0 (0.0%) |
| $10,000 to $24,999 | 25 (10.3%) | 0 (0.0%) |
| $25,000 to $34,999 | 124 (51.2%) | 4 (2.8%) |
| $35,000 to $49,999 | 22 (9.1%) | 48 (33.1%) |
| $50,000 to $74,999 | 5 (2.1%) | 0 (0.0%) |
| $75,000 to $99,999 | 51 (21.1%) | 25 (17.2%) |
| $100,000 to $149,999 | 6 (2.5%) | 49 (33.8%) |
| $150,000 or more | 5 (2.1%) | 5 (3.5%) |
| Total | 242 (100.0%) | 145 (100.0%) |
Property Value to Household Income Ratio in Van Wyck
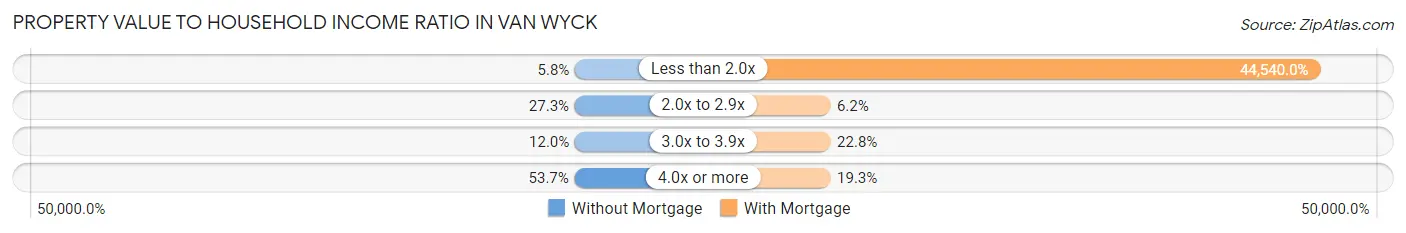
| Value-to-Income Ratio | Without Mortgage | With Mortgage |
| Less than 2.0x | 14 (5.8%) | 64,583 (44,540.0%) |
| 2.0x to 2.9x | 66 (27.3%) | 9 (6.2%) |
| 3.0x to 3.9x | 29 (12.0%) | 33 (22.8%) |
| 4.0x or more | 130 (53.7%) | 28 (19.3%) |
| Total | 242 (100.0%) | 145 (100.0%) |
Real Estate Taxes by Mortgage Status in Van Wyck
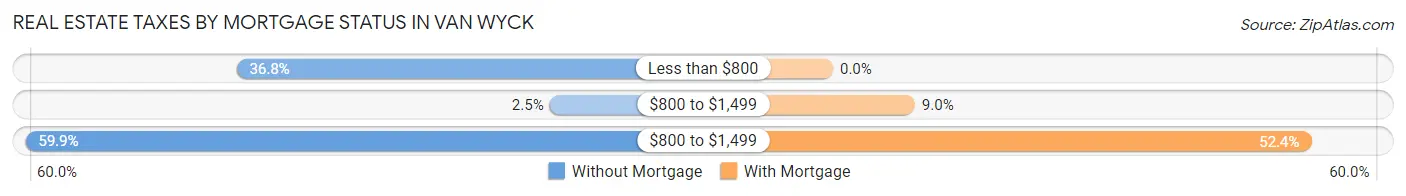
| Property Taxes | Without Mortgage | With Mortgage |
| Less than $800 | 89 (36.8%) | 0 (0.0%) |
| $800 to $1,499 | 6 (2.5%) | 13 (9.0%) |
| $800 to $1,499 | 145 (59.9%) | 76 (52.4%) |
| Total | 242 (100.0%) | 145 (100.0%) |
Health & Disability in Van Wyck
Health Insurance Coverage by Age in Van Wyck
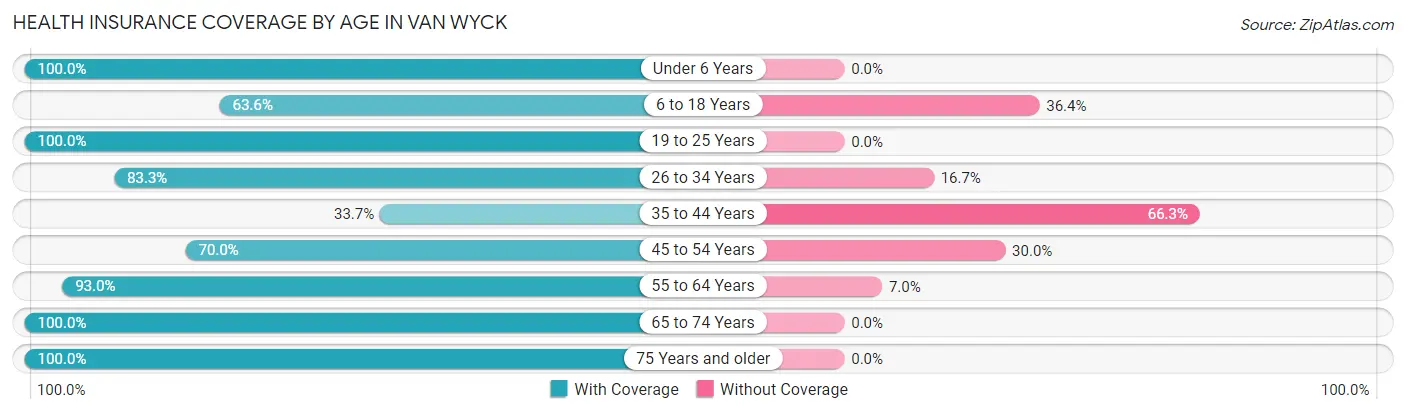
| Age Bracket | With Coverage | Without Coverage |
| Under 6 Years | 8 (100.0%) | 0 (0.0%) |
| 6 to 18 Years | 84 (63.6%) | 48 (36.4%) |
| 19 to 25 Years | 46 (100.0%) | 0 (0.0%) |
| 26 to 34 Years | 30 (83.3%) | 6 (16.7%) |
| 35 to 44 Years | 30 (33.7%) | 59 (66.3%) |
| 45 to 54 Years | 49 (70.0%) | 21 (30.0%) |
| 55 to 64 Years | 106 (93.0%) | 8 (7.0%) |
| 65 to 74 Years | 124 (100.0%) | 0 (0.0%) |
| 75 Years and older | 254 (100.0%) | 0 (0.0%) |
| Total | 731 (83.7%) | 142 (16.3%) |
Health Insurance Coverage by Citizenship Status in Van Wyck
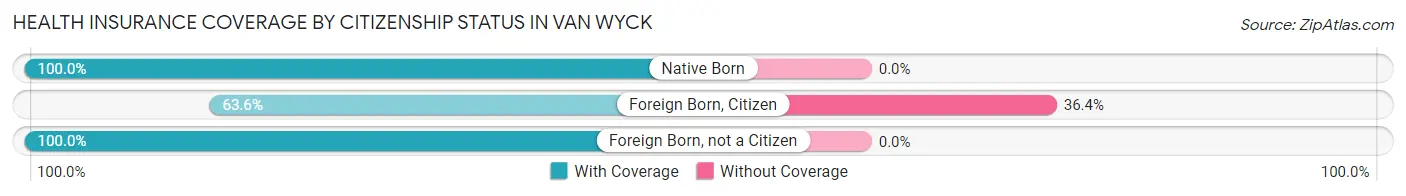
| Citizenship Status | With Coverage | Without Coverage |
| Native Born | 8 (100.0%) | 0 (0.0%) |
| Foreign Born, Citizen | 84 (63.6%) | 48 (36.4%) |
| Foreign Born, not a Citizen | 46 (100.0%) | 0 (0.0%) |
Health Insurance Coverage by Household Income in Van Wyck
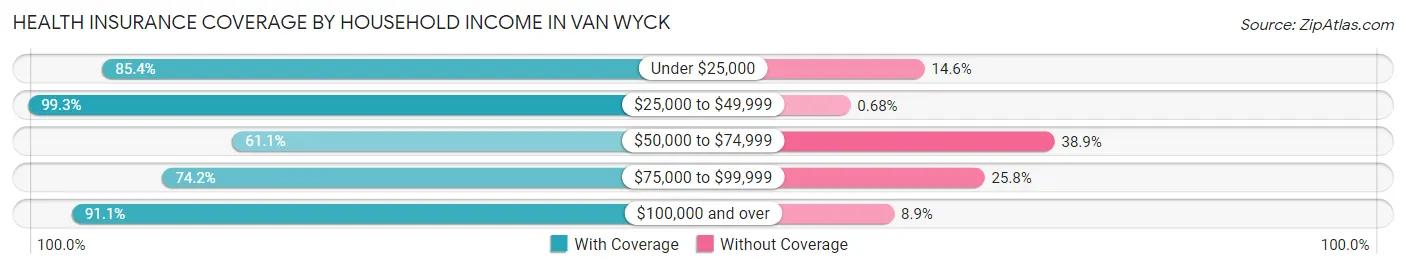
| Household Income | With Coverage | Without Coverage |
| Under $25,000 | 41 (85.4%) | 7 (14.6%) |
| $25,000 to $49,999 | 293 (99.3%) | 2 (0.7%) |
| $50,000 to $74,999 | 80 (61.1%) | 51 (38.9%) |
| $75,000 to $99,999 | 204 (74.2%) | 71 (25.8%) |
| $100,000 and over | 113 (91.1%) | 11 (8.9%) |
Public vs Private Health Insurance Coverage by Age in Van Wyck
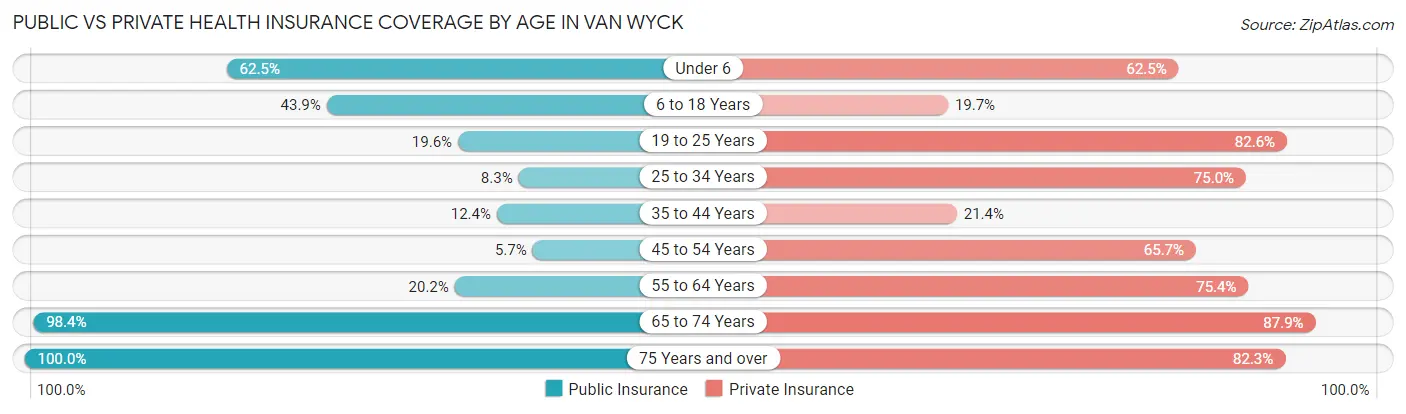
| Age Bracket | Public Insurance | Private Insurance |
| Under 6 | 5 (62.5%) | 5 (62.5%) |
| 6 to 18 Years | 58 (43.9%) | 26 (19.7%) |
| 19 to 25 Years | 9 (19.6%) | 38 (82.6%) |
| 25 to 34 Years | 3 (8.3%) | 27 (75.0%) |
| 35 to 44 Years | 11 (12.4%) | 19 (21.3%) |
| 45 to 54 Years | 4 (5.7%) | 46 (65.7%) |
| 55 to 64 Years | 23 (20.2%) | 86 (75.4%) |
| 65 to 74 Years | 122 (98.4%) | 109 (87.9%) |
| 75 Years and over | 254 (100.0%) | 209 (82.3%) |
| Total | 489 (56.0%) | 565 (64.7%) |
Disability Status by Sex by Age in Van Wyck
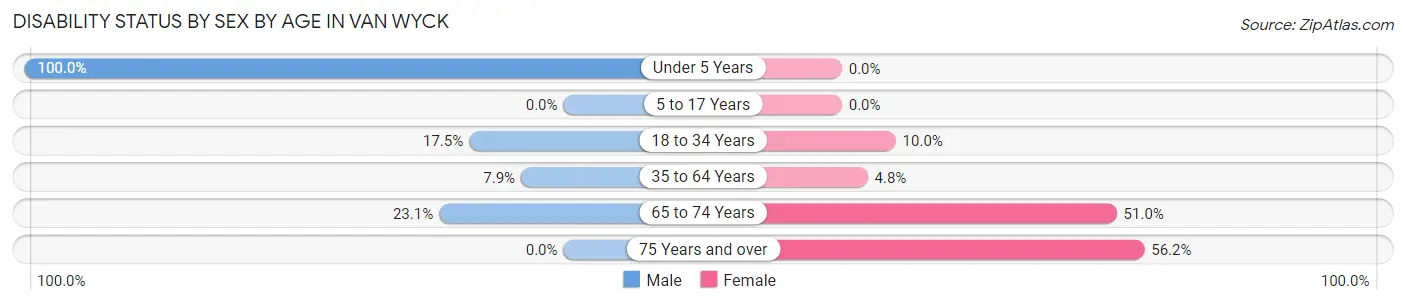
| Age Bracket | Male | Female |
| Under 5 Years | 1 (100.0%) | 0 (0.0%) |
| 5 to 17 Years | 0 (0.0%) | 0 (0.0%) |
| 18 to 34 Years | 7 (17.5%) | 5 (10.0%) |
| 35 to 64 Years | 10 (7.9%) | 7 (4.8%) |
| 65 to 74 Years | 6 (23.1%) | 50 (51.0%) |
| 75 Years and over | 0 (0.0%) | 73 (56.1%) |
Disability Class by Sex by Age in Van Wyck
Disability Class: Hearing Difficulty
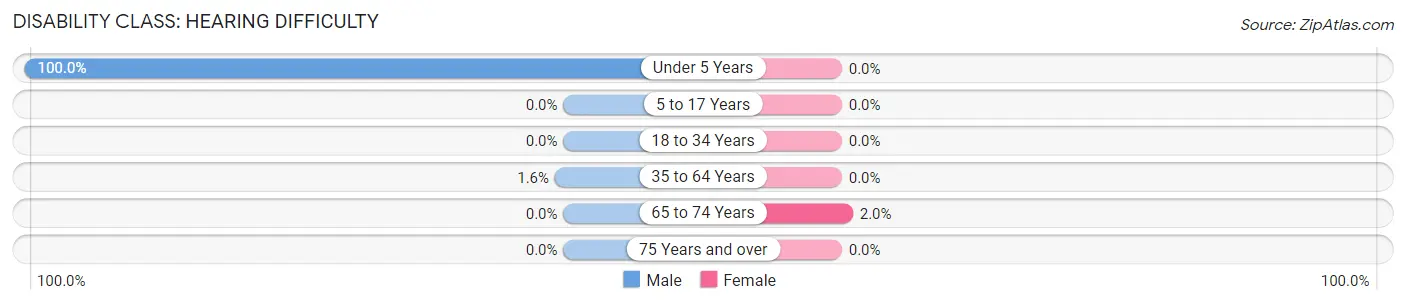
| Age Bracket | Male | Female |
| Under 5 Years | 1 (100.0%) | 0 (0.0%) |
| 5 to 17 Years | 0 (0.0%) | 0 (0.0%) |
| 18 to 34 Years | 0 (0.0%) | 0 (0.0%) |
| 35 to 64 Years | 2 (1.6%) | 0 (0.0%) |
| 65 to 74 Years | 0 (0.0%) | 2 (2.0%) |
| 75 Years and over | 0 (0.0%) | 0 (0.0%) |
Disability Class: Vision Difficulty
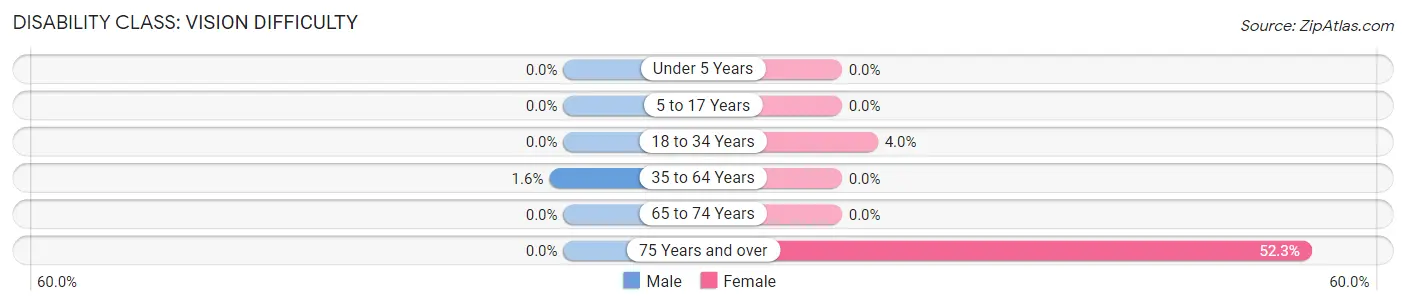
| Age Bracket | Male | Female |
| Under 5 Years | 0 (0.0%) | 0 (0.0%) |
| 5 to 17 Years | 0 (0.0%) | 0 (0.0%) |
| 18 to 34 Years | 0 (0.0%) | 2 (4.0%) |
| 35 to 64 Years | 2 (1.6%) | 0 (0.0%) |
| 65 to 74 Years | 0 (0.0%) | 0 (0.0%) |
| 75 Years and over | 0 (0.0%) | 68 (52.3%) |
Disability Class: Cognitive Difficulty
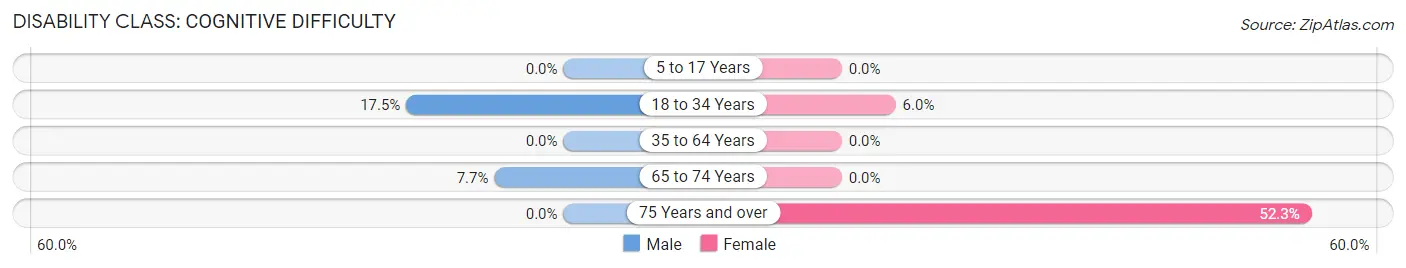
| Age Bracket | Male | Female |
| 5 to 17 Years | 0 (0.0%) | 0 (0.0%) |
| 18 to 34 Years | 7 (17.5%) | 3 (6.0%) |
| 35 to 64 Years | 0 (0.0%) | 0 (0.0%) |
| 65 to 74 Years | 2 (7.7%) | 0 (0.0%) |
| 75 Years and over | 0 (0.0%) | 68 (52.3%) |
Disability Class: Ambulatory Difficulty
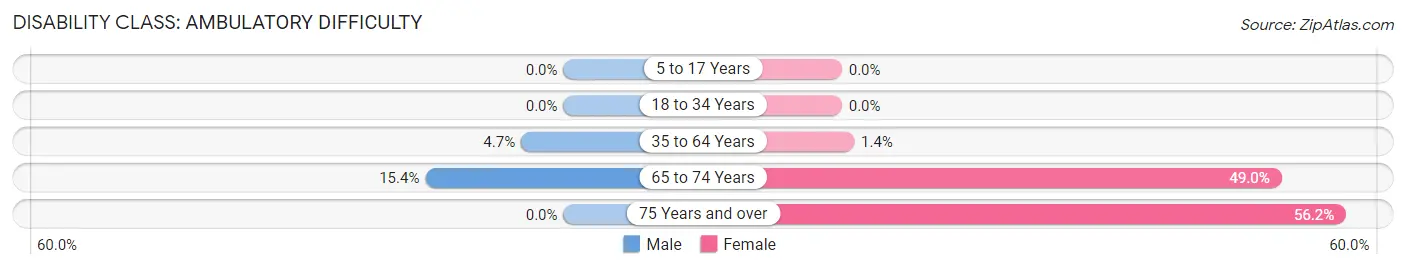
| Age Bracket | Male | Female |
| 5 to 17 Years | 0 (0.0%) | 0 (0.0%) |
| 18 to 34 Years | 0 (0.0%) | 0 (0.0%) |
| 35 to 64 Years | 6 (4.7%) | 2 (1.4%) |
| 65 to 74 Years | 4 (15.4%) | 48 (49.0%) |
| 75 Years and over | 0 (0.0%) | 73 (56.1%) |
Disability Class: Self-Care Difficulty
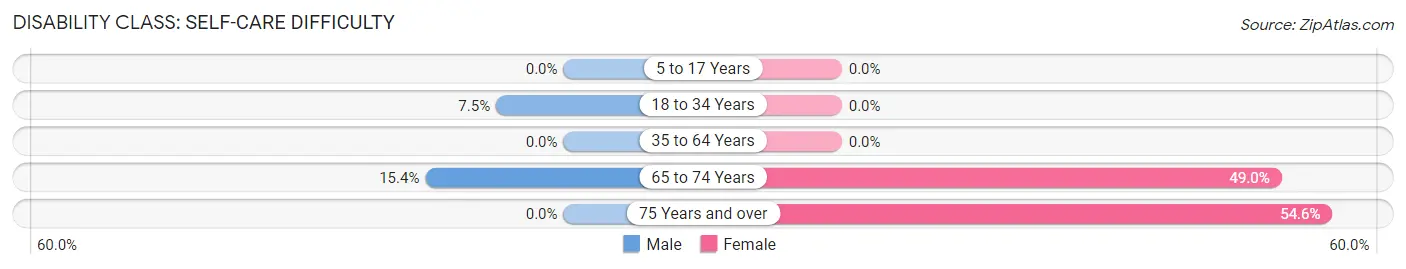
| Age Bracket | Male | Female |
| 5 to 17 Years | 0 (0.0%) | 0 (0.0%) |
| 18 to 34 Years | 3 (7.5%) | 0 (0.0%) |
| 35 to 64 Years | 0 (0.0%) | 0 (0.0%) |
| 65 to 74 Years | 4 (15.4%) | 48 (49.0%) |
| 75 Years and over | 0 (0.0%) | 71 (54.6%) |
Technology Access in Van Wyck
Computing Device Access in Van Wyck
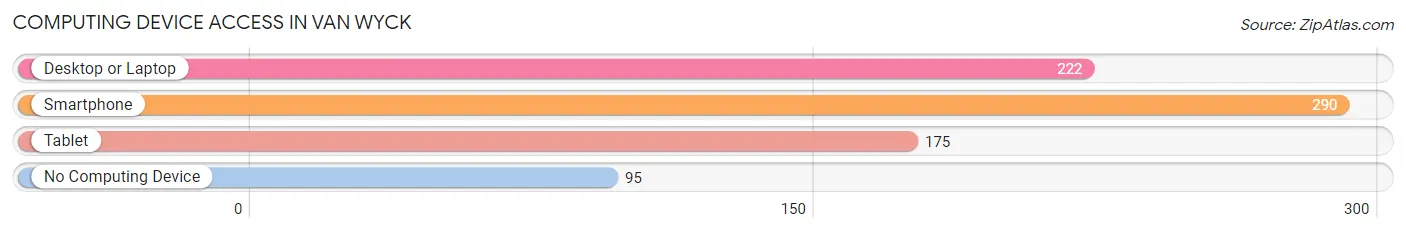
| Device Type | # Households | % Households |
| Desktop or Laptop | 222 | 56.1% |
| Smartphone | 290 | 73.2% |
| Tablet | 175 | 44.2% |
| No Computing Device | 95 | 24.0% |
| Total | 396 | 100.0% |
Internet Access in Van Wyck
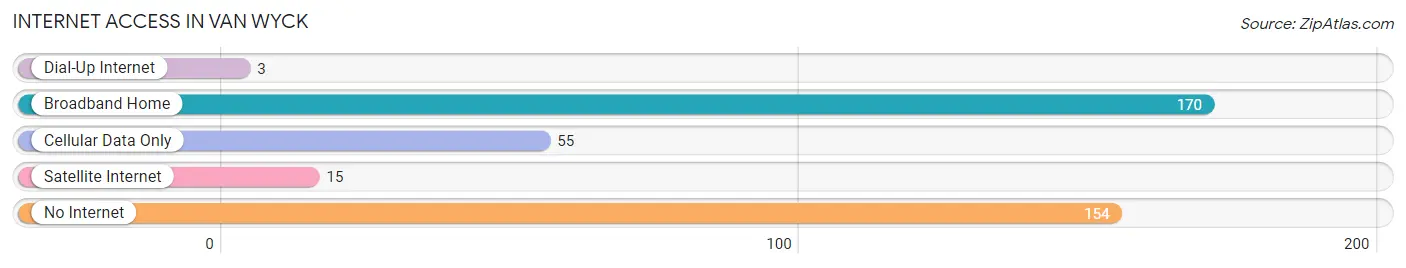
| Internet Type | # Households | % Households |
| Dial-Up Internet | 3 | 0.8% |
| Broadband Home | 170 | 42.9% |
| Cellular Data Only | 55 | 13.9% |
| Satellite Internet | 15 | 3.8% |
| No Internet | 154 | 38.9% |
| Total | 396 | 100.0% |
Van Wyck Summary
History
The town of Van Wyck, South Carolina is located in Lancaster County, approximately 25 miles south of Charlotte, North Carolina. The town was founded in 1891 by the Van Wyck family, who were originally from the Netherlands. The family purchased the land from the Catawba Indians and named the town after their ancestor, Cornelius Van Wyck. The town was originally a farming community, but in the early 1900s, the Van Wyck family began to develop the area into a small industrial town. The first industry to be established was a cotton mill, which was followed by a sawmill, a gristmill, and a brickyard.
The town grew steadily throughout the early 20th century, and by the 1950s, it had become a thriving community with a population of over 1,000 people. The town was home to several businesses, including a grocery store, a hardware store, a bank, and a movie theater. The town also had its own school system, which included an elementary school, a middle school, and a high school.
In the late 1960s, the town began to decline as the local industries began to close. By the 1980s, the population had dropped to just over 500 people. In the 1990s, the town began to experience a resurgence as new businesses began to move into the area. Today, the town has a population of over 1,500 people and is home to several businesses, including a grocery store, a hardware store, a bank, and a movie theater.
Geography
Van Wyck is located in the Piedmont region of South Carolina, approximately 25 miles south of Charlotte, North Carolina. The town is situated on the banks of the Catawba River, which flows through the town and provides a source of recreation for the residents. The town is surrounded by rolling hills and forests, and is home to several parks and recreational areas.
The climate in Van Wyck is mild and humid, with temperatures ranging from the mid-50s in the winter to the mid-80s in the summer. The town receives an average of 48 inches of rain per year, and snowfall is rare.
Economy
The economy of Van Wyck is largely based on agriculture and manufacturing. The town is home to several farms, which produce a variety of crops, including corn, soybeans, and cotton. The town also has several manufacturing plants, which produce a variety of products, including furniture, textiles, and automotive parts.
The town is also home to several small businesses, including restaurants, retail stores, and service providers. The town is also home to a branch of the Lancaster County Bank, which provides banking services to the residents of Van Wyck.
Demographics
As of the 2010 census, the population of Van Wyck was 1,541. The racial makeup of the town was 79.3% White, 17.2% African American, 0.7% Native American, 0.3% Asian, 0.1% Pacific Islander, and 2.4% from other races. The median household income was $37,917, and the median family income was $45,938. The per capita income was $19,945.
The town is home to several churches, including the Van Wyck Presbyterian Church, the Van Wyck Baptist Church, and the Van Wyck Methodist Church. The town also has a public library, a post office, and a fire department.
Common Questions
What is Per Capita Income in Van Wyck?
Per Capita income in Van Wyck is $27,139.
What is the Median Family Income in Van Wyck?
Median Family Income in Van Wyck is $64,940.
What is Inequality or Gini Index in Van Wyck?
Inequality or Gini Index in Van Wyck is 0.38.
What is the Total Population of Van Wyck?
Total Population of Van Wyck is 873.
What is the Total Male Population of Van Wyck?
Total Male Population of Van Wyck is 360.
What is the Total Female Population of Van Wyck?
Total Female Population of Van Wyck is 513.
What is the Ratio of Males per 100 Females in Van Wyck?
There are 70.18 Males per 100 Females in Van Wyck.
What is the Ratio of Females per 100 Males in Van Wyck?
There are 142.50 Females per 100 Males in Van Wyck.
What is the Median Population Age in Van Wyck?
Median Population Age in Van Wyck is 61.4 Years.
What is the Average Family Size in Van Wyck
Average Family Size in Van Wyck is 2.8 People.
What is the Average Household Size in Van Wyck
Average Household Size in Van Wyck is 2.2 People.
How Large is the Labor Force in Van Wyck?
There are 316 People in the Labor Forcein in Van Wyck.
What is the Percentage of People in the Labor Force in Van Wyck?
42.4% of People are in the Labor Force in Van Wyck.
What is the Unemployment Rate in Van Wyck?
Unemployment Rate in Van Wyck is 8.5%.