American Falls, ID Map & Demographics
American Falls Map
American Falls Overview
$22,047
PER CAPITA INCOME
$65,500
AVG FAMILY INCOME
$55,465
AVG HOUSEHOLD INCOME
41.2%
WAGE / INCOME GAP [ % ]
58.8¢/ $1
WAGE / INCOME GAP [ $ ]
0.34
INEQUALITY / GINI INDEX
4,573
TOTAL POPULATION
2,187
MALE POPULATION
2,386
FEMALE POPULATION
91.66
MALES / 100 FEMALES
109.10
FEMALES / 100 MALES
30.8
MEDIAN AGE
3.7
AVG FAMILY SIZE
3.1
AVG HOUSEHOLD SIZE
2,193
LABOR FORCE [ PEOPLE ]
69.0%
PERCENT IN LABOR FORCE
7.8%
UNEMPLOYMENT RATE
American Falls Zip Codes
American Falls Area Codes
Income in American Falls
Income Overview in American Falls
Per Capita Income in American Falls is $22,047, while median incomes of families and households are $65,500 and $55,465 respectively.
| Characteristic | Number | Measure |
| Per Capita Income | 4,573 | $22,047 |
| Median Family Income | 1,054 | $65,500 |
| Mean Family Income | 1,054 | $75,175 |
| Median Household Income | 1,465 | $55,465 |
| Mean Household Income | 1,465 | $65,330 |
| Income Deficit | 1,054 | $0 |
| Wage / Income Gap (%) | 4,573 | 41.15% |
| Wage / Income Gap ($) | 4,573 | 58.85¢ per $1 |
| Gini / Inequality Index | 4,573 | 0.34 |
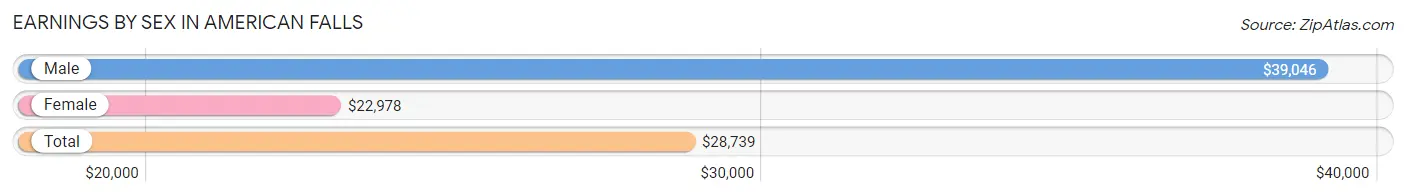
Earnings by Sex in American Falls
Average Earnings in American Falls are $28,739, $39,046 for men and $22,978 for women, a difference of 41.1%.
| Sex | Number | Average Earnings |
| Male | 1,285 (54.3%) | $39,046 |
| Female | 1,083 (45.7%) | $22,978 |
| Total | 2,368 (100.0%) | $28,739 |
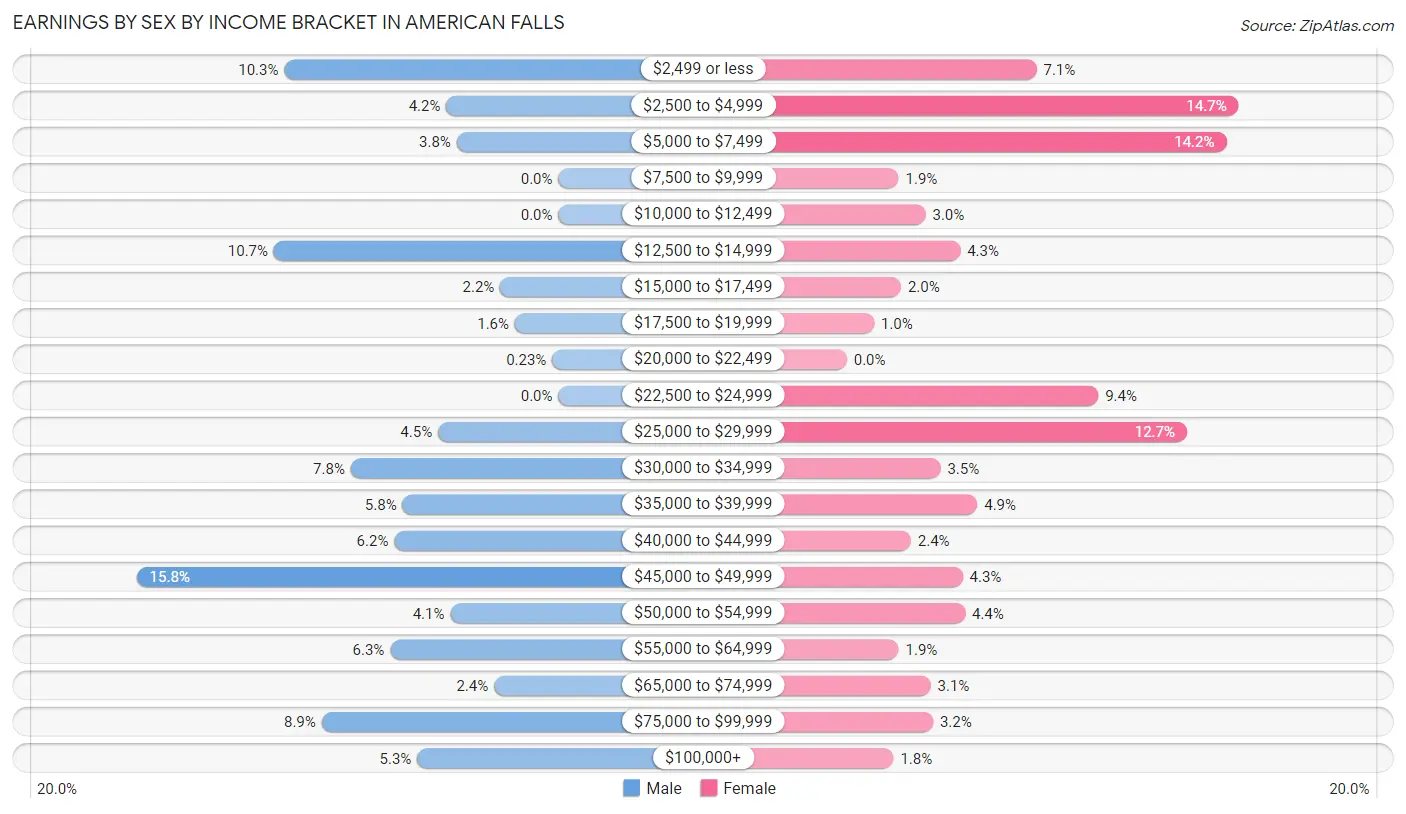
Earnings by Sex by Income Bracket in American Falls
The most common earnings brackets in American Falls are $45,000 to $49,999 for men (203 | 15.8%) and $2,500 to $4,999 for women (159 | 14.7%).
| Income | Male | Female |
| $2,499 or less | 132 (10.3%) | 77 (7.1%) |
| $2,500 to $4,999 | 54 (4.2%) | 159 (14.7%) |
| $5,000 to $7,499 | 49 (3.8%) | 154 (14.2%) |
| $7,500 to $9,999 | 0 (0.0%) | 21 (1.9%) |
| $10,000 to $12,499 | 0 (0.0%) | 32 (2.9%) |
| $12,500 to $14,999 | 137 (10.7%) | 46 (4.3%) |
| $15,000 to $17,499 | 28 (2.2%) | 22 (2.0%) |
| $17,500 to $19,999 | 21 (1.6%) | 11 (1.0%) |
| $20,000 to $22,499 | 3 (0.2%) | 0 (0.0%) |
| $22,500 to $24,999 | 0 (0.0%) | 102 (9.4%) |
| $25,000 to $29,999 | 58 (4.5%) | 138 (12.7%) |
| $30,000 to $34,999 | 100 (7.8%) | 38 (3.5%) |
| $35,000 to $39,999 | 75 (5.8%) | 53 (4.9%) |
| $40,000 to $44,999 | 79 (6.1%) | 26 (2.4%) |
| $45,000 to $49,999 | 203 (15.8%) | 47 (4.3%) |
| $50,000 to $54,999 | 52 (4.1%) | 48 (4.4%) |
| $55,000 to $64,999 | 81 (6.3%) | 21 (1.9%) |
| $65,000 to $74,999 | 31 (2.4%) | 34 (3.1%) |
| $75,000 to $99,999 | 114 (8.9%) | 35 (3.2%) |
| $100,000+ | 68 (5.3%) | 19 (1.8%) |
| Total | 1,285 (100.0%) | 1,083 (100.0%) |
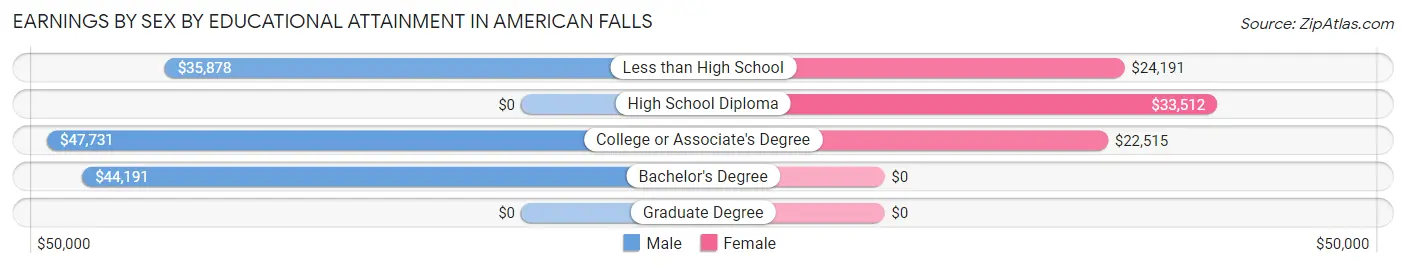
Earnings by Sex by Educational Attainment in American Falls
Average earnings in American Falls are $40,781 for men and $24,988 for women, a difference of 38.7%. Men with an educational attainment of college or associate's degree enjoy the highest average annual earnings of $47,731, while those with less than high school education earn the least with $35,878. Women with an educational attainment of high school diploma earn the most with the average annual earnings of $33,512, while those with college or associate's degree education have the smallest earnings of $22,515.
| Educational Attainment | Male Income | Female Income |
| Less than High School | $35,878 | $24,191 |
| High School Diploma | - | - |
| College or Associate's Degree | $47,731 | $22,515 |
| Bachelor's Degree | $44,191 | $0 |
| Graduate Degree | - | - |
| Total | $40,781 | $24,988 |
Family Income in American Falls
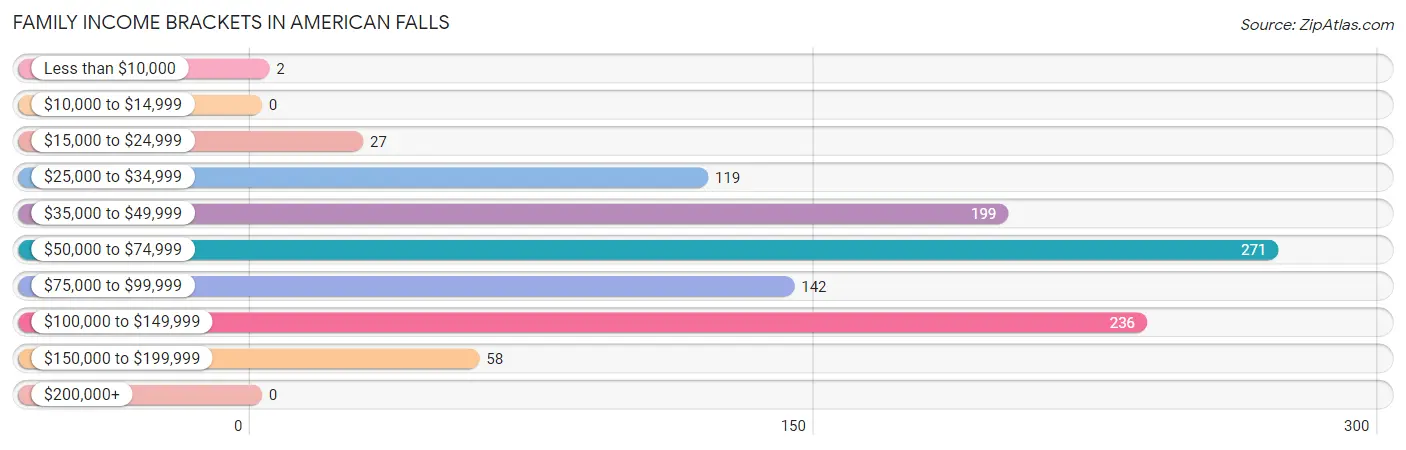
Family Income Brackets in American Falls
According to the American Falls family income data, there are 271 families falling into the $50,000 to $74,999 income range, which is the most common income bracket and makes up 25.7% of all families.
| Income Bracket | # Families | % Families |
| Less than $10,000 | 2 | 0.2% |
| $10,000 to $14,999 | 0 | 0.0% |
| $15,000 to $24,999 | 27 | 2.6% |
| $25,000 to $34,999 | 119 | 11.3% |
| $35,000 to $49,999 | 199 | 18.9% |
| $50,000 to $74,999 | 271 | 25.7% |
| $75,000 to $99,999 | 142 | 13.5% |
| $100,000 to $149,999 | 236 | 22.4% |
| $150,000 to $199,999 | 58 | 5.5% |
| $200,000+ | 0 | 0.0% |
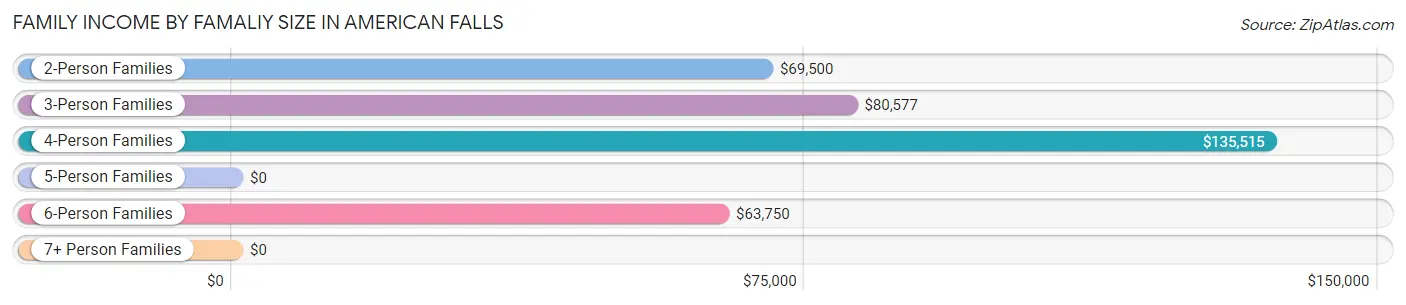
Family Income by Famaliy Size in American Falls
4-person families (110 | 10.4%) account for the highest median family income in American Falls with $135,515 per family, while 2-person families (494 | 46.9%) have the highest median income of $34,750 per family member.
| Income Bracket | # Families | Median Income |
| 2-Person Families | 494 (46.9%) | $69,500 |
| 3-Person Families | 150 (14.2%) | $80,577 |
| 4-Person Families | 110 (10.4%) | $135,515 |
| 5-Person Families | 79 (7.5%) | $0 |
| 6-Person Families | 189 (17.9%) | $63,750 |
| 7+ Person Families | 32 (3.0%) | $0 |
| Total | 1,054 (100.0%) | $65,500 |
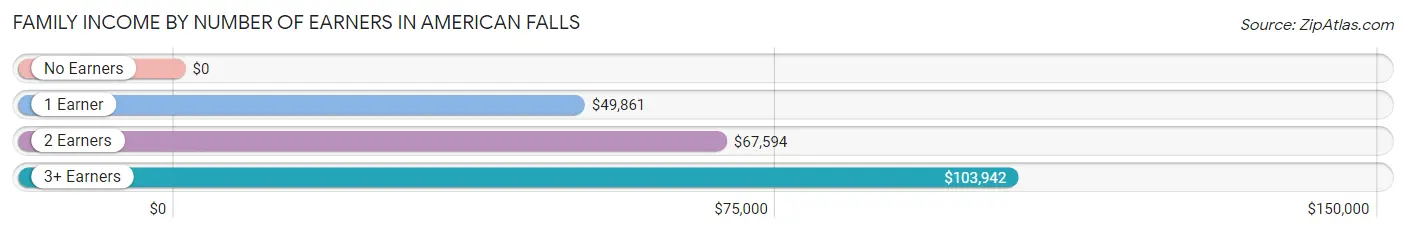
Family Income by Number of Earners in American Falls
| Number of Earners | # Families | Median Income |
| No Earners | 98 (9.3%) | $0 |
| 1 Earner | 247 (23.4%) | $49,861 |
| 2 Earners | 535 (50.8%) | $67,594 |
| 3+ Earners | 174 (16.5%) | $103,942 |
| Total | 1,054 (100.0%) | $65,500 |
Household Income in American Falls
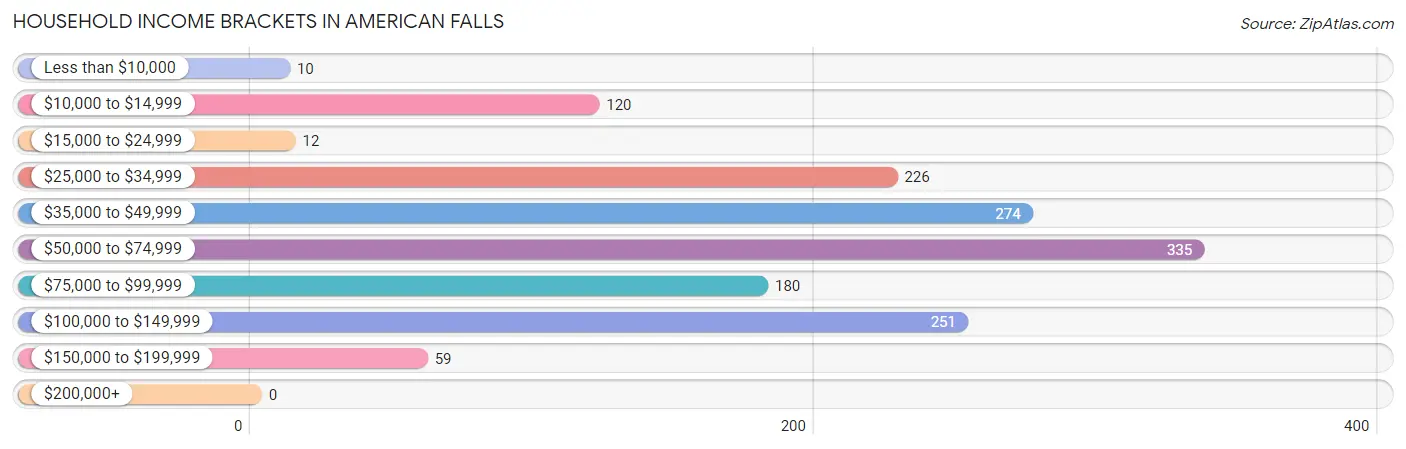
Household Income Brackets in American Falls
With 335 households falling in the category, the $50,000 to $74,999 income range is the most frequent in American Falls, accounting for 22.9% of all households.
| Income Bracket | # Households | % Households |
| Less than $10,000 | 10 | 0.7% |
| $10,000 to $14,999 | 120 | 8.2% |
| $15,000 to $24,999 | 12 | 0.8% |
| $25,000 to $34,999 | 226 | 15.4% |
| $35,000 to $49,999 | 274 | 18.7% |
| $50,000 to $74,999 | 335 | 22.9% |
| $75,000 to $99,999 | 180 | 12.3% |
| $100,000 to $149,999 | 251 | 17.1% |
| $150,000 to $199,999 | 59 | 4.0% |
| $200,000+ | 0 | 0.0% |
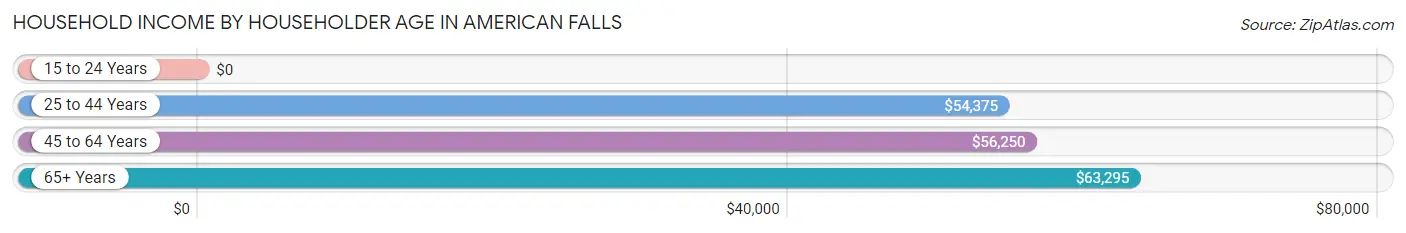
Household Income by Householder Age in American Falls
The median household income in American Falls is $55,465, with the highest median household income of $63,295 found in the 65+ years age bracket for the primary householder. A total of 311 households (21.2%) fall into this category. Meanwhile, the 15 to 24 years age bracket for the primary householder has the lowest median household income of $0, with 40 households (2.7%) in this group.
| Income Bracket | # Households | Median Income |
| 15 to 24 Years | 40 (2.7%) | $0 |
| 25 to 44 Years | 622 (42.5%) | $54,375 |
| 45 to 64 Years | 492 (33.6%) | $56,250 |
| 65+ Years | 311 (21.2%) | $63,295 |
| Total | 1,465 (100.0%) | $55,465 |
Poverty in American Falls
Income Below Poverty by Sex and Age in American Falls
With 10.9% poverty level for males and 10.9% for females among the residents of American Falls, 25 to 34 year old males and 5 year old females are the most vulnerable to poverty, with 122 males (35.2%) and 19 females (100.0%) in their respective age groups living below the poverty level.
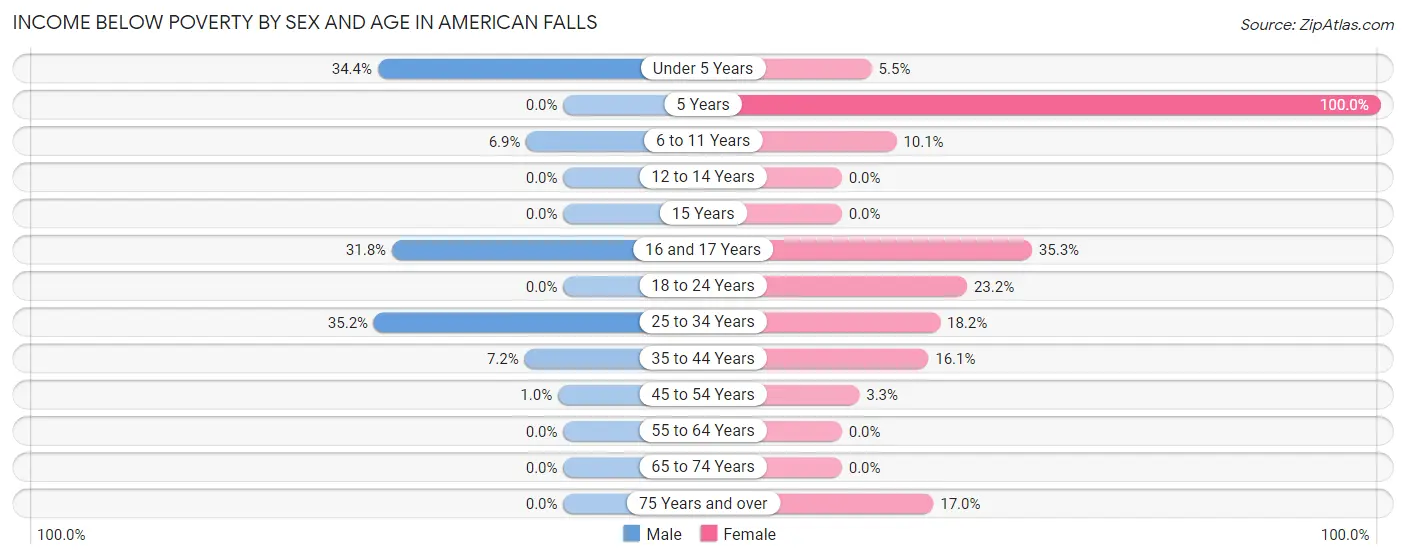
| Age Bracket | Male | Female |
| Under 5 Years | 31 (34.4%) | 15 (5.5%) |
| 5 Years | 0 (0.0%) | 19 (100.0%) |
| 6 to 11 Years | 23 (6.9%) | 35 (10.1%) |
| 12 to 14 Years | 0 (0.0%) | 0 (0.0%) |
| 15 Years | 0 (0.0%) | 0 (0.0%) |
| 16 and 17 Years | 35 (31.8%) | 18 (35.3%) |
| 18 to 24 Years | 0 (0.0%) | 56 (23.2%) |
| 25 to 34 Years | 122 (35.2%) | 37 (18.2%) |
| 35 to 44 Years | 24 (7.2%) | 39 (16.1%) |
| 45 to 54 Years | 2 (1.0%) | 8 (3.3%) |
| 55 to 64 Years | 0 (0.0%) | 0 (0.0%) |
| 65 to 74 Years | 0 (0.0%) | 0 (0.0%) |
| 75 Years and over | 0 (0.0%) | 27 (17.0%) |
| Total | 237 (10.9%) | 254 (10.9%) |
Income Above Poverty by Sex and Age in American Falls
According to the poverty statistics in American Falls, males aged 12 to 14 years and females aged 12 to 14 years are the age groups that are most secure financially, with 100.0% of males and 100.0% of females in these age groups living above the poverty line.
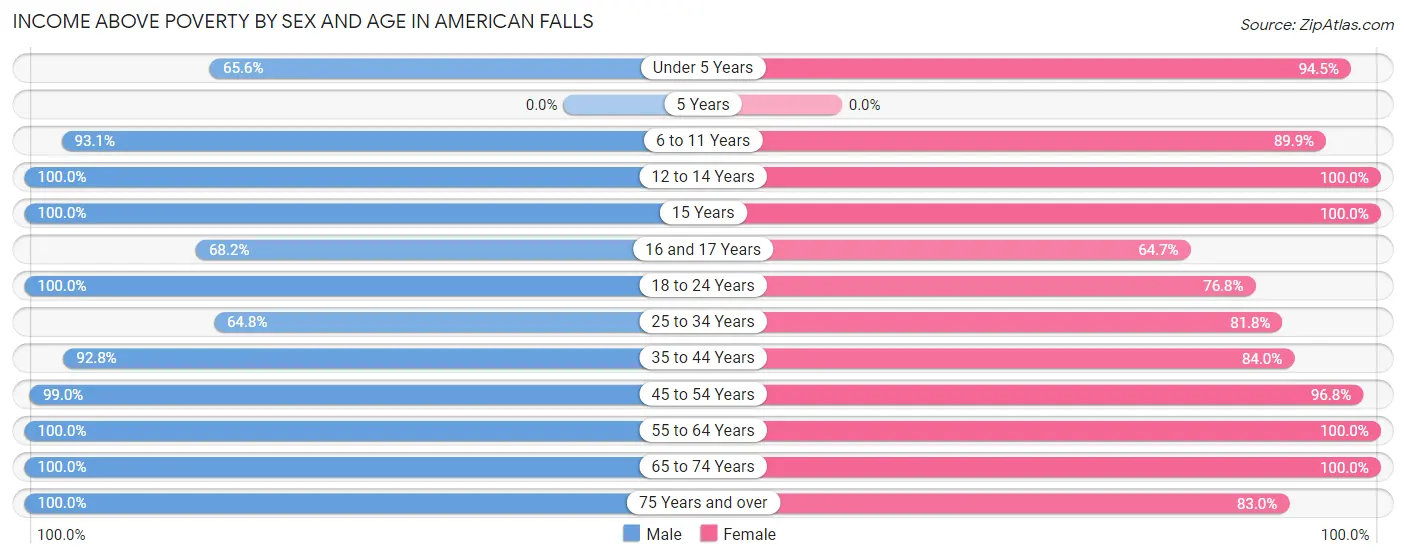
| Age Bracket | Male | Female |
| Under 5 Years | 59 (65.6%) | 256 (94.5%) |
| 5 Years | 0 (0.0%) | 0 (0.0%) |
| 6 to 11 Years | 312 (93.1%) | 310 (89.9%) |
| 12 to 14 Years | 148 (100.0%) | 108 (100.0%) |
| 15 Years | 7 (100.0%) | 72 (100.0%) |
| 16 and 17 Years | 75 (68.2%) | 33 (64.7%) |
| 18 to 24 Years | 123 (100.0%) | 185 (76.8%) |
| 25 to 34 Years | 225 (64.8%) | 166 (81.8%) |
| 35 to 44 Years | 309 (92.8%) | 204 (84.0%) |
| 45 to 54 Years | 199 (99.0%) | 238 (96.8%) |
| 55 to 64 Years | 278 (100.0%) | 235 (100.0%) |
| 65 to 74 Years | 76 (100.0%) | 142 (100.0%) |
| 75 Years and over | 121 (100.0%) | 132 (83.0%) |
| Total | 1,932 (89.1%) | 2,081 (89.1%) |
Income Below Poverty Among Married-Couple Families in American Falls
The poverty statistics for married-couple families in American Falls show that 3.2% or 26 of the total 822 families live below the poverty line. Families with 5 or more children have the highest poverty rate of 75.0%, comprising of 24 families. On the other hand, families with no children have the lowest poverty rate of 0.0%, which includes 0 families.
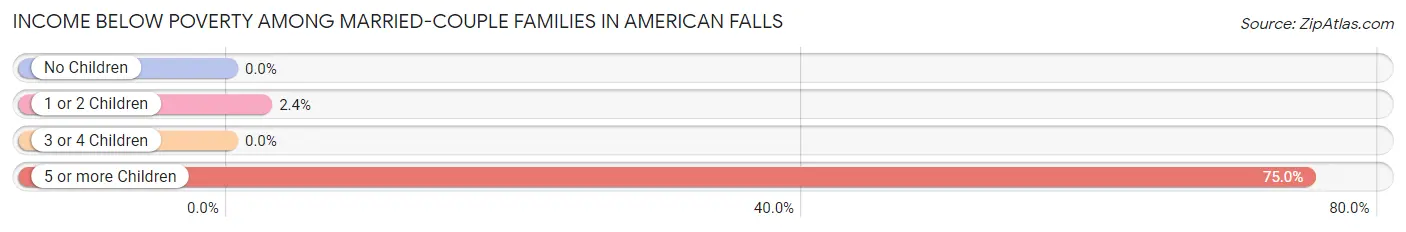
| Children | Above Poverty | Below Poverty |
| No Children | 517 (100.0%) | 0 (0.0%) |
| 1 or 2 Children | 82 (97.6%) | 2 (2.4%) |
| 3 or 4 Children | 189 (100.0%) | 0 (0.0%) |
| 5 or more Children | 8 (25.0%) | 24 (75.0%) |
| Total | 796 (96.8%) | 26 (3.2%) |
Income Below Poverty Among Single-Parent Households in American Falls
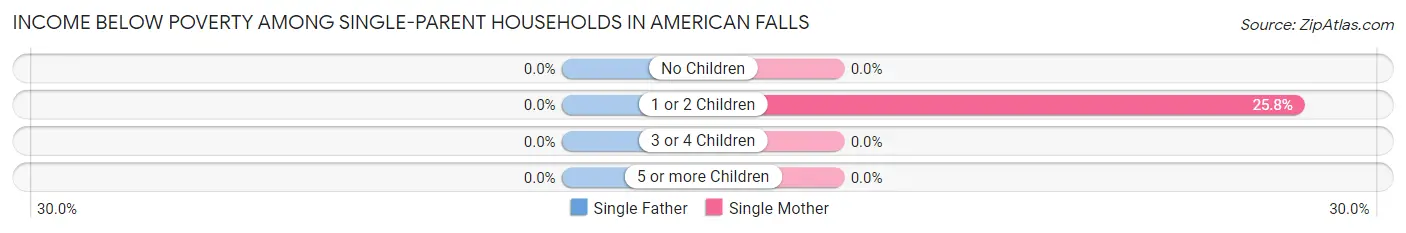
| Children | Single Father | Single Mother |
| No Children | 0 (0.0%) | 0 (0.0%) |
| 1 or 2 Children | 0 (0.0%) | 17 (25.8%) |
| 3 or 4 Children | 0 (0.0%) | 0 (0.0%) |
| 5 or more Children | 0 (0.0%) | 0 (0.0%) |
| Total | 0 (0.0%) | 17 (12.1%) |
Income Below Poverty Among Married-Couple vs Single-Parent Households in American Falls
The poverty data for American Falls shows that 26 of the married-couple family households (3.2%) and 17 of the single-parent households (7.3%) are living below the poverty level. Within the married-couple family households, those with 5 or more children have the highest poverty rate, with 24 households (75.0%) falling below the poverty line. Among the single-parent households, those with 1 or 2 children have the highest poverty rate, with 17 household (19.8%) living below poverty.
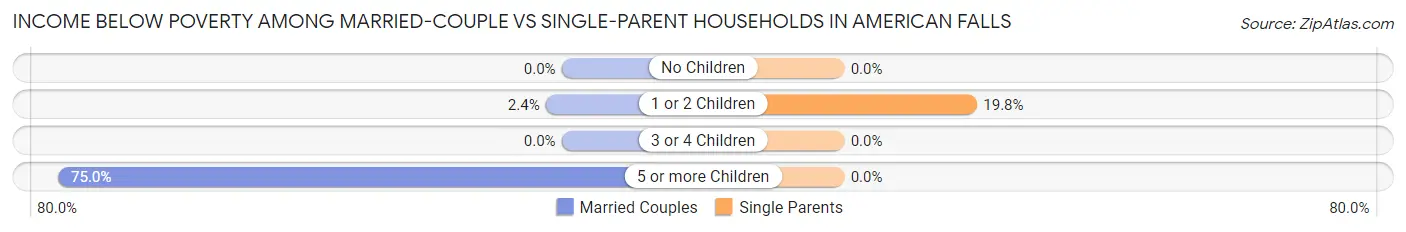
| Children | Married-Couple Families | Single-Parent Households |
| No Children | 0 (0.0%) | 0 (0.0%) |
| 1 or 2 Children | 2 (2.4%) | 17 (19.8%) |
| 3 or 4 Children | 0 (0.0%) | 0 (0.0%) |
| 5 or more Children | 24 (75.0%) | 0 (0.0%) |
| Total | 26 (3.2%) | 17 (7.3%) |
Race in American Falls
The most populous races in American Falls are White / Caucasian (2,861 | 62.6%), Hispanic or Latino (2,160 | 47.2%), and Some other Race (1,337 | 29.2%).
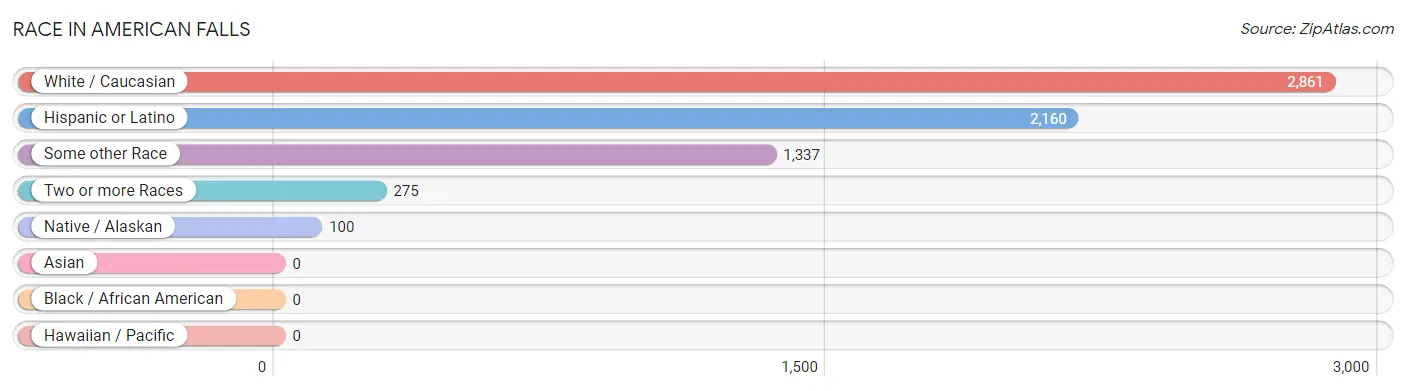
| Race | # Population | % Population |
| Asian | 0 | 0.0% |
| Black / African American | 0 | 0.0% |
| Hawaiian / Pacific | 0 | 0.0% |
| Hispanic or Latino | 2,160 | 47.2% |
| Native / Alaskan | 100 | 2.2% |
| White / Caucasian | 2,861 | 62.6% |
| Two or more Races | 275 | 6.0% |
| Some other Race | 1,337 | 29.2% |
| Total | 4,573 | 100.0% |
Ancestry in American Falls
The most populous ancestries reported in American Falls are Mexican (1,933 | 42.3%), English (968 | 21.2%), German (361 | 7.9%), Irish (296 | 6.5%), and Italian (262 | 5.7%), together accounting for 83.5% of all American Falls residents.
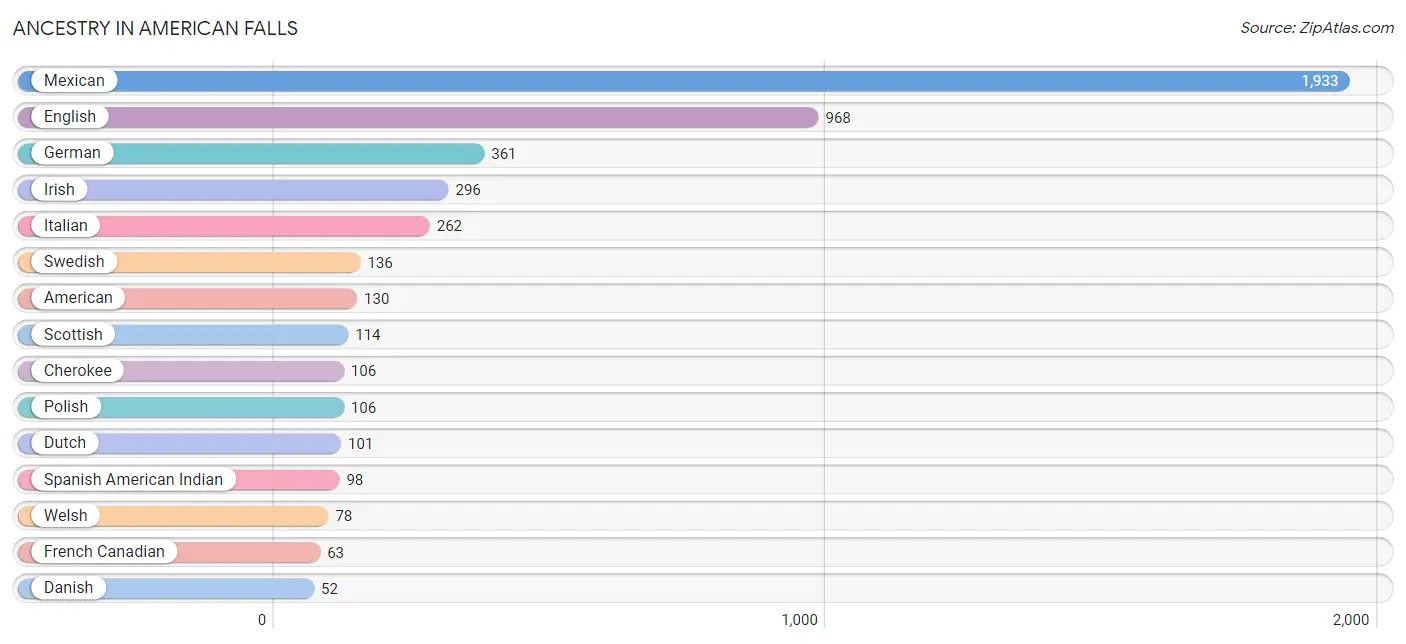
| Ancestry | # Population | % Population |
| American | 130 | 2.8% |
| Cherokee | 106 | 2.3% |
| Czech | 51 | 1.1% |
| Danish | 52 | 1.1% |
| Dutch | 101 | 2.2% |
| Eastern European | 29 | 0.6% |
| English | 968 | 21.2% |
| French | 40 | 0.9% |
| French Canadian | 63 | 1.4% |
| German | 361 | 7.9% |
| Irish | 296 | 6.5% |
| Italian | 262 | 5.7% |
| Mexican | 1,933 | 42.3% |
| Norwegian | 46 | 1.0% |
| Osage | 3 | 0.1% |
| Polish | 106 | 2.3% |
| Russian | 8 | 0.2% |
| Scottish | 114 | 2.5% |
| Spanish American Indian | 98 | 2.1% |
| Swedish | 136 | 3.0% |
| Swiss | 13 | 0.3% |
| Welsh | 78 | 1.7% | View All 22 Rows |
Immigrants in American Falls
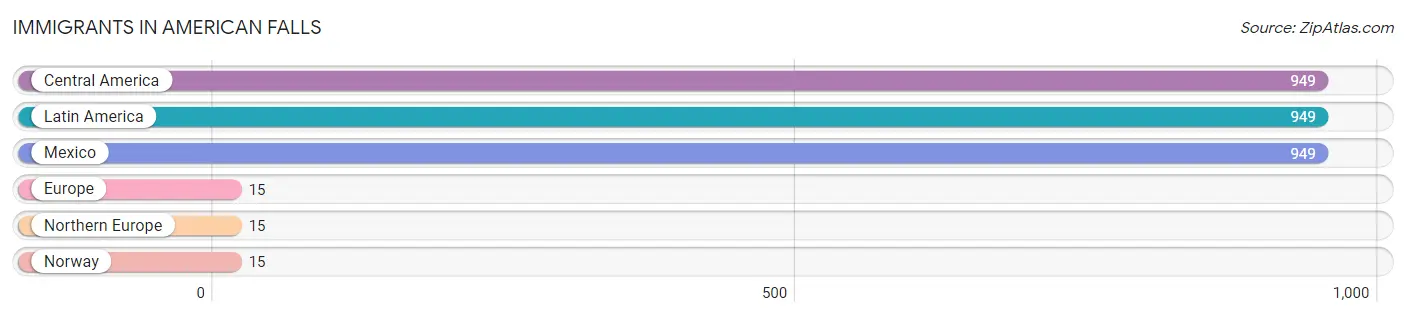
The most numerous immigrant groups reported in American Falls came from Central America (949 | 20.7%), Latin America (949 | 20.7%), Mexico (949 | 20.7%), Europe (15 | 0.3%), and Northern Europe (15 | 0.3%), together accounting for 62.9% of all American Falls residents.
| Immigration Origin | # Population | % Population |
| Central America | 949 | 20.7% |
| Europe | 15 | 0.3% |
| Latin America | 949 | 20.7% |
| Mexico | 949 | 20.7% |
| Northern Europe | 15 | 0.3% |
| Norway | 15 | 0.3% | View All 6 Rows |
Sex and Age in American Falls
Sex and Age in American Falls
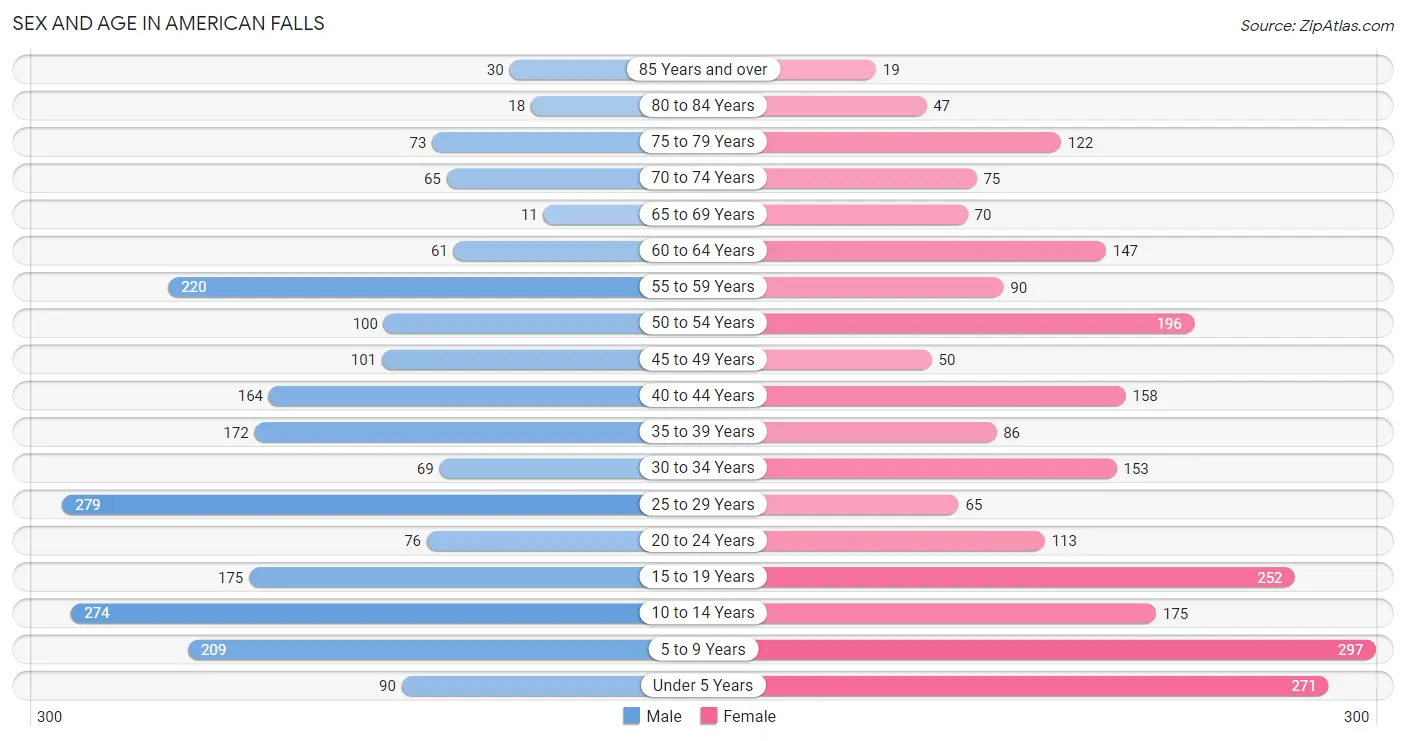
The most populous age groups in American Falls are 25 to 29 Years (279 | 12.8%) for men and 5 to 9 Years (297 | 12.4%) for women.
| Age Bracket | Male | Female |
| Under 5 Years | 90 (4.1%) | 271 (11.4%) |
| 5 to 9 Years | 209 (9.6%) | 297 (12.4%) |
| 10 to 14 Years | 274 (12.5%) | 175 (7.3%) |
| 15 to 19 Years | 175 (8.0%) | 252 (10.6%) |
| 20 to 24 Years | 76 (3.5%) | 113 (4.7%) |
| 25 to 29 Years | 279 (12.8%) | 65 (2.7%) |
| 30 to 34 Years | 69 (3.2%) | 153 (6.4%) |
| 35 to 39 Years | 172 (7.9%) | 86 (3.6%) |
| 40 to 44 Years | 164 (7.5%) | 158 (6.6%) |
| 45 to 49 Years | 101 (4.6%) | 50 (2.1%) |
| 50 to 54 Years | 100 (4.6%) | 196 (8.2%) |
| 55 to 59 Years | 220 (10.1%) | 90 (3.8%) |
| 60 to 64 Years | 61 (2.8%) | 147 (6.2%) |
| 65 to 69 Years | 11 (0.5%) | 70 (2.9%) |
| 70 to 74 Years | 65 (3.0%) | 75 (3.1%) |
| 75 to 79 Years | 73 (3.3%) | 122 (5.1%) |
| 80 to 84 Years | 18 (0.8%) | 47 (2.0%) |
| 85 Years and over | 30 (1.4%) | 19 (0.8%) |
| Total | 2,187 (100.0%) | 2,386 (100.0%) |
Families and Households in American Falls
Median Family Size in American Falls
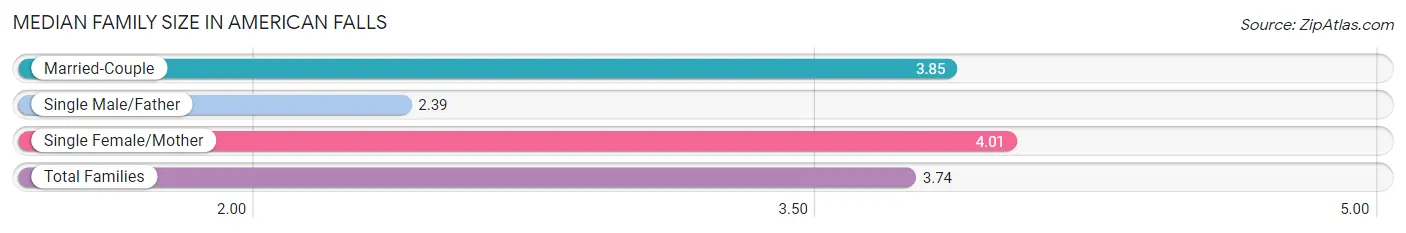
The median family size in American Falls is 3.74 persons per family, with single female/mother families (140 | 13.3%) accounting for the largest median family size of 4.01 persons per family. On the other hand, single male/father families (92 | 8.7%) represent the smallest median family size with 2.39 persons per family.
| Family Type | # Families | Family Size |
| Married-Couple | 822 (78.0%) | 3.85 |
| Single Male/Father | 92 (8.7%) | 2.39 |
| Single Female/Mother | 140 (13.3%) | 4.01 |
| Total Families | 1,054 (100.0%) | 3.74 |
Median Household Size in American Falls
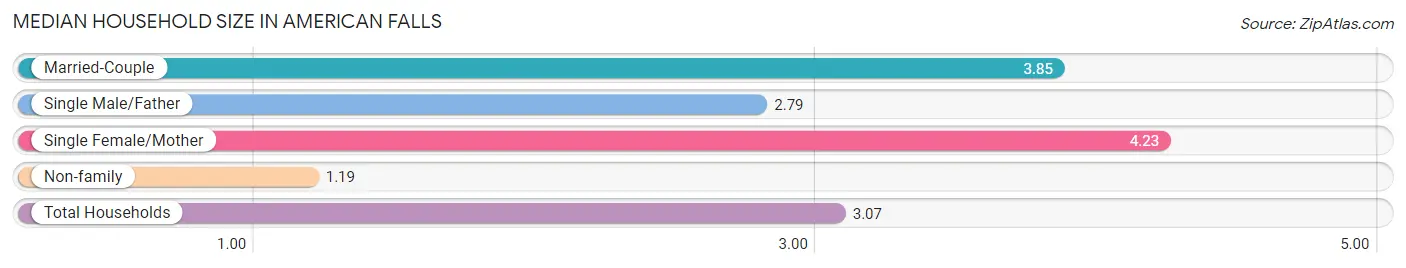
The median household size in American Falls is 3.07 persons per household, with single female/mother households (140 | 9.6%) accounting for the largest median household size of 4.23 persons per household. non-family households (411 | 28.1%) represent the smallest median household size with 1.19 persons per household.
| Household Type | # Households | Household Size |
| Married-Couple | 822 (56.1%) | 3.85 |
| Single Male/Father | 92 (6.3%) | 2.79 |
| Single Female/Mother | 140 (9.6%) | 4.23 |
| Non-family | 411 (28.1%) | 1.19 |
| Total Households | 1,465 (100.0%) | 3.07 |
Household Size by Marriage Status in American Falls
Out of a total of 1,465 households in American Falls, 1,054 (72.0%) are family households, while 411 (28.1%) are nonfamily households. The most numerous type of family households are 2-person households, comprising 485, and the most common type of nonfamily households are 1-person households, comprising 371.
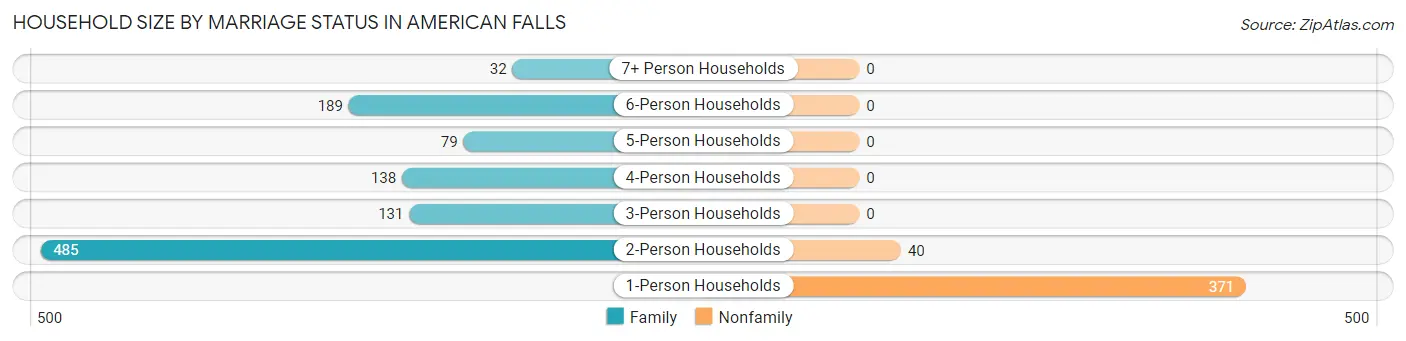
| Household Size | Family Households | Nonfamily Households |
| 1-Person Households | - | 371 (25.3%) |
| 2-Person Households | 485 (33.1%) | 40 (2.7%) |
| 3-Person Households | 131 (8.9%) | 0 (0.0%) |
| 4-Person Households | 138 (9.4%) | 0 (0.0%) |
| 5-Person Households | 79 (5.4%) | 0 (0.0%) |
| 6-Person Households | 189 (12.9%) | 0 (0.0%) |
| 7+ Person Households | 32 (2.2%) | 0 (0.0%) |
| Total | 1,054 (72.0%) | 411 (28.1%) |
Female Fertility in American Falls
Fertility by Age in American Falls
Average fertility rate in American Falls is 30.0 births per 1,000 women. Women in the age bracket of 20 to 34 years have the highest fertility rate with 60.0 births per 1,000 women. Women in the age bracket of 20 to 34 years acount for 71.4% of all women with births.
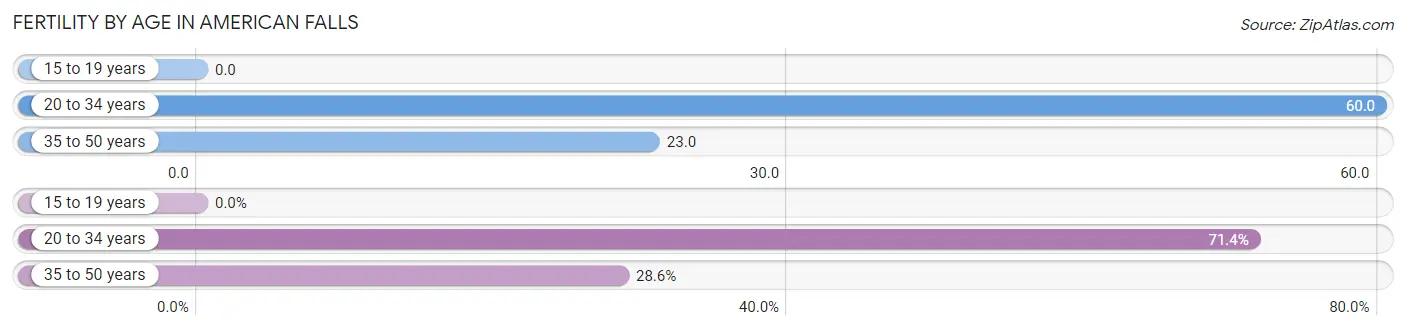
| Age Bracket | Women with Births | Births / 1,000 Women |
| 15 to 19 years | 0 (0.0%) | 0.0 |
| 20 to 34 years | 20 (71.4%) | 60.0 |
| 35 to 50 years | 8 (28.6%) | 23.0 |
| Total | 28 (100.0%) | 30.0 |
Fertility by Age by Marriage Status in American Falls
28.6% of women with births (28) in American Falls are married. The highest percentage of unmarried women with births falls into 20 to 34 years age bracket with 100.0% of them unmarried at the time of birth, while the lowest percentage of unmarried women with births belong to 35 to 50 years age bracket with 0.0% of them unmarried.
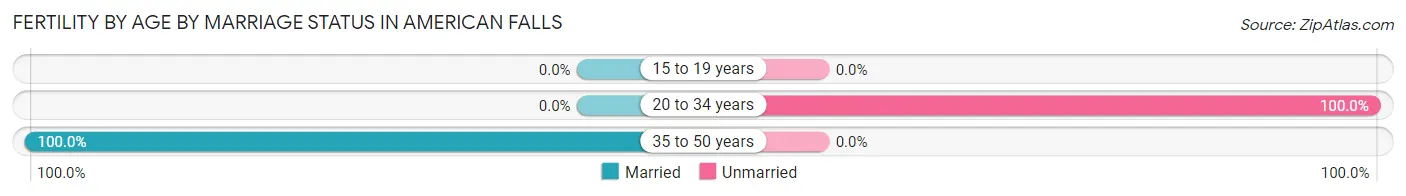
| Age Bracket | Married | Unmarried |
| 15 to 19 years | 0 (0.0%) | 0 (0.0%) |
| 20 to 34 years | 0 (0.0%) | 20 (100.0%) |
| 35 to 50 years | 8 (100.0%) | 0 (0.0%) |
| Total | 8 (28.6%) | 20 (71.4%) |
Fertility by Education in American Falls
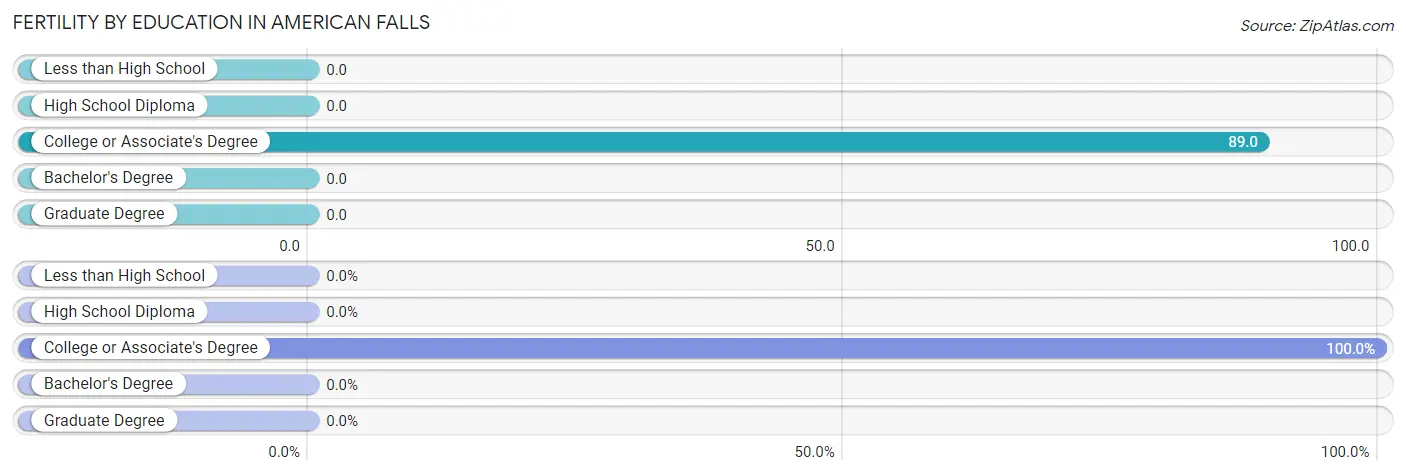
| Educational Attainment | Women with Births | Births / 1,000 Women |
| Less than High School | 0 (0.0%) | 0.0 |
| High School Diploma | 0 (0.0%) | 0.0 |
| College or Associate's Degree | 28 (100.0%) | 89.0 |
| Bachelor's Degree | 0 (0.0%) | 0.0 |
| Graduate Degree | 0 (0.0%) | 0.0 |
| Total | 28 (100.0%) | 30.0 |
Fertility by Education by Marriage Status in American Falls
71.4% of women with births in American Falls are unmarried. Women with the educational attainment of college or associate's degree are most likely to be married with 28.6% of them married at childbirth, while women with the educational attainment of college or associate's degree are least likely to be married with 71.4% of them unmarried at childbirth.
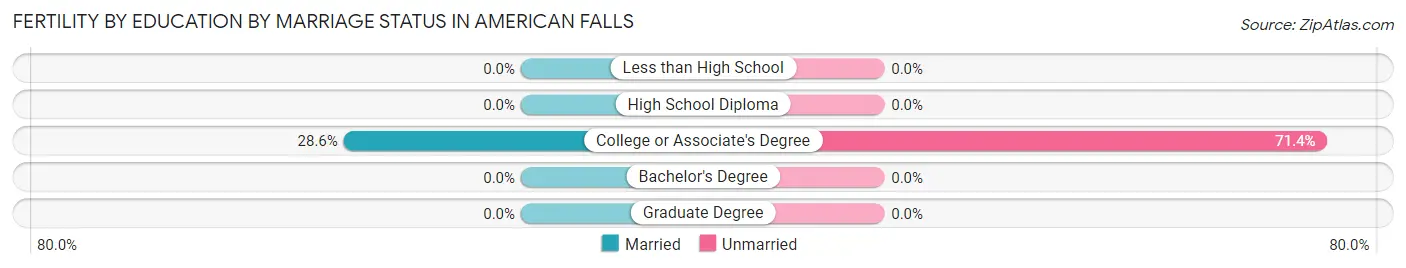
| Educational Attainment | Married | Unmarried |
| Less than High School | 0 (0.0%) | 0 (0.0%) |
| High School Diploma | 0 (0.0%) | 0 (0.0%) |
| College or Associate's Degree | 8 (28.6%) | 20 (71.4%) |
| Bachelor's Degree | 0 (0.0%) | 0 (0.0%) |
| Graduate Degree | 0 (0.0%) | 0 (0.0%) |
| Total | 8 (28.6%) | 20 (71.4%) |
Employment Characteristics in American Falls
Employment by Class of Employer in American Falls
Among the 1,958 employed individuals in American Falls, private company employees (1,200 | 61.3%), local government employees (241 | 12.3%), and self-employed (not incorporated) (125 | 6.4%) make up the most common classes of employment.
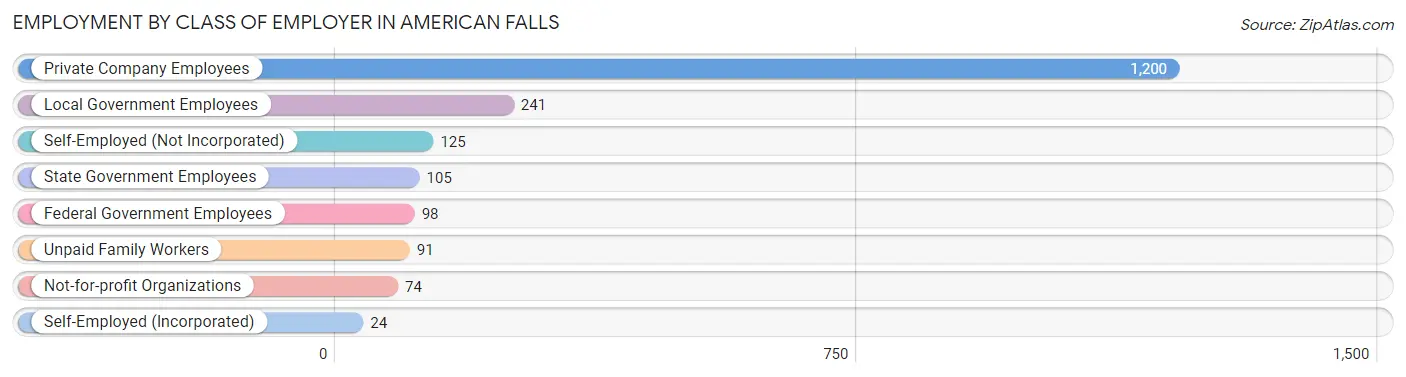
| Employer Class | # Employees | % Employees |
| Private Company Employees | 1,200 | 61.3% |
| Self-Employed (Incorporated) | 24 | 1.2% |
| Self-Employed (Not Incorporated) | 125 | 6.4% |
| Not-for-profit Organizations | 74 | 3.8% |
| Local Government Employees | 241 | 12.3% |
| State Government Employees | 105 | 5.4% |
| Federal Government Employees | 98 | 5.0% |
| Unpaid Family Workers | 91 | 4.6% |
| Total | 1,958 | 100.0% |
Employment Status by Age in American Falls
According to the labor force statistics for American Falls, out of the total population over 16 years of age (3,178), 69.0% or 2,193 individuals are in the labor force, with 7.8% or 171 of them unemployed. The age group with the highest labor force participation rate is 35 to 44 years, with 94.3% or 547 individuals in the labor force. Within the labor force, the 16 to 19 years age range has the highest percentage of unemployed individuals, with 49.3% or 113 of them being unemployed.
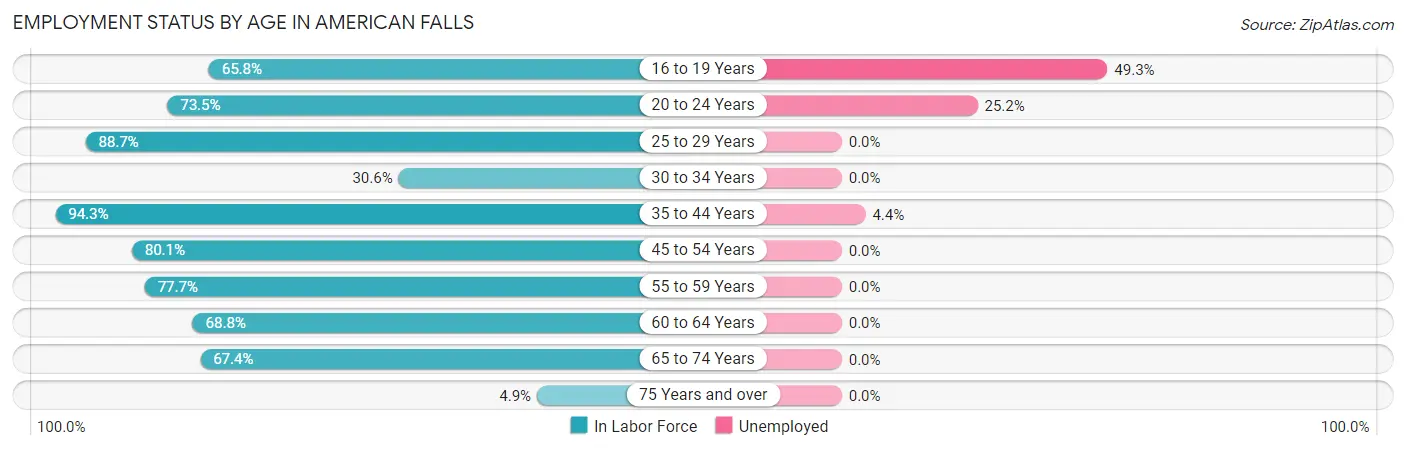
| Age Bracket | In Labor Force | Unemployed |
| 16 to 19 Years | 229 (65.8%) | 113 (49.3%) |
| 20 to 24 Years | 139 (73.5%) | 35 (25.2%) |
| 25 to 29 Years | 305 (88.7%) | 0 (0.0%) |
| 30 to 34 Years | 68 (30.6%) | 0 (0.0%) |
| 35 to 44 Years | 547 (94.3%) | 24 (4.4%) |
| 45 to 54 Years | 358 (80.1%) | 0 (0.0%) |
| 55 to 59 Years | 241 (77.7%) | 0 (0.0%) |
| 60 to 64 Years | 143 (68.8%) | 0 (0.0%) |
| 65 to 74 Years | 149 (67.4%) | 0 (0.0%) |
| 75 Years and over | 15 (4.9%) | 0 (0.0%) |
| Total | 2,193 (69.0%) | 171 (7.8%) |
Employment Status by Educational Attainment in American Falls
According to labor force statistics for American Falls, 78.7% of individuals (1,661) out of the total population between 25 and 64 years of age (2,111) are in the labor force, with 1.4% or 23 of them being unemployed. The group with the highest labor force participation rate are those with the educational attainment of bachelor's degree or higher, with 100.0% or 259 individuals in the labor force. Within the labor force, individuals with less than high school education have the highest percentage of unemployment, with 6.3% or 24 of them being unemployed.
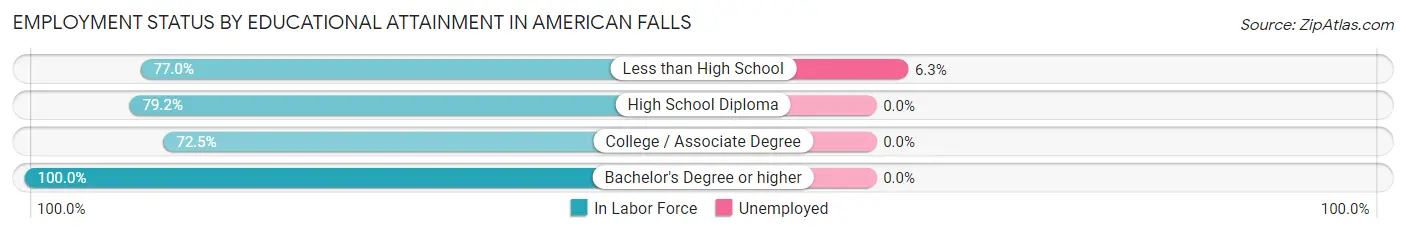
| Educational Attainment | In Labor Force | Unemployed |
| Less than High School | 379 (77.0%) | 31 (6.3%) |
| High School Diploma | 446 (79.2%) | 0 (0.0%) |
| College / Associate Degree | 578 (72.5%) | 0 (0.0%) |
| Bachelor's Degree or higher | 259 (100.0%) | 0 (0.0%) |
| Total | 1,661 (78.7%) | 30 (1.4%) |
Employment Occupations by Sex in American Falls
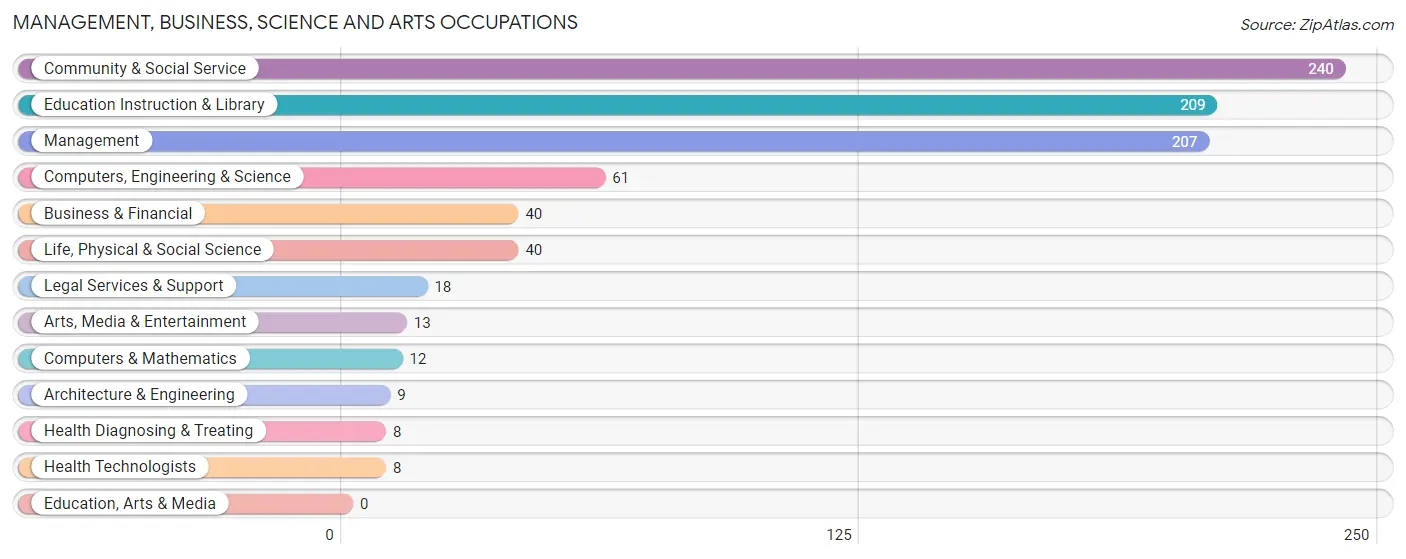
Management, Business, Science and Arts Occupations
The most common Management, Business, Science and Arts occupations in American Falls are Community & Social Service (240 | 11.9%), Education Instruction & Library (209 | 10.3%), Management (207 | 10.2%), Computers, Engineering & Science (61 | 3.0%), and Business & Financial (40 | 2.0%).
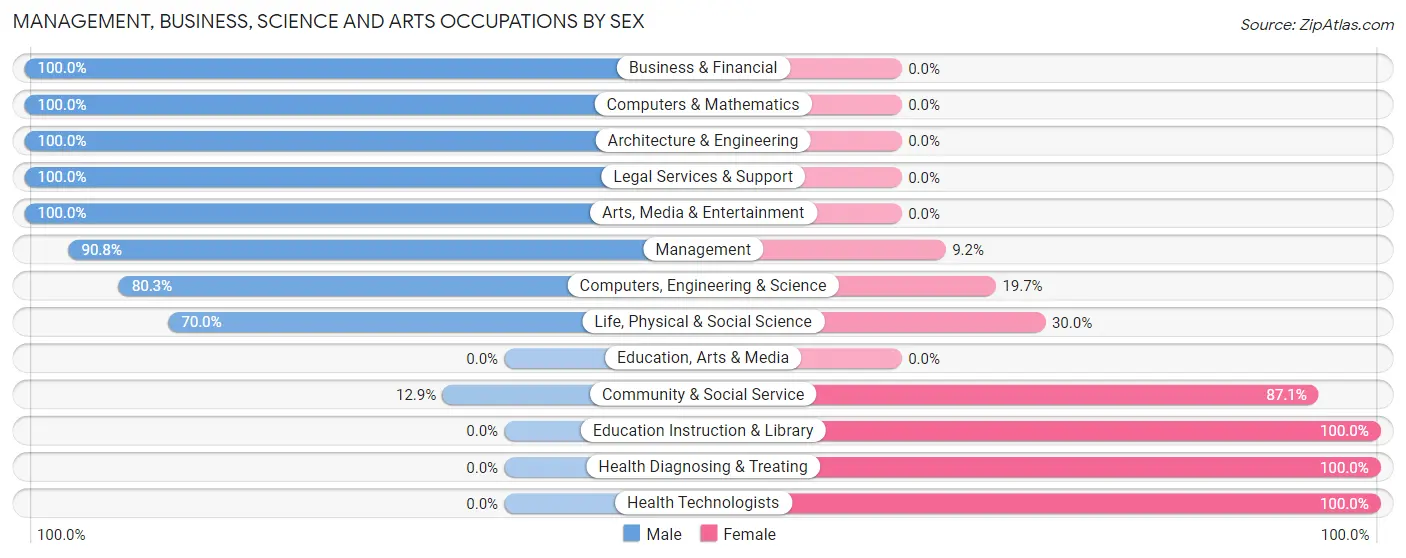
Management, Business, Science and Arts Occupations by Sex
Within the Management, Business, Science and Arts occupations in American Falls, the most male-oriented occupations are Business & Financial (100.0%), Computers & Mathematics (100.0%), and Architecture & Engineering (100.0%), while the most female-oriented occupations are Education Instruction & Library (100.0%), Health Diagnosing & Treating (100.0%), and Health Technologists (100.0%).
| Occupation | Male | Female |
| Management | 188 (90.8%) | 19 (9.2%) |
| Business & Financial | 40 (100.0%) | 0 (0.0%) |
| Computers, Engineering & Science | 49 (80.3%) | 12 (19.7%) |
| Computers & Mathematics | 12 (100.0%) | 0 (0.0%) |
| Architecture & Engineering | 9 (100.0%) | 0 (0.0%) |
| Life, Physical & Social Science | 28 (70.0%) | 12 (30.0%) |
| Community & Social Service | 31 (12.9%) | 209 (87.1%) |
| Education, Arts & Media | 0 (0.0%) | 0 (0.0%) |
| Legal Services & Support | 18 (100.0%) | 0 (0.0%) |
| Education Instruction & Library | 0 (0.0%) | 209 (100.0%) |
| Arts, Media & Entertainment | 13 (100.0%) | 0 (0.0%) |
| Health Diagnosing & Treating | 0 (0.0%) | 8 (100.0%) |
| Health Technologists | 0 (0.0%) | 8 (100.0%) |
| Total (Category) | 308 (55.4%) | 248 (44.6%) |
| Total (Overall) | 1,227 (60.7%) | 795 (39.3%) |
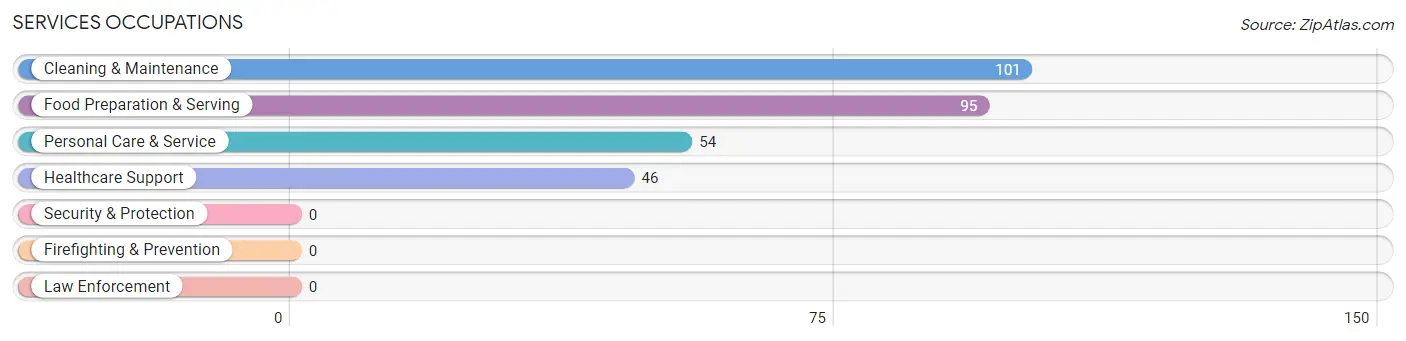
Services Occupations
The most common Services occupations in American Falls are Cleaning & Maintenance (101 | 5.0%), Food Preparation & Serving (95 | 4.7%), Personal Care & Service (54 | 2.7%), and Healthcare Support (46 | 2.3%).
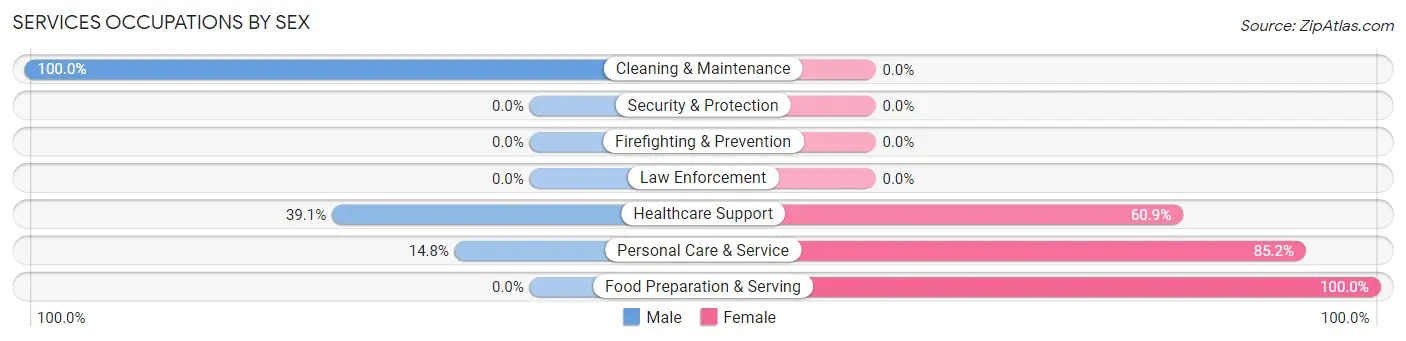
Services Occupations by Sex
Within the Services occupations in American Falls, the most male-oriented occupations are Cleaning & Maintenance (100.0%), Healthcare Support (39.1%), and Personal Care & Service (14.8%), while the most female-oriented occupations are Food Preparation & Serving (100.0%), Personal Care & Service (85.2%), and Healthcare Support (60.9%).
| Occupation | Male | Female |
| Healthcare Support | 18 (39.1%) | 28 (60.9%) |
| Security & Protection | 0 (0.0%) | 0 (0.0%) |
| Firefighting & Prevention | 0 (0.0%) | 0 (0.0%) |
| Law Enforcement | 0 (0.0%) | 0 (0.0%) |
| Food Preparation & Serving | 0 (0.0%) | 95 (100.0%) |
| Cleaning & Maintenance | 101 (100.0%) | 0 (0.0%) |
| Personal Care & Service | 8 (14.8%) | 46 (85.2%) |
| Total (Category) | 127 (42.9%) | 169 (57.1%) |
| Total (Overall) | 1,227 (60.7%) | 795 (39.3%) |
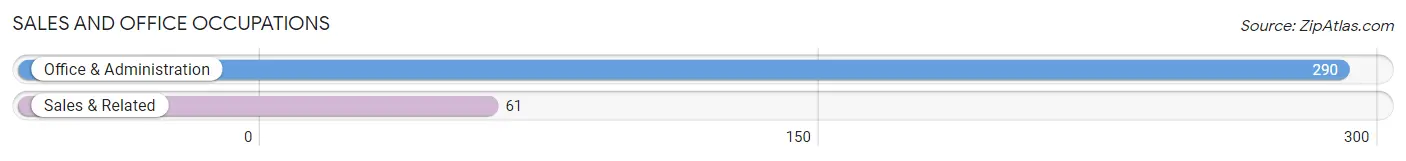
Sales and Office Occupations
The most common Sales and Office occupations in American Falls are Office & Administration (290 | 14.3%), and Sales & Related (61 | 3.0%).
Sales and Office Occupations by Sex
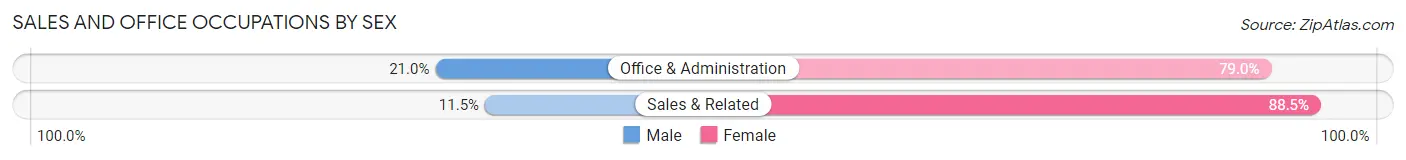
| Occupation | Male | Female |
| Sales & Related | 7 (11.5%) | 54 (88.5%) |
| Office & Administration | 61 (21.0%) | 229 (79.0%) |
| Total (Category) | 68 (19.4%) | 283 (80.6%) |
| Total (Overall) | 1,227 (60.7%) | 795 (39.3%) |
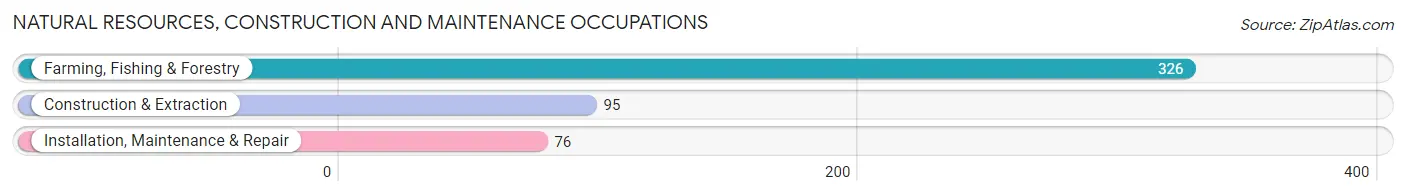
Natural Resources, Construction and Maintenance Occupations
The most common Natural Resources, Construction and Maintenance occupations in American Falls are Farming, Fishing & Forestry (326 | 16.1%), Construction & Extraction (95 | 4.7%), and Installation, Maintenance & Repair (76 | 3.8%).
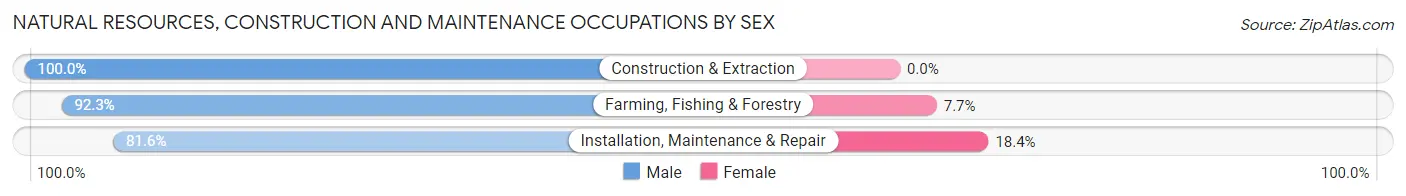
Natural Resources, Construction and Maintenance Occupations by Sex
| Occupation | Male | Female |
| Farming, Fishing & Forestry | 301 (92.3%) | 25 (7.7%) |
| Construction & Extraction | 95 (100.0%) | 0 (0.0%) |
| Installation, Maintenance & Repair | 62 (81.6%) | 14 (18.4%) |
| Total (Category) | 458 (92.1%) | 39 (7.9%) |
| Total (Overall) | 1,227 (60.7%) | 795 (39.3%) |
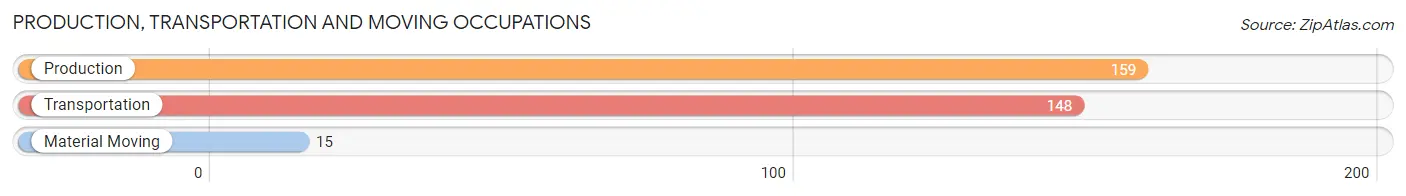
Production, Transportation and Moving Occupations
The most common Production, Transportation and Moving occupations in American Falls are Production (159 | 7.9%), Transportation (148 | 7.3%), and Material Moving (15 | 0.7%).
Production, Transportation and Moving Occupations by Sex
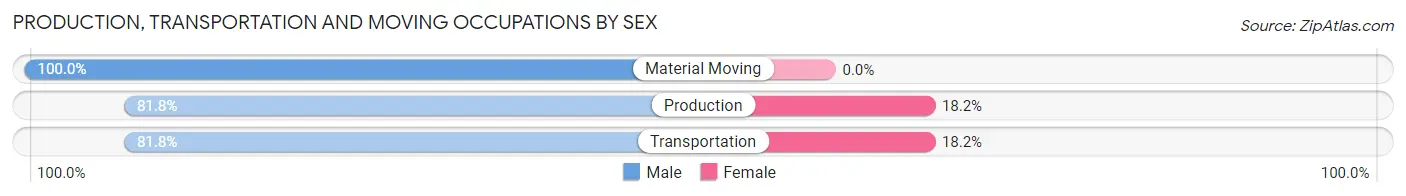
| Occupation | Male | Female |
| Production | 130 (81.8%) | 29 (18.2%) |
| Transportation | 121 (81.8%) | 27 (18.2%) |
| Material Moving | 15 (100.0%) | 0 (0.0%) |
| Total (Category) | 266 (82.6%) | 56 (17.4%) |
| Total (Overall) | 1,227 (60.7%) | 795 (39.3%) |
Employment Industries by Sex in American Falls
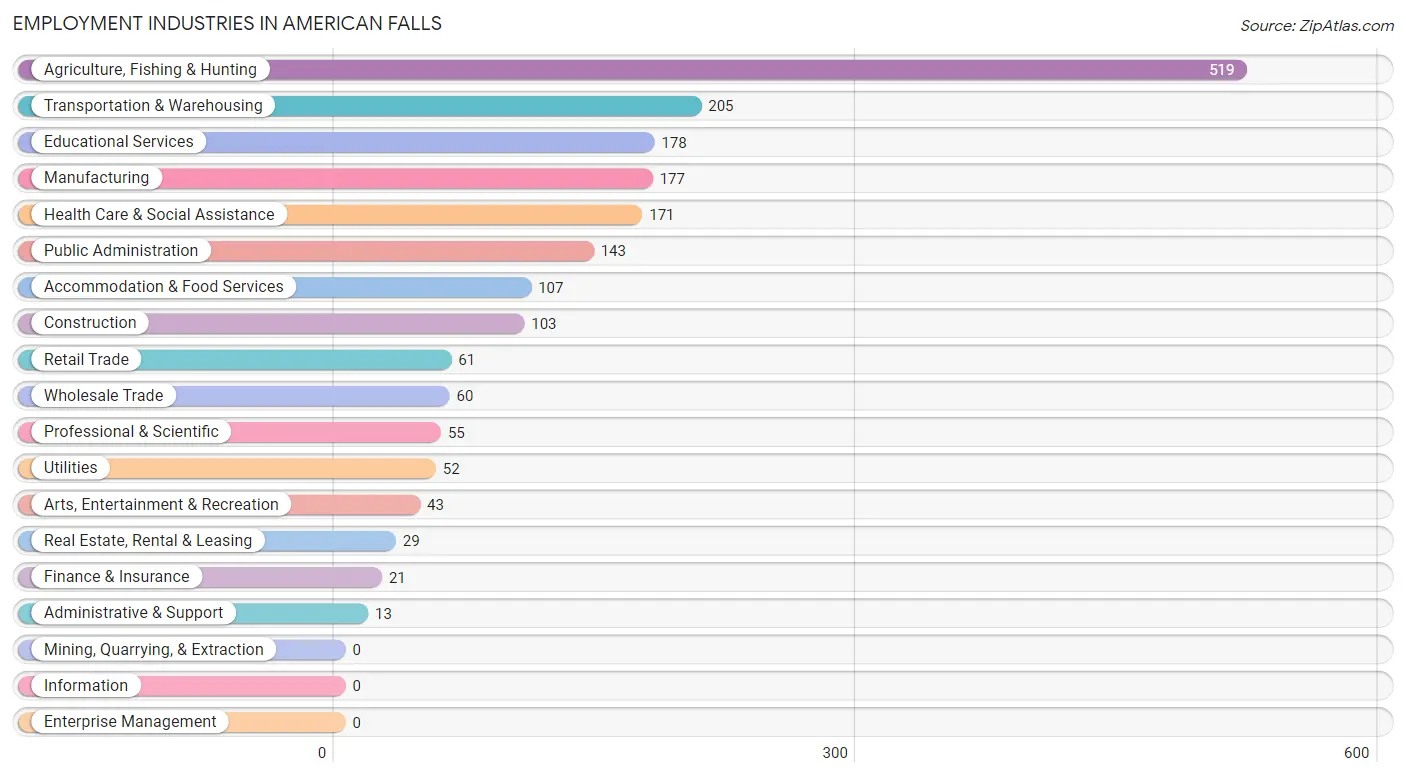
Employment Industries in American Falls
The major employment industries in American Falls include Agriculture, Fishing & Hunting (519 | 25.7%), Transportation & Warehousing (205 | 10.1%), Educational Services (178 | 8.8%), Manufacturing (177 | 8.7%), and Health Care & Social Assistance (171 | 8.5%).
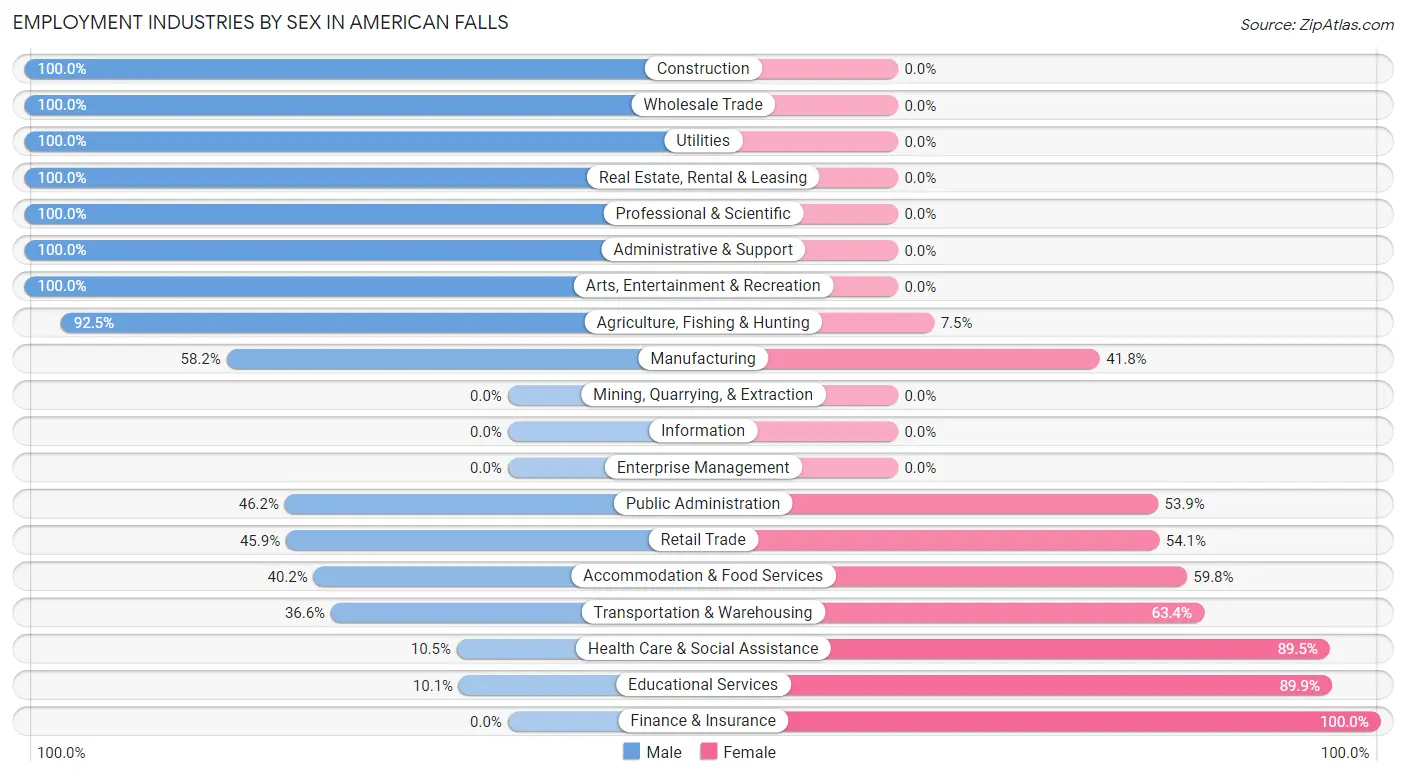
Employment Industries by Sex in American Falls
The American Falls industries that see more men than women are Construction (100.0%), Wholesale Trade (100.0%), and Utilities (100.0%), whereas the industries that tend to have a higher number of women are Finance & Insurance (100.0%), Educational Services (89.9%), and Health Care & Social Assistance (89.5%).
| Industry | Male | Female |
| Agriculture, Fishing & Hunting | 480 (92.5%) | 39 (7.5%) |
| Mining, Quarrying, & Extraction | 0 (0.0%) | 0 (0.0%) |
| Construction | 103 (100.0%) | 0 (0.0%) |
| Manufacturing | 103 (58.2%) | 74 (41.8%) |
| Wholesale Trade | 60 (100.0%) | 0 (0.0%) |
| Retail Trade | 28 (45.9%) | 33 (54.1%) |
| Transportation & Warehousing | 75 (36.6%) | 130 (63.4%) |
| Utilities | 52 (100.0%) | 0 (0.0%) |
| Information | 0 (0.0%) | 0 (0.0%) |
| Finance & Insurance | 0 (0.0%) | 21 (100.0%) |
| Real Estate, Rental & Leasing | 29 (100.0%) | 0 (0.0%) |
| Professional & Scientific | 55 (100.0%) | 0 (0.0%) |
| Enterprise Management | 0 (0.0%) | 0 (0.0%) |
| Administrative & Support | 13 (100.0%) | 0 (0.0%) |
| Educational Services | 18 (10.1%) | 160 (89.9%) |
| Health Care & Social Assistance | 18 (10.5%) | 153 (89.5%) |
| Arts, Entertainment & Recreation | 43 (100.0%) | 0 (0.0%) |
| Accommodation & Food Services | 43 (40.2%) | 64 (59.8%) |
| Public Administration | 66 (46.2%) | 77 (53.8%) |
| Total | 1,227 (60.7%) | 795 (39.3%) |
Education in American Falls
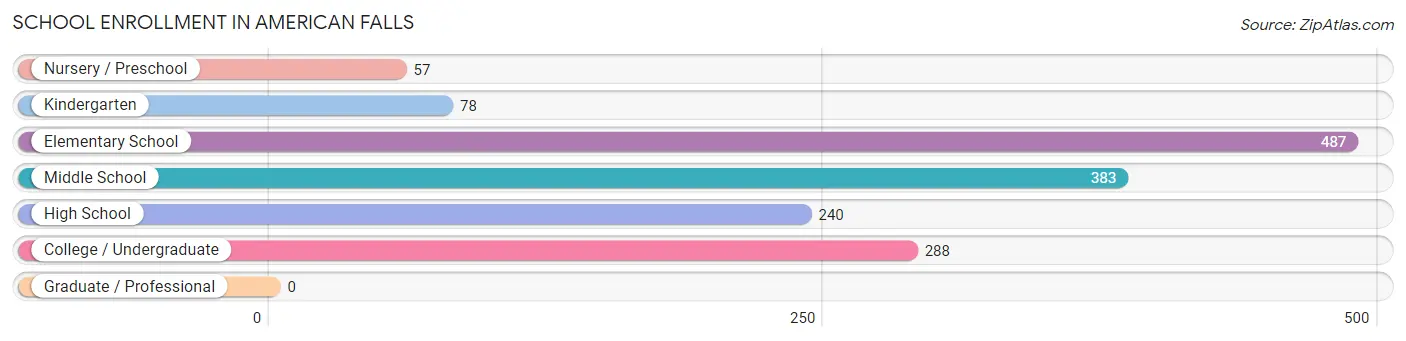
School Enrollment in American Falls
The most common levels of schooling among the 1,533 students in American Falls are elementary school (487 | 31.8%), middle school (383 | 25.0%), and college / undergraduate (288 | 18.8%).
| School Level | # Students | % Students |
| Nursery / Preschool | 57 | 3.7% |
| Kindergarten | 78 | 5.1% |
| Elementary School | 487 | 31.8% |
| Middle School | 383 | 25.0% |
| High School | 240 | 15.7% |
| College / Undergraduate | 288 | 18.8% |
| Graduate / Professional | 0 | 0.0% |
| Total | 1,533 | 100.0% |
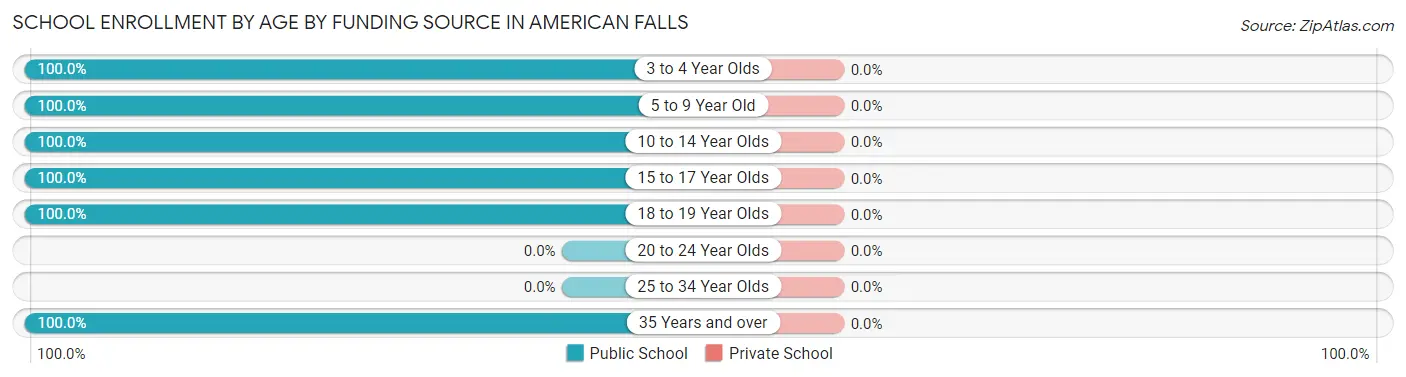
School Enrollment by Age by Funding Source in American Falls
| Age Bracket | Public School | Private School |
| 3 to 4 Year Olds | 57 (100.0%) | 0 (0.0%) |
| 5 to 9 Year Old | 499 (100.0%) | 0 (0.0%) |
| 10 to 14 Year Olds | 449 (100.0%) | 0 (0.0%) |
| 15 to 17 Year Olds | 240 (100.0%) | 0 (0.0%) |
| 18 to 19 Year Olds | 144 (100.0%) | 0 (0.0%) |
| 20 to 24 Year Olds | 0 (0.0%) | 0 (0.0%) |
| 25 to 34 Year Olds | 0 (0.0%) | 0 (0.0%) |
| 35 Years and over | 144 (100.0%) | 0 (0.0%) |
| Total | 1,533 (100.0%) | 0 (0.0%) |
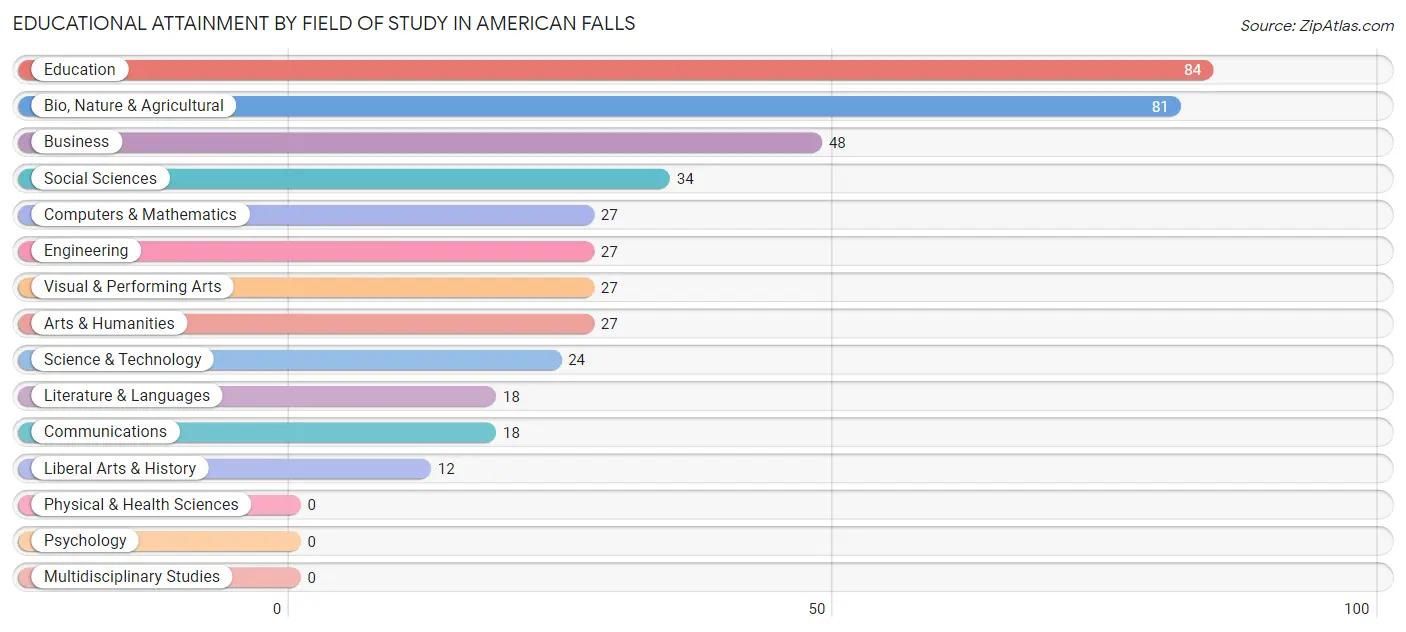
Educational Attainment by Field of Study in American Falls
Education (84 | 19.7%), bio, nature & agricultural (81 | 19.0%), business (48 | 11.2%), social sciences (34 | 8.0%), and computers & mathematics (27 | 6.3%) are the most common fields of study among 427 individuals in American Falls who have obtained a bachelor's degree or higher.
| Field of Study | # Graduates | % Graduates |
| Computers & Mathematics | 27 | 6.3% |
| Bio, Nature & Agricultural | 81 | 19.0% |
| Physical & Health Sciences | 0 | 0.0% |
| Psychology | 0 | 0.0% |
| Social Sciences | 34 | 8.0% |
| Engineering | 27 | 6.3% |
| Multidisciplinary Studies | 0 | 0.0% |
| Science & Technology | 24 | 5.6% |
| Business | 48 | 11.2% |
| Education | 84 | 19.7% |
| Literature & Languages | 18 | 4.2% |
| Liberal Arts & History | 12 | 2.8% |
| Visual & Performing Arts | 27 | 6.3% |
| Communications | 18 | 4.2% |
| Arts & Humanities | 27 | 6.3% |
| Total | 427 | 100.0% |
Transportation & Commute in American Falls
Vehicle Availability by Sex in American Falls
The most prevalent vehicle ownership categories in American Falls are males with 2 vehicles (413, accounting for 33.7%) and females with 2 vehicles (220, making up 56.5%).
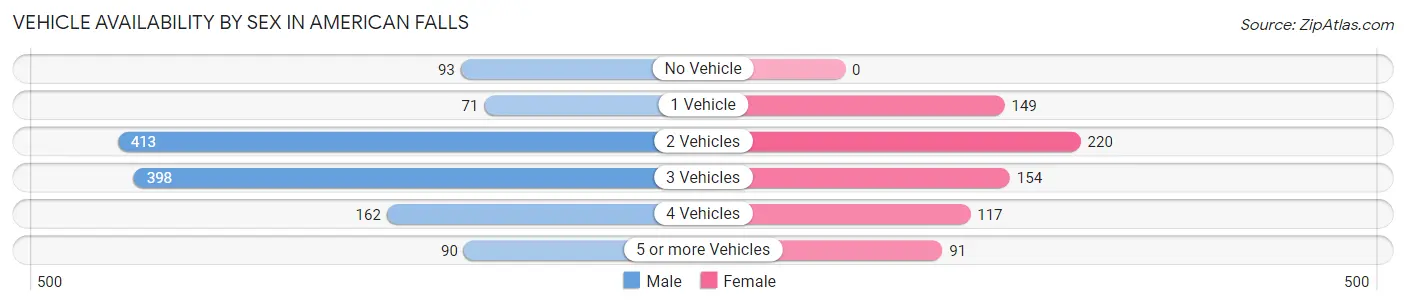
| Vehicles Available | Male | Female |
| No Vehicle | 93 (7.6%) | 0 (0.0%) |
| 1 Vehicle | 71 (5.8%) | 149 (20.4%) |
| 2 Vehicles | 413 (33.7%) | 220 (30.1%) |
| 3 Vehicles | 398 (32.4%) | 154 (21.1%) |
| 4 Vehicles | 162 (13.2%) | 117 (16.0%) |
| 5 or more Vehicles | 90 (7.3%) | 91 (12.4%) |
| Total | 1,227 (100.0%) | 731 (100.0%) |
Commute Time in American Falls
The most frequently occuring commute durations in American Falls are 5 to 9 minutes (466 commuters, 24.4%), 10 to 14 minutes (423 commuters, 22.2%), and 30 to 34 minutes (293 commuters, 15.4%).
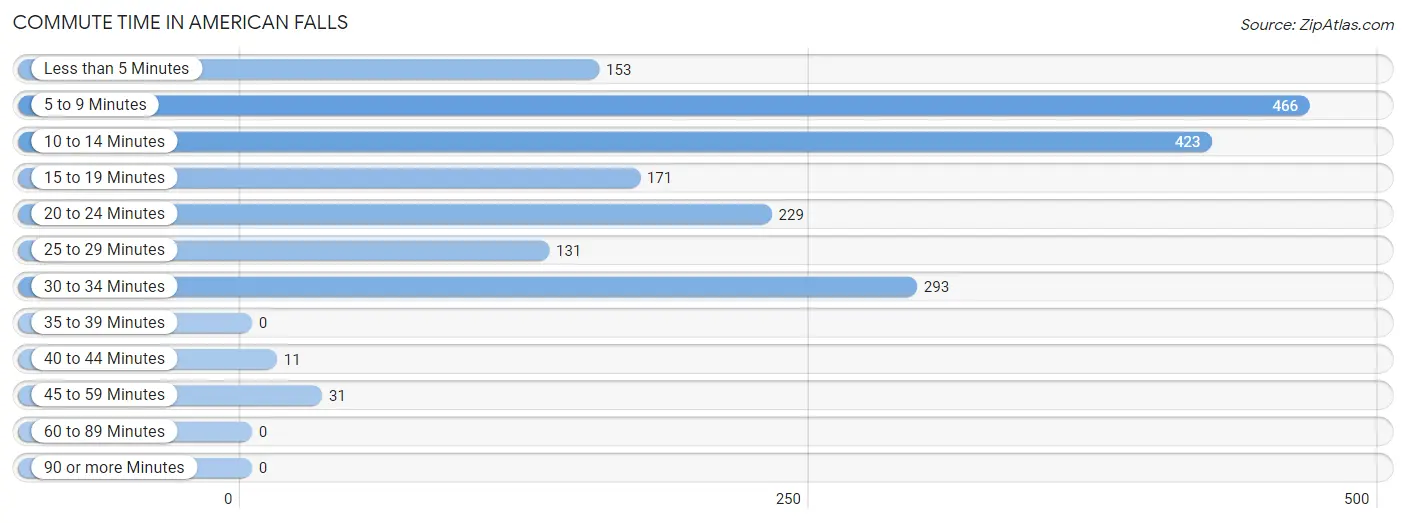
| Commute Time | # Commuters | % Commuters |
| Less than 5 Minutes | 153 | 8.0% |
| 5 to 9 Minutes | 466 | 24.4% |
| 10 to 14 Minutes | 423 | 22.2% |
| 15 to 19 Minutes | 171 | 9.0% |
| 20 to 24 Minutes | 229 | 12.0% |
| 25 to 29 Minutes | 131 | 6.9% |
| 30 to 34 Minutes | 293 | 15.4% |
| 35 to 39 Minutes | 0 | 0.0% |
| 40 to 44 Minutes | 11 | 0.6% |
| 45 to 59 Minutes | 31 | 1.6% |
| 60 to 89 Minutes | 0 | 0.0% |
| 90 or more Minutes | 0 | 0.0% |
Commute Time by Sex in American Falls
The most common commute times in American Falls are 10 to 14 minutes (269 commuters, 22.4%) for males and 5 to 9 minutes (248 commuters, 35.0%) for females.
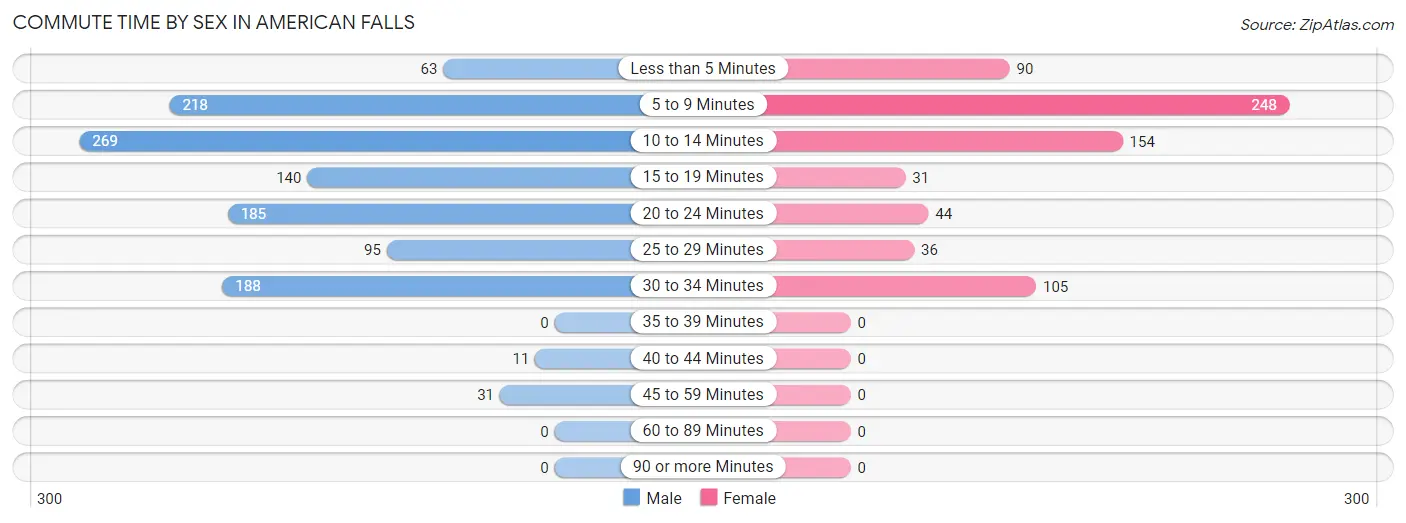
| Commute Time | Male | Female |
| Less than 5 Minutes | 63 (5.2%) | 90 (12.7%) |
| 5 to 9 Minutes | 218 (18.2%) | 248 (35.0%) |
| 10 to 14 Minutes | 269 (22.4%) | 154 (21.7%) |
| 15 to 19 Minutes | 140 (11.7%) | 31 (4.4%) |
| 20 to 24 Minutes | 185 (15.4%) | 44 (6.2%) |
| 25 to 29 Minutes | 95 (7.9%) | 36 (5.1%) |
| 30 to 34 Minutes | 188 (15.7%) | 105 (14.8%) |
| 35 to 39 Minutes | 0 (0.0%) | 0 (0.0%) |
| 40 to 44 Minutes | 11 (0.9%) | 0 (0.0%) |
| 45 to 59 Minutes | 31 (2.6%) | 0 (0.0%) |
| 60 to 89 Minutes | 0 (0.0%) | 0 (0.0%) |
| 90 or more Minutes | 0 (0.0%) | 0 (0.0%) |
Time of Departure to Work by Sex in American Falls
The most frequent times of departure to work in American Falls are 7:00 AM to 7:29 AM (284, 23.7%) for males and 8:30 AM to 8:59 AM (124, 17.5%) for females.
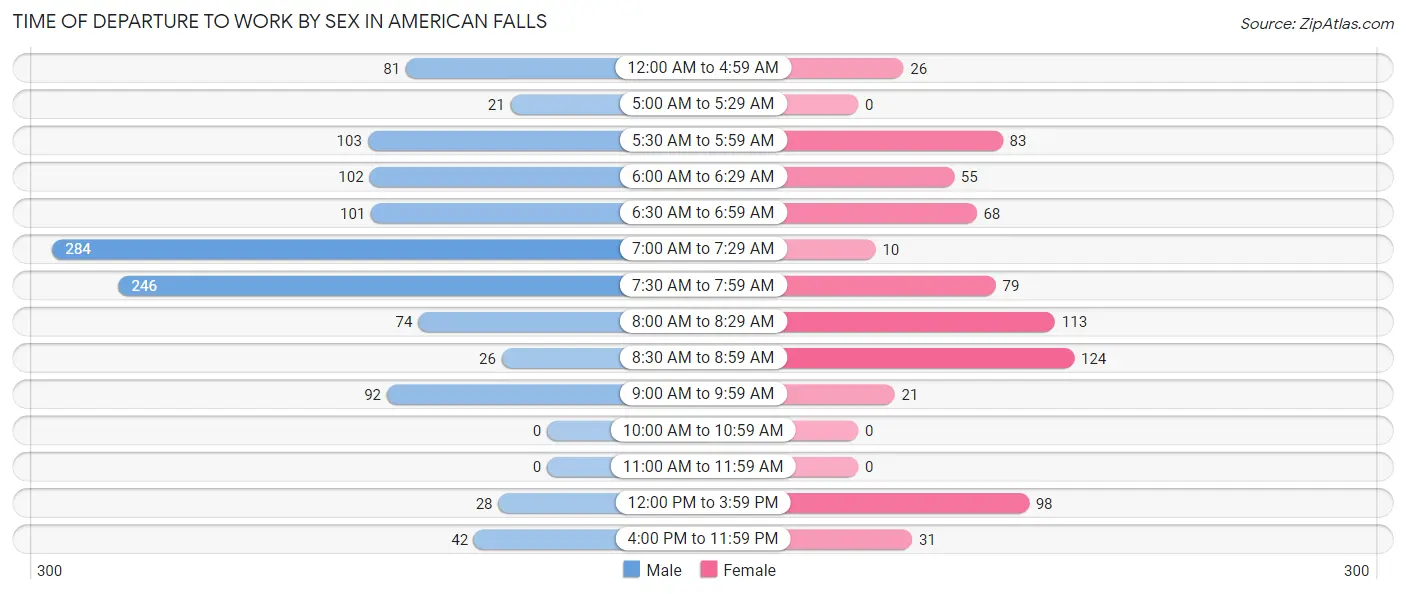
| Time of Departure | Male | Female |
| 12:00 AM to 4:59 AM | 81 (6.8%) | 26 (3.7%) |
| 5:00 AM to 5:29 AM | 21 (1.8%) | 0 (0.0%) |
| 5:30 AM to 5:59 AM | 103 (8.6%) | 83 (11.7%) |
| 6:00 AM to 6:29 AM | 102 (8.5%) | 55 (7.8%) |
| 6:30 AM to 6:59 AM | 101 (8.4%) | 68 (9.6%) |
| 7:00 AM to 7:29 AM | 284 (23.7%) | 10 (1.4%) |
| 7:30 AM to 7:59 AM | 246 (20.5%) | 79 (11.2%) |
| 8:00 AM to 8:29 AM | 74 (6.2%) | 113 (16.0%) |
| 8:30 AM to 8:59 AM | 26 (2.2%) | 124 (17.5%) |
| 9:00 AM to 9:59 AM | 92 (7.7%) | 21 (3.0%) |
| 10:00 AM to 10:59 AM | 0 (0.0%) | 0 (0.0%) |
| 11:00 AM to 11:59 AM | 0 (0.0%) | 0 (0.0%) |
| 12:00 PM to 3:59 PM | 28 (2.3%) | 98 (13.8%) |
| 4:00 PM to 11:59 PM | 42 (3.5%) | 31 (4.4%) |
| Total | 1,200 (100.0%) | 708 (100.0%) |
Housing Occupancy in American Falls
Occupancy by Ownership in American Falls
Of the total 1,465 dwellings in American Falls, owner-occupied units account for 1,047 (71.5%), while renter-occupied units make up 418 (28.5%).
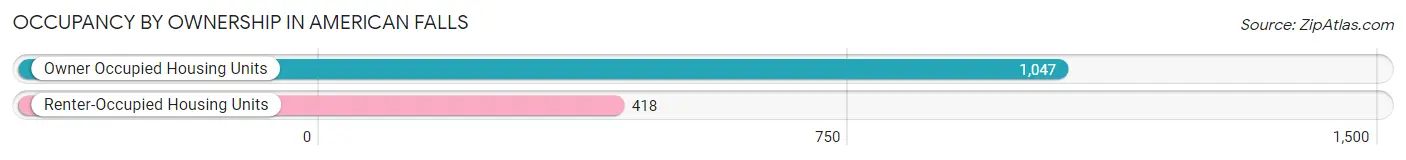
| Occupancy | # Housing Units | % Housing Units |
| Owner Occupied Housing Units | 1,047 | 71.5% |
| Renter-Occupied Housing Units | 418 | 28.5% |
| Total Occupied Housing Units | 1,465 | 100.0% |
Occupancy by Household Size in American Falls
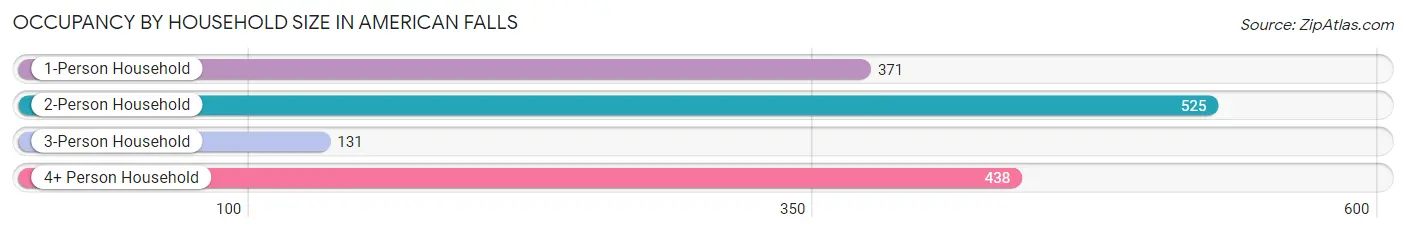
| Household Size | # Housing Units | % Housing Units |
| 1-Person Household | 371 | 25.3% |
| 2-Person Household | 525 | 35.8% |
| 3-Person Household | 131 | 8.9% |
| 4+ Person Household | 438 | 29.9% |
| Total Housing Units | 1,465 | 100.0% |
Occupancy by Ownership by Household Size in American Falls
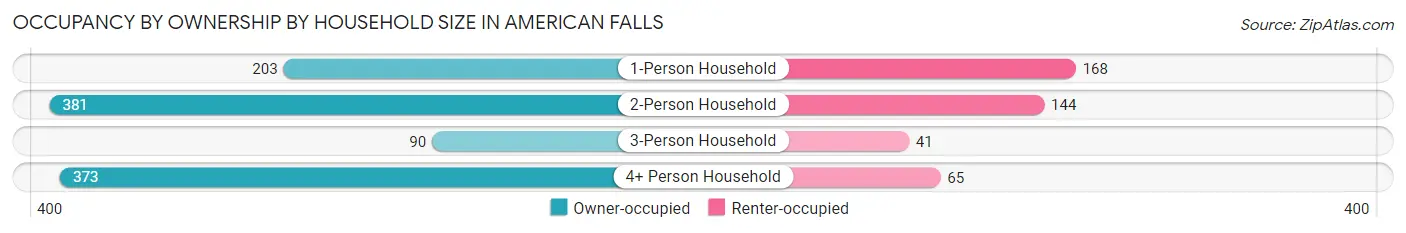
| Household Size | Owner-occupied | Renter-occupied |
| 1-Person Household | 203 (54.7%) | 168 (45.3%) |
| 2-Person Household | 381 (72.6%) | 144 (27.4%) |
| 3-Person Household | 90 (68.7%) | 41 (31.3%) |
| 4+ Person Household | 373 (85.2%) | 65 (14.8%) |
| Total Housing Units | 1,047 (71.5%) | 418 (28.5%) |
Occupancy by Educational Attainment in American Falls
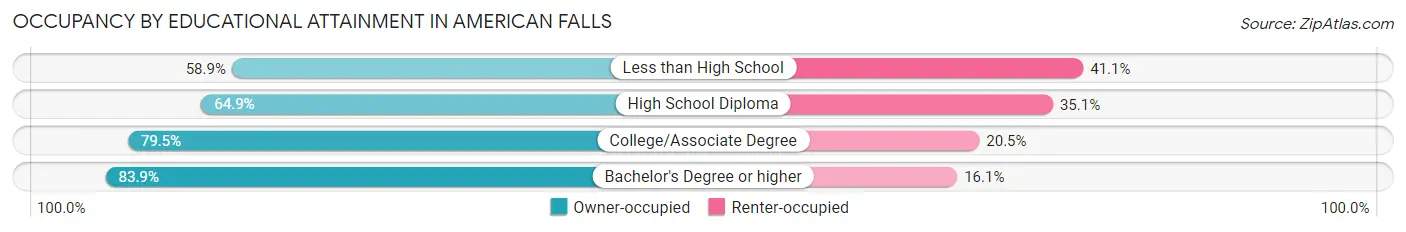
| Household Size | Owner-occupied | Renter-occupied |
| Less than High School | 165 (58.9%) | 115 (41.1%) |
| High School Diploma | 313 (64.9%) | 169 (35.1%) |
| College/Associate Degree | 381 (79.5%) | 98 (20.5%) |
| Bachelor's Degree or higher | 188 (83.9%) | 36 (16.1%) |
Occupancy by Age of Householder in American Falls
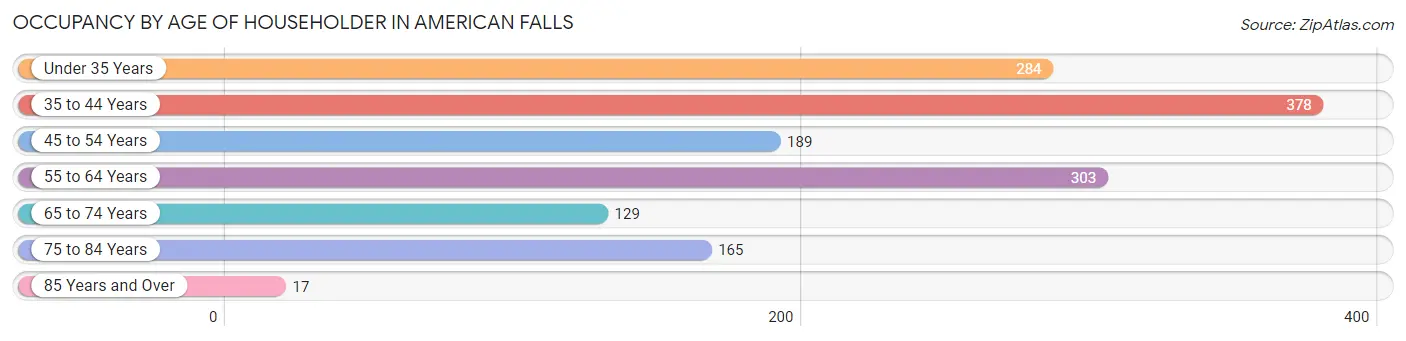
| Age Bracket | # Households | % Households |
| Under 35 Years | 284 | 19.4% |
| 35 to 44 Years | 378 | 25.8% |
| 45 to 54 Years | 189 | 12.9% |
| 55 to 64 Years | 303 | 20.7% |
| 65 to 74 Years | 129 | 8.8% |
| 75 to 84 Years | 165 | 11.3% |
| 85 Years and Over | 17 | 1.2% |
| Total | 1,465 | 100.0% |
Housing Finances in American Falls
Median Income by Occupancy in American Falls
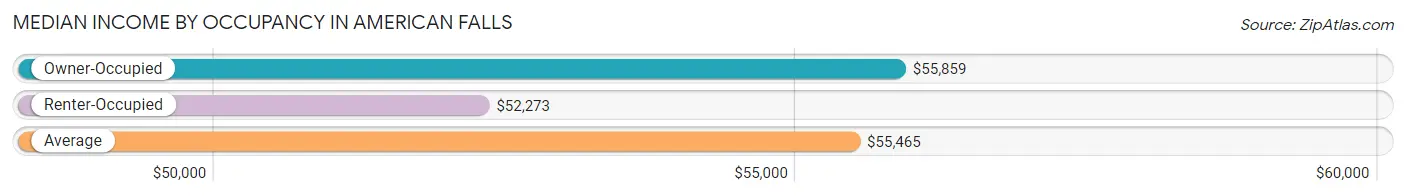
| Occupancy Type | # Households | Median Income |
| Owner-Occupied | 1,047 (71.5%) | $55,859 |
| Renter-Occupied | 418 (28.5%) | $52,273 |
| Average | 1,465 (100.0%) | $55,465 |
Occupancy by Householder Income Bracket in American Falls
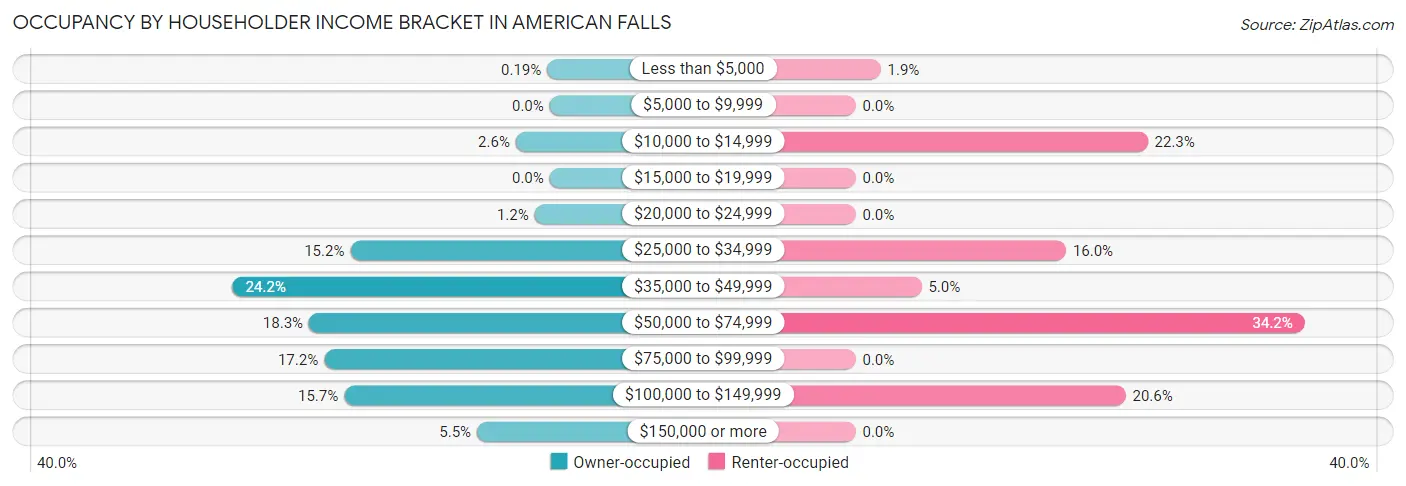
| Income Bracket | Owner-occupied | Renter-occupied |
| Less than $5,000 | 2 (0.2%) | 8 (1.9%) |
| $5,000 to $9,999 | 0 (0.0%) | 0 (0.0%) |
| $10,000 to $14,999 | 27 (2.6%) | 93 (22.3%) |
| $15,000 to $19,999 | 0 (0.0%) | 0 (0.0%) |
| $20,000 to $24,999 | 12 (1.1%) | 0 (0.0%) |
| $25,000 to $34,999 | 159 (15.2%) | 67 (16.0%) |
| $35,000 to $49,999 | 253 (24.2%) | 21 (5.0%) |
| $50,000 to $74,999 | 192 (18.3%) | 143 (34.2%) |
| $75,000 to $99,999 | 180 (17.2%) | 0 (0.0%) |
| $100,000 to $149,999 | 164 (15.7%) | 86 (20.6%) |
| $150,000 or more | 58 (5.5%) | 0 (0.0%) |
| Total | 1,047 (100.0%) | 418 (100.0%) |
Monthly Housing Cost Tiers in American Falls
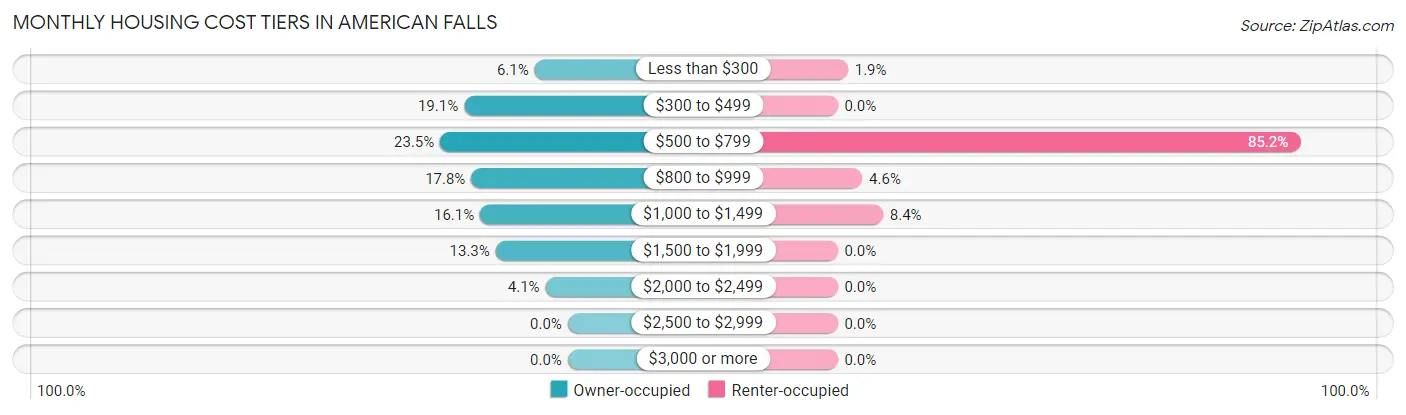
| Monthly Cost | Owner-occupied | Renter-occupied |
| Less than $300 | 64 (6.1%) | 8 (1.9%) |
| $300 to $499 | 200 (19.1%) | 0 (0.0%) |
| $500 to $799 | 246 (23.5%) | 356 (85.2%) |
| $800 to $999 | 186 (17.8%) | 19 (4.5%) |
| $1,000 to $1,499 | 169 (16.1%) | 35 (8.4%) |
| $1,500 to $1,999 | 139 (13.3%) | 0 (0.0%) |
| $2,000 to $2,499 | 43 (4.1%) | 0 (0.0%) |
| $2,500 to $2,999 | 0 (0.0%) | 0 (0.0%) |
| $3,000 or more | 0 (0.0%) | 0 (0.0%) |
| Total | 1,047 (100.0%) | 418 (100.0%) |
Physical Housing Characteristics in American Falls
Housing Structures in American Falls
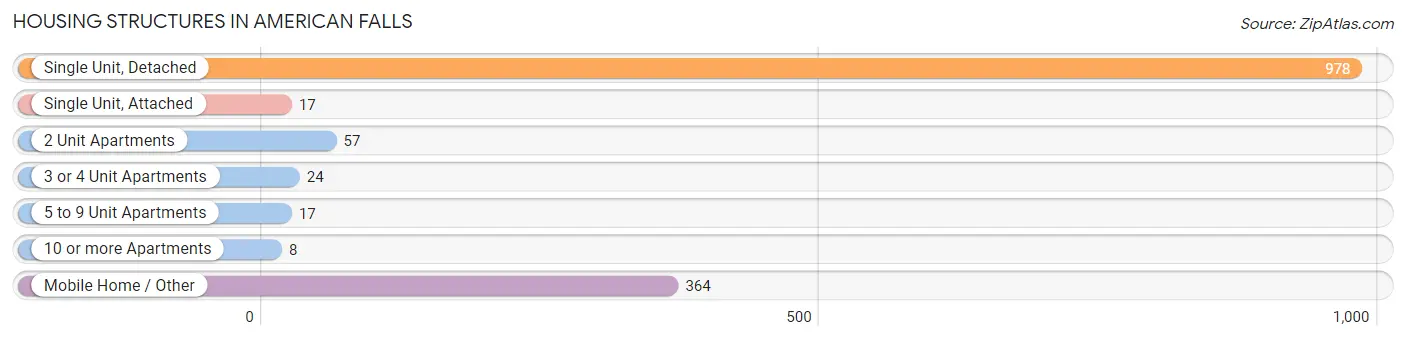
| Structure Type | # Housing Units | % Housing Units |
| Single Unit, Detached | 978 | 66.8% |
| Single Unit, Attached | 17 | 1.2% |
| 2 Unit Apartments | 57 | 3.9% |
| 3 or 4 Unit Apartments | 24 | 1.6% |
| 5 to 9 Unit Apartments | 17 | 1.2% |
| 10 or more Apartments | 8 | 0.5% |
| Mobile Home / Other | 364 | 24.8% |
| Total | 1,465 | 100.0% |
Housing Structures by Occupancy in American Falls
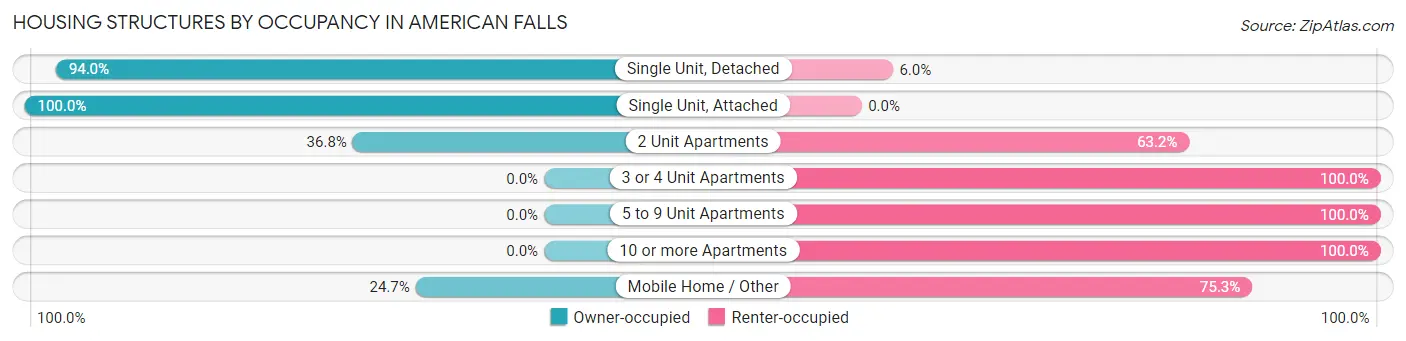
| Structure Type | Owner-occupied | Renter-occupied |
| Single Unit, Detached | 919 (94.0%) | 59 (6.0%) |
| Single Unit, Attached | 17 (100.0%) | 0 (0.0%) |
| 2 Unit Apartments | 21 (36.8%) | 36 (63.2%) |
| 3 or 4 Unit Apartments | 0 (0.0%) | 24 (100.0%) |
| 5 to 9 Unit Apartments | 0 (0.0%) | 17 (100.0%) |
| 10 or more Apartments | 0 (0.0%) | 8 (100.0%) |
| Mobile Home / Other | 90 (24.7%) | 274 (75.3%) |
| Total | 1,047 (71.5%) | 418 (28.5%) |
Housing Structures by Number of Rooms in American Falls
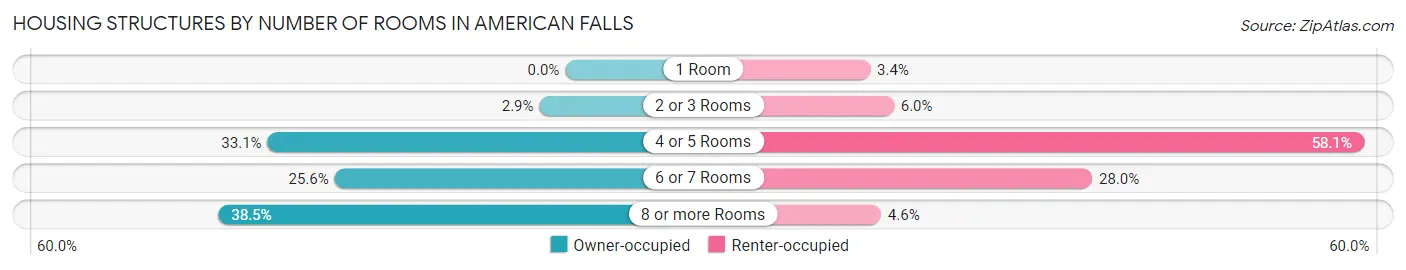
| Number of Rooms | Owner-occupied | Renter-occupied |
| 1 Room | 0 (0.0%) | 14 (3.4%) |
| 2 or 3 Rooms | 30 (2.9%) | 25 (6.0%) |
| 4 or 5 Rooms | 346 (33.1%) | 243 (58.1%) |
| 6 or 7 Rooms | 268 (25.6%) | 117 (28.0%) |
| 8 or more Rooms | 403 (38.5%) | 19 (4.5%) |
| Total | 1,047 (100.0%) | 418 (100.0%) |
Housing Structure by Heating Type in American Falls
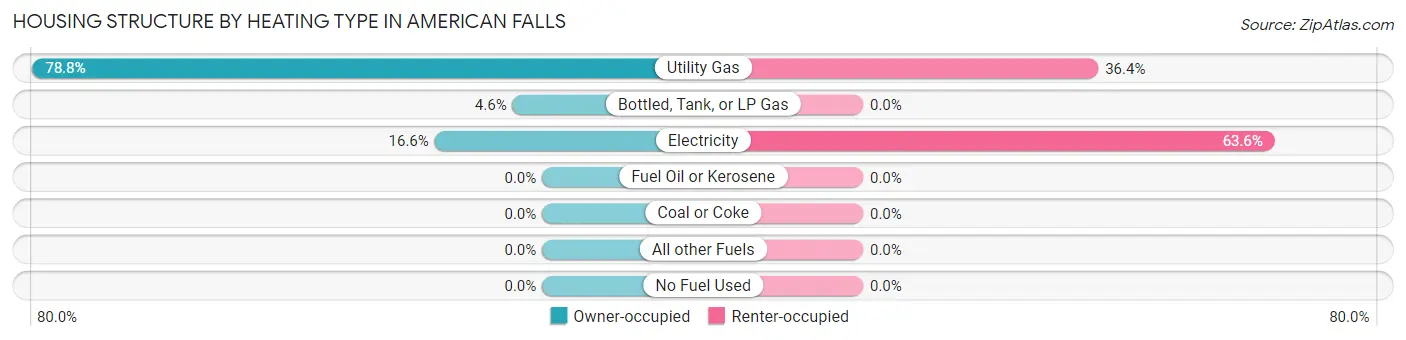
| Heating Type | Owner-occupied | Renter-occupied |
| Utility Gas | 825 (78.8%) | 152 (36.4%) |
| Bottled, Tank, or LP Gas | 48 (4.6%) | 0 (0.0%) |
| Electricity | 174 (16.6%) | 266 (63.6%) |
| Fuel Oil or Kerosene | 0 (0.0%) | 0 (0.0%) |
| Coal or Coke | 0 (0.0%) | 0 (0.0%) |
| All other Fuels | 0 (0.0%) | 0 (0.0%) |
| No Fuel Used | 0 (0.0%) | 0 (0.0%) |
| Total | 1,047 (100.0%) | 418 (100.0%) |
Household Vehicle Usage in American Falls
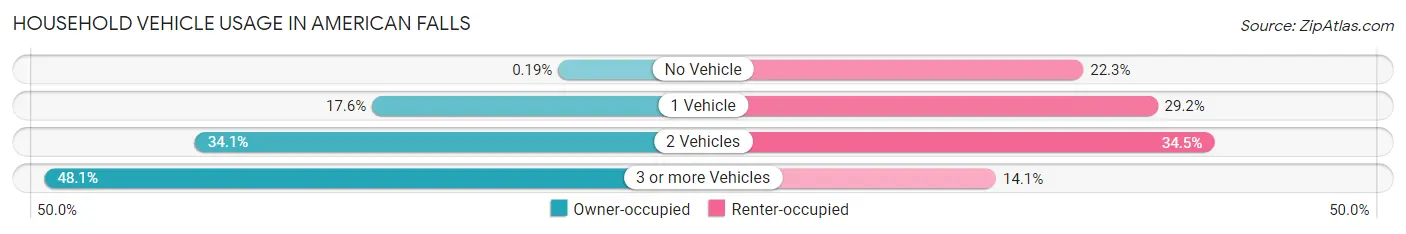
| Vehicles per Household | Owner-occupied | Renter-occupied |
| No Vehicle | 2 (0.2%) | 93 (22.3%) |
| 1 Vehicle | 184 (17.6%) | 122 (29.2%) |
| 2 Vehicles | 357 (34.1%) | 144 (34.4%) |
| 3 or more Vehicles | 504 (48.1%) | 59 (14.1%) |
| Total | 1,047 (100.0%) | 418 (100.0%) |
Real Estate & Mortgages in American Falls
Real Estate and Mortgage Overview in American Falls
| Characteristic | Without Mortgage | With Mortgage |
| Housing Units | 429 | 618 |
| Median Property Value | $146,600 | $174,700 |
| Median Household Income | $47,250 | $46 |
| Monthly Housing Costs | $441 | $0 |
| Real Estate Taxes | $1,740 | $0 |
Property Value by Mortgage Status in American Falls
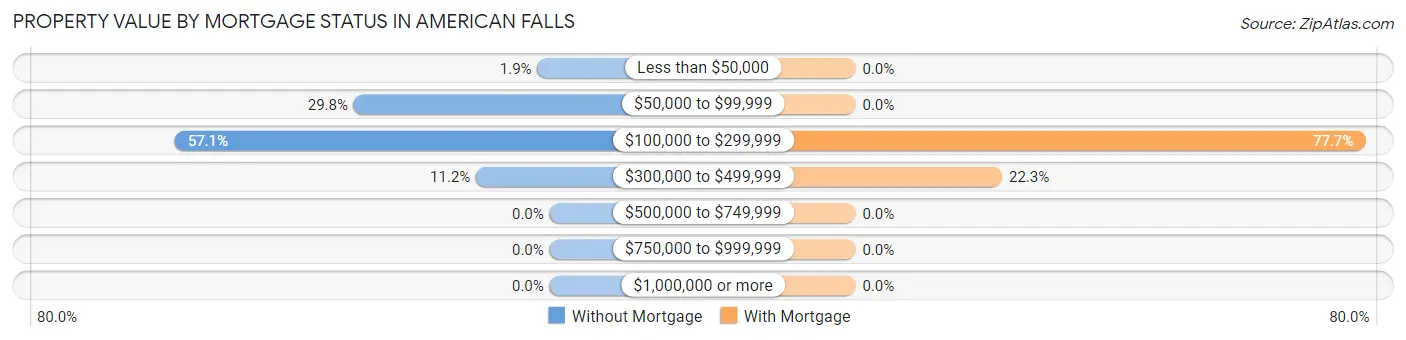
| Property Value | Without Mortgage | With Mortgage |
| Less than $50,000 | 8 (1.9%) | 0 (0.0%) |
| $50,000 to $99,999 | 128 (29.8%) | 0 (0.0%) |
| $100,000 to $299,999 | 245 (57.1%) | 480 (77.7%) |
| $300,000 to $499,999 | 48 (11.2%) | 138 (22.3%) |
| $500,000 to $749,999 | 0 (0.0%) | 0 (0.0%) |
| $750,000 to $999,999 | 0 (0.0%) | 0 (0.0%) |
| $1,000,000 or more | 0 (0.0%) | 0 (0.0%) |
| Total | 429 (100.0%) | 618 (100.0%) |
Household Income by Mortgage Status in American Falls
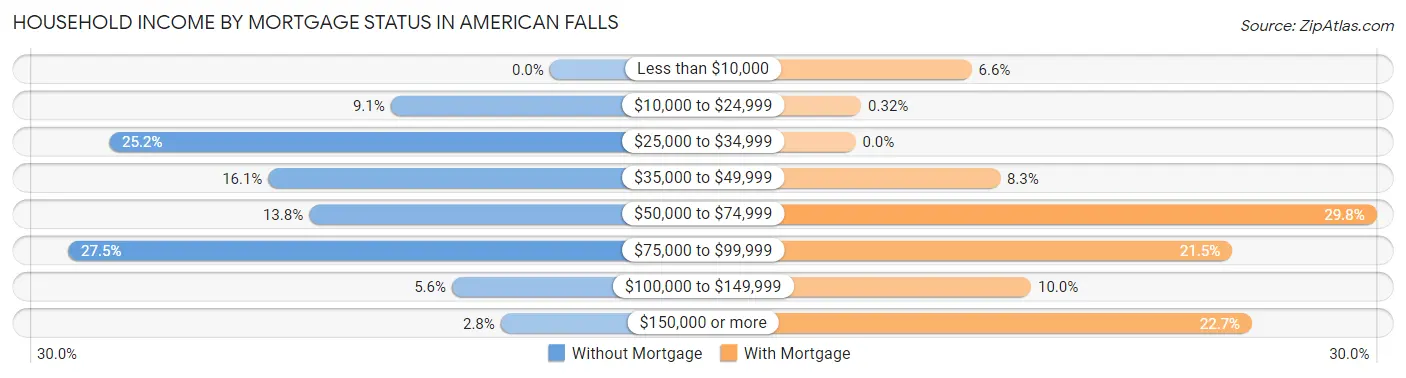
| Household Income | Without Mortgage | With Mortgage |
| Less than $10,000 | 0 (0.0%) | 41 (6.6%) |
| $10,000 to $24,999 | 39 (9.1%) | 2 (0.3%) |
| $25,000 to $34,999 | 108 (25.2%) | 0 (0.0%) |
| $35,000 to $49,999 | 69 (16.1%) | 51 (8.3%) |
| $50,000 to $74,999 | 59 (13.8%) | 184 (29.8%) |
| $75,000 to $99,999 | 118 (27.5%) | 133 (21.5%) |
| $100,000 to $149,999 | 24 (5.6%) | 62 (10.0%) |
| $150,000 or more | 12 (2.8%) | 140 (22.7%) |
| Total | 429 (100.0%) | 618 (100.0%) |
Property Value to Household Income Ratio in American Falls
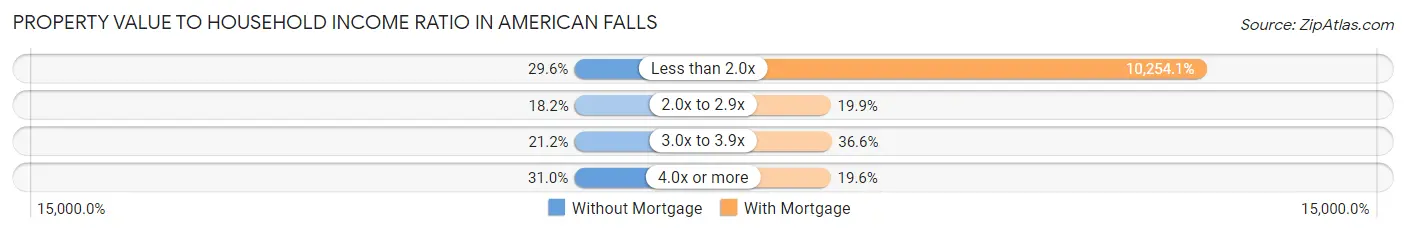
| Value-to-Income Ratio | Without Mortgage | With Mortgage |
| Less than 2.0x | 127 (29.6%) | 63,370 (10,254.0%) |
| 2.0x to 2.9x | 78 (18.2%) | 123 (19.9%) |
| 3.0x to 3.9x | 91 (21.2%) | 226 (36.6%) |
| 4.0x or more | 133 (31.0%) | 121 (19.6%) |
| Total | 429 (100.0%) | 618 (100.0%) |
Real Estate Taxes by Mortgage Status in American Falls
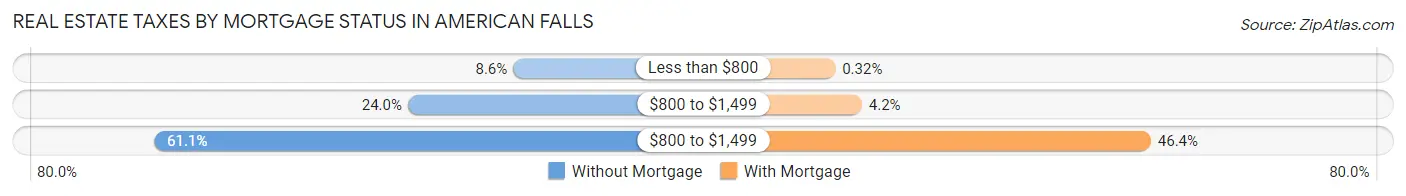
| Property Taxes | Without Mortgage | With Mortgage |
| Less than $800 | 37 (8.6%) | 2 (0.3%) |
| $800 to $1,499 | 103 (24.0%) | 26 (4.2%) |
| $800 to $1,499 | 262 (61.1%) | 287 (46.4%) |
| Total | 429 (100.0%) | 618 (100.0%) |
Health & Disability in American Falls
Health Insurance Coverage by Age in American Falls
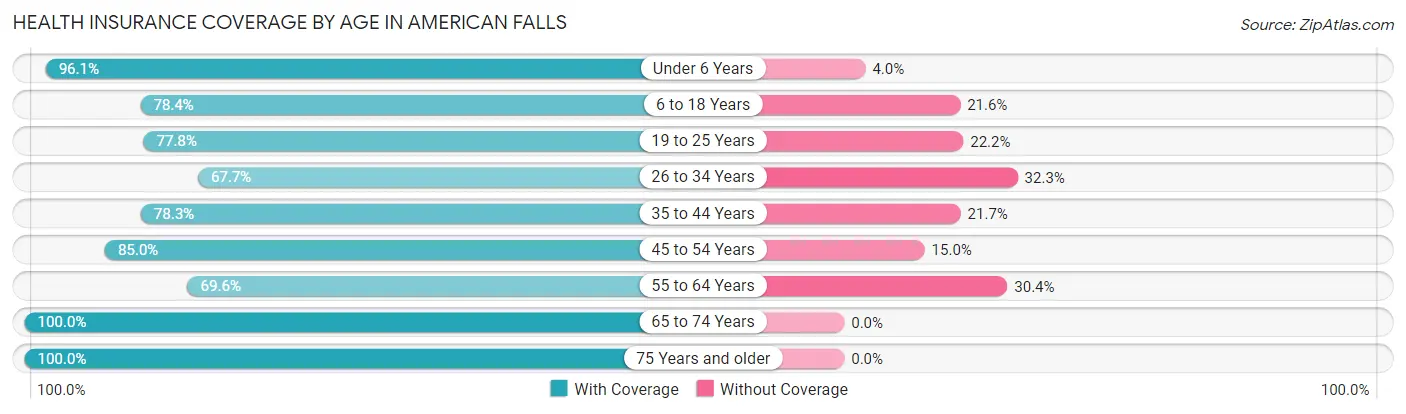
| Age Bracket | With Coverage | Without Coverage |
| Under 6 Years | 365 (96.1%) | 15 (4.0%) |
| 6 to 18 Years | 965 (78.4%) | 266 (21.6%) |
| 19 to 25 Years | 305 (77.8%) | 87 (22.2%) |
| 26 to 34 Years | 316 (67.7%) | 151 (32.3%) |
| 35 to 44 Years | 451 (78.3%) | 125 (21.7%) |
| 45 to 54 Years | 380 (85.0%) | 67 (15.0%) |
| 55 to 64 Years | 357 (69.6%) | 156 (30.4%) |
| 65 to 74 Years | 218 (100.0%) | 0 (0.0%) |
| 75 Years and older | 280 (100.0%) | 0 (0.0%) |
| Total | 3,637 (80.7%) | 867 (19.3%) |
Health Insurance Coverage by Citizenship Status in American Falls
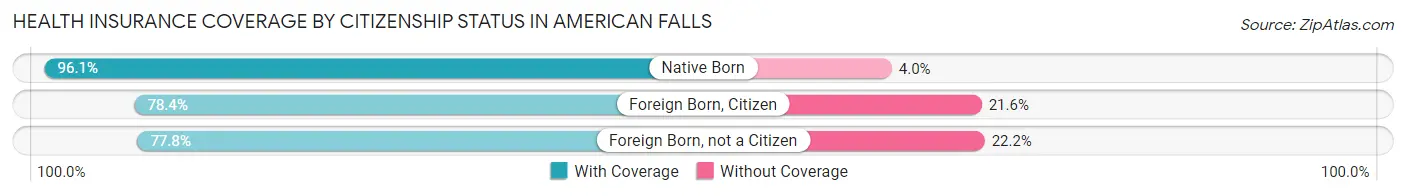
| Citizenship Status | With Coverage | Without Coverage |
| Native Born | 365 (96.1%) | 15 (4.0%) |
| Foreign Born, Citizen | 965 (78.4%) | 266 (21.6%) |
| Foreign Born, not a Citizen | 305 (77.8%) | 87 (22.2%) |
Health Insurance Coverage by Household Income in American Falls
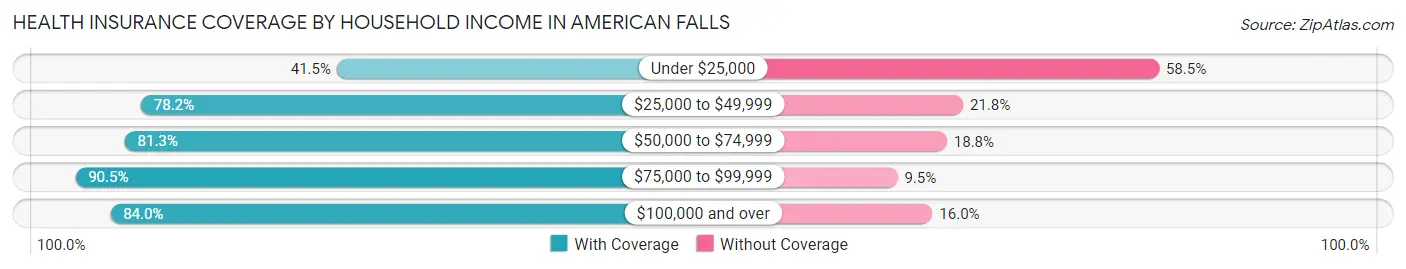
| Household Income | With Coverage | Without Coverage |
| Under $25,000 | 66 (41.5%) | 93 (58.5%) |
| $25,000 to $49,999 | 1,005 (78.2%) | 280 (21.8%) |
| $50,000 to $74,999 | 1,131 (81.2%) | 261 (18.8%) |
| $75,000 to $99,999 | 477 (90.5%) | 50 (9.5%) |
| $100,000 and over | 958 (84.0%) | 183 (16.0%) |
Public vs Private Health Insurance Coverage by Age in American Falls
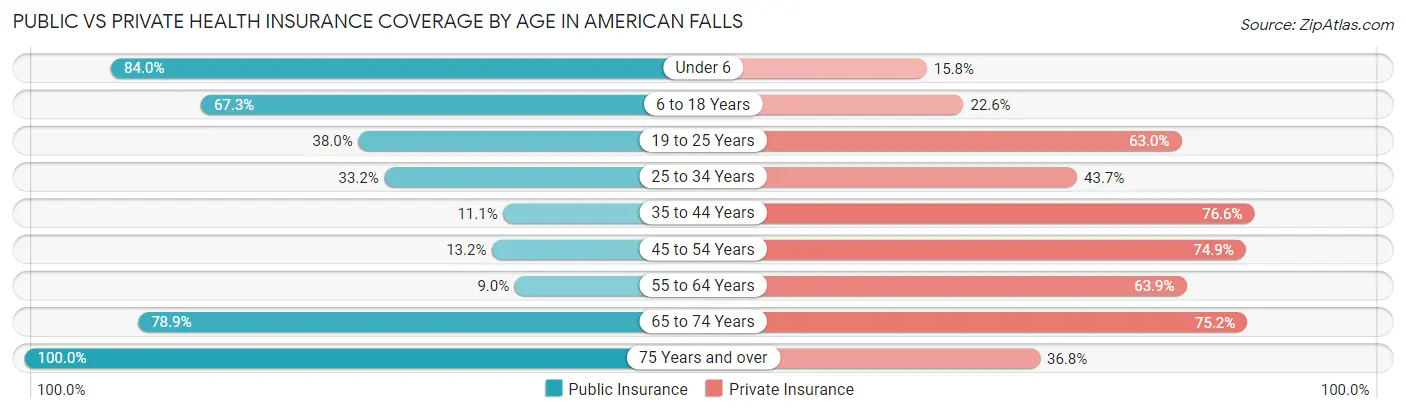
| Age Bracket | Public Insurance | Private Insurance |
| Under 6 | 319 (84.0%) | 60 (15.8%) |
| 6 to 18 Years | 828 (67.3%) | 278 (22.6%) |
| 19 to 25 Years | 149 (38.0%) | 247 (63.0%) |
| 25 to 34 Years | 155 (33.2%) | 204 (43.7%) |
| 35 to 44 Years | 64 (11.1%) | 441 (76.6%) |
| 45 to 54 Years | 59 (13.2%) | 335 (74.9%) |
| 55 to 64 Years | 46 (9.0%) | 328 (63.9%) |
| 65 to 74 Years | 172 (78.9%) | 164 (75.2%) |
| 75 Years and over | 280 (100.0%) | 103 (36.8%) |
| Total | 2,072 (46.0%) | 2,160 (48.0%) |
Disability Status by Sex by Age in American Falls
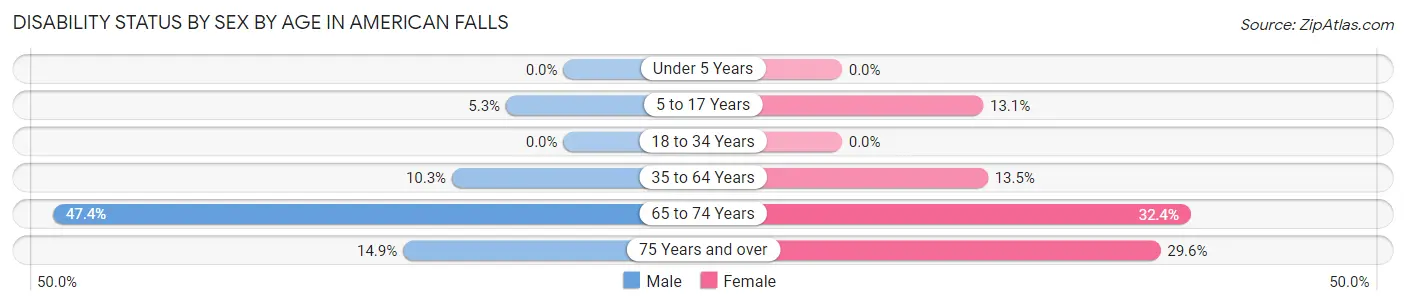
| Age Bracket | Male | Female |
| Under 5 Years | 0 (0.0%) | 0 (0.0%) |
| 5 to 17 Years | 32 (5.3%) | 78 (13.1%) |
| 18 to 34 Years | 0 (0.0%) | 0 (0.0%) |
| 35 to 64 Years | 84 (10.3%) | 98 (13.5%) |
| 65 to 74 Years | 36 (47.4%) | 46 (32.4%) |
| 75 Years and over | 18 (14.9%) | 47 (29.6%) |
Disability Class by Sex by Age in American Falls
Disability Class: Hearing Difficulty
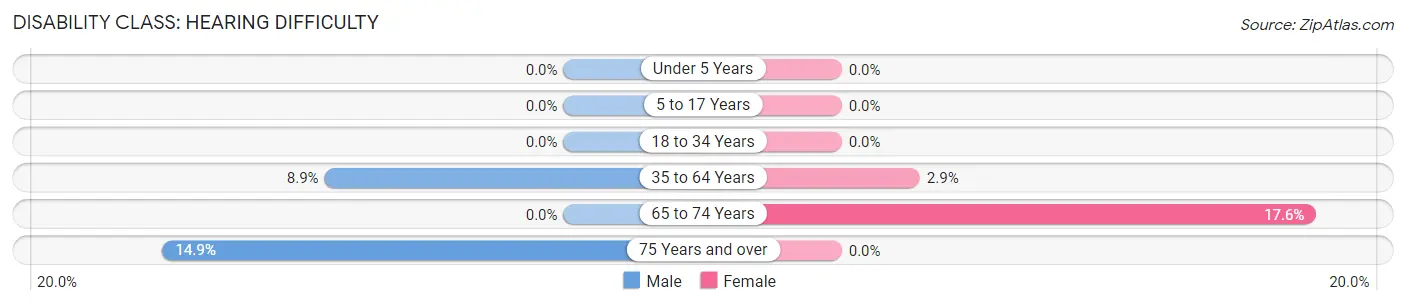
| Age Bracket | Male | Female |
| Under 5 Years | 0 (0.0%) | 0 (0.0%) |
| 5 to 17 Years | 0 (0.0%) | 0 (0.0%) |
| 18 to 34 Years | 0 (0.0%) | 0 (0.0%) |
| 35 to 64 Years | 72 (8.9%) | 21 (2.9%) |
| 65 to 74 Years | 0 (0.0%) | 25 (17.6%) |
| 75 Years and over | 18 (14.9%) | 0 (0.0%) |
Disability Class: Vision Difficulty
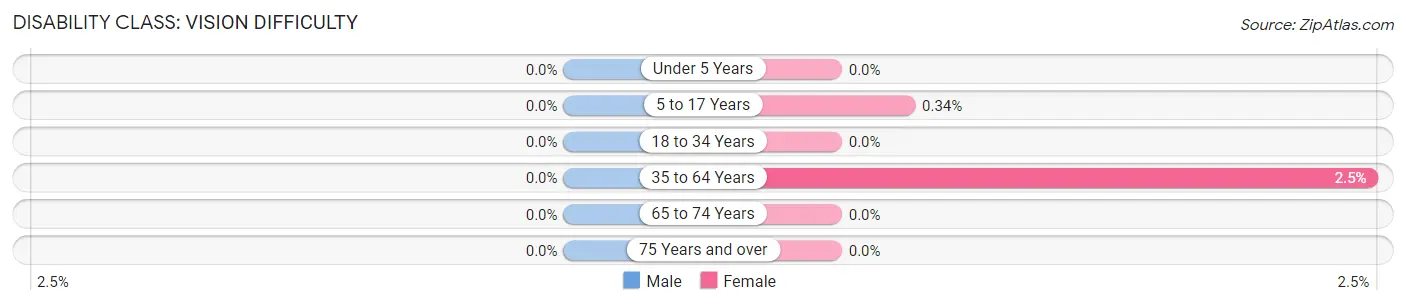
| Age Bracket | Male | Female |
| Under 5 Years | 0 (0.0%) | 0 (0.0%) |
| 5 to 17 Years | 0 (0.0%) | 2 (0.3%) |
| 18 to 34 Years | 0 (0.0%) | 0 (0.0%) |
| 35 to 64 Years | 0 (0.0%) | 18 (2.5%) |
| 65 to 74 Years | 0 (0.0%) | 0 (0.0%) |
| 75 Years and over | 0 (0.0%) | 0 (0.0%) |
Disability Class: Cognitive Difficulty
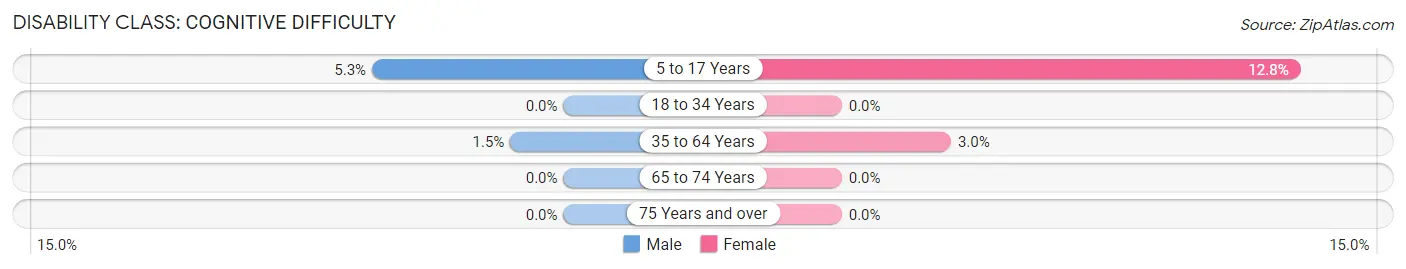
| Age Bracket | Male | Female |
| 5 to 17 Years | 32 (5.3%) | 76 (12.8%) |
| 18 to 34 Years | 0 (0.0%) | 0 (0.0%) |
| 35 to 64 Years | 12 (1.5%) | 22 (3.0%) |
| 65 to 74 Years | 0 (0.0%) | 0 (0.0%) |
| 75 Years and over | 0 (0.0%) | 0 (0.0%) |
Disability Class: Ambulatory Difficulty
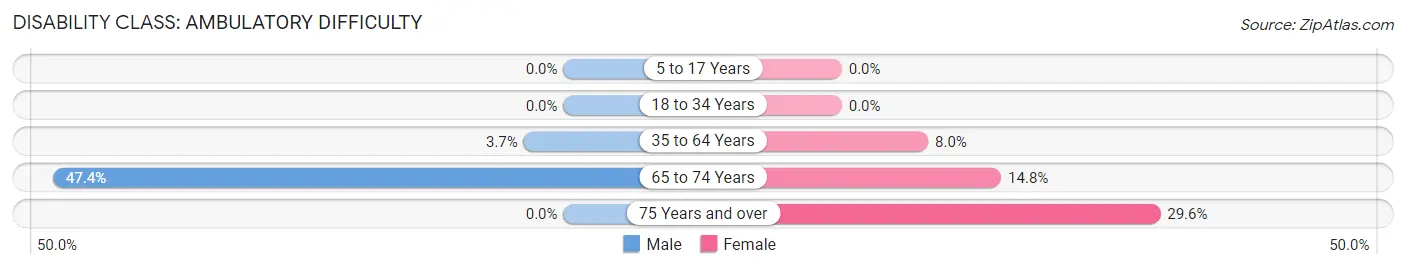
| Age Bracket | Male | Female |
| 5 to 17 Years | 0 (0.0%) | 0 (0.0%) |
| 18 to 34 Years | 0 (0.0%) | 0 (0.0%) |
| 35 to 64 Years | 30 (3.7%) | 58 (8.0%) |
| 65 to 74 Years | 36 (47.4%) | 21 (14.8%) |
| 75 Years and over | 0 (0.0%) | 47 (29.6%) |
Disability Class: Self-Care Difficulty
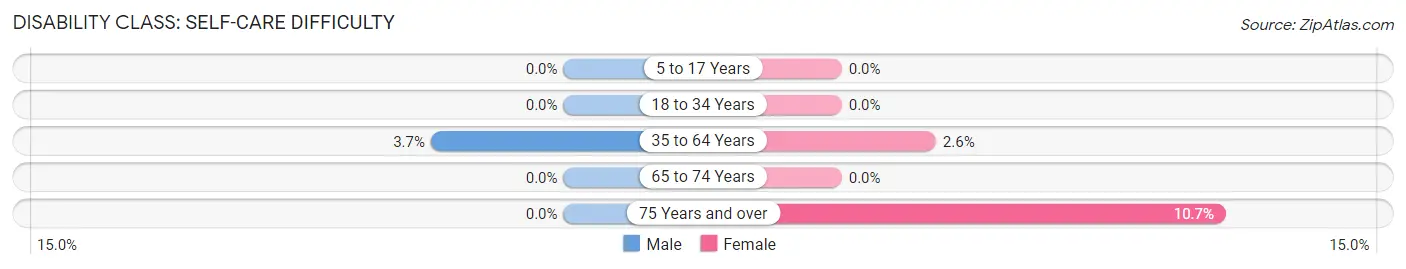
| Age Bracket | Male | Female |
| 5 to 17 Years | 0 (0.0%) | 0 (0.0%) |
| 18 to 34 Years | 0 (0.0%) | 0 (0.0%) |
| 35 to 64 Years | 30 (3.7%) | 19 (2.6%) |
| 65 to 74 Years | 0 (0.0%) | 0 (0.0%) |
| 75 Years and over | 0 (0.0%) | 17 (10.7%) |
Technology Access in American Falls
Computing Device Access in American Falls
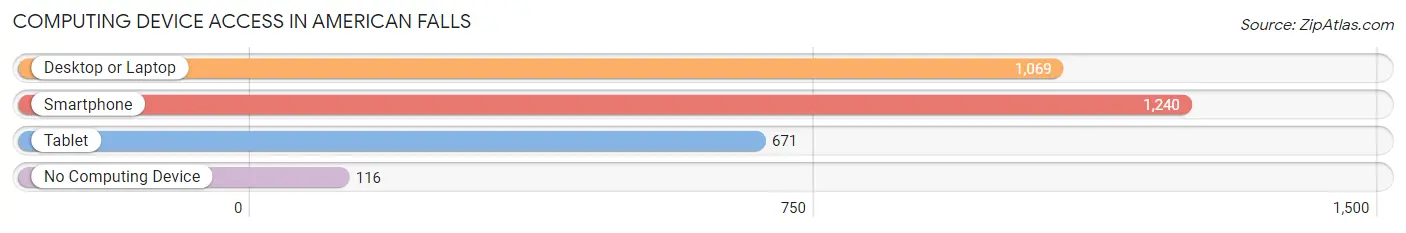
| Device Type | # Households | % Households |
| Desktop or Laptop | 1,069 | 73.0% |
| Smartphone | 1,240 | 84.6% |
| Tablet | 671 | 45.8% |
| No Computing Device | 116 | 7.9% |
| Total | 1,465 | 100.0% |
Internet Access in American Falls
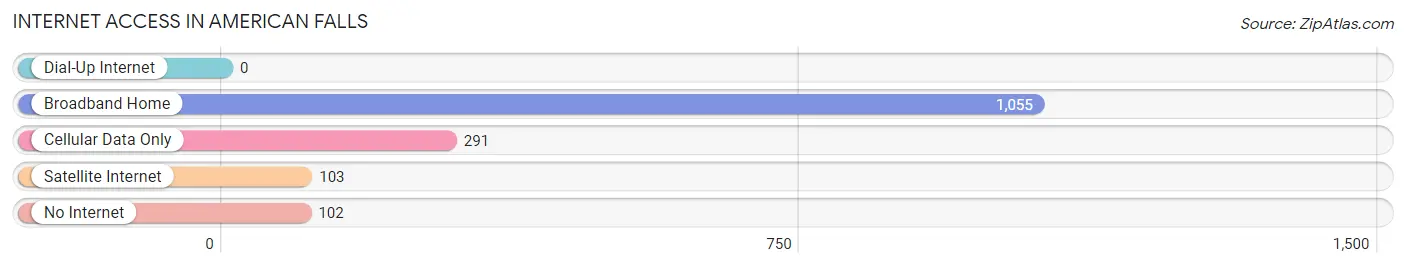
| Internet Type | # Households | % Households |
| Dial-Up Internet | 0 | 0.0% |
| Broadband Home | 1,055 | 72.0% |
| Cellular Data Only | 291 | 19.9% |
| Satellite Internet | 103 | 7.0% |
| No Internet | 102 | 7.0% |
| Total | 1,465 | 100.0% |
American Falls Summary
History
American Falls is a city located in Power County, Idaho. It is situated on the Snake River, near the Oregon border. The city was founded in 1891 and was originally known as Upper Salmon Falls. The city was renamed American Falls in 1895, in honor of the American Falls of the Snake River.
The area around American Falls was first inhabited by Native American tribes, including the Shoshone, Bannock, and Paiute. The first European settlers arrived in the area in the late 1800s, and the city was officially founded in 1891.
American Falls was an important stop on the Oregon Trail, and the city quickly grew as a result. The city was incorporated in 1901, and the population had grown to over 1,000 by 1910.
The economy of American Falls was largely based on agriculture and ranching. The city was also home to several lumber mills, which provided jobs for many of the city’s residents.
In the early 1900s, the city was also home to a large hydroelectric power plant, which provided electricity to the surrounding area. The plant was decommissioned in the 1950s, but the city still relies on hydroelectric power for much of its electricity.
The city was also home to a large sugar beet processing plant, which provided jobs for many of the city’s residents. The plant closed in the 1980s, and the city’s economy has since shifted to focus on tourism and recreation.
Geography
American Falls is located in Power County, Idaho. The city is situated on the Snake River, near the Oregon border. The city is located at an elevation of 4,092 feet above sea level.
The city covers an area of 4.2 square miles, and has a population of approximately 4,500 people. The city is located in a semi-arid climate, with hot summers and cold winters.
The city is surrounded by several mountain ranges, including the Snake River Range, the Owyhee Mountains, and the Salmon River Mountains. The city is also located near several lakes, including American Falls Reservoir, Lake Walcott, and Lake Cleveland.
Economy
The economy of American Falls is largely based on tourism and recreation. The city is home to several parks and recreational areas, including American Falls Reservoir, Lake Walcott, and Lake Cleveland.
The city is also home to several businesses, including restaurants, retail stores, and hotels. The city is also home to several manufacturing companies, including a concrete plant and a food processing plant.
The city is also home to several agricultural operations, including cattle ranches and farms. The city is also home to several wineries, which produce wine from grapes grown in the area.
Demographics
As of the 2010 census, the population of American Falls was 4,457. The racial makeup of the city was 90.3% White, 0.3% African American, 0.7% Native American, 0.3% Asian, 0.1% Pacific Islander, 5.3% from other races, and 2.9% from two or more races. Hispanic or Latino of any race were 11.2% of the population.
The median income for a household in the city was $35,938, and the median income for a family was $41,944. The per capita income for the city was $17,845. About 14.2% of families and 17.3% of the population were below the poverty line, including 22.3% of those under age 18 and 8.2% of those age 65 or over.
Common Questions
What is Per Capita Income in American Falls?
Per Capita income in American Falls is $22,047.
What is the Median Family Income in American Falls?
Median Family Income in American Falls is $65,500.
What is the Median Household income in American Falls?
Median Household Income in American Falls is $55,465.
What is Income or Wage Gap in American Falls?
Income or Wage Gap in American Falls is 41.2%.
Women in American Falls earn 58.8 cents for every dollar earned by a man.
What is Inequality or Gini Index in American Falls?
Inequality or Gini Index in American Falls is 0.34.
What is the Total Population of American Falls?
Total Population of American Falls is 4,573.
What is the Total Male Population of American Falls?
Total Male Population of American Falls is 2,187.
What is the Total Female Population of American Falls?
Total Female Population of American Falls is 2,386.
What is the Ratio of Males per 100 Females in American Falls?
There are 91.66 Males per 100 Females in American Falls.
What is the Ratio of Females per 100 Males in American Falls?
There are 109.10 Females per 100 Males in American Falls.
What is the Median Population Age in American Falls?
Median Population Age in American Falls is 30.8 Years.
What is the Average Family Size in American Falls
Average Family Size in American Falls is 3.7 People.
What is the Average Household Size in American Falls
Average Household Size in American Falls is 3.1 People.
How Large is the Labor Force in American Falls?
There are 2,193 People in the Labor Forcein in American Falls.
What is the Percentage of People in the Labor Force in American Falls?
69.0% of People are in the Labor Force in American Falls.
What is the Unemployment Rate in American Falls?
Unemployment Rate in American Falls is 7.8%.