Monte Vista, CO Map & Demographics
Monte Vista Map
Monte Vista Overview
$27,453
PER CAPITA INCOME
$80,570
AVG FAMILY INCOME
$51,071
AVG HOUSEHOLD INCOME
3.6%
WAGE / INCOME GAP [ % ]
96.4¢/ $1
WAGE / INCOME GAP [ $ ]
0.37
INEQUALITY / GINI INDEX
4,201
TOTAL POPULATION
2,038
MALE POPULATION
2,163
FEMALE POPULATION
94.22
MALES / 100 FEMALES
106.13
FEMALES / 100 MALES
38.2
MEDIAN AGE
3.0
AVG FAMILY SIZE
2.6
AVG HOUSEHOLD SIZE
2,047
LABOR FORCE [ PEOPLE ]
61.2%
PERCENT IN LABOR FORCE
8.3%
UNEMPLOYMENT RATE
Monte Vista Zip Codes
Monte Vista Area Codes
Income in Monte Vista
Income Overview in Monte Vista
Per Capita Income in Monte Vista is $27,453, while median incomes of families and households are $80,570 and $51,071 respectively.
| Characteristic | Number | Measure |
| Per Capita Income | 4,201 | $27,453 |
| Median Family Income | 1,112 | $80,570 |
| Mean Family Income | 1,112 | $73,136 |
| Median Household Income | 1,576 | $51,071 |
| Mean Household Income | 1,576 | $61,966 |
| Income Deficit | 1,112 | $0 |
| Wage / Income Gap (%) | 4,201 | 3.61% |
| Wage / Income Gap ($) | 4,201 | 96.39¢ per $1 |
| Gini / Inequality Index | 4,201 | 0.37 |
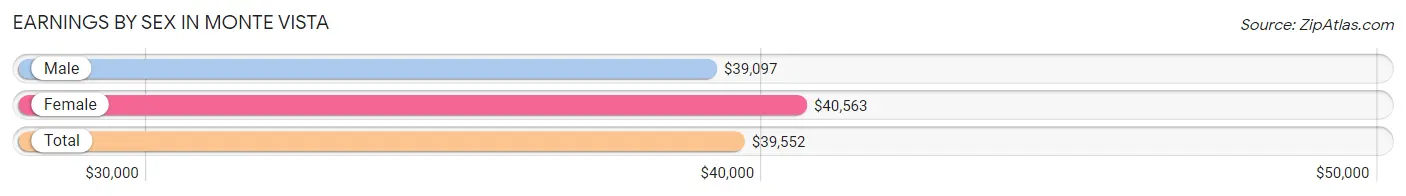
Earnings by Sex in Monte Vista
Average Earnings in Monte Vista are $39,552, $39,097 for men and $40,563 for women, a difference of 3.6%.
| Sex | Number | Average Earnings |
| Male | 1,194 (52.9%) | $39,097 |
| Female | 1,065 (47.1%) | $40,563 |
| Total | 2,259 (100.0%) | $39,552 |
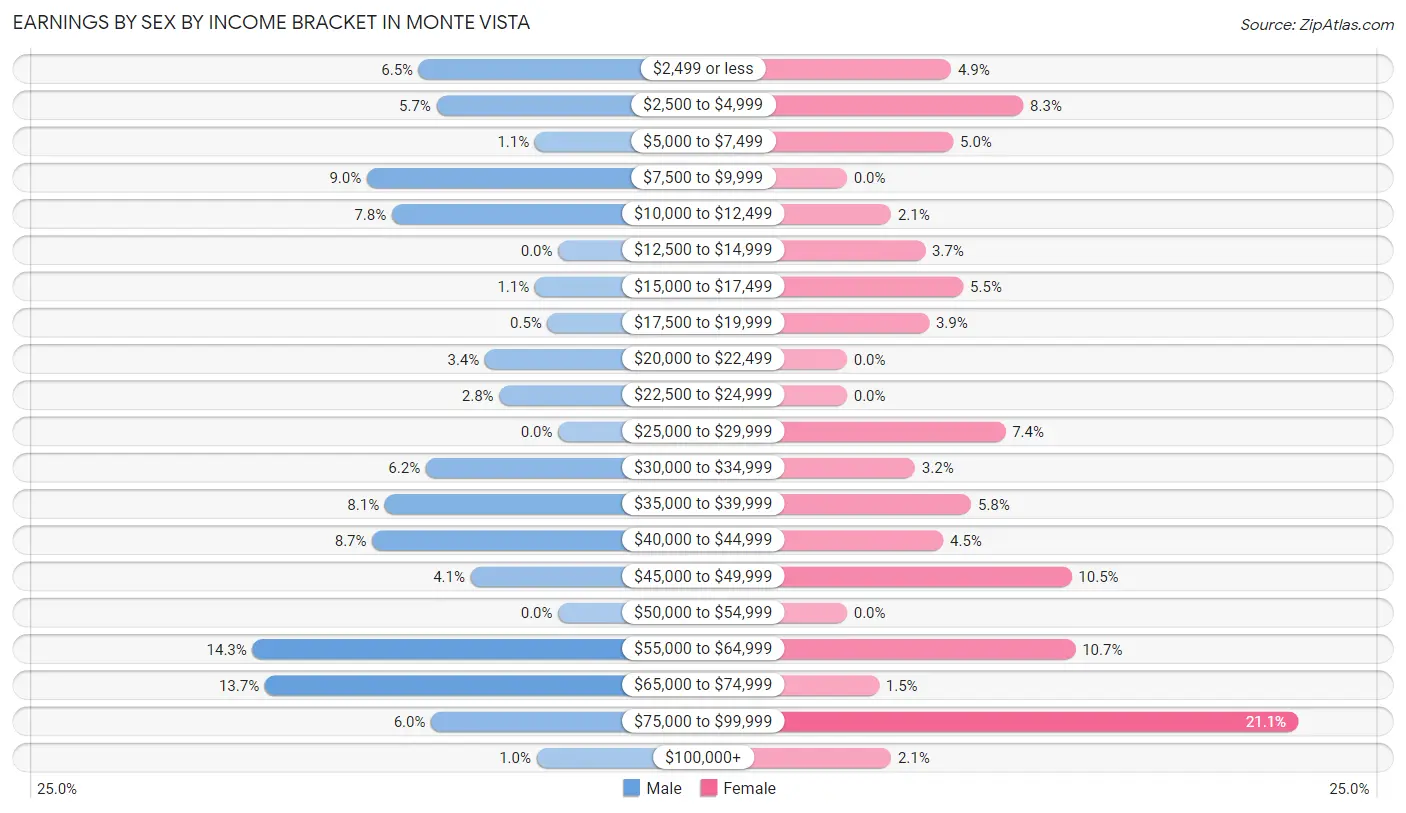
Earnings by Sex by Income Bracket in Monte Vista
The most common earnings brackets in Monte Vista are $55,000 to $64,999 for men (171 | 14.3%) and $75,000 to $99,999 for women (225 | 21.1%).
| Income | Male | Female |
| $2,499 or less | 78 (6.5%) | 52 (4.9%) |
| $2,500 to $4,999 | 68 (5.7%) | 88 (8.3%) |
| $5,000 to $7,499 | 13 (1.1%) | 53 (5.0%) |
| $7,500 to $9,999 | 107 (9.0%) | 0 (0.0%) |
| $10,000 to $12,499 | 93 (7.8%) | 22 (2.1%) |
| $12,500 to $14,999 | 0 (0.0%) | 39 (3.7%) |
| $15,000 to $17,499 | 13 (1.1%) | 58 (5.4%) |
| $17,500 to $19,999 | 6 (0.5%) | 41 (3.8%) |
| $20,000 to $22,499 | 41 (3.4%) | 0 (0.0%) |
| $22,500 to $24,999 | 33 (2.8%) | 0 (0.0%) |
| $25,000 to $29,999 | 0 (0.0%) | 79 (7.4%) |
| $30,000 to $34,999 | 74 (6.2%) | 34 (3.2%) |
| $35,000 to $39,999 | 97 (8.1%) | 62 (5.8%) |
| $40,000 to $44,999 | 104 (8.7%) | 48 (4.5%) |
| $45,000 to $49,999 | 49 (4.1%) | 112 (10.5%) |
| $50,000 to $54,999 | 0 (0.0%) | 0 (0.0%) |
| $55,000 to $64,999 | 171 (14.3%) | 114 (10.7%) |
| $65,000 to $74,999 | 164 (13.7%) | 16 (1.5%) |
| $75,000 to $99,999 | 71 (5.9%) | 225 (21.1%) |
| $100,000+ | 12 (1.0%) | 22 (2.1%) |
| Total | 1,194 (100.0%) | 1,065 (100.0%) |
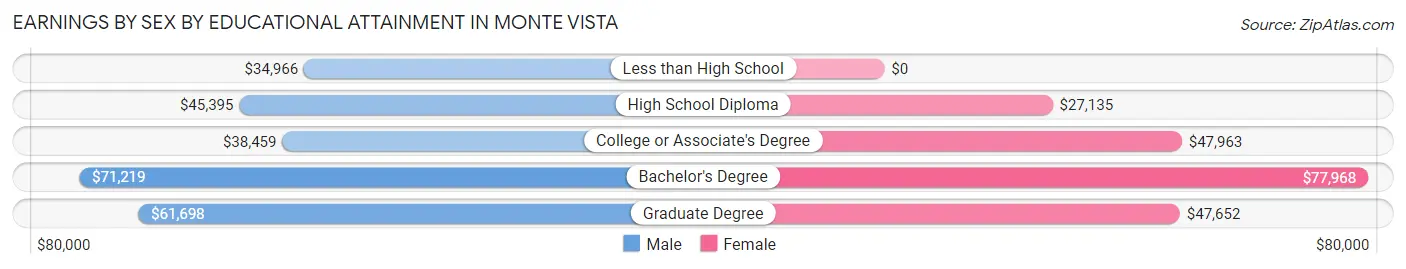
Earnings by Sex by Educational Attainment in Monte Vista
Average earnings in Monte Vista are $44,279 for men and $48,204 for women, a difference of 8.1%. Men with an educational attainment of bachelor's degree enjoy the highest average annual earnings of $71,219, while those with less than high school education earn the least with $34,966. Women with an educational attainment of bachelor's degree earn the most with the average annual earnings of $77,968, while those with high school diploma education have the smallest earnings of $27,135.
| Educational Attainment | Male Income | Female Income |
| Less than High School | $34,966 | $0 |
| High School Diploma | $45,395 | $27,135 |
| College or Associate's Degree | $38,459 | $47,963 |
| Bachelor's Degree | $71,219 | $77,968 |
| Graduate Degree | $61,698 | $47,652 |
| Total | $44,279 | $48,204 |
Family Income in Monte Vista
Family Income Brackets in Monte Vista
According to the Monte Vista family income data, there are 282 families falling into the $75,000 to $99,999 income range, which is the most common income bracket and makes up 25.4% of all families.
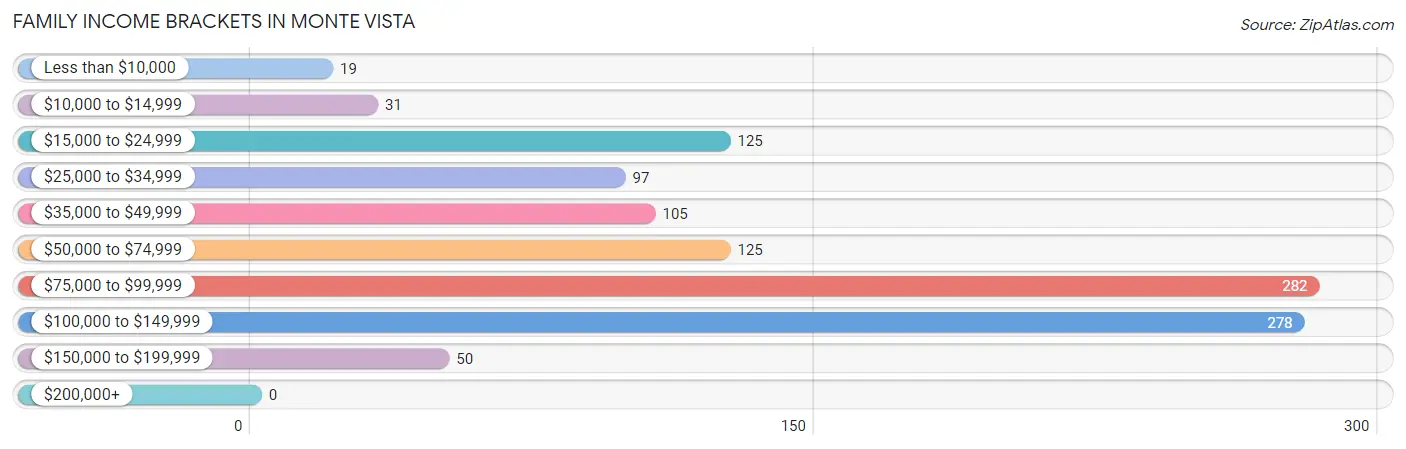
| Income Bracket | # Families | % Families |
| Less than $10,000 | 19 | 1.7% |
| $10,000 to $14,999 | 31 | 2.8% |
| $15,000 to $24,999 | 125 | 11.2% |
| $25,000 to $34,999 | 97 | 8.7% |
| $35,000 to $49,999 | 105 | 9.4% |
| $50,000 to $74,999 | 125 | 11.2% |
| $75,000 to $99,999 | 282 | 25.4% |
| $100,000 to $149,999 | 278 | 25.0% |
| $150,000 to $199,999 | 50 | 4.5% |
| $200,000+ | 0 | 0.0% |
Family Income by Famaliy Size in Monte Vista
4-person families (78 | 7.0%) account for the highest median family income in Monte Vista with $81,103 per family, while 2-person families (557 | 50.1%) have the highest median income of $36,223 per family member.
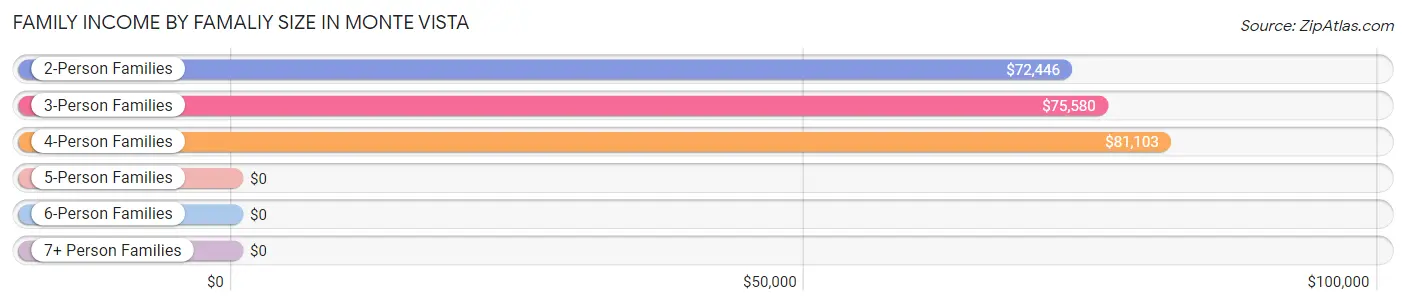
| Income Bracket | # Families | Median Income |
| 2-Person Families | 557 (50.1%) | $72,446 |
| 3-Person Families | 411 (37.0%) | $75,580 |
| 4-Person Families | 78 (7.0%) | $81,103 |
| 5-Person Families | 66 (5.9%) | $0 |
| 6-Person Families | 0 (0.0%) | $0 |
| 7+ Person Families | 0 (0.0%) | $0 |
| Total | 1,112 (100.0%) | $80,570 |
Family Income by Number of Earners in Monte Vista
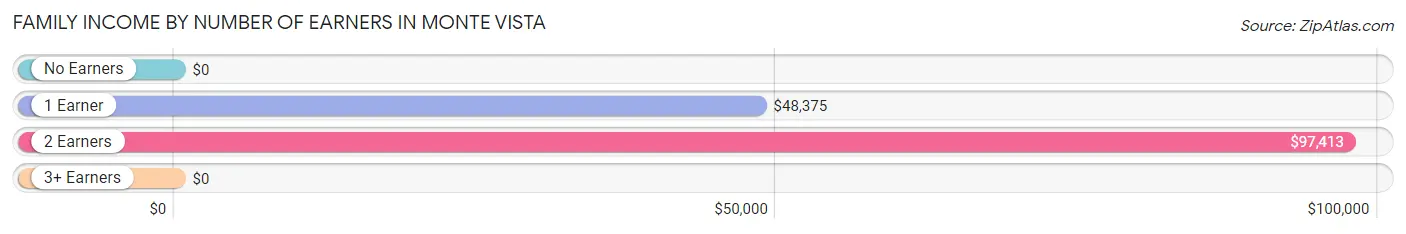
| Number of Earners | # Families | Median Income |
| No Earners | 114 (10.2%) | $0 |
| 1 Earner | 437 (39.3%) | $48,375 |
| 2 Earners | 561 (50.4%) | $97,413 |
| 3+ Earners | 0 (0.0%) | $0 |
| Total | 1,112 (100.0%) | $80,570 |
Household Income in Monte Vista
Household Income Brackets in Monte Vista
With 318 households falling in the category, the $100,000 to $149,999 income range is the most frequent in Monte Vista, accounting for 20.2% of all households.
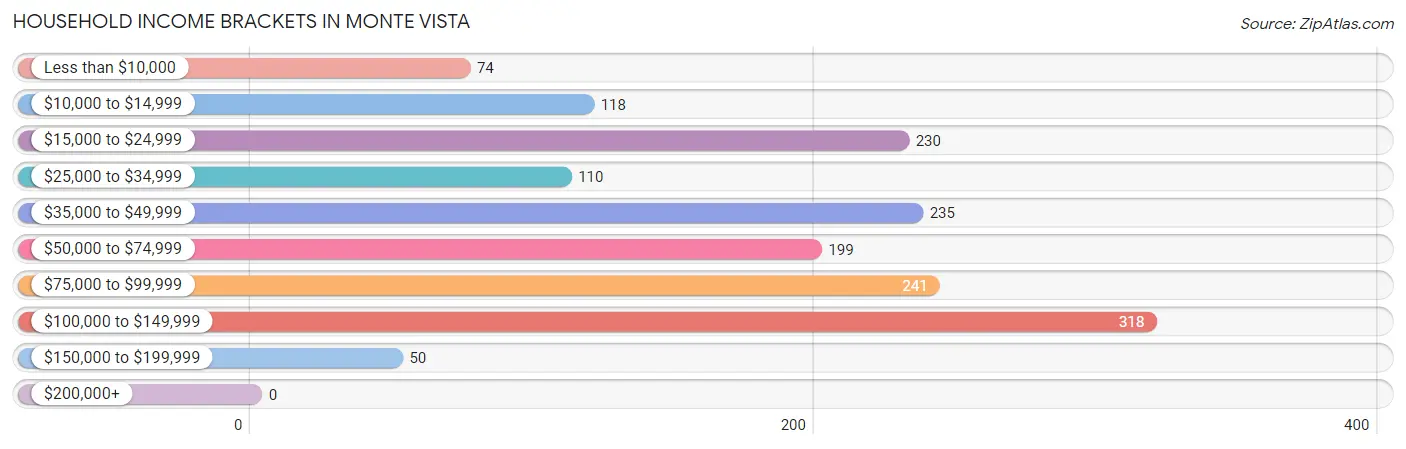
| Income Bracket | # Households | % Households |
| Less than $10,000 | 74 | 4.7% |
| $10,000 to $14,999 | 118 | 7.5% |
| $15,000 to $24,999 | 230 | 14.6% |
| $25,000 to $34,999 | 110 | 7.0% |
| $35,000 to $49,999 | 235 | 14.9% |
| $50,000 to $74,999 | 199 | 12.6% |
| $75,000 to $99,999 | 241 | 15.3% |
| $100,000 to $149,999 | 318 | 20.2% |
| $150,000 to $199,999 | 50 | 3.2% |
| $200,000+ | 0 | 0.0% |
Household Income by Householder Age in Monte Vista
The median household income in Monte Vista is $51,071, with the highest median household income of $81,213 found in the 25 to 44 years age bracket for the primary householder. A total of 587 households (37.2%) fall into this category. Meanwhile, the 15 to 24 years age bracket for the primary householder has the lowest median household income of $23,340, with 145 households (9.2%) in this group.
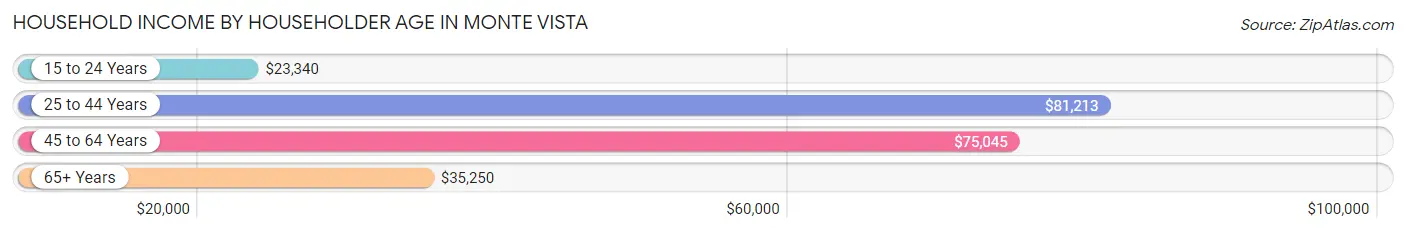
| Income Bracket | # Households | Median Income |
| 15 to 24 Years | 145 (9.2%) | $23,340 |
| 25 to 44 Years | 587 (37.2%) | $81,213 |
| 45 to 64 Years | 505 (32.0%) | $75,045 |
| 65+ Years | 339 (21.5%) | $35,250 |
| Total | 1,576 (100.0%) | $51,071 |
Poverty in Monte Vista
Income Below Poverty by Sex and Age in Monte Vista
With 16.9% poverty level for males and 17.4% for females among the residents of Monte Vista, under 5 year old males and 18 to 24 year old females are the most vulnerable to poverty, with 56 males (100.0%) and 108 females (70.6%) in their respective age groups living below the poverty level.
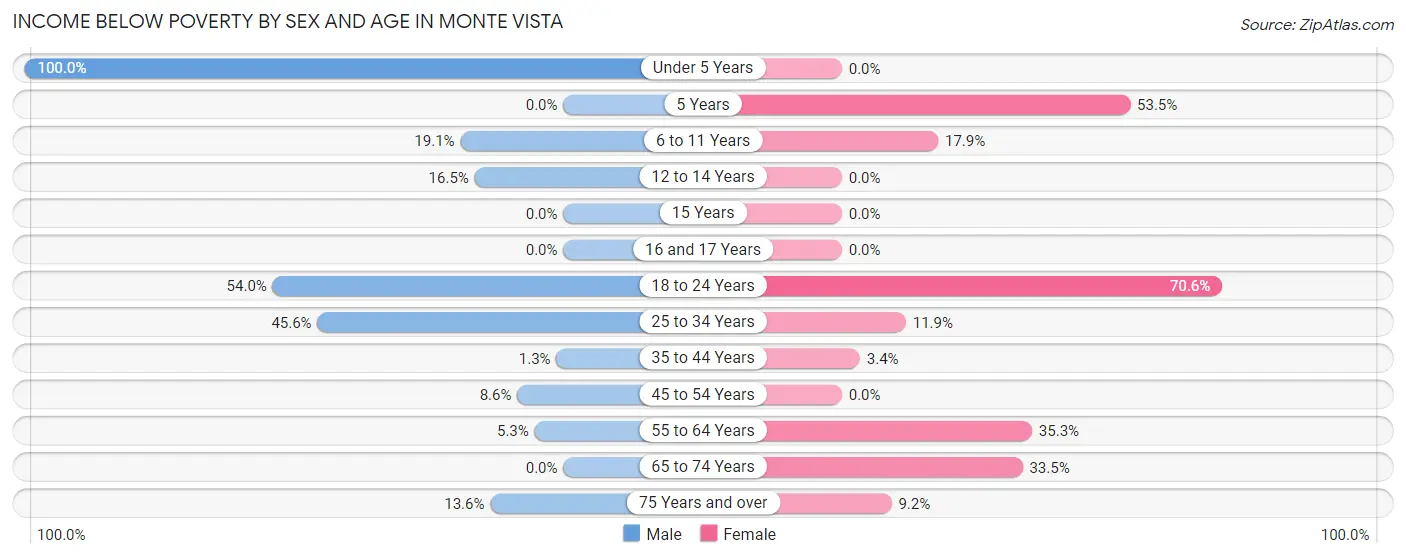
| Age Bracket | Male | Female |
| Under 5 Years | 56 (100.0%) | 0 (0.0%) |
| 5 Years | 0 (0.0%) | 38 (53.5%) |
| 6 to 11 Years | 30 (19.1%) | 37 (17.9%) |
| 12 to 14 Years | 26 (16.5%) | 0 (0.0%) |
| 15 Years | 0 (0.0%) | 0 (0.0%) |
| 16 and 17 Years | 0 (0.0%) | 0 (0.0%) |
| 18 to 24 Years | 109 (54.0%) | 108 (70.6%) |
| 25 to 34 Years | 68 (45.6%) | 24 (11.9%) |
| 35 to 44 Years | 6 (1.3%) | 19 (3.4%) |
| 45 to 54 Years | 13 (8.6%) | 0 (0.0%) |
| 55 to 64 Years | 17 (5.3%) | 66 (35.3%) |
| 65 to 74 Years | 0 (0.0%) | 55 (33.5%) |
| 75 Years and over | 16 (13.6%) | 20 (9.2%) |
| Total | 341 (16.9%) | 367 (17.4%) |
Income Above Poverty by Sex and Age in Monte Vista
According to the poverty statistics in Monte Vista, males aged 15 years and females aged under 5 years are the age groups that are most secure financially, with 100.0% of males and 100.0% of females in these age groups living above the poverty line.
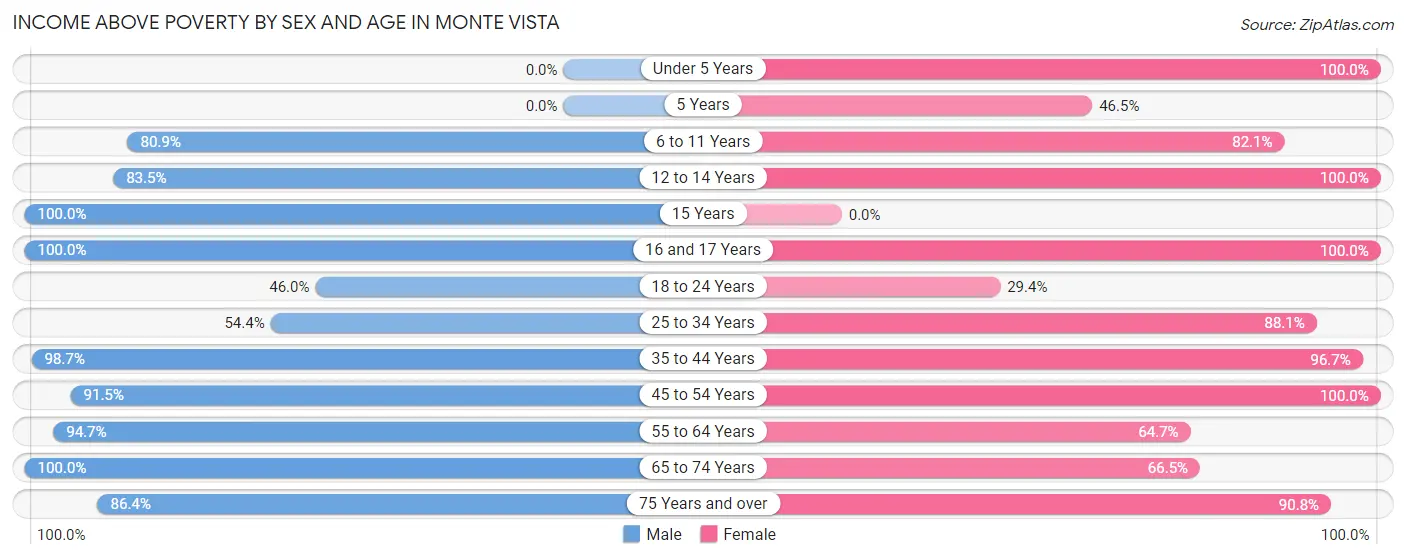
| Age Bracket | Male | Female |
| Under 5 Years | 0 (0.0%) | 52 (100.0%) |
| 5 Years | 0 (0.0%) | 33 (46.5%) |
| 6 to 11 Years | 127 (80.9%) | 170 (82.1%) |
| 12 to 14 Years | 132 (83.5%) | 33 (100.0%) |
| 15 Years | 88 (100.0%) | 0 (0.0%) |
| 16 and 17 Years | 79 (100.0%) | 54 (100.0%) |
| 18 to 24 Years | 93 (46.0%) | 45 (29.4%) |
| 25 to 34 Years | 81 (54.4%) | 178 (88.1%) |
| 35 to 44 Years | 461 (98.7%) | 548 (96.7%) |
| 45 to 54 Years | 139 (91.4%) | 200 (100.0%) |
| 55 to 64 Years | 302 (94.7%) | 121 (64.7%) |
| 65 to 74 Years | 70 (100.0%) | 109 (66.5%) |
| 75 Years and over | 102 (86.4%) | 197 (90.8%) |
| Total | 1,674 (83.1%) | 1,740 (82.6%) |
Income Below Poverty Among Married-Couple Families in Monte Vista
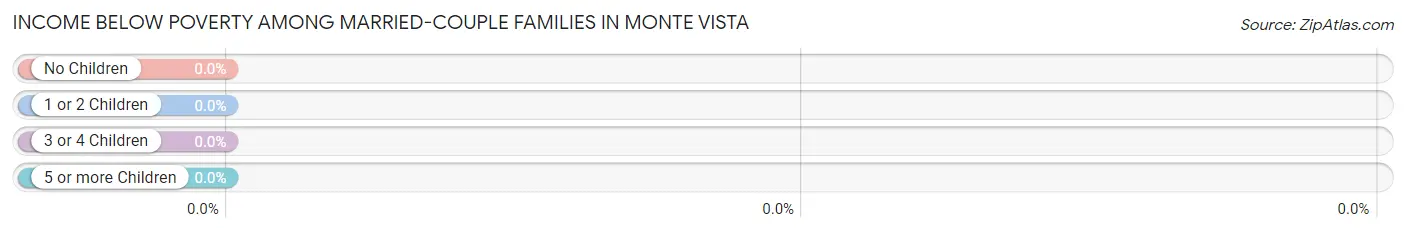
| Children | Above Poverty | Below Poverty |
| No Children | 452 (100.0%) | 0 (0.0%) |
| 1 or 2 Children | 201 (100.0%) | 0 (0.0%) |
| 3 or 4 Children | 25 (100.0%) | 0 (0.0%) |
| 5 or more Children | 0 (0.0%) | 0 (0.0%) |
| Total | 678 (100.0%) | 0 (0.0%) |
Income Below Poverty Among Single-Parent Households in Monte Vista
According to the poverty data in Monte Vista, 2.6% or 2 single-father households and 20.7% or 74 single-mother households are living below the poverty line. Among single-father households, those with no children have the highest poverty rate, with 2 households (5.6%) experiencing poverty. Likewise, among single-mother households, those with 3 or 4 children have the highest poverty rate, with 24 households (100.0%) falling below the poverty line.
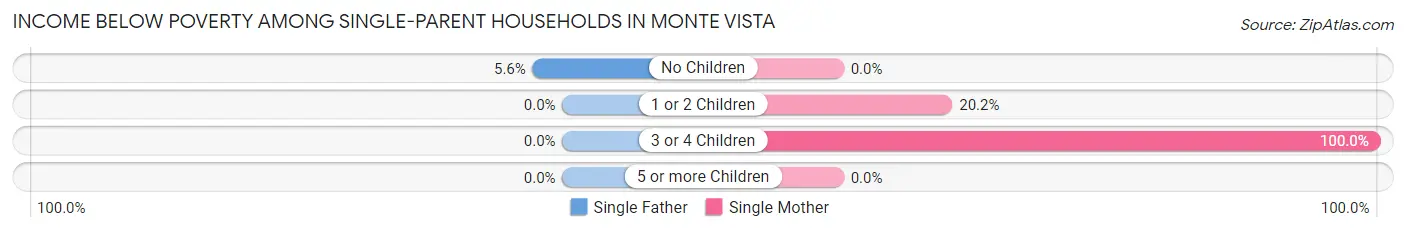
| Children | Single Father | Single Mother |
| No Children | 2 (5.6%) | 0 (0.0%) |
| 1 or 2 Children | 0 (0.0%) | 50 (20.2%) |
| 3 or 4 Children | 0 (0.0%) | 24 (100.0%) |
| 5 or more Children | 0 (0.0%) | 0 (0.0%) |
| Total | 2 (2.6%) | 74 (20.7%) |
Income Below Poverty Among Married-Couple vs Single-Parent Households in Monte Vista
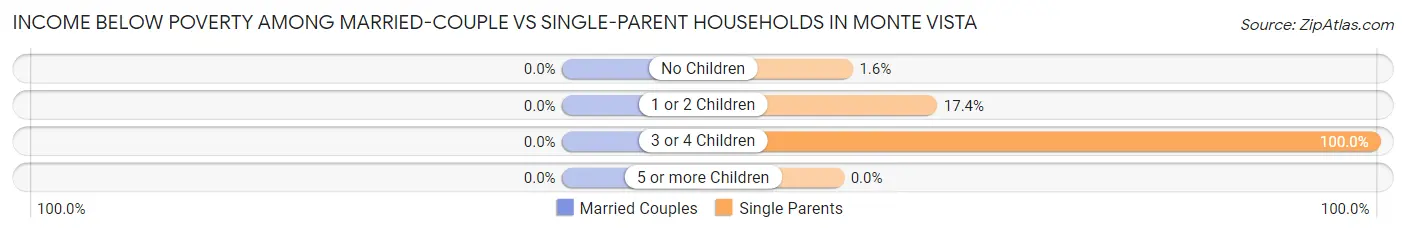
| Children | Married-Couple Families | Single-Parent Households |
| No Children | 0 (0.0%) | 2 (1.6%) |
| 1 or 2 Children | 0 (0.0%) | 50 (17.4%) |
| 3 or 4 Children | 0 (0.0%) | 24 (100.0%) |
| 5 or more Children | 0 (0.0%) | 0 (0.0%) |
| Total | 0 (0.0%) | 76 (17.5%) |
Race in Monte Vista
The most populous races in Monte Vista are White / Caucasian (2,863 | 68.1%), Hispanic or Latino (2,708 | 64.5%), and Two or more Races (769 | 18.3%).
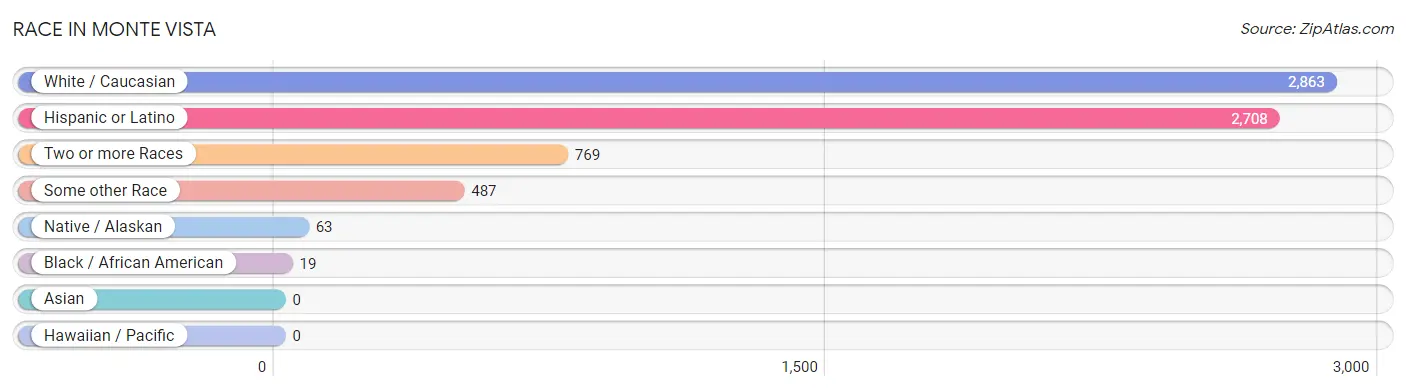
| Race | # Population | % Population |
| Asian | 0 | 0.0% |
| Black / African American | 19 | 0.4% |
| Hawaiian / Pacific | 0 | 0.0% |
| Hispanic or Latino | 2,708 | 64.5% |
| Native / Alaskan | 63 | 1.5% |
| White / Caucasian | 2,863 | 68.1% |
| Two or more Races | 769 | 18.3% |
| Some other Race | 487 | 11.6% |
| Total | 4,201 | 100.0% |
Ancestry in Monte Vista
The most populous ancestries reported in Monte Vista are Mexican (1,401 | 33.4%), German (620 | 14.8%), Spanish (563 | 13.4%), Italian (411 | 9.8%), and Spaniard (389 | 9.3%), together accounting for 80.5% of all Monte Vista residents.
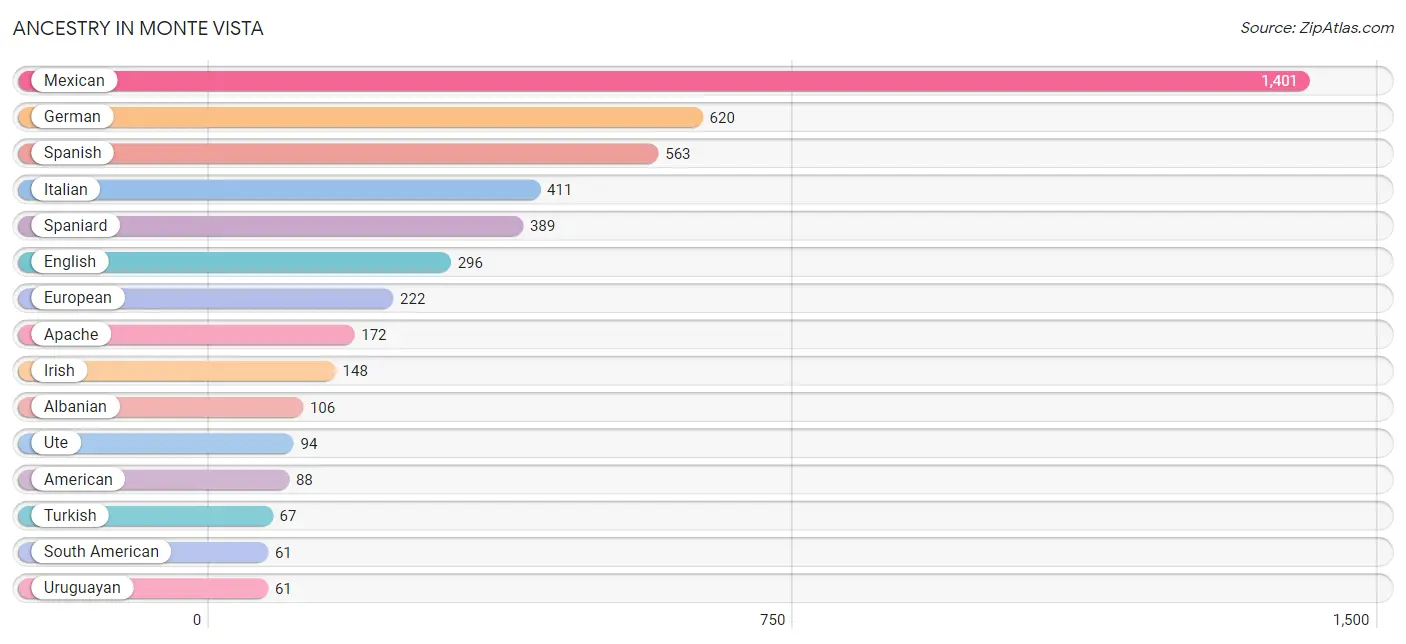
| Ancestry | # Population | % Population |
| Albanian | 106 | 2.5% |
| American | 88 | 2.1% |
| Apache | 172 | 4.1% |
| Austrian | 19 | 0.4% |
| Cherokee | 22 | 0.5% |
| Czech | 13 | 0.3% |
| English | 296 | 7.0% |
| European | 222 | 5.3% |
| French | 28 | 0.7% |
| German | 620 | 14.8% |
| Irish | 148 | 3.5% |
| Italian | 411 | 9.8% |
| Mexican | 1,401 | 33.4% |
| Navajo | 3 | 0.1% |
| Northern European | 31 | 0.7% |
| Norwegian | 51 | 1.2% |
| Polish | 22 | 0.5% |
| Puerto Rican | 33 | 0.8% |
| Scotch-Irish | 10 | 0.2% |
| Scottish | 52 | 1.2% |
| Sioux | 17 | 0.4% |
| South American | 61 | 1.5% |
| Spaniard | 389 | 9.3% |
| Spanish | 563 | 13.4% |
| Spanish American | 53 | 1.3% |
| Spanish American Indian | 22 | 0.5% |
| Swedish | 56 | 1.3% |
| Turkish | 67 | 1.6% |
| Uruguayan | 61 | 1.5% |
| Ute | 94 | 2.2% |
| Welsh | 50 | 1.2% | View All 31 Rows |
Immigrants in Monte Vista
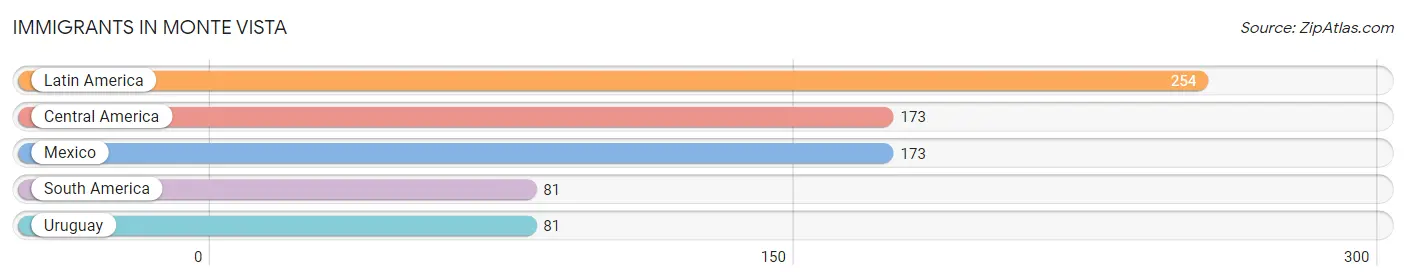
The most numerous immigrant groups reported in Monte Vista came from Latin America (254 | 6.0%), Central America (173 | 4.1%), Mexico (173 | 4.1%), South America (81 | 1.9%), and Uruguay (81 | 1.9%), together accounting for 18.2% of all Monte Vista residents.
| Immigration Origin | # Population | % Population |
| Central America | 173 | 4.1% |
| Latin America | 254 | 6.0% |
| Mexico | 173 | 4.1% |
| South America | 81 | 1.9% |
| Uruguay | 81 | 1.9% | View All 5 Rows |
Sex and Age in Monte Vista
Sex and Age in Monte Vista
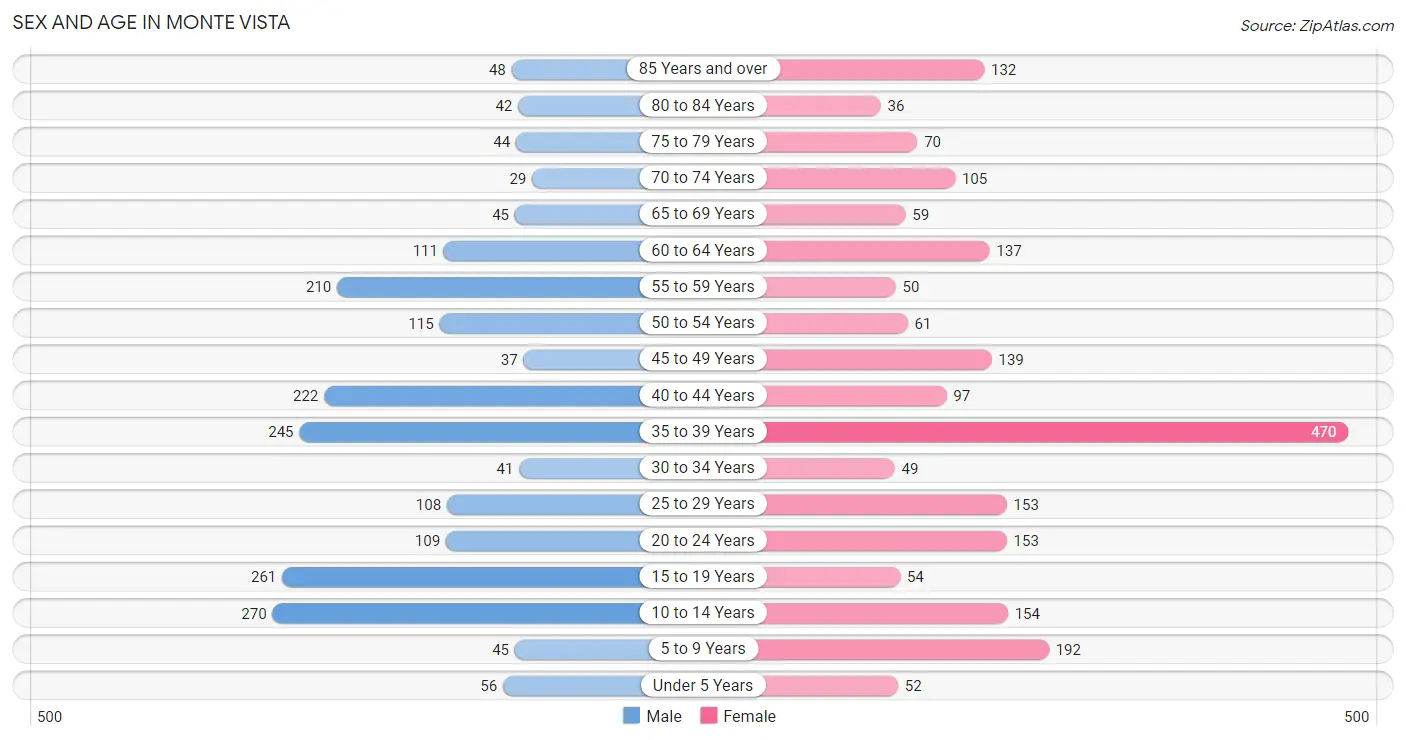
The most populous age groups in Monte Vista are 10 to 14 Years (270 | 13.3%) for men and 35 to 39 Years (470 | 21.7%) for women.
| Age Bracket | Male | Female |
| Under 5 Years | 56 (2.8%) | 52 (2.4%) |
| 5 to 9 Years | 45 (2.2%) | 192 (8.9%) |
| 10 to 14 Years | 270 (13.3%) | 154 (7.1%) |
| 15 to 19 Years | 261 (12.8%) | 54 (2.5%) |
| 20 to 24 Years | 109 (5.3%) | 153 (7.1%) |
| 25 to 29 Years | 108 (5.3%) | 153 (7.1%) |
| 30 to 34 Years | 41 (2.0%) | 49 (2.3%) |
| 35 to 39 Years | 245 (12.0%) | 470 (21.7%) |
| 40 to 44 Years | 222 (10.9%) | 97 (4.5%) |
| 45 to 49 Years | 37 (1.8%) | 139 (6.4%) |
| 50 to 54 Years | 115 (5.6%) | 61 (2.8%) |
| 55 to 59 Years | 210 (10.3%) | 50 (2.3%) |
| 60 to 64 Years | 111 (5.4%) | 137 (6.3%) |
| 65 to 69 Years | 45 (2.2%) | 59 (2.7%) |
| 70 to 74 Years | 29 (1.4%) | 105 (4.9%) |
| 75 to 79 Years | 44 (2.2%) | 70 (3.2%) |
| 80 to 84 Years | 42 (2.1%) | 36 (1.7%) |
| 85 Years and over | 48 (2.4%) | 132 (6.1%) |
| Total | 2,038 (100.0%) | 2,163 (100.0%) |
Families and Households in Monte Vista
Median Family Size in Monte Vista
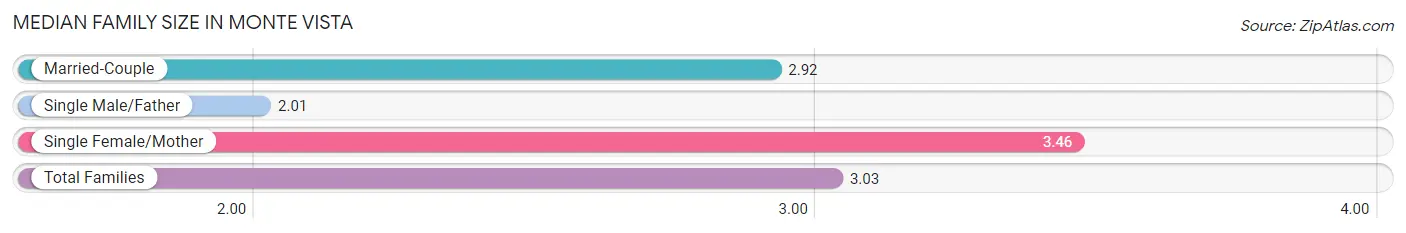
The median family size in Monte Vista is 3.03 persons per family, with single female/mother families (357 | 32.1%) accounting for the largest median family size of 3.46 persons per family. On the other hand, single male/father families (77 | 6.9%) represent the smallest median family size with 2.01 persons per family.
| Family Type | # Families | Family Size |
| Married-Couple | 678 (61.0%) | 2.92 |
| Single Male/Father | 77 (6.9%) | 2.01 |
| Single Female/Mother | 357 (32.1%) | 3.46 |
| Total Families | 1,112 (100.0%) | 3.03 |
Median Household Size in Monte Vista
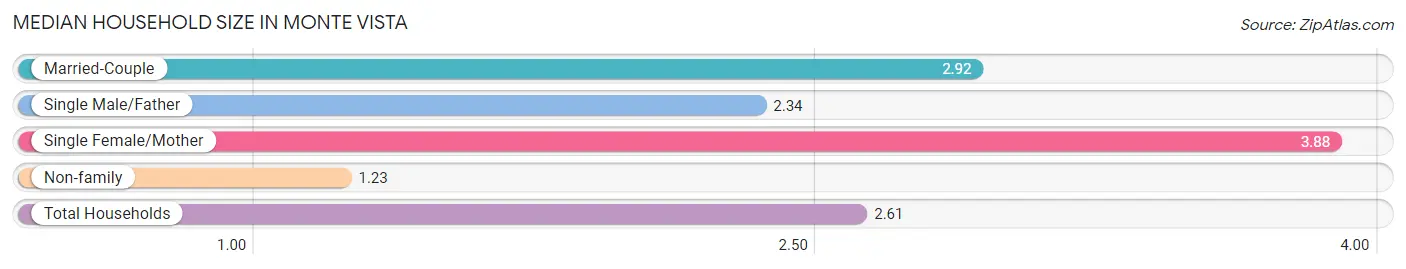
The median household size in Monte Vista is 2.61 persons per household, with single female/mother households (357 | 22.7%) accounting for the largest median household size of 3.88 persons per household. non-family households (464 | 29.4%) represent the smallest median household size with 1.23 persons per household.
| Household Type | # Households | Household Size |
| Married-Couple | 678 (43.0%) | 2.92 |
| Single Male/Father | 77 (4.9%) | 2.34 |
| Single Female/Mother | 357 (22.7%) | 3.88 |
| Non-family | 464 (29.4%) | 1.23 |
| Total Households | 1,576 (100.0%) | 2.61 |
Household Size by Marriage Status in Monte Vista
Out of a total of 1,576 households in Monte Vista, 1,112 (70.6%) are family households, while 464 (29.4%) are nonfamily households. The most numerous type of family households are 3-person households, comprising 518, and the most common type of nonfamily households are 1-person households, comprising 333.
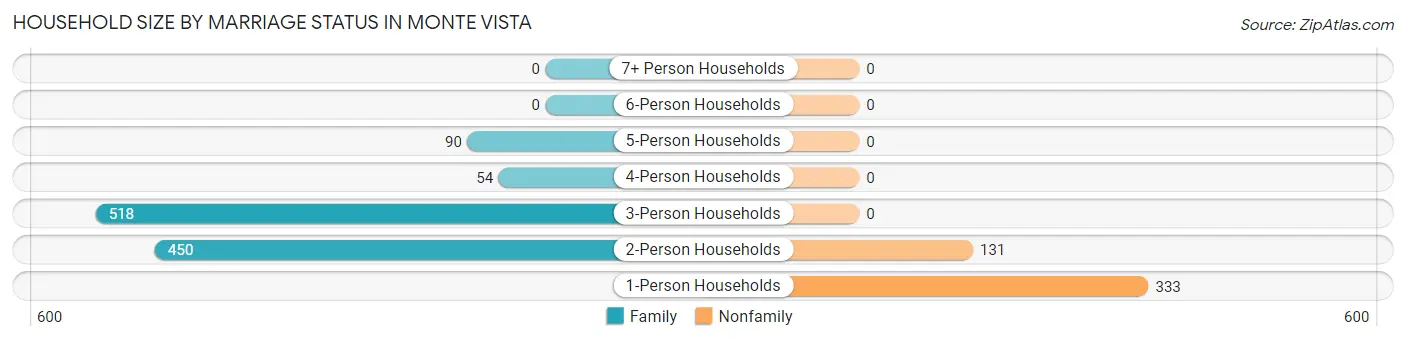
| Household Size | Family Households | Nonfamily Households |
| 1-Person Households | - | 333 (21.1%) |
| 2-Person Households | 450 (28.5%) | 131 (8.3%) |
| 3-Person Households | 518 (32.9%) | 0 (0.0%) |
| 4-Person Households | 54 (3.4%) | 0 (0.0%) |
| 5-Person Households | 90 (5.7%) | 0 (0.0%) |
| 6-Person Households | 0 (0.0%) | 0 (0.0%) |
| 7+ Person Households | 0 (0.0%) | 0 (0.0%) |
| Total | 1,112 (70.6%) | 464 (29.4%) |
Female Fertility in Monte Vista
Fertility by Age in Monte Vista
Average fertility rate in Monte Vista is 53.0 births per 1,000 women. Women in the age bracket of 20 to 34 years have the highest fertility rate with 166.0 births per 1,000 women. Women in the age bracket of 20 to 34 years acount for 100.0% of all women with births.
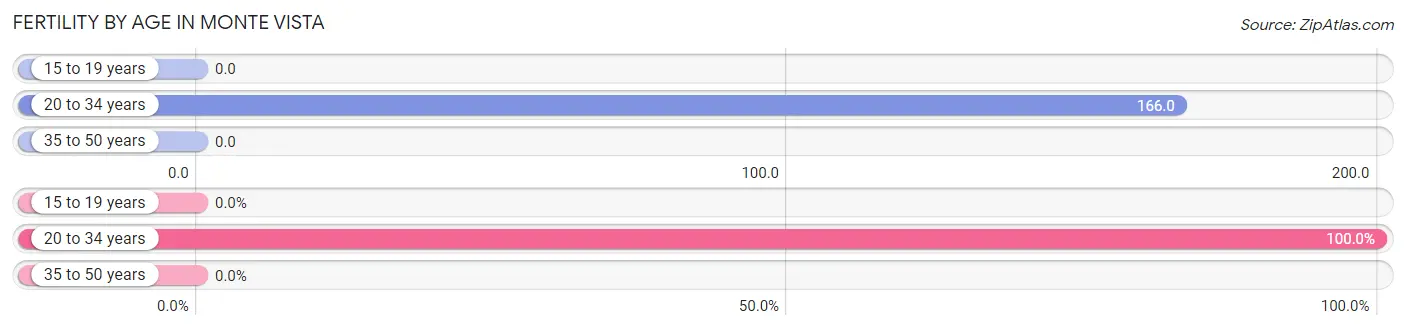
| Age Bracket | Women with Births | Births / 1,000 Women |
| 15 to 19 years | 0 (0.0%) | 0.0 |
| 20 to 34 years | 59 (100.0%) | 166.0 |
| 35 to 50 years | 0 (0.0%) | 0.0 |
| Total | 59 (100.0%) | 53.0 |
Fertility by Age by Marriage Status in Monte Vista
47.5% of women with births (59) in Monte Vista are married. The highest percentage of unmarried women with births falls into 20 to 34 years age bracket with 52.5% of them unmarried at the time of birth, while the lowest percentage of unmarried women with births belong to 20 to 34 years age bracket with 52.5% of them unmarried.
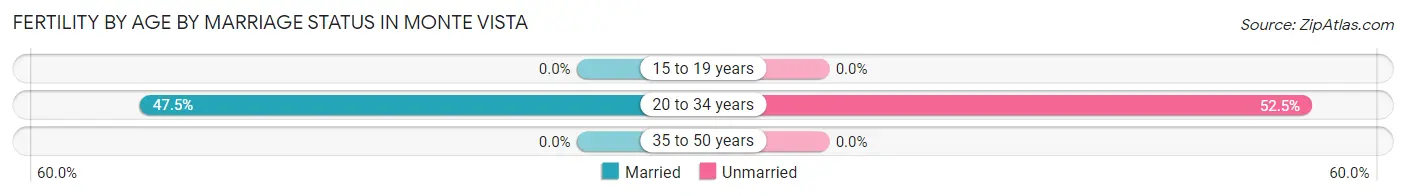
| Age Bracket | Married | Unmarried |
| 15 to 19 years | 0 (0.0%) | 0 (0.0%) |
| 20 to 34 years | 28 (47.5%) | 31 (52.5%) |
| 35 to 50 years | 0 (0.0%) | 0 (0.0%) |
| Total | 28 (47.5%) | 31 (52.5%) |
Fertility by Education in Monte Vista
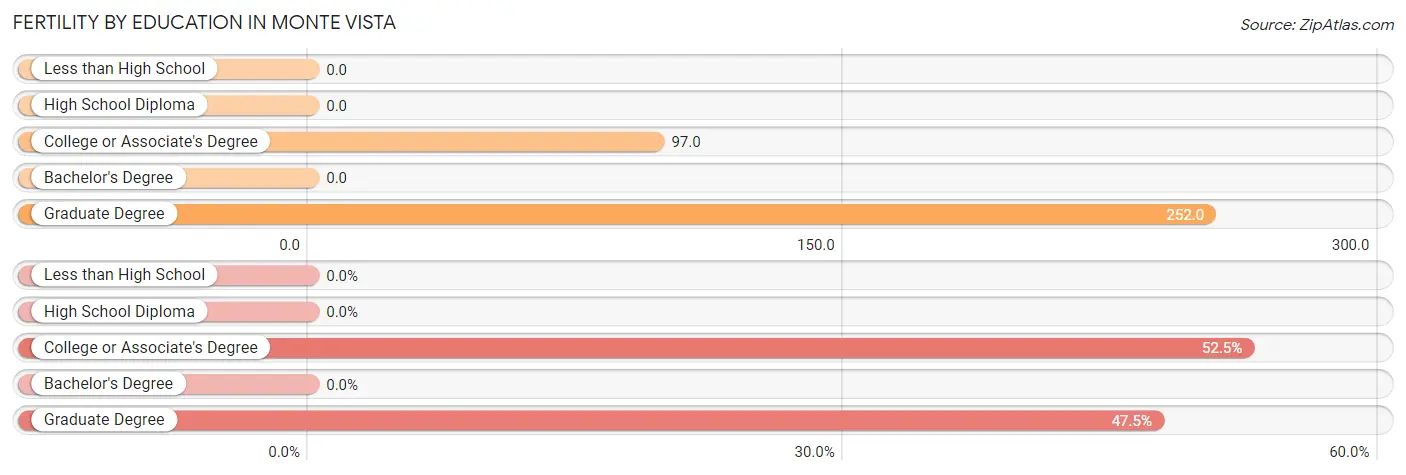
| Educational Attainment | Women with Births | Births / 1,000 Women |
| Less than High School | 0 (0.0%) | 0.0 |
| High School Diploma | 0 (0.0%) | 0.0 |
| College or Associate's Degree | 31 (52.5%) | 97.0 |
| Bachelor's Degree | 0 (0.0%) | 0.0 |
| Graduate Degree | 28 (47.5%) | 252.0 |
| Total | 59 (100.0%) | 53.0 |
Fertility by Education by Marriage Status in Monte Vista
52.5% of women with births in Monte Vista are unmarried. Women with the educational attainment of graduate degree are most likely to be married with 100.0% of them married at childbirth, while women with the educational attainment of college or associate's degree are least likely to be married with 100.0% of them unmarried at childbirth.
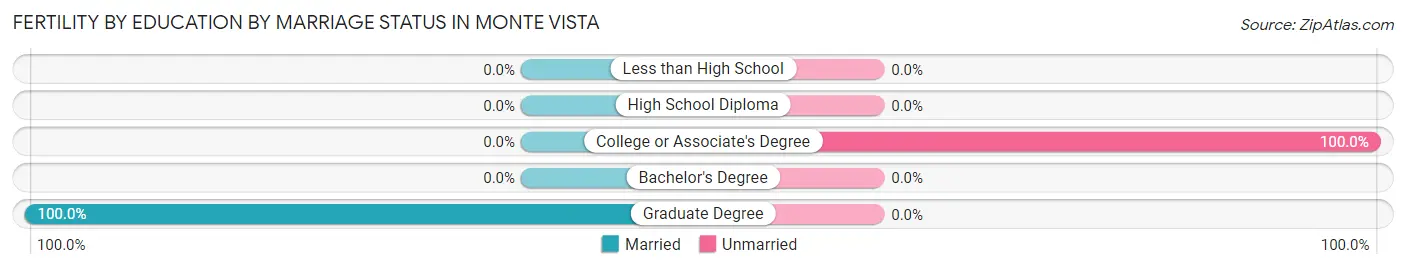
| Educational Attainment | Married | Unmarried |
| Less than High School | 0 (0.0%) | 0 (0.0%) |
| High School Diploma | 0 (0.0%) | 0 (0.0%) |
| College or Associate's Degree | 0 (0.0%) | 31 (100.0%) |
| Bachelor's Degree | 0 (0.0%) | 0 (0.0%) |
| Graduate Degree | 28 (100.0%) | 0 (0.0%) |
| Total | 28 (47.5%) | 31 (52.5%) |
Employment Characteristics in Monte Vista
Employment by Class of Employer in Monte Vista
Among the 1,657 employed individuals in Monte Vista, private company employees (946 | 57.1%), local government employees (285 | 17.2%), and not-for-profit organizations (199 | 12.0%) make up the most common classes of employment.
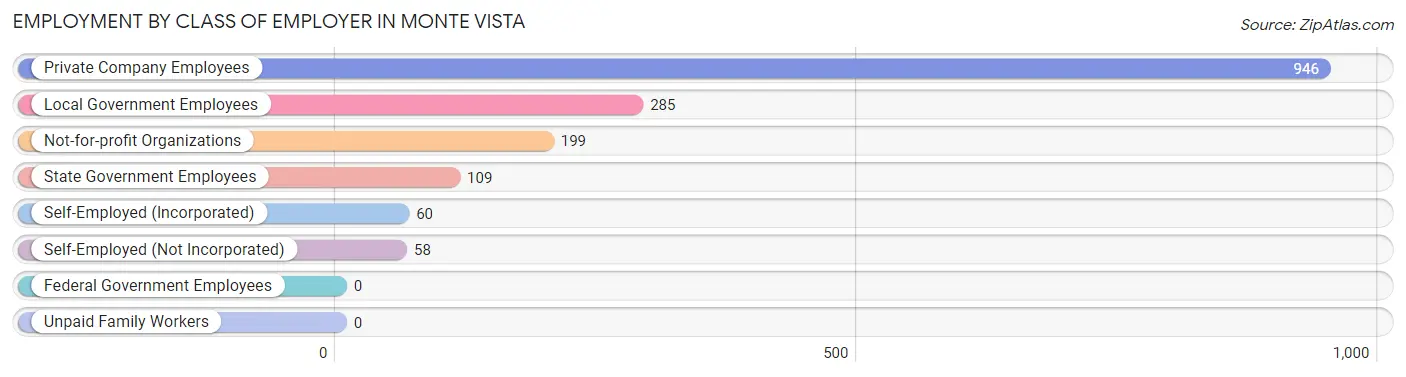
| Employer Class | # Employees | % Employees |
| Private Company Employees | 946 | 57.1% |
| Self-Employed (Incorporated) | 60 | 3.6% |
| Self-Employed (Not Incorporated) | 58 | 3.5% |
| Not-for-profit Organizations | 199 | 12.0% |
| Local Government Employees | 285 | 17.2% |
| State Government Employees | 109 | 6.6% |
| Federal Government Employees | 0 | 0.0% |
| Unpaid Family Workers | 0 | 0.0% |
| Total | 1,657 | 100.0% |
Employment Status by Age in Monte Vista
According to the labor force statistics for Monte Vista, out of the total population over 16 years of age (3,344), 61.2% or 2,047 individuals are in the labor force, with 8.3% or 170 of them unemployed. The age group with the highest labor force participation rate is 30 to 34 years, with 100.0% or 90 individuals in the labor force. Within the labor force, the 20 to 24 years age range has the highest percentage of unemployed individuals, with 19.7% or 42 of them being unemployed.
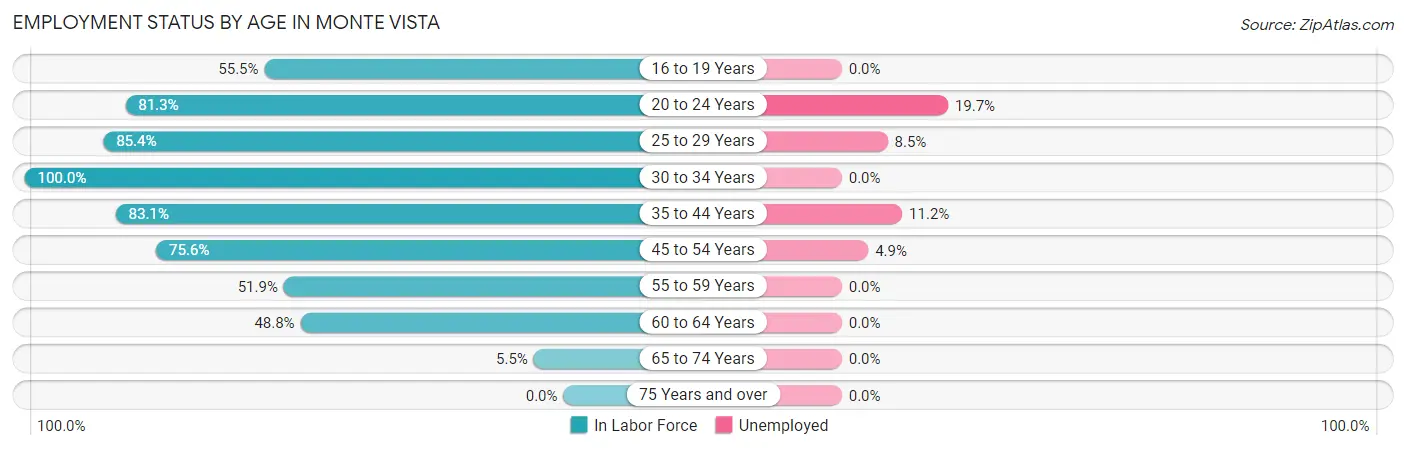
| Age Bracket | In Labor Force | Unemployed |
| 16 to 19 Years | 126 (55.5%) | 0 (0.0%) |
| 20 to 24 Years | 213 (81.3%) | 42 (19.7%) |
| 25 to 29 Years | 223 (85.4%) | 19 (8.5%) |
| 30 to 34 Years | 90 (100.0%) | 0 (0.0%) |
| 35 to 44 Years | 859 (83.1%) | 96 (11.2%) |
| 45 to 54 Years | 266 (75.6%) | 13 (4.9%) |
| 55 to 59 Years | 135 (51.9%) | 0 (0.0%) |
| 60 to 64 Years | 121 (48.8%) | 0 (0.0%) |
| 65 to 74 Years | 13 (5.5%) | 0 (0.0%) |
| 75 Years and over | 0 (0.0%) | 0 (0.0%) |
| Total | 2,047 (61.2%) | 170 (8.3%) |
Employment Status by Educational Attainment in Monte Vista
According to labor force statistics for Monte Vista, 75.5% of individuals (1,695) out of the total population between 25 and 64 years of age (2,245) are in the labor force, with 7.6% or 129 of them being unemployed. The group with the highest labor force participation rate are those with the educational attainment of less than high school, with 92.8% or 271 individuals in the labor force. Within the labor force, individuals with college / associate degree education have the highest percentage of unemployment, with 27.3% or 81 of them being unemployed.
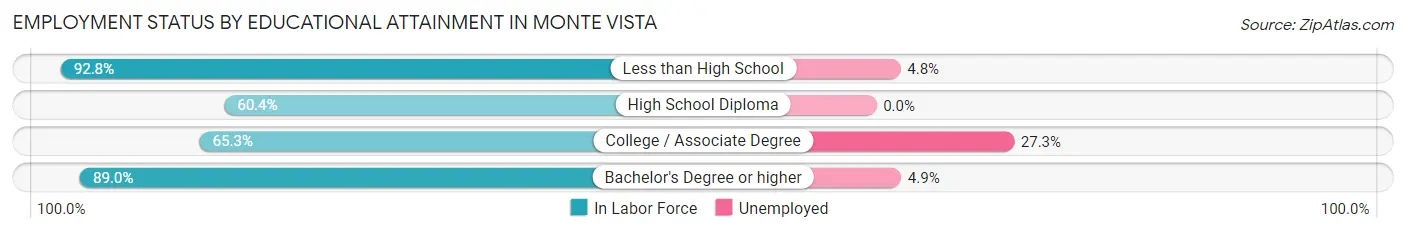
| Educational Attainment | In Labor Force | Unemployed |
| Less than High School | 271 (92.8%) | 14 (4.8%) |
| High School Diploma | 437 (60.4%) | 0 (0.0%) |
| College / Associate Degree | 297 (65.3%) | 124 (27.3%) |
| Bachelor's Degree or higher | 689 (89.0%) | 38 (4.9%) |
| Total | 1,695 (75.5%) | 171 (7.6%) |
Employment Occupations by Sex in Monte Vista
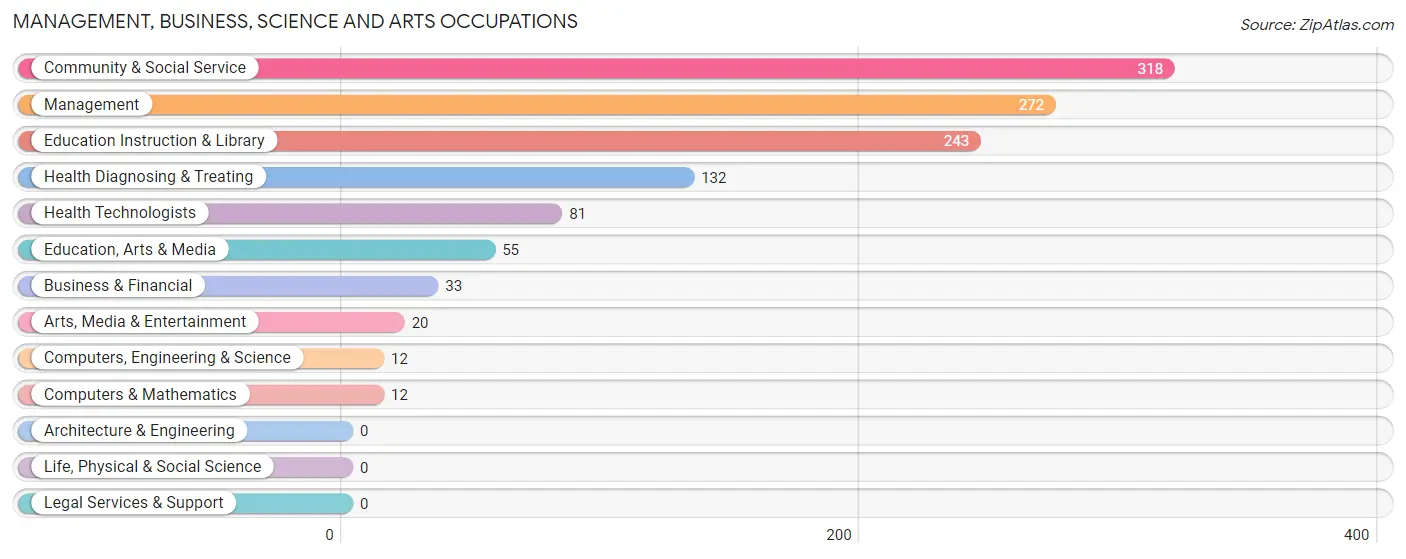
Management, Business, Science and Arts Occupations
The most common Management, Business, Science and Arts occupations in Monte Vista are Community & Social Service (318 | 17.0%), Management (272 | 14.5%), Education Instruction & Library (243 | 13.0%), Health Diagnosing & Treating (132 | 7.0%), and Health Technologists (81 | 4.3%).
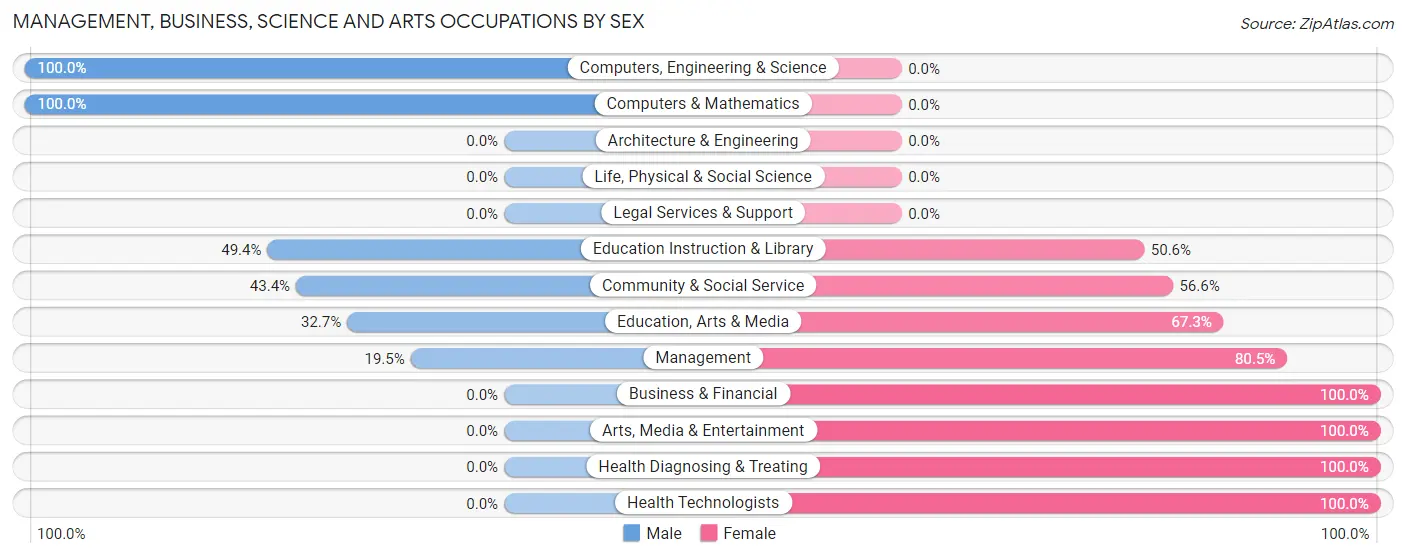
Management, Business, Science and Arts Occupations by Sex
Within the Management, Business, Science and Arts occupations in Monte Vista, the most male-oriented occupations are Computers, Engineering & Science (100.0%), Computers & Mathematics (100.0%), and Education Instruction & Library (49.4%), while the most female-oriented occupations are Business & Financial (100.0%), Arts, Media & Entertainment (100.0%), and Health Diagnosing & Treating (100.0%).
| Occupation | Male | Female |
| Management | 53 (19.5%) | 219 (80.5%) |
| Business & Financial | 0 (0.0%) | 33 (100.0%) |
| Computers, Engineering & Science | 12 (100.0%) | 0 (0.0%) |
| Computers & Mathematics | 12 (100.0%) | 0 (0.0%) |
| Architecture & Engineering | 0 (0.0%) | 0 (0.0%) |
| Life, Physical & Social Science | 0 (0.0%) | 0 (0.0%) |
| Community & Social Service | 138 (43.4%) | 180 (56.6%) |
| Education, Arts & Media | 18 (32.7%) | 37 (67.3%) |
| Legal Services & Support | 0 (0.0%) | 0 (0.0%) |
| Education Instruction & Library | 120 (49.4%) | 123 (50.6%) |
| Arts, Media & Entertainment | 0 (0.0%) | 20 (100.0%) |
| Health Diagnosing & Treating | 0 (0.0%) | 132 (100.0%) |
| Health Technologists | 0 (0.0%) | 81 (100.0%) |
| Total (Category) | 203 (26.5%) | 564 (73.5%) |
| Total (Overall) | 988 (52.7%) | 888 (47.3%) |
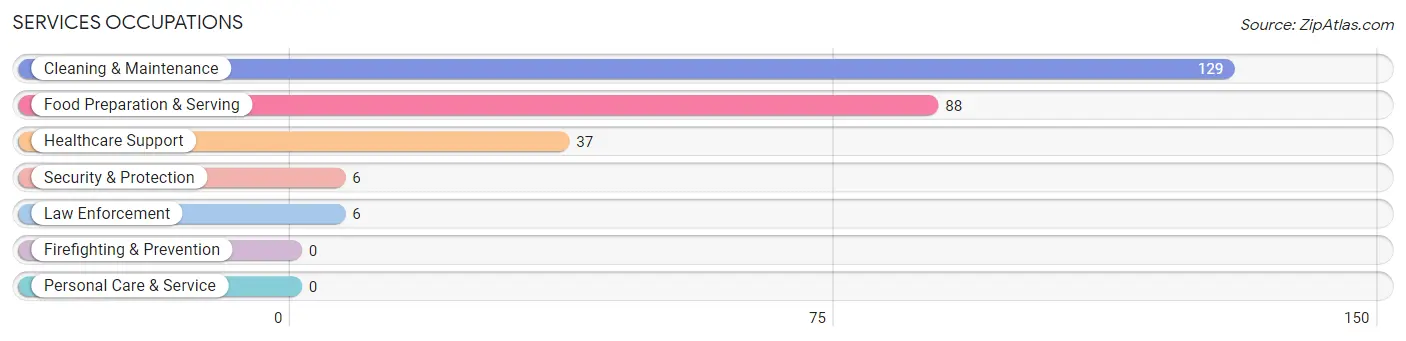
Services Occupations
The most common Services occupations in Monte Vista are Cleaning & Maintenance (129 | 6.9%), Food Preparation & Serving (88 | 4.7%), Healthcare Support (37 | 2.0%), Security & Protection (6 | 0.3%), and Law Enforcement (6 | 0.3%).
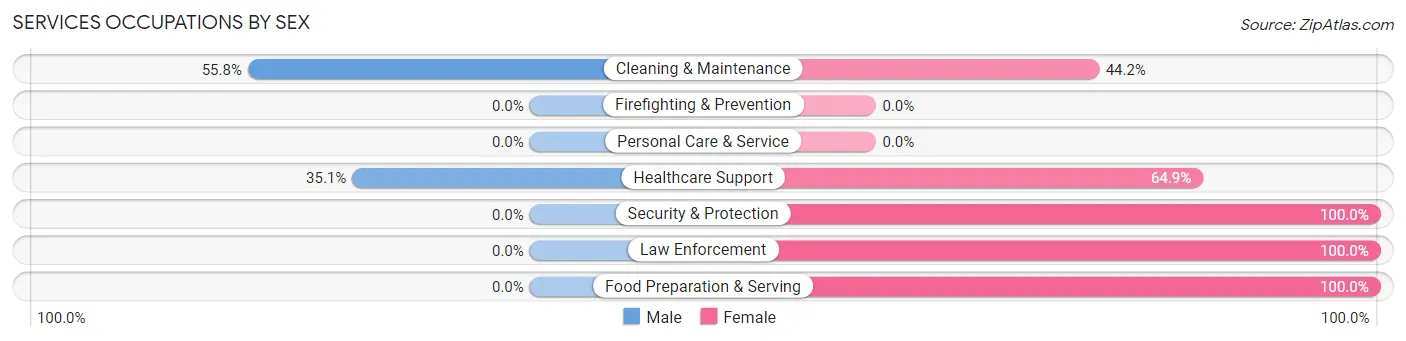
Services Occupations by Sex
Within the Services occupations in Monte Vista, the most male-oriented occupations are Cleaning & Maintenance (55.8%), and Healthcare Support (35.1%), while the most female-oriented occupations are Security & Protection (100.0%), Law Enforcement (100.0%), and Food Preparation & Serving (100.0%).
| Occupation | Male | Female |
| Healthcare Support | 13 (35.1%) | 24 (64.9%) |
| Security & Protection | 0 (0.0%) | 6 (100.0%) |
| Firefighting & Prevention | 0 (0.0%) | 0 (0.0%) |
| Law Enforcement | 0 (0.0%) | 6 (100.0%) |
| Food Preparation & Serving | 0 (0.0%) | 88 (100.0%) |
| Cleaning & Maintenance | 72 (55.8%) | 57 (44.2%) |
| Personal Care & Service | 0 (0.0%) | 0 (0.0%) |
| Total (Category) | 85 (32.7%) | 175 (67.3%) |
| Total (Overall) | 988 (52.7%) | 888 (47.3%) |
Sales and Office Occupations
The most common Sales and Office occupations in Monte Vista are Sales & Related (231 | 12.3%), and Office & Administration (138 | 7.4%).
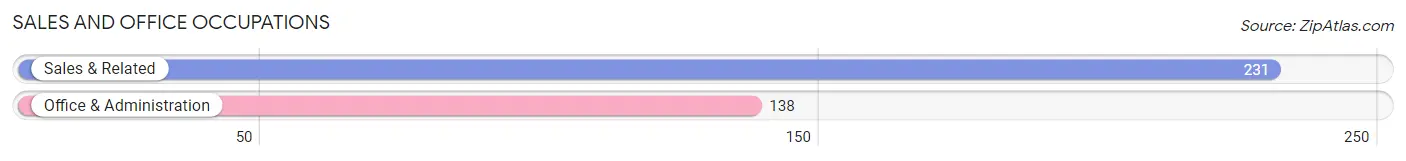
Sales and Office Occupations by Sex

| Occupation | Male | Female |
| Sales & Related | 220 (95.2%) | 11 (4.8%) |
| Office & Administration | 0 (0.0%) | 138 (100.0%) |
| Total (Category) | 220 (59.6%) | 149 (40.4%) |
| Total (Overall) | 988 (52.7%) | 888 (47.3%) |
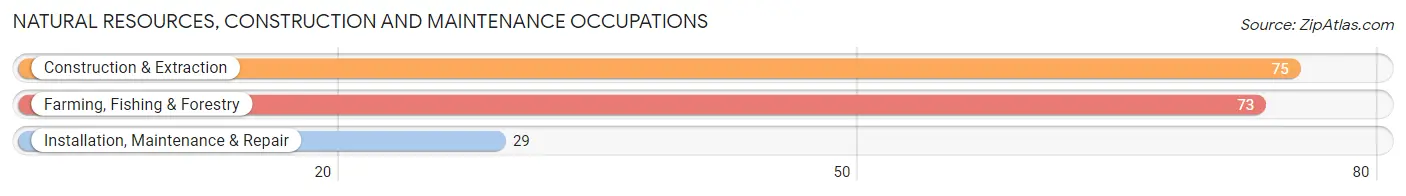
Natural Resources, Construction and Maintenance Occupations
The most common Natural Resources, Construction and Maintenance occupations in Monte Vista are Construction & Extraction (75 | 4.0%), Farming, Fishing & Forestry (73 | 3.9%), and Installation, Maintenance & Repair (29 | 1.5%).
Natural Resources, Construction and Maintenance Occupations by Sex
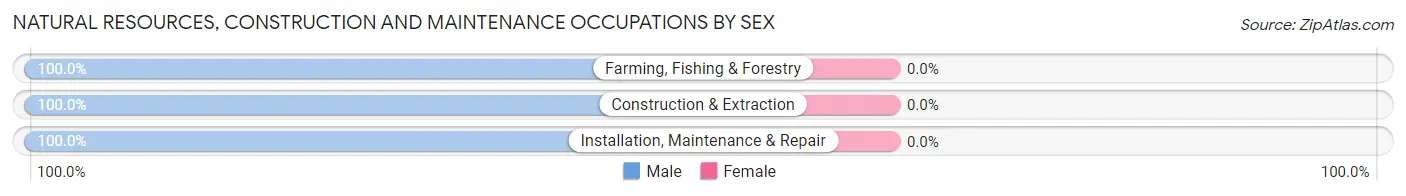
| Occupation | Male | Female |
| Farming, Fishing & Forestry | 73 (100.0%) | 0 (0.0%) |
| Construction & Extraction | 75 (100.0%) | 0 (0.0%) |
| Installation, Maintenance & Repair | 29 (100.0%) | 0 (0.0%) |
| Total (Category) | 177 (100.0%) | 0 (0.0%) |
| Total (Overall) | 988 (52.7%) | 888 (47.3%) |
Production, Transportation and Moving Occupations
The most common Production, Transportation and Moving occupations in Monte Vista are Production (131 | 7.0%), Transportation (88 | 4.7%), and Material Moving (84 | 4.5%).
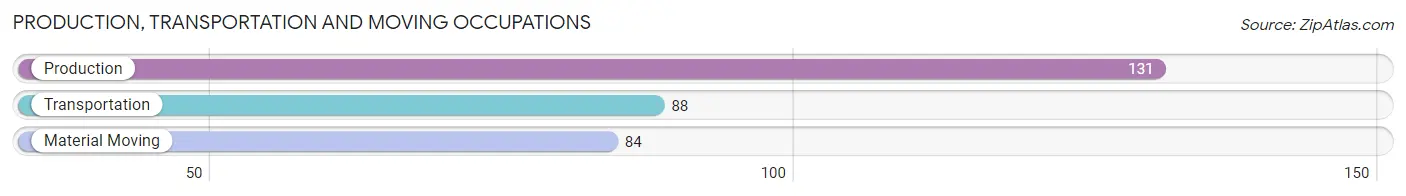
Production, Transportation and Moving Occupations by Sex
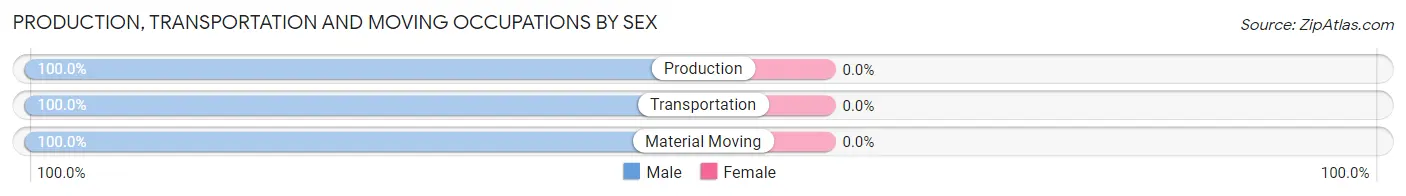
| Occupation | Male | Female |
| Production | 131 (100.0%) | 0 (0.0%) |
| Transportation | 88 (100.0%) | 0 (0.0%) |
| Material Moving | 84 (100.0%) | 0 (0.0%) |
| Total (Category) | 303 (100.0%) | 0 (0.0%) |
| Total (Overall) | 988 (52.7%) | 888 (47.3%) |
Employment Industries by Sex in Monte Vista
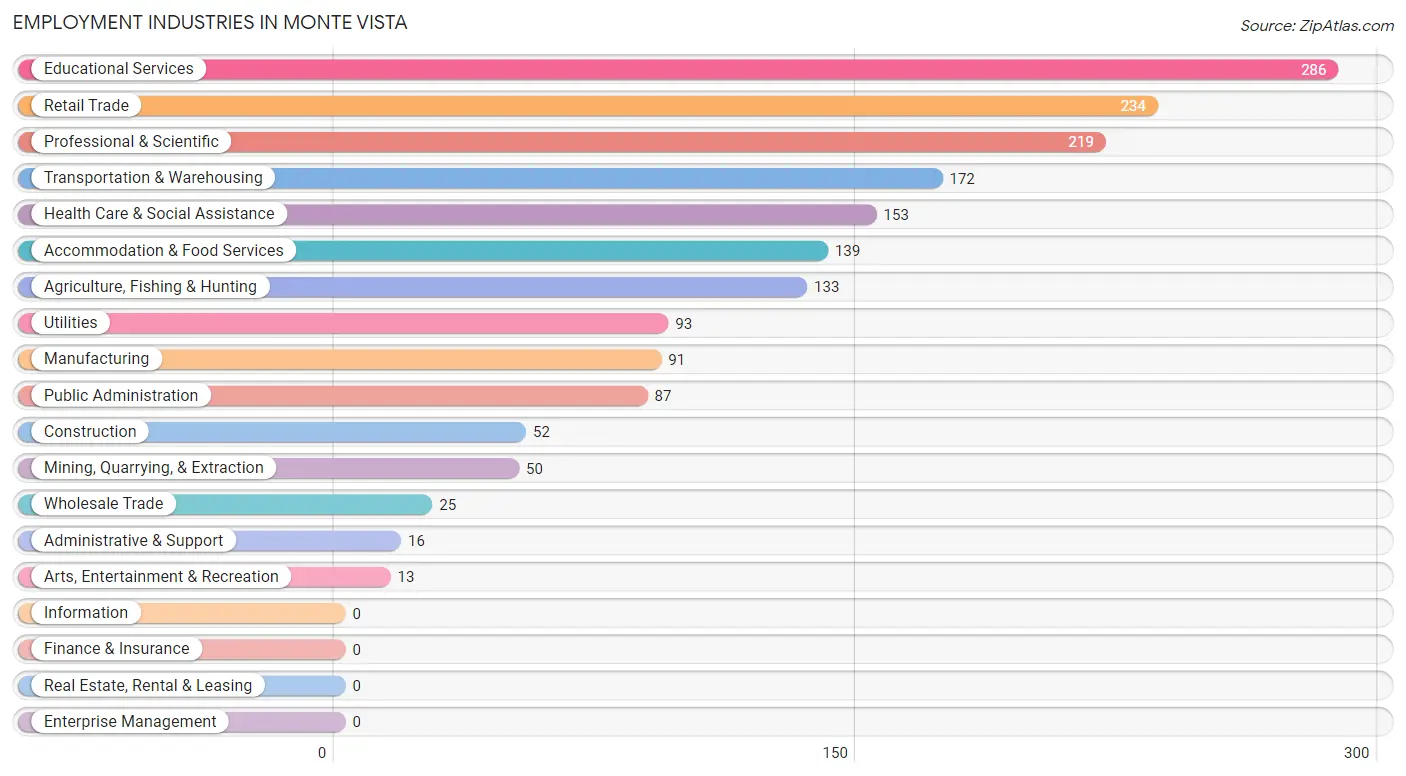
Employment Industries in Monte Vista
The major employment industries in Monte Vista include Educational Services (286 | 15.2%), Retail Trade (234 | 12.5%), Professional & Scientific (219 | 11.7%), Transportation & Warehousing (172 | 9.2%), and Health Care & Social Assistance (153 | 8.2%).
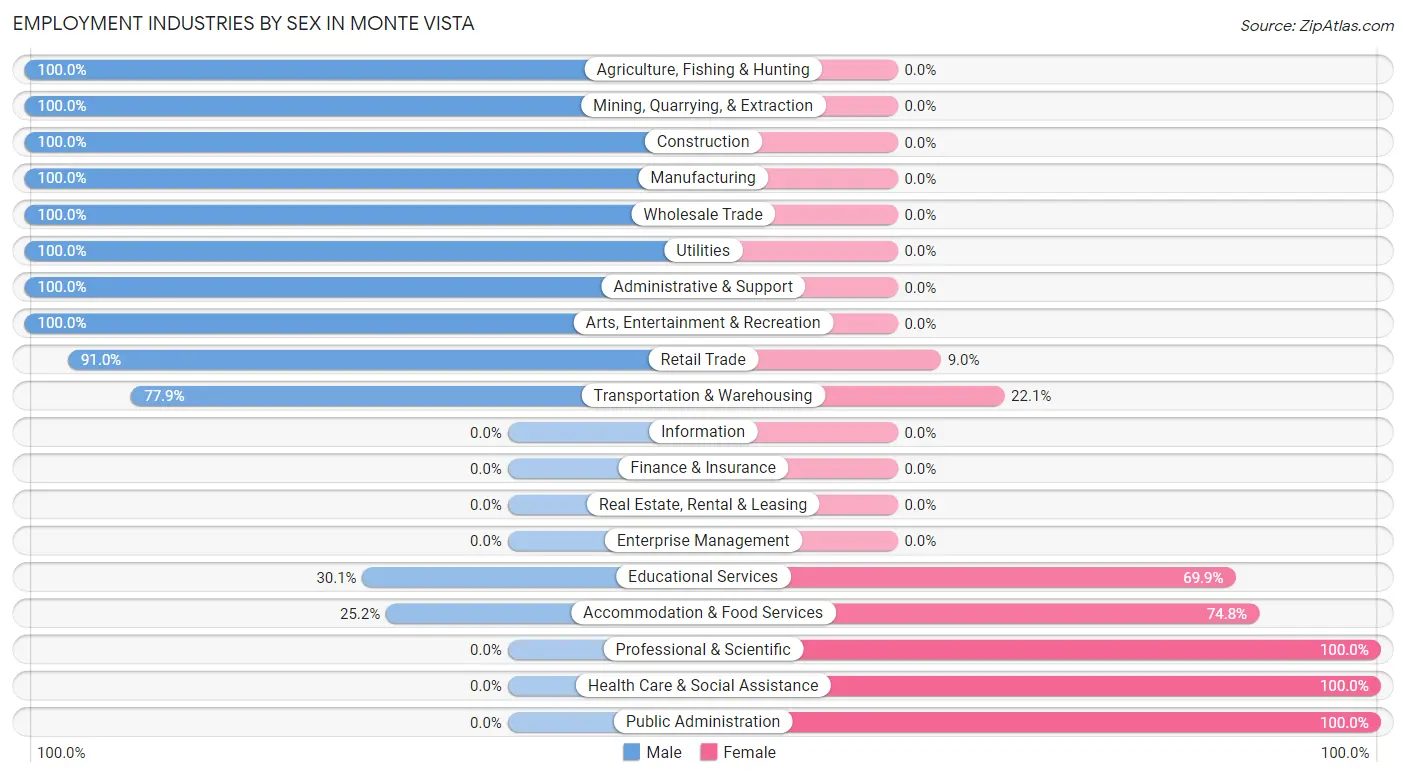
Employment Industries by Sex in Monte Vista
The Monte Vista industries that see more men than women are Agriculture, Fishing & Hunting (100.0%), Mining, Quarrying, & Extraction (100.0%), and Construction (100.0%), whereas the industries that tend to have a higher number of women are Professional & Scientific (100.0%), Health Care & Social Assistance (100.0%), and Public Administration (100.0%).
| Industry | Male | Female |
| Agriculture, Fishing & Hunting | 133 (100.0%) | 0 (0.0%) |
| Mining, Quarrying, & Extraction | 50 (100.0%) | 0 (0.0%) |
| Construction | 52 (100.0%) | 0 (0.0%) |
| Manufacturing | 91 (100.0%) | 0 (0.0%) |
| Wholesale Trade | 25 (100.0%) | 0 (0.0%) |
| Retail Trade | 213 (91.0%) | 21 (9.0%) |
| Transportation & Warehousing | 134 (77.9%) | 38 (22.1%) |
| Utilities | 93 (100.0%) | 0 (0.0%) |
| Information | 0 (0.0%) | 0 (0.0%) |
| Finance & Insurance | 0 (0.0%) | 0 (0.0%) |
| Real Estate, Rental & Leasing | 0 (0.0%) | 0 (0.0%) |
| Professional & Scientific | 0 (0.0%) | 219 (100.0%) |
| Enterprise Management | 0 (0.0%) | 0 (0.0%) |
| Administrative & Support | 16 (100.0%) | 0 (0.0%) |
| Educational Services | 86 (30.1%) | 200 (69.9%) |
| Health Care & Social Assistance | 0 (0.0%) | 153 (100.0%) |
| Arts, Entertainment & Recreation | 13 (100.0%) | 0 (0.0%) |
| Accommodation & Food Services | 35 (25.2%) | 104 (74.8%) |
| Public Administration | 0 (0.0%) | 87 (100.0%) |
| Total | 988 (52.7%) | 888 (47.3%) |
Education in Monte Vista
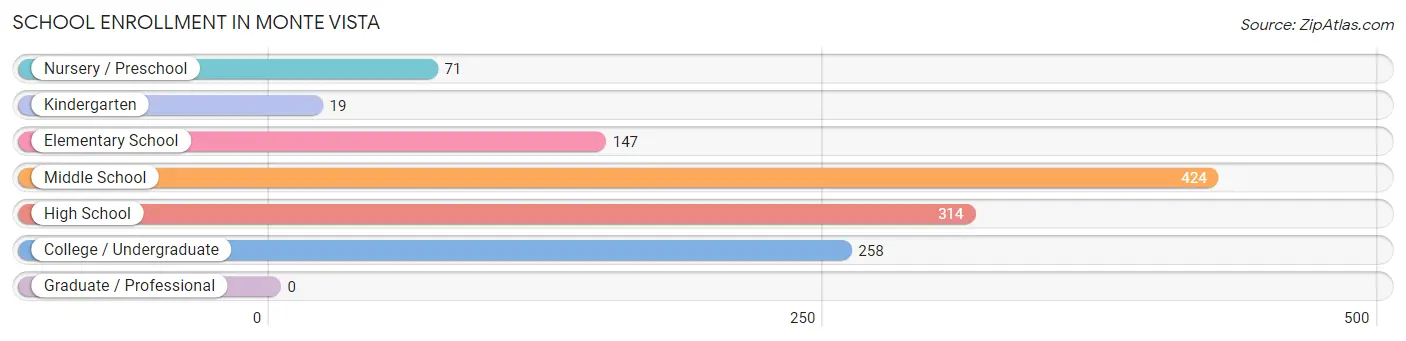
School Enrollment in Monte Vista
The most common levels of schooling among the 1,233 students in Monte Vista are middle school (424 | 34.4%), high school (314 | 25.5%), and college / undergraduate (258 | 20.9%).
| School Level | # Students | % Students |
| Nursery / Preschool | 71 | 5.8% |
| Kindergarten | 19 | 1.5% |
| Elementary School | 147 | 11.9% |
| Middle School | 424 | 34.4% |
| High School | 314 | 25.5% |
| College / Undergraduate | 258 | 20.9% |
| Graduate / Professional | 0 | 0.0% |
| Total | 1,233 | 100.0% |
School Enrollment by Age by Funding Source in Monte Vista
Out of a total of 1,233 students who are enrolled in schools in Monte Vista, 129 (10.5%) attend a private institution, while the remaining 1,104 (89.5%) are enrolled in public schools. The age group of 10 to 14 year olds has the highest likelihood of being enrolled in private schools, with 92 (21.7% in the age bracket) enrolled. Conversely, the age group of 15 to 17 year olds has the lowest likelihood of being enrolled in a private school, with 221 (100.0% in the age bracket) attending a public institution.
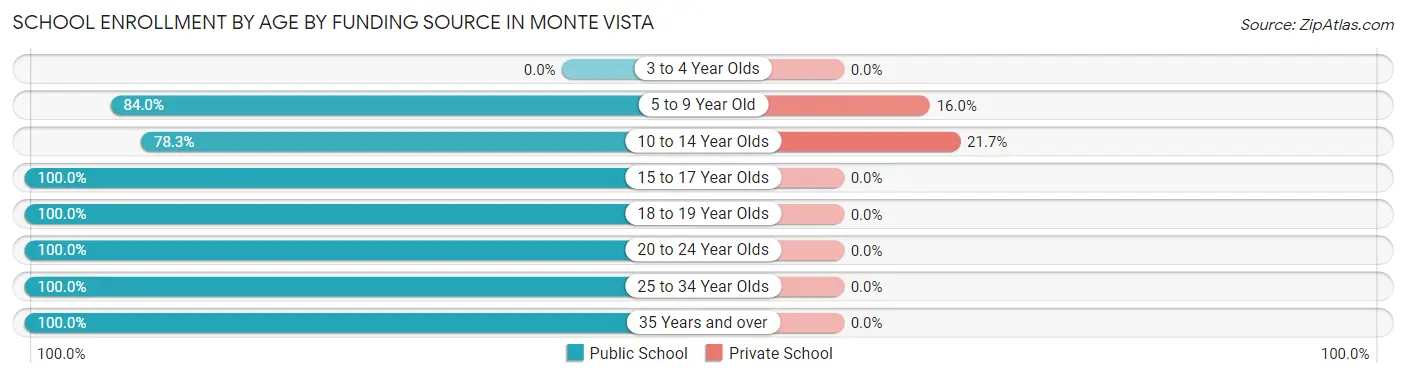
| Age Bracket | Public School | Private School |
| 3 to 4 Year Olds | 0 (0.0%) | 0 (0.0%) |
| 5 to 9 Year Old | 199 (84.0%) | 38 (16.0%) |
| 10 to 14 Year Olds | 332 (78.3%) | 92 (21.7%) |
| 15 to 17 Year Olds | 221 (100.0%) | 0 (0.0%) |
| 18 to 19 Year Olds | 93 (100.0%) | 0 (0.0%) |
| 20 to 24 Year Olds | 151 (100.0%) | 0 (0.0%) |
| 25 to 34 Year Olds | 70 (100.0%) | 0 (0.0%) |
| 35 Years and over | 37 (100.0%) | 0 (0.0%) |
| Total | 1,104 (89.5%) | 129 (10.5%) |
Educational Attainment by Field of Study in Monte Vista
Education (430 | 49.3%), social sciences (85 | 9.7%), business (63 | 7.2%), science & technology (55 | 6.3%), and bio, nature & agricultural (46 | 5.3%) are the most common fields of study among 873 individuals in Monte Vista who have obtained a bachelor's degree or higher.
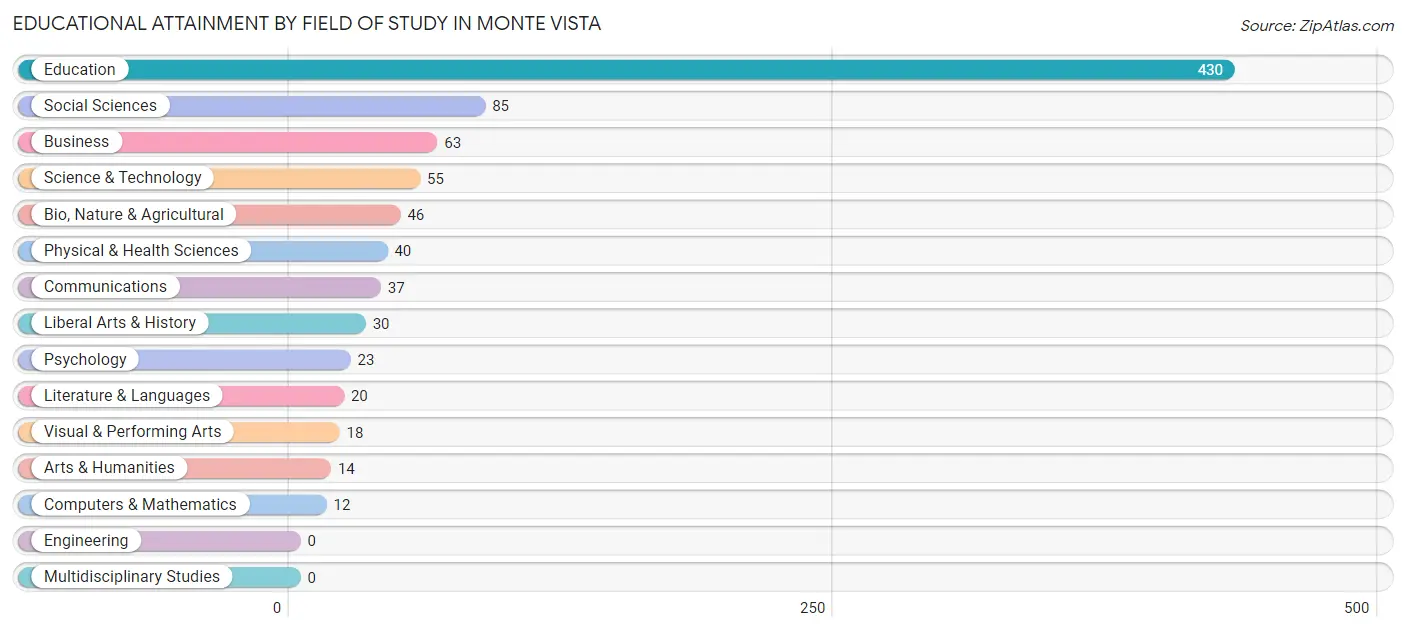
| Field of Study | # Graduates | % Graduates |
| Computers & Mathematics | 12 | 1.4% |
| Bio, Nature & Agricultural | 46 | 5.3% |
| Physical & Health Sciences | 40 | 4.6% |
| Psychology | 23 | 2.6% |
| Social Sciences | 85 | 9.7% |
| Engineering | 0 | 0.0% |
| Multidisciplinary Studies | 0 | 0.0% |
| Science & Technology | 55 | 6.3% |
| Business | 63 | 7.2% |
| Education | 430 | 49.3% |
| Literature & Languages | 20 | 2.3% |
| Liberal Arts & History | 30 | 3.4% |
| Visual & Performing Arts | 18 | 2.1% |
| Communications | 37 | 4.2% |
| Arts & Humanities | 14 | 1.6% |
| Total | 873 | 100.0% |
Transportation & Commute in Monte Vista
Vehicle Availability by Sex in Monte Vista
The most prevalent vehicle ownership categories in Monte Vista are males with 2 vehicles (440, accounting for 45.4%) and females with 2 vehicles (177, making up 65.8%).
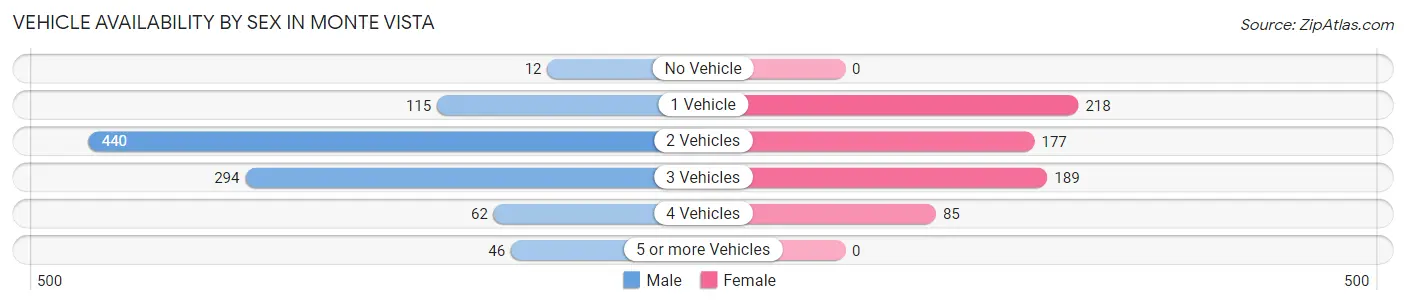
| Vehicles Available | Male | Female |
| No Vehicle | 12 (1.2%) | 0 (0.0%) |
| 1 Vehicle | 115 (11.9%) | 218 (32.6%) |
| 2 Vehicles | 440 (45.4%) | 177 (26.5%) |
| 3 Vehicles | 294 (30.3%) | 189 (28.2%) |
| 4 Vehicles | 62 (6.4%) | 85 (12.7%) |
| 5 or more Vehicles | 46 (4.8%) | 0 (0.0%) |
| Total | 969 (100.0%) | 669 (100.0%) |
Commute Time in Monte Vista
The most frequently occuring commute durations in Monte Vista are 10 to 14 minutes (343 commuters, 21.6%), less than 5 minutes (333 commuters, 21.0%), and 20 to 24 minutes (276 commuters, 17.4%).
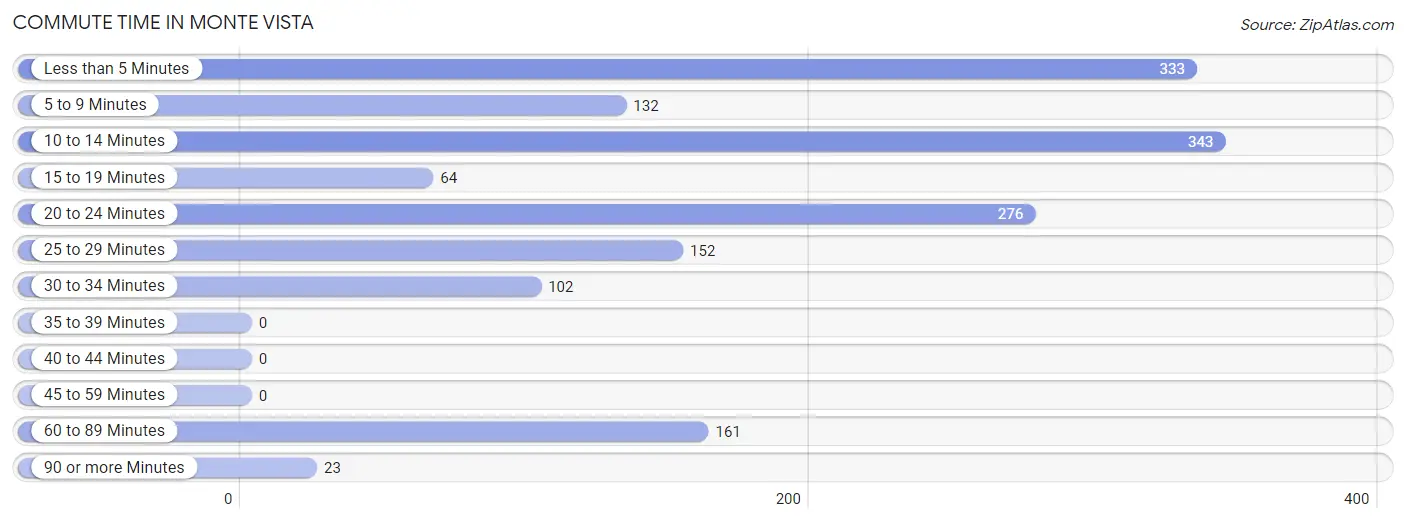
| Commute Time | # Commuters | % Commuters |
| Less than 5 Minutes | 333 | 21.0% |
| 5 to 9 Minutes | 132 | 8.3% |
| 10 to 14 Minutes | 343 | 21.6% |
| 15 to 19 Minutes | 64 | 4.0% |
| 20 to 24 Minutes | 276 | 17.4% |
| 25 to 29 Minutes | 152 | 9.6% |
| 30 to 34 Minutes | 102 | 6.4% |
| 35 to 39 Minutes | 0 | 0.0% |
| 40 to 44 Minutes | 0 | 0.0% |
| 45 to 59 Minutes | 0 | 0.0% |
| 60 to 89 Minutes | 161 | 10.2% |
| 90 or more Minutes | 23 | 1.5% |
Commute Time by Sex in Monte Vista
The most common commute times in Monte Vista are 10 to 14 minutes (249 commuters, 25.5%) for males and less than 5 minutes (192 commuters, 31.5%) for females.
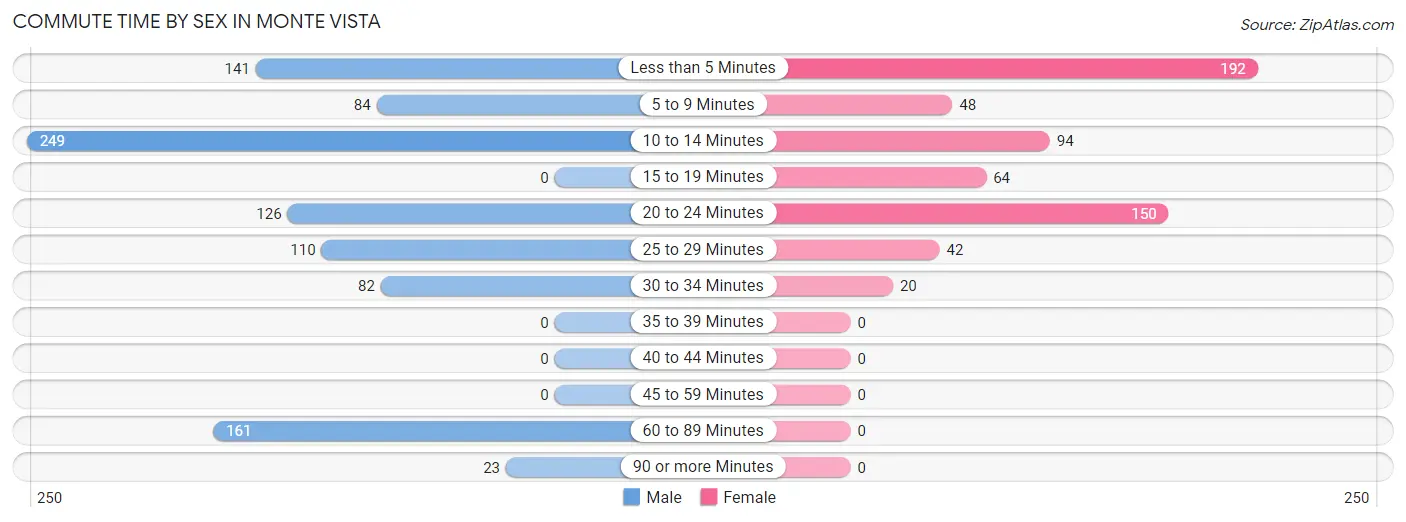
| Commute Time | Male | Female |
| Less than 5 Minutes | 141 (14.4%) | 192 (31.5%) |
| 5 to 9 Minutes | 84 (8.6%) | 48 (7.9%) |
| 10 to 14 Minutes | 249 (25.5%) | 94 (15.4%) |
| 15 to 19 Minutes | 0 (0.0%) | 64 (10.5%) |
| 20 to 24 Minutes | 126 (12.9%) | 150 (24.6%) |
| 25 to 29 Minutes | 110 (11.3%) | 42 (6.9%) |
| 30 to 34 Minutes | 82 (8.4%) | 20 (3.3%) |
| 35 to 39 Minutes | 0 (0.0%) | 0 (0.0%) |
| 40 to 44 Minutes | 0 (0.0%) | 0 (0.0%) |
| 45 to 59 Minutes | 0 (0.0%) | 0 (0.0%) |
| 60 to 89 Minutes | 161 (16.5%) | 0 (0.0%) |
| 90 or more Minutes | 23 (2.4%) | 0 (0.0%) |
Time of Departure to Work by Sex in Monte Vista
The most frequent times of departure to work in Monte Vista are 7:00 AM to 7:29 AM (408, 41.8%) for males and 7:30 AM to 7:59 AM (183, 30.0%) for females.
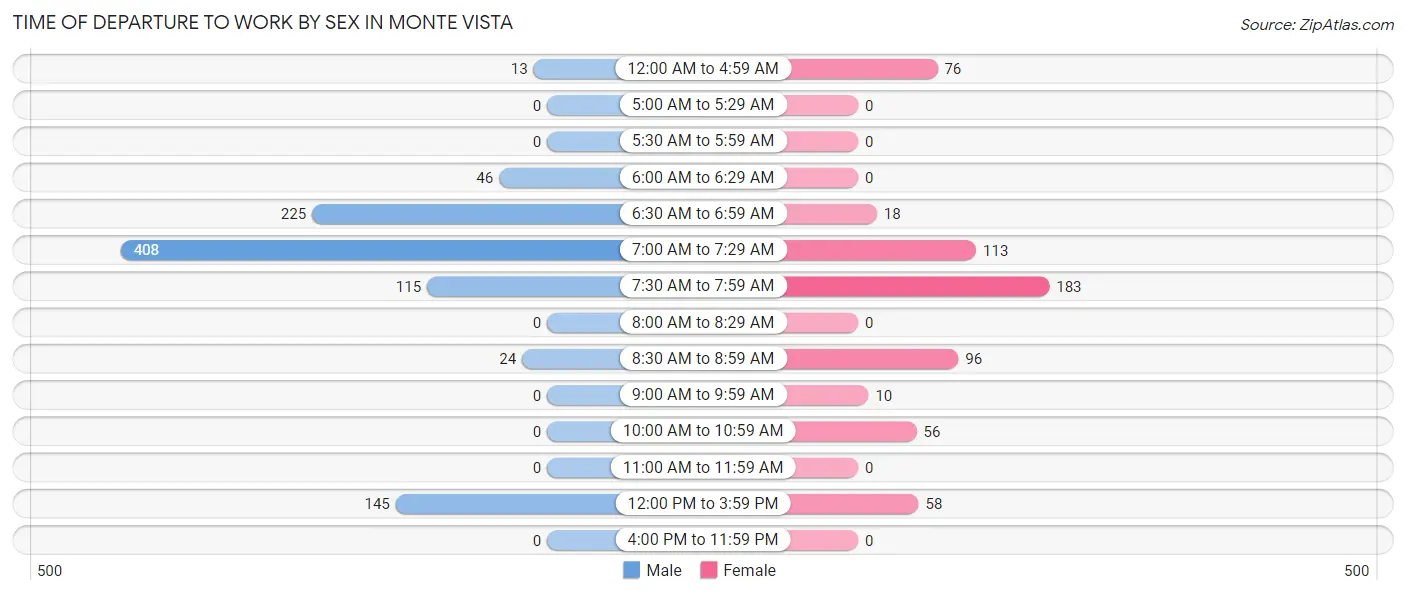
| Time of Departure | Male | Female |
| 12:00 AM to 4:59 AM | 13 (1.3%) | 76 (12.5%) |
| 5:00 AM to 5:29 AM | 0 (0.0%) | 0 (0.0%) |
| 5:30 AM to 5:59 AM | 0 (0.0%) | 0 (0.0%) |
| 6:00 AM to 6:29 AM | 46 (4.7%) | 0 (0.0%) |
| 6:30 AM to 6:59 AM | 225 (23.1%) | 18 (2.9%) |
| 7:00 AM to 7:29 AM | 408 (41.8%) | 113 (18.5%) |
| 7:30 AM to 7:59 AM | 115 (11.8%) | 183 (30.0%) |
| 8:00 AM to 8:29 AM | 0 (0.0%) | 0 (0.0%) |
| 8:30 AM to 8:59 AM | 24 (2.5%) | 96 (15.7%) |
| 9:00 AM to 9:59 AM | 0 (0.0%) | 10 (1.6%) |
| 10:00 AM to 10:59 AM | 0 (0.0%) | 56 (9.2%) |
| 11:00 AM to 11:59 AM | 0 (0.0%) | 0 (0.0%) |
| 12:00 PM to 3:59 PM | 145 (14.9%) | 58 (9.5%) |
| 4:00 PM to 11:59 PM | 0 (0.0%) | 0 (0.0%) |
| Total | 976 (100.0%) | 610 (100.0%) |
Housing Occupancy in Monte Vista
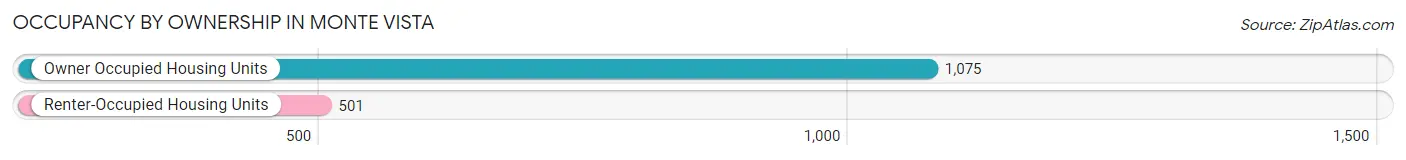
Occupancy by Ownership in Monte Vista
Of the total 1,576 dwellings in Monte Vista, owner-occupied units account for 1,075 (68.2%), while renter-occupied units make up 501 (31.8%).
| Occupancy | # Housing Units | % Housing Units |
| Owner Occupied Housing Units | 1,075 | 68.2% |
| Renter-Occupied Housing Units | 501 | 31.8% |
| Total Occupied Housing Units | 1,576 | 100.0% |
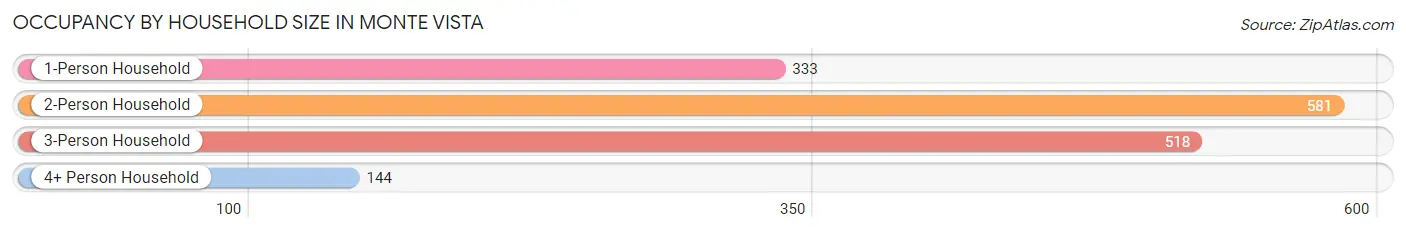
Occupancy by Household Size in Monte Vista
| Household Size | # Housing Units | % Housing Units |
| 1-Person Household | 333 | 21.1% |
| 2-Person Household | 581 | 36.9% |
| 3-Person Household | 518 | 32.9% |
| 4+ Person Household | 144 | 9.1% |
| Total Housing Units | 1,576 | 100.0% |
Occupancy by Ownership by Household Size in Monte Vista
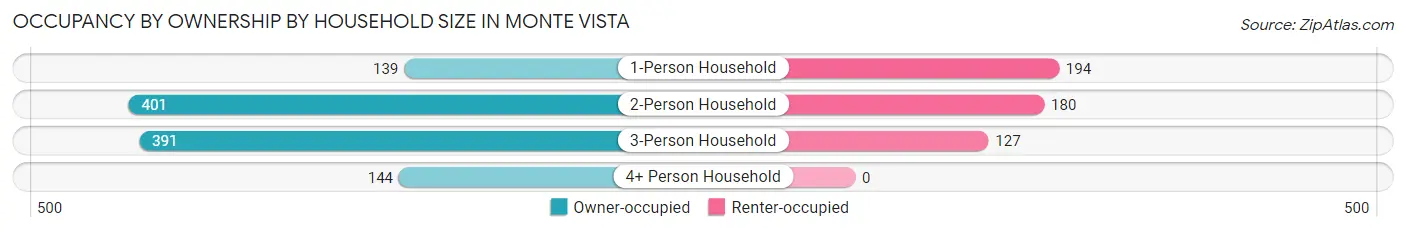
| Household Size | Owner-occupied | Renter-occupied |
| 1-Person Household | 139 (41.7%) | 194 (58.3%) |
| 2-Person Household | 401 (69.0%) | 180 (31.0%) |
| 3-Person Household | 391 (75.5%) | 127 (24.5%) |
| 4+ Person Household | 144 (100.0%) | 0 (0.0%) |
| Total Housing Units | 1,075 (68.2%) | 501 (31.8%) |
Occupancy by Educational Attainment in Monte Vista
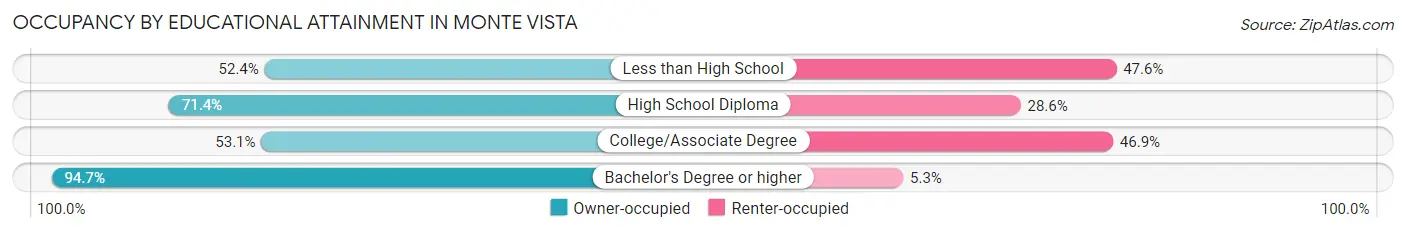
| Household Size | Owner-occupied | Renter-occupied |
| Less than High School | 98 (52.4%) | 89 (47.6%) |
| High School Diploma | 389 (71.4%) | 156 (28.6%) |
| College/Associate Degree | 269 (53.1%) | 238 (46.9%) |
| Bachelor's Degree or higher | 319 (94.7%) | 18 (5.3%) |
Occupancy by Age of Householder in Monte Vista
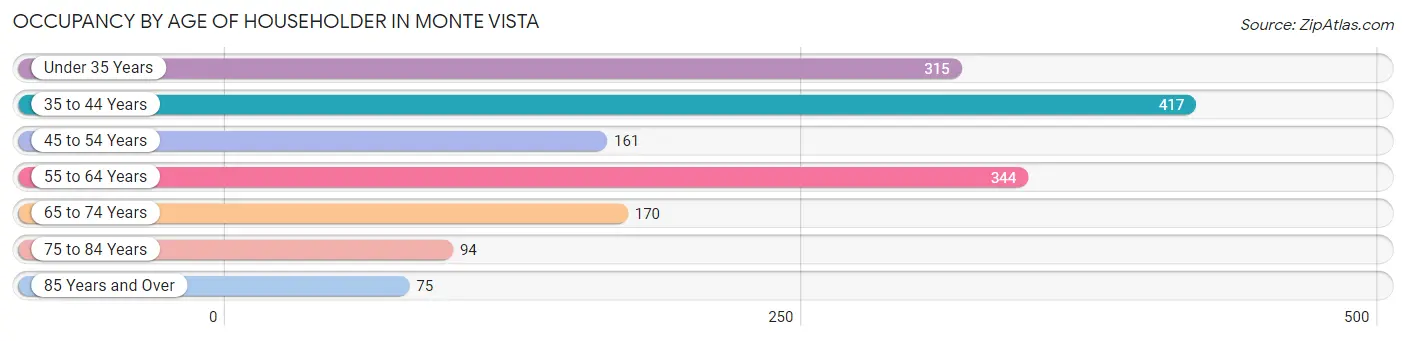
| Age Bracket | # Households | % Households |
| Under 35 Years | 315 | 20.0% |
| 35 to 44 Years | 417 | 26.5% |
| 45 to 54 Years | 161 | 10.2% |
| 55 to 64 Years | 344 | 21.8% |
| 65 to 74 Years | 170 | 10.8% |
| 75 to 84 Years | 94 | 6.0% |
| 85 Years and Over | 75 | 4.8% |
| Total | 1,576 | 100.0% |
Housing Finances in Monte Vista
Median Income by Occupancy in Monte Vista
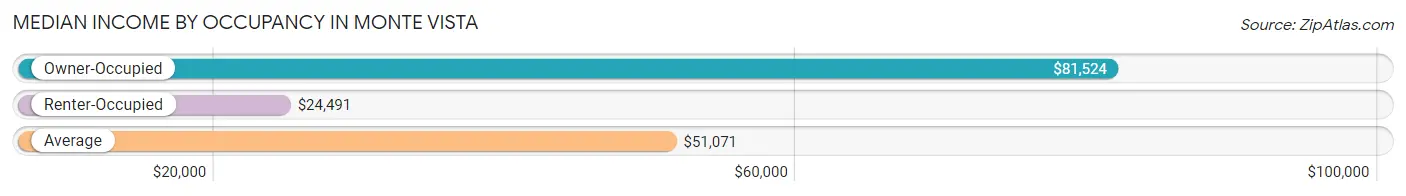
| Occupancy Type | # Households | Median Income |
| Owner-Occupied | 1,075 (68.2%) | $81,524 |
| Renter-Occupied | 501 (31.8%) | $24,491 |
| Average | 1,576 (100.0%) | $51,071 |
Occupancy by Householder Income Bracket in Monte Vista
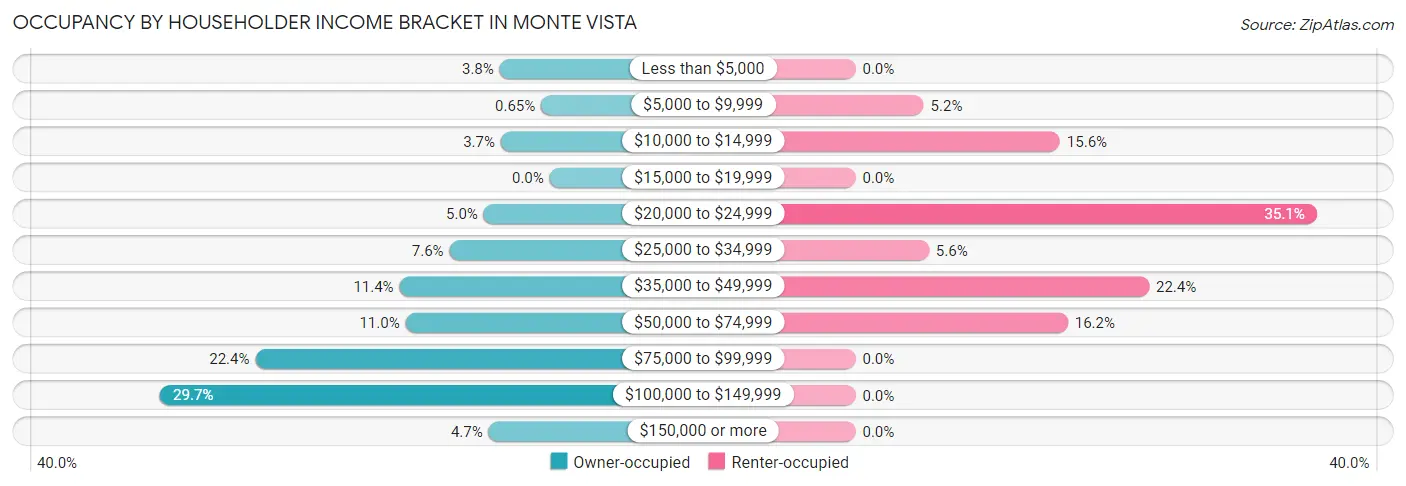
| Income Bracket | Owner-occupied | Renter-occupied |
| Less than $5,000 | 41 (3.8%) | 0 (0.0%) |
| $5,000 to $9,999 | 7 (0.6%) | 26 (5.2%) |
| $10,000 to $14,999 | 40 (3.7%) | 78 (15.6%) |
| $15,000 to $19,999 | 0 (0.0%) | 0 (0.0%) |
| $20,000 to $24,999 | 54 (5.0%) | 176 (35.1%) |
| $25,000 to $34,999 | 82 (7.6%) | 28 (5.6%) |
| $35,000 to $49,999 | 123 (11.4%) | 112 (22.4%) |
| $50,000 to $74,999 | 118 (11.0%) | 81 (16.2%) |
| $75,000 to $99,999 | 241 (22.4%) | 0 (0.0%) |
| $100,000 to $149,999 | 319 (29.7%) | 0 (0.0%) |
| $150,000 or more | 50 (4.6%) | 0 (0.0%) |
| Total | 1,075 (100.0%) | 501 (100.0%) |
Monthly Housing Cost Tiers in Monte Vista
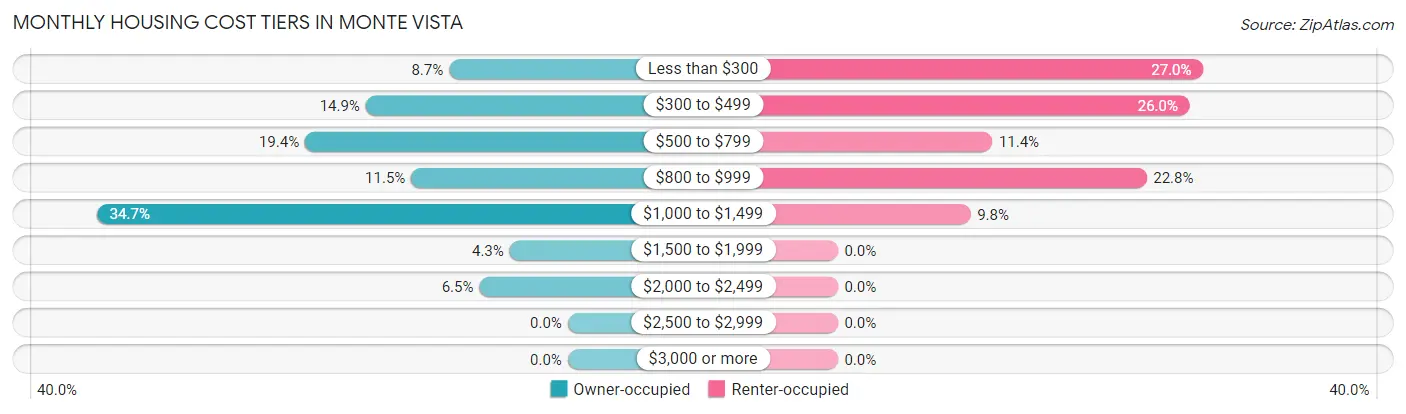
| Monthly Cost | Owner-occupied | Renter-occupied |
| Less than $300 | 94 (8.7%) | 135 (27.0%) |
| $300 to $499 | 160 (14.9%) | 130 (26.0%) |
| $500 to $799 | 208 (19.4%) | 57 (11.4%) |
| $800 to $999 | 124 (11.5%) | 114 (22.8%) |
| $1,000 to $1,499 | 373 (34.7%) | 49 (9.8%) |
| $1,500 to $1,999 | 46 (4.3%) | 0 (0.0%) |
| $2,000 to $2,499 | 70 (6.5%) | 0 (0.0%) |
| $2,500 to $2,999 | 0 (0.0%) | 0 (0.0%) |
| $3,000 or more | 0 (0.0%) | 0 (0.0%) |
| Total | 1,075 (100.0%) | 501 (100.0%) |
Physical Housing Characteristics in Monte Vista
Housing Structures in Monte Vista
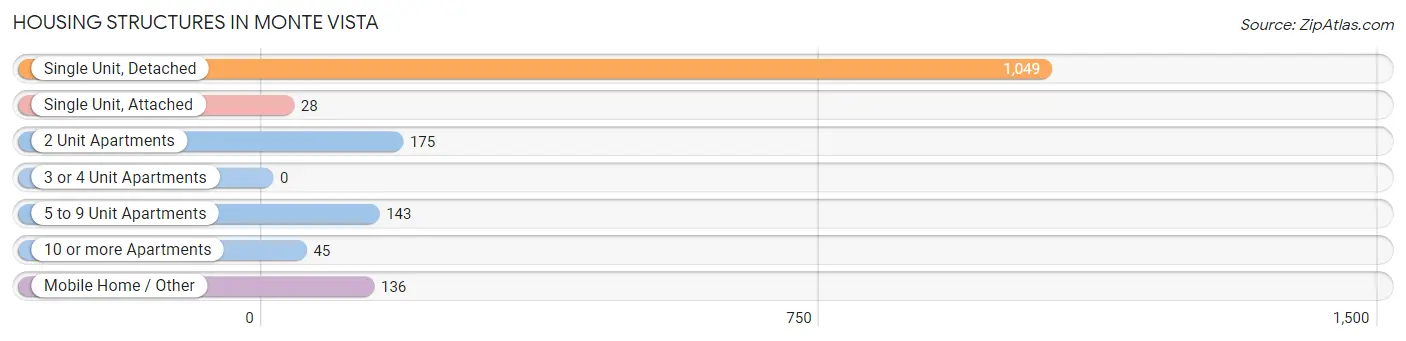
| Structure Type | # Housing Units | % Housing Units |
| Single Unit, Detached | 1,049 | 66.6% |
| Single Unit, Attached | 28 | 1.8% |
| 2 Unit Apartments | 175 | 11.1% |
| 3 or 4 Unit Apartments | 0 | 0.0% |
| 5 to 9 Unit Apartments | 143 | 9.1% |
| 10 or more Apartments | 45 | 2.9% |
| Mobile Home / Other | 136 | 8.6% |
| Total | 1,576 | 100.0% |
Housing Structures by Occupancy in Monte Vista
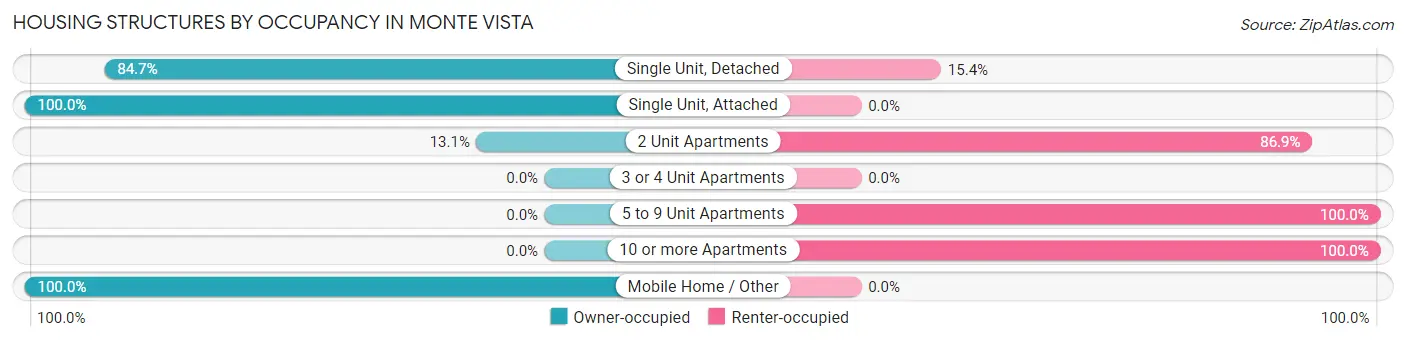
| Structure Type | Owner-occupied | Renter-occupied |
| Single Unit, Detached | 888 (84.7%) | 161 (15.3%) |
| Single Unit, Attached | 28 (100.0%) | 0 (0.0%) |
| 2 Unit Apartments | 23 (13.1%) | 152 (86.9%) |
| 3 or 4 Unit Apartments | 0 (0.0%) | 0 (0.0%) |
| 5 to 9 Unit Apartments | 0 (0.0%) | 143 (100.0%) |
| 10 or more Apartments | 0 (0.0%) | 45 (100.0%) |
| Mobile Home / Other | 136 (100.0%) | 0 (0.0%) |
| Total | 1,075 (68.2%) | 501 (31.8%) |
Housing Structures by Number of Rooms in Monte Vista
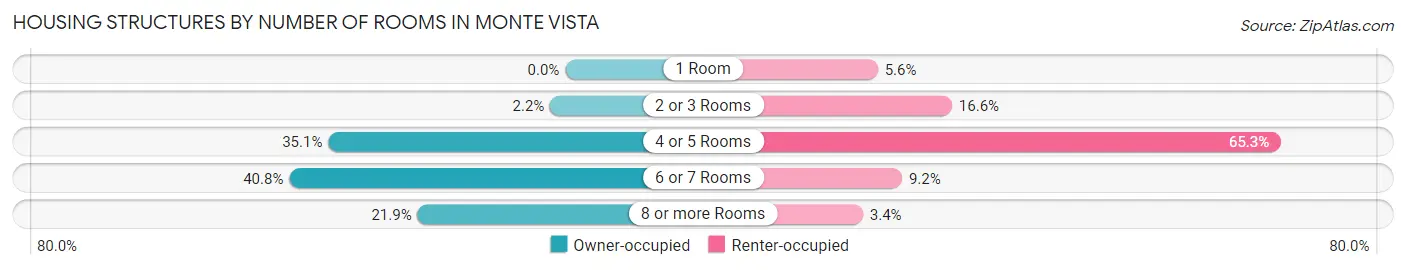
| Number of Rooms | Owner-occupied | Renter-occupied |
| 1 Room | 0 (0.0%) | 28 (5.6%) |
| 2 or 3 Rooms | 24 (2.2%) | 83 (16.6%) |
| 4 or 5 Rooms | 377 (35.1%) | 327 (65.3%) |
| 6 or 7 Rooms | 439 (40.8%) | 46 (9.2%) |
| 8 or more Rooms | 235 (21.9%) | 17 (3.4%) |
| Total | 1,075 (100.0%) | 501 (100.0%) |
Housing Structure by Heating Type in Monte Vista
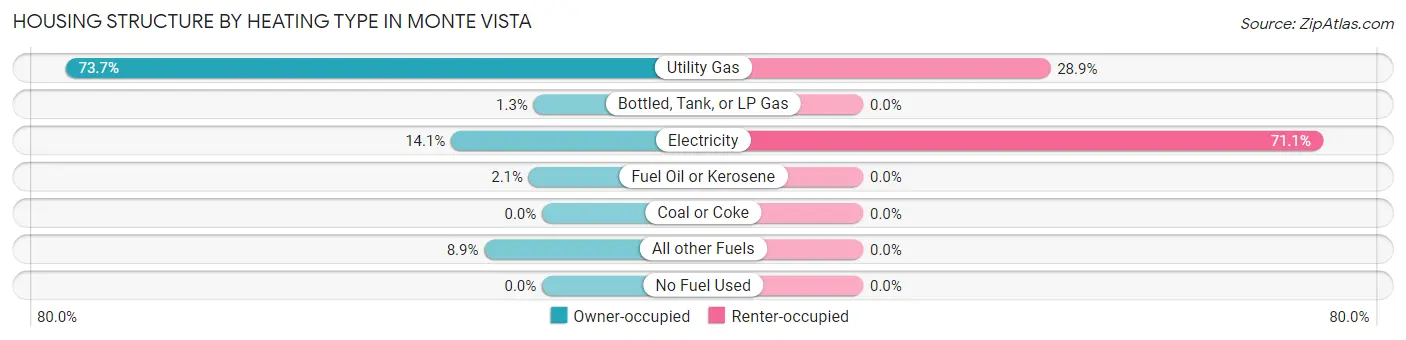
| Heating Type | Owner-occupied | Renter-occupied |
| Utility Gas | 792 (73.7%) | 145 (28.9%) |
| Bottled, Tank, or LP Gas | 14 (1.3%) | 0 (0.0%) |
| Electricity | 151 (14.1%) | 356 (71.1%) |
| Fuel Oil or Kerosene | 22 (2.1%) | 0 (0.0%) |
| Coal or Coke | 0 (0.0%) | 0 (0.0%) |
| All other Fuels | 96 (8.9%) | 0 (0.0%) |
| No Fuel Used | 0 (0.0%) | 0 (0.0%) |
| Total | 1,075 (100.0%) | 501 (100.0%) |
Household Vehicle Usage in Monte Vista
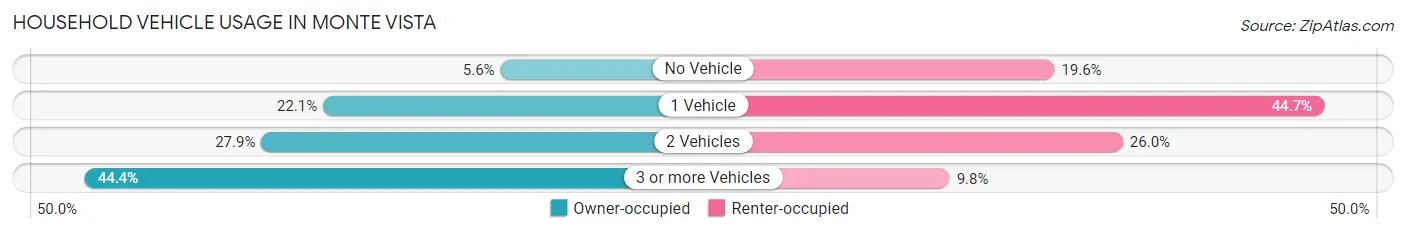
| Vehicles per Household | Owner-occupied | Renter-occupied |
| No Vehicle | 60 (5.6%) | 98 (19.6%) |
| 1 Vehicle | 238 (22.1%) | 224 (44.7%) |
| 2 Vehicles | 300 (27.9%) | 130 (26.0%) |
| 3 or more Vehicles | 477 (44.4%) | 49 (9.8%) |
| Total | 1,075 (100.0%) | 501 (100.0%) |
Real Estate & Mortgages in Monte Vista
Real Estate and Mortgage Overview in Monte Vista
| Characteristic | Without Mortgage | With Mortgage |
| Housing Units | 363 | 712 |
| Median Property Value | $89,300 | $209,100 |
| Median Household Income | $33,438 | $50 |
| Monthly Housing Costs | $431 | $0 |
| Real Estate Taxes | $463 | $2 |
Property Value by Mortgage Status in Monte Vista
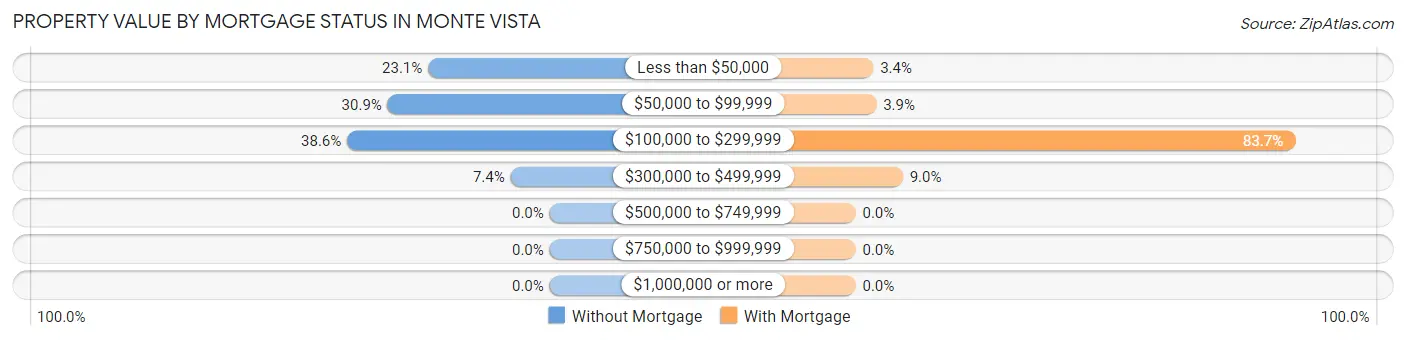
| Property Value | Without Mortgage | With Mortgage |
| Less than $50,000 | 84 (23.1%) | 24 (3.4%) |
| $50,000 to $99,999 | 112 (30.8%) | 28 (3.9%) |
| $100,000 to $299,999 | 140 (38.6%) | 596 (83.7%) |
| $300,000 to $499,999 | 27 (7.4%) | 64 (9.0%) |
| $500,000 to $749,999 | 0 (0.0%) | 0 (0.0%) |
| $750,000 to $999,999 | 0 (0.0%) | 0 (0.0%) |
| $1,000,000 or more | 0 (0.0%) | 0 (0.0%) |
| Total | 363 (100.0%) | 712 (100.0%) |
Household Income by Mortgage Status in Monte Vista
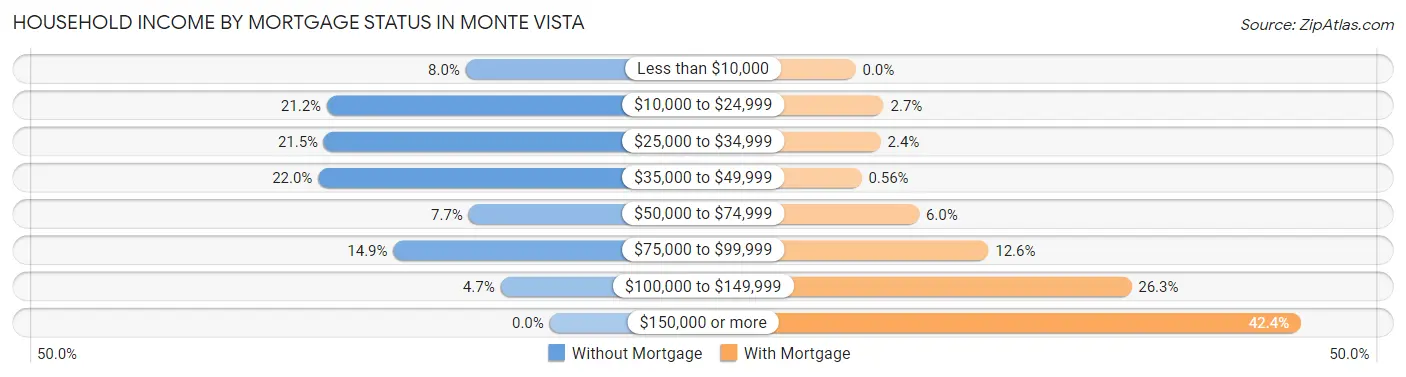
| Household Income | Without Mortgage | With Mortgage |
| Less than $10,000 | 29 (8.0%) | 0 (0.0%) |
| $10,000 to $24,999 | 77 (21.2%) | 19 (2.7%) |
| $25,000 to $34,999 | 78 (21.5%) | 17 (2.4%) |
| $35,000 to $49,999 | 80 (22.0%) | 4 (0.6%) |
| $50,000 to $74,999 | 28 (7.7%) | 43 (6.0%) |
| $75,000 to $99,999 | 54 (14.9%) | 90 (12.6%) |
| $100,000 to $149,999 | 17 (4.7%) | 187 (26.3%) |
| $150,000 or more | 0 (0.0%) | 302 (42.4%) |
| Total | 363 (100.0%) | 712 (100.0%) |
Property Value to Household Income Ratio in Monte Vista
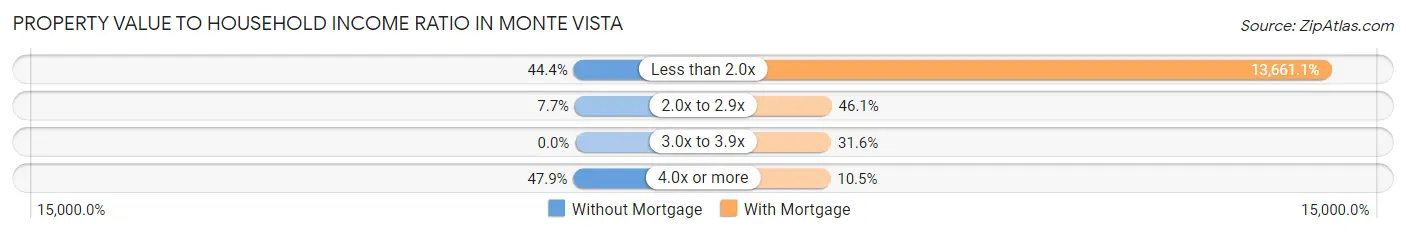
| Value-to-Income Ratio | Without Mortgage | With Mortgage |
| Less than 2.0x | 161 (44.4%) | 97,267 (13,661.1%) |
| 2.0x to 2.9x | 28 (7.7%) | 328 (46.1%) |
| 3.0x to 3.9x | 0 (0.0%) | 225 (31.6%) |
| 4.0x or more | 174 (47.9%) | 75 (10.5%) |
| Total | 363 (100.0%) | 712 (100.0%) |
Real Estate Taxes by Mortgage Status in Monte Vista
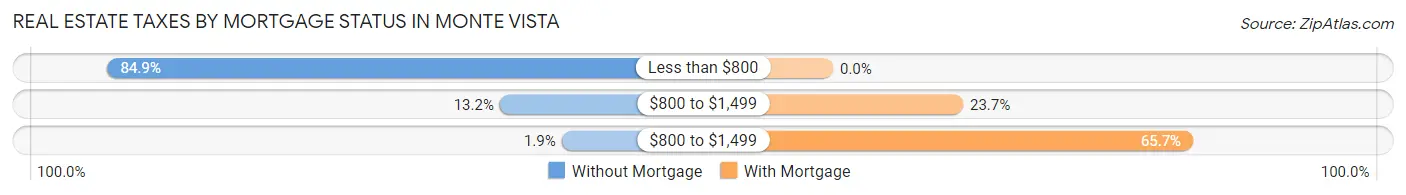
| Property Taxes | Without Mortgage | With Mortgage |
| Less than $800 | 308 (84.9%) | 0 (0.0%) |
| $800 to $1,499 | 48 (13.2%) | 169 (23.7%) |
| $800 to $1,499 | 7 (1.9%) | 468 (65.7%) |
| Total | 363 (100.0%) | 712 (100.0%) |
Health & Disability in Monte Vista
Health Insurance Coverage by Age in Monte Vista
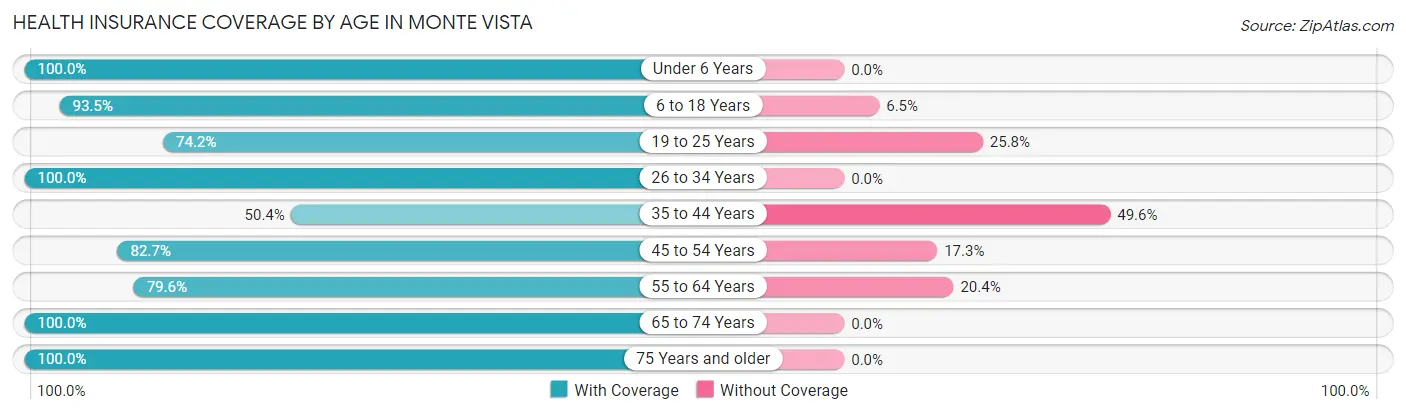
| Age Bracket | With Coverage | Without Coverage |
| Under 6 Years | 179 (100.0%) | 0 (0.0%) |
| 6 to 18 Years | 845 (93.5%) | 59 (6.5%) |
| 19 to 25 Years | 287 (74.2%) | 100 (25.8%) |
| 26 to 34 Years | 226 (100.0%) | 0 (0.0%) |
| 35 to 44 Years | 521 (50.4%) | 513 (49.6%) |
| 45 to 54 Years | 291 (82.7%) | 61 (17.3%) |
| 55 to 64 Years | 403 (79.6%) | 103 (20.4%) |
| 65 to 74 Years | 234 (100.0%) | 0 (0.0%) |
| 75 Years and older | 335 (100.0%) | 0 (0.0%) |
| Total | 3,321 (79.9%) | 836 (20.1%) |
Health Insurance Coverage by Citizenship Status in Monte Vista
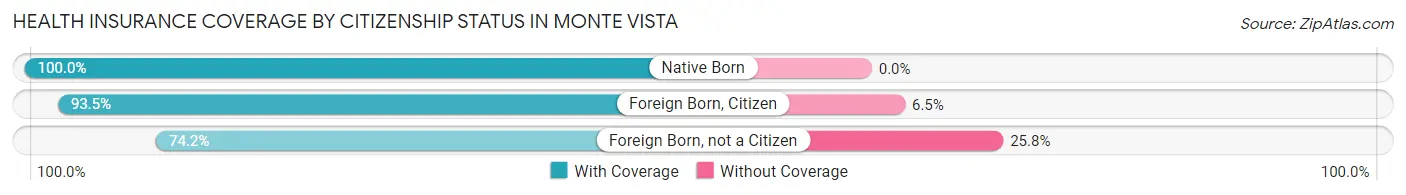
| Citizenship Status | With Coverage | Without Coverage |
| Native Born | 179 (100.0%) | 0 (0.0%) |
| Foreign Born, Citizen | 845 (93.5%) | 59 (6.5%) |
| Foreign Born, not a Citizen | 287 (74.2%) | 100 (25.8%) |
Health Insurance Coverage by Household Income in Monte Vista
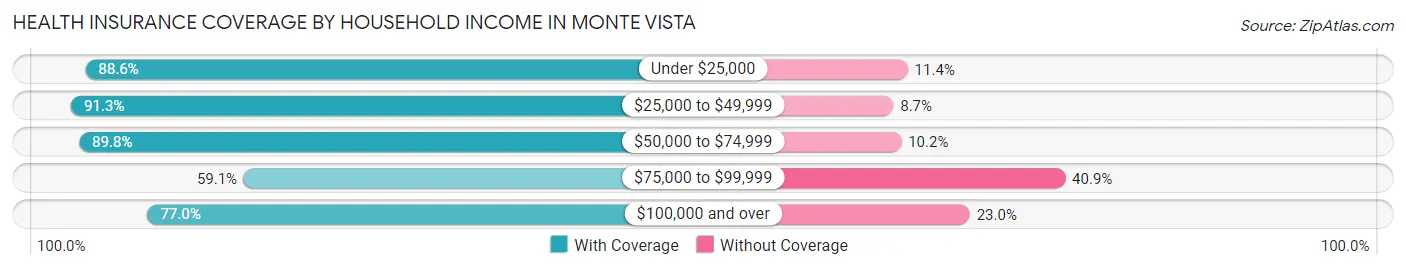
| Household Income | With Coverage | Without Coverage |
| Under $25,000 | 777 (88.6%) | 100 (11.4%) |
| $25,000 to $49,999 | 660 (91.3%) | 63 (8.7%) |
| $50,000 to $74,999 | 396 (89.8%) | 45 (10.2%) |
| $75,000 to $99,999 | 494 (59.1%) | 342 (40.9%) |
| $100,000 and over | 956 (77.0%) | 286 (23.0%) |
Public vs Private Health Insurance Coverage by Age in Monte Vista
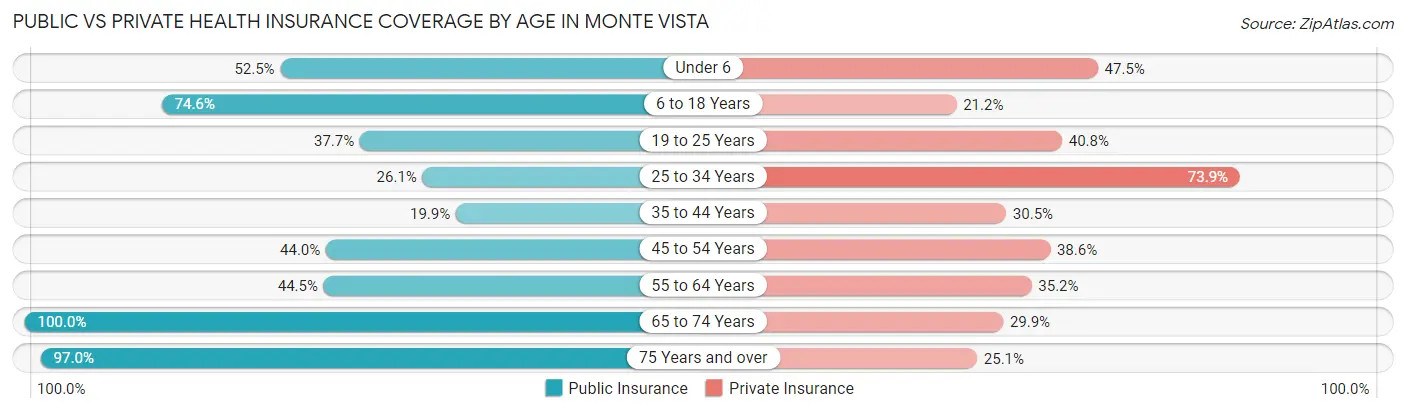
| Age Bracket | Public Insurance | Private Insurance |
| Under 6 | 94 (52.5%) | 85 (47.5%) |
| 6 to 18 Years | 674 (74.6%) | 192 (21.2%) |
| 19 to 25 Years | 146 (37.7%) | 158 (40.8%) |
| 25 to 34 Years | 59 (26.1%) | 167 (73.9%) |
| 35 to 44 Years | 206 (19.9%) | 315 (30.5%) |
| 45 to 54 Years | 155 (44.0%) | 136 (38.6%) |
| 55 to 64 Years | 225 (44.5%) | 178 (35.2%) |
| 65 to 74 Years | 234 (100.0%) | 70 (29.9%) |
| 75 Years and over | 325 (97.0%) | 84 (25.1%) |
| Total | 2,118 (50.9%) | 1,385 (33.3%) |
Disability Status by Sex by Age in Monte Vista
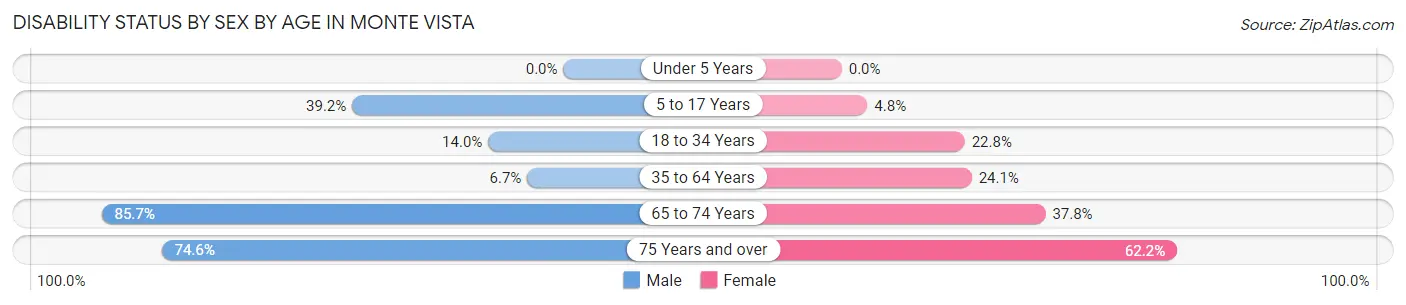
| Age Bracket | Male | Female |
| Under 5 Years | 0 (0.0%) | 0 (0.0%) |
| 5 to 17 Years | 189 (39.2%) | 19 (4.8%) |
| 18 to 34 Years | 49 (14.0%) | 81 (22.8%) |
| 35 to 64 Years | 63 (6.7%) | 230 (24.1%) |
| 65 to 74 Years | 60 (85.7%) | 62 (37.8%) |
| 75 Years and over | 88 (74.6%) | 135 (62.2%) |
Disability Class by Sex by Age in Monte Vista
Disability Class: Hearing Difficulty
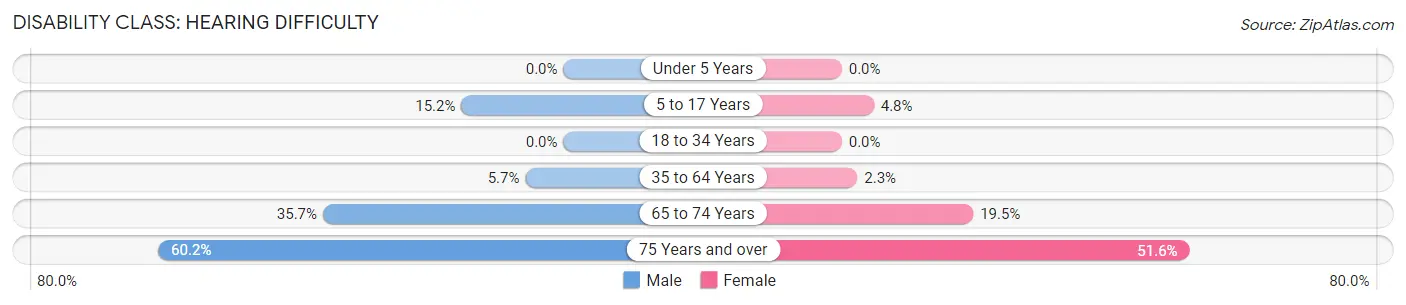
| Age Bracket | Male | Female |
| Under 5 Years | 0 (0.0%) | 0 (0.0%) |
| 5 to 17 Years | 73 (15.1%) | 19 (4.8%) |
| 18 to 34 Years | 0 (0.0%) | 0 (0.0%) |
| 35 to 64 Years | 53 (5.7%) | 22 (2.3%) |
| 65 to 74 Years | 25 (35.7%) | 32 (19.5%) |
| 75 Years and over | 71 (60.2%) | 112 (51.6%) |
Disability Class: Vision Difficulty
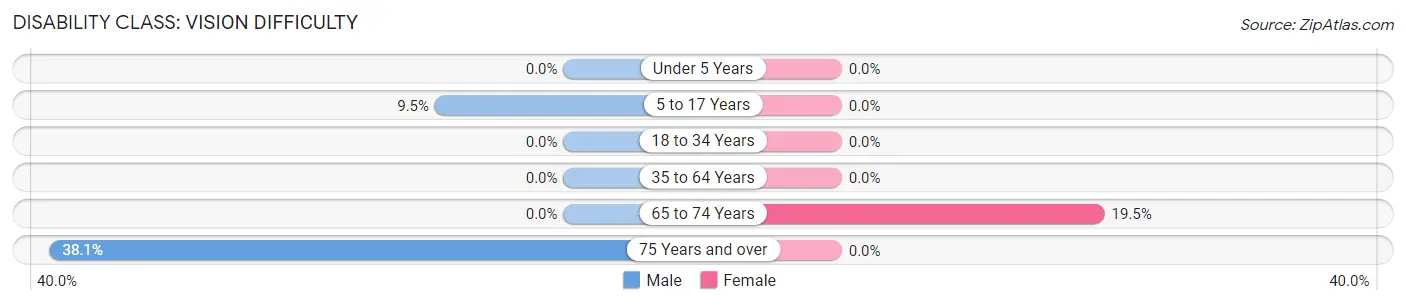
| Age Bracket | Male | Female |
| Under 5 Years | 0 (0.0%) | 0 (0.0%) |
| 5 to 17 Years | 46 (9.5%) | 0 (0.0%) |
| 18 to 34 Years | 0 (0.0%) | 0 (0.0%) |
| 35 to 64 Years | 0 (0.0%) | 0 (0.0%) |
| 65 to 74 Years | 0 (0.0%) | 32 (19.5%) |
| 75 Years and over | 45 (38.1%) | 0 (0.0%) |
Disability Class: Cognitive Difficulty
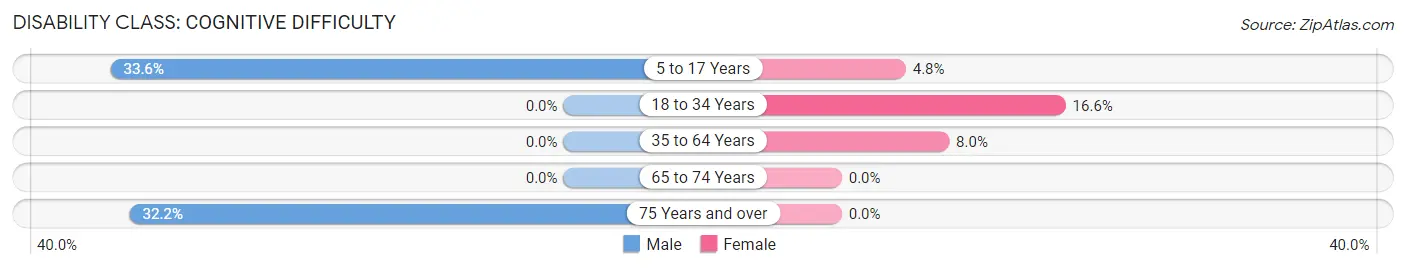
| Age Bracket | Male | Female |
| 5 to 17 Years | 162 (33.6%) | 19 (4.8%) |
| 18 to 34 Years | 0 (0.0%) | 59 (16.6%) |
| 35 to 64 Years | 0 (0.0%) | 76 (8.0%) |
| 65 to 74 Years | 0 (0.0%) | 0 (0.0%) |
| 75 Years and over | 38 (32.2%) | 0 (0.0%) |
Disability Class: Ambulatory Difficulty
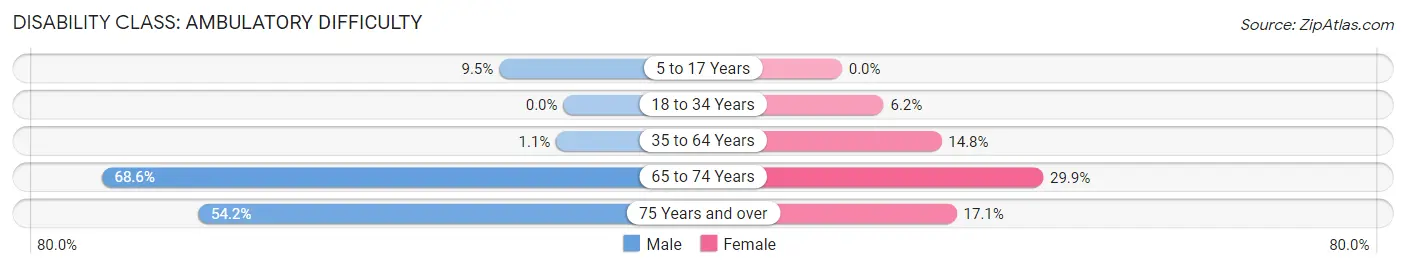
| Age Bracket | Male | Female |
| 5 to 17 Years | 46 (9.5%) | 0 (0.0%) |
| 18 to 34 Years | 0 (0.0%) | 22 (6.2%) |
| 35 to 64 Years | 10 (1.1%) | 141 (14.8%) |
| 65 to 74 Years | 48 (68.6%) | 49 (29.9%) |
| 75 Years and over | 64 (54.2%) | 37 (17.1%) |
Disability Class: Self-Care Difficulty
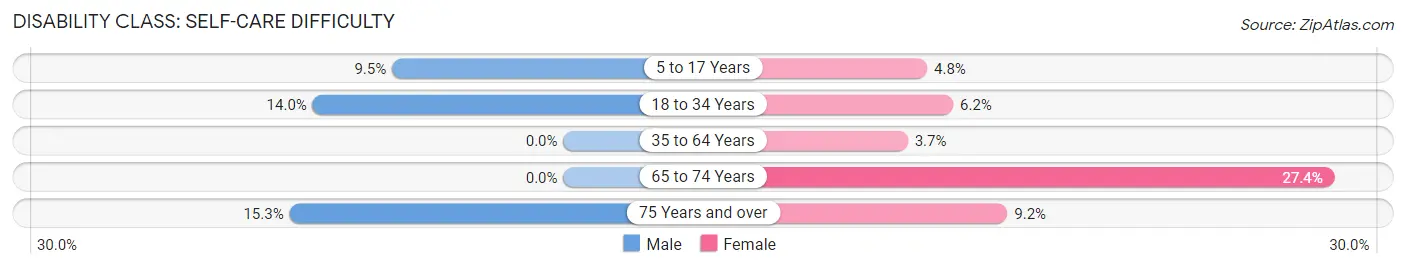
| Age Bracket | Male | Female |
| 5 to 17 Years | 46 (9.5%) | 19 (4.8%) |
| 18 to 34 Years | 49 (14.0%) | 22 (6.2%) |
| 35 to 64 Years | 0 (0.0%) | 35 (3.7%) |
| 65 to 74 Years | 0 (0.0%) | 45 (27.4%) |
| 75 Years and over | 18 (15.2%) | 20 (9.2%) |
Technology Access in Monte Vista
Computing Device Access in Monte Vista
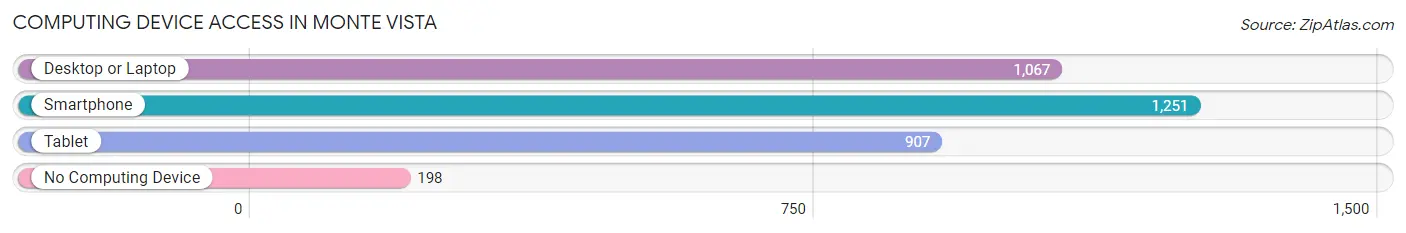
| Device Type | # Households | % Households |
| Desktop or Laptop | 1,067 | 67.7% |
| Smartphone | 1,251 | 79.4% |
| Tablet | 907 | 57.6% |
| No Computing Device | 198 | 12.6% |
| Total | 1,576 | 100.0% |
Internet Access in Monte Vista
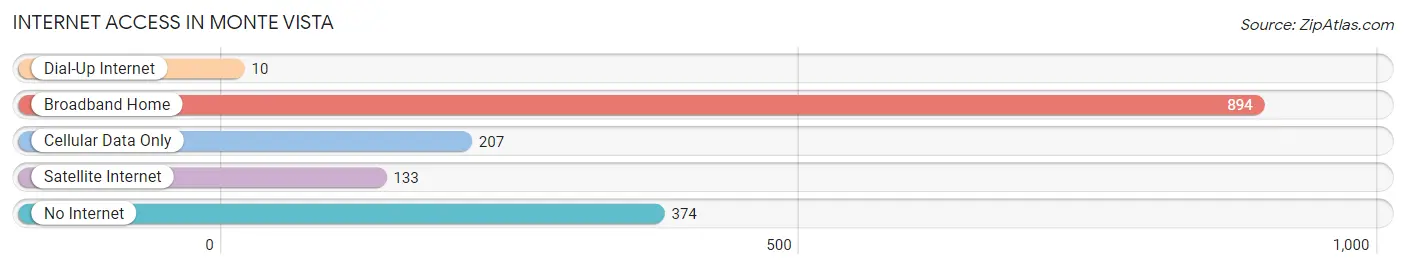
| Internet Type | # Households | % Households |
| Dial-Up Internet | 10 | 0.6% |
| Broadband Home | 894 | 56.7% |
| Cellular Data Only | 207 | 13.1% |
| Satellite Internet | 133 | 8.4% |
| No Internet | 374 | 23.7% |
| Total | 1,576 | 100.0% |
Monte Vista Summary
Monte Vista is a small town located in the San Luis Valley of south-central Colorado. It is the county seat of Rio Grande County and is situated at the base of the Sangre de Cristo Mountains. The town was founded in 1881 and has a population of approximately 4,000 people.
History
Monte Vista was founded in 1881 by a group of settlers from the nearby town of Del Norte. The settlers were looking for a place to settle and start a new life. The town was named after the nearby mountain, Monte Vista, which means “view of the mountain” in Spanish. The town was originally a farming and ranching community, but it soon became a hub for the surrounding area.
The town was incorporated in 1885 and quickly grew in population. The railroad arrived in 1887, bringing with it new businesses and opportunities. The town was also home to a number of saloons, hotels, and other businesses.
In the early 1900s, Monte Vista was a popular tourist destination. The town was known for its hot springs, which were believed to have healing properties. The town also had a number of resorts and hotels, which attracted visitors from all over the country.
Geography
Monte Vista is located in the San Luis Valley of south-central Colorado. The town is situated at the base of the Sangre de Cristo Mountains and is surrounded by the Rio Grande National Forest. The town is located at an elevation of 7,500 feet and has a total area of 2.2 square miles.
The climate in Monte Vista is semi-arid, with hot summers and cold winters. The average annual temperature is around 50 degrees Fahrenheit. The town receives an average of 12 inches of precipitation per year, most of which falls in the form of snow.
Economy
The economy of Monte Vista is largely based on agriculture and tourism. The town is home to a number of farms and ranches, which produce a variety of crops and livestock. The town is also home to a number of tourist attractions, including the Monte Vista National Wildlife Refuge and the Rio Grande Scenic Railroad.
The town is also home to a number of businesses, including restaurants, retail stores, and hotels. The town is also home to a number of manufacturing companies, which produce a variety of products, including furniture, clothing, and electronics.
Demographics
As of the 2010 census, the population of Monte Vista was 4,039. The racial makeup of the town was 87.3% White, 0.7% African American, 0.9% Native American, 0.3% Asian, 0.1% Pacific Islander, 8.7% from other races, and 2.0% from two or more races. Hispanic or Latino of any race were 24.3% of the population.
The median household income in Monte Vista was $35,938, and the median family income was $41,944. The per capita income was $17,845. About 16.2% of families and 19.3% of the population were below the poverty line, including 25.2% of those under age 18 and 10.2% of those age 65 or over.
Common Questions
What is Per Capita Income in Monte Vista?
Per Capita income in Monte Vista is $27,453.
What is the Median Family Income in Monte Vista?
Median Family Income in Monte Vista is $80,570.
What is the Median Household income in Monte Vista?
Median Household Income in Monte Vista is $51,071.
What is Income or Wage Gap in Monte Vista?
Income or Wage Gap in Monte Vista is 3.6%.
Women in Monte Vista earn 96.4 cents for every dollar earned by a man.
What is Inequality or Gini Index in Monte Vista?
Inequality or Gini Index in Monte Vista is 0.37.
What is the Total Population of Monte Vista?
Total Population of Monte Vista is 4,201.
What is the Total Male Population of Monte Vista?
Total Male Population of Monte Vista is 2,038.
What is the Total Female Population of Monte Vista?
Total Female Population of Monte Vista is 2,163.
What is the Ratio of Males per 100 Females in Monte Vista?
There are 94.22 Males per 100 Females in Monte Vista.
What is the Ratio of Females per 100 Males in Monte Vista?
There are 106.13 Females per 100 Males in Monte Vista.
What is the Median Population Age in Monte Vista?
Median Population Age in Monte Vista is 38.2 Years.
What is the Average Family Size in Monte Vista
Average Family Size in Monte Vista is 3.0 People.
What is the Average Household Size in Monte Vista
Average Household Size in Monte Vista is 2.6 People.
How Large is the Labor Force in Monte Vista?
There are 2,047 People in the Labor Forcein in Monte Vista.
What is the Percentage of People in the Labor Force in Monte Vista?
61.2% of People are in the Labor Force in Monte Vista.
What is the Unemployment Rate in Monte Vista?
Unemployment Rate in Monte Vista is 8.3%.