Magnolia, AR Map & Demographics
Magnolia Map
Magnolia Overview
$26,087
PER CAPITA INCOME
$54,725
AVG FAMILY INCOME
$43,000
AVG HOUSEHOLD INCOME
34.2%
WAGE / INCOME GAP [ % ]
65.8¢/ $1
WAGE / INCOME GAP [ $ ]
0.58
INEQUALITY / GINI INDEX
11,044
TOTAL POPULATION
5,073
MALE POPULATION
5,971
FEMALE POPULATION
84.96
MALES / 100 FEMALES
117.70
FEMALES / 100 MALES
28.8
MEDIAN AGE
3.5
AVG FAMILY SIZE
2.7
AVG HOUSEHOLD SIZE
4,609
LABOR FORCE [ PEOPLE ]
51.7%
PERCENT IN LABOR FORCE
3.8%
UNEMPLOYMENT RATE
Magnolia Zip Codes
Magnolia Area Codes
Income in Magnolia
Income Overview in Magnolia
Per Capita Income in Magnolia is $26,087, while median incomes of families and households are $54,725 and $43,000 respectively.
| Characteristic | Number | Measure |
| Per Capita Income | 11,044 | $26,087 |
| Median Family Income | 2,085 | $54,725 |
| Mean Family Income | 2,085 | $70,457 |
| Median Household Income | 3,354 | $43,000 |
| Mean Household Income | 3,354 | $74,883 |
| Income Deficit | 2,085 | $0 |
| Wage / Income Gap (%) | 11,044 | 34.17% |
| Wage / Income Gap ($) | 11,044 | 65.83¢ per $1 |
| Gini / Inequality Index | 11,044 | 0.58 |
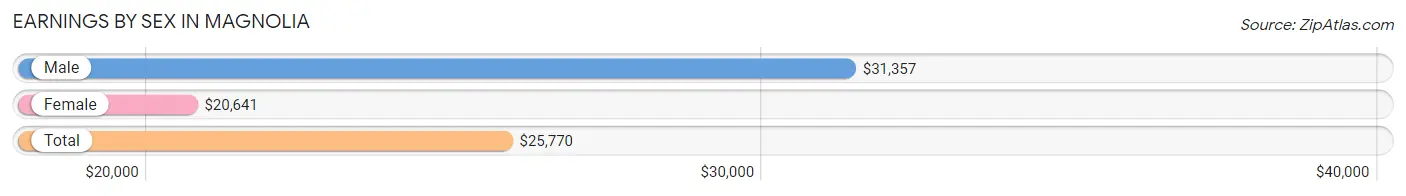
Earnings by Sex in Magnolia
Average Earnings in Magnolia are $25,770, $31,357 for men and $20,641 for women, a difference of 34.2%.
| Sex | Number | Average Earnings |
| Male | 2,272 (43.4%) | $31,357 |
| Female | 2,958 (56.6%) | $20,641 |
| Total | 5,230 (100.0%) | $25,770 |
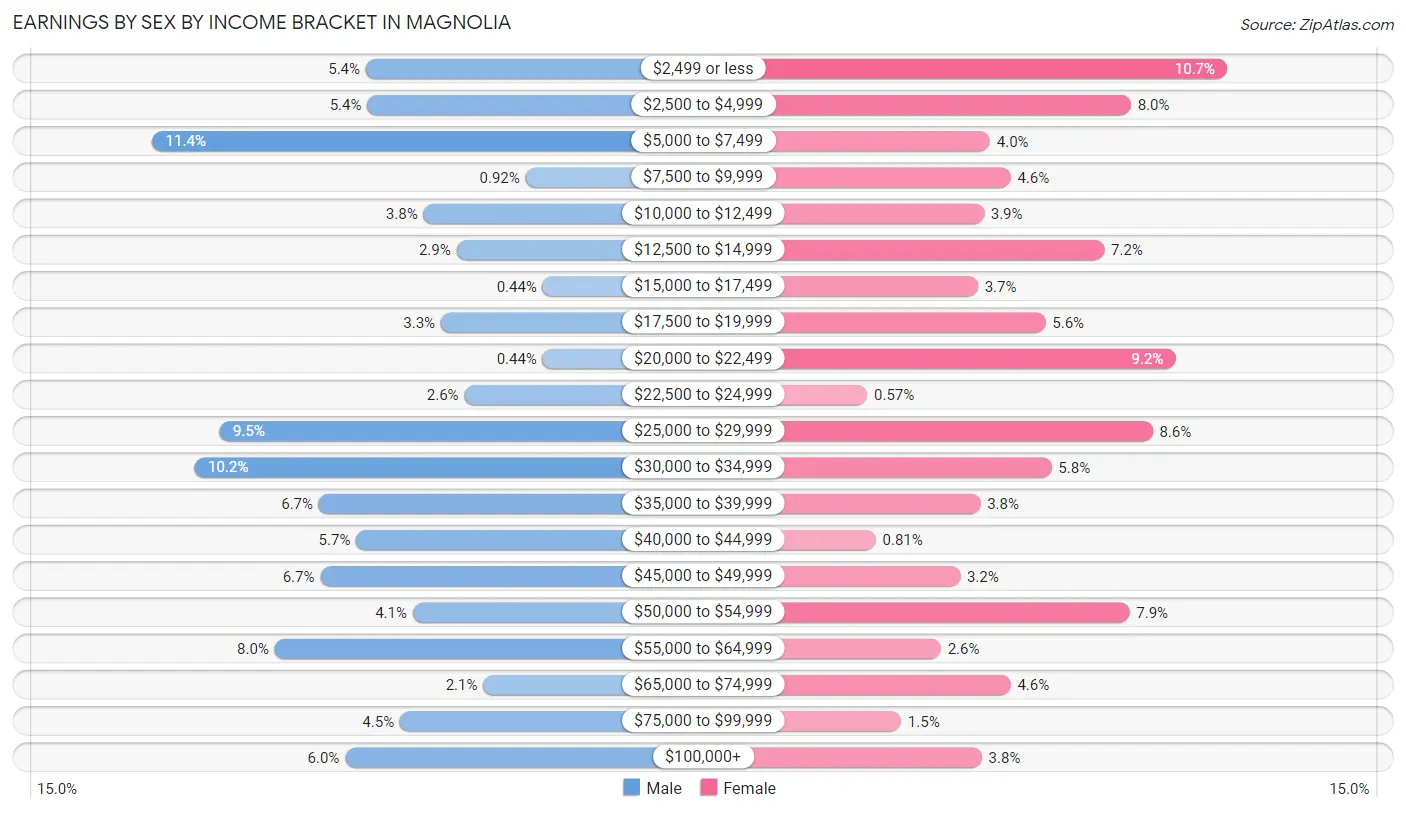
Earnings by Sex by Income Bracket in Magnolia
The most common earnings brackets in Magnolia are $5,000 to $7,499 for men (259 | 11.4%) and $2,499 or less for women (316 | 10.7%).
| Income | Male | Female |
| $2,499 or less | 123 (5.4%) | 316 (10.7%) |
| $2,500 to $4,999 | 122 (5.4%) | 236 (8.0%) |
| $5,000 to $7,499 | 259 (11.4%) | 119 (4.0%) |
| $7,500 to $9,999 | 21 (0.9%) | 136 (4.6%) |
| $10,000 to $12,499 | 86 (3.8%) | 114 (3.8%) |
| $12,500 to $14,999 | 65 (2.9%) | 214 (7.2%) |
| $15,000 to $17,499 | 10 (0.4%) | 109 (3.7%) |
| $17,500 to $19,999 | 75 (3.3%) | 165 (5.6%) |
| $20,000 to $22,499 | 10 (0.4%) | 273 (9.2%) |
| $22,500 to $24,999 | 60 (2.6%) | 17 (0.6%) |
| $25,000 to $29,999 | 216 (9.5%) | 254 (8.6%) |
| $30,000 to $34,999 | 232 (10.2%) | 170 (5.8%) |
| $35,000 to $39,999 | 153 (6.7%) | 111 (3.7%) |
| $40,000 to $44,999 | 129 (5.7%) | 24 (0.8%) |
| $45,000 to $49,999 | 152 (6.7%) | 94 (3.2%) |
| $50,000 to $54,999 | 93 (4.1%) | 235 (7.9%) |
| $55,000 to $64,999 | 181 (8.0%) | 78 (2.6%) |
| $65,000 to $74,999 | 48 (2.1%) | 136 (4.6%) |
| $75,000 to $99,999 | 101 (4.4%) | 45 (1.5%) |
| $100,000+ | 136 (6.0%) | 112 (3.8%) |
| Total | 2,272 (100.0%) | 2,958 (100.0%) |
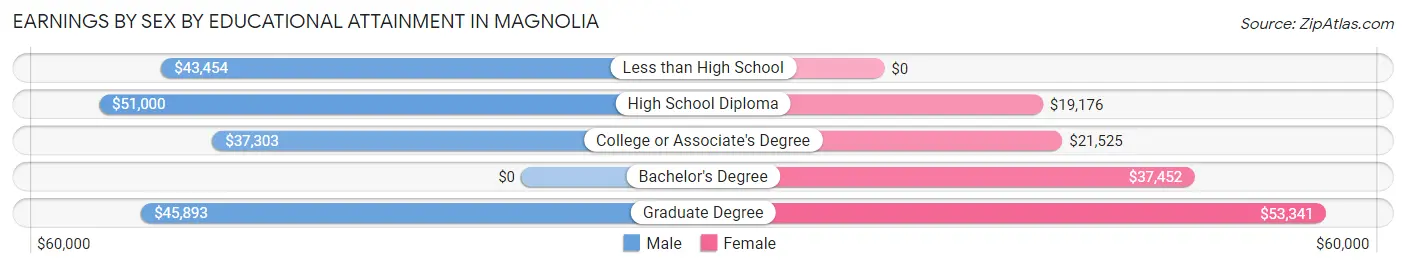
Earnings by Sex by Educational Attainment in Magnolia
Average earnings in Magnolia are $39,846 for men and $28,613 for women, a difference of 28.2%. Men with an educational attainment of high school diploma enjoy the highest average annual earnings of $51,000, while those with college or associate's degree education earn the least with $37,303. Women with an educational attainment of graduate degree earn the most with the average annual earnings of $53,341, while those with high school diploma education have the smallest earnings of $19,176.
| Educational Attainment | Male Income | Female Income |
| Less than High School | $43,454 | $0 |
| High School Diploma | $51,000 | $19,176 |
| College or Associate's Degree | $37,303 | $21,525 |
| Bachelor's Degree | - | - |
| Graduate Degree | $45,893 | $53,341 |
| Total | $39,846 | $28,613 |
Family Income in Magnolia
Family Income Brackets in Magnolia
According to the Magnolia family income data, there are 480 families falling into the $50,000 to $74,999 income range, which is the most common income bracket and makes up 23.0% of all families. Conversely, the $200,000+ income bracket is the least frequent group with only 44 families (2.1%) belonging to this category.
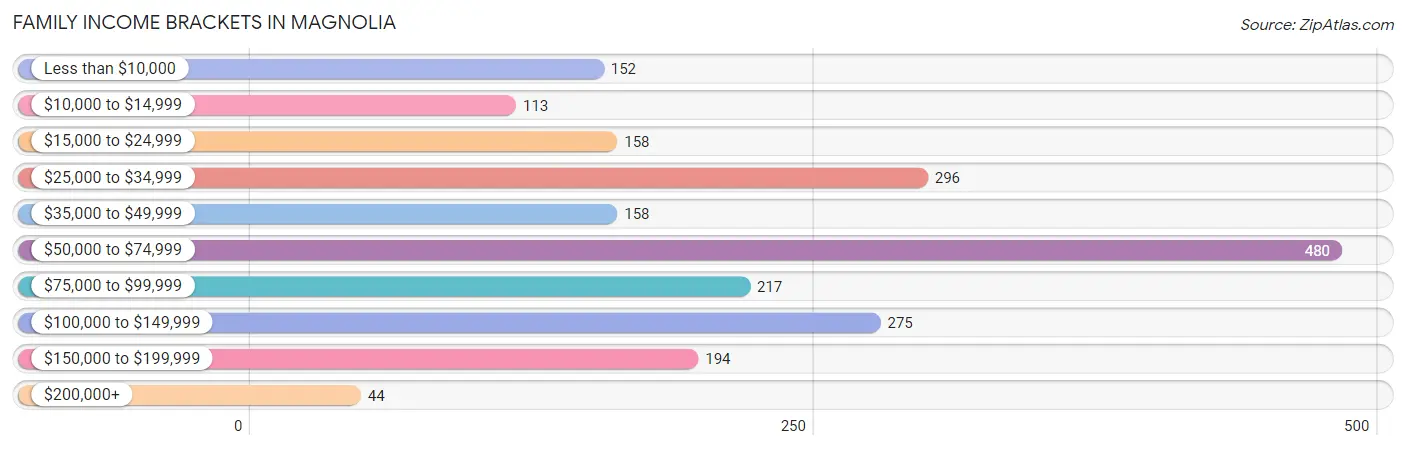
| Income Bracket | # Families | % Families |
| Less than $10,000 | 152 | 7.3% |
| $10,000 to $14,999 | 113 | 5.4% |
| $15,000 to $24,999 | 158 | 7.6% |
| $25,000 to $34,999 | 296 | 14.2% |
| $35,000 to $49,999 | 158 | 7.6% |
| $50,000 to $74,999 | 480 | 23.0% |
| $75,000 to $99,999 | 217 | 10.4% |
| $100,000 to $149,999 | 275 | 13.2% |
| $150,000 to $199,999 | 194 | 9.3% |
| $200,000+ | 44 | 2.1% |
Family Income by Famaliy Size in Magnolia
4-person families (476 | 22.8%) account for the highest median family income in Magnolia with $75,000 per family, while 2-person families (1,115 | 53.5%) have the highest median income of $23,420 per family member.
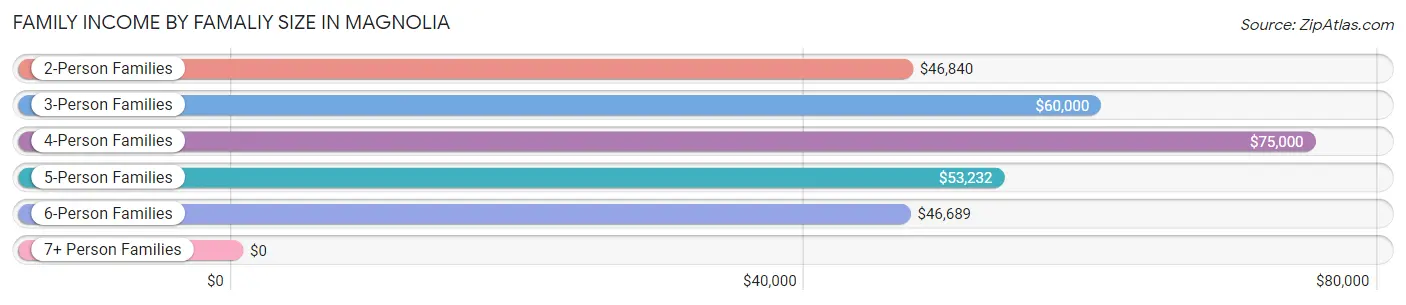
| Income Bracket | # Families | Median Income |
| 2-Person Families | 1,115 (53.5%) | $46,840 |
| 3-Person Families | 234 (11.2%) | $60,000 |
| 4-Person Families | 476 (22.8%) | $75,000 |
| 5-Person Families | 156 (7.5%) | $53,232 |
| 6-Person Families | 50 (2.4%) | $46,689 |
| 7+ Person Families | 54 (2.6%) | $0 |
| Total | 2,085 (100.0%) | $54,725 |
Family Income by Number of Earners in Magnolia
The median family income in Magnolia is $54,725, with families comprising 3+ earners (62) having the highest median family income of $94,000, while families with no earners (493) have the lowest median family income of $22,235, accounting for 3.0% and 23.6% of families, respectively.
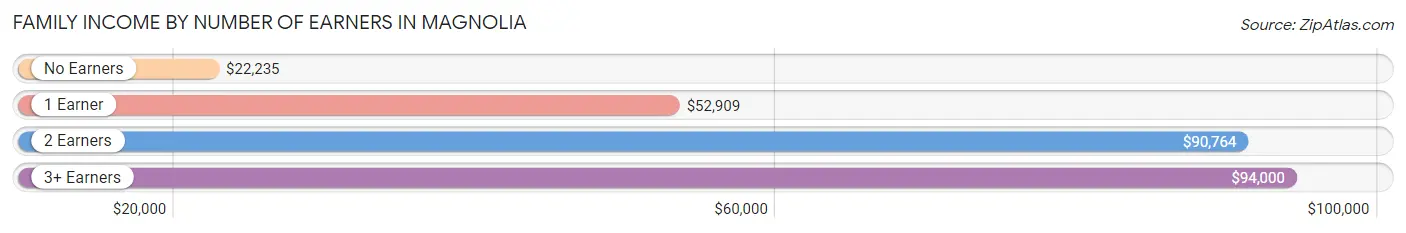
| Number of Earners | # Families | Median Income |
| No Earners | 493 (23.6%) | $22,235 |
| 1 Earner | 758 (36.3%) | $52,909 |
| 2 Earners | 772 (37.0%) | $90,764 |
| 3+ Earners | 62 (3.0%) | $94,000 |
| Total | 2,085 (100.0%) | $54,725 |
Household Income in Magnolia
Household Income Brackets in Magnolia
With 563 households falling in the category, the $50,000 to $74,999 income range is the most frequent in Magnolia, accounting for 16.8% of all households. In contrast, only 101 households (3.0%) fall into the $200,000+ income bracket, making it the least populous group.
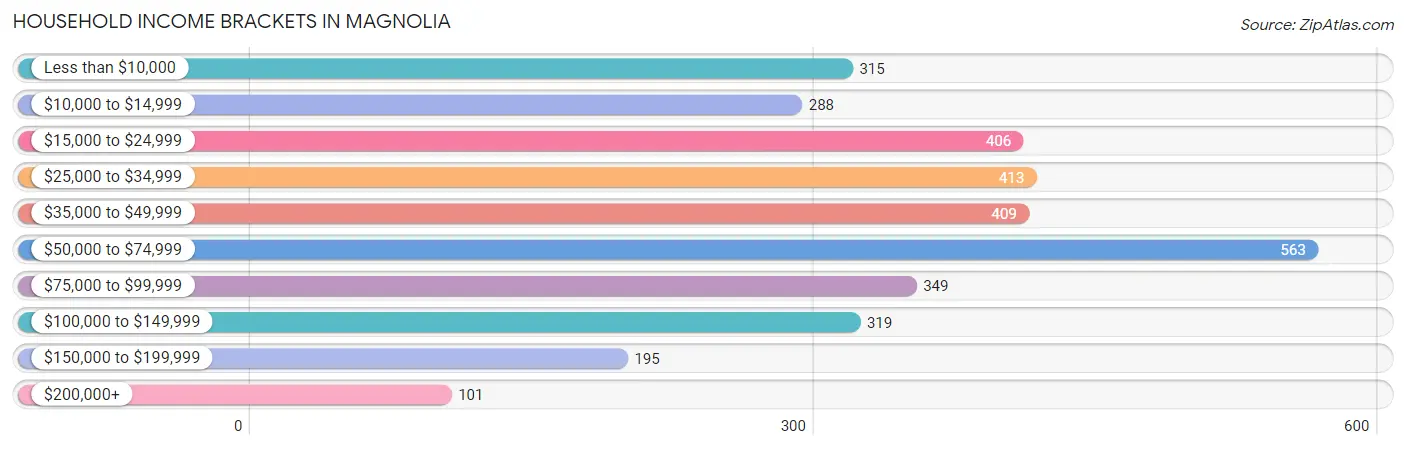
| Income Bracket | # Households | % Households |
| Less than $10,000 | 315 | 9.4% |
| $10,000 to $14,999 | 288 | 8.6% |
| $15,000 to $24,999 | 406 | 12.1% |
| $25,000 to $34,999 | 413 | 12.3% |
| $35,000 to $49,999 | 409 | 12.2% |
| $50,000 to $74,999 | 563 | 16.8% |
| $75,000 to $99,999 | 349 | 10.4% |
| $100,000 to $149,999 | 319 | 9.5% |
| $150,000 to $199,999 | 195 | 5.8% |
| $200,000+ | 101 | 3.0% |
Household Income by Householder Age in Magnolia
The median household income in Magnolia is $43,000, with the highest median household income of $55,345 found in the 45 to 64 years age bracket for the primary householder. A total of 892 households (26.6%) fall into this category. Meanwhile, the 15 to 24 years age bracket for the primary householder has the lowest median household income of $0, with 254 households (7.6%) in this group.
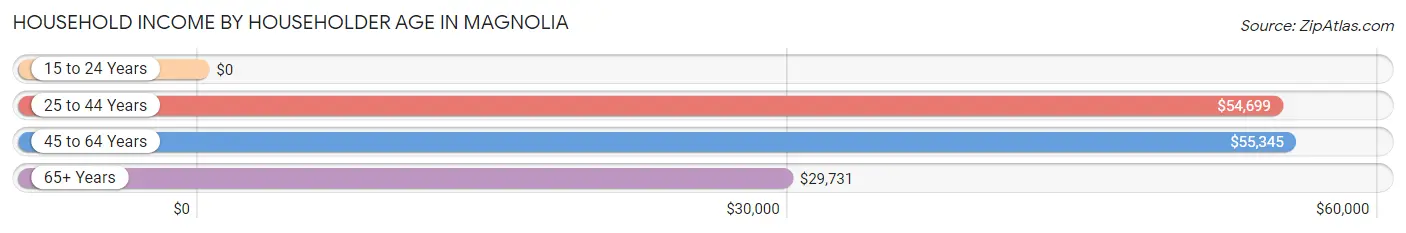
| Income Bracket | # Households | Median Income |
| 15 to 24 Years | 254 (7.6%) | $0 |
| 25 to 44 Years | 1,106 (33.0%) | $54,699 |
| 45 to 64 Years | 892 (26.6%) | $55,345 |
| 65+ Years | 1,102 (32.9%) | $29,731 |
| Total | 3,354 (100.0%) | $43,000 |
Poverty in Magnolia
Income Below Poverty by Sex and Age in Magnolia
With 18.3% poverty level for males and 30.0% for females among the residents of Magnolia, 5 year old males and 16 and 17 year old females are the most vulnerable to poverty, with 63 males (94.0%) and 108 females (90.8%) in their respective age groups living below the poverty level.
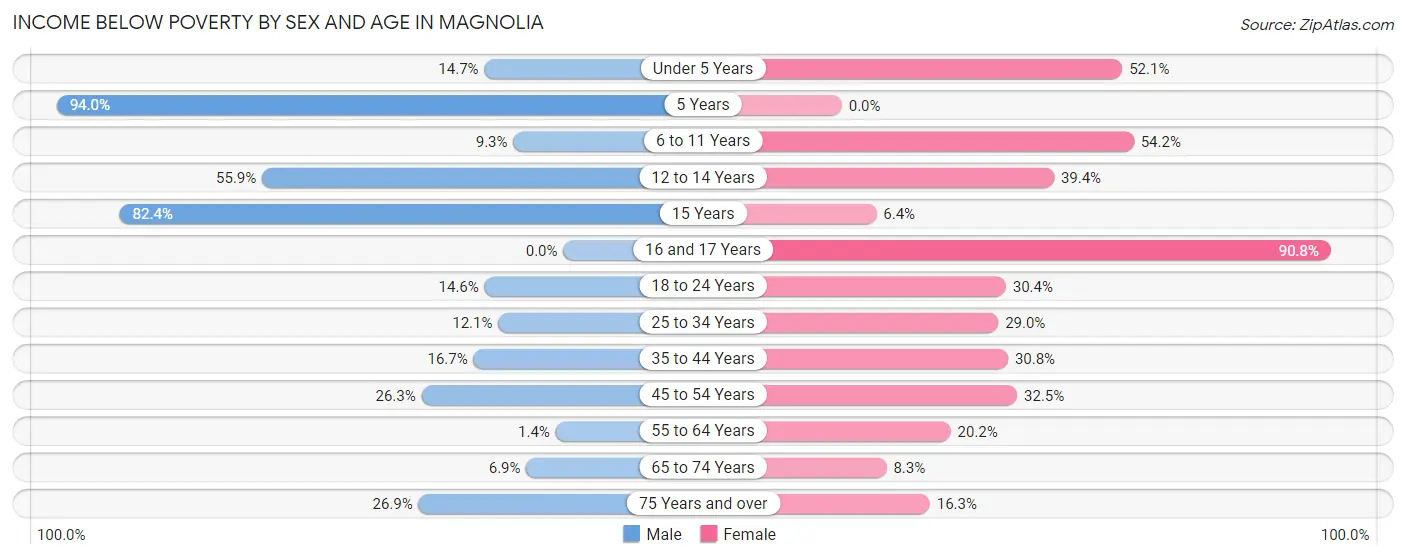
| Age Bracket | Male | Female |
| Under 5 Years | 64 (14.6%) | 152 (52.0%) |
| 5 Years | 63 (94.0%) | 0 (0.0%) |
| 6 to 11 Years | 27 (9.3%) | 181 (54.2%) |
| 12 to 14 Years | 104 (55.9%) | 115 (39.4%) |
| 15 Years | 56 (82.4%) | 5 (6.4%) |
| 16 and 17 Years | 0 (0.0%) | 108 (90.8%) |
| 18 to 24 Years | 78 (14.6%) | 144 (30.4%) |
| 25 to 34 Years | 73 (12.1%) | 263 (29.0%) |
| 35 to 44 Years | 68 (16.7%) | 206 (30.8%) |
| 45 to 54 Years | 100 (26.3%) | 165 (32.5%) |
| 55 to 64 Years | 4 (1.4%) | 80 (20.2%) |
| 65 to 74 Years | 30 (6.9%) | 44 (8.3%) |
| 75 Years and over | 75 (26.9%) | 81 (16.3%) |
| Total | 742 (18.3%) | 1,544 (30.0%) |
Income Above Poverty by Sex and Age in Magnolia
According to the poverty statistics in Magnolia, males aged 16 and 17 years and females aged 5 years are the age groups that are most secure financially, with 100.0% of males and 100.0% of females in these age groups living above the poverty line.
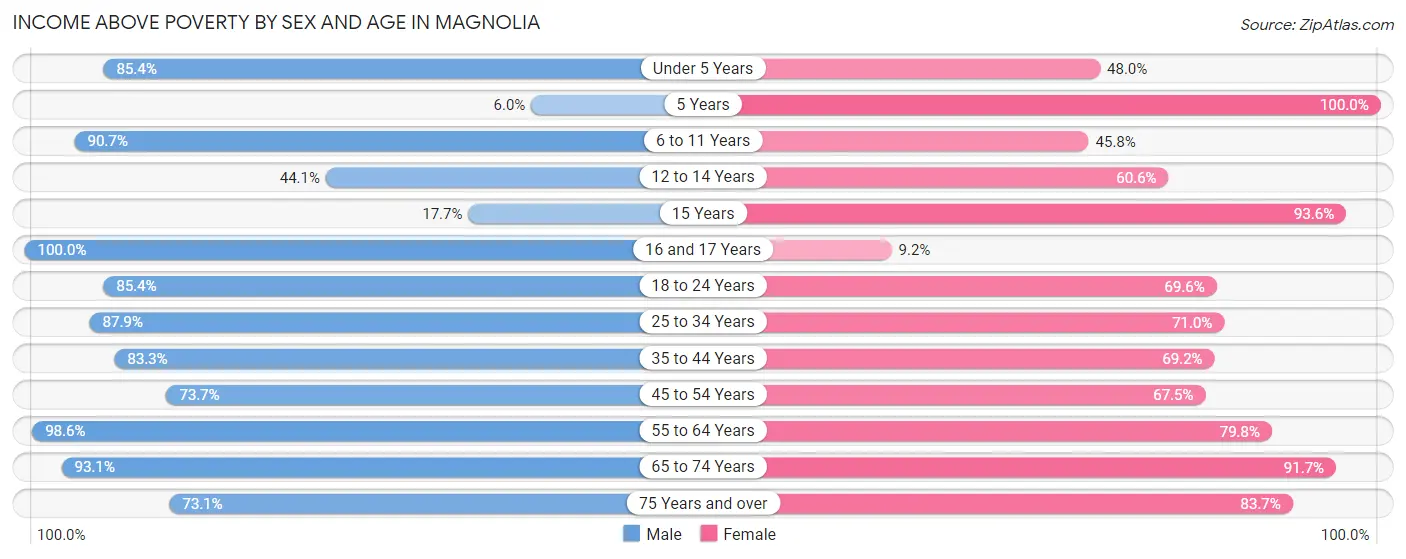
| Age Bracket | Male | Female |
| Under 5 Years | 373 (85.4%) | 140 (47.9%) |
| 5 Years | 4 (6.0%) | 61 (100.0%) |
| 6 to 11 Years | 264 (90.7%) | 153 (45.8%) |
| 12 to 14 Years | 82 (44.1%) | 177 (60.6%) |
| 15 Years | 12 (17.6%) | 73 (93.6%) |
| 16 and 17 Years | 75 (100.0%) | 11 (9.2%) |
| 18 to 24 Years | 456 (85.4%) | 329 (69.6%) |
| 25 to 34 Years | 532 (87.9%) | 643 (71.0%) |
| 35 to 44 Years | 340 (83.3%) | 462 (69.2%) |
| 45 to 54 Years | 280 (73.7%) | 342 (67.5%) |
| 55 to 64 Years | 278 (98.6%) | 316 (79.8%) |
| 65 to 74 Years | 407 (93.1%) | 487 (91.7%) |
| 75 Years and over | 204 (73.1%) | 415 (83.7%) |
| Total | 3,307 (81.7%) | 3,609 (70.0%) |
Income Below Poverty Among Married-Couple Families in Magnolia
The poverty statistics for married-couple families in Magnolia show that 6.4% or 85 of the total 1,333 families live below the poverty line. Families with no children have the highest poverty rate of 9.3%, comprising of 81 families. On the other hand, families with 3 or 4 children have the lowest poverty rate of 0.0%, which includes 0 families.
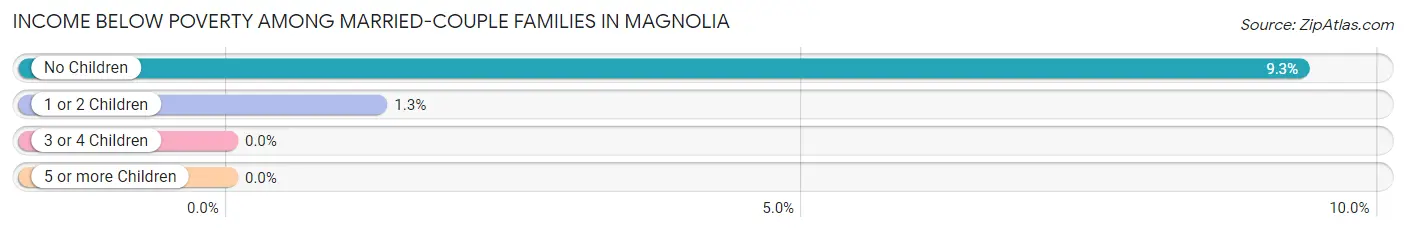
| Children | Above Poverty | Below Poverty |
| No Children | 787 (90.7%) | 81 (9.3%) |
| 1 or 2 Children | 303 (98.7%) | 4 (1.3%) |
| 3 or 4 Children | 158 (100.0%) | 0 (0.0%) |
| 5 or more Children | 0 (0.0%) | 0 (0.0%) |
| Total | 1,248 (93.6%) | 85 (6.4%) |
Income Below Poverty Among Single-Parent Households in Magnolia
According to the poverty data in Magnolia, 11.0% or 26 single-father households and 60.1% or 310 single-mother households are living below the poverty line. Among single-father households, those with no children have the highest poverty rate, with 26 households (27.7%) experiencing poverty. Likewise, among single-mother households, those with 3 or 4 children have the highest poverty rate, with 86 households (100.0%) falling below the poverty line.
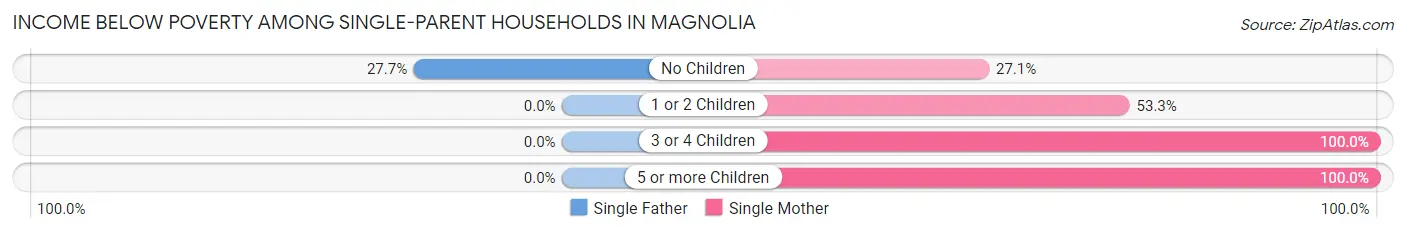
| Children | Single Father | Single Mother |
| No Children | 26 (27.7%) | 26 (27.1%) |
| 1 or 2 Children | 0 (0.0%) | 155 (53.3%) |
| 3 or 4 Children | 0 (0.0%) | 86 (100.0%) |
| 5 or more Children | 0 (0.0%) | 43 (100.0%) |
| Total | 26 (11.0%) | 310 (60.1%) |
Income Below Poverty Among Married-Couple vs Single-Parent Households in Magnolia
The poverty data for Magnolia shows that 85 of the married-couple family households (6.4%) and 336 of the single-parent households (44.7%) are living below the poverty level. Within the married-couple family households, those with no children have the highest poverty rate, with 81 households (9.3%) falling below the poverty line. Among the single-parent households, those with 5 or more children have the highest poverty rate, with 43 household (100.0%) living below poverty.
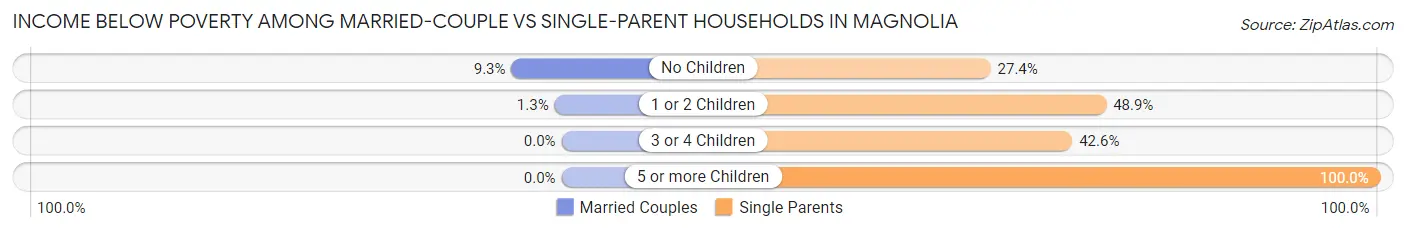
| Children | Married-Couple Families | Single-Parent Households |
| No Children | 81 (9.3%) | 52 (27.4%) |
| 1 or 2 Children | 4 (1.3%) | 155 (48.9%) |
| 3 or 4 Children | 0 (0.0%) | 86 (42.6%) |
| 5 or more Children | 0 (0.0%) | 43 (100.0%) |
| Total | 85 (6.4%) | 336 (44.7%) |
Race in Magnolia
The most populous races in Magnolia are White / Caucasian (5,789 | 52.4%), Black / African American (4,861 | 44.0%), and Hispanic or Latino (503 | 4.5%).
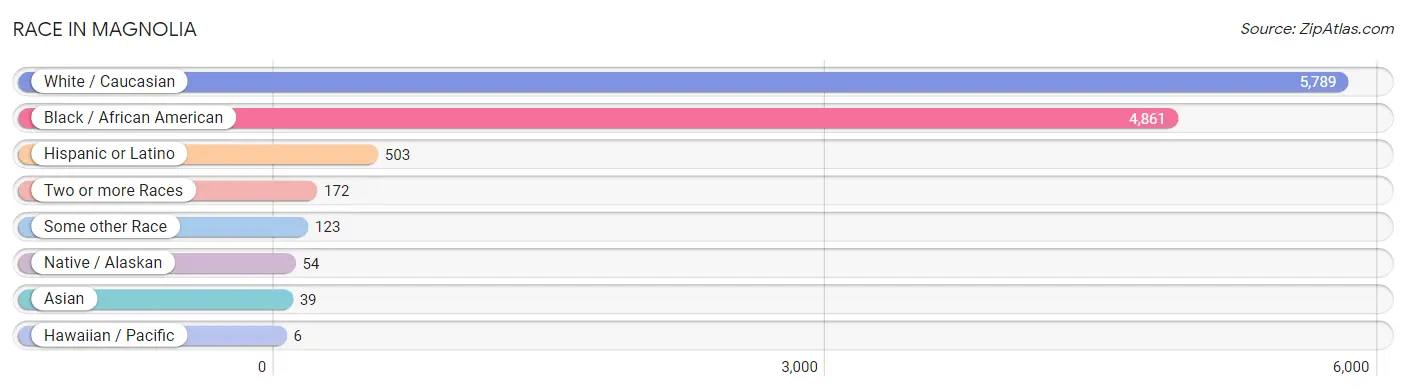
| Race | # Population | % Population |
| Asian | 39 | 0.4% |
| Black / African American | 4,861 | 44.0% |
| Hawaiian / Pacific | 6 | 0.1% |
| Hispanic or Latino | 503 | 4.5% |
| Native / Alaskan | 54 | 0.5% |
| White / Caucasian | 5,789 | 52.4% |
| Two or more Races | 172 | 1.6% |
| Some other Race | 123 | 1.1% |
| Total | 11,044 | 100.0% |
Ancestry in Magnolia
The most populous ancestries reported in Magnolia are American (1,560 | 14.1%), German (560 | 5.1%), Irish (493 | 4.5%), Mexican (446 | 4.0%), and Subsaharan African (404 | 3.7%), together accounting for 31.4% of all Magnolia residents.
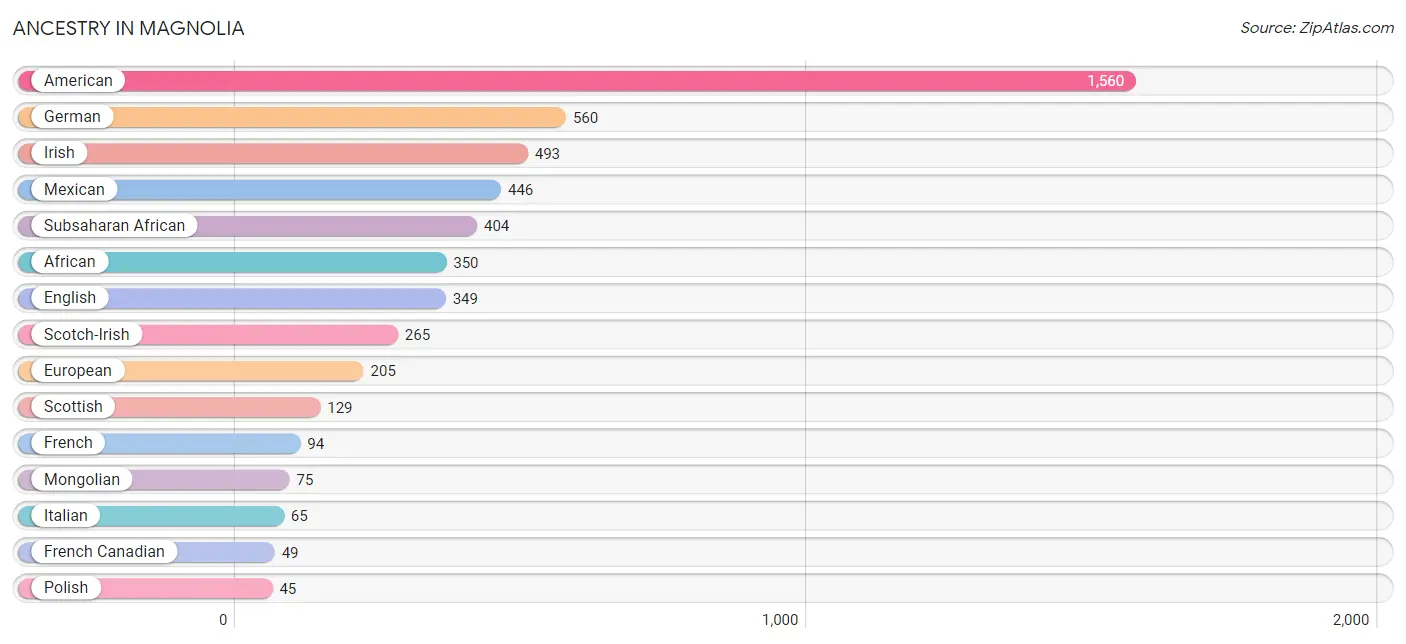
| Ancestry | # Population | % Population |
| African | 350 | 3.2% |
| American | 1,560 | 14.1% |
| Bhutanese | 6 | 0.1% |
| British | 22 | 0.2% |
| Central American | 8 | 0.1% |
| Cherokee | 29 | 0.3% |
| Choctaw | 17 | 0.2% |
| Czechoslovakian | 9 | 0.1% |
| Dutch | 20 | 0.2% |
| English | 349 | 3.2% |
| European | 205 | 1.9% |
| Finnish | 3 | 0.0% |
| French | 94 | 0.9% |
| French Canadian | 49 | 0.4% |
| German | 560 | 5.1% |
| Greek | 5 | 0.1% |
| Guamanian / Chamorro | 6 | 0.1% |
| Irish | 493 | 4.5% |
| Italian | 65 | 0.6% |
| Jamaican | 11 | 0.1% |
| Korean | 3 | 0.0% |
| Mexican | 446 | 4.0% |
| Mongolian | 75 | 0.7% |
| Nigerian | 14 | 0.1% |
| Peruvian | 44 | 0.4% |
| Polish | 45 | 0.4% |
| Salvadoran | 8 | 0.1% |
| Scotch-Irish | 265 | 2.4% |
| Scottish | 129 | 1.2% |
| South American | 44 | 0.4% |
| Spanish American Indian | 44 | 0.4% |
| Sri Lankan | 33 | 0.3% |
| Subsaharan African | 404 | 3.7% |
| Swedish | 23 | 0.2% |
| Thai | 18 | 0.2% |
| Turkish | 5 | 0.1% | View All 36 Rows |
Immigrants in Magnolia
The most numerous immigrant groups reported in Magnolia came from Latin America (152 | 1.4%), Central America (148 | 1.3%), Mexico (148 | 1.3%), Africa (81 | 0.7%), and Asia (49 | 0.4%), together accounting for 5.2% of all Magnolia residents.
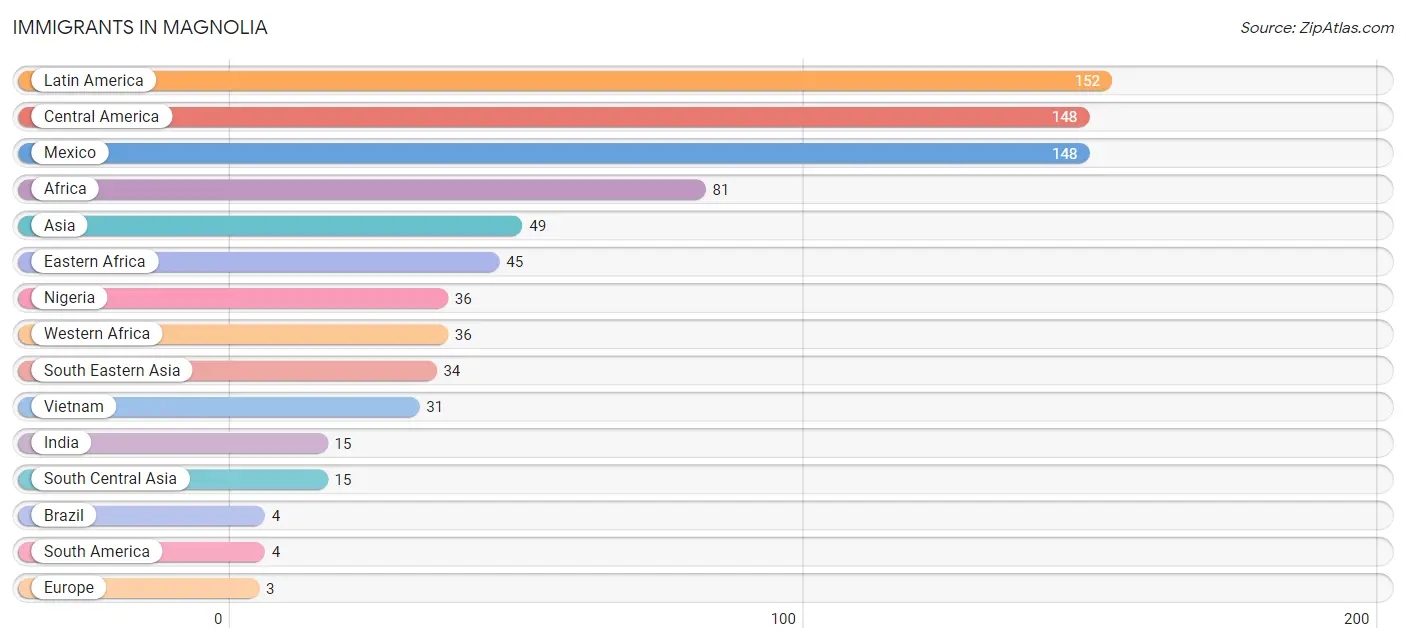
| Immigration Origin | # Population | % Population |
| Africa | 81 | 0.7% |
| Asia | 49 | 0.4% |
| Brazil | 4 | 0.0% |
| Central America | 148 | 1.3% |
| Eastern Africa | 45 | 0.4% |
| Europe | 3 | 0.0% |
| India | 15 | 0.1% |
| Kenya | 3 | 0.0% |
| Latin America | 152 | 1.4% |
| Mexico | 148 | 1.3% |
| Nigeria | 36 | 0.3% |
| Northern Europe | 3 | 0.0% |
| Philippines | 3 | 0.0% |
| South America | 4 | 0.0% |
| South Central Asia | 15 | 0.1% |
| South Eastern Asia | 34 | 0.3% |
| Vietnam | 31 | 0.3% |
| Western Africa | 36 | 0.3% | View All 18 Rows |
Sex and Age in Magnolia
Sex and Age in Magnolia
The most populous age groups in Magnolia are 20 to 24 Years (966 | 19.0%) for men and 25 to 29 Years (673 | 11.3%) for women.
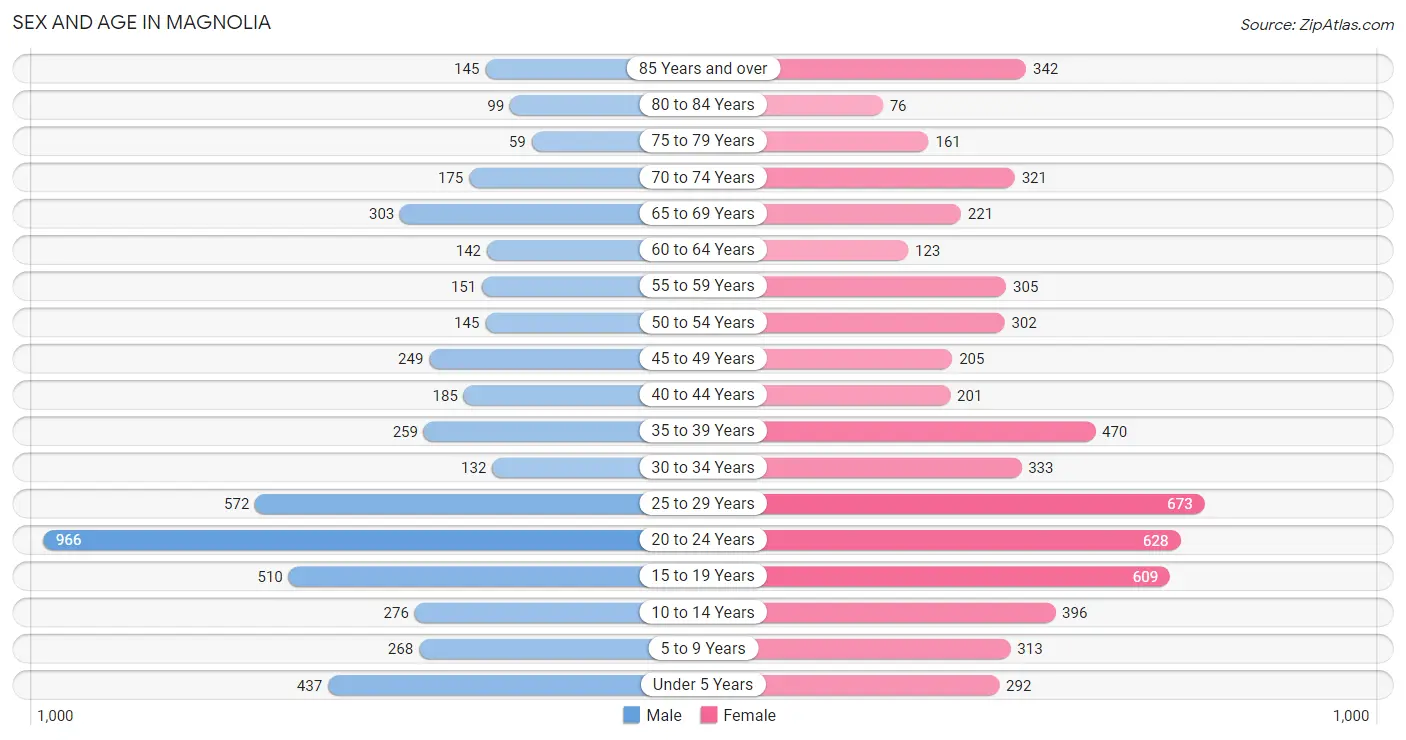
| Age Bracket | Male | Female |
| Under 5 Years | 437 (8.6%) | 292 (4.9%) |
| 5 to 9 Years | 268 (5.3%) | 313 (5.2%) |
| 10 to 14 Years | 276 (5.4%) | 396 (6.6%) |
| 15 to 19 Years | 510 (10.1%) | 609 (10.2%) |
| 20 to 24 Years | 966 (19.0%) | 628 (10.5%) |
| 25 to 29 Years | 572 (11.3%) | 673 (11.3%) |
| 30 to 34 Years | 132 (2.6%) | 333 (5.6%) |
| 35 to 39 Years | 259 (5.1%) | 470 (7.9%) |
| 40 to 44 Years | 185 (3.6%) | 201 (3.4%) |
| 45 to 49 Years | 249 (4.9%) | 205 (3.4%) |
| 50 to 54 Years | 145 (2.9%) | 302 (5.1%) |
| 55 to 59 Years | 151 (3.0%) | 305 (5.1%) |
| 60 to 64 Years | 142 (2.8%) | 123 (2.1%) |
| 65 to 69 Years | 303 (6.0%) | 221 (3.7%) |
| 70 to 74 Years | 175 (3.5%) | 321 (5.4%) |
| 75 to 79 Years | 59 (1.2%) | 161 (2.7%) |
| 80 to 84 Years | 99 (1.9%) | 76 (1.3%) |
| 85 Years and over | 145 (2.9%) | 342 (5.7%) |
| Total | 5,073 (100.0%) | 5,971 (100.0%) |
Families and Households in Magnolia
Median Family Size in Magnolia
The median family size in Magnolia is 3.55 persons per family, with single female/mother families (516 | 24.7%) accounting for the largest median family size of 4.29 persons per family. On the other hand, single male/father families (236 | 11.3%) represent the smallest median family size with 2.72 persons per family.
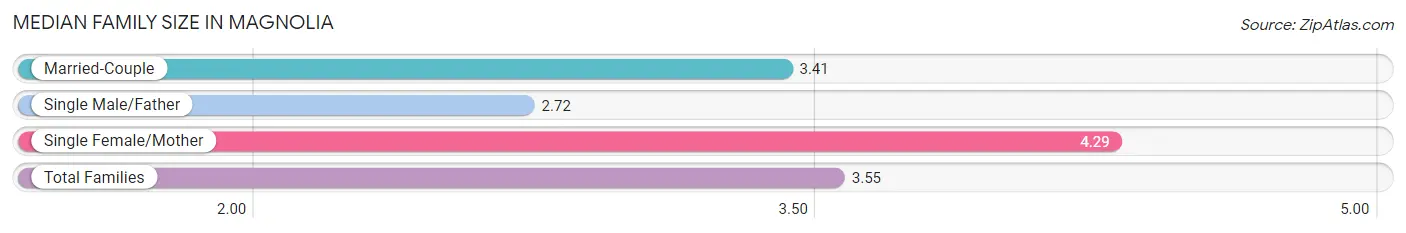
| Family Type | # Families | Family Size |
| Married-Couple | 1,333 (63.9%) | 3.41 |
| Single Male/Father | 236 (11.3%) | 2.72 |
| Single Female/Mother | 516 (24.7%) | 4.29 |
| Total Families | 2,085 (100.0%) | 3.55 |
Median Household Size in Magnolia
The median household size in Magnolia is 2.73 persons per household, with single female/mother households (516 | 15.4%) accounting for the largest median household size of 4.42 persons per household. non-family households (1,269 | 37.8%) represent the smallest median household size with 1.25 persons per household.
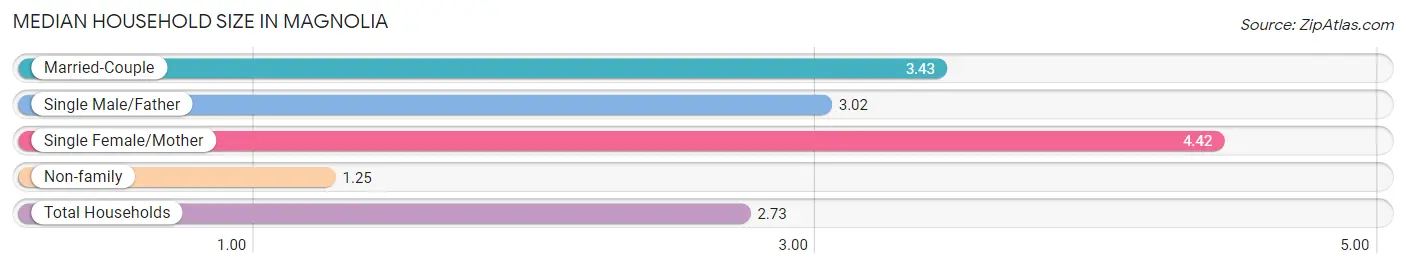
| Household Type | # Households | Household Size |
| Married-Couple | 1,333 (39.7%) | 3.43 |
| Single Male/Father | 236 (7.0%) | 3.02 |
| Single Female/Mother | 516 (15.4%) | 4.42 |
| Non-family | 1,269 (37.8%) | 1.25 |
| Total Households | 3,354 (100.0%) | 2.73 |
Household Size by Marriage Status in Magnolia
Out of a total of 3,354 households in Magnolia, 2,085 (62.2%) are family households, while 1,269 (37.8%) are nonfamily households. The most numerous type of family households are 2-person households, comprising 1,115, and the most common type of nonfamily households are 1-person households, comprising 1,097.
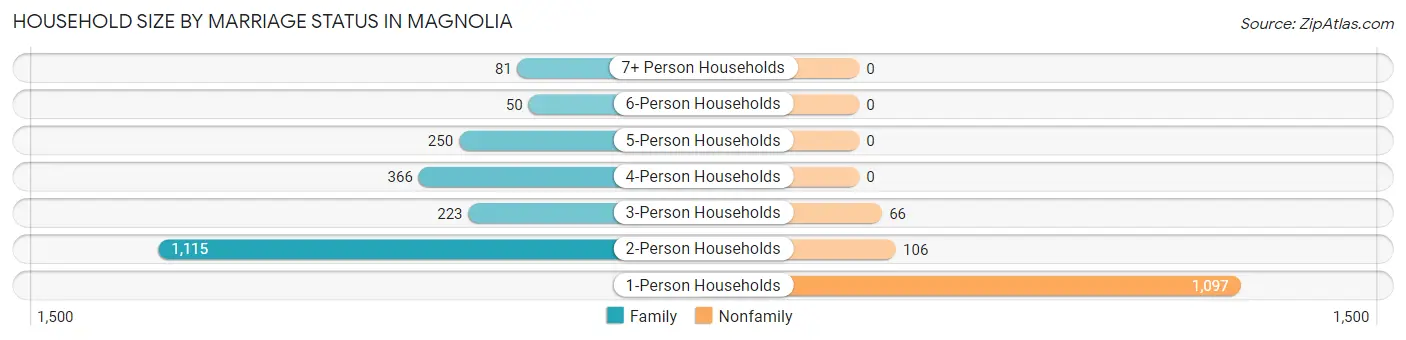
| Household Size | Family Households | Nonfamily Households |
| 1-Person Households | - | 1,097 (32.7%) |
| 2-Person Households | 1,115 (33.2%) | 106 (3.2%) |
| 3-Person Households | 223 (6.7%) | 66 (2.0%) |
| 4-Person Households | 366 (10.9%) | 0 (0.0%) |
| 5-Person Households | 250 (7.4%) | 0 (0.0%) |
| 6-Person Households | 50 (1.5%) | 0 (0.0%) |
| 7+ Person Households | 81 (2.4%) | 0 (0.0%) |
| Total | 2,085 (62.2%) | 1,269 (37.8%) |
Female Fertility in Magnolia
Fertility by Age in Magnolia
Average fertility rate in Magnolia is 46.0 births per 1,000 women. Women in the age bracket of 20 to 34 years have the highest fertility rate with 83.0 births per 1,000 women. Women in the age bracket of 20 to 34 years acount for 93.1% of all women with births.
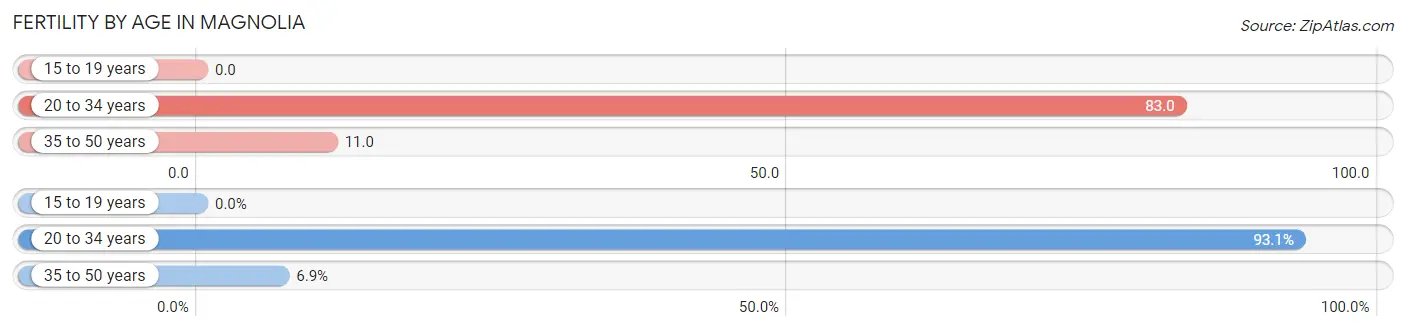
| Age Bracket | Women with Births | Births / 1,000 Women |
| 15 to 19 years | 0 (0.0%) | 0.0 |
| 20 to 34 years | 135 (93.1%) | 83.0 |
| 35 to 50 years | 10 (6.9%) | 11.0 |
| Total | 145 (100.0%) | 46.0 |
Fertility by Age by Marriage Status in Magnolia
75.2% of women with births (145) in Magnolia are married. The highest percentage of unmarried women with births falls into 20 to 34 years age bracket with 26.7% of them unmarried at the time of birth, while the lowest percentage of unmarried women with births belong to 35 to 50 years age bracket with 0.0% of them unmarried.
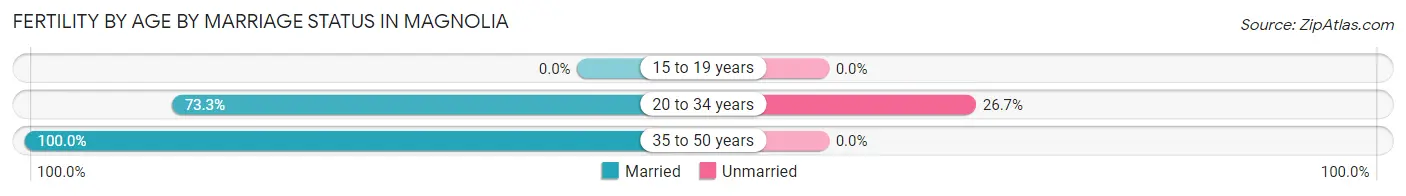
| Age Bracket | Married | Unmarried |
| 15 to 19 years | 0 (0.0%) | 0 (0.0%) |
| 20 to 34 years | 99 (73.3%) | 36 (26.7%) |
| 35 to 50 years | 10 (100.0%) | 0 (0.0%) |
| Total | 109 (75.2%) | 36 (24.8%) |
Fertility by Education in Magnolia
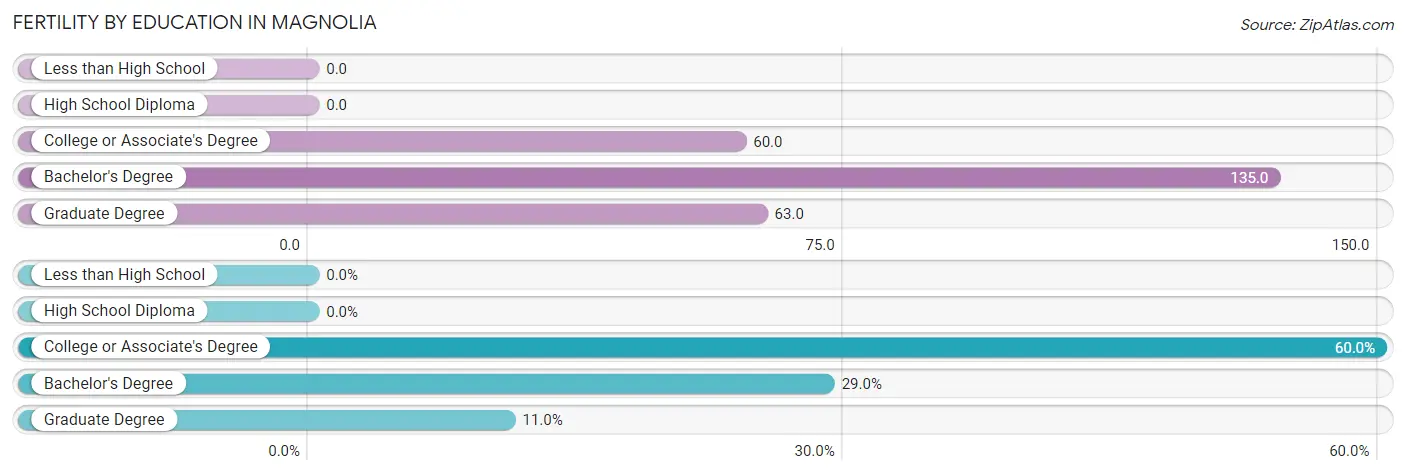
| Educational Attainment | Women with Births | Births / 1,000 Women |
| Less than High School | 0 (0.0%) | 0.0 |
| High School Diploma | 0 (0.0%) | 0.0 |
| College or Associate's Degree | 87 (60.0%) | 60.0 |
| Bachelor's Degree | 42 (29.0%) | 135.0 |
| Graduate Degree | 16 (11.0%) | 63.0 |
| Total | 145 (100.0%) | 46.0 |
Fertility by Education by Marriage Status in Magnolia
24.8% of women with births in Magnolia are unmarried. Women with the educational attainment of bachelor's degree are most likely to be married with 100.0% of them married at childbirth, while women with the educational attainment of college or associate's degree are least likely to be married with 41.4% of them unmarried at childbirth.
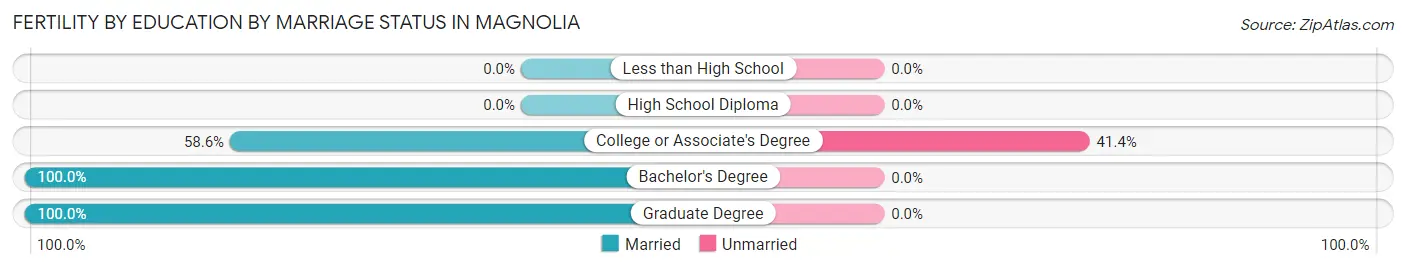
| Educational Attainment | Married | Unmarried |
| Less than High School | 0 (0.0%) | 0 (0.0%) |
| High School Diploma | 0 (0.0%) | 0 (0.0%) |
| College or Associate's Degree | 51 (58.6%) | 36 (41.4%) |
| Bachelor's Degree | 42 (100.0%) | 0 (0.0%) |
| Graduate Degree | 16 (100.0%) | 0 (0.0%) |
| Total | 109 (75.2%) | 36 (24.8%) |
Employment Characteristics in Magnolia
Employment by Class of Employer in Magnolia
Among the 4,425 employed individuals in Magnolia, private company employees (2,744 | 62.0%), state government employees (612 | 13.8%), and not-for-profit organizations (472 | 10.7%) make up the most common classes of employment.
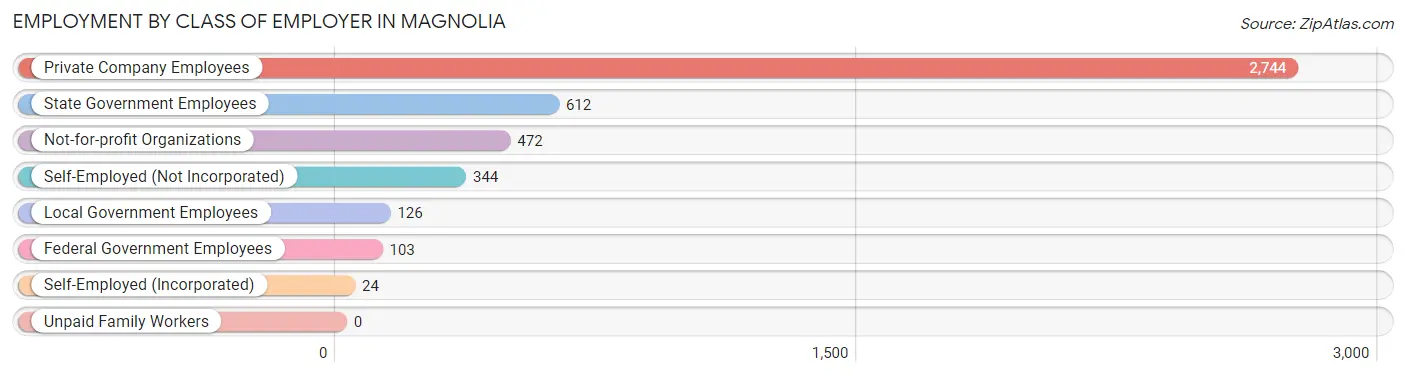
| Employer Class | # Employees | % Employees |
| Private Company Employees | 2,744 | 62.0% |
| Self-Employed (Incorporated) | 24 | 0.5% |
| Self-Employed (Not Incorporated) | 344 | 7.8% |
| Not-for-profit Organizations | 472 | 10.7% |
| Local Government Employees | 126 | 2.9% |
| State Government Employees | 612 | 13.8% |
| Federal Government Employees | 103 | 2.3% |
| Unpaid Family Workers | 0 | 0.0% |
| Total | 4,425 | 100.0% |
Employment Status by Age in Magnolia
According to the labor force statistics for Magnolia, out of the total population over 16 years of age (8,914), 51.7% or 4,609 individuals are in the labor force, with 3.8% or 175 of them unemployed. The age group with the highest labor force participation rate is 30 to 34 years, with 89.7% or 417 individuals in the labor force. Within the labor force, the 35 to 44 years age range has the highest percentage of unemployed individuals, with 9.5% or 76 of them being unemployed.
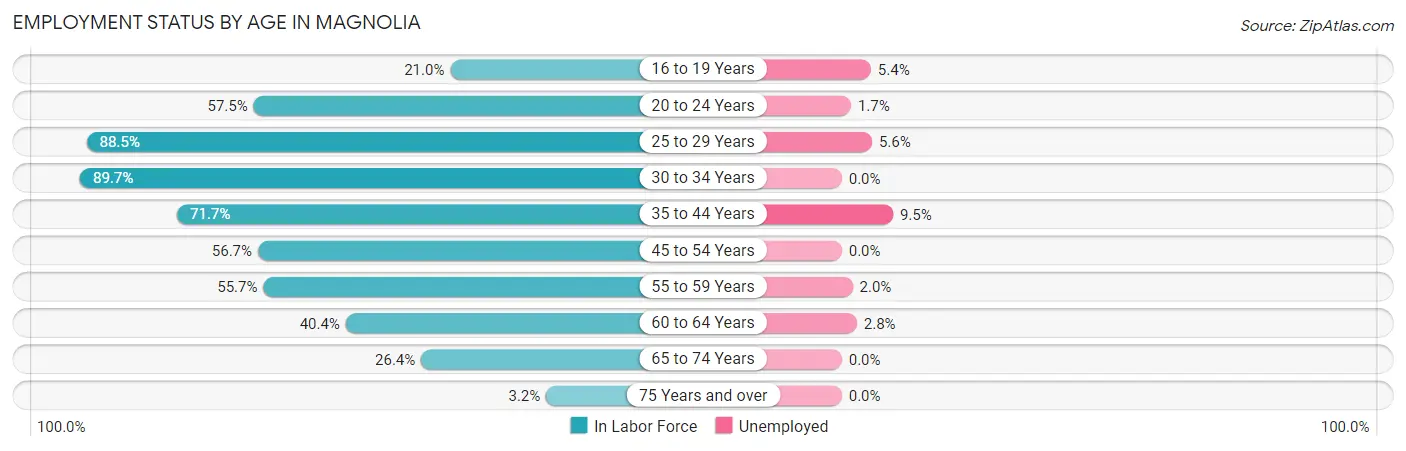
| Age Bracket | In Labor Force | Unemployed |
| 16 to 19 Years | 204 (21.0%) | 11 (5.4%) |
| 20 to 24 Years | 917 (57.5%) | 16 (1.7%) |
| 25 to 29 Years | 1,102 (88.5%) | 62 (5.6%) |
| 30 to 34 Years | 417 (89.7%) | 0 (0.0%) |
| 35 to 44 Years | 799 (71.7%) | 76 (9.5%) |
| 45 to 54 Years | 511 (56.7%) | 0 (0.0%) |
| 55 to 59 Years | 254 (55.7%) | 5 (2.0%) |
| 60 to 64 Years | 107 (40.4%) | 3 (2.8%) |
| 65 to 74 Years | 269 (26.4%) | 0 (0.0%) |
| 75 Years and over | 28 (3.2%) | 0 (0.0%) |
| Total | 4,609 (51.7%) | 175 (3.8%) |
Employment Status by Educational Attainment in Magnolia
According to labor force statistics for Magnolia, 71.8% of individuals (3,193) out of the total population between 25 and 64 years of age (4,447) are in the labor force, with 4.6% or 147 of them being unemployed. The group with the highest labor force participation rate are those with the educational attainment of bachelor's degree or higher, with 89.6% or 855 individuals in the labor force. Within the labor force, individuals with high school diploma education have the highest percentage of unemployment, with 10.7% or 102 of them being unemployed.
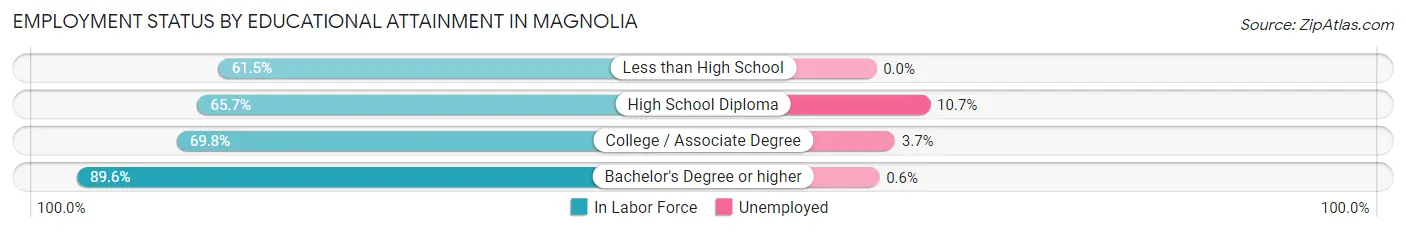
| Educational Attainment | In Labor Force | Unemployed |
| Less than High School | 323 (61.5%) | 0 (0.0%) |
| High School Diploma | 952 (65.7%) | 155 (10.7%) |
| College / Associate Degree | 1,060 (69.8%) | 56 (3.7%) |
| Bachelor's Degree or higher | 855 (89.6%) | 6 (0.6%) |
| Total | 3,193 (71.8%) | 205 (4.6%) |
Employment Occupations by Sex in Magnolia
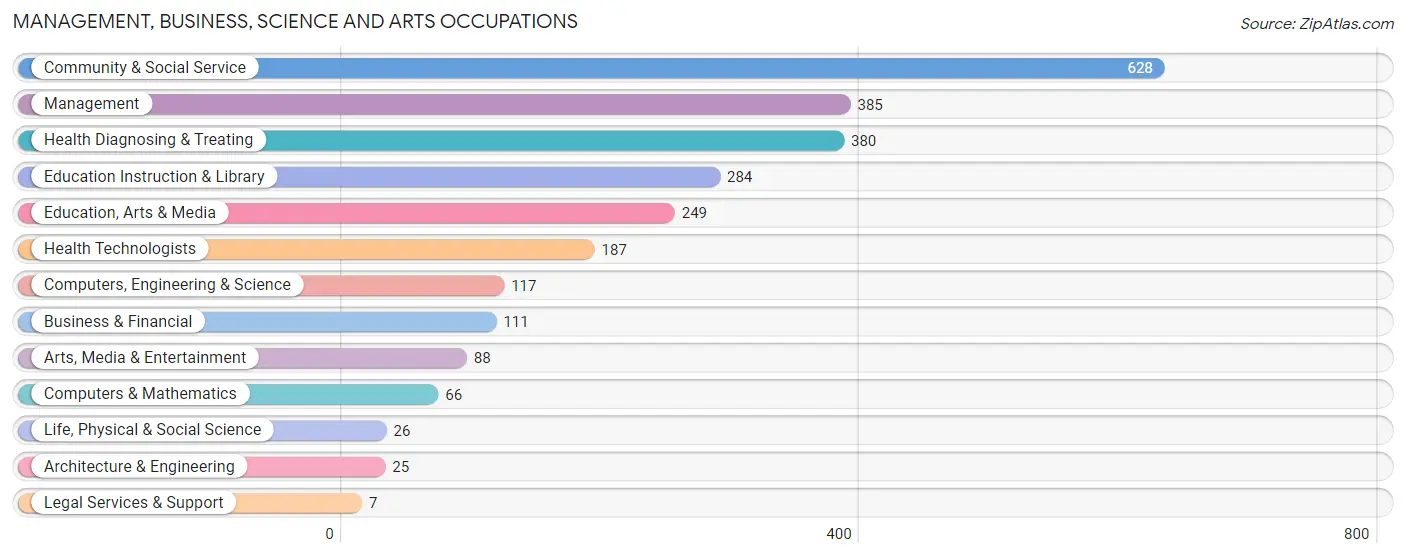
Management, Business, Science and Arts Occupations
The most common Management, Business, Science and Arts occupations in Magnolia are Community & Social Service (628 | 14.2%), Management (385 | 8.7%), Health Diagnosing & Treating (380 | 8.6%), Education Instruction & Library (284 | 6.4%), and Education, Arts & Media (249 | 5.6%).
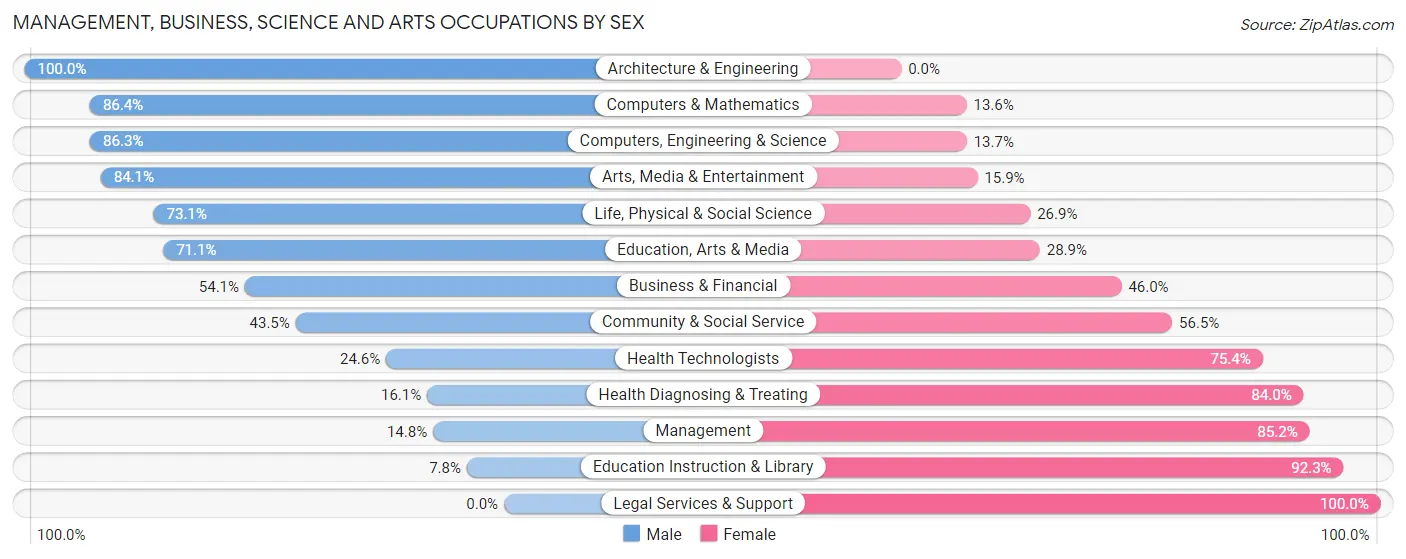
Management, Business, Science and Arts Occupations by Sex
Within the Management, Business, Science and Arts occupations in Magnolia, the most male-oriented occupations are Architecture & Engineering (100.0%), Computers & Mathematics (86.4%), and Computers, Engineering & Science (86.3%), while the most female-oriented occupations are Legal Services & Support (100.0%), Education Instruction & Library (92.2%), and Management (85.2%).
| Occupation | Male | Female |
| Management | 57 (14.8%) | 328 (85.2%) |
| Business & Financial | 60 (54.0%) | 51 (46.0%) |
| Computers, Engineering & Science | 101 (86.3%) | 16 (13.7%) |
| Computers & Mathematics | 57 (86.4%) | 9 (13.6%) |
| Architecture & Engineering | 25 (100.0%) | 0 (0.0%) |
| Life, Physical & Social Science | 19 (73.1%) | 7 (26.9%) |
| Community & Social Service | 273 (43.5%) | 355 (56.5%) |
| Education, Arts & Media | 177 (71.1%) | 72 (28.9%) |
| Legal Services & Support | 0 (0.0%) | 7 (100.0%) |
| Education Instruction & Library | 22 (7.7%) | 262 (92.2%) |
| Arts, Media & Entertainment | 74 (84.1%) | 14 (15.9%) |
| Health Diagnosing & Treating | 61 (16.1%) | 319 (84.0%) |
| Health Technologists | 46 (24.6%) | 141 (75.4%) |
| Total (Category) | 552 (34.1%) | 1,069 (65.9%) |
| Total (Overall) | 1,962 (44.2%) | 2,473 (55.8%) |
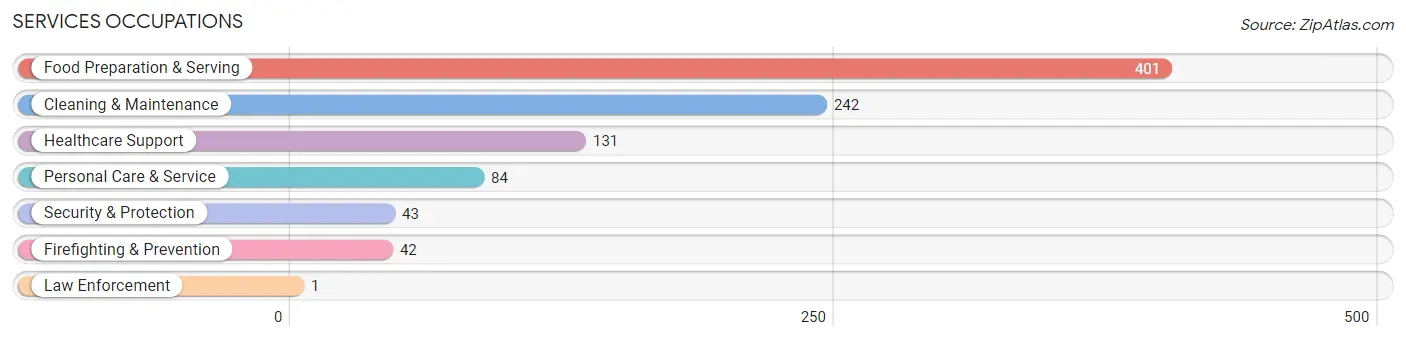
Services Occupations
The most common Services occupations in Magnolia are Food Preparation & Serving (401 | 9.0%), Cleaning & Maintenance (242 | 5.5%), Healthcare Support (131 | 2.9%), Personal Care & Service (84 | 1.9%), and Security & Protection (43 | 1.0%).
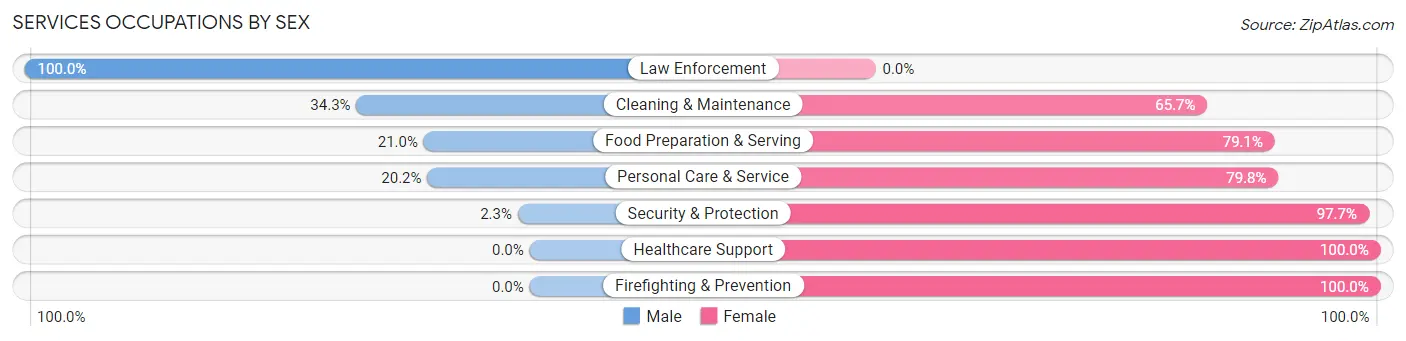
Services Occupations by Sex
Within the Services occupations in Magnolia, the most male-oriented occupations are Law Enforcement (100.0%), Cleaning & Maintenance (34.3%), and Food Preparation & Serving (20.9%), while the most female-oriented occupations are Healthcare Support (100.0%), Firefighting & Prevention (100.0%), and Security & Protection (97.7%).
| Occupation | Male | Female |
| Healthcare Support | 0 (0.0%) | 131 (100.0%) |
| Security & Protection | 1 (2.3%) | 42 (97.7%) |
| Firefighting & Prevention | 0 (0.0%) | 42 (100.0%) |
| Law Enforcement | 1 (100.0%) | 0 (0.0%) |
| Food Preparation & Serving | 84 (20.9%) | 317 (79.0%) |
| Cleaning & Maintenance | 83 (34.3%) | 159 (65.7%) |
| Personal Care & Service | 17 (20.2%) | 67 (79.8%) |
| Total (Category) | 185 (20.5%) | 716 (79.5%) |
| Total (Overall) | 1,962 (44.2%) | 2,473 (55.8%) |
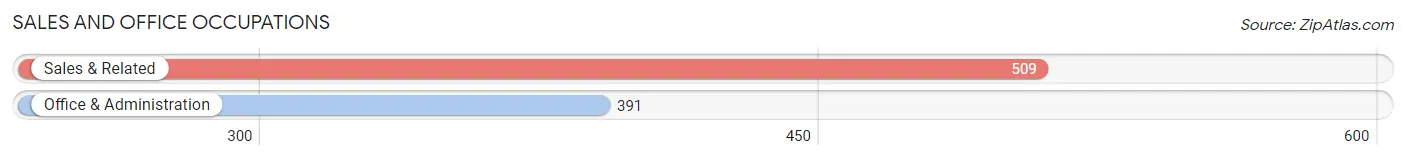
Sales and Office Occupations
The most common Sales and Office occupations in Magnolia are Sales & Related (509 | 11.5%), and Office & Administration (391 | 8.8%).
Sales and Office Occupations by Sex
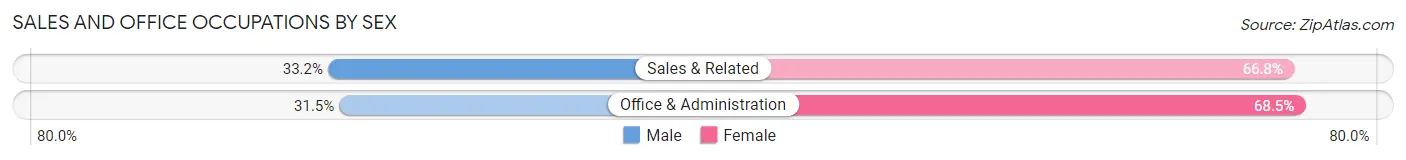
| Occupation | Male | Female |
| Sales & Related | 169 (33.2%) | 340 (66.8%) |
| Office & Administration | 123 (31.5%) | 268 (68.5%) |
| Total (Category) | 292 (32.4%) | 608 (67.6%) |
| Total (Overall) | 1,962 (44.2%) | 2,473 (55.8%) |
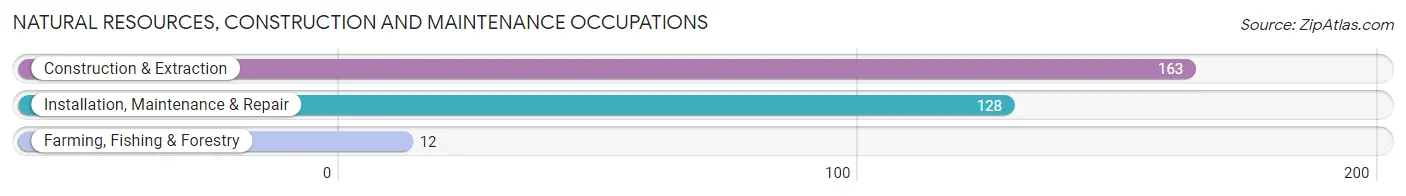
Natural Resources, Construction and Maintenance Occupations
The most common Natural Resources, Construction and Maintenance occupations in Magnolia are Construction & Extraction (163 | 3.7%), Installation, Maintenance & Repair (128 | 2.9%), and Farming, Fishing & Forestry (12 | 0.3%).
Natural Resources, Construction and Maintenance Occupations by Sex
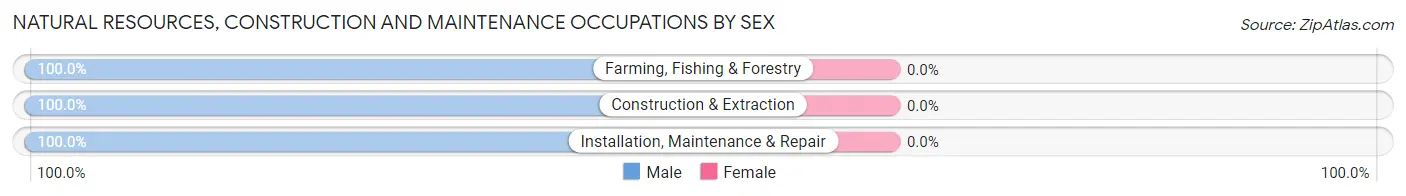
| Occupation | Male | Female |
| Farming, Fishing & Forestry | 12 (100.0%) | 0 (0.0%) |
| Construction & Extraction | 163 (100.0%) | 0 (0.0%) |
| Installation, Maintenance & Repair | 128 (100.0%) | 0 (0.0%) |
| Total (Category) | 303 (100.0%) | 0 (0.0%) |
| Total (Overall) | 1,962 (44.2%) | 2,473 (55.8%) |
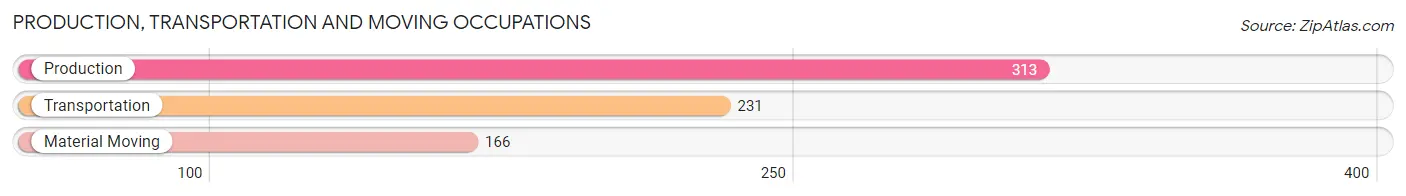
Production, Transportation and Moving Occupations
The most common Production, Transportation and Moving occupations in Magnolia are Production (313 | 7.1%), Transportation (231 | 5.2%), and Material Moving (166 | 3.7%).
Production, Transportation and Moving Occupations by Sex
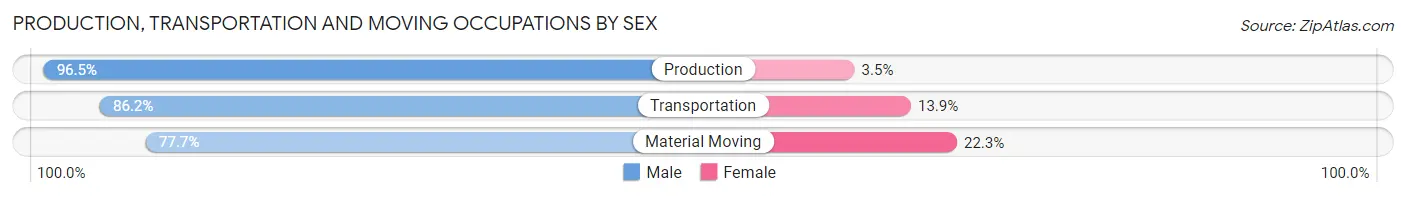
| Occupation | Male | Female |
| Production | 302 (96.5%) | 11 (3.5%) |
| Transportation | 199 (86.2%) | 32 (13.9%) |
| Material Moving | 129 (77.7%) | 37 (22.3%) |
| Total (Category) | 630 (88.7%) | 80 (11.3%) |
| Total (Overall) | 1,962 (44.2%) | 2,473 (55.8%) |
Employment Industries by Sex in Magnolia
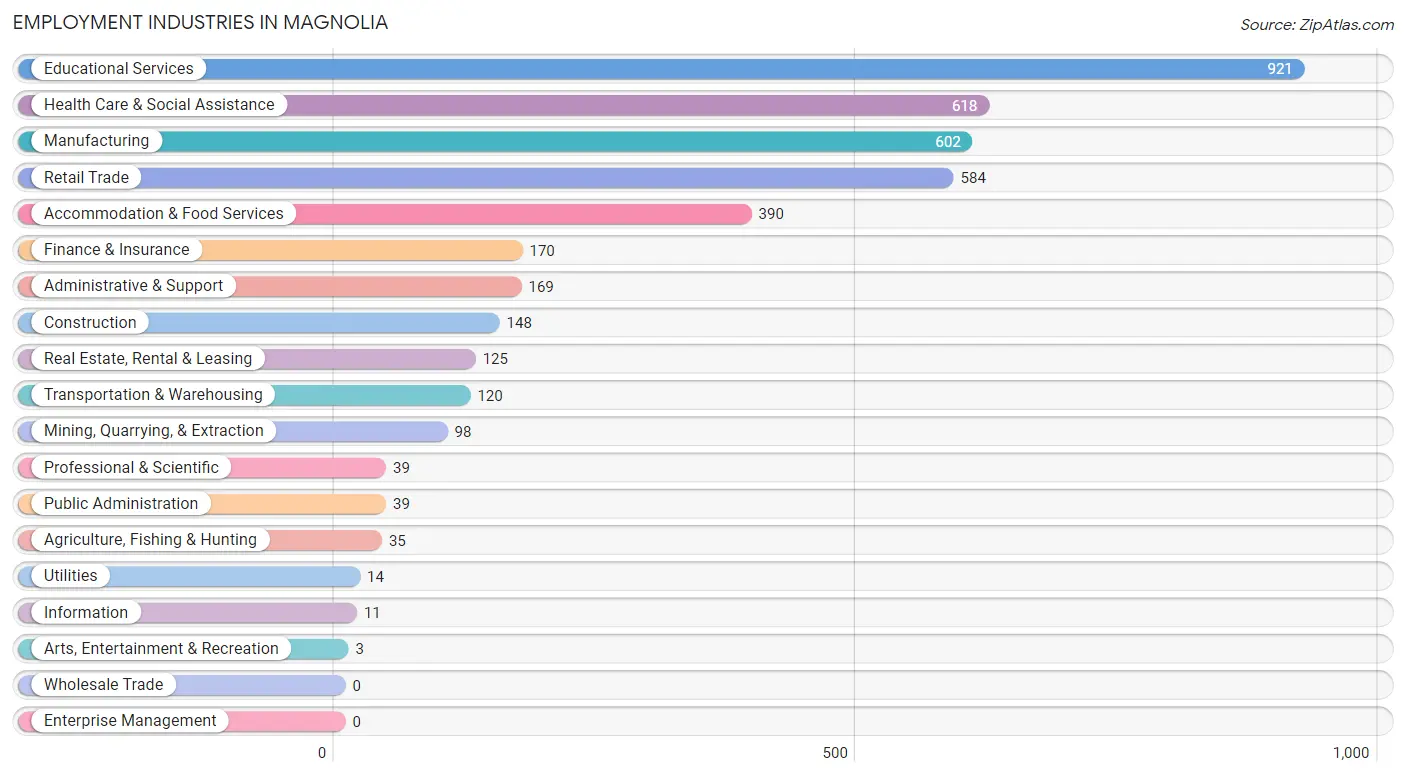
Employment Industries in Magnolia
The major employment industries in Magnolia include Educational Services (921 | 20.8%), Health Care & Social Assistance (618 | 13.9%), Manufacturing (602 | 13.6%), Retail Trade (584 | 13.2%), and Accommodation & Food Services (390 | 8.8%).
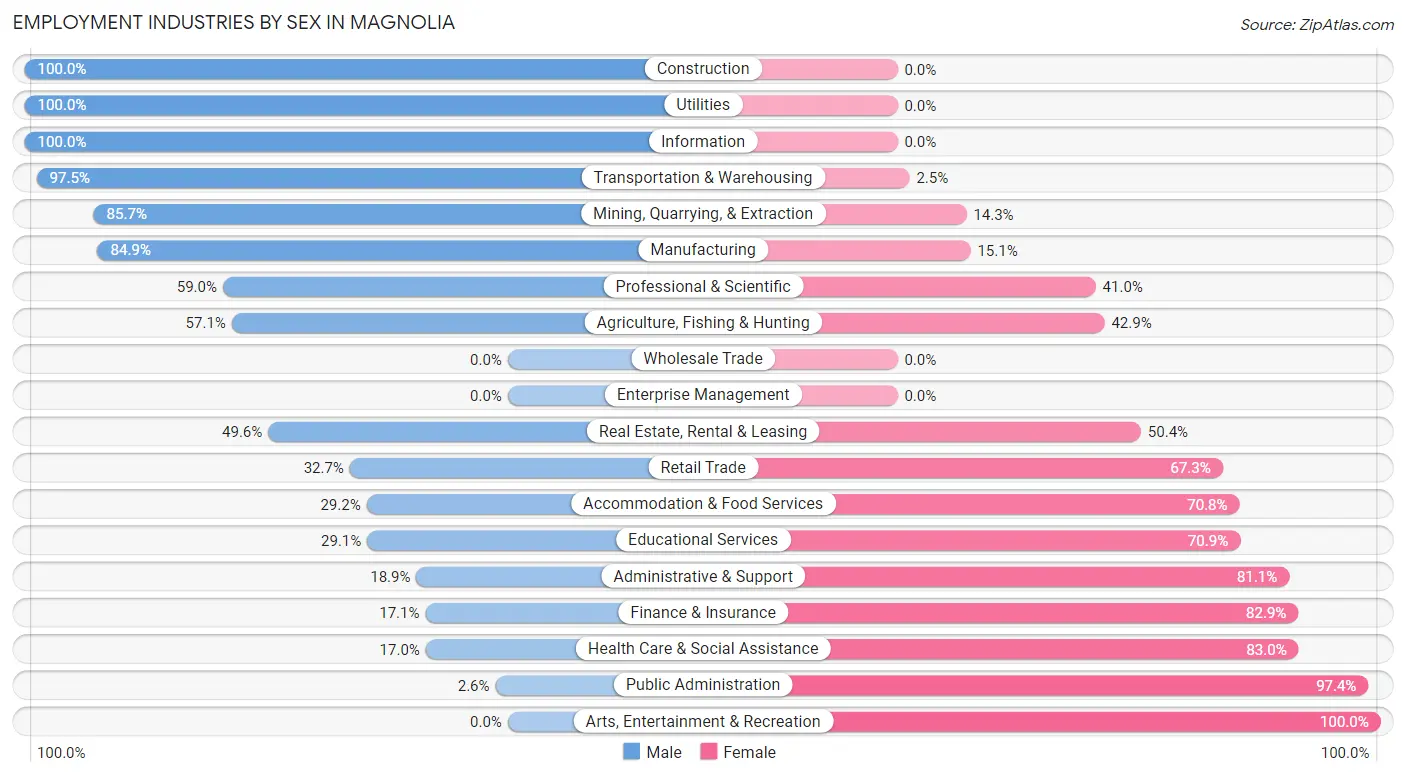
Employment Industries by Sex in Magnolia
The Magnolia industries that see more men than women are Construction (100.0%), Utilities (100.0%), and Information (100.0%), whereas the industries that tend to have a higher number of women are Arts, Entertainment & Recreation (100.0%), Public Administration (97.4%), and Health Care & Social Assistance (83.0%).
| Industry | Male | Female |
| Agriculture, Fishing & Hunting | 20 (57.1%) | 15 (42.9%) |
| Mining, Quarrying, & Extraction | 84 (85.7%) | 14 (14.3%) |
| Construction | 148 (100.0%) | 0 (0.0%) |
| Manufacturing | 511 (84.9%) | 91 (15.1%) |
| Wholesale Trade | 0 (0.0%) | 0 (0.0%) |
| Retail Trade | 191 (32.7%) | 393 (67.3%) |
| Transportation & Warehousing | 117 (97.5%) | 3 (2.5%) |
| Utilities | 14 (100.0%) | 0 (0.0%) |
| Information | 11 (100.0%) | 0 (0.0%) |
| Finance & Insurance | 29 (17.1%) | 141 (82.9%) |
| Real Estate, Rental & Leasing | 62 (49.6%) | 63 (50.4%) |
| Professional & Scientific | 23 (59.0%) | 16 (41.0%) |
| Enterprise Management | 0 (0.0%) | 0 (0.0%) |
| Administrative & Support | 32 (18.9%) | 137 (81.1%) |
| Educational Services | 268 (29.1%) | 653 (70.9%) |
| Health Care & Social Assistance | 105 (17.0%) | 513 (83.0%) |
| Arts, Entertainment & Recreation | 0 (0.0%) | 3 (100.0%) |
| Accommodation & Food Services | 114 (29.2%) | 276 (70.8%) |
| Public Administration | 1 (2.6%) | 38 (97.4%) |
| Total | 1,962 (44.2%) | 2,473 (55.8%) |
Education in Magnolia
School Enrollment in Magnolia
The most common levels of schooling among the 3,790 students in Magnolia are college / undergraduate (2,171 | 57.3%), middle school (511 | 13.5%), and kindergarten (312 | 8.2%).
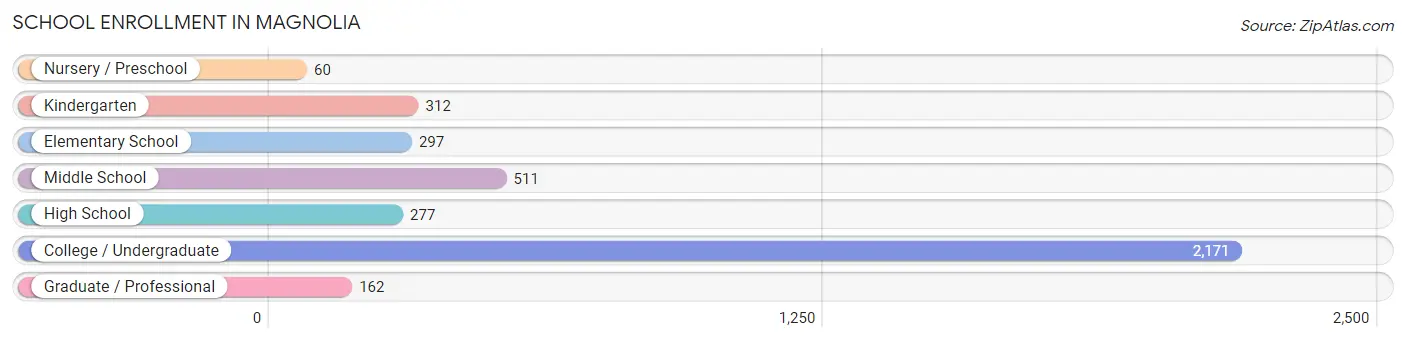
| School Level | # Students | % Students |
| Nursery / Preschool | 60 | 1.6% |
| Kindergarten | 312 | 8.2% |
| Elementary School | 297 | 7.8% |
| Middle School | 511 | 13.5% |
| High School | 277 | 7.3% |
| College / Undergraduate | 2,171 | 57.3% |
| Graduate / Professional | 162 | 4.3% |
| Total | 3,790 | 100.0% |
School Enrollment by Age by Funding Source in Magnolia
Out of a total of 3,790 students who are enrolled in schools in Magnolia, 216 (5.7%) attend a private institution, while the remaining 3,574 (94.3%) are enrolled in public schools. The age group of 3 to 4 year olds has the highest likelihood of being enrolled in private schools, with 13 (21.7% in the age bracket) enrolled. Conversely, the age group of 18 to 19 year olds has the lowest likelihood of being enrolled in a private school, with 713 (98.9% in the age bracket) attending a public institution.
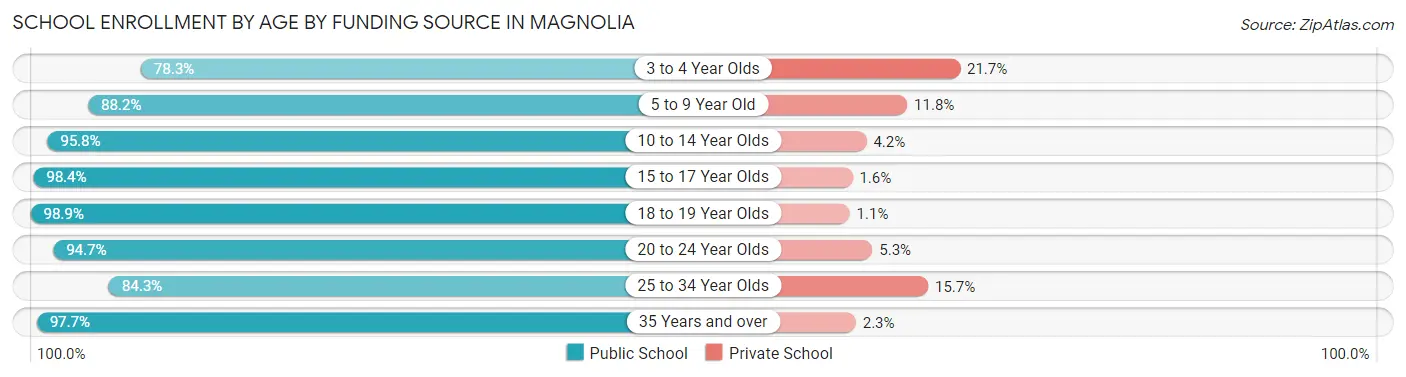
| Age Bracket | Public School | Private School |
| 3 to 4 Year Olds | 47 (78.3%) | 13 (21.7%) |
| 5 to 9 Year Old | 492 (88.2%) | 66 (11.8%) |
| 10 to 14 Year Olds | 564 (95.8%) | 25 (4.2%) |
| 15 to 17 Year Olds | 241 (98.4%) | 4 (1.6%) |
| 18 to 19 Year Olds | 713 (98.9%) | 8 (1.1%) |
| 20 to 24 Year Olds | 1,081 (94.7%) | 61 (5.3%) |
| 25 to 34 Year Olds | 177 (84.3%) | 33 (15.7%) |
| 35 Years and over | 259 (97.7%) | 6 (2.3%) |
| Total | 3,574 (94.3%) | 216 (5.7%) |
Educational Attainment by Field of Study in Magnolia
Physical & health sciences (311 | 24.0%), business (280 | 21.6%), literature & languages (142 | 11.0%), science & technology (129 | 10.0%), and education (127 | 9.8%) are the most common fields of study among 1,296 individuals in Magnolia who have obtained a bachelor's degree or higher.
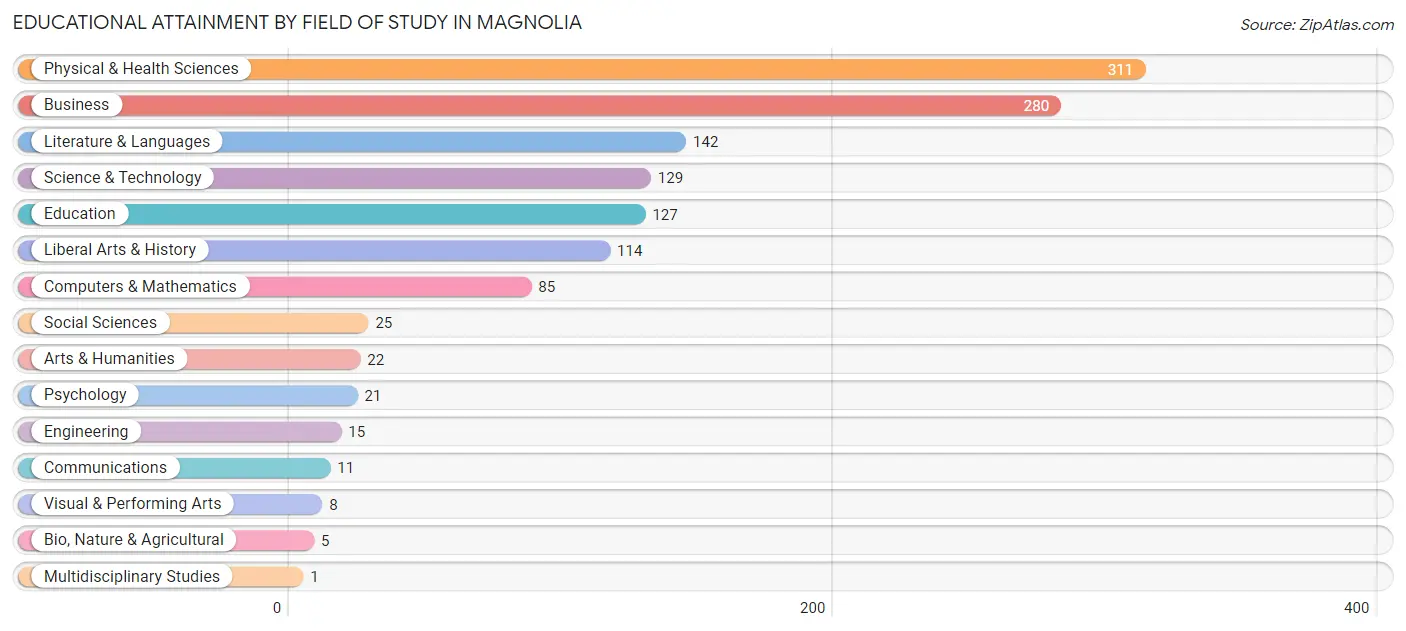
| Field of Study | # Graduates | % Graduates |
| Computers & Mathematics | 85 | 6.6% |
| Bio, Nature & Agricultural | 5 | 0.4% |
| Physical & Health Sciences | 311 | 24.0% |
| Psychology | 21 | 1.6% |
| Social Sciences | 25 | 1.9% |
| Engineering | 15 | 1.2% |
| Multidisciplinary Studies | 1 | 0.1% |
| Science & Technology | 129 | 10.0% |
| Business | 280 | 21.6% |
| Education | 127 | 9.8% |
| Literature & Languages | 142 | 11.0% |
| Liberal Arts & History | 114 | 8.8% |
| Visual & Performing Arts | 8 | 0.6% |
| Communications | 11 | 0.9% |
| Arts & Humanities | 22 | 1.7% |
| Total | 1,296 | 100.0% |
Transportation & Commute in Magnolia
Vehicle Availability by Sex in Magnolia
The most prevalent vehicle ownership categories in Magnolia are males with 2 vehicles (818, accounting for 51.4%) and females with 2 vehicles (700, making up 39.3%).
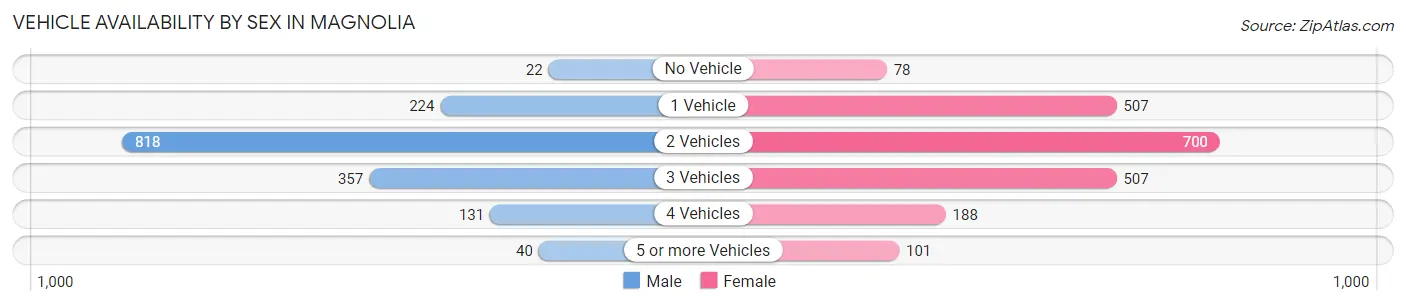
| Vehicles Available | Male | Female |
| No Vehicle | 22 (1.4%) | 78 (3.7%) |
| 1 Vehicle | 224 (14.1%) | 507 (24.4%) |
| 2 Vehicles | 818 (51.4%) | 700 (33.6%) |
| 3 Vehicles | 357 (22.4%) | 507 (24.4%) |
| 4 Vehicles | 131 (8.2%) | 188 (9.0%) |
| 5 or more Vehicles | 40 (2.5%) | 101 (4.9%) |
| Total | 1,592 (100.0%) | 2,081 (100.0%) |
Commute Time in Magnolia
The most frequently occuring commute durations in Magnolia are 5 to 9 minutes (1,390 commuters, 32.3%), 10 to 14 minutes (1,094 commuters, 25.4%), and 15 to 19 minutes (574 commuters, 13.3%).
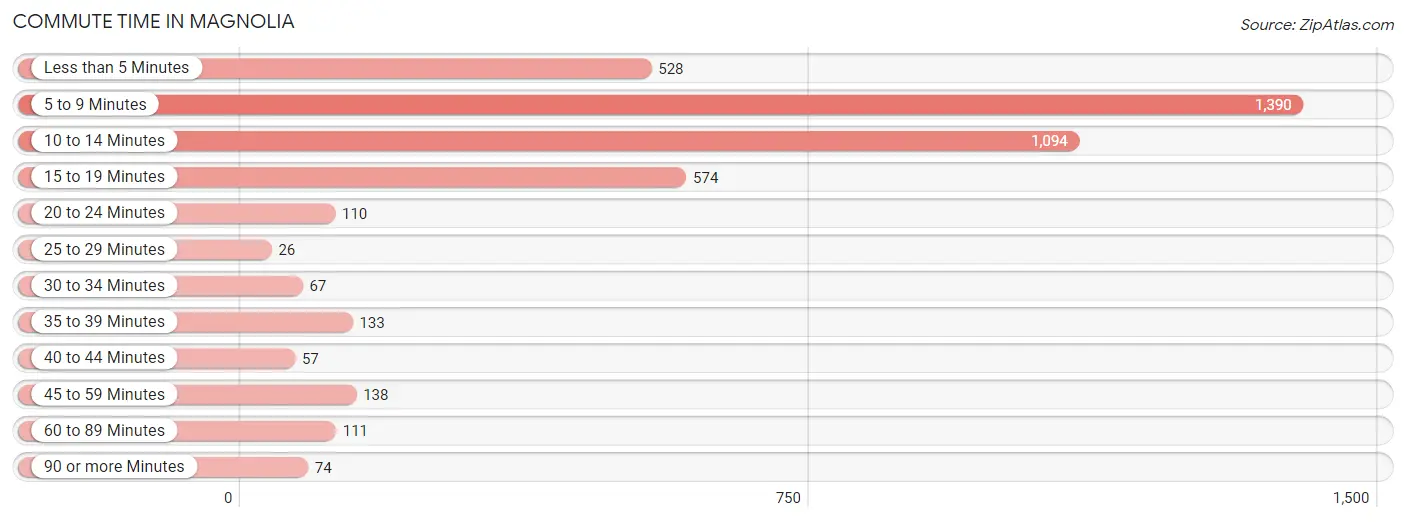
| Commute Time | # Commuters | % Commuters |
| Less than 5 Minutes | 528 | 12.3% |
| 5 to 9 Minutes | 1,390 | 32.3% |
| 10 to 14 Minutes | 1,094 | 25.4% |
| 15 to 19 Minutes | 574 | 13.3% |
| 20 to 24 Minutes | 110 | 2.6% |
| 25 to 29 Minutes | 26 | 0.6% |
| 30 to 34 Minutes | 67 | 1.6% |
| 35 to 39 Minutes | 133 | 3.1% |
| 40 to 44 Minutes | 57 | 1.3% |
| 45 to 59 Minutes | 138 | 3.2% |
| 60 to 89 Minutes | 111 | 2.6% |
| 90 or more Minutes | 74 | 1.7% |
Commute Time by Sex in Magnolia
The most common commute times in Magnolia are 5 to 9 minutes (684 commuters, 36.1%) for males and 5 to 9 minutes (706 commuters, 29.3%) for females.
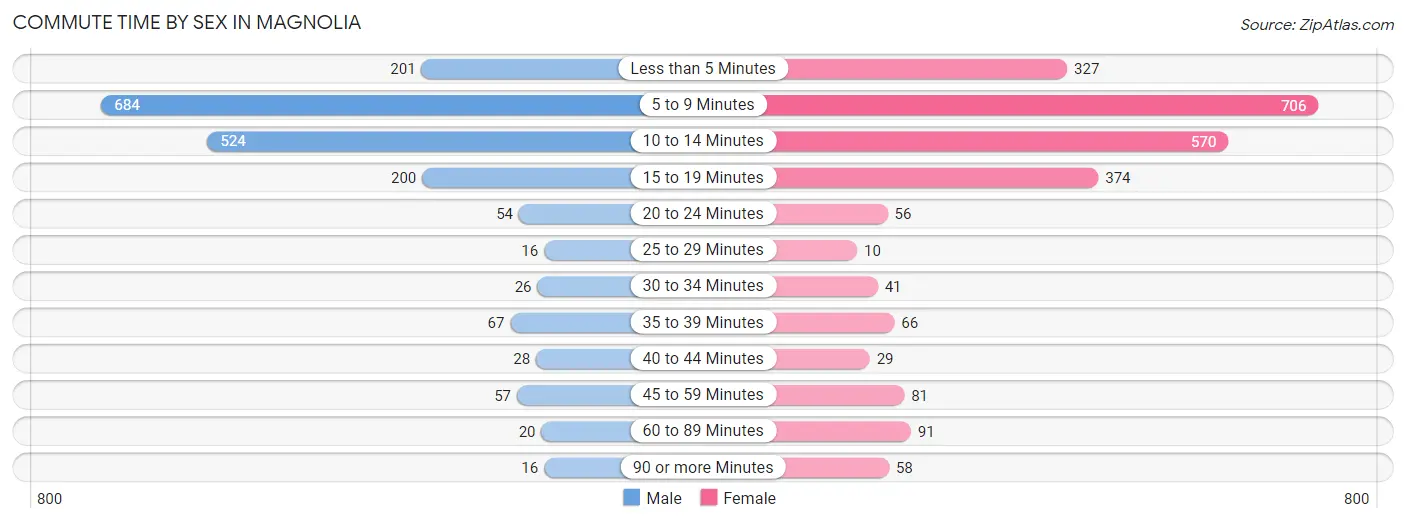
| Commute Time | Male | Female |
| Less than 5 Minutes | 201 (10.6%) | 327 (13.6%) |
| 5 to 9 Minutes | 684 (36.1%) | 706 (29.3%) |
| 10 to 14 Minutes | 524 (27.7%) | 570 (23.7%) |
| 15 to 19 Minutes | 200 (10.6%) | 374 (15.5%) |
| 20 to 24 Minutes | 54 (2.9%) | 56 (2.3%) |
| 25 to 29 Minutes | 16 (0.9%) | 10 (0.4%) |
| 30 to 34 Minutes | 26 (1.4%) | 41 (1.7%) |
| 35 to 39 Minutes | 67 (3.5%) | 66 (2.7%) |
| 40 to 44 Minutes | 28 (1.5%) | 29 (1.2%) |
| 45 to 59 Minutes | 57 (3.0%) | 81 (3.4%) |
| 60 to 89 Minutes | 20 (1.1%) | 91 (3.8%) |
| 90 or more Minutes | 16 (0.9%) | 58 (2.4%) |
Time of Departure to Work by Sex in Magnolia
The most frequent times of departure to work in Magnolia are 5:30 AM to 5:59 AM (351, 18.5%) for males and 7:30 AM to 7:59 AM (447, 18.6%) for females.
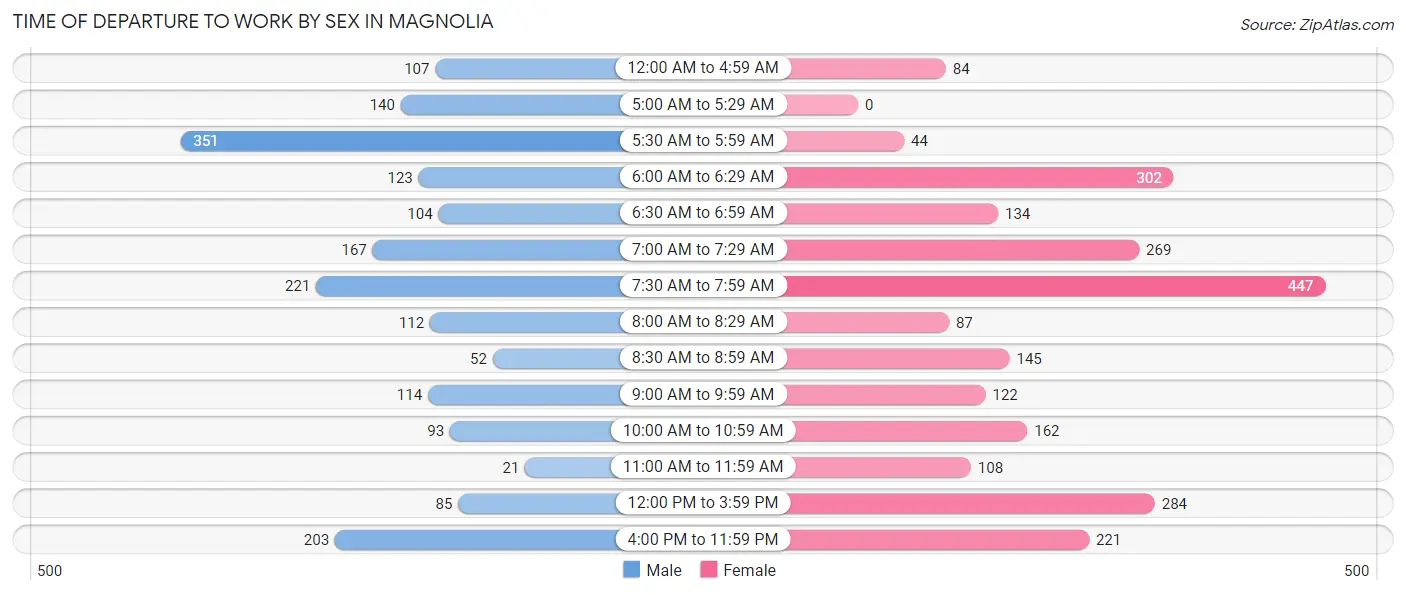
| Time of Departure | Male | Female |
| 12:00 AM to 4:59 AM | 107 (5.7%) | 84 (3.5%) |
| 5:00 AM to 5:29 AM | 140 (7.4%) | 0 (0.0%) |
| 5:30 AM to 5:59 AM | 351 (18.5%) | 44 (1.8%) |
| 6:00 AM to 6:29 AM | 123 (6.5%) | 302 (12.5%) |
| 6:30 AM to 6:59 AM | 104 (5.5%) | 134 (5.6%) |
| 7:00 AM to 7:29 AM | 167 (8.8%) | 269 (11.2%) |
| 7:30 AM to 7:59 AM | 221 (11.7%) | 447 (18.6%) |
| 8:00 AM to 8:29 AM | 112 (5.9%) | 87 (3.6%) |
| 8:30 AM to 8:59 AM | 52 (2.8%) | 145 (6.0%) |
| 9:00 AM to 9:59 AM | 114 (6.0%) | 122 (5.1%) |
| 10:00 AM to 10:59 AM | 93 (4.9%) | 162 (6.7%) |
| 11:00 AM to 11:59 AM | 21 (1.1%) | 108 (4.5%) |
| 12:00 PM to 3:59 PM | 85 (4.5%) | 284 (11.8%) |
| 4:00 PM to 11:59 PM | 203 (10.7%) | 221 (9.2%) |
| Total | 1,893 (100.0%) | 2,409 (100.0%) |
Housing Occupancy in Magnolia
Occupancy by Ownership in Magnolia
Of the total 3,354 dwellings in Magnolia, owner-occupied units account for 1,773 (52.9%), while renter-occupied units make up 1,581 (47.1%).
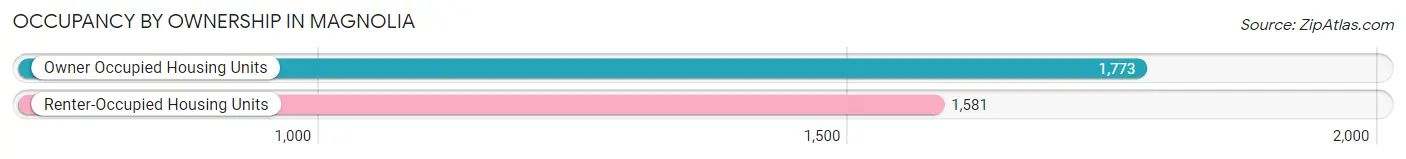
| Occupancy | # Housing Units | % Housing Units |
| Owner Occupied Housing Units | 1,773 | 52.9% |
| Renter-Occupied Housing Units | 1,581 | 47.1% |
| Total Occupied Housing Units | 3,354 | 100.0% |
Occupancy by Household Size in Magnolia
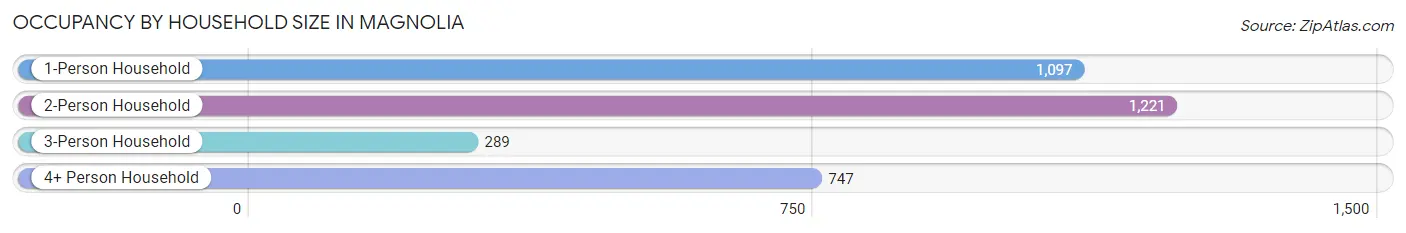
| Household Size | # Housing Units | % Housing Units |
| 1-Person Household | 1,097 | 32.7% |
| 2-Person Household | 1,221 | 36.4% |
| 3-Person Household | 289 | 8.6% |
| 4+ Person Household | 747 | 22.3% |
| Total Housing Units | 3,354 | 100.0% |
Occupancy by Ownership by Household Size in Magnolia
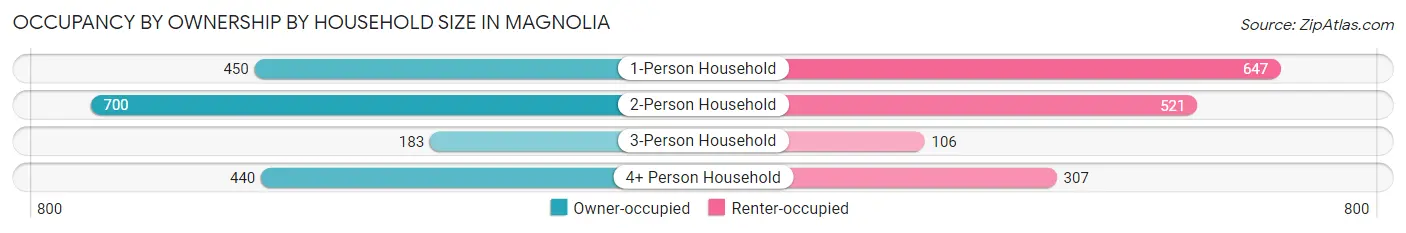
| Household Size | Owner-occupied | Renter-occupied |
| 1-Person Household | 450 (41.0%) | 647 (59.0%) |
| 2-Person Household | 700 (57.3%) | 521 (42.7%) |
| 3-Person Household | 183 (63.3%) | 106 (36.7%) |
| 4+ Person Household | 440 (58.9%) | 307 (41.1%) |
| Total Housing Units | 1,773 (52.9%) | 1,581 (47.1%) |
Occupancy by Educational Attainment in Magnolia
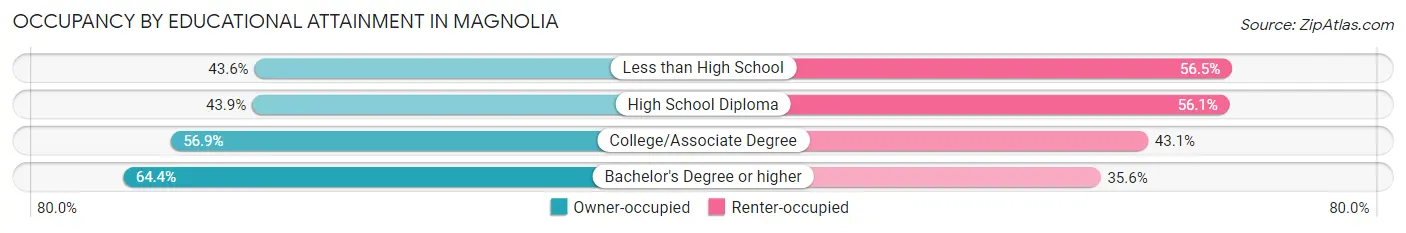
| Household Size | Owner-occupied | Renter-occupied |
| Less than High School | 179 (43.5%) | 232 (56.5%) |
| High School Diploma | 485 (43.9%) | 619 (56.1%) |
| College/Associate Degree | 573 (56.9%) | 434 (43.1%) |
| Bachelor's Degree or higher | 536 (64.4%) | 296 (35.6%) |
Occupancy by Age of Householder in Magnolia
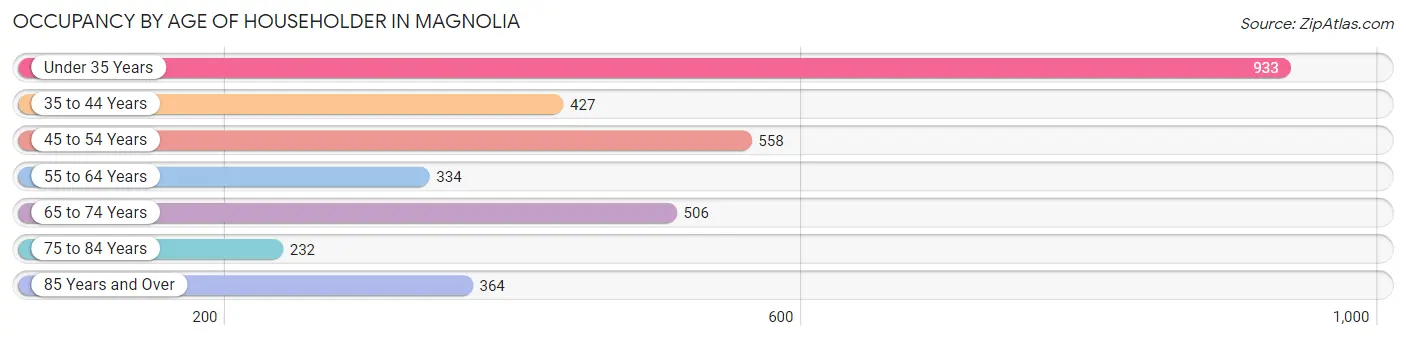
| Age Bracket | # Households | % Households |
| Under 35 Years | 933 | 27.8% |
| 35 to 44 Years | 427 | 12.7% |
| 45 to 54 Years | 558 | 16.6% |
| 55 to 64 Years | 334 | 10.0% |
| 65 to 74 Years | 506 | 15.1% |
| 75 to 84 Years | 232 | 6.9% |
| 85 Years and Over | 364 | 10.8% |
| Total | 3,354 | 100.0% |
Housing Finances in Magnolia
Median Income by Occupancy in Magnolia
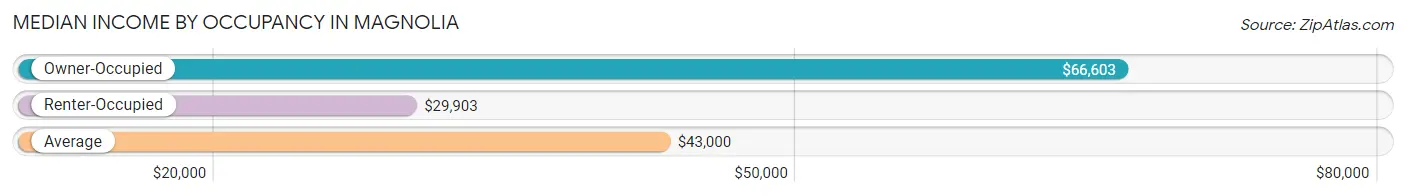
| Occupancy Type | # Households | Median Income |
| Owner-Occupied | 1,773 (52.9%) | $66,603 |
| Renter-Occupied | 1,581 (47.1%) | $29,903 |
| Average | 3,354 (100.0%) | $43,000 |
Occupancy by Householder Income Bracket in Magnolia
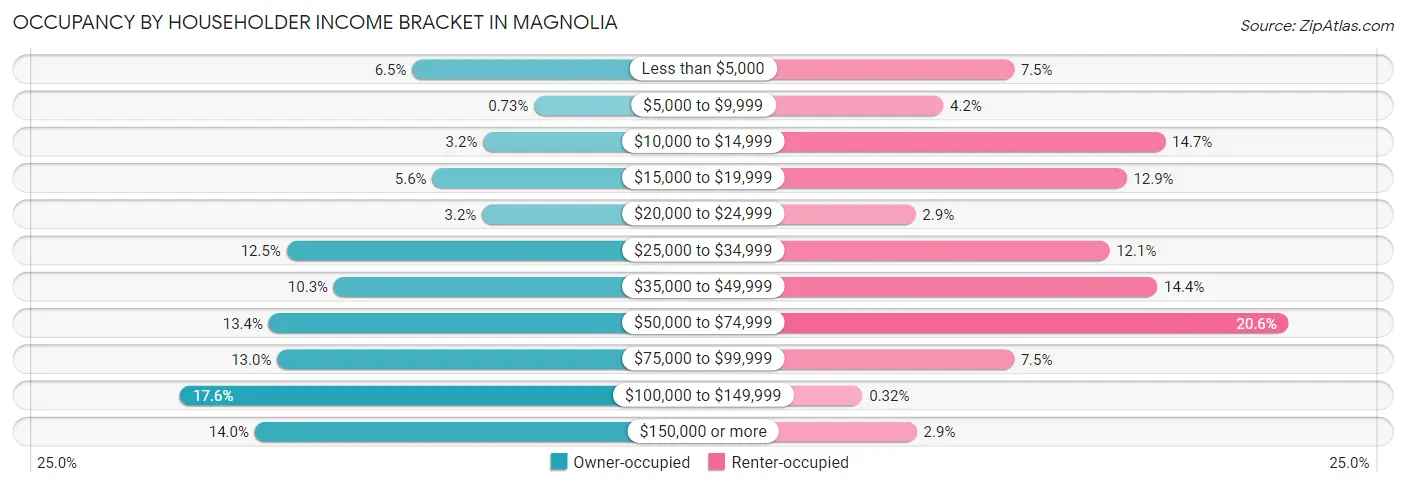
| Income Bracket | Owner-occupied | Renter-occupied |
| Less than $5,000 | 116 (6.5%) | 119 (7.5%) |
| $5,000 to $9,999 | 13 (0.7%) | 66 (4.2%) |
| $10,000 to $14,999 | 56 (3.2%) | 233 (14.7%) |
| $15,000 to $19,999 | 99 (5.6%) | 204 (12.9%) |
| $20,000 to $24,999 | 57 (3.2%) | 45 (2.9%) |
| $25,000 to $34,999 | 222 (12.5%) | 191 (12.1%) |
| $35,000 to $49,999 | 182 (10.3%) | 227 (14.4%) |
| $50,000 to $74,999 | 237 (13.4%) | 326 (20.6%) |
| $75,000 to $99,999 | 230 (13.0%) | 119 (7.5%) |
| $100,000 to $149,999 | 312 (17.6%) | 5 (0.3%) |
| $150,000 or more | 249 (14.0%) | 46 (2.9%) |
| Total | 1,773 (100.0%) | 1,581 (100.0%) |
Monthly Housing Cost Tiers in Magnolia
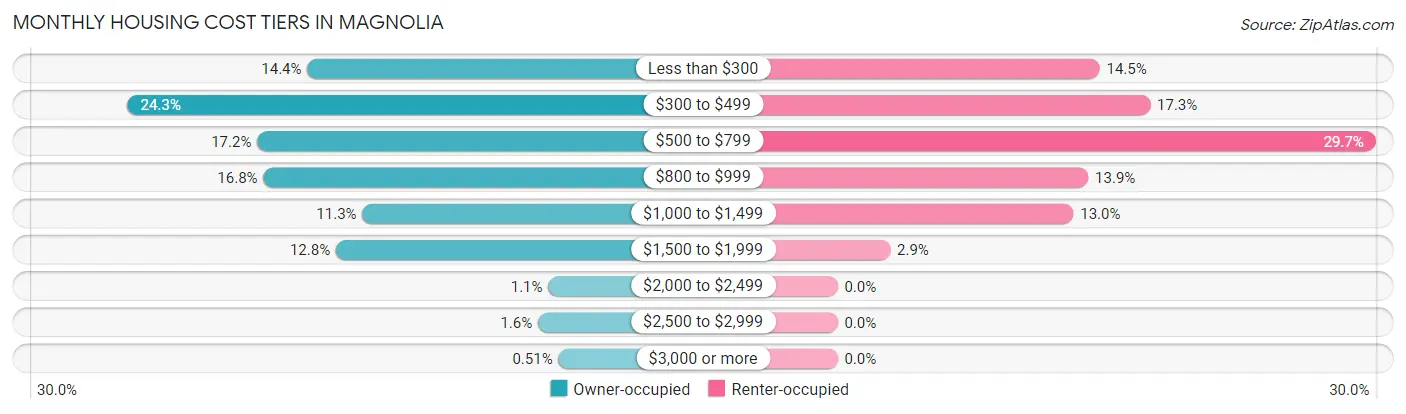
| Monthly Cost | Owner-occupied | Renter-occupied |
| Less than $300 | 255 (14.4%) | 229 (14.5%) |
| $300 to $499 | 431 (24.3%) | 273 (17.3%) |
| $500 to $799 | 304 (17.2%) | 470 (29.7%) |
| $800 to $999 | 298 (16.8%) | 219 (13.9%) |
| $1,000 to $1,499 | 201 (11.3%) | 206 (13.0%) |
| $1,500 to $1,999 | 227 (12.8%) | 46 (2.9%) |
| $2,000 to $2,499 | 19 (1.1%) | 0 (0.0%) |
| $2,500 to $2,999 | 29 (1.6%) | 0 (0.0%) |
| $3,000 or more | 9 (0.5%) | 0 (0.0%) |
| Total | 1,773 (100.0%) | 1,581 (100.0%) |
Physical Housing Characteristics in Magnolia
Housing Structures in Magnolia
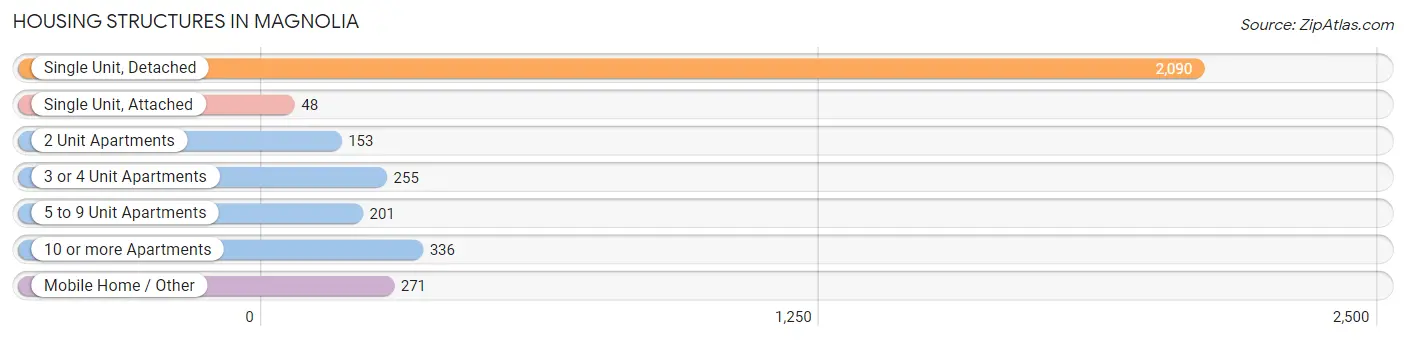
| Structure Type | # Housing Units | % Housing Units |
| Single Unit, Detached | 2,090 | 62.3% |
| Single Unit, Attached | 48 | 1.4% |
| 2 Unit Apartments | 153 | 4.6% |
| 3 or 4 Unit Apartments | 255 | 7.6% |
| 5 to 9 Unit Apartments | 201 | 6.0% |
| 10 or more Apartments | 336 | 10.0% |
| Mobile Home / Other | 271 | 8.1% |
| Total | 3,354 | 100.0% |
Housing Structures by Occupancy in Magnolia
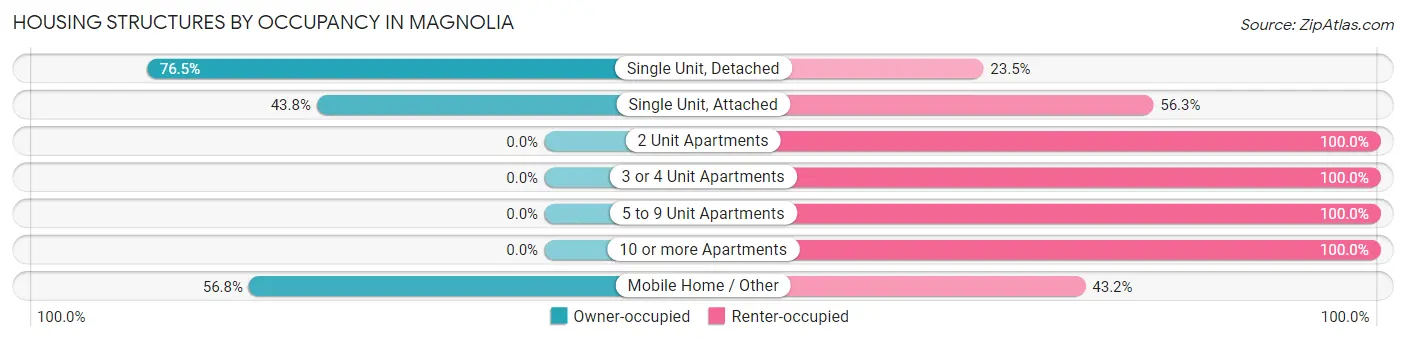
| Structure Type | Owner-occupied | Renter-occupied |
| Single Unit, Detached | 1,598 (76.5%) | 492 (23.5%) |
| Single Unit, Attached | 21 (43.8%) | 27 (56.2%) |
| 2 Unit Apartments | 0 (0.0%) | 153 (100.0%) |
| 3 or 4 Unit Apartments | 0 (0.0%) | 255 (100.0%) |
| 5 to 9 Unit Apartments | 0 (0.0%) | 201 (100.0%) |
| 10 or more Apartments | 0 (0.0%) | 336 (100.0%) |
| Mobile Home / Other | 154 (56.8%) | 117 (43.2%) |
| Total | 1,773 (52.9%) | 1,581 (47.1%) |
Housing Structures by Number of Rooms in Magnolia
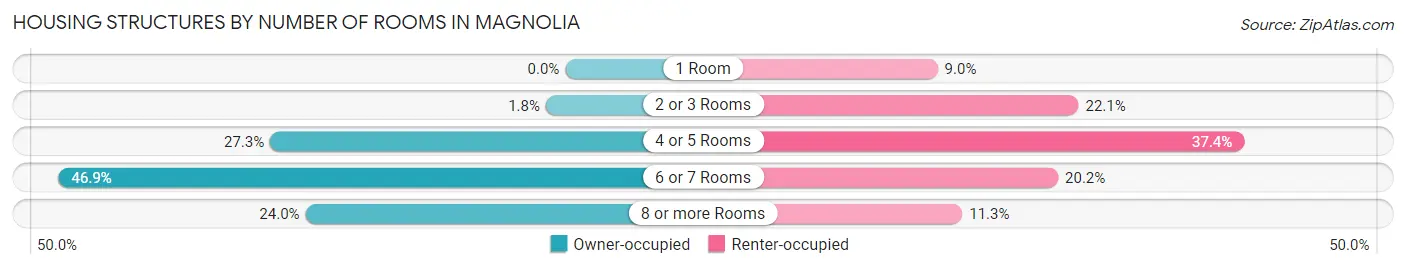
| Number of Rooms | Owner-occupied | Renter-occupied |
| 1 Room | 0 (0.0%) | 143 (9.0%) |
| 2 or 3 Rooms | 32 (1.8%) | 349 (22.1%) |
| 4 or 5 Rooms | 484 (27.3%) | 591 (37.4%) |
| 6 or 7 Rooms | 831 (46.9%) | 319 (20.2%) |
| 8 or more Rooms | 426 (24.0%) | 179 (11.3%) |
| Total | 1,773 (100.0%) | 1,581 (100.0%) |
Housing Structure by Heating Type in Magnolia
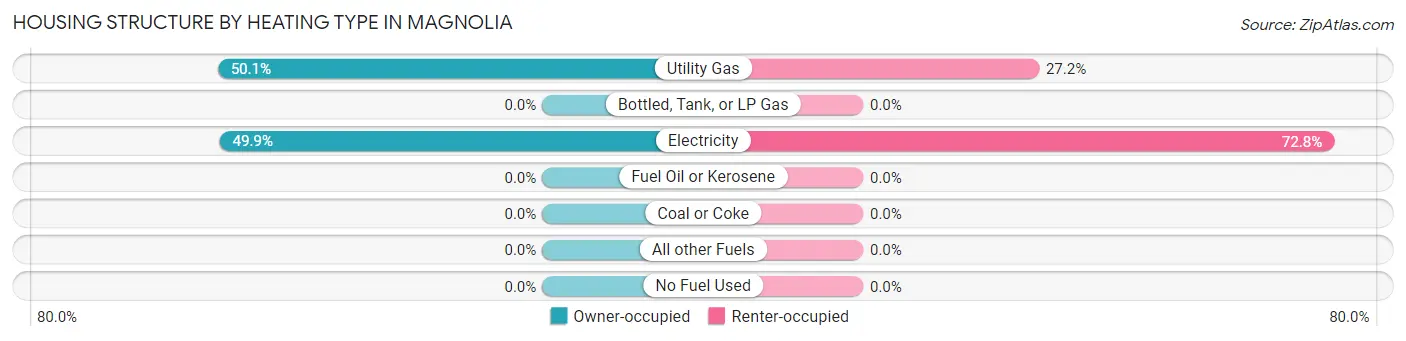
| Heating Type | Owner-occupied | Renter-occupied |
| Utility Gas | 889 (50.1%) | 430 (27.2%) |
| Bottled, Tank, or LP Gas | 0 (0.0%) | 0 (0.0%) |
| Electricity | 884 (49.9%) | 1,151 (72.8%) |
| Fuel Oil or Kerosene | 0 (0.0%) | 0 (0.0%) |
| Coal or Coke | 0 (0.0%) | 0 (0.0%) |
| All other Fuels | 0 (0.0%) | 0 (0.0%) |
| No Fuel Used | 0 (0.0%) | 0 (0.0%) |
| Total | 1,773 (100.0%) | 1,581 (100.0%) |
Household Vehicle Usage in Magnolia
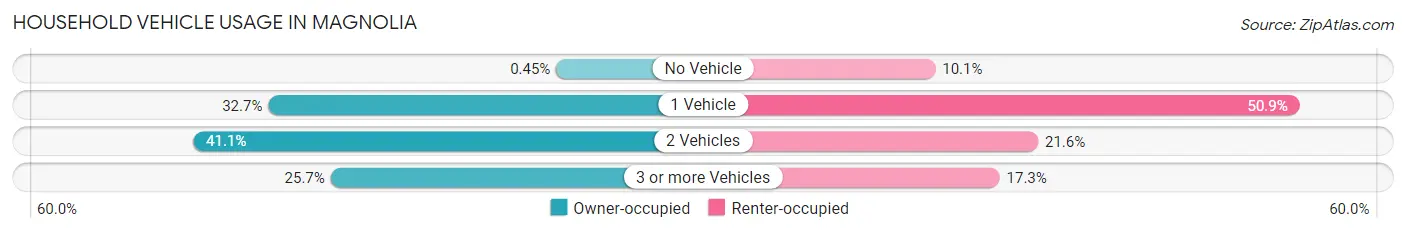
| Vehicles per Household | Owner-occupied | Renter-occupied |
| No Vehicle | 8 (0.4%) | 160 (10.1%) |
| 1 Vehicle | 580 (32.7%) | 805 (50.9%) |
| 2 Vehicles | 729 (41.1%) | 342 (21.6%) |
| 3 or more Vehicles | 456 (25.7%) | 274 (17.3%) |
| Total | 1,773 (100.0%) | 1,581 (100.0%) |
Real Estate & Mortgages in Magnolia
Real Estate and Mortgage Overview in Magnolia
| Characteristic | Without Mortgage | With Mortgage |
| Housing Units | 957 | 816 |
| Median Property Value | $124,400 | $163,600 |
| Median Household Income | $39,656 | $154 |
| Monthly Housing Costs | $415 | $9 |
| Real Estate Taxes | $741 | $83 |
Property Value by Mortgage Status in Magnolia
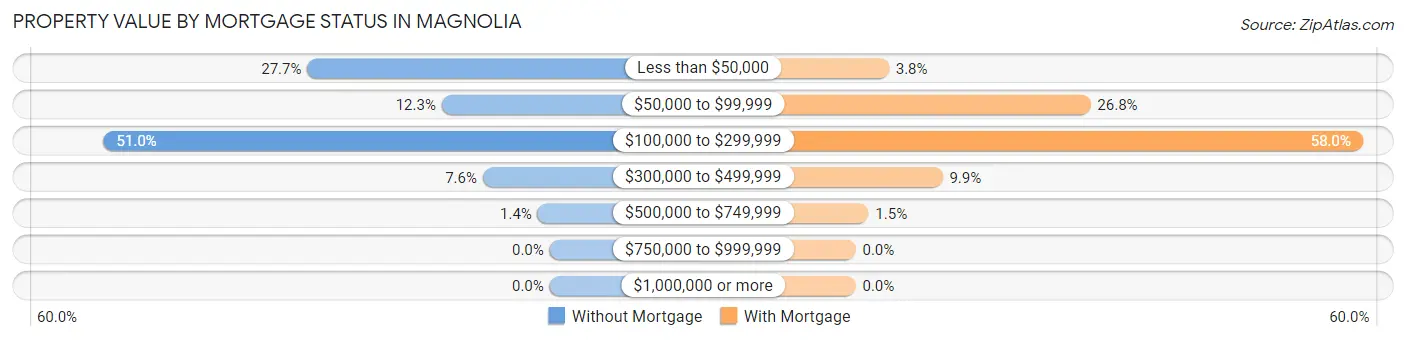
| Property Value | Without Mortgage | With Mortgage |
| Less than $50,000 | 265 (27.7%) | 31 (3.8%) |
| $50,000 to $99,999 | 118 (12.3%) | 219 (26.8%) |
| $100,000 to $299,999 | 488 (51.0%) | 473 (58.0%) |
| $300,000 to $499,999 | 73 (7.6%) | 81 (9.9%) |
| $500,000 to $749,999 | 13 (1.4%) | 12 (1.5%) |
| $750,000 to $999,999 | 0 (0.0%) | 0 (0.0%) |
| $1,000,000 or more | 0 (0.0%) | 0 (0.0%) |
| Total | 957 (100.0%) | 816 (100.0%) |
Household Income by Mortgage Status in Magnolia
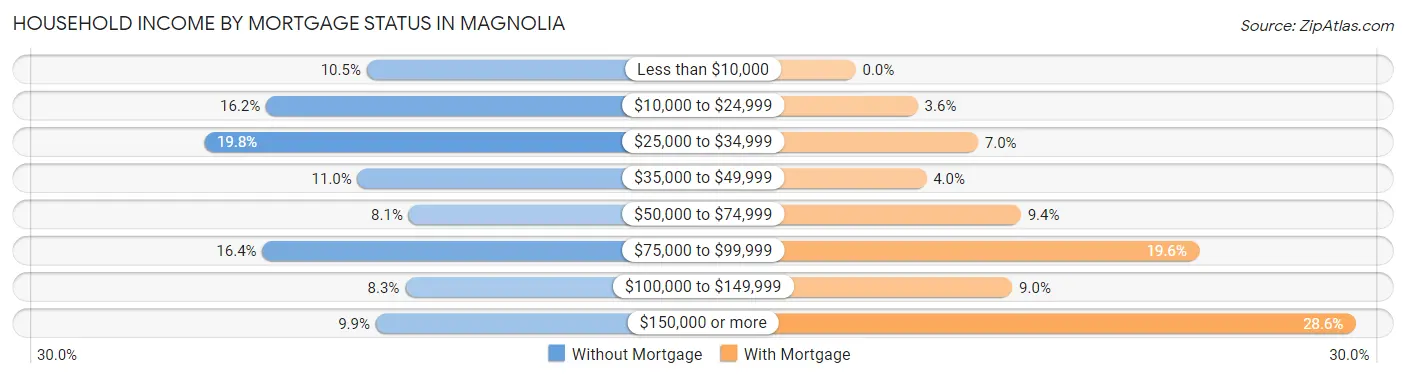
| Household Income | Without Mortgage | With Mortgage |
| Less than $10,000 | 100 (10.4%) | 0 (0.0%) |
| $10,000 to $24,999 | 155 (16.2%) | 29 (3.5%) |
| $25,000 to $34,999 | 189 (19.8%) | 57 (7.0%) |
| $35,000 to $49,999 | 105 (11.0%) | 33 (4.0%) |
| $50,000 to $74,999 | 77 (8.1%) | 77 (9.4%) |
| $75,000 to $99,999 | 157 (16.4%) | 160 (19.6%) |
| $100,000 to $149,999 | 79 (8.3%) | 73 (8.9%) |
| $150,000 or more | 95 (9.9%) | 233 (28.5%) |
| Total | 957 (100.0%) | 816 (100.0%) |
Property Value to Household Income Ratio in Magnolia
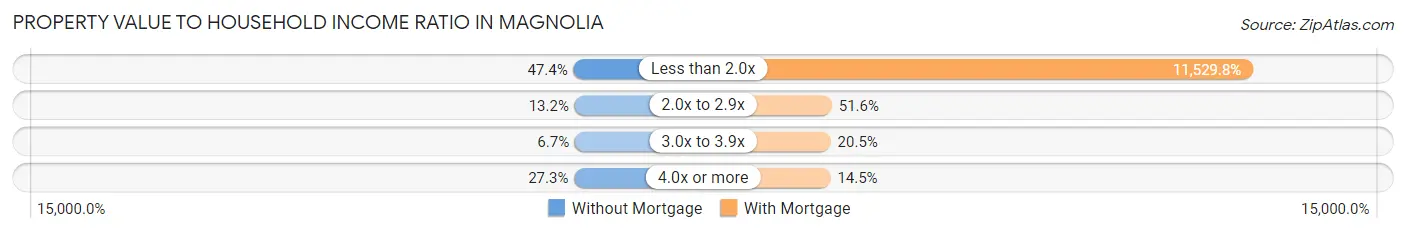
| Value-to-Income Ratio | Without Mortgage | With Mortgage |
| Less than 2.0x | 454 (47.4%) | 94,083 (11,529.8%) |
| 2.0x to 2.9x | 126 (13.2%) | 421 (51.6%) |
| 3.0x to 3.9x | 64 (6.7%) | 167 (20.5%) |
| 4.0x or more | 261 (27.3%) | 118 (14.5%) |
| Total | 957 (100.0%) | 816 (100.0%) |
Real Estate Taxes by Mortgage Status in Magnolia
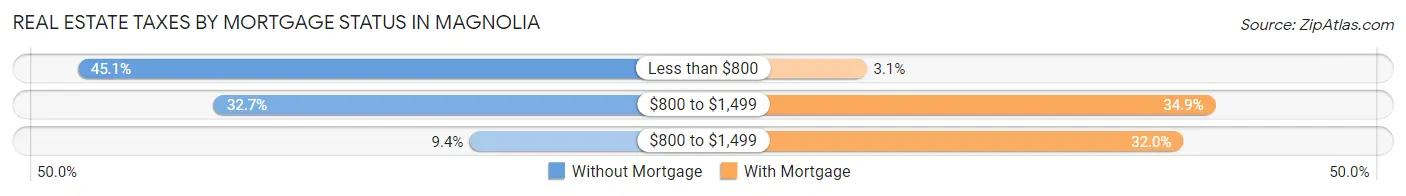
| Property Taxes | Without Mortgage | With Mortgage |
| Less than $800 | 432 (45.1%) | 25 (3.1%) |
| $800 to $1,499 | 313 (32.7%) | 285 (34.9%) |
| $800 to $1,499 | 90 (9.4%) | 261 (32.0%) |
| Total | 957 (100.0%) | 816 (100.0%) |
Health & Disability in Magnolia
Health Insurance Coverage by Age in Magnolia
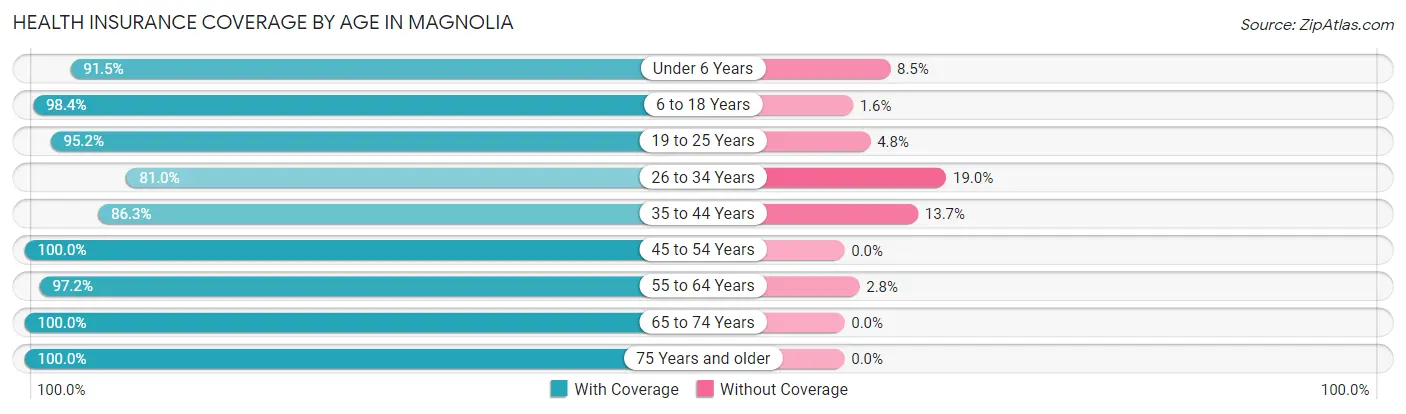
| Age Bracket | With Coverage | Without Coverage |
| Under 6 Years | 804 (91.5%) | 75 (8.5%) |
| 6 to 18 Years | 1,698 (98.4%) | 27 (1.6%) |
| 19 to 25 Years | 2,206 (95.2%) | 112 (4.8%) |
| 26 to 34 Years | 1,174 (81.0%) | 275 (19.0%) |
| 35 to 44 Years | 931 (86.3%) | 148 (13.7%) |
| 45 to 54 Years | 887 (100.0%) | 0 (0.0%) |
| 55 to 64 Years | 659 (97.2%) | 19 (2.8%) |
| 65 to 74 Years | 968 (100.0%) | 0 (0.0%) |
| 75 Years and older | 775 (100.0%) | 0 (0.0%) |
| Total | 10,102 (93.9%) | 656 (6.1%) |
Health Insurance Coverage by Citizenship Status in Magnolia
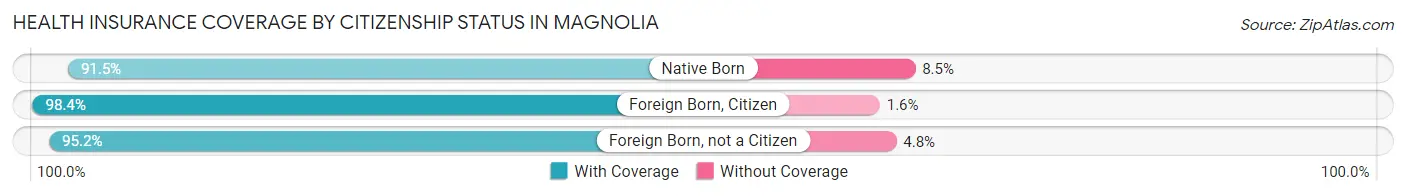
| Citizenship Status | With Coverage | Without Coverage |
| Native Born | 804 (91.5%) | 75 (8.5%) |
| Foreign Born, Citizen | 1,698 (98.4%) | 27 (1.6%) |
| Foreign Born, not a Citizen | 2,206 (95.2%) | 112 (4.8%) |
Health Insurance Coverage by Household Income in Magnolia
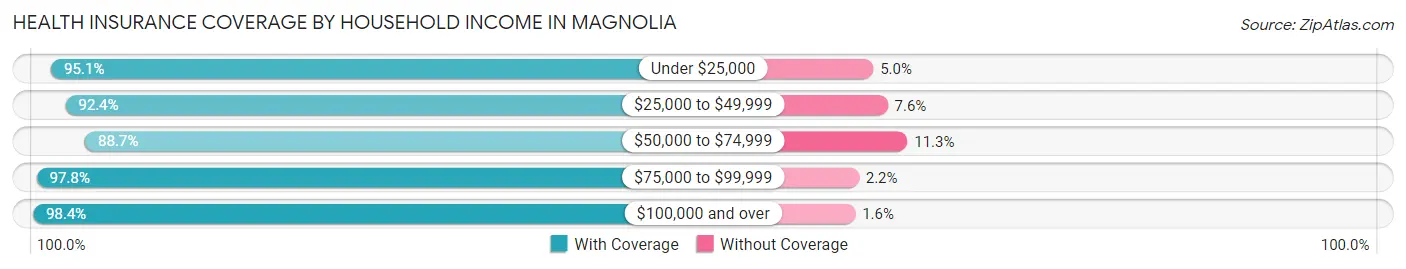
| Household Income | With Coverage | Without Coverage |
| Under $25,000 | 1,669 (95.1%) | 87 (5.0%) |
| $25,000 to $49,999 | 1,947 (92.4%) | 161 (7.6%) |
| $50,000 to $74,999 | 1,735 (88.7%) | 222 (11.3%) |
| $75,000 to $99,999 | 958 (97.8%) | 22 (2.2%) |
| $100,000 and over | 2,316 (98.4%) | 37 (1.6%) |
Public vs Private Health Insurance Coverage by Age in Magnolia
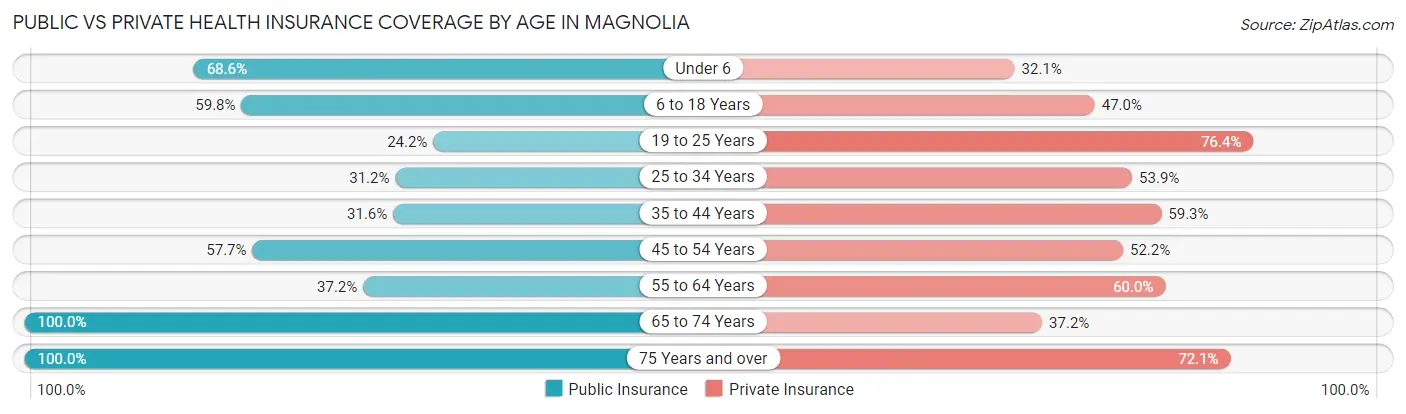
| Age Bracket | Public Insurance | Private Insurance |
| Under 6 | 603 (68.6%) | 282 (32.1%) |
| 6 to 18 Years | 1,031 (59.8%) | 810 (47.0%) |
| 19 to 25 Years | 560 (24.2%) | 1,770 (76.4%) |
| 25 to 34 Years | 452 (31.2%) | 781 (53.9%) |
| 35 to 44 Years | 341 (31.6%) | 640 (59.3%) |
| 45 to 54 Years | 512 (57.7%) | 463 (52.2%) |
| 55 to 64 Years | 252 (37.2%) | 407 (60.0%) |
| 65 to 74 Years | 968 (100.0%) | 360 (37.2%) |
| 75 Years and over | 775 (100.0%) | 559 (72.1%) |
| Total | 5,494 (51.1%) | 6,072 (56.4%) |
Disability Status by Sex by Age in Magnolia
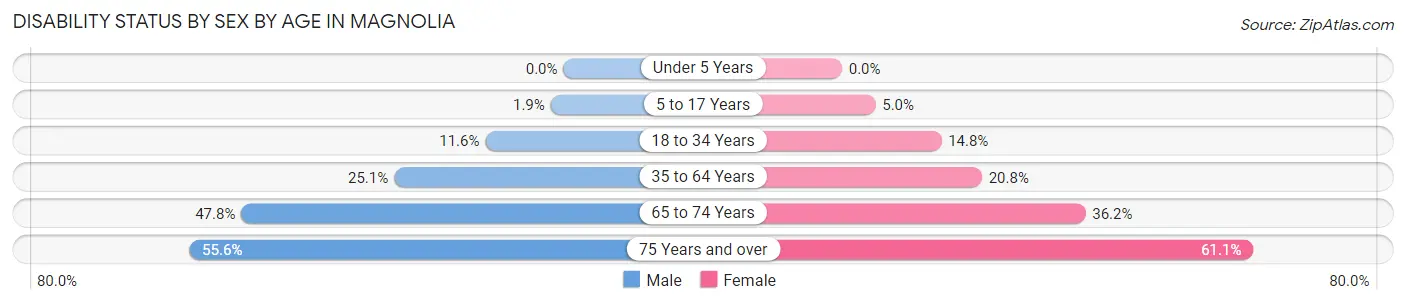
| Age Bracket | Male | Female |
| Under 5 Years | 0 (0.0%) | 0 (0.0%) |
| 5 to 17 Years | 13 (1.9%) | 45 (5.0%) |
| 18 to 34 Years | 233 (11.6%) | 301 (14.8%) |
| 35 to 64 Years | 269 (25.1%) | 327 (20.8%) |
| 65 to 74 Years | 209 (47.8%) | 192 (36.2%) |
| 75 Years and over | 155 (55.6%) | 303 (61.1%) |
Disability Class by Sex by Age in Magnolia
Disability Class: Hearing Difficulty
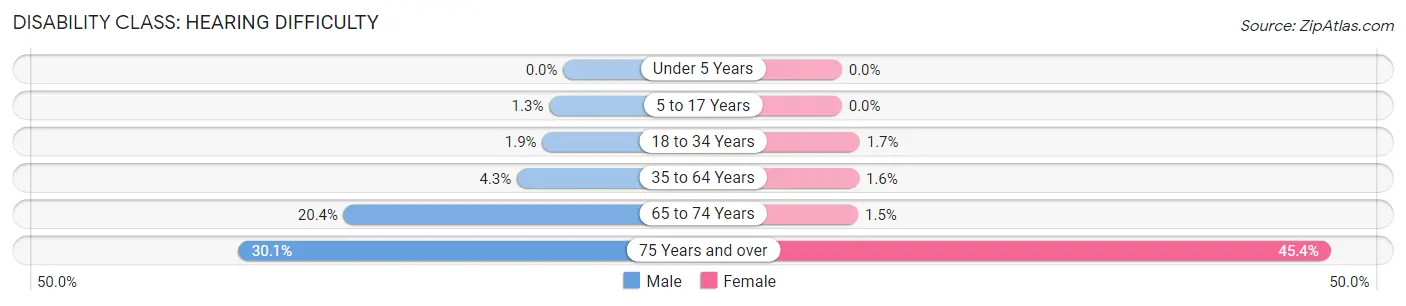
| Age Bracket | Male | Female |
| Under 5 Years | 0 (0.0%) | 0 (0.0%) |
| 5 to 17 Years | 9 (1.3%) | 0 (0.0%) |
| 18 to 34 Years | 39 (1.9%) | 34 (1.7%) |
| 35 to 64 Years | 46 (4.3%) | 25 (1.6%) |
| 65 to 74 Years | 89 (20.4%) | 8 (1.5%) |
| 75 Years and over | 84 (30.1%) | 225 (45.4%) |
Disability Class: Vision Difficulty
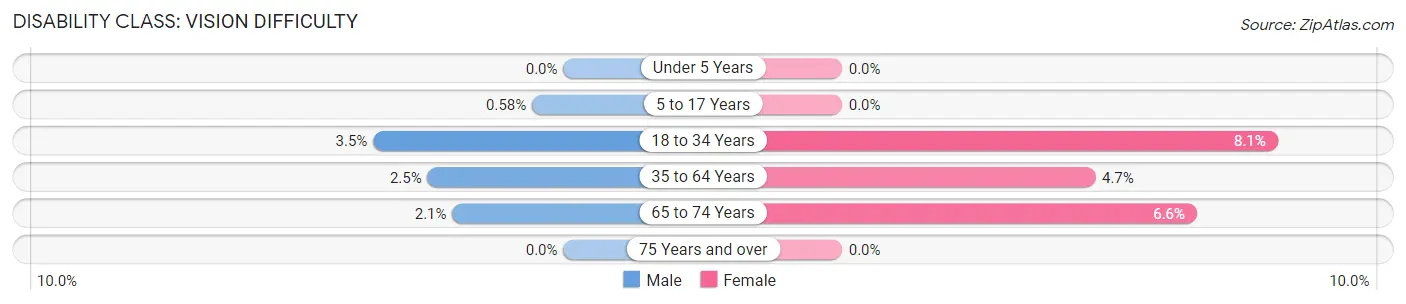
| Age Bracket | Male | Female |
| Under 5 Years | 0 (0.0%) | 0 (0.0%) |
| 5 to 17 Years | 4 (0.6%) | 0 (0.0%) |
| 18 to 34 Years | 71 (3.5%) | 165 (8.1%) |
| 35 to 64 Years | 27 (2.5%) | 74 (4.7%) |
| 65 to 74 Years | 9 (2.1%) | 35 (6.6%) |
| 75 Years and over | 0 (0.0%) | 0 (0.0%) |
Disability Class: Cognitive Difficulty
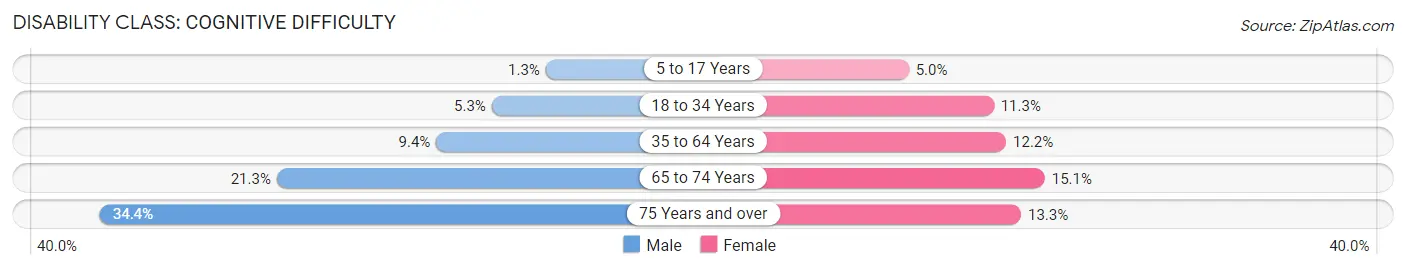
| Age Bracket | Male | Female |
| 5 to 17 Years | 9 (1.3%) | 45 (5.0%) |
| 18 to 34 Years | 107 (5.3%) | 230 (11.3%) |
| 35 to 64 Years | 101 (9.4%) | 192 (12.2%) |
| 65 to 74 Years | 93 (21.3%) | 80 (15.1%) |
| 75 Years and over | 96 (34.4%) | 66 (13.3%) |
Disability Class: Ambulatory Difficulty
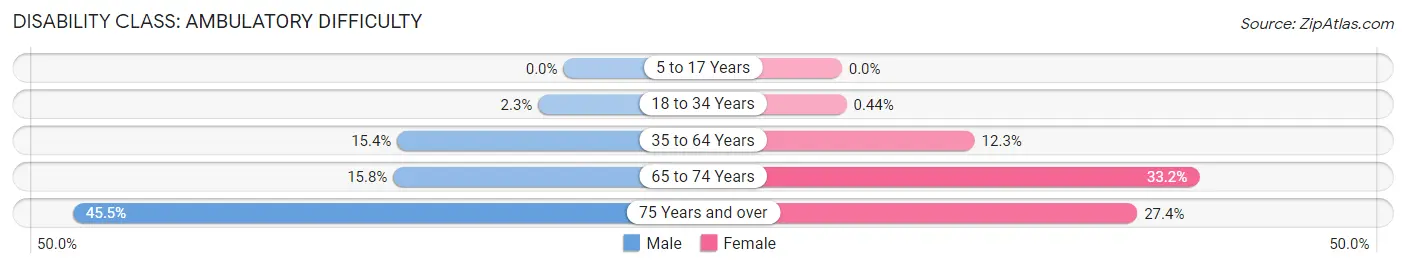
| Age Bracket | Male | Female |
| 5 to 17 Years | 0 (0.0%) | 0 (0.0%) |
| 18 to 34 Years | 47 (2.3%) | 9 (0.4%) |
| 35 to 64 Years | 165 (15.4%) | 194 (12.3%) |
| 65 to 74 Years | 69 (15.8%) | 176 (33.2%) |
| 75 Years and over | 127 (45.5%) | 136 (27.4%) |
Disability Class: Self-Care Difficulty
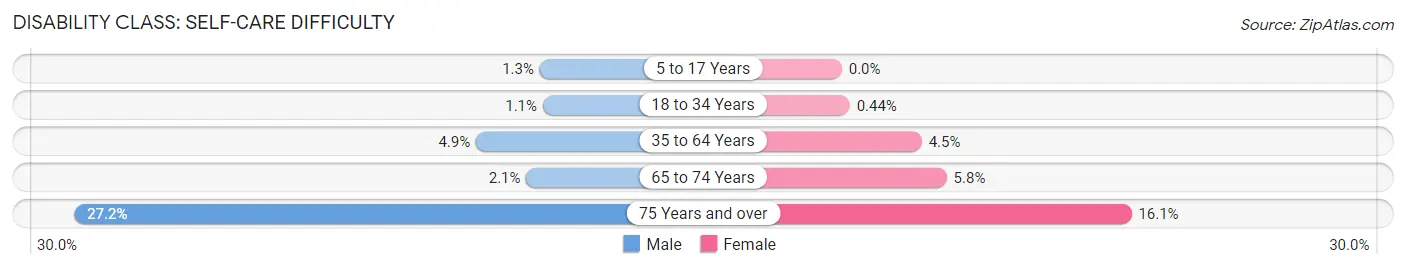
| Age Bracket | Male | Female |
| 5 to 17 Years | 9 (1.3%) | 0 (0.0%) |
| 18 to 34 Years | 23 (1.1%) | 9 (0.4%) |
| 35 to 64 Years | 52 (4.9%) | 70 (4.4%) |
| 65 to 74 Years | 9 (2.1%) | 31 (5.8%) |
| 75 Years and over | 76 (27.2%) | 80 (16.1%) |
Technology Access in Magnolia
Computing Device Access in Magnolia
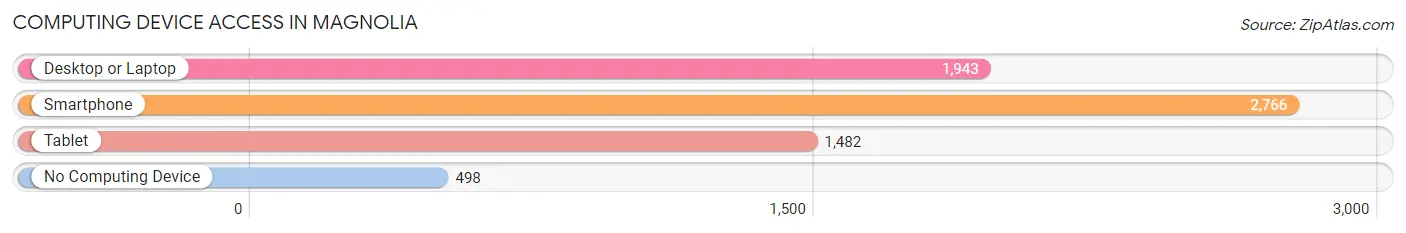
| Device Type | # Households | % Households |
| Desktop or Laptop | 1,943 | 57.9% |
| Smartphone | 2,766 | 82.5% |
| Tablet | 1,482 | 44.2% |
| No Computing Device | 498 | 14.8% |
| Total | 3,354 | 100.0% |
Internet Access in Magnolia
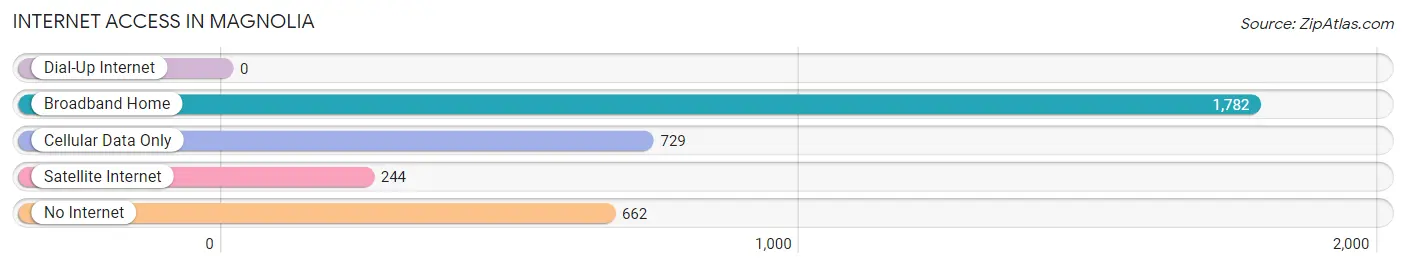
| Internet Type | # Households | % Households |
| Dial-Up Internet | 0 | 0.0% |
| Broadband Home | 1,782 | 53.1% |
| Cellular Data Only | 729 | 21.7% |
| Satellite Internet | 244 | 7.3% |
| No Internet | 662 | 19.7% |
| Total | 3,354 | 100.0% |
Magnolia Summary
Magnolia, Arkansas is a city located in Columbia County, Arkansas. It is the county seat of Columbia County and is located in the south-central part of the state. The city has a population of 11,577 as of the 2010 census.
History
The area that is now Magnolia was first settled in the early 1800s by settlers from the United States. The first post office was established in 1848 and the town was officially incorporated in 1853. The city was named after the magnolia trees that grew in the area.
In the late 1800s, Magnolia became a major center for the timber industry. The city was home to several sawmills and lumber companies, and the timber industry was the main source of employment for the city’s residents.
In the early 1900s, Magnolia began to experience a period of growth and development. The city was home to several banks, stores, and other businesses. The city also became a major center for the oil and gas industry.
Geography
Magnolia is located in south-central Arkansas, in Columbia County. The city is situated at the intersection of U.S. Highway 79 and Arkansas Highway 82. The city is located approximately 60 miles south of Little Rock, the state capital.
The city has a total area of 8.3 square miles, all of which is land. The city is located in the Ouachita Mountains region of Arkansas and is surrounded by rolling hills and forests.
Economy
The economy of Magnolia is largely based on the oil and gas industry. The city is home to several oil and gas companies, as well as several related businesses. The timber industry is also an important part of the city’s economy.
The city is also home to several manufacturing companies, including a paper mill and a furniture factory. The city is also home to several retail stores and restaurants.
Demographics
As of the 2010 census, the population of Magnolia was 11,577. The city has a population density of 1,395 people per square mile. The median age of the city’s population is 37.7 years.
The racial makeup of the city is 73.3% White, 22.2% African American, 0.5% Native American, 0.7% Asian, 0.1% Pacific Islander, 1.2% from other races, and 2.1% from two or more races. The city’s Hispanic population is 4.2%.
The median household income in Magnolia is $35,945. The city’s per capita income is $17,945. The city’s poverty rate is 22.3%. The city’s unemployment rate is 6.2%.
Common Questions
What is Per Capita Income in Magnolia?
Per Capita income in Magnolia is $26,087.
What is the Median Family Income in Magnolia?
Median Family Income in Magnolia is $54,725.
What is the Median Household income in Magnolia?
Median Household Income in Magnolia is $43,000.
What is Income or Wage Gap in Magnolia?
Income or Wage Gap in Magnolia is 34.2%.
Women in Magnolia earn 65.8 cents for every dollar earned by a man.
What is Inequality or Gini Index in Magnolia?
Inequality or Gini Index in Magnolia is 0.58.
What is the Total Population of Magnolia?
Total Population of Magnolia is 11,044.
What is the Total Male Population of Magnolia?
Total Male Population of Magnolia is 5,073.
What is the Total Female Population of Magnolia?
Total Female Population of Magnolia is 5,971.
What is the Ratio of Males per 100 Females in Magnolia?
There are 84.96 Males per 100 Females in Magnolia.
What is the Ratio of Females per 100 Males in Magnolia?
There are 117.70 Females per 100 Males in Magnolia.
What is the Median Population Age in Magnolia?
Median Population Age in Magnolia is 28.8 Years.
What is the Average Family Size in Magnolia
Average Family Size in Magnolia is 3.5 People.
What is the Average Household Size in Magnolia
Average Household Size in Magnolia is 2.7 People.
How Large is the Labor Force in Magnolia?
There are 4,609 People in the Labor Forcein in Magnolia.
What is the Percentage of People in the Labor Force in Magnolia?
51.7% of People are in the Labor Force in Magnolia.
What is the Unemployment Rate in Magnolia?
Unemployment Rate in Magnolia is 3.8%.