Creswell, NC Map & Demographics
Creswell Map
Creswell Overview
$24,973
PER CAPITA INCOME
$46,750
AVG FAMILY INCOME
0.48
INEQUALITY / GINI INDEX
152
TOTAL POPULATION
63
MALE POPULATION
89
FEMALE POPULATION
70.79
MALES / 100 FEMALES
141.27
FEMALES / 100 MALES
40.2
MEDIAN AGE
2.5
AVG FAMILY SIZE
2.1
AVG HOUSEHOLD SIZE
62
LABOR FORCE [ PEOPLE ]
50.0%
PERCENT IN LABOR FORCE
Creswell Zip Codes
Creswell Area Codes
Income in Creswell
Income Overview in Creswell
| Characteristic | Number | Measure |
| Per Capita Income | 152 | $24,973 |
| Median Family Income | 43 | $46,750 |
| Mean Family Income | 43 | $54,453 |
| Median Household Income | 71 | $0 |
| Mean Household Income | 71 | $49,214 |
| Income Deficit | 43 | $0 |
| Wage / Income Gap (%) | 152 | 0.00% |
| Wage / Income Gap ($) | 152 | 100.00¢ per $1 |
| Gini / Inequality Index | 152 | 0.48 |
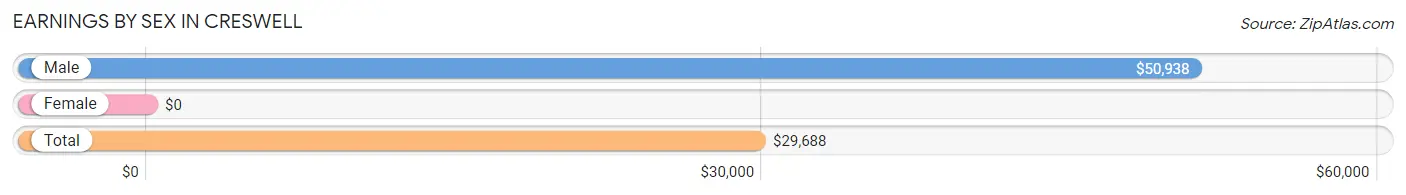
Earnings by Sex in Creswell
| Sex | Number | Average Earnings |
| Male | 27 (36.5%) | $50,938 |
| Female | 47 (63.5%) | $0 |
| Total | 74 (100.0%) | $29,688 |
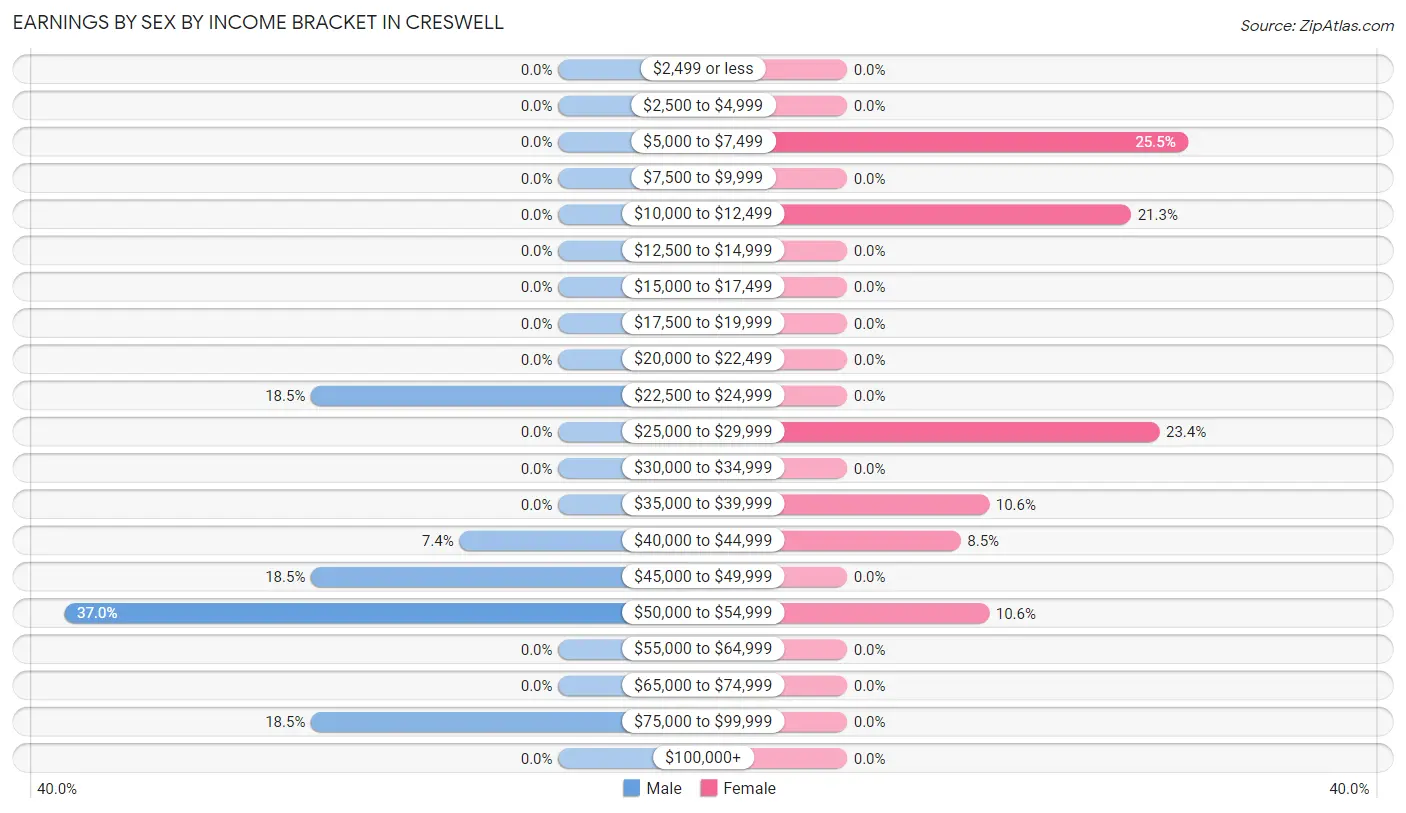
Earnings by Sex by Income Bracket in Creswell
The most common earnings brackets in Creswell are $50,000 to $54,999 for men (10 | 37.0%) and $5,000 to $7,499 for women (12 | 25.5%).
| Income | Male | Female |
| $2,499 or less | 0 (0.0%) | 0 (0.0%) |
| $2,500 to $4,999 | 0 (0.0%) | 0 (0.0%) |
| $5,000 to $7,499 | 0 (0.0%) | 12 (25.5%) |
| $7,500 to $9,999 | 0 (0.0%) | 0 (0.0%) |
| $10,000 to $12,499 | 0 (0.0%) | 10 (21.3%) |
| $12,500 to $14,999 | 0 (0.0%) | 0 (0.0%) |
| $15,000 to $17,499 | 0 (0.0%) | 0 (0.0%) |
| $17,500 to $19,999 | 0 (0.0%) | 0 (0.0%) |
| $20,000 to $22,499 | 0 (0.0%) | 0 (0.0%) |
| $22,500 to $24,999 | 5 (18.5%) | 0 (0.0%) |
| $25,000 to $29,999 | 0 (0.0%) | 11 (23.4%) |
| $30,000 to $34,999 | 0 (0.0%) | 0 (0.0%) |
| $35,000 to $39,999 | 0 (0.0%) | 5 (10.6%) |
| $40,000 to $44,999 | 2 (7.4%) | 4 (8.5%) |
| $45,000 to $49,999 | 5 (18.5%) | 0 (0.0%) |
| $50,000 to $54,999 | 10 (37.0%) | 5 (10.6%) |
| $55,000 to $64,999 | 0 (0.0%) | 0 (0.0%) |
| $65,000 to $74,999 | 0 (0.0%) | 0 (0.0%) |
| $75,000 to $99,999 | 5 (18.5%) | 0 (0.0%) |
| $100,000+ | 0 (0.0%) | 0 (0.0%) |
| Total | 27 (100.0%) | 47 (100.0%) |
Earnings by Sex by Educational Attainment in Creswell
| Educational Attainment | Male Income | Female Income |
| Less than High School | - | - |
| High School Diploma | - | - |
| College or Associate's Degree | - | - |
| Bachelor's Degree | - | - |
| Graduate Degree | - | - |
| Total | $50,938 | $0 |
Family Income in Creswell
Family Income Brackets in Creswell
According to the Creswell family income data, there are 12 families falling into the less than $10,000 income range, which is the most common income bracket and makes up 27.9% of all families.
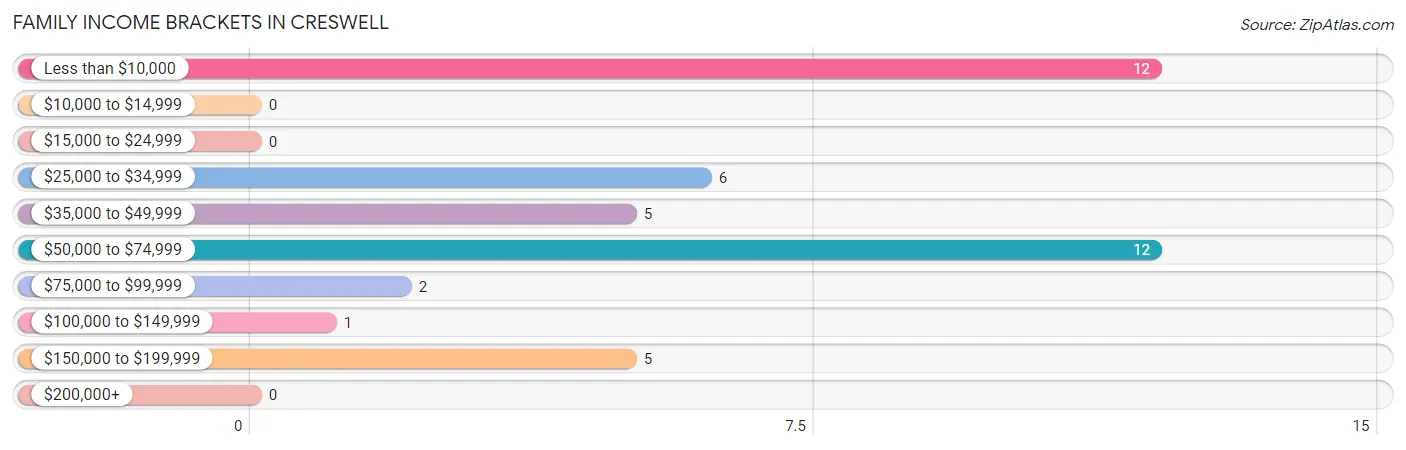
| Income Bracket | # Families | % Families |
| Less than $10,000 | 12 | 27.9% |
| $10,000 to $14,999 | 0 | 0.0% |
| $15,000 to $24,999 | 0 | 0.0% |
| $25,000 to $34,999 | 6 | 14.0% |
| $35,000 to $49,999 | 5 | 11.6% |
| $50,000 to $74,999 | 12 | 27.9% |
| $75,000 to $99,999 | 2 | 4.7% |
| $100,000 to $149,999 | 1 | 2.3% |
| $150,000 to $199,999 | 5 | 11.6% |
| $200,000+ | 0 | 0.0% |
Family Income by Famaliy Size in Creswell
| Income Bracket | # Families | Median Income |
| 2-Person Families | 32 (74.4%) | $0 |
| 3-Person Families | 10 (23.3%) | $0 |
| 4-Person Families | 1 (2.3%) | $0 |
| 5-Person Families | 0 (0.0%) | $0 |
| 6-Person Families | 0 (0.0%) | $0 |
| 7+ Person Families | 0 (0.0%) | $0 |
| Total | 43 (100.0%) | $46,750 |
Family Income by Number of Earners in Creswell
| Number of Earners | # Families | Median Income |
| No Earners | 8 (18.6%) | $0 |
| 1 Earner | 22 (51.2%) | $0 |
| 2 Earners | 13 (30.2%) | $0 |
| 3+ Earners | 0 (0.0%) | $0 |
| Total | 43 (100.0%) | $46,750 |
Household Income in Creswell
Household Income Brackets in Creswell
With 17 households falling in the category, the less than $10,000 income range is the most frequent in Creswell, accounting for 23.9% of all households.
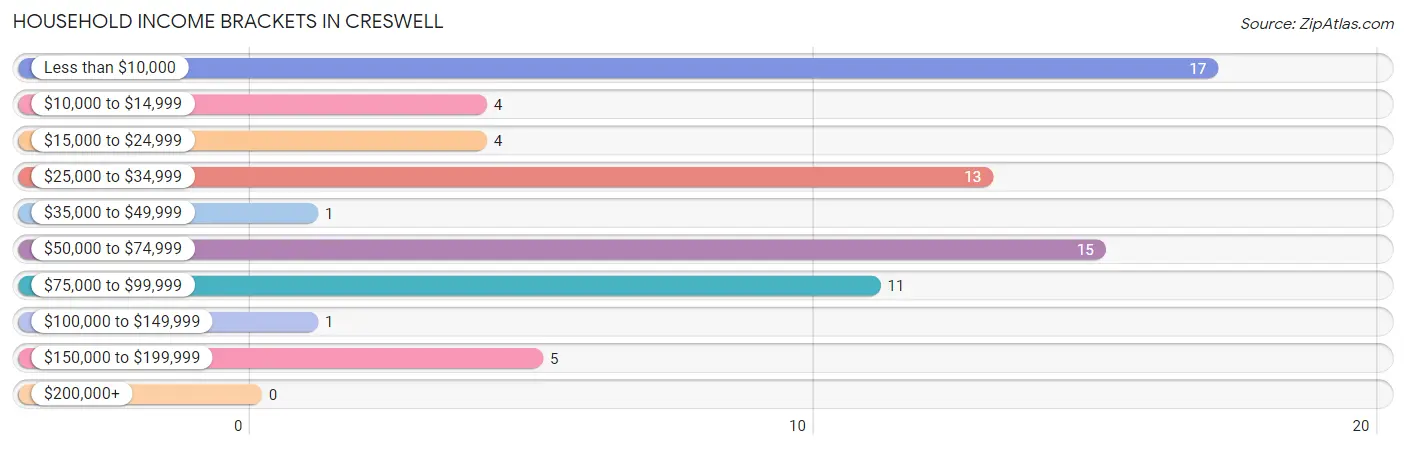
| Income Bracket | # Households | % Households |
| Less than $10,000 | 17 | 23.9% |
| $10,000 to $14,999 | 4 | 5.6% |
| $15,000 to $24,999 | 4 | 5.6% |
| $25,000 to $34,999 | 13 | 18.3% |
| $35,000 to $49,999 | 1 | 1.4% |
| $50,000 to $74,999 | 15 | 21.1% |
| $75,000 to $99,999 | 11 | 15.5% |
| $100,000 to $149,999 | 1 | 1.4% |
| $150,000 to $199,999 | 5 | 7.0% |
| $200,000+ | 0 | 0.0% |
Household Income by Householder Age in Creswell
The median household income in Creswell is $0, with the highest median household income of $66,250 found in the 45 to 64 years age bracket for the primary householder. A total of 6 households (8.5%) fall into this category. Meanwhile, the 15 to 24 years age bracket for the primary householder has the lowest median household income of $0, with 10 households (14.1%) in this group.
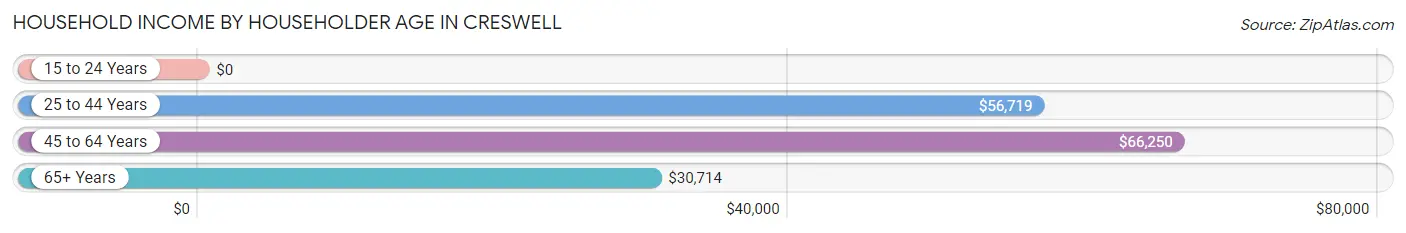
| Income Bracket | # Households | Median Income |
| 15 to 24 Years | 10 (14.1%) | $0 |
| 25 to 44 Years | 23 (32.4%) | $56,719 |
| 45 to 64 Years | 6 (8.5%) | $66,250 |
| 65+ Years | 32 (45.1%) | $30,714 |
| Total | 71 (100.0%) | $0 |
Poverty in Creswell
Income Below Poverty by Sex and Age in Creswell
With 22.2% poverty level for males and 27.0% for females among the residents of Creswell, under 5 year old males and 15 year old females are the most vulnerable to poverty, with 8 males (100.0%) and 3 females (100.0%) in their respective age groups living below the poverty level.
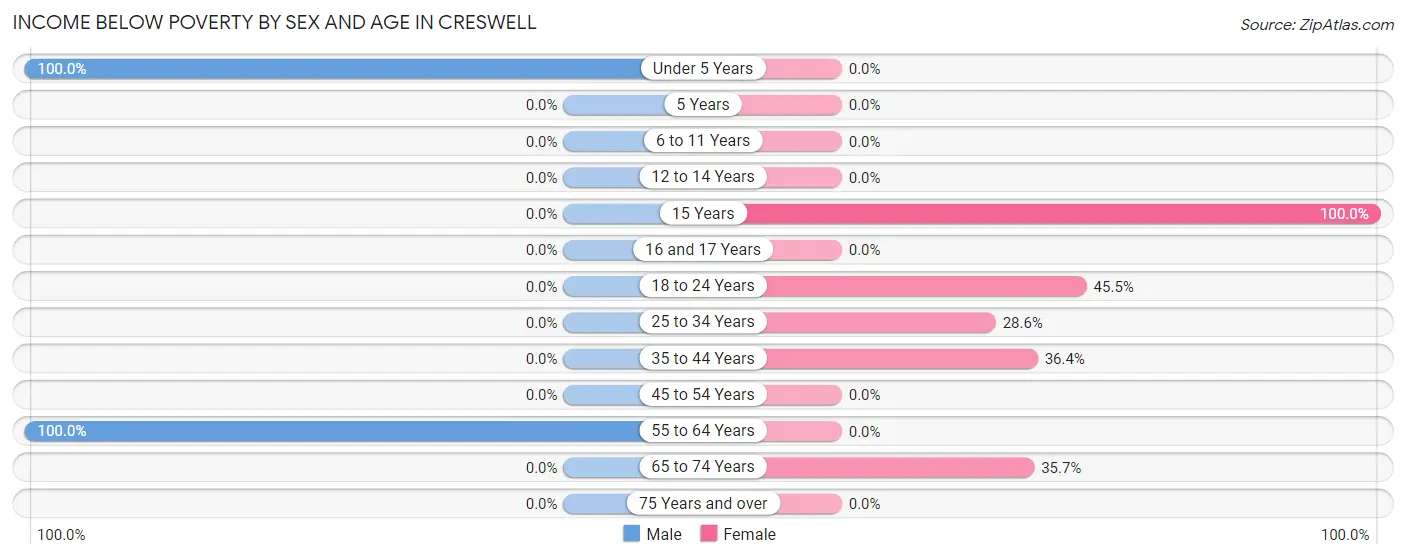
| Age Bracket | Male | Female |
| Under 5 Years | 8 (100.0%) | 0 (0.0%) |
| 5 Years | 0 (0.0%) | 0 (0.0%) |
| 6 to 11 Years | 0 (0.0%) | 0 (0.0%) |
| 12 to 14 Years | 0 (0.0%) | 0 (0.0%) |
| 15 Years | 0 (0.0%) | 3 (100.0%) |
| 16 and 17 Years | 0 (0.0%) | 0 (0.0%) |
| 18 to 24 Years | 0 (0.0%) | 10 (45.5%) |
| 25 to 34 Years | 0 (0.0%) | 2 (28.6%) |
| 35 to 44 Years | 0 (0.0%) | 4 (36.4%) |
| 45 to 54 Years | 0 (0.0%) | 0 (0.0%) |
| 55 to 64 Years | 6 (100.0%) | 0 (0.0%) |
| 65 to 74 Years | 0 (0.0%) | 5 (35.7%) |
| 75 Years and over | 0 (0.0%) | 0 (0.0%) |
| Total | 14 (22.2%) | 24 (27.0%) |
Income Above Poverty by Sex and Age in Creswell
According to the poverty statistics in Creswell, males aged 5 years and females aged under 5 years are the age groups that are most secure financially, with 100.0% of males and 100.0% of females in these age groups living above the poverty line.
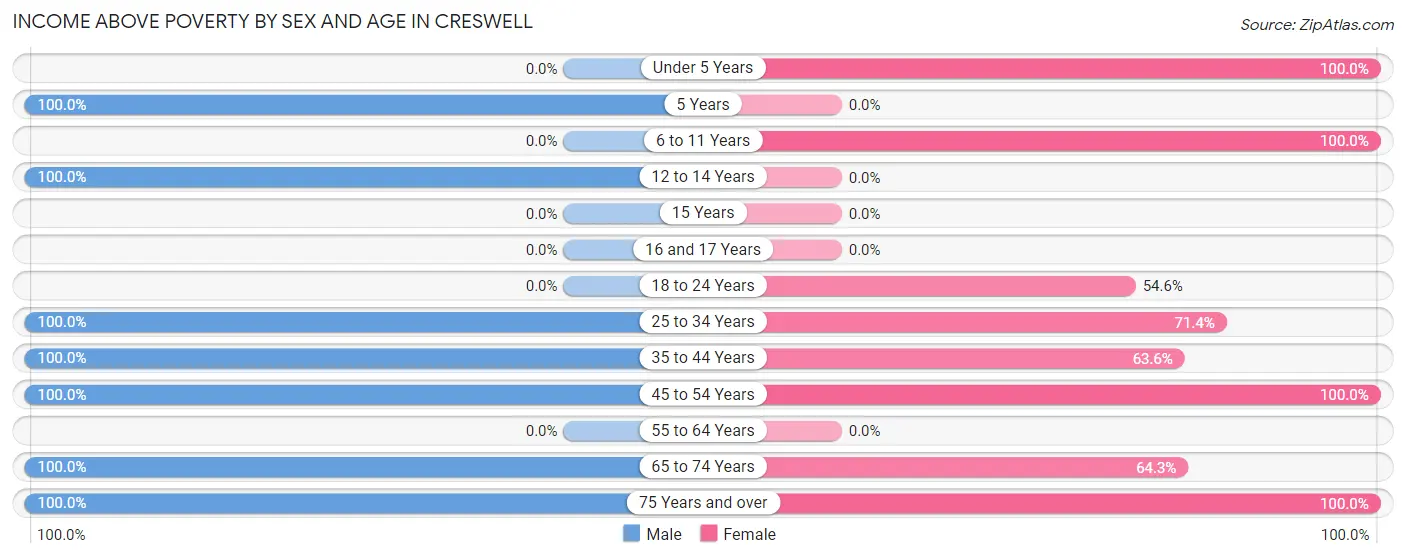
| Age Bracket | Male | Female |
| Under 5 Years | 0 (0.0%) | 7 (100.0%) |
| 5 Years | 6 (100.0%) | 0 (0.0%) |
| 6 to 11 Years | 0 (0.0%) | 2 (100.0%) |
| 12 to 14 Years | 2 (100.0%) | 0 (0.0%) |
| 15 Years | 0 (0.0%) | 0 (0.0%) |
| 16 and 17 Years | 0 (0.0%) | 0 (0.0%) |
| 18 to 24 Years | 0 (0.0%) | 12 (54.5%) |
| 25 to 34 Years | 14 (100.0%) | 5 (71.4%) |
| 35 to 44 Years | 5 (100.0%) | 7 (63.6%) |
| 45 to 54 Years | 8 (100.0%) | 6 (100.0%) |
| 55 to 64 Years | 0 (0.0%) | 0 (0.0%) |
| 65 to 74 Years | 7 (100.0%) | 9 (64.3%) |
| 75 Years and over | 7 (100.0%) | 17 (100.0%) |
| Total | 49 (77.8%) | 65 (73.0%) |
Income Below Poverty Among Married-Couple Families in Creswell
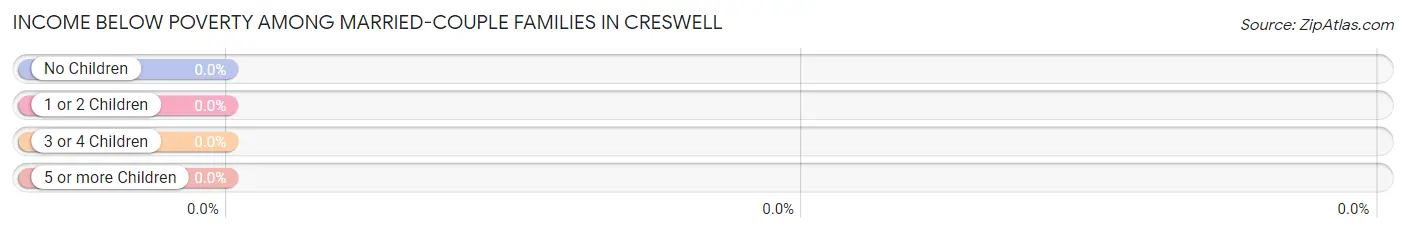
| Children | Above Poverty | Below Poverty |
| No Children | 17 (100.0%) | 0 (0.0%) |
| 1 or 2 Children | 11 (100.0%) | 0 (0.0%) |
| 3 or 4 Children | 0 (0.0%) | 0 (0.0%) |
| 5 or more Children | 0 (0.0%) | 0 (0.0%) |
| Total | 28 (100.0%) | 0 (0.0%) |
Income Below Poverty Among Single-Parent Households in Creswell
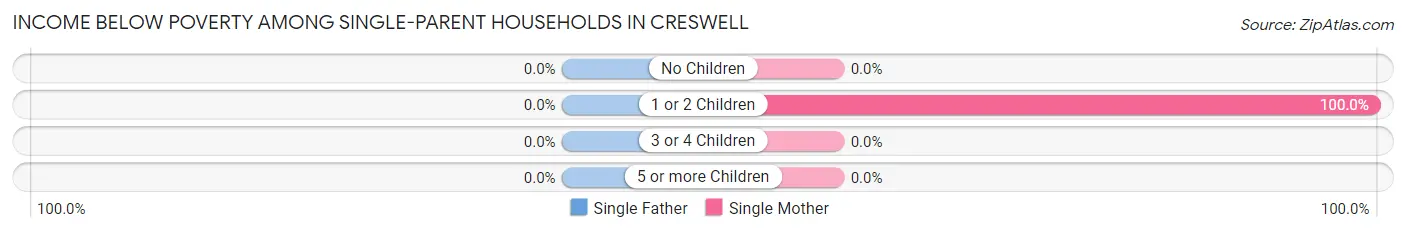
| Children | Single Father | Single Mother |
| No Children | 0 (0.0%) | 0 (0.0%) |
| 1 or 2 Children | 0 (0.0%) | 12 (100.0%) |
| 3 or 4 Children | 0 (0.0%) | 0 (0.0%) |
| 5 or more Children | 0 (0.0%) | 0 (0.0%) |
| Total | 0 (0.0%) | 12 (80.0%) |
Income Below Poverty Among Married-Couple vs Single-Parent Households in Creswell
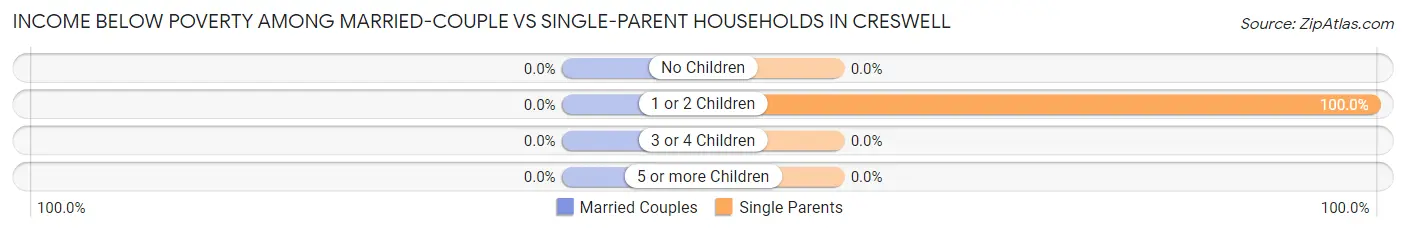
| Children | Married-Couple Families | Single-Parent Households |
| No Children | 0 (0.0%) | 0 (0.0%) |
| 1 or 2 Children | 0 (0.0%) | 12 (100.0%) |
| 3 or 4 Children | 0 (0.0%) | 0 (0.0%) |
| 5 or more Children | 0 (0.0%) | 0 (0.0%) |
| Total | 0 (0.0%) | 12 (80.0%) |
Race in Creswell
The most populous races in Creswell are Black / African American (68 | 44.7%), White / Caucasian (65 | 42.8%), and Hispanic or Latino (19 | 12.5%).
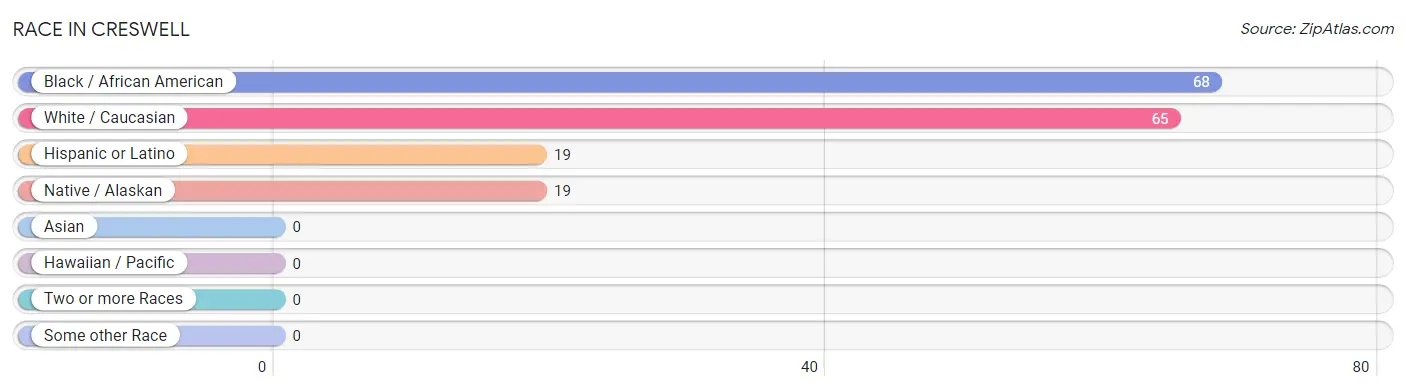
| Race | # Population | % Population |
| Asian | 0 | 0.0% |
| Black / African American | 68 | 44.7% |
| Hawaiian / Pacific | 0 | 0.0% |
| Hispanic or Latino | 19 | 12.5% |
| Native / Alaskan | 19 | 12.5% |
| White / Caucasian | 65 | 42.8% |
| Two or more Races | 0 | 0.0% |
| Some other Race | 0 | 0.0% |
| Total | 152 | 100.0% |
Ancestry in Creswell
The most populous ancestries reported in Creswell are Central American (19 | 12.5%), Spanish American Indian (19 | 12.5%), Irish (17 | 11.2%), Honduran (15 | 9.9%), and American (13 | 8.6%), together accounting for 54.6% of all Creswell residents.
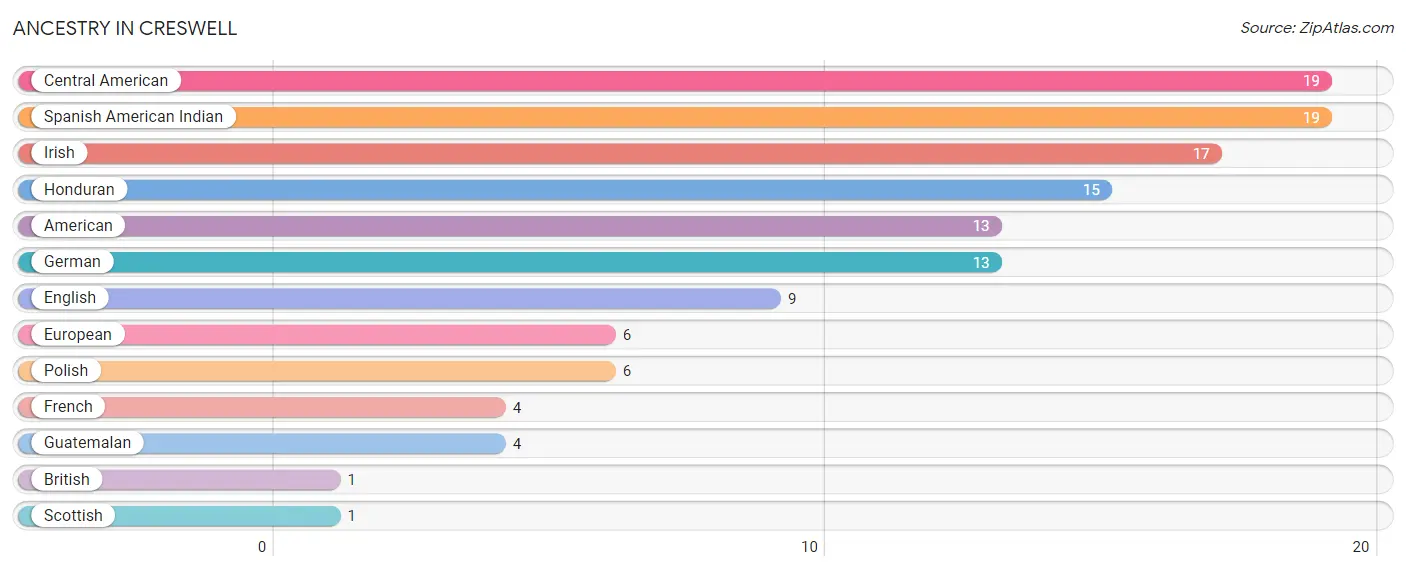
| Ancestry | # Population | % Population |
| American | 13 | 8.6% |
| British | 1 | 0.7% |
| Central American | 19 | 12.5% |
| English | 9 | 5.9% |
| European | 6 | 4.0% |
| French | 4 | 2.6% |
| German | 13 | 8.6% |
| Guatemalan | 4 | 2.6% |
| Honduran | 15 | 9.9% |
| Irish | 17 | 11.2% |
| Polish | 6 | 4.0% |
| Scottish | 1 | 0.7% |
| Spanish American Indian | 19 | 12.5% | View All 13 Rows |
Immigrants in Creswell
The most numerous immigrant groups reported in Creswell came from Central America (19 | 12.5%), Latin America (19 | 12.5%), Honduras (15 | 9.9%), and Guatemala (4 | 2.6%), together accounting for 37.5% of all Creswell residents.
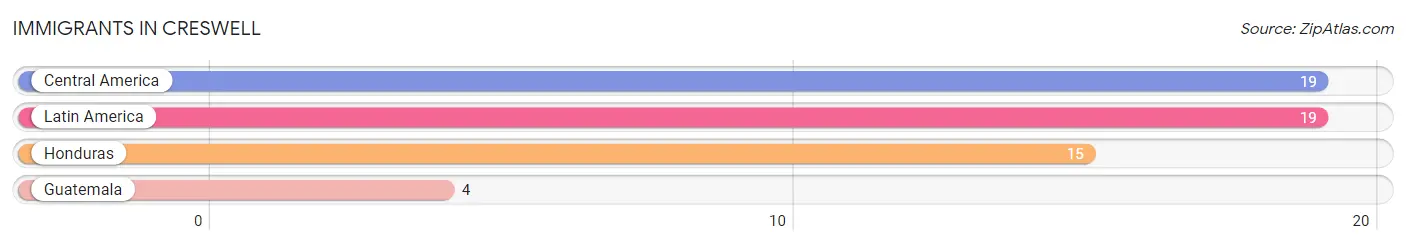
| Immigration Origin | # Population | % Population |
| Central America | 19 | 12.5% |
| Guatemala | 4 | 2.6% |
| Honduras | 15 | 9.9% |
| Latin America | 19 | 12.5% | View All 4 Rows |
Sex and Age in Creswell
Sex and Age in Creswell
The most populous age groups in Creswell are 25 to 29 Years (9 | 14.3%) for men and 20 to 24 Years (22 | 24.7%) for women.
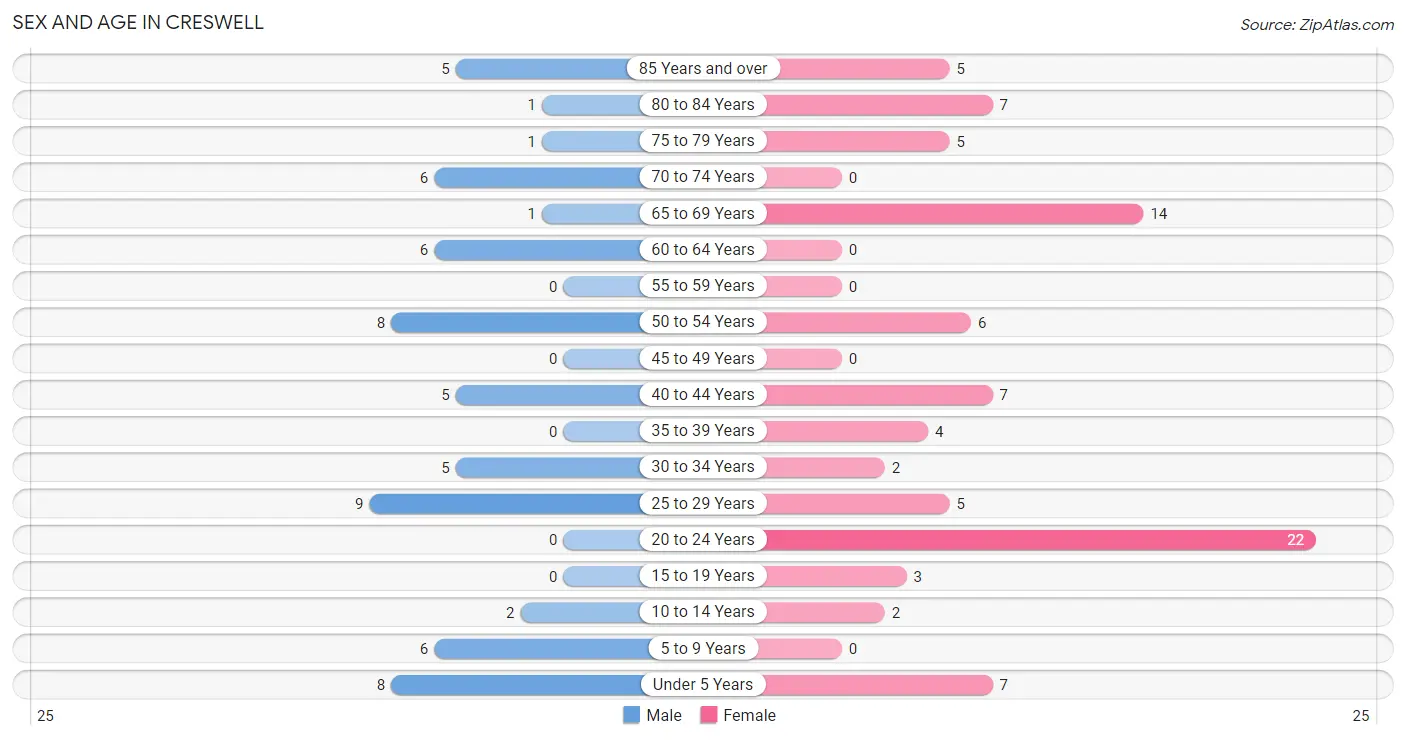
| Age Bracket | Male | Female |
| Under 5 Years | 8 (12.7%) | 7 (7.9%) |
| 5 to 9 Years | 6 (9.5%) | 0 (0.0%) |
| 10 to 14 Years | 2 (3.2%) | 2 (2.2%) |
| 15 to 19 Years | 0 (0.0%) | 3 (3.4%) |
| 20 to 24 Years | 0 (0.0%) | 22 (24.7%) |
| 25 to 29 Years | 9 (14.3%) | 5 (5.6%) |
| 30 to 34 Years | 5 (7.9%) | 2 (2.2%) |
| 35 to 39 Years | 0 (0.0%) | 4 (4.5%) |
| 40 to 44 Years | 5 (7.9%) | 7 (7.9%) |
| 45 to 49 Years | 0 (0.0%) | 0 (0.0%) |
| 50 to 54 Years | 8 (12.7%) | 6 (6.7%) |
| 55 to 59 Years | 0 (0.0%) | 0 (0.0%) |
| 60 to 64 Years | 6 (9.5%) | 0 (0.0%) |
| 65 to 69 Years | 1 (1.6%) | 14 (15.7%) |
| 70 to 74 Years | 6 (9.5%) | 0 (0.0%) |
| 75 to 79 Years | 1 (1.6%) | 5 (5.6%) |
| 80 to 84 Years | 1 (1.6%) | 7 (7.9%) |
| 85 Years and over | 5 (7.9%) | 5 (5.6%) |
| Total | 63 (100.0%) | 89 (100.0%) |
Families and Households in Creswell
Median Family Size in Creswell
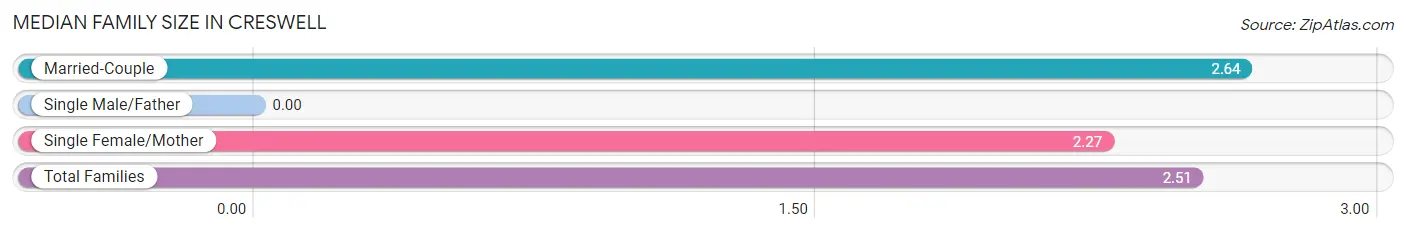
| Family Type | # Families | Family Size |
| Married-Couple | 28 (65.1%) | 2.64 |
| Single Male/Father | 0 (0.0%) | - |
| Single Female/Mother | 15 (34.9%) | 2.27 |
| Total Families | 43 (100.0%) | 2.51 |
Median Household Size in Creswell
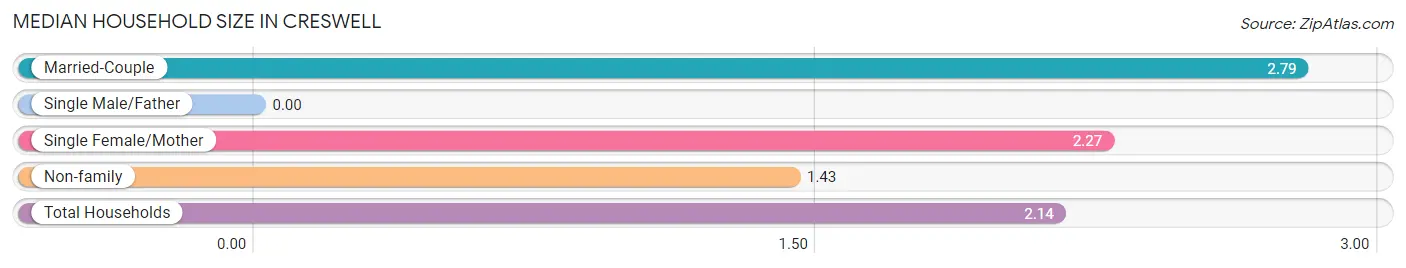
| Household Type | # Households | Household Size |
| Married-Couple | 28 (39.4%) | 2.79 |
| Single Male/Father | 0 (0.0%) | - |
| Single Female/Mother | 15 (21.1%) | 2.27 |
| Non-family | 28 (39.4%) | 1.43 |
| Total Households | 71 (100.0%) | 2.14 |
Household Size by Marriage Status in Creswell
Out of a total of 71 households in Creswell, 43 (60.6%) are family households, while 28 (39.4%) are nonfamily households. The most numerous type of family households are 2-person households, comprising 32, and the most common type of nonfamily households are 1-person households, comprising 21.
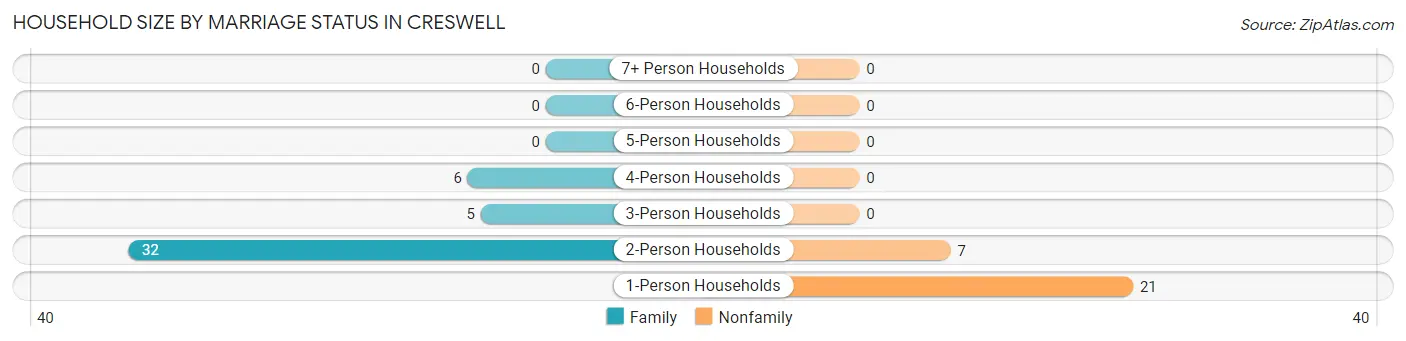
| Household Size | Family Households | Nonfamily Households |
| 1-Person Households | - | 21 (29.6%) |
| 2-Person Households | 32 (45.1%) | 7 (9.9%) |
| 3-Person Households | 5 (7.0%) | 0 (0.0%) |
| 4-Person Households | 6 (8.5%) | 0 (0.0%) |
| 5-Person Households | 0 (0.0%) | 0 (0.0%) |
| 6-Person Households | 0 (0.0%) | 0 (0.0%) |
| 7+ Person Households | 0 (0.0%) | 0 (0.0%) |
| Total | 43 (60.6%) | 28 (39.4%) |
Female Fertility in Creswell
Fertility by Age in Creswell
Average fertility rate in Creswell is 227.0 births per 1,000 women. Women in the age bracket of 20 to 34 years have the highest fertility rate with 345.0 births per 1,000 women. Women in the age bracket of 20 to 34 years acount for 100.0% of all women with births.
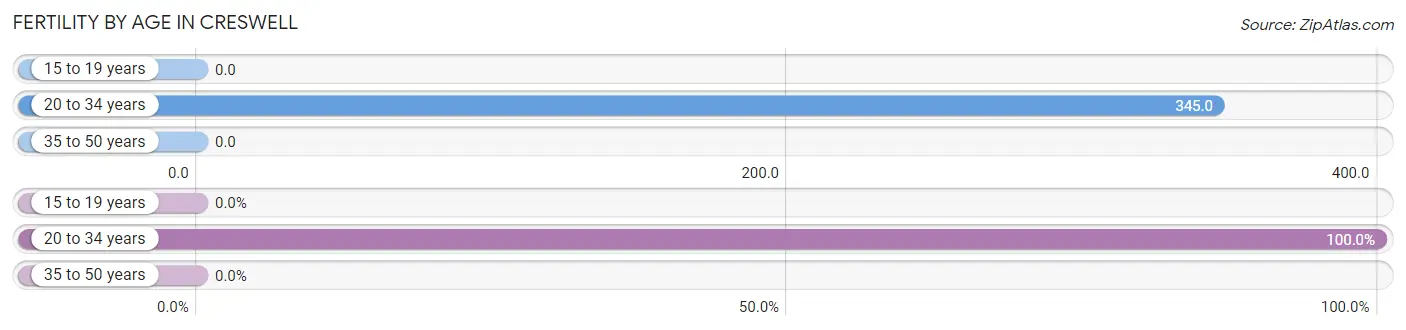
| Age Bracket | Women with Births | Births / 1,000 Women |
| 15 to 19 years | 0 (0.0%) | 0.0 |
| 20 to 34 years | 10 (100.0%) | 345.0 |
| 35 to 50 years | 0 (0.0%) | 0.0 |
| Total | 10 (100.0%) | 227.0 |
Fertility by Age by Marriage Status in Creswell
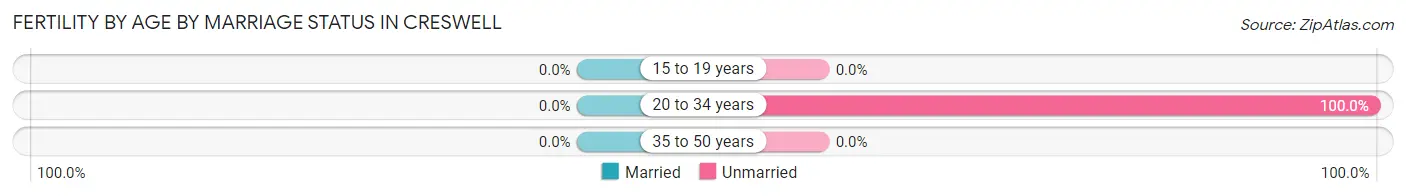
| Age Bracket | Married | Unmarried |
| 15 to 19 years | 0 (0.0%) | 0 (0.0%) |
| 20 to 34 years | 0 (0.0%) | 10 (100.0%) |
| 35 to 50 years | 0 (0.0%) | 0 (0.0%) |
| Total | 0 (0.0%) | 10 (100.0%) |
Fertility by Education in Creswell
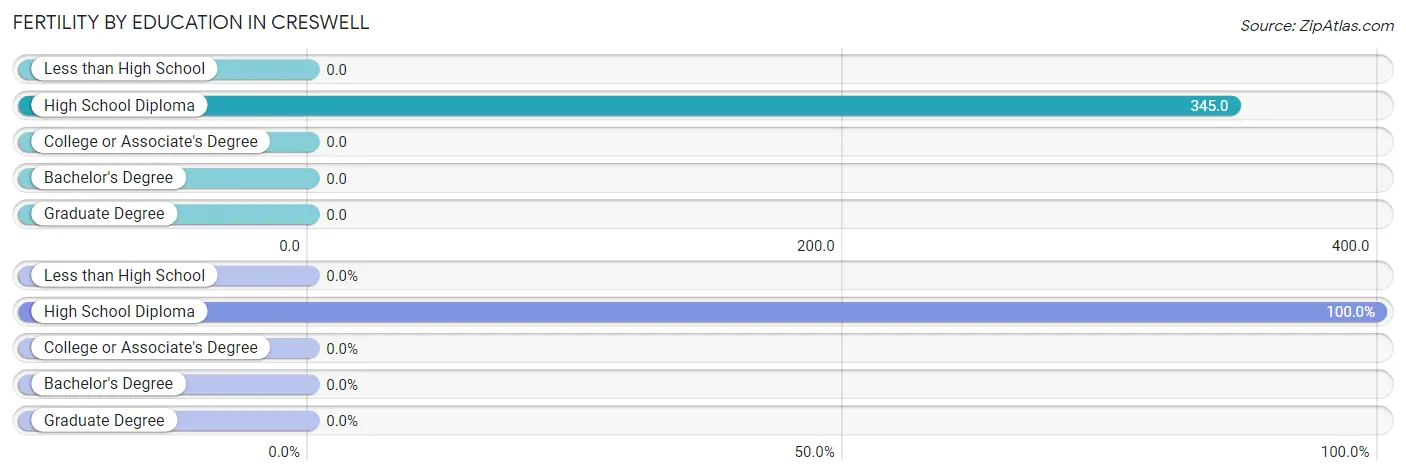
| Educational Attainment | Women with Births | Births / 1,000 Women |
| Less than High School | 0 (0.0%) | 0.0 |
| High School Diploma | 10 (100.0%) | 345.0 |
| College or Associate's Degree | 0 (0.0%) | 0.0 |
| Bachelor's Degree | 0 (0.0%) | 0.0 |
| Graduate Degree | 0 (0.0%) | 0.0 |
| Total | 10 (100.0%) | 227.0 |
Fertility by Education by Marriage Status in Creswell
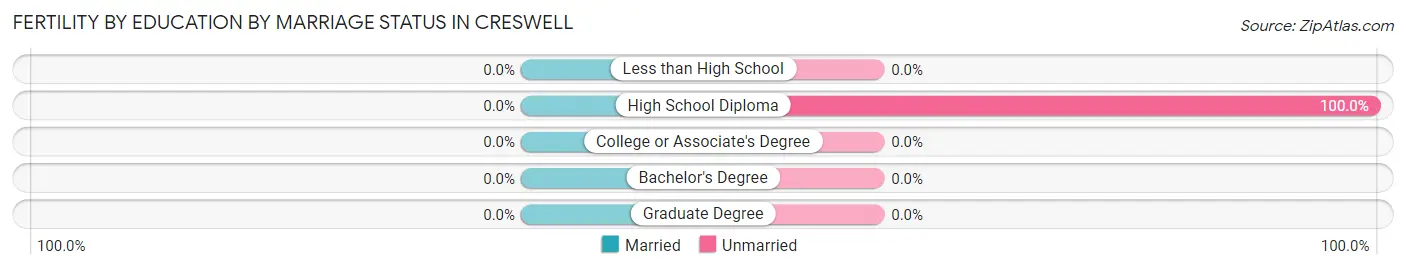
| Educational Attainment | Married | Unmarried |
| Less than High School | 0 (0.0%) | 0 (0.0%) |
| High School Diploma | 0 (0.0%) | 10 (100.0%) |
| College or Associate's Degree | 0 (0.0%) | 0 (0.0%) |
| Bachelor's Degree | 0 (0.0%) | 0 (0.0%) |
| Graduate Degree | 0 (0.0%) | 0 (0.0%) |
| Total | 0 (0.0%) | 10 (100.0%) |
Employment Characteristics in Creswell
Employment by Class of Employer in Creswell
Among the 62 employed individuals in Creswell, private company employees (49 | 79.0%), state government employees (7 | 11.3%), and local government employees (5 | 8.1%) make up the most common classes of employment.
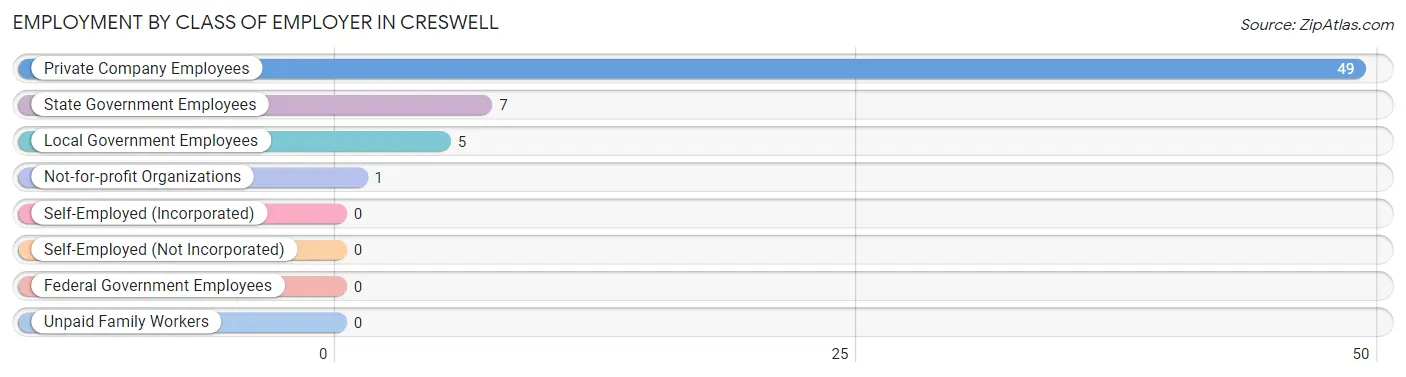
| Employer Class | # Employees | % Employees |
| Private Company Employees | 49 | 79.0% |
| Self-Employed (Incorporated) | 0 | 0.0% |
| Self-Employed (Not Incorporated) | 0 | 0.0% |
| Not-for-profit Organizations | 1 | 1.6% |
| Local Government Employees | 5 | 8.1% |
| State Government Employees | 7 | 11.3% |
| Federal Government Employees | 0 | 0.0% |
| Unpaid Family Workers | 0 | 0.0% |
| Total | 62 | 100.0% |
Employment Status by Age in Creswell
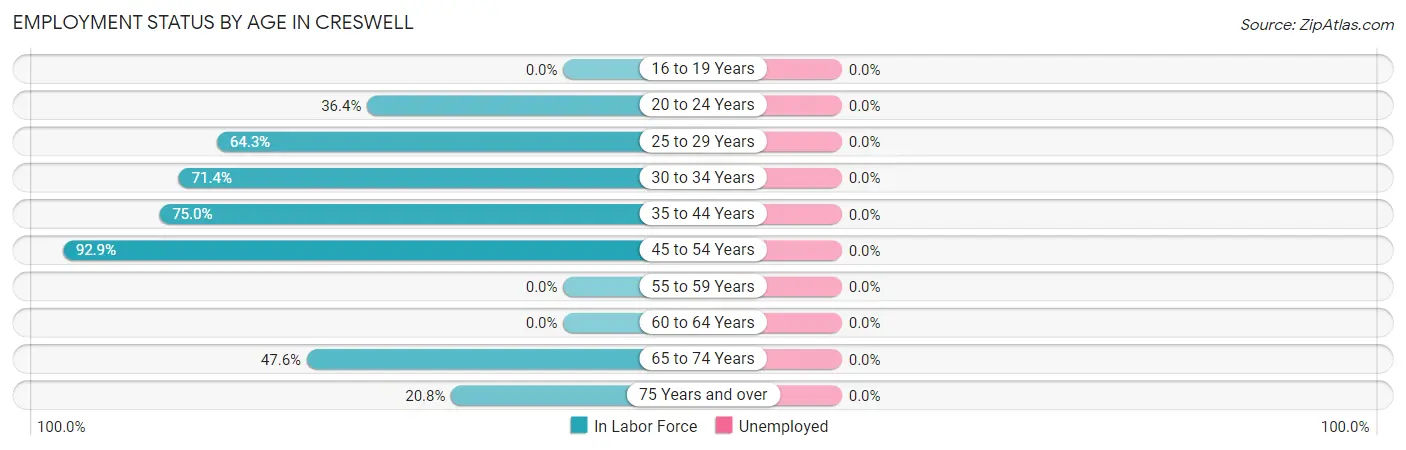
| Age Bracket | In Labor Force | Unemployed |
| 16 to 19 Years | 0 (0.0%) | 0 (0.0%) |
| 20 to 24 Years | 8 (36.4%) | 0 (0.0%) |
| 25 to 29 Years | 9 (64.3%) | 0 (0.0%) |
| 30 to 34 Years | 5 (71.4%) | 0 (0.0%) |
| 35 to 44 Years | 12 (75.0%) | 0 (0.0%) |
| 45 to 54 Years | 13 (92.9%) | 0 (0.0%) |
| 55 to 59 Years | 0 (0.0%) | 0 (0.0%) |
| 60 to 64 Years | 0 (0.0%) | 0 (0.0%) |
| 65 to 74 Years | 10 (47.6%) | 0 (0.0%) |
| 75 Years and over | 5 (20.8%) | 0 (0.0%) |
| Total | 62 (50.0%) | 0 (0.0%) |
Employment Status by Educational Attainment in Creswell
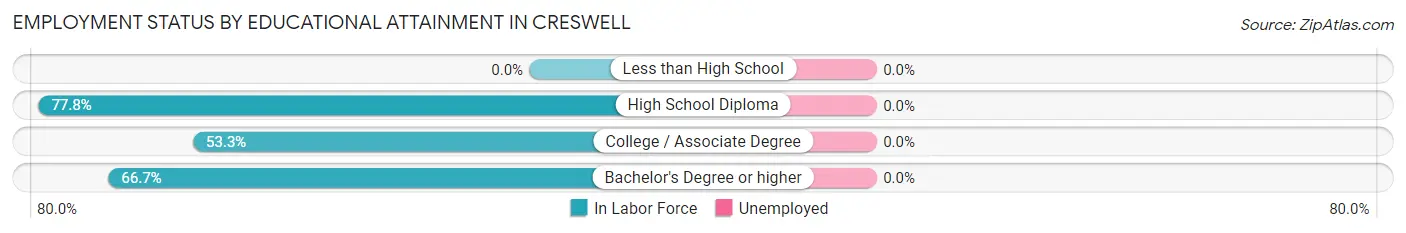
| Educational Attainment | In Labor Force | Unemployed |
| Less than High School | 0 (0.0%) | 0 (0.0%) |
| High School Diploma | 21 (77.8%) | 0 (0.0%) |
| College / Associate Degree | 8 (53.3%) | 0 (0.0%) |
| Bachelor's Degree or higher | 10 (66.7%) | 0 (0.0%) |
| Total | 39 (68.4%) | 0 (0.0%) |
Employment Occupations by Sex in Creswell
Management, Business, Science and Arts Occupations
The most common Management, Business, Science and Arts occupations in Creswell are Management (10 | 16.1%), Community & Social Service (5 | 8.1%), Education Instruction & Library (5 | 8.1%), and Health Diagnosing & Treating (5 | 8.1%).
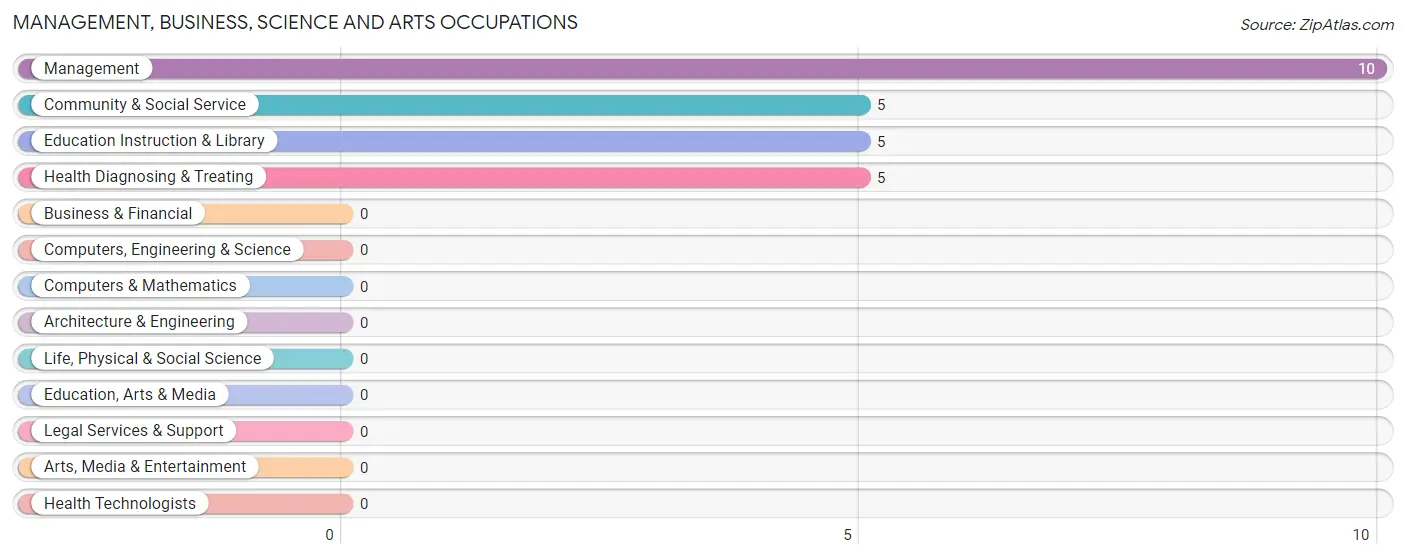
Management, Business, Science and Arts Occupations by Sex
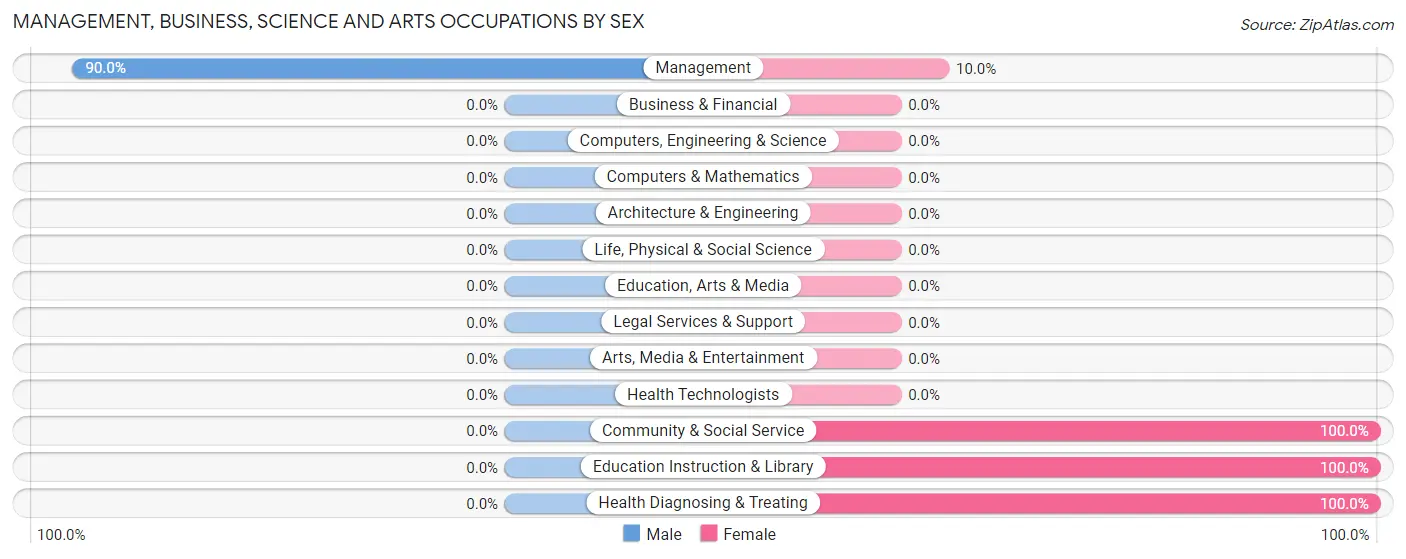
| Occupation | Male | Female |
| Management | 9 (90.0%) | 1 (10.0%) |
| Business & Financial | 0 (0.0%) | 0 (0.0%) |
| Computers, Engineering & Science | 0 (0.0%) | 0 (0.0%) |
| Computers & Mathematics | 0 (0.0%) | 0 (0.0%) |
| Architecture & Engineering | 0 (0.0%) | 0 (0.0%) |
| Life, Physical & Social Science | 0 (0.0%) | 0 (0.0%) |
| Community & Social Service | 0 (0.0%) | 5 (100.0%) |
| Education, Arts & Media | 0 (0.0%) | 0 (0.0%) |
| Legal Services & Support | 0 (0.0%) | 0 (0.0%) |
| Education Instruction & Library | 0 (0.0%) | 5 (100.0%) |
| Arts, Media & Entertainment | 0 (0.0%) | 0 (0.0%) |
| Health Diagnosing & Treating | 0 (0.0%) | 5 (100.0%) |
| Health Technologists | 0 (0.0%) | 0 (0.0%) |
| Total (Category) | 9 (45.0%) | 11 (55.0%) |
| Total (Overall) | 27 (43.5%) | 35 (56.5%) |
Services Occupations
The most common Services occupations in Creswell are , and Cleaning & Maintenance (13 | 21.0%).
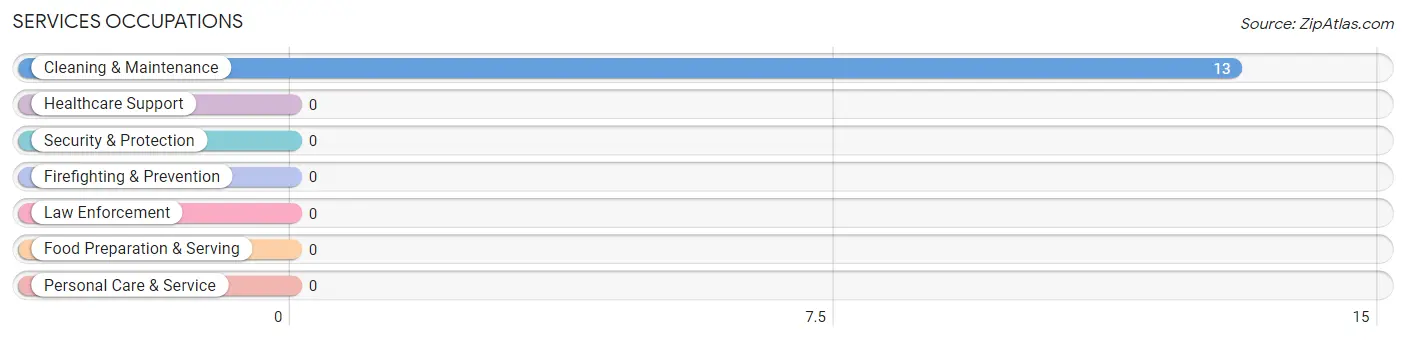
Services Occupations by Sex
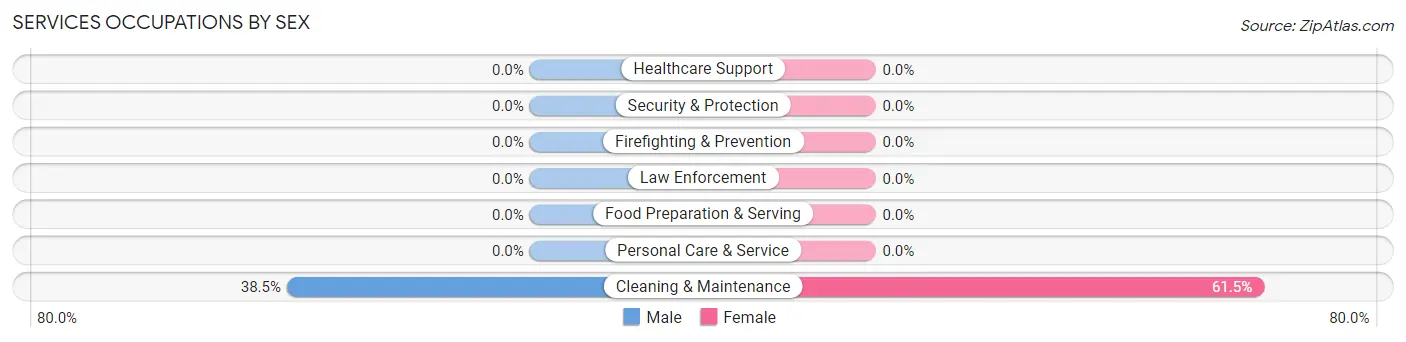
| Occupation | Male | Female |
| Healthcare Support | 0 (0.0%) | 0 (0.0%) |
| Security & Protection | 0 (0.0%) | 0 (0.0%) |
| Firefighting & Prevention | 0 (0.0%) | 0 (0.0%) |
| Law Enforcement | 0 (0.0%) | 0 (0.0%) |
| Food Preparation & Serving | 0 (0.0%) | 0 (0.0%) |
| Cleaning & Maintenance | 5 (38.5%) | 8 (61.5%) |
| Personal Care & Service | 0 (0.0%) | 0 (0.0%) |
| Total (Category) | 5 (38.5%) | 8 (61.5%) |
| Total (Overall) | 27 (43.5%) | 35 (56.5%) |
Sales and Office Occupations
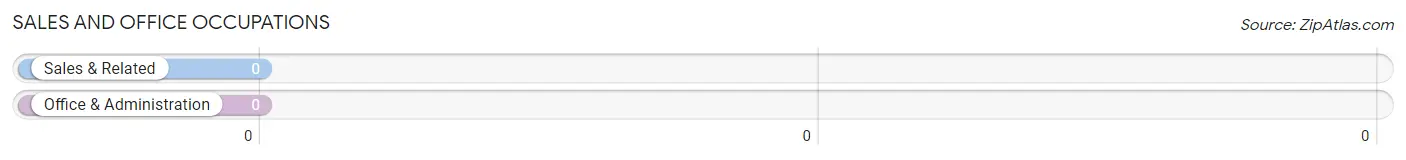
Sales and Office Occupations by Sex
| Occupation | Male | Female |
| Sales & Related | 0 (0.0%) | 0 (0.0%) |
| Office & Administration | 0 (0.0%) | 0 (0.0%) |
| Total (Category) | 0 (0.0%) | 0 (0.0%) |
| Total (Overall) | 27 (43.5%) | 35 (56.5%) |
Natural Resources, Construction and Maintenance Occupations
The most common Natural Resources, Construction and Maintenance occupations in Creswell are , and Construction & Extraction (2 | 3.2%).
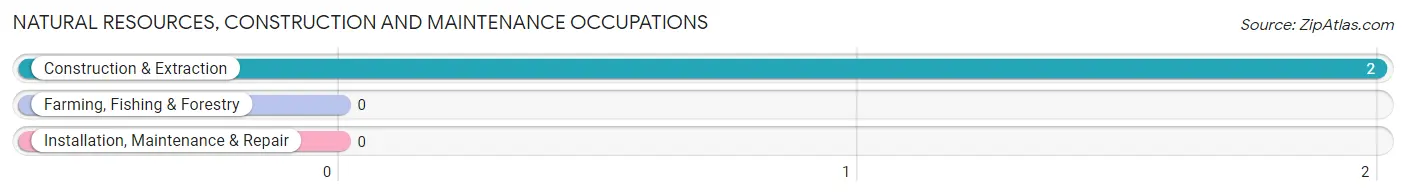
Natural Resources, Construction and Maintenance Occupations by Sex
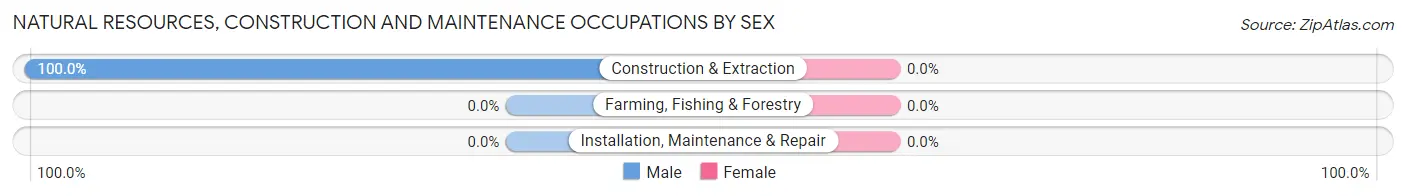
| Occupation | Male | Female |
| Farming, Fishing & Forestry | 0 (0.0%) | 0 (0.0%) |
| Construction & Extraction | 2 (100.0%) | 0 (0.0%) |
| Installation, Maintenance & Repair | 0 (0.0%) | 0 (0.0%) |
| Total (Category) | 2 (100.0%) | 0 (0.0%) |
| Total (Overall) | 27 (43.5%) | 35 (56.5%) |
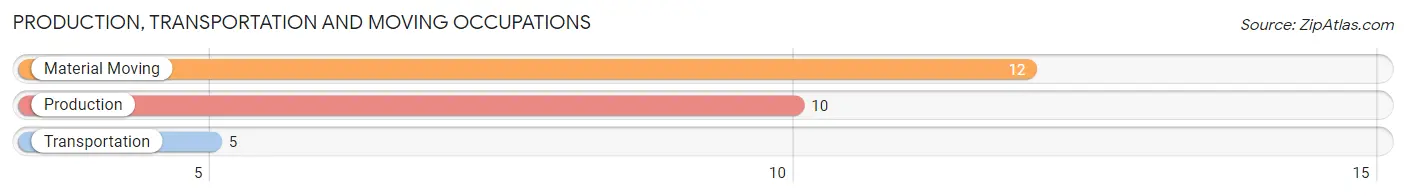
Production, Transportation and Moving Occupations
The most common Production, Transportation and Moving occupations in Creswell are Material Moving (12 | 19.4%), Production (10 | 16.1%), and Transportation (5 | 8.1%).
Production, Transportation and Moving Occupations by Sex
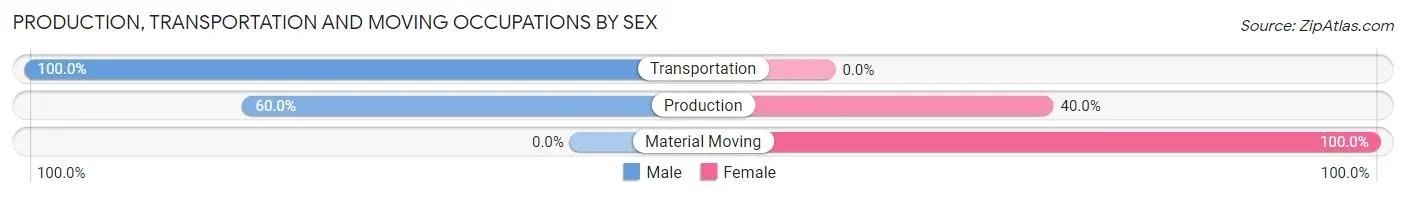
| Occupation | Male | Female |
| Production | 6 (60.0%) | 4 (40.0%) |
| Transportation | 5 (100.0%) | 0 (0.0%) |
| Material Moving | 0 (0.0%) | 12 (100.0%) |
| Total (Category) | 11 (40.7%) | 16 (59.3%) |
| Total (Overall) | 27 (43.5%) | 35 (56.5%) |
Employment Industries by Sex in Creswell
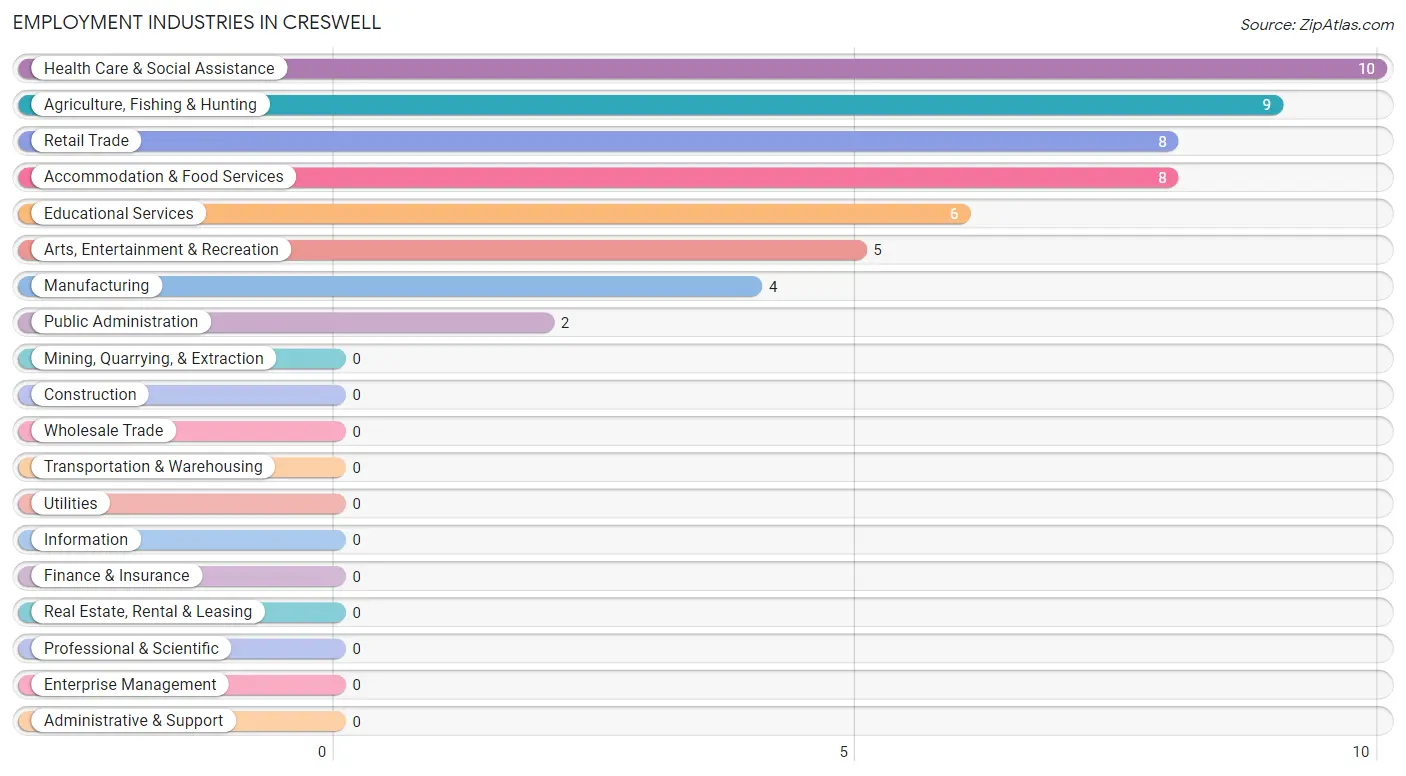
Employment Industries in Creswell
The major employment industries in Creswell include Health Care & Social Assistance (10 | 16.1%), Agriculture, Fishing & Hunting (9 | 14.5%), Retail Trade (8 | 12.9%), Accommodation & Food Services (8 | 12.9%), and Educational Services (6 | 9.7%).
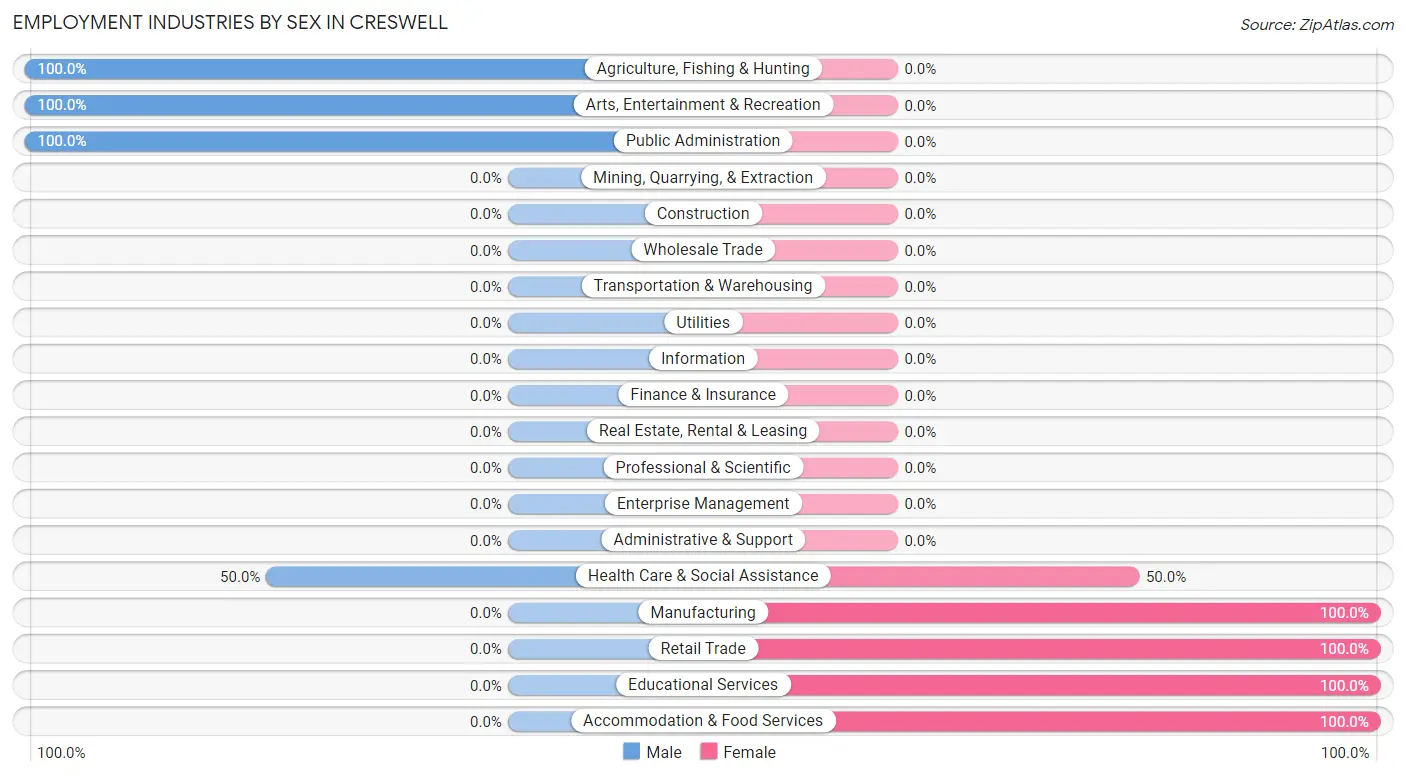
Employment Industries by Sex in Creswell
The Creswell industries that see more men than women are Agriculture, Fishing & Hunting (100.0%), Arts, Entertainment & Recreation (100.0%), and Public Administration (100.0%), whereas the industries that tend to have a higher number of women are Manufacturing (100.0%), Retail Trade (100.0%), and Educational Services (100.0%).
| Industry | Male | Female |
| Agriculture, Fishing & Hunting | 9 (100.0%) | 0 (0.0%) |
| Mining, Quarrying, & Extraction | 0 (0.0%) | 0 (0.0%) |
| Construction | 0 (0.0%) | 0 (0.0%) |
| Manufacturing | 0 (0.0%) | 4 (100.0%) |
| Wholesale Trade | 0 (0.0%) | 0 (0.0%) |
| Retail Trade | 0 (0.0%) | 8 (100.0%) |
| Transportation & Warehousing | 0 (0.0%) | 0 (0.0%) |
| Utilities | 0 (0.0%) | 0 (0.0%) |
| Information | 0 (0.0%) | 0 (0.0%) |
| Finance & Insurance | 0 (0.0%) | 0 (0.0%) |
| Real Estate, Rental & Leasing | 0 (0.0%) | 0 (0.0%) |
| Professional & Scientific | 0 (0.0%) | 0 (0.0%) |
| Enterprise Management | 0 (0.0%) | 0 (0.0%) |
| Administrative & Support | 0 (0.0%) | 0 (0.0%) |
| Educational Services | 0 (0.0%) | 6 (100.0%) |
| Health Care & Social Assistance | 5 (50.0%) | 5 (50.0%) |
| Arts, Entertainment & Recreation | 5 (100.0%) | 0 (0.0%) |
| Accommodation & Food Services | 0 (0.0%) | 8 (100.0%) |
| Public Administration | 2 (100.0%) | 0 (0.0%) |
| Total | 27 (43.5%) | 35 (56.5%) |
Education in Creswell
School Enrollment in Creswell
The most common levels of schooling among the 21 students in Creswell are college / undergraduate (8 | 38.1%), kindergarten (6 | 28.6%), and middle school (4 | 19.1%).
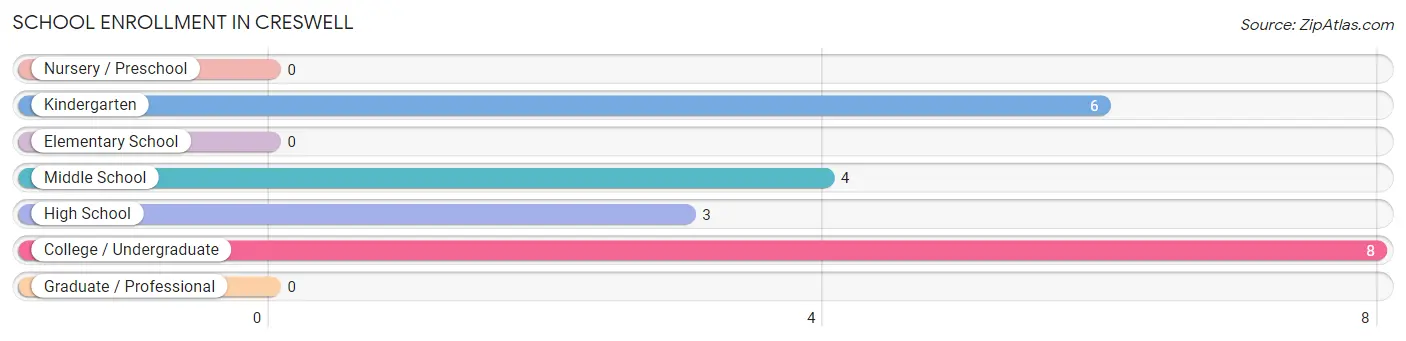
| School Level | # Students | % Students |
| Nursery / Preschool | 0 | 0.0% |
| Kindergarten | 6 | 28.6% |
| Elementary School | 0 | 0.0% |
| Middle School | 4 | 19.1% |
| High School | 3 | 14.3% |
| College / Undergraduate | 8 | 38.1% |
| Graduate / Professional | 0 | 0.0% |
| Total | 21 | 100.0% |
School Enrollment by Age by Funding Source in Creswell
Out of a total of 21 students who are enrolled in schools in Creswell, 3 (14.3%) attend a private institution, while the remaining 18 (85.7%) are enrolled in public schools. The age group of 15 to 17 year olds has the highest likelihood of being enrolled in private schools, with 3 (100.0% in the age bracket) enrolled. Conversely, the age group of 5 to 9 year old has the lowest likelihood of being enrolled in a private school, with 6 (100.0% in the age bracket) attending a public institution.
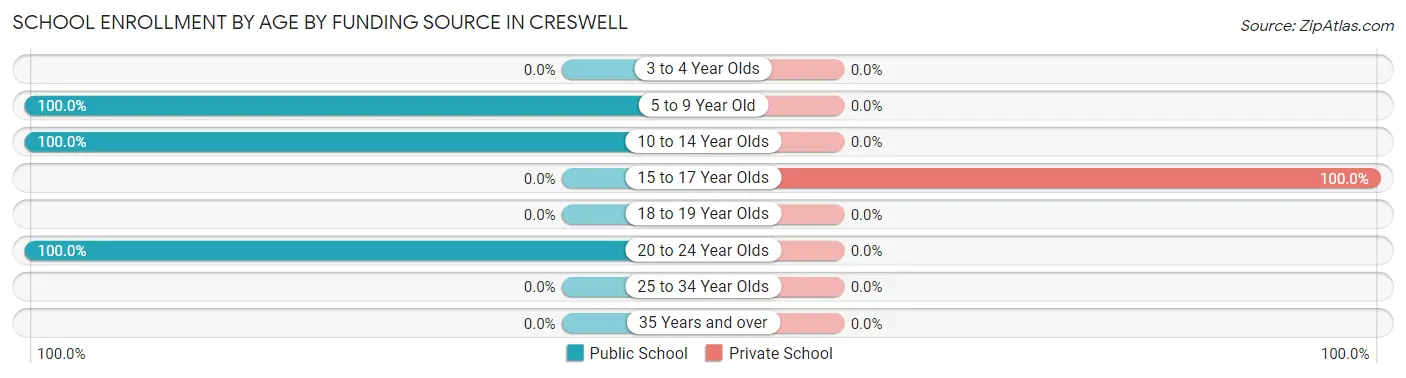
| Age Bracket | Public School | Private School |
| 3 to 4 Year Olds | 0 (0.0%) | 0 (0.0%) |
| 5 to 9 Year Old | 6 (100.0%) | 0 (0.0%) |
| 10 to 14 Year Olds | 4 (100.0%) | 0 (0.0%) |
| 15 to 17 Year Olds | 0 (0.0%) | 3 (100.0%) |
| 18 to 19 Year Olds | 0 (0.0%) | 0 (0.0%) |
| 20 to 24 Year Olds | 8 (100.0%) | 0 (0.0%) |
| 25 to 34 Year Olds | 0 (0.0%) | 0 (0.0%) |
| 35 Years and over | 0 (0.0%) | 0 (0.0%) |
| Total | 18 (85.7%) | 3 (14.3%) |
Educational Attainment by Field of Study in Creswell
Bio, nature & agricultural (14 | 60.9%), education (7 | 30.4%), social sciences (1 | 4.3%), and communications (1 | 4.3%) are the most common fields of study among 23 individuals in Creswell who have obtained a bachelor's degree or higher.
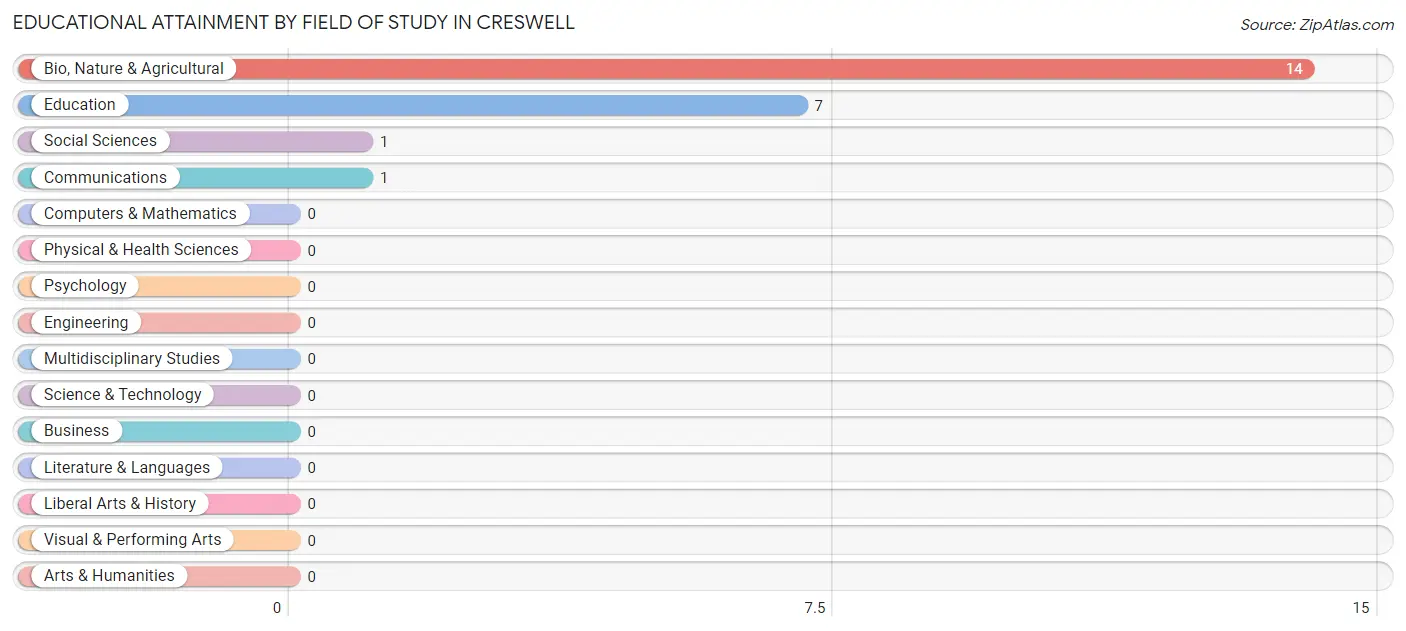
| Field of Study | # Graduates | % Graduates |
| Computers & Mathematics | 0 | 0.0% |
| Bio, Nature & Agricultural | 14 | 60.9% |
| Physical & Health Sciences | 0 | 0.0% |
| Psychology | 0 | 0.0% |
| Social Sciences | 1 | 4.3% |
| Engineering | 0 | 0.0% |
| Multidisciplinary Studies | 0 | 0.0% |
| Science & Technology | 0 | 0.0% |
| Business | 0 | 0.0% |
| Education | 7 | 30.4% |
| Literature & Languages | 0 | 0.0% |
| Liberal Arts & History | 0 | 0.0% |
| Visual & Performing Arts | 0 | 0.0% |
| Communications | 1 | 4.3% |
| Arts & Humanities | 0 | 0.0% |
| Total | 23 | 100.0% |
Transportation & Commute in Creswell
Vehicle Availability by Sex in Creswell
The most prevalent vehicle ownership categories in Creswell are males with 2 vehicles (27, accounting for 100.0%) and females with 2 vehicles (30, making up 77.1%).
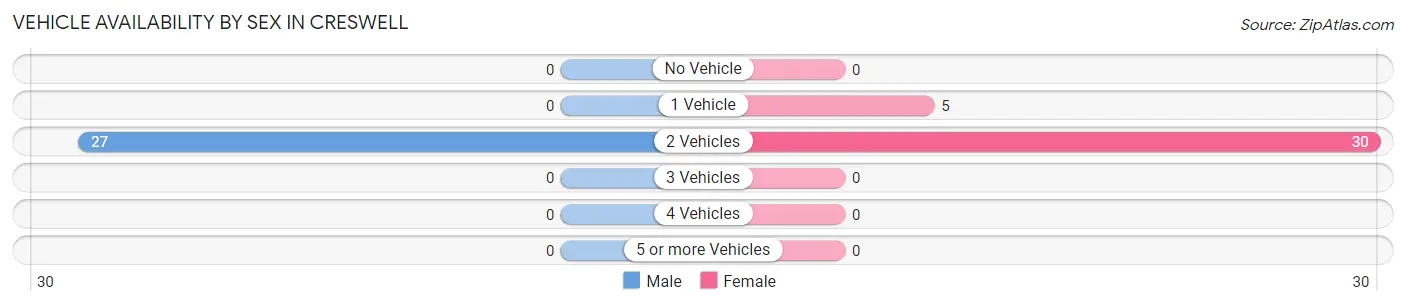
| Vehicles Available | Male | Female |
| No Vehicle | 0 (0.0%) | 0 (0.0%) |
| 1 Vehicle | 0 (0.0%) | 5 (14.3%) |
| 2 Vehicles | 27 (100.0%) | 30 (85.7%) |
| 3 Vehicles | 0 (0.0%) | 0 (0.0%) |
| 4 Vehicles | 0 (0.0%) | 0 (0.0%) |
| 5 or more Vehicles | 0 (0.0%) | 0 (0.0%) |
| Total | 27 (100.0%) | 35 (100.0%) |
Commute Time in Creswell
The most frequently occuring commute durations in Creswell are 60 to 89 minutes (18 commuters, 29.0%), 30 to 34 minutes (15 commuters, 24.2%), and 15 to 19 minutes (14 commuters, 22.6%).
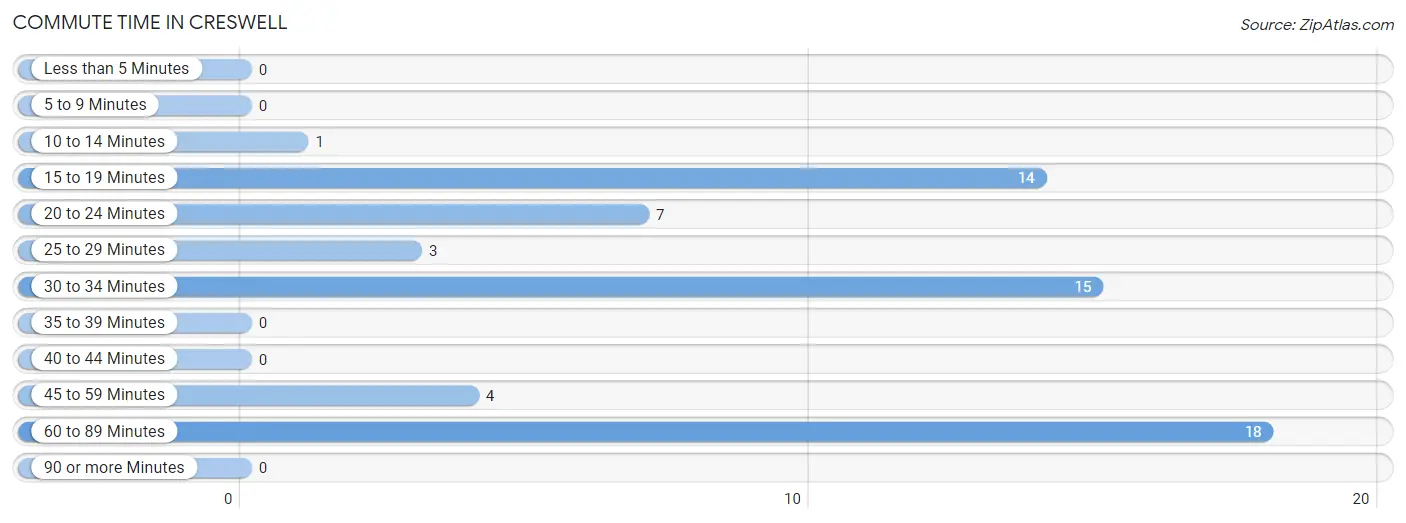
| Commute Time | # Commuters | % Commuters |
| Less than 5 Minutes | 0 | 0.0% |
| 5 to 9 Minutes | 0 | 0.0% |
| 10 to 14 Minutes | 1 | 1.6% |
| 15 to 19 Minutes | 14 | 22.6% |
| 20 to 24 Minutes | 7 | 11.3% |
| 25 to 29 Minutes | 3 | 4.8% |
| 30 to 34 Minutes | 15 | 24.2% |
| 35 to 39 Minutes | 0 | 0.0% |
| 40 to 44 Minutes | 0 | 0.0% |
| 45 to 59 Minutes | 4 | 6.5% |
| 60 to 89 Minutes | 18 | 29.0% |
| 90 or more Minutes | 0 | 0.0% |
Commute Time by Sex in Creswell
The most common commute times in Creswell are 30 to 34 minutes (10 commuters, 37.0%) for males and 60 to 89 minutes (12 commuters, 34.3%) for females.
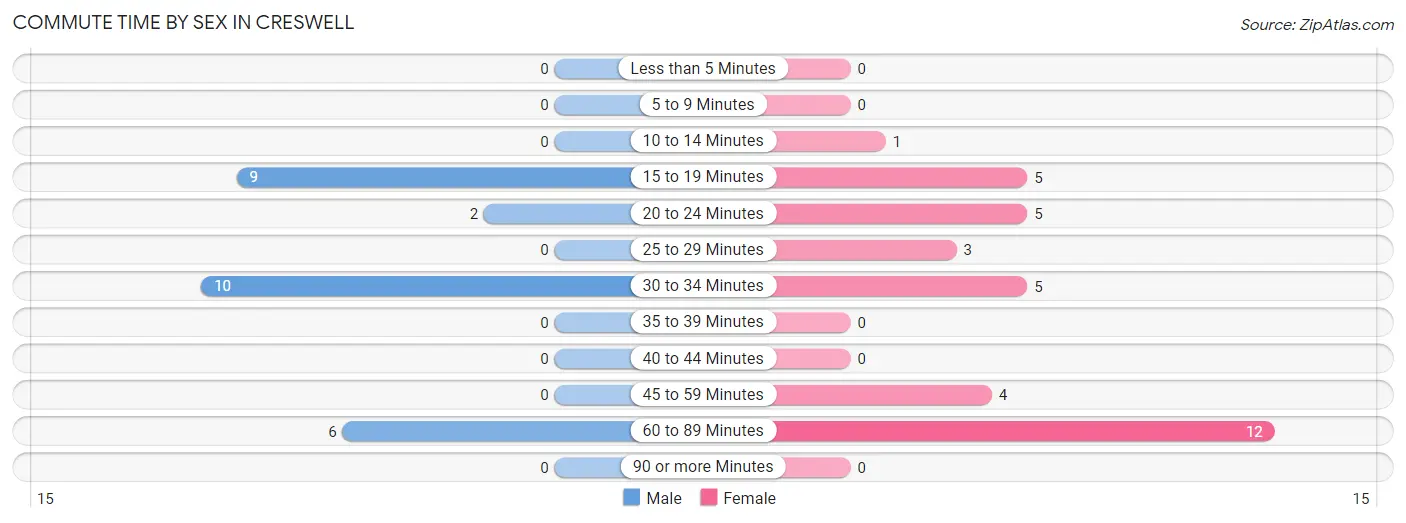
| Commute Time | Male | Female |
| Less than 5 Minutes | 0 (0.0%) | 0 (0.0%) |
| 5 to 9 Minutes | 0 (0.0%) | 0 (0.0%) |
| 10 to 14 Minutes | 0 (0.0%) | 1 (2.9%) |
| 15 to 19 Minutes | 9 (33.3%) | 5 (14.3%) |
| 20 to 24 Minutes | 2 (7.4%) | 5 (14.3%) |
| 25 to 29 Minutes | 0 (0.0%) | 3 (8.6%) |
| 30 to 34 Minutes | 10 (37.0%) | 5 (14.3%) |
| 35 to 39 Minutes | 0 (0.0%) | 0 (0.0%) |
| 40 to 44 Minutes | 0 (0.0%) | 0 (0.0%) |
| 45 to 59 Minutes | 0 (0.0%) | 4 (11.4%) |
| 60 to 89 Minutes | 6 (22.2%) | 12 (34.3%) |
| 90 or more Minutes | 0 (0.0%) | 0 (0.0%) |
Time of Departure to Work by Sex in Creswell
The most frequent times of departure to work in Creswell are 12:00 AM to 4:59 AM (6, 22.2%) for males and 7:00 AM to 7:29 AM (13, 37.1%) for females.
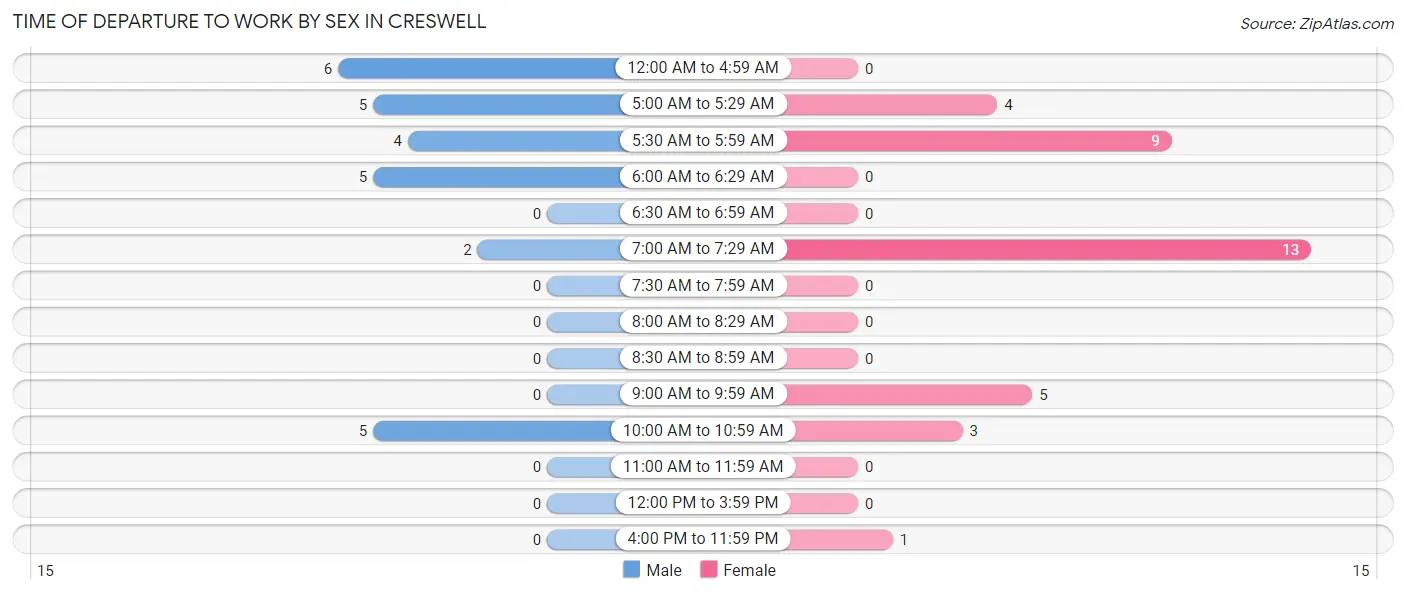
| Time of Departure | Male | Female |
| 12:00 AM to 4:59 AM | 6 (22.2%) | 0 (0.0%) |
| 5:00 AM to 5:29 AM | 5 (18.5%) | 4 (11.4%) |
| 5:30 AM to 5:59 AM | 4 (14.8%) | 9 (25.7%) |
| 6:00 AM to 6:29 AM | 5 (18.5%) | 0 (0.0%) |
| 6:30 AM to 6:59 AM | 0 (0.0%) | 0 (0.0%) |
| 7:00 AM to 7:29 AM | 2 (7.4%) | 13 (37.1%) |
| 7:30 AM to 7:59 AM | 0 (0.0%) | 0 (0.0%) |
| 8:00 AM to 8:29 AM | 0 (0.0%) | 0 (0.0%) |
| 8:30 AM to 8:59 AM | 0 (0.0%) | 0 (0.0%) |
| 9:00 AM to 9:59 AM | 0 (0.0%) | 5 (14.3%) |
| 10:00 AM to 10:59 AM | 5 (18.5%) | 3 (8.6%) |
| 11:00 AM to 11:59 AM | 0 (0.0%) | 0 (0.0%) |
| 12:00 PM to 3:59 PM | 0 (0.0%) | 0 (0.0%) |
| 4:00 PM to 11:59 PM | 0 (0.0%) | 1 (2.9%) |
| Total | 27 (100.0%) | 35 (100.0%) |
Housing Occupancy in Creswell
Occupancy by Ownership in Creswell
Of the total 71 dwellings in Creswell, owner-occupied units account for 34 (47.9%), while renter-occupied units make up 37 (52.1%).
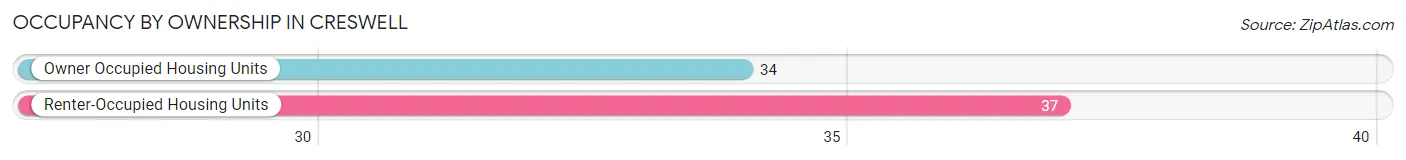
| Occupancy | # Housing Units | % Housing Units |
| Owner Occupied Housing Units | 34 | 47.9% |
| Renter-Occupied Housing Units | 37 | 52.1% |
| Total Occupied Housing Units | 71 | 100.0% |
Occupancy by Household Size in Creswell
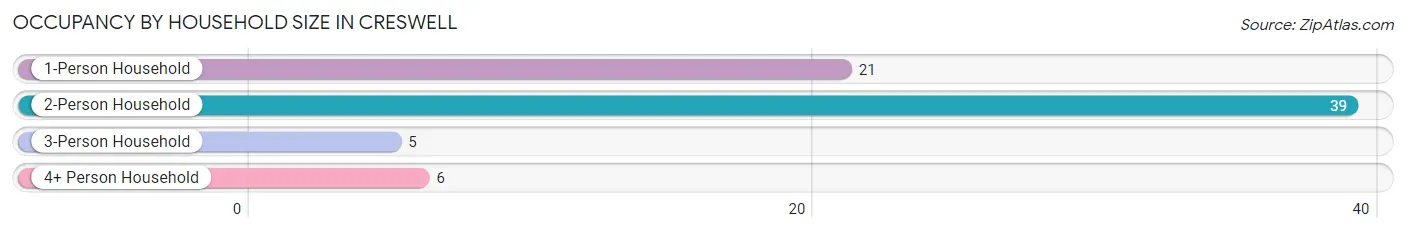
| Household Size | # Housing Units | % Housing Units |
| 1-Person Household | 21 | 29.6% |
| 2-Person Household | 39 | 54.9% |
| 3-Person Household | 5 | 7.0% |
| 4+ Person Household | 6 | 8.5% |
| Total Housing Units | 71 | 100.0% |
Occupancy by Ownership by Household Size in Creswell
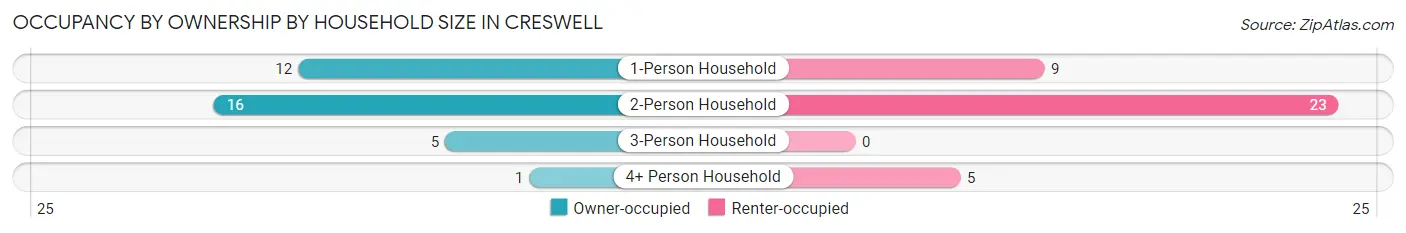
| Household Size | Owner-occupied | Renter-occupied |
| 1-Person Household | 12 (57.1%) | 9 (42.9%) |
| 2-Person Household | 16 (41.0%) | 23 (59.0%) |
| 3-Person Household | 5 (100.0%) | 0 (0.0%) |
| 4+ Person Household | 1 (16.7%) | 5 (83.3%) |
| Total Housing Units | 34 (47.9%) | 37 (52.1%) |
Occupancy by Educational Attainment in Creswell
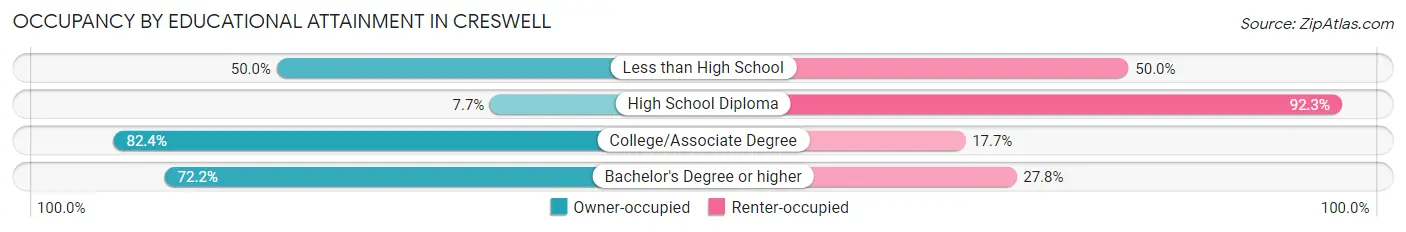
| Household Size | Owner-occupied | Renter-occupied |
| Less than High School | 5 (50.0%) | 5 (50.0%) |
| High School Diploma | 2 (7.7%) | 24 (92.3%) |
| College/Associate Degree | 14 (82.4%) | 3 (17.6%) |
| Bachelor's Degree or higher | 13 (72.2%) | 5 (27.8%) |
Occupancy by Age of Householder in Creswell
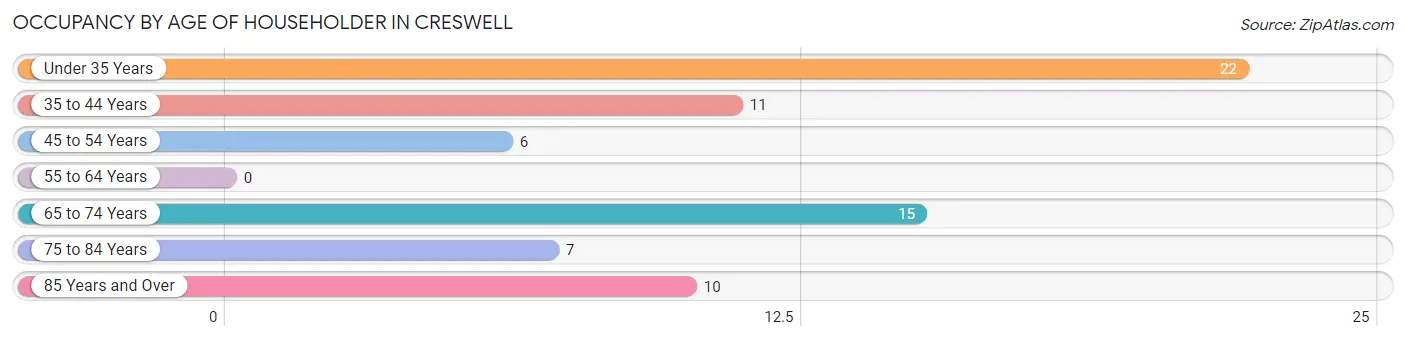
| Age Bracket | # Households | % Households |
| Under 35 Years | 22 | 31.0% |
| 35 to 44 Years | 11 | 15.5% |
| 45 to 54 Years | 6 | 8.5% |
| 55 to 64 Years | 0 | 0.0% |
| 65 to 74 Years | 15 | 21.1% |
| 75 to 84 Years | 7 | 9.9% |
| 85 Years and Over | 10 | 14.1% |
| Total | 71 | 100.0% |
Housing Finances in Creswell
Median Income by Occupancy in Creswell
| Occupancy Type | # Households | Median Income |
| Owner-Occupied | 34 (47.9%) | $0 |
| Renter-Occupied | 37 (52.1%) | $0 |
| Average | 71 (100.0%) | $0 |
Occupancy by Householder Income Bracket in Creswell
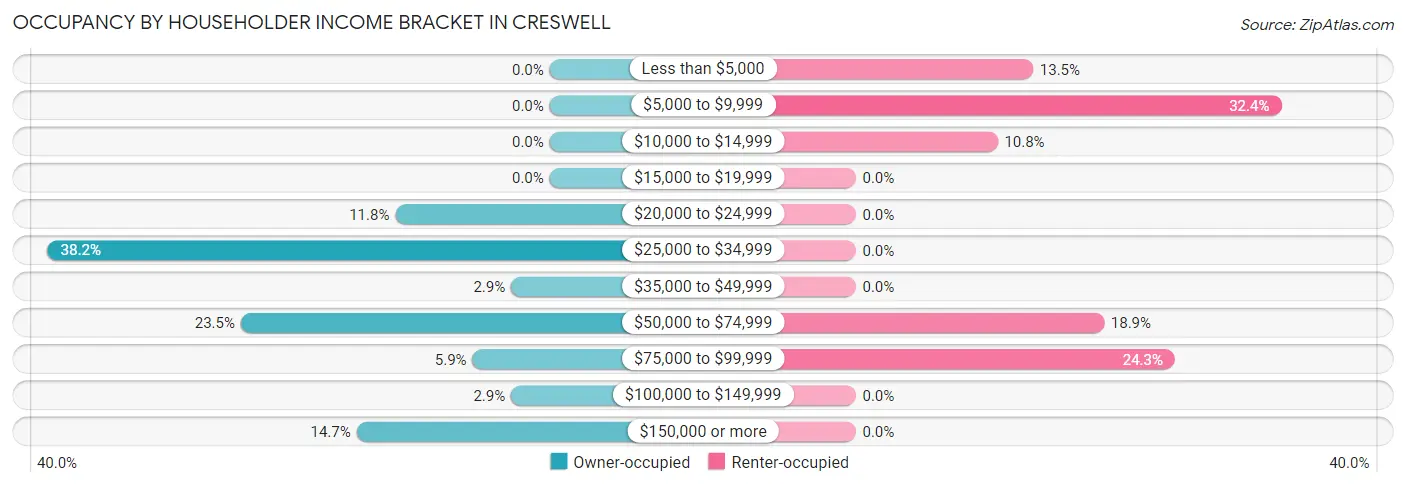
| Income Bracket | Owner-occupied | Renter-occupied |
| Less than $5,000 | 0 (0.0%) | 5 (13.5%) |
| $5,000 to $9,999 | 0 (0.0%) | 12 (32.4%) |
| $10,000 to $14,999 | 0 (0.0%) | 4 (10.8%) |
| $15,000 to $19,999 | 0 (0.0%) | 0 (0.0%) |
| $20,000 to $24,999 | 4 (11.8%) | 0 (0.0%) |
| $25,000 to $34,999 | 13 (38.2%) | 0 (0.0%) |
| $35,000 to $49,999 | 1 (2.9%) | 0 (0.0%) |
| $50,000 to $74,999 | 8 (23.5%) | 7 (18.9%) |
| $75,000 to $99,999 | 2 (5.9%) | 9 (24.3%) |
| $100,000 to $149,999 | 1 (2.9%) | 0 (0.0%) |
| $150,000 or more | 5 (14.7%) | 0 (0.0%) |
| Total | 34 (100.0%) | 37 (100.0%) |
Monthly Housing Cost Tiers in Creswell
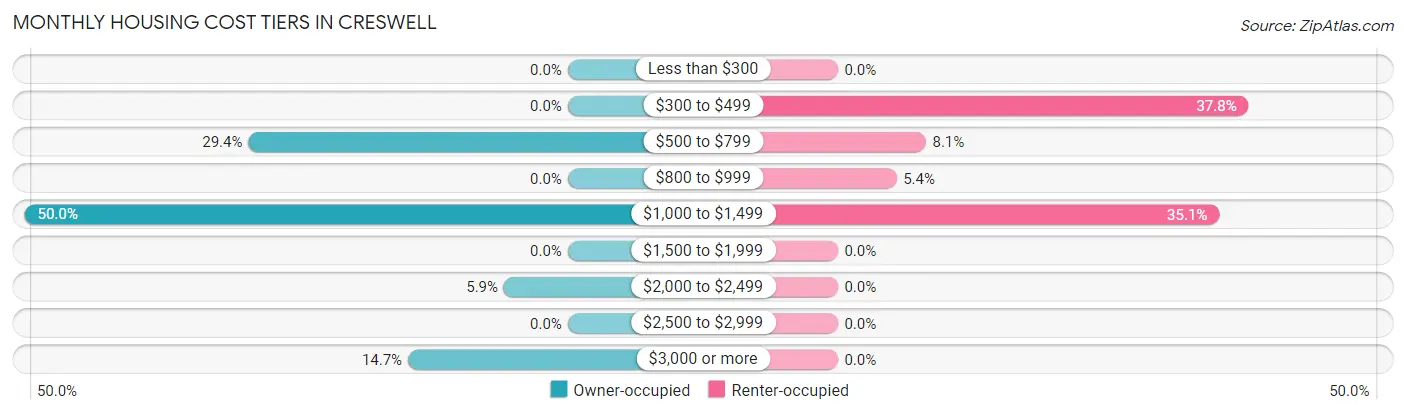
| Monthly Cost | Owner-occupied | Renter-occupied |
| Less than $300 | 0 (0.0%) | 0 (0.0%) |
| $300 to $499 | 0 (0.0%) | 14 (37.8%) |
| $500 to $799 | 10 (29.4%) | 3 (8.1%) |
| $800 to $999 | 0 (0.0%) | 2 (5.4%) |
| $1,000 to $1,499 | 17 (50.0%) | 13 (35.1%) |
| $1,500 to $1,999 | 0 (0.0%) | 0 (0.0%) |
| $2,000 to $2,499 | 2 (5.9%) | 0 (0.0%) |
| $2,500 to $2,999 | 0 (0.0%) | 0 (0.0%) |
| $3,000 or more | 5 (14.7%) | 0 (0.0%) |
| Total | 34 (100.0%) | 37 (100.0%) |
Physical Housing Characteristics in Creswell
Housing Structures in Creswell
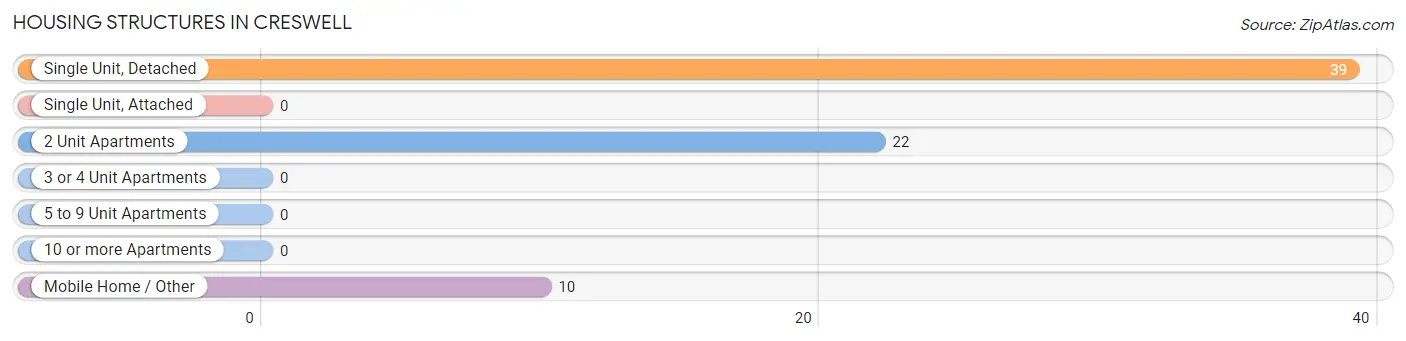
| Structure Type | # Housing Units | % Housing Units |
| Single Unit, Detached | 39 | 54.9% |
| Single Unit, Attached | 0 | 0.0% |
| 2 Unit Apartments | 22 | 31.0% |
| 3 or 4 Unit Apartments | 0 | 0.0% |
| 5 to 9 Unit Apartments | 0 | 0.0% |
| 10 or more Apartments | 0 | 0.0% |
| Mobile Home / Other | 10 | 14.1% |
| Total | 71 | 100.0% |
Housing Structures by Occupancy in Creswell
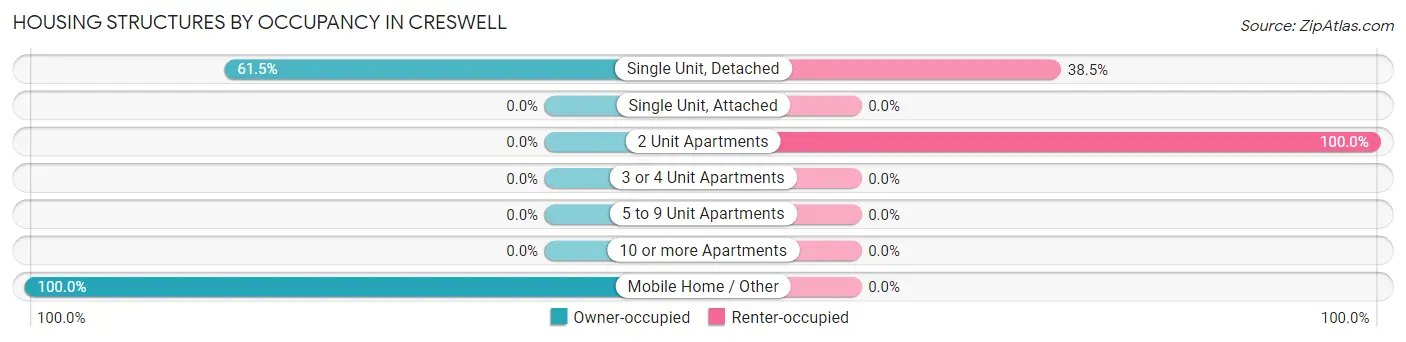
| Structure Type | Owner-occupied | Renter-occupied |
| Single Unit, Detached | 24 (61.5%) | 15 (38.5%) |
| Single Unit, Attached | 0 (0.0%) | 0 (0.0%) |
| 2 Unit Apartments | 0 (0.0%) | 22 (100.0%) |
| 3 or 4 Unit Apartments | 0 (0.0%) | 0 (0.0%) |
| 5 to 9 Unit Apartments | 0 (0.0%) | 0 (0.0%) |
| 10 or more Apartments | 0 (0.0%) | 0 (0.0%) |
| Mobile Home / Other | 10 (100.0%) | 0 (0.0%) |
| Total | 34 (47.9%) | 37 (52.1%) |
Housing Structures by Number of Rooms in Creswell
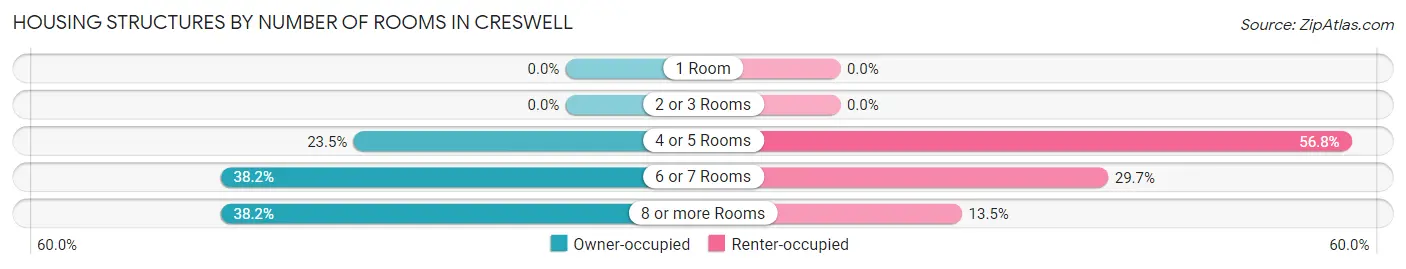
| Number of Rooms | Owner-occupied | Renter-occupied |
| 1 Room | 0 (0.0%) | 0 (0.0%) |
| 2 or 3 Rooms | 0 (0.0%) | 0 (0.0%) |
| 4 or 5 Rooms | 8 (23.5%) | 21 (56.8%) |
| 6 or 7 Rooms | 13 (38.2%) | 11 (29.7%) |
| 8 or more Rooms | 13 (38.2%) | 5 (13.5%) |
| Total | 34 (100.0%) | 37 (100.0%) |
Housing Structure by Heating Type in Creswell
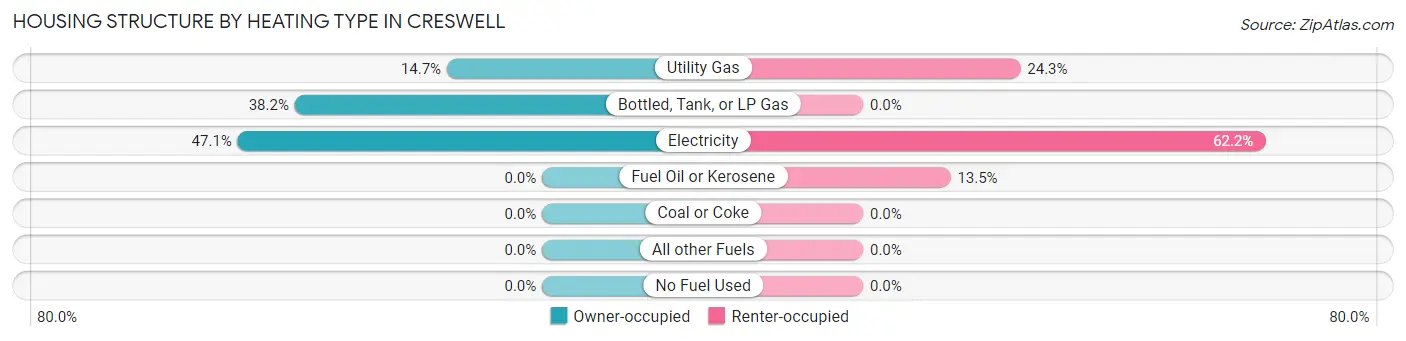
| Heating Type | Owner-occupied | Renter-occupied |
| Utility Gas | 5 (14.7%) | 9 (24.3%) |
| Bottled, Tank, or LP Gas | 13 (38.2%) | 0 (0.0%) |
| Electricity | 16 (47.1%) | 23 (62.2%) |
| Fuel Oil or Kerosene | 0 (0.0%) | 5 (13.5%) |
| Coal or Coke | 0 (0.0%) | 0 (0.0%) |
| All other Fuels | 0 (0.0%) | 0 (0.0%) |
| No Fuel Used | 0 (0.0%) | 0 (0.0%) |
| Total | 34 (100.0%) | 37 (100.0%) |
Household Vehicle Usage in Creswell
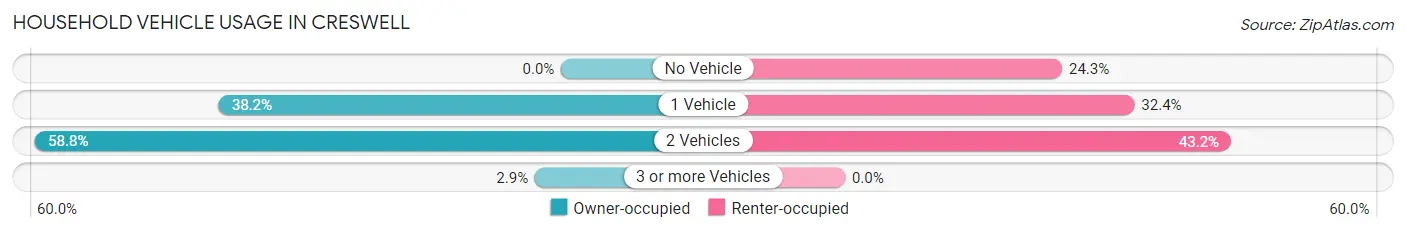
| Vehicles per Household | Owner-occupied | Renter-occupied |
| No Vehicle | 0 (0.0%) | 9 (24.3%) |
| 1 Vehicle | 13 (38.2%) | 12 (32.4%) |
| 2 Vehicles | 20 (58.8%) | 16 (43.2%) |
| 3 or more Vehicles | 1 (2.9%) | 0 (0.0%) |
| Total | 34 (100.0%) | 37 (100.0%) |
Real Estate & Mortgages in Creswell
Real Estate and Mortgage Overview in Creswell
| Characteristic | Without Mortgage | With Mortgage |
| Housing Units | 19 | 15 |
| Median Property Value | $140,300 | $102,100 |
| Median Household Income | - | - |
| Monthly Housing Costs | - | - |
| Real Estate Taxes | $1,396 | $0 |
Property Value by Mortgage Status in Creswell
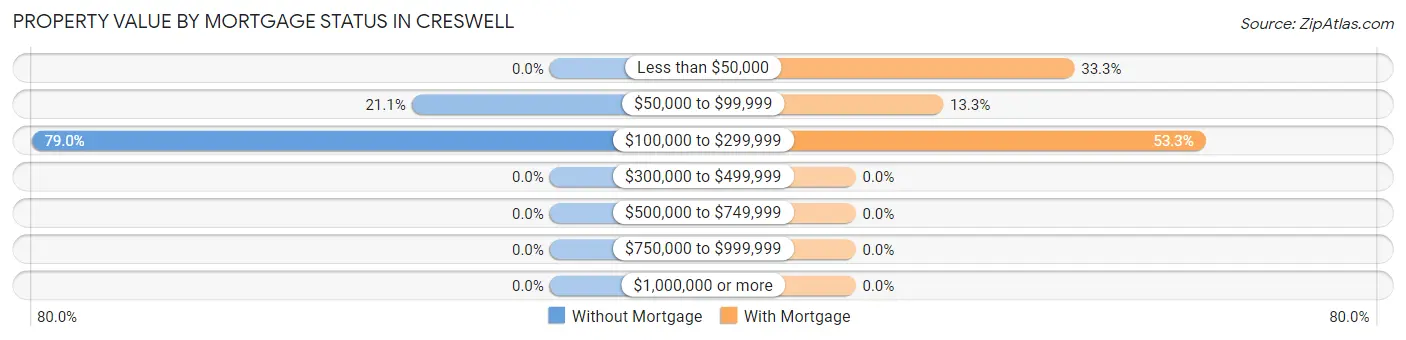
| Property Value | Without Mortgage | With Mortgage |
| Less than $50,000 | 0 (0.0%) | 5 (33.3%) |
| $50,000 to $99,999 | 4 (21.0%) | 2 (13.3%) |
| $100,000 to $299,999 | 15 (78.9%) | 8 (53.3%) |
| $300,000 to $499,999 | 0 (0.0%) | 0 (0.0%) |
| $500,000 to $749,999 | 0 (0.0%) | 0 (0.0%) |
| $750,000 to $999,999 | 0 (0.0%) | 0 (0.0%) |
| $1,000,000 or more | 0 (0.0%) | 0 (0.0%) |
| Total | 19 (100.0%) | 15 (100.0%) |
Household Income by Mortgage Status in Creswell
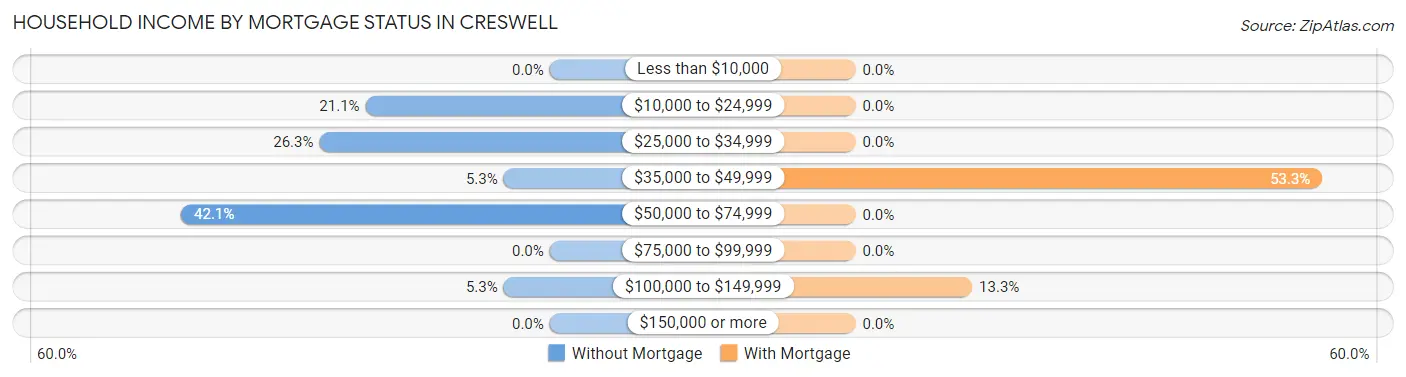
| Household Income | Without Mortgage | With Mortgage |
| Less than $10,000 | 0 (0.0%) | 0 (0.0%) |
| $10,000 to $24,999 | 4 (21.0%) | 0 (0.0%) |
| $25,000 to $34,999 | 5 (26.3%) | 0 (0.0%) |
| $35,000 to $49,999 | 1 (5.3%) | 8 (53.3%) |
| $50,000 to $74,999 | 8 (42.1%) | 0 (0.0%) |
| $75,000 to $99,999 | 0 (0.0%) | 0 (0.0%) |
| $100,000 to $149,999 | 1 (5.3%) | 2 (13.3%) |
| $150,000 or more | 0 (0.0%) | 0 (0.0%) |
| Total | 19 (100.0%) | 15 (100.0%) |
Property Value to Household Income Ratio in Creswell
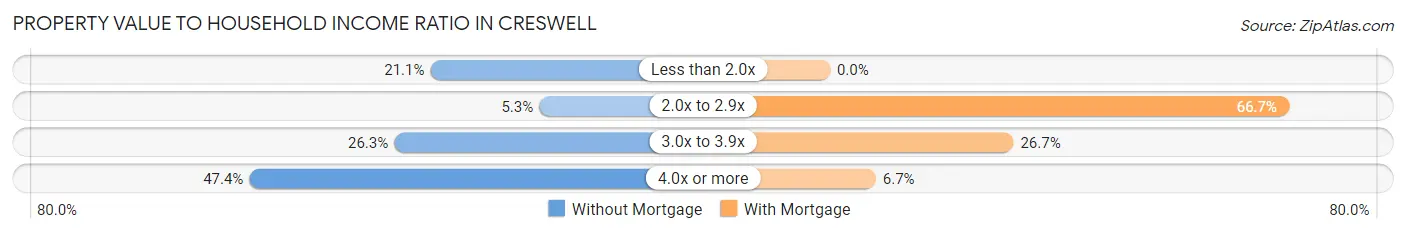
| Value-to-Income Ratio | Without Mortgage | With Mortgage |
| Less than 2.0x | 4 (21.0%) | 0 (0.0%) |
| 2.0x to 2.9x | 1 (5.3%) | 10 (66.7%) |
| 3.0x to 3.9x | 5 (26.3%) | 4 (26.7%) |
| 4.0x or more | 9 (47.4%) | 1 (6.7%) |
| Total | 19 (100.0%) | 15 (100.0%) |
Real Estate Taxes by Mortgage Status in Creswell
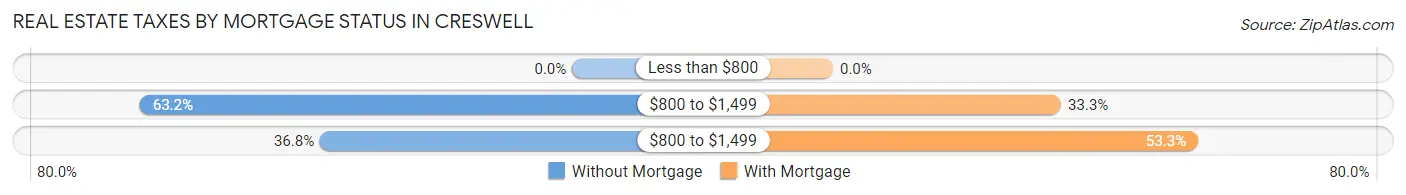
| Property Taxes | Without Mortgage | With Mortgage |
| Less than $800 | 0 (0.0%) | 0 (0.0%) |
| $800 to $1,499 | 12 (63.2%) | 5 (33.3%) |
| $800 to $1,499 | 7 (36.8%) | 8 (53.3%) |
| Total | 19 (100.0%) | 15 (100.0%) |
Health & Disability in Creswell
Health Insurance Coverage by Age in Creswell
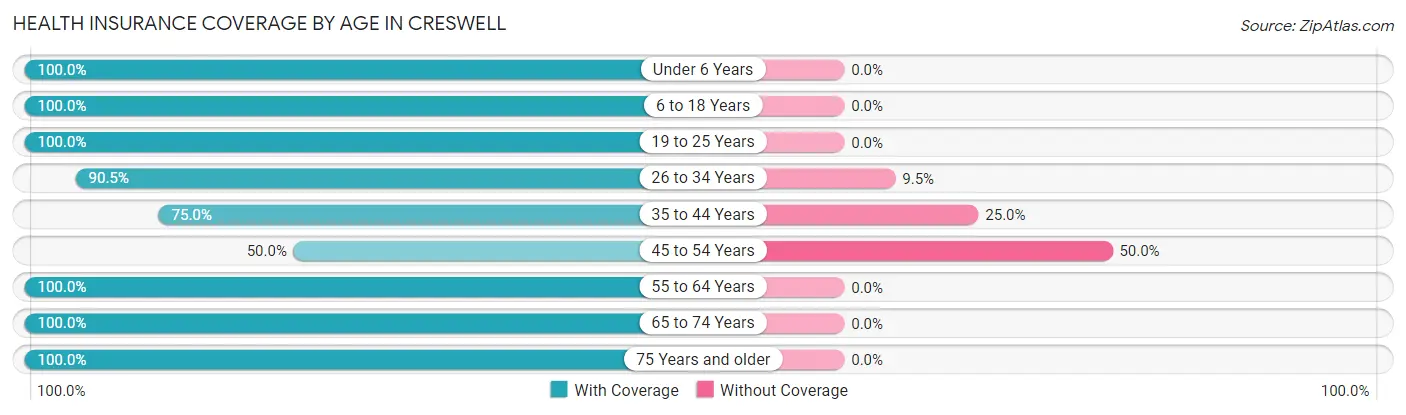
| Age Bracket | With Coverage | Without Coverage |
| Under 6 Years | 21 (100.0%) | 0 (0.0%) |
| 6 to 18 Years | 7 (100.0%) | 0 (0.0%) |
| 19 to 25 Years | 22 (100.0%) | 0 (0.0%) |
| 26 to 34 Years | 19 (90.5%) | 2 (9.5%) |
| 35 to 44 Years | 12 (75.0%) | 4 (25.0%) |
| 45 to 54 Years | 7 (50.0%) | 7 (50.0%) |
| 55 to 64 Years | 6 (100.0%) | 0 (0.0%) |
| 65 to 74 Years | 21 (100.0%) | 0 (0.0%) |
| 75 Years and older | 24 (100.0%) | 0 (0.0%) |
| Total | 139 (91.4%) | 13 (8.6%) |
Health Insurance Coverage by Citizenship Status in Creswell
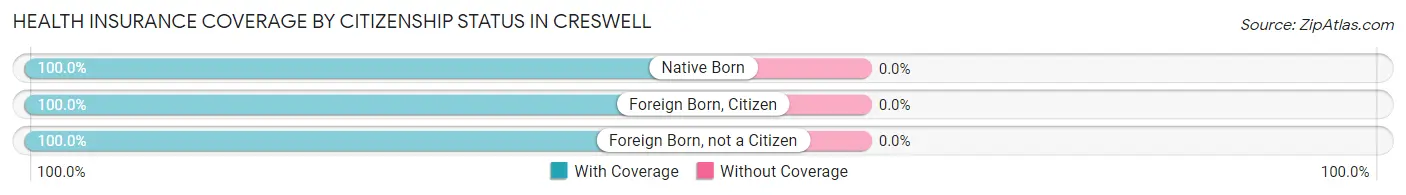
| Citizenship Status | With Coverage | Without Coverage |
| Native Born | 21 (100.0%) | 0 (0.0%) |
| Foreign Born, Citizen | 7 (100.0%) | 0 (0.0%) |
| Foreign Born, not a Citizen | 22 (100.0%) | 0 (0.0%) |
Health Insurance Coverage by Household Income in Creswell
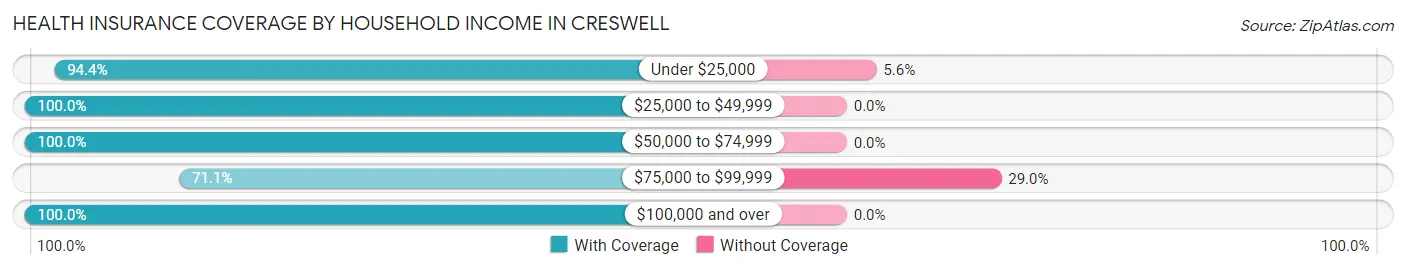
| Household Income | With Coverage | Without Coverage |
| Under $25,000 | 34 (94.4%) | 2 (5.6%) |
| $25,000 to $49,999 | 20 (100.0%) | 0 (0.0%) |
| $50,000 to $74,999 | 46 (100.0%) | 0 (0.0%) |
| $75,000 to $99,999 | 27 (71.1%) | 11 (28.9%) |
| $100,000 and over | 12 (100.0%) | 0 (0.0%) |
Public vs Private Health Insurance Coverage by Age in Creswell
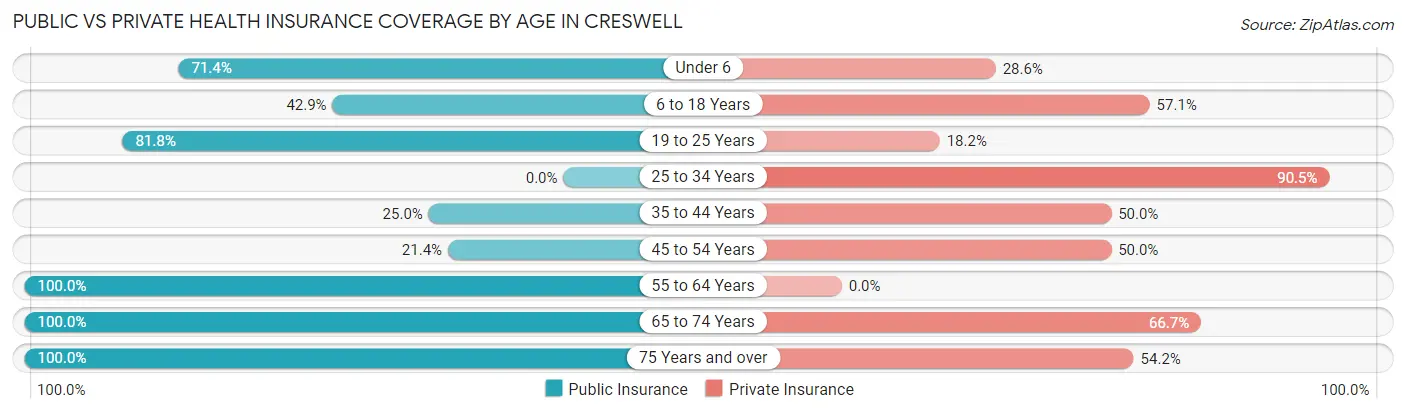
| Age Bracket | Public Insurance | Private Insurance |
| Under 6 | 15 (71.4%) | 6 (28.6%) |
| 6 to 18 Years | 3 (42.9%) | 4 (57.1%) |
| 19 to 25 Years | 18 (81.8%) | 4 (18.2%) |
| 25 to 34 Years | 0 (0.0%) | 19 (90.5%) |
| 35 to 44 Years | 4 (25.0%) | 8 (50.0%) |
| 45 to 54 Years | 3 (21.4%) | 7 (50.0%) |
| 55 to 64 Years | 6 (100.0%) | 0 (0.0%) |
| 65 to 74 Years | 21 (100.0%) | 14 (66.7%) |
| 75 Years and over | 24 (100.0%) | 13 (54.2%) |
| Total | 94 (61.8%) | 75 (49.3%) |
Disability Status by Sex by Age in Creswell
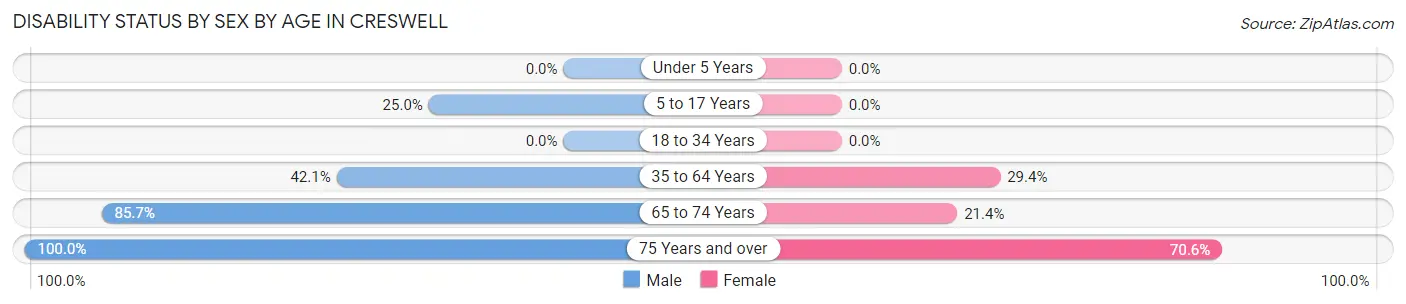
| Age Bracket | Male | Female |
| Under 5 Years | 0 (0.0%) | 0 (0.0%) |
| 5 to 17 Years | 2 (25.0%) | 0 (0.0%) |
| 18 to 34 Years | 0 (0.0%) | 0 (0.0%) |
| 35 to 64 Years | 8 (42.1%) | 5 (29.4%) |
| 65 to 74 Years | 6 (85.7%) | 3 (21.4%) |
| 75 Years and over | 7 (100.0%) | 12 (70.6%) |
Disability Class by Sex by Age in Creswell
Disability Class: Hearing Difficulty
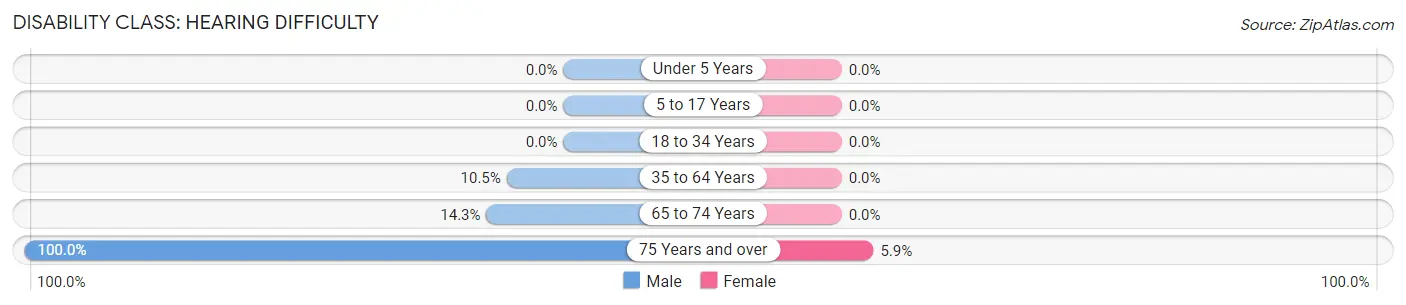
| Age Bracket | Male | Female |
| Under 5 Years | 0 (0.0%) | 0 (0.0%) |
| 5 to 17 Years | 0 (0.0%) | 0 (0.0%) |
| 18 to 34 Years | 0 (0.0%) | 0 (0.0%) |
| 35 to 64 Years | 2 (10.5%) | 0 (0.0%) |
| 65 to 74 Years | 1 (14.3%) | 0 (0.0%) |
| 75 Years and over | 7 (100.0%) | 1 (5.9%) |
Disability Class: Vision Difficulty
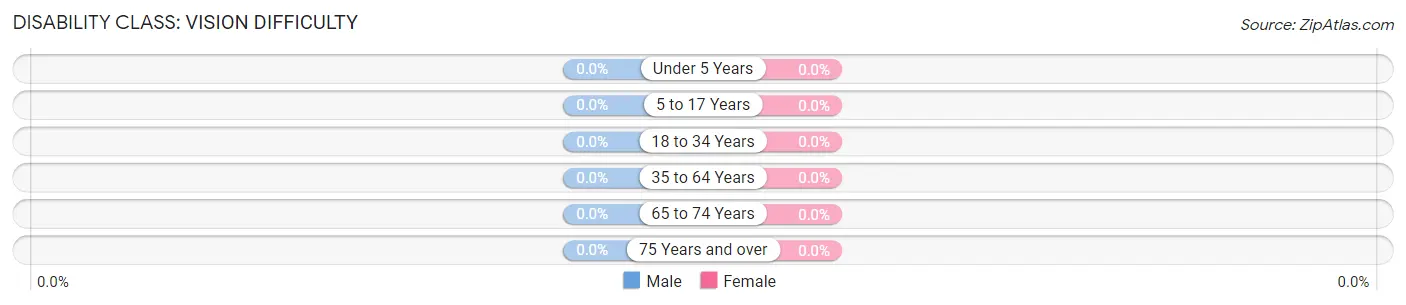
| Age Bracket | Male | Female |
| Under 5 Years | 0 (0.0%) | 0 (0.0%) |
| 5 to 17 Years | 0 (0.0%) | 0 (0.0%) |
| 18 to 34 Years | 0 (0.0%) | 0 (0.0%) |
| 35 to 64 Years | 0 (0.0%) | 0 (0.0%) |
| 65 to 74 Years | 0 (0.0%) | 0 (0.0%) |
| 75 Years and over | 0 (0.0%) | 0 (0.0%) |
Disability Class: Cognitive Difficulty
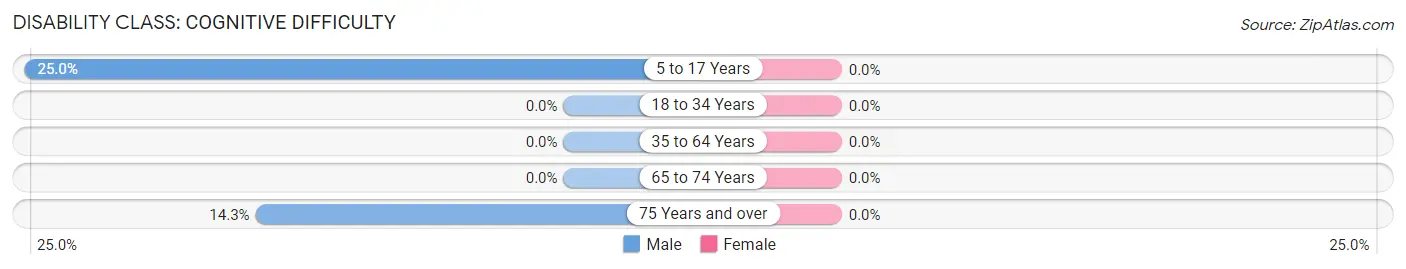
| Age Bracket | Male | Female |
| 5 to 17 Years | 2 (25.0%) | 0 (0.0%) |
| 18 to 34 Years | 0 (0.0%) | 0 (0.0%) |
| 35 to 64 Years | 0 (0.0%) | 0 (0.0%) |
| 65 to 74 Years | 0 (0.0%) | 0 (0.0%) |
| 75 Years and over | 1 (14.3%) | 0 (0.0%) |
Disability Class: Ambulatory Difficulty
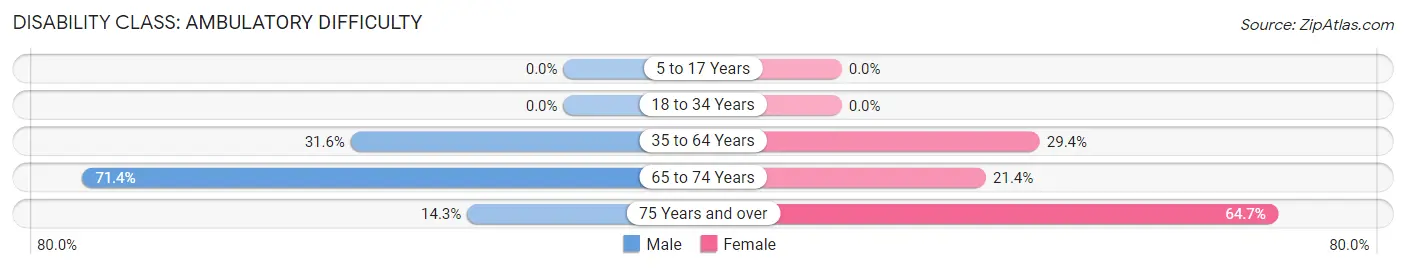
| Age Bracket | Male | Female |
| 5 to 17 Years | 0 (0.0%) | 0 (0.0%) |
| 18 to 34 Years | 0 (0.0%) | 0 (0.0%) |
| 35 to 64 Years | 6 (31.6%) | 5 (29.4%) |
| 65 to 74 Years | 5 (71.4%) | 3 (21.4%) |
| 75 Years and over | 1 (14.3%) | 11 (64.7%) |
Disability Class: Self-Care Difficulty
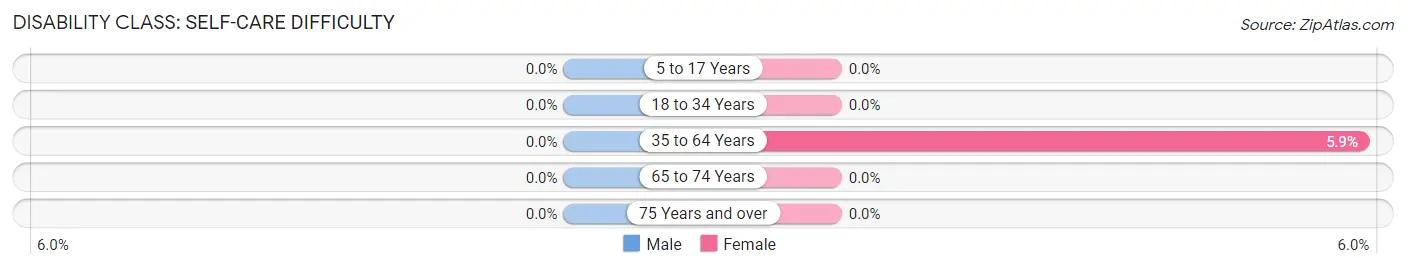
| Age Bracket | Male | Female |
| 5 to 17 Years | 0 (0.0%) | 0 (0.0%) |
| 18 to 34 Years | 0 (0.0%) | 0 (0.0%) |
| 35 to 64 Years | 0 (0.0%) | 1 (5.9%) |
| 65 to 74 Years | 0 (0.0%) | 0 (0.0%) |
| 75 Years and over | 0 (0.0%) | 0 (0.0%) |
Technology Access in Creswell
Computing Device Access in Creswell
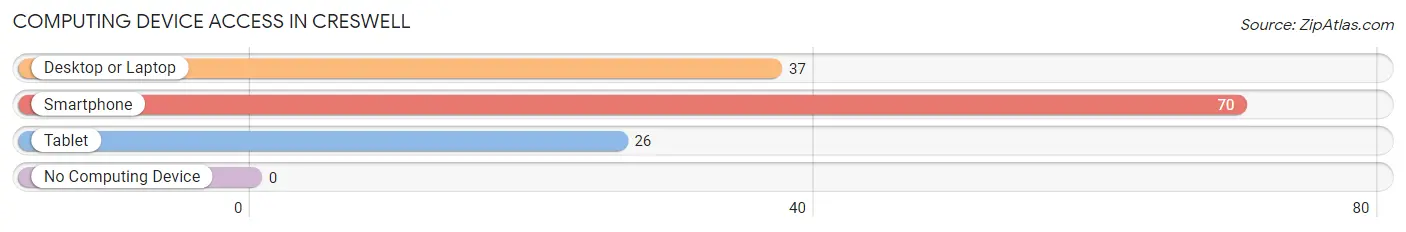
| Device Type | # Households | % Households |
| Desktop or Laptop | 37 | 52.1% |
| Smartphone | 70 | 98.6% |
| Tablet | 26 | 36.6% |
| No Computing Device | 0 | 0.0% |
| Total | 71 | 100.0% |
Internet Access in Creswell
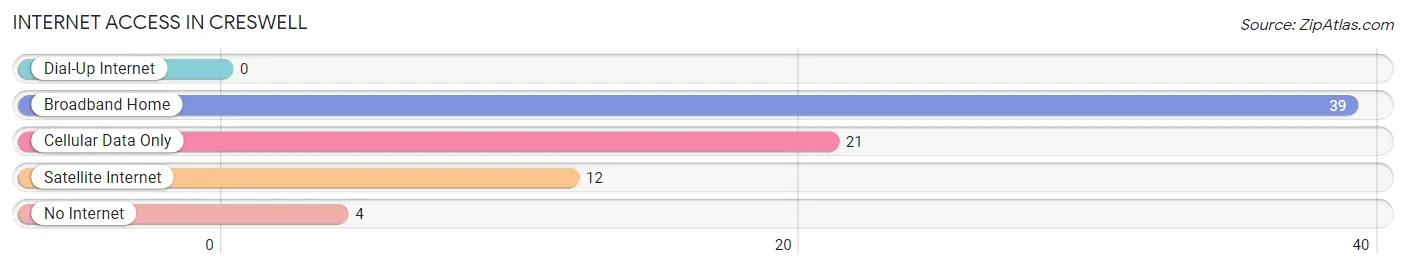
| Internet Type | # Households | % Households |
| Dial-Up Internet | 0 | 0.0% |
| Broadband Home | 39 | 54.9% |
| Cellular Data Only | 21 | 29.6% |
| Satellite Internet | 12 | 16.9% |
| No Internet | 4 | 5.6% |
| Total | 71 | 100.0% |
Creswell Summary
Creswell is a small town located in Washington County, North Carolina. It is situated on the Albemarle Sound, which is part of the Atlantic Intracoastal Waterway. The town has a population of 1,845 people, according to the 2010 census.
Geography
Creswell is located in the northeastern corner of Washington County, North Carolina. It is situated on the Albemarle Sound, which is part of the Atlantic Intracoastal Waterway. The town is bordered by the towns of Plymouth and Columbia to the north, and by the towns of Belhaven and Pantego to the south. The town is located approximately 30 miles from the city of Greenville, North Carolina.
The town is situated on a flat coastal plain, with an elevation of approximately 10 feet above sea level. The climate is humid subtropical, with hot, humid summers and mild winters. The average annual temperature is around 70 degrees Fahrenheit.
History
Creswell was founded in 1790 by William Creswell, a planter from Virginia. The town was originally known as Creswell’s Landing, and was a port of entry for ships coming from the Caribbean. The town was incorporated in 1891, and the name was changed to Creswell.
The town was a major center of the lumber industry in the late 19th and early 20th centuries. The lumber industry was the main source of employment for the town’s residents. The town also had a thriving fishing industry, and was home to several seafood processing plants.
In the late 20th century, the town’s economy shifted away from the lumber and fishing industries, and towards tourism and recreation. The town is now home to several marinas, boat ramps, and other recreational facilities.
Economy
The economy of Creswell is largely based on tourism and recreation. The town is home to several marinas, boat ramps, and other recreational facilities. The town is also home to several seafood processing plants, which provide employment for many of the town’s residents.
The town is also home to several small businesses, including restaurants, retail stores, and other services. The town is also home to several manufacturing plants, which provide employment for many of the town’s residents.
Demographics
According to the 2010 census, the population of Creswell was 1,845 people. The racial makeup of the town was 79.3% White, 17.2% African American, 0.7% Native American, 0.3% Asian, 0.1% Pacific Islander, and 2.4% from other races. The median household income was $30,938, and the median family income was $37,813.
Conclusion
Creswell is a small town located in Washington County, North Carolina. It is situated on the Albemarle Sound, which is part of the Atlantic Intracoastal Waterway. The town has a population of 1,845 people, according to the 2010 census. The town’s economy is largely based on tourism and recreation, and the town is home to several marinas, boat ramps, and other recreational facilities. The town is also home to several small businesses, including restaurants, retail stores, and other services. The racial makeup of the town is 79.3% White, 17.2% African American, 0.7% Native American, 0.3% Asian, 0.1% Pacific Islander, and 2.4% from other races. The median household income was $30,938, and the median family income was $37,813.
Common Questions
What is Per Capita Income in Creswell?
Per Capita income in Creswell is $24,973.
What is the Median Family Income in Creswell?
Median Family Income in Creswell is $46,750.
What is Inequality or Gini Index in Creswell?
Inequality or Gini Index in Creswell is 0.48.
What is the Total Population of Creswell?
Total Population of Creswell is 152.
What is the Total Male Population of Creswell?
Total Male Population of Creswell is 63.
What is the Total Female Population of Creswell?
Total Female Population of Creswell is 89.
What is the Ratio of Males per 100 Females in Creswell?
There are 70.79 Males per 100 Females in Creswell.
What is the Ratio of Females per 100 Males in Creswell?
There are 141.27 Females per 100 Males in Creswell.
What is the Median Population Age in Creswell?
Median Population Age in Creswell is 40.2 Years.
What is the Average Family Size in Creswell
Average Family Size in Creswell is 2.5 People.
What is the Average Household Size in Creswell
Average Household Size in Creswell is 2.1 People.
How Large is the Labor Force in Creswell?
There are 62 People in the Labor Forcein in Creswell.
What is the Percentage of People in the Labor Force in Creswell?
50.0% of People are in the Labor Force in Creswell.