La Mesilla, NM Map & Demographics
La Mesilla Map
La Mesilla Overview
$34,781
PER CAPITA INCOME
$76,429
AVG FAMILY INCOME
$71,473
AVG HOUSEHOLD INCOME
5.3%
WAGE / INCOME GAP [ % ]
94.7¢/ $1
WAGE / INCOME GAP [ $ ]
0.45
INEQUALITY / GINI INDEX
2,456
TOTAL POPULATION
1,437
MALE POPULATION
1,019
FEMALE POPULATION
141.02
MALES / 100 FEMALES
70.91
FEMALES / 100 MALES
41.4
MEDIAN AGE
3.7
AVG FAMILY SIZE
2.9
AVG HOUSEHOLD SIZE
1,054
LABOR FORCE [ PEOPLE ]
56.0%
PERCENT IN LABOR FORCE
2.7%
UNEMPLOYMENT RATE
Income in La Mesilla
Income Overview in La Mesilla
Per Capita Income in La Mesilla is $34,781, while median incomes of families and households are $76,429 and $71,473 respectively.
| Characteristic | Number | Measure |
| Per Capita Income | 2,456 | $34,781 |
| Median Family Income | 552 | $76,429 |
| Mean Family Income | 552 | $110,064 |
| Median Household Income | 852 | $71,473 |
| Mean Household Income | 852 | $91,655 |
| Income Deficit | 552 | $0 |
| Wage / Income Gap (%) | 2,456 | 5.28% |
| Wage / Income Gap ($) | 2,456 | 94.72¢ per $1 |
| Gini / Inequality Index | 2,456 | 0.45 |
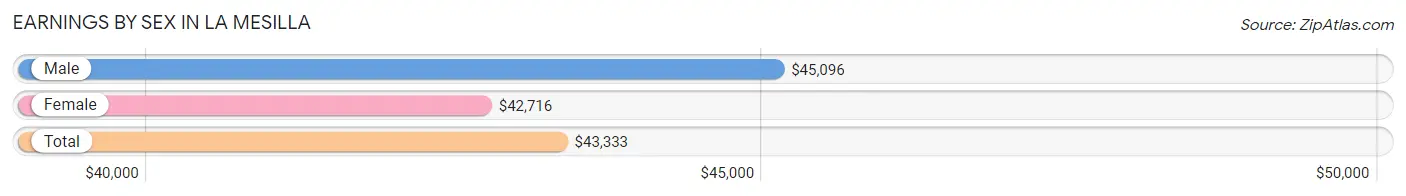
Earnings by Sex in La Mesilla
Average Earnings in La Mesilla are $43,333, $45,096 for men and $42,716 for women, a difference of 5.3%.
| Sex | Number | Average Earnings |
| Male | 679 (59.9%) | $45,096 |
| Female | 455 (40.1%) | $42,716 |
| Total | 1,134 (100.0%) | $43,333 |
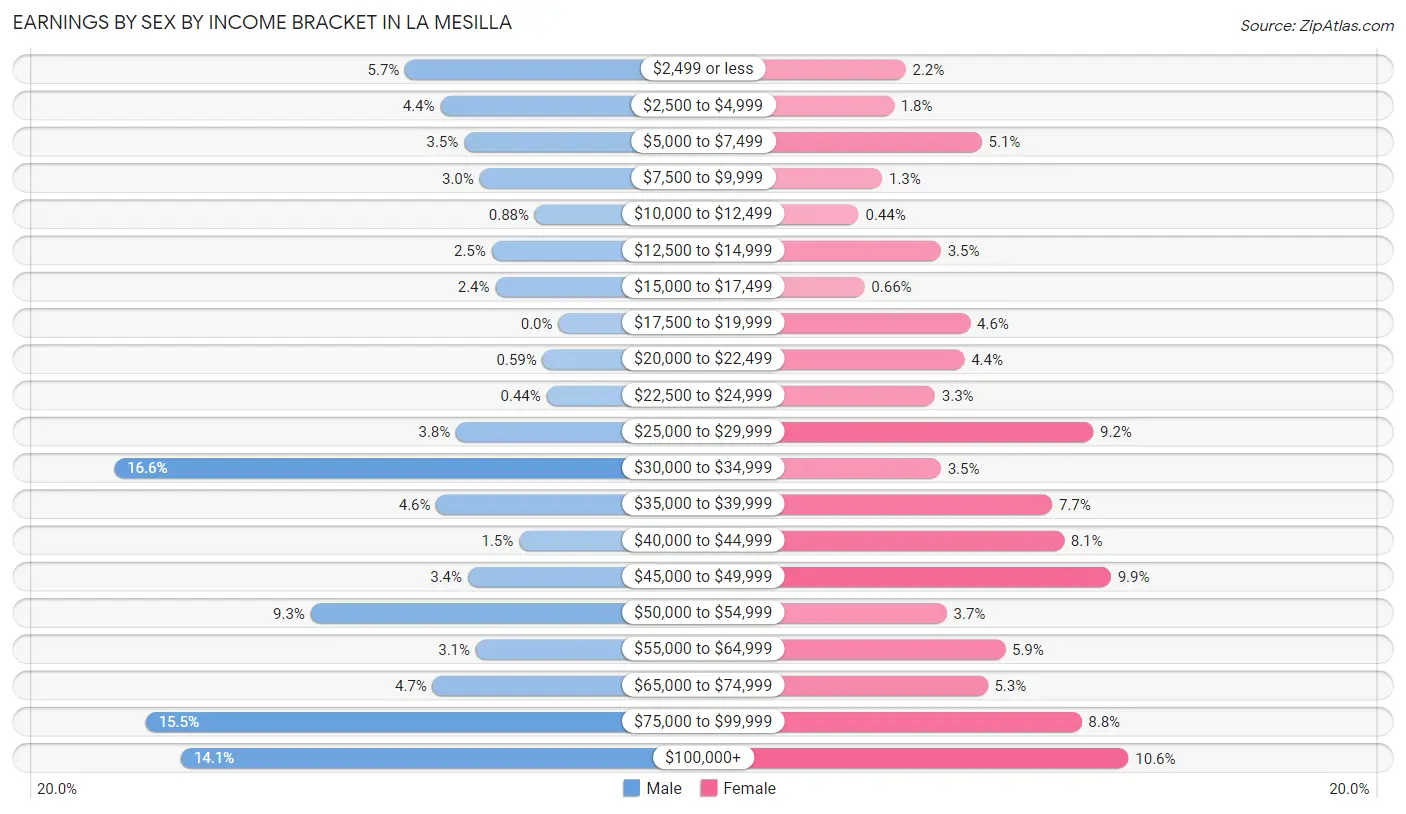
Earnings by Sex by Income Bracket in La Mesilla
The most common earnings brackets in La Mesilla are $30,000 to $34,999 for men (113 | 16.6%) and $100,000+ for women (48 | 10.5%).
| Income | Male | Female |
| $2,499 or less | 39 (5.7%) | 10 (2.2%) |
| $2,500 to $4,999 | 30 (4.4%) | 8 (1.8%) |
| $5,000 to $7,499 | 24 (3.5%) | 23 (5.1%) |
| $7,500 to $9,999 | 20 (2.9%) | 6 (1.3%) |
| $10,000 to $12,499 | 6 (0.9%) | 2 (0.4%) |
| $12,500 to $14,999 | 17 (2.5%) | 16 (3.5%) |
| $15,000 to $17,499 | 16 (2.4%) | 3 (0.7%) |
| $17,500 to $19,999 | 0 (0.0%) | 21 (4.6%) |
| $20,000 to $22,499 | 4 (0.6%) | 20 (4.4%) |
| $22,500 to $24,999 | 3 (0.4%) | 15 (3.3%) |
| $25,000 to $29,999 | 26 (3.8%) | 42 (9.2%) |
| $30,000 to $34,999 | 113 (16.6%) | 16 (3.5%) |
| $35,000 to $39,999 | 31 (4.6%) | 35 (7.7%) |
| $40,000 to $44,999 | 10 (1.5%) | 37 (8.1%) |
| $45,000 to $49,999 | 23 (3.4%) | 45 (9.9%) |
| $50,000 to $54,999 | 63 (9.3%) | 17 (3.7%) |
| $55,000 to $64,999 | 21 (3.1%) | 27 (5.9%) |
| $65,000 to $74,999 | 32 (4.7%) | 24 (5.3%) |
| $75,000 to $99,999 | 105 (15.5%) | 40 (8.8%) |
| $100,000+ | 96 (14.1%) | 48 (10.5%) |
| Total | 679 (100.0%) | 455 (100.0%) |
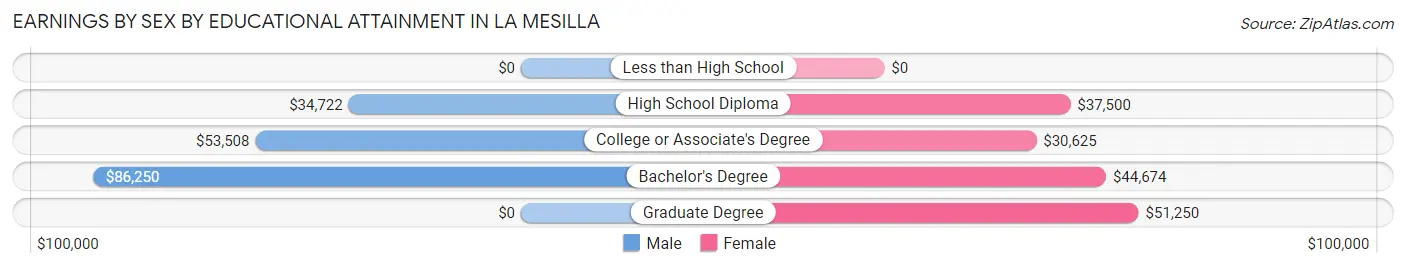
Earnings by Sex by Educational Attainment in La Mesilla
Average earnings in La Mesilla are $52,125 for men and $43,621 for women, a difference of 16.3%. Men with an educational attainment of bachelor's degree enjoy the highest average annual earnings of $86,250, while those with high school diploma education earn the least with $34,722. Women with an educational attainment of graduate degree earn the most with the average annual earnings of $51,250, while those with college or associate's degree education have the smallest earnings of $30,625.
| Educational Attainment | Male Income | Female Income |
| Less than High School | - | - |
| High School Diploma | $34,722 | $37,500 |
| College or Associate's Degree | $53,508 | $30,625 |
| Bachelor's Degree | $86,250 | $44,674 |
| Graduate Degree | - | - |
| Total | $52,125 | $43,621 |
Family Income in La Mesilla
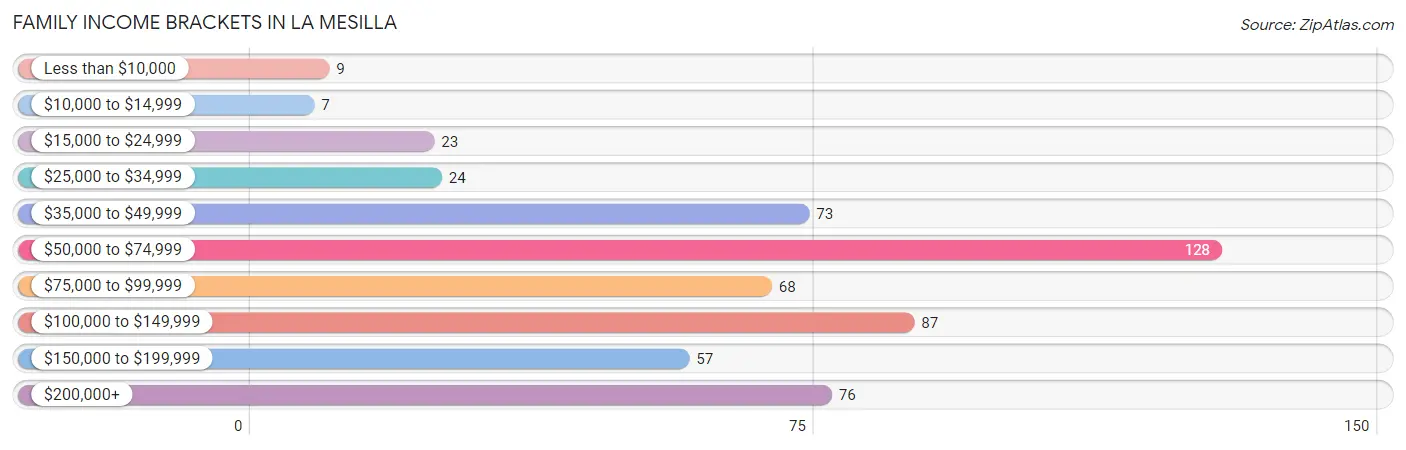
Family Income Brackets in La Mesilla
According to the La Mesilla family income data, there are 128 families falling into the $50,000 to $74,999 income range, which is the most common income bracket and makes up 23.2% of all families. Conversely, the $10,000 to $14,999 income bracket is the least frequent group with only 7 families (1.3%) belonging to this category.
| Income Bracket | # Families | % Families |
| Less than $10,000 | 9 | 1.6% |
| $10,000 to $14,999 | 7 | 1.3% |
| $15,000 to $24,999 | 23 | 4.2% |
| $25,000 to $34,999 | 24 | 4.3% |
| $35,000 to $49,999 | 73 | 13.2% |
| $50,000 to $74,999 | 128 | 23.2% |
| $75,000 to $99,999 | 68 | 12.3% |
| $100,000 to $149,999 | 87 | 15.8% |
| $150,000 to $199,999 | 57 | 10.3% |
| $200,000+ | 76 | 13.8% |
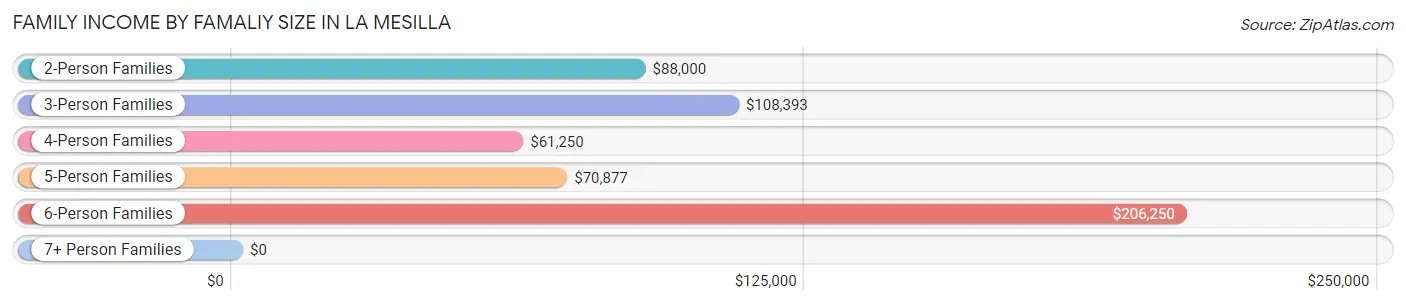
Family Income by Famaliy Size in La Mesilla
6-person families (12 | 2.2%) account for the highest median family income in La Mesilla with $206,250 per family, while 2-person families (308 | 55.8%) have the highest median income of $44,000 per family member.
| Income Bracket | # Families | Median Income |
| 2-Person Families | 308 (55.8%) | $88,000 |
| 3-Person Families | 71 (12.9%) | $108,393 |
| 4-Person Families | 71 (12.9%) | $61,250 |
| 5-Person Families | 90 (16.3%) | $70,877 |
| 6-Person Families | 12 (2.2%) | $206,250 |
| 7+ Person Families | 0 (0.0%) | $0 |
| Total | 552 (100.0%) | $76,429 |
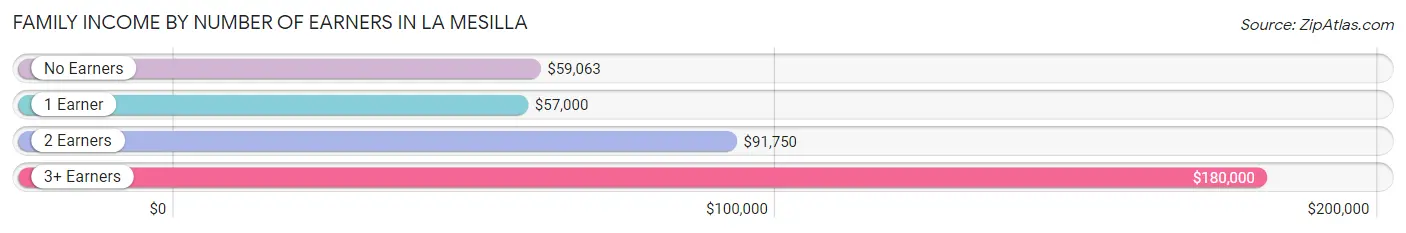
Family Income by Number of Earners in La Mesilla
The median family income in La Mesilla is $76,429, with families comprising 3+ earners (44) having the highest median family income of $180,000, while families with 1 earner (206) have the lowest median family income of $57,000, accounting for 8.0% and 37.3% of families, respectively.
| Number of Earners | # Families | Median Income |
| No Earners | 87 (15.8%) | $59,063 |
| 1 Earner | 206 (37.3%) | $57,000 |
| 2 Earners | 215 (39.0%) | $91,750 |
| 3+ Earners | 44 (8.0%) | $180,000 |
| Total | 552 (100.0%) | $76,429 |
Household Income in La Mesilla
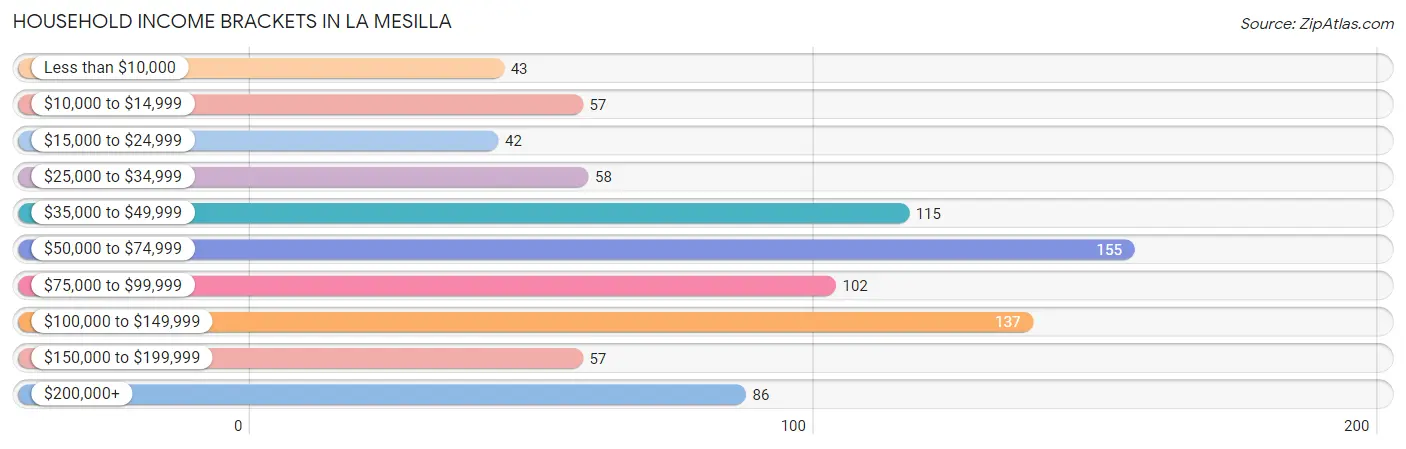
Household Income Brackets in La Mesilla
With 155 households falling in the category, the $50,000 to $74,999 income range is the most frequent in La Mesilla, accounting for 18.2% of all households. In contrast, only 42 households (4.9%) fall into the $15,000 to $24,999 income bracket, making it the least populous group.
| Income Bracket | # Households | % Households |
| Less than $10,000 | 43 | 5.0% |
| $10,000 to $14,999 | 57 | 6.7% |
| $15,000 to $24,999 | 42 | 4.9% |
| $25,000 to $34,999 | 58 | 6.8% |
| $35,000 to $49,999 | 115 | 13.5% |
| $50,000 to $74,999 | 155 | 18.2% |
| $75,000 to $99,999 | 102 | 12.0% |
| $100,000 to $149,999 | 137 | 16.1% |
| $150,000 to $199,999 | 57 | 6.7% |
| $200,000+ | 86 | 10.1% |
Household Income by Householder Age in La Mesilla
The median household income in La Mesilla is $71,473, with the highest median household income of $90,833 found in the 45 to 64 years age bracket for the primary householder. A total of 342 households (40.1%) fall into this category. Meanwhile, the 25 to 44 years age bracket for the primary householder has the lowest median household income of $61,000, with 238 households (27.9%) in this group.
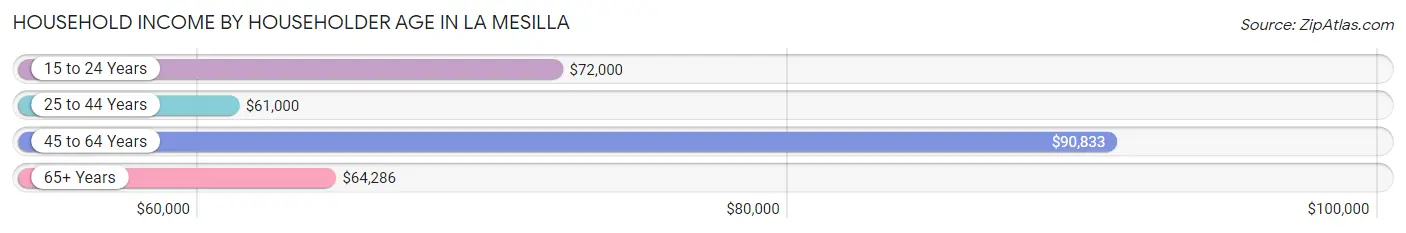
| Income Bracket | # Households | Median Income |
| 15 to 24 Years | 18 (2.1%) | $72,000 |
| 25 to 44 Years | 238 (27.9%) | $61,000 |
| 45 to 64 Years | 342 (40.1%) | $90,833 |
| 65+ Years | 254 (29.8%) | $64,286 |
| Total | 852 (100.0%) | $71,473 |
Poverty in La Mesilla
Income Below Poverty by Sex and Age in La Mesilla
With 10.7% poverty level for males and 13.9% for females among the residents of La Mesilla, under 5 year old males and 75 year old and over females are the most vulnerable to poverty, with 32 males (45.1%) and 23 females (22.3%) in their respective age groups living below the poverty level.
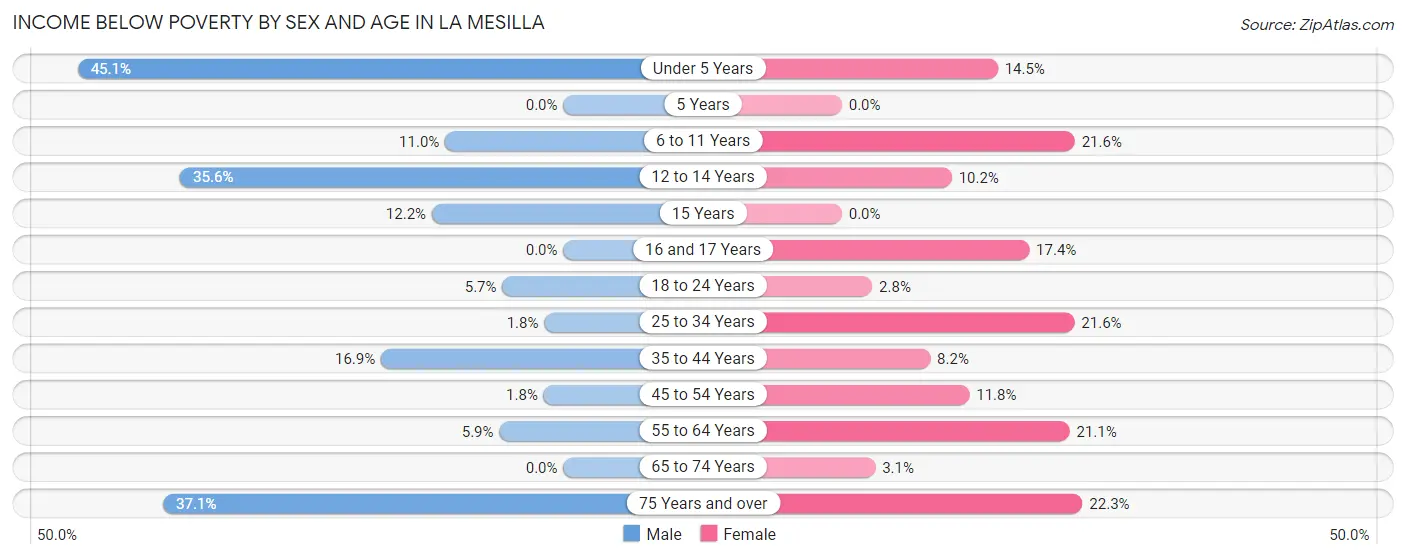
| Age Bracket | Male | Female |
| Under 5 Years | 32 (45.1%) | 11 (14.5%) |
| 5 Years | 0 (0.0%) | 0 (0.0%) |
| 6 to 11 Years | 17 (11.0%) | 16 (21.6%) |
| 12 to 14 Years | 16 (35.6%) | 5 (10.2%) |
| 15 Years | 5 (12.2%) | 0 (0.0%) |
| 16 and 17 Years | 0 (0.0%) | 4 (17.4%) |
| 18 to 24 Years | 6 (5.7%) | 2 (2.8%) |
| 25 to 34 Years | 2 (1.8%) | 19 (21.6%) |
| 35 to 44 Years | 33 (16.9%) | 10 (8.2%) |
| 45 to 54 Years | 4 (1.8%) | 11 (11.8%) |
| 55 to 64 Years | 12 (5.9%) | 37 (21.1%) |
| 65 to 74 Years | 0 (0.0%) | 4 (3.1%) |
| 75 Years and over | 26 (37.1%) | 23 (22.3%) |
| Total | 153 (10.7%) | 142 (13.9%) |
Income Above Poverty by Sex and Age in La Mesilla
According to the poverty statistics in La Mesilla, males aged 5 years and females aged 5 years are the age groups that are most secure financially, with 100.0% of males and 100.0% of females in these age groups living above the poverty line.
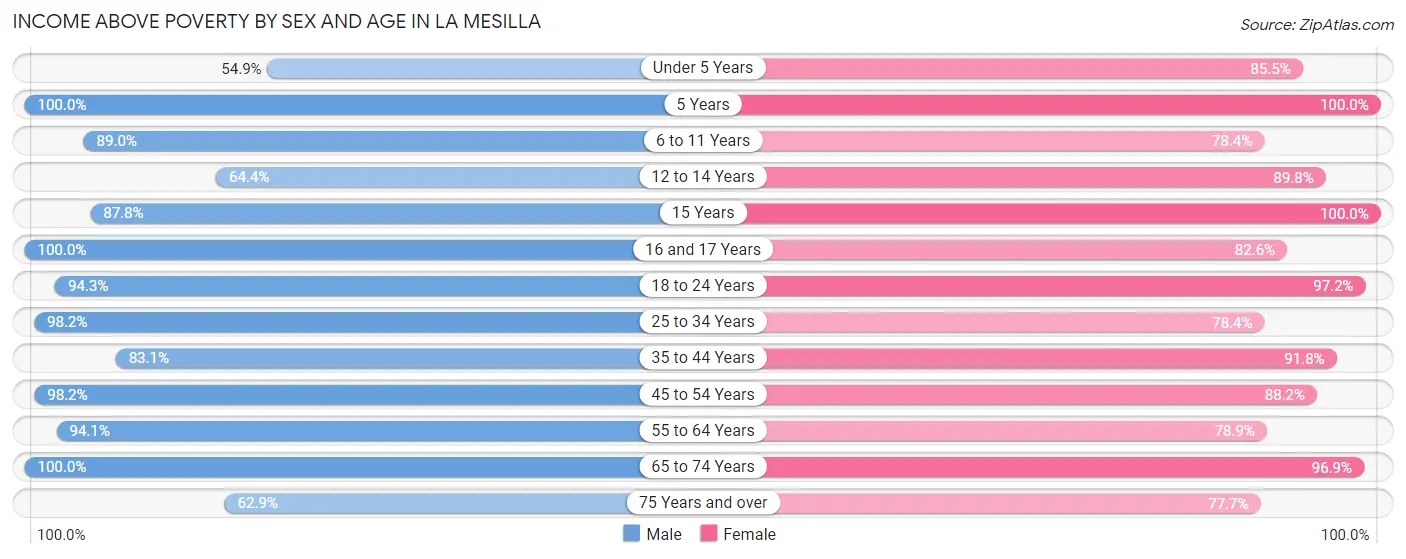
| Age Bracket | Male | Female |
| Under 5 Years | 39 (54.9%) | 65 (85.5%) |
| 5 Years | 37 (100.0%) | 5 (100.0%) |
| 6 to 11 Years | 138 (89.0%) | 58 (78.4%) |
| 12 to 14 Years | 29 (64.4%) | 44 (89.8%) |
| 15 Years | 36 (87.8%) | 11 (100.0%) |
| 16 and 17 Years | 42 (100.0%) | 19 (82.6%) |
| 18 to 24 Years | 100 (94.3%) | 69 (97.2%) |
| 25 to 34 Years | 111 (98.2%) | 69 (78.4%) |
| 35 to 44 Years | 162 (83.1%) | 112 (91.8%) |
| 45 to 54 Years | 216 (98.2%) | 82 (88.2%) |
| 55 to 64 Years | 190 (94.1%) | 138 (78.9%) |
| 65 to 74 Years | 130 (100.0%) | 125 (96.9%) |
| 75 Years and over | 44 (62.9%) | 80 (77.7%) |
| Total | 1,274 (89.3%) | 877 (86.1%) |
Income Below Poverty Among Married-Couple Families in La Mesilla
The poverty statistics for married-couple families in La Mesilla show that 4.1% or 18 of the total 435 families live below the poverty line. Families with 1 or 2 children have the highest poverty rate of 15.5%, comprising of 9 families. On the other hand, families with 3 or 4 children have the lowest poverty rate of 0.0%, which includes 0 families.
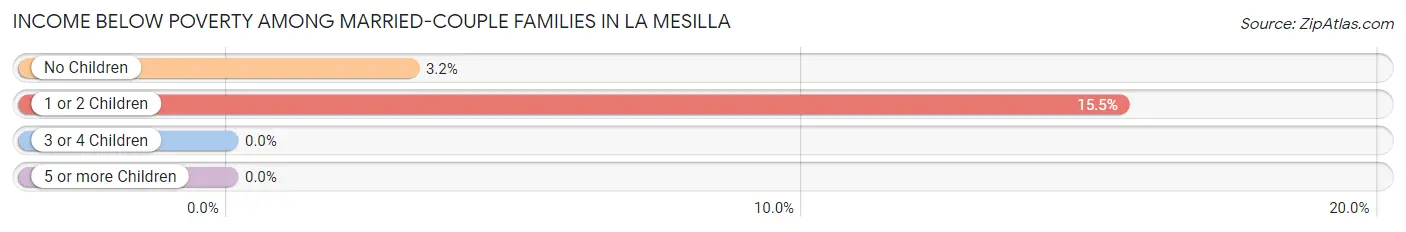
| Children | Above Poverty | Below Poverty |
| No Children | 277 (96.9%) | 9 (3.2%) |
| 1 or 2 Children | 49 (84.5%) | 9 (15.5%) |
| 3 or 4 Children | 91 (100.0%) | 0 (0.0%) |
| 5 or more Children | 0 (0.0%) | 0 (0.0%) |
| Total | 417 (95.9%) | 18 (4.1%) |
Income Below Poverty Among Single-Parent Households in La Mesilla
According to the poverty data in La Mesilla, 10.0% or 5 single-father households and 13.4% or 9 single-mother households are living below the poverty line. Among single-father households, those with 3 or 4 children have the highest poverty rate, with 5 households (100.0%) experiencing poverty. Likewise, among single-mother households, those with 3 or 4 children have the highest poverty rate, with 6 households (66.7%) falling below the poverty line.
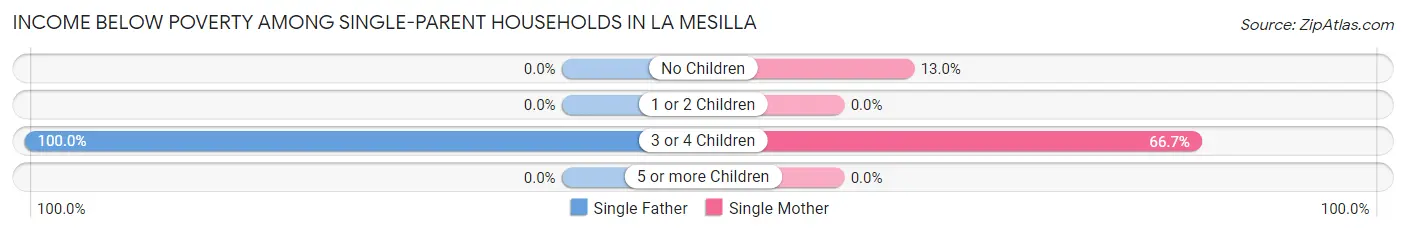
| Children | Single Father | Single Mother |
| No Children | 0 (0.0%) | 3 (13.0%) |
| 1 or 2 Children | 0 (0.0%) | 0 (0.0%) |
| 3 or 4 Children | 5 (100.0%) | 6 (66.7%) |
| 5 or more Children | 0 (0.0%) | 0 (0.0%) |
| Total | 5 (10.0%) | 9 (13.4%) |
Income Below Poverty Among Married-Couple vs Single-Parent Households in La Mesilla
The poverty data for La Mesilla shows that 18 of the married-couple family households (4.1%) and 14 of the single-parent households (12.0%) are living below the poverty level. Within the married-couple family households, those with 1 or 2 children have the highest poverty rate, with 9 households (15.5%) falling below the poverty line. Among the single-parent households, those with 3 or 4 children have the highest poverty rate, with 11 household (78.6%) living below poverty.
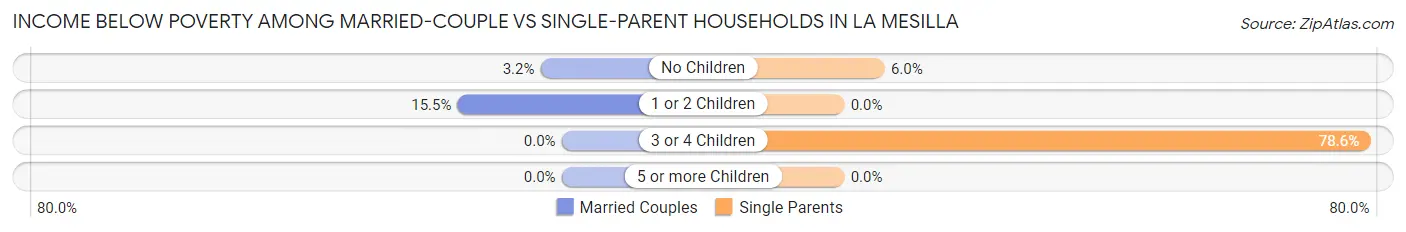
| Children | Married-Couple Families | Single-Parent Households |
| No Children | 9 (3.2%) | 3 (6.0%) |
| 1 or 2 Children | 9 (15.5%) | 0 (0.0%) |
| 3 or 4 Children | 0 (0.0%) | 11 (78.6%) |
| 5 or more Children | 0 (0.0%) | 0 (0.0%) |
| Total | 18 (4.1%) | 14 (12.0%) |
Race in La Mesilla
The most populous races in La Mesilla are Hispanic or Latino (1,731 | 70.5%), White / Caucasian (1,074 | 43.7%), and Some other Race (681 | 27.7%).
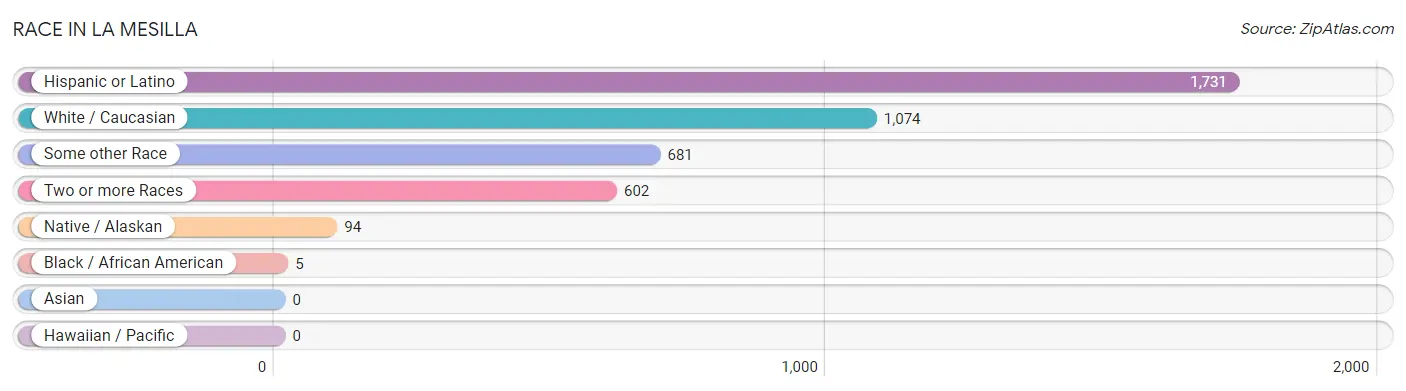
| Race | # Population | % Population |
| Asian | 0 | 0.0% |
| Black / African American | 5 | 0.2% |
| Hawaiian / Pacific | 0 | 0.0% |
| Hispanic or Latino | 1,731 | 70.5% |
| Native / Alaskan | 94 | 3.8% |
| White / Caucasian | 1,074 | 43.7% |
| Two or more Races | 602 | 24.5% |
| Some other Race | 681 | 27.7% |
| Total | 2,456 | 100.0% |
Ancestry in La Mesilla
The most populous ancestries reported in La Mesilla are Spaniard (555 | 22.6%), Mexican (501 | 20.4%), Spanish (148 | 6.0%), German (112 | 4.6%), and American (80 | 3.3%), together accounting for 56.9% of all La Mesilla residents.
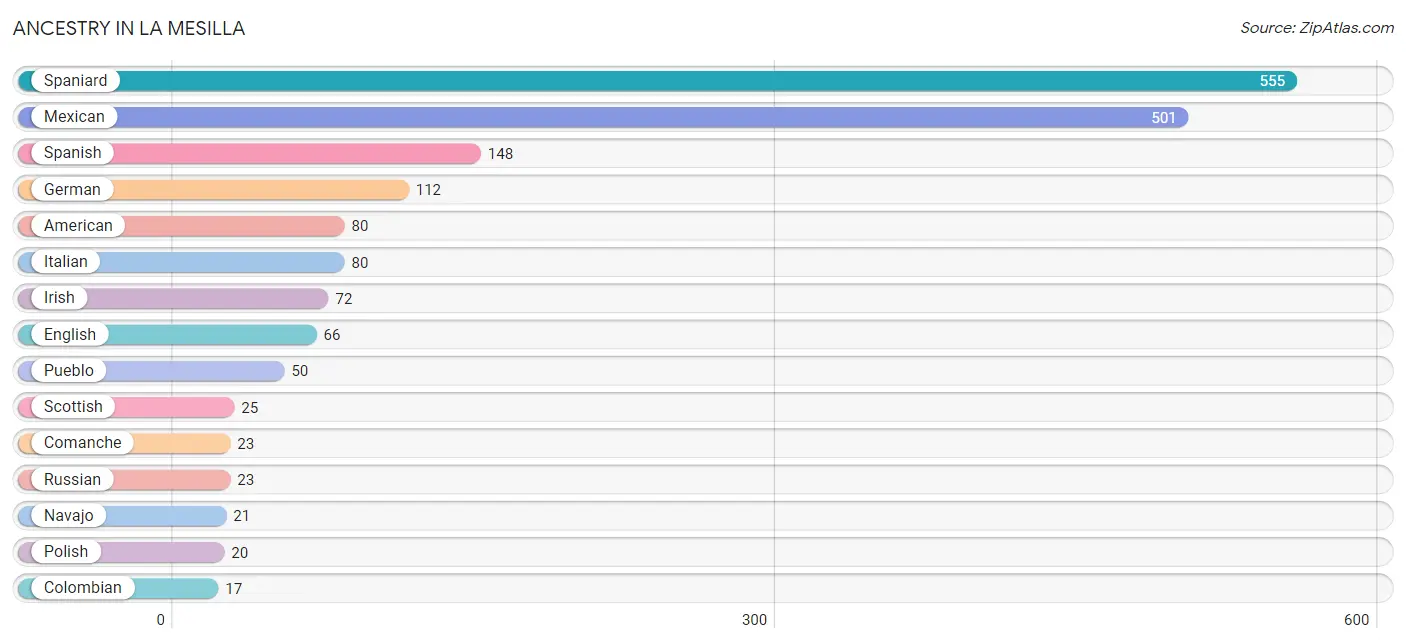
| Ancestry | # Population | % Population |
| African | 4 | 0.2% |
| American | 80 | 3.3% |
| Austrian | 3 | 0.1% |
| British | 4 | 0.2% |
| Canadian | 3 | 0.1% |
| Colombian | 17 | 0.7% |
| Comanche | 23 | 0.9% |
| Creek | 16 | 0.6% |
| Czech | 4 | 0.2% |
| Dutch | 13 | 0.5% |
| English | 66 | 2.7% |
| European | 13 | 0.5% |
| French | 10 | 0.4% |
| German | 112 | 4.6% |
| Hungarian | 7 | 0.3% |
| Irish | 72 | 2.9% |
| Italian | 80 | 3.3% |
| Korean | 2 | 0.1% |
| Mexican | 501 | 20.4% |
| Navajo | 21 | 0.9% |
| Norwegian | 13 | 0.5% |
| Pima | 5 | 0.2% |
| Polish | 20 | 0.8% |
| Portuguese | 3 | 0.1% |
| Potawatomi | 5 | 0.2% |
| Pueblo | 50 | 2.0% |
| Russian | 23 | 0.9% |
| Scottish | 25 | 1.0% |
| Serbian | 3 | 0.1% |
| Sioux | 1 | 0.0% |
| South American | 17 | 0.7% |
| Spaniard | 555 | 22.6% |
| Spanish | 148 | 6.0% |
| Spanish American Indian | 9 | 0.4% |
| Subsaharan African | 4 | 0.2% |
| Swedish | 8 | 0.3% |
| Swiss | 8 | 0.3% |
| Welsh | 4 | 0.2% | View All 38 Rows |
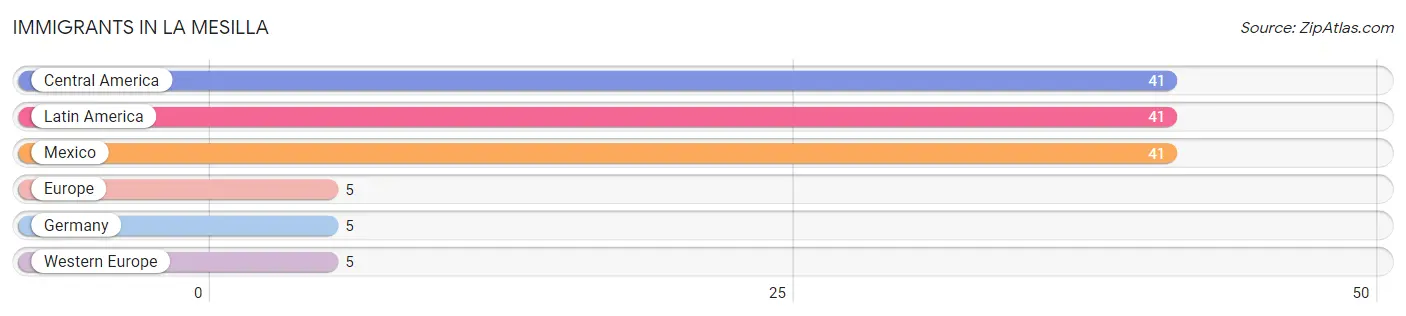
Immigrants in La Mesilla
The most numerous immigrant groups reported in La Mesilla came from Central America (41 | 1.7%), Latin America (41 | 1.7%), Mexico (41 | 1.7%), Europe (5 | 0.2%), and Germany (5 | 0.2%), together accounting for 5.4% of all La Mesilla residents.
| Immigration Origin | # Population | % Population |
| Central America | 41 | 1.7% |
| Europe | 5 | 0.2% |
| Germany | 5 | 0.2% |
| Latin America | 41 | 1.7% |
| Mexico | 41 | 1.7% |
| Western Europe | 5 | 0.2% | View All 6 Rows |
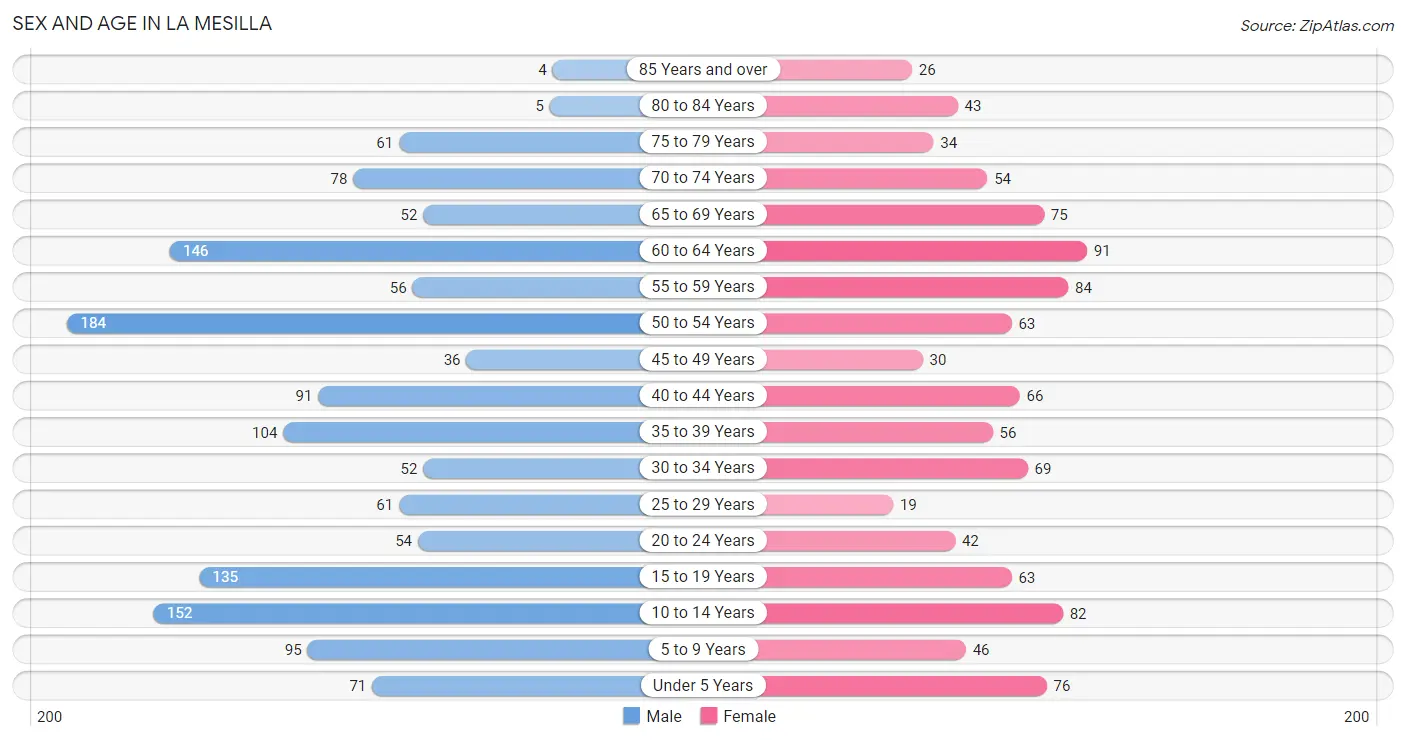
Sex and Age in La Mesilla
Sex and Age in La Mesilla
The most populous age groups in La Mesilla are 50 to 54 Years (184 | 12.8%) for men and 60 to 64 Years (91 | 8.9%) for women.
| Age Bracket | Male | Female |
| Under 5 Years | 71 (4.9%) | 76 (7.5%) |
| 5 to 9 Years | 95 (6.6%) | 46 (4.5%) |
| 10 to 14 Years | 152 (10.6%) | 82 (8.1%) |
| 15 to 19 Years | 135 (9.4%) | 63 (6.2%) |
| 20 to 24 Years | 54 (3.8%) | 42 (4.1%) |
| 25 to 29 Years | 61 (4.2%) | 19 (1.9%) |
| 30 to 34 Years | 52 (3.6%) | 69 (6.8%) |
| 35 to 39 Years | 104 (7.2%) | 56 (5.5%) |
| 40 to 44 Years | 91 (6.3%) | 66 (6.5%) |
| 45 to 49 Years | 36 (2.5%) | 30 (2.9%) |
| 50 to 54 Years | 184 (12.8%) | 63 (6.2%) |
| 55 to 59 Years | 56 (3.9%) | 84 (8.2%) |
| 60 to 64 Years | 146 (10.2%) | 91 (8.9%) |
| 65 to 69 Years | 52 (3.6%) | 75 (7.4%) |
| 70 to 74 Years | 78 (5.4%) | 54 (5.3%) |
| 75 to 79 Years | 61 (4.2%) | 34 (3.3%) |
| 80 to 84 Years | 5 (0.4%) | 43 (4.2%) |
| 85 Years and over | 4 (0.3%) | 26 (2.5%) |
| Total | 1,437 (100.0%) | 1,019 (100.0%) |
Families and Households in La Mesilla
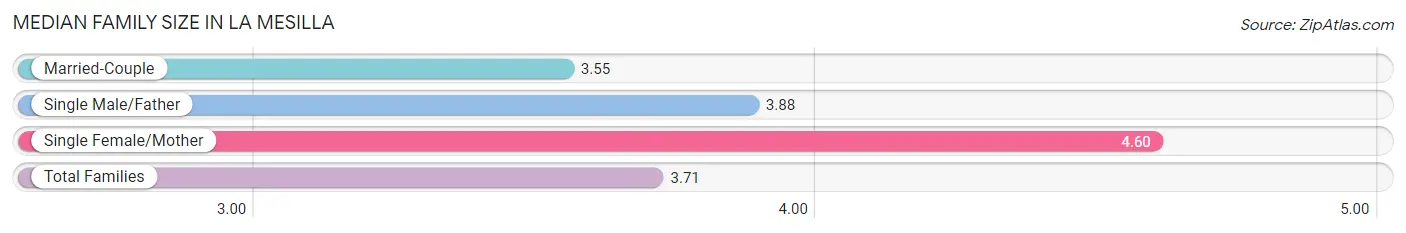
Median Family Size in La Mesilla
The median family size in La Mesilla is 3.71 persons per family, with single female/mother families (67 | 12.1%) accounting for the largest median family size of 4.6 persons per family. On the other hand, married-couple families (435 | 78.8%) represent the smallest median family size with 3.55 persons per family.
| Family Type | # Families | Family Size |
| Married-Couple | 435 (78.8%) | 3.55 |
| Single Male/Father | 50 (9.1%) | 3.88 |
| Single Female/Mother | 67 (12.1%) | 4.60 |
| Total Families | 552 (100.0%) | 3.71 |
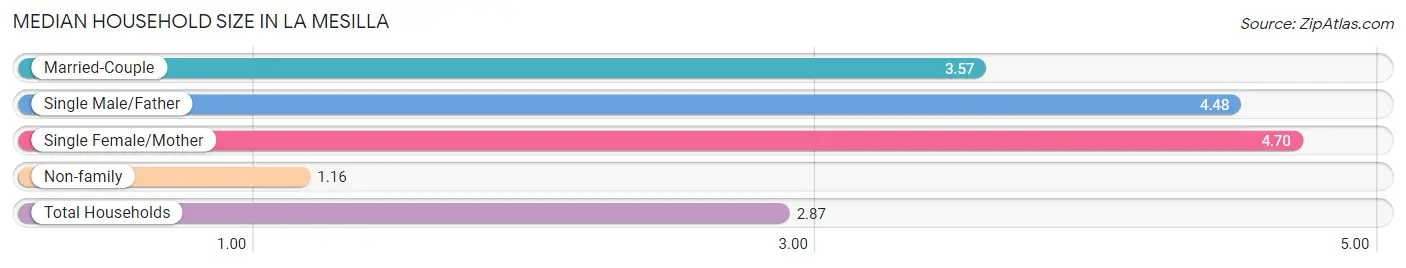
Median Household Size in La Mesilla
The median household size in La Mesilla is 2.87 persons per household, with single female/mother households (67 | 7.9%) accounting for the largest median household size of 4.7 persons per household. non-family households (300 | 35.2%) represent the smallest median household size with 1.16 persons per household.
| Household Type | # Households | Household Size |
| Married-Couple | 435 (51.1%) | 3.57 |
| Single Male/Father | 50 (5.9%) | 4.48 |
| Single Female/Mother | 67 (7.9%) | 4.70 |
| Non-family | 300 (35.2%) | 1.16 |
| Total Households | 852 (100.0%) | 2.87 |
Household Size by Marriage Status in La Mesilla
Out of a total of 852 households in La Mesilla, 552 (64.8%) are family households, while 300 (35.2%) are nonfamily households. The most numerous type of family households are 2-person households, comprising 286, and the most common type of nonfamily households are 1-person households, comprising 263.
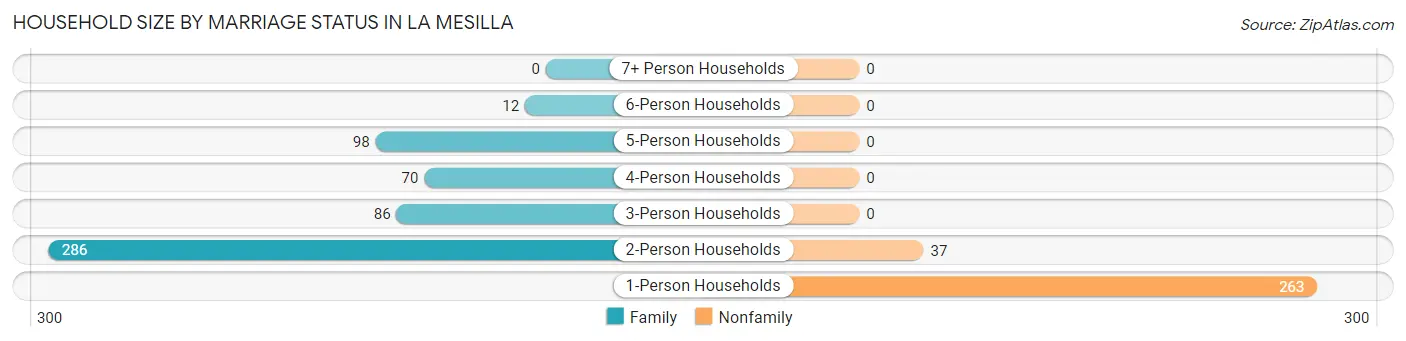
| Household Size | Family Households | Nonfamily Households |
| 1-Person Households | - | 263 (30.9%) |
| 2-Person Households | 286 (33.6%) | 37 (4.3%) |
| 3-Person Households | 86 (10.1%) | 0 (0.0%) |
| 4-Person Households | 70 (8.2%) | 0 (0.0%) |
| 5-Person Households | 98 (11.5%) | 0 (0.0%) |
| 6-Person Households | 12 (1.4%) | 0 (0.0%) |
| 7+ Person Households | 0 (0.0%) | 0 (0.0%) |
| Total | 552 (64.8%) | 300 (35.2%) |
Female Fertility in La Mesilla
Fertility by Age in La Mesilla
| Age Bracket | Women with Births | Births / 1,000 Women |
| 15 to 19 years | 0 (0.0%) | 0.0 |
| 20 to 34 years | 0 (0.0%) | 0.0 |
| 35 to 50 years | 0 (0.0%) | 0.0 |
| Total | 0 (0.0%) | 0.0 |
Fertility by Age by Marriage Status in La Mesilla
| Age Bracket | Married | Unmarried |
| 15 to 19 years | 0 (0.0%) | 0 (0.0%) |
| 20 to 34 years | 0 (0.0%) | 0 (0.0%) |
| 35 to 50 years | 0 (0.0%) | 0 (0.0%) |
| Total | 0 (0.0%) | 0 (0.0%) |
Fertility by Education in La Mesilla
| Educational Attainment | Women with Births | Births / 1,000 Women |
| Less than High School | 0 (0.0%) | 0.0 |
| High School Diploma | 0 (0.0%) | 0.0 |
| College or Associate's Degree | 0 (0.0%) | 0.0 |
| Bachelor's Degree | 0 (0.0%) | 0.0 |
| Graduate Degree | 0 (0.0%) | 0.0 |
| Total | 0 (0.0%) | 0.0 |
Fertility by Education by Marriage Status in La Mesilla
| Educational Attainment | Married | Unmarried |
| Less than High School | 0 (0.0%) | 0 (0.0%) |
| High School Diploma | 0 (0.0%) | 0 (0.0%) |
| College or Associate's Degree | 0 (0.0%) | 0 (0.0%) |
| Bachelor's Degree | 0 (0.0%) | 0 (0.0%) |
| Graduate Degree | 0 (0.0%) | 0 (0.0%) |
| Total | 0 (0.0%) | 0 (0.0%) |
Employment Characteristics in La Mesilla
Employment by Class of Employer in La Mesilla
Among the 1,023 employed individuals in La Mesilla, private company employees (424 | 41.4%), federal government employees (193 | 18.9%), and self-employed (not incorporated) (114 | 11.1%) make up the most common classes of employment.
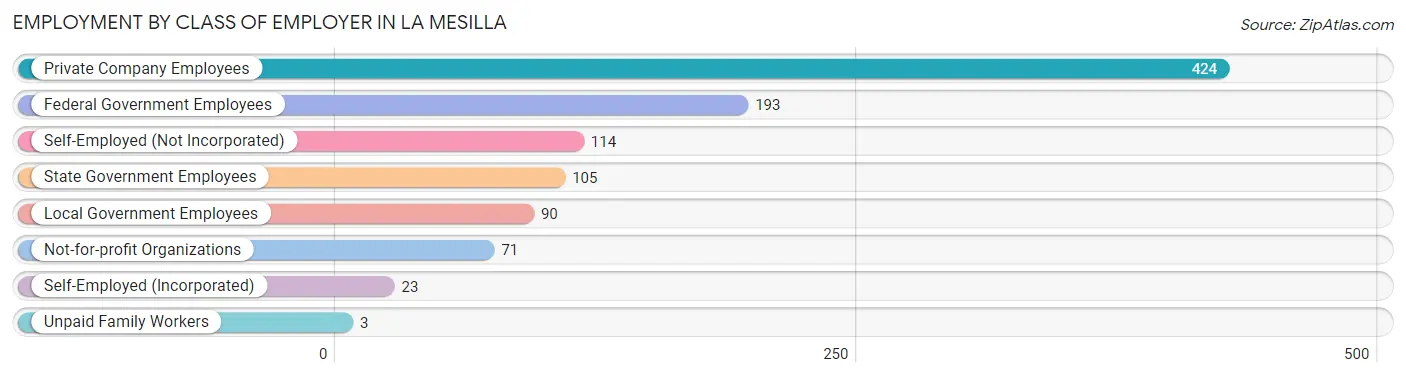
| Employer Class | # Employees | % Employees |
| Private Company Employees | 424 | 41.4% |
| Self-Employed (Incorporated) | 23 | 2.2% |
| Self-Employed (Not Incorporated) | 114 | 11.1% |
| Not-for-profit Organizations | 71 | 6.9% |
| Local Government Employees | 90 | 8.8% |
| State Government Employees | 105 | 10.3% |
| Federal Government Employees | 193 | 18.9% |
| Unpaid Family Workers | 3 | 0.3% |
| Total | 1,023 | 100.0% |
Employment Status by Age in La Mesilla
According to the labor force statistics for La Mesilla, out of the total population over 16 years of age (1,882), 56.0% or 1,054 individuals are in the labor force, with 2.7% or 28 of them unemployed. The age group with the highest labor force participation rate is 20 to 24 years, with 97.9% or 94 individuals in the labor force. Within the labor force, the 16 to 19 years age range has the highest percentage of unemployed individuals, with 12.2% or 5 of them being unemployed.
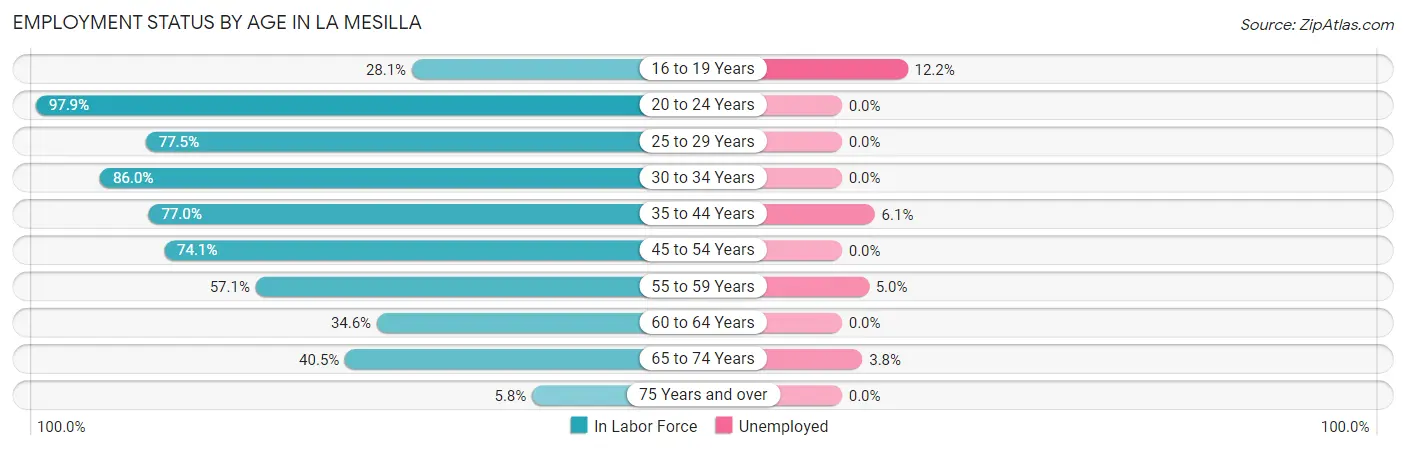
| Age Bracket | In Labor Force | Unemployed |
| 16 to 19 Years | 41 (28.1%) | 5 (12.2%) |
| 20 to 24 Years | 94 (97.9%) | 0 (0.0%) |
| 25 to 29 Years | 62 (77.5%) | 0 (0.0%) |
| 30 to 34 Years | 104 (86.0%) | 0 (0.0%) |
| 35 to 44 Years | 244 (77.0%) | 15 (6.1%) |
| 45 to 54 Years | 232 (74.1%) | 0 (0.0%) |
| 55 to 59 Years | 80 (57.1%) | 4 (5.0%) |
| 60 to 64 Years | 82 (34.6%) | 0 (0.0%) |
| 65 to 74 Years | 105 (40.5%) | 4 (3.8%) |
| 75 Years and over | 10 (5.8%) | 0 (0.0%) |
| Total | 1,054 (56.0%) | 28 (2.7%) |
Employment Status by Educational Attainment in La Mesilla
According to labor force statistics for La Mesilla, 66.6% of individuals (805) out of the total population between 25 and 64 years of age (1,208) are in the labor force, with 2.4% or 19 of them being unemployed. The group with the highest labor force participation rate are those with the educational attainment of bachelor's degree or higher, with 85.5% or 365 individuals in the labor force. Within the labor force, individuals with bachelor's degree or higher education have the highest percentage of unemployment, with 3.8% or 14 of them being unemployed.
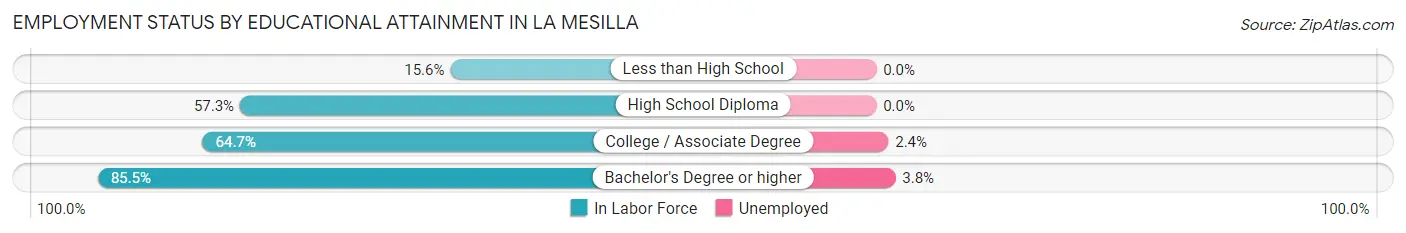
| Educational Attainment | In Labor Force | Unemployed |
| Less than High School | 12 (15.6%) | 0 (0.0%) |
| High School Diploma | 220 (57.3%) | 0 (0.0%) |
| College / Associate Degree | 207 (64.7%) | 8 (2.4%) |
| Bachelor's Degree or higher | 365 (85.5%) | 16 (3.8%) |
| Total | 805 (66.6%) | 29 (2.4%) |
Employment Occupations by Sex in La Mesilla
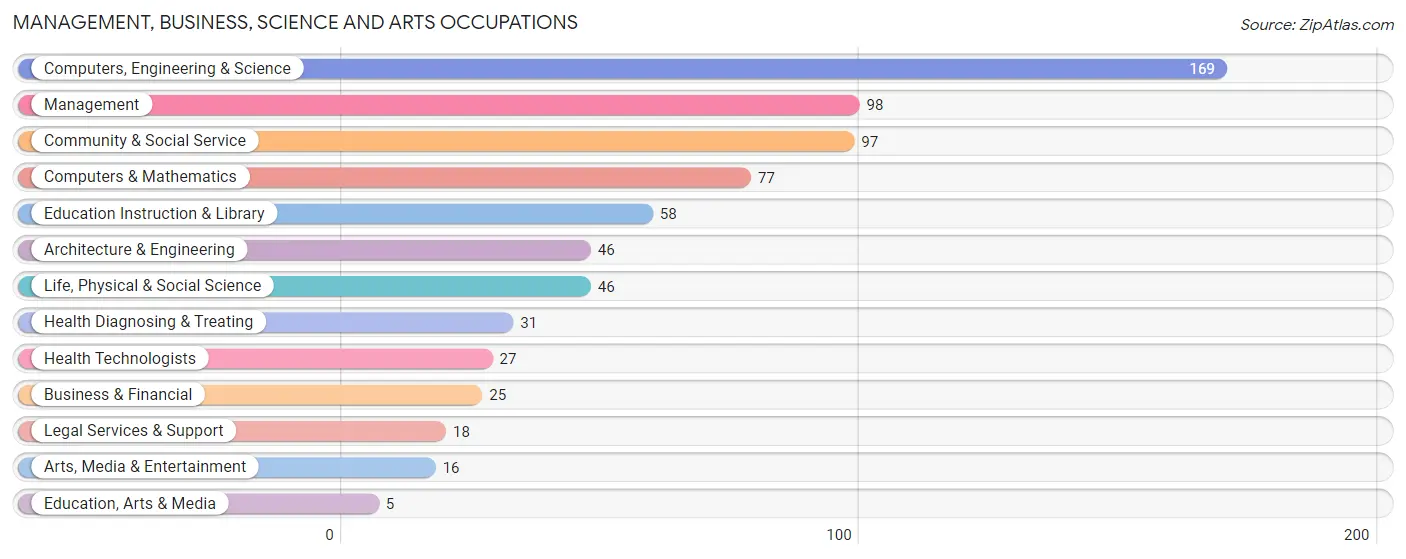
Management, Business, Science and Arts Occupations
The most common Management, Business, Science and Arts occupations in La Mesilla are Computers, Engineering & Science (169 | 16.5%), Management (98 | 9.6%), Community & Social Service (97 | 9.5%), Computers & Mathematics (77 | 7.5%), and Education Instruction & Library (58 | 5.7%).
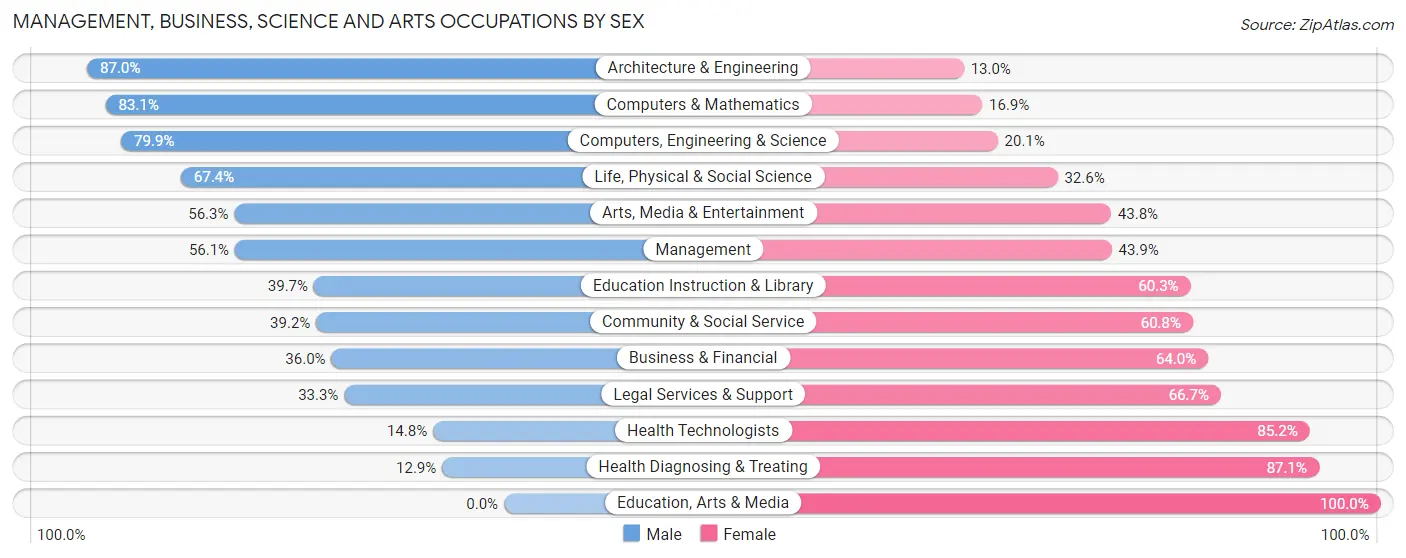
Management, Business, Science and Arts Occupations by Sex
Within the Management, Business, Science and Arts occupations in La Mesilla, the most male-oriented occupations are Architecture & Engineering (87.0%), Computers & Mathematics (83.1%), and Computers, Engineering & Science (79.9%), while the most female-oriented occupations are Education, Arts & Media (100.0%), Health Diagnosing & Treating (87.1%), and Health Technologists (85.2%).
| Occupation | Male | Female |
| Management | 55 (56.1%) | 43 (43.9%) |
| Business & Financial | 9 (36.0%) | 16 (64.0%) |
| Computers, Engineering & Science | 135 (79.9%) | 34 (20.1%) |
| Computers & Mathematics | 64 (83.1%) | 13 (16.9%) |
| Architecture & Engineering | 40 (87.0%) | 6 (13.0%) |
| Life, Physical & Social Science | 31 (67.4%) | 15 (32.6%) |
| Community & Social Service | 38 (39.2%) | 59 (60.8%) |
| Education, Arts & Media | 0 (0.0%) | 5 (100.0%) |
| Legal Services & Support | 6 (33.3%) | 12 (66.7%) |
| Education Instruction & Library | 23 (39.7%) | 35 (60.3%) |
| Arts, Media & Entertainment | 9 (56.2%) | 7 (43.8%) |
| Health Diagnosing & Treating | 4 (12.9%) | 27 (87.1%) |
| Health Technologists | 4 (14.8%) | 23 (85.2%) |
| Total (Category) | 241 (57.4%) | 179 (42.6%) |
| Total (Overall) | 607 (59.2%) | 419 (40.8%) |
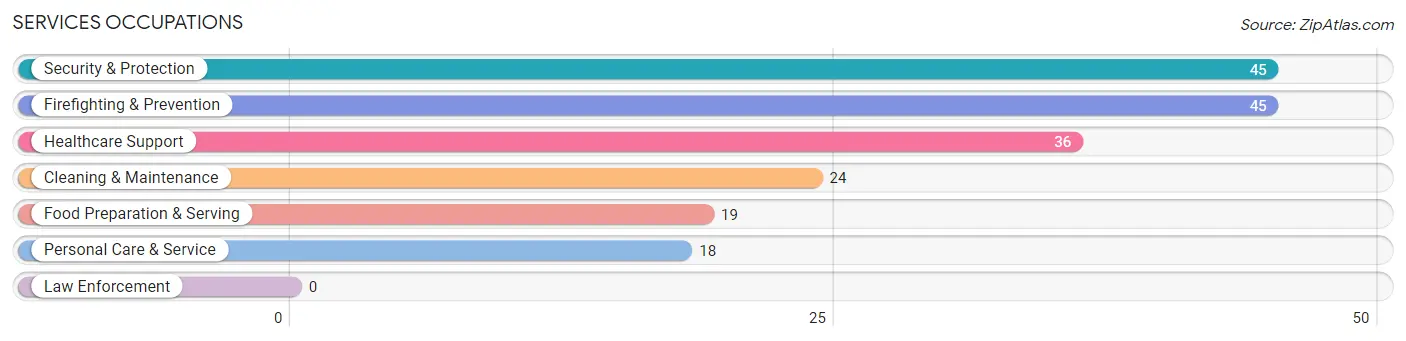
Services Occupations
The most common Services occupations in La Mesilla are Security & Protection (45 | 4.4%), Firefighting & Prevention (45 | 4.4%), Healthcare Support (36 | 3.5%), Cleaning & Maintenance (24 | 2.3%), and Food Preparation & Serving (19 | 1.8%).
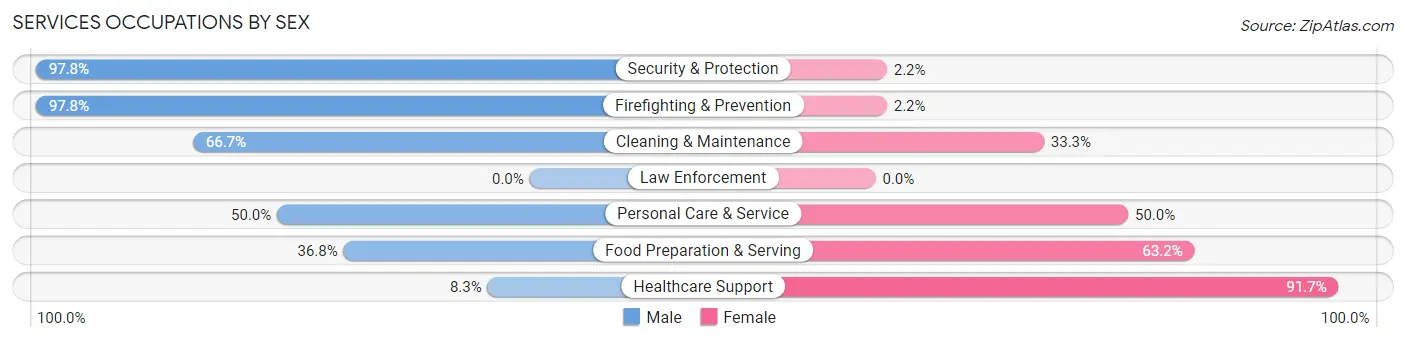
Services Occupations by Sex
Within the Services occupations in La Mesilla, the most male-oriented occupations are Security & Protection (97.8%), Firefighting & Prevention (97.8%), and Cleaning & Maintenance (66.7%), while the most female-oriented occupations are Healthcare Support (91.7%), Food Preparation & Serving (63.2%), and Personal Care & Service (50.0%).
| Occupation | Male | Female |
| Healthcare Support | 3 (8.3%) | 33 (91.7%) |
| Security & Protection | 44 (97.8%) | 1 (2.2%) |
| Firefighting & Prevention | 44 (97.8%) | 1 (2.2%) |
| Law Enforcement | 0 (0.0%) | 0 (0.0%) |
| Food Preparation & Serving | 7 (36.8%) | 12 (63.2%) |
| Cleaning & Maintenance | 16 (66.7%) | 8 (33.3%) |
| Personal Care & Service | 9 (50.0%) | 9 (50.0%) |
| Total (Category) | 79 (55.6%) | 63 (44.4%) |
| Total (Overall) | 607 (59.2%) | 419 (40.8%) |
Sales and Office Occupations
The most common Sales and Office occupations in La Mesilla are Office & Administration (153 | 14.9%), and Sales & Related (39 | 3.8%).

Sales and Office Occupations by Sex

| Occupation | Male | Female |
| Sales & Related | 21 (53.8%) | 18 (46.2%) |
| Office & Administration | 43 (28.1%) | 110 (71.9%) |
| Total (Category) | 64 (33.3%) | 128 (66.7%) |
| Total (Overall) | 607 (59.2%) | 419 (40.8%) |
Natural Resources, Construction and Maintenance Occupations
The most common Natural Resources, Construction and Maintenance occupations in La Mesilla are Construction & Extraction (105 | 10.2%), and Installation, Maintenance & Repair (58 | 5.7%).

Natural Resources, Construction and Maintenance Occupations by Sex
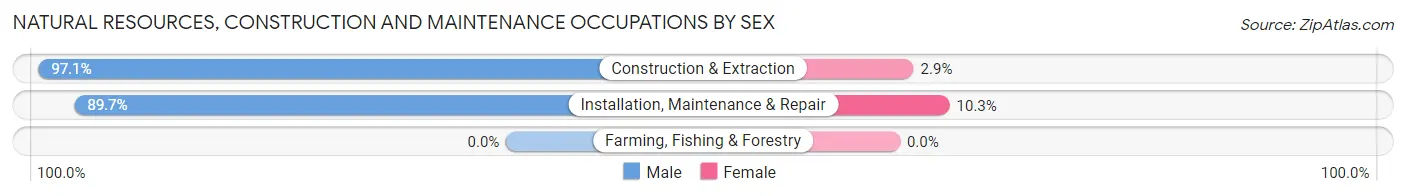
| Occupation | Male | Female |
| Farming, Fishing & Forestry | 0 (0.0%) | 0 (0.0%) |
| Construction & Extraction | 102 (97.1%) | 3 (2.9%) |
| Installation, Maintenance & Repair | 52 (89.7%) | 6 (10.3%) |
| Total (Category) | 154 (94.5%) | 9 (5.5%) |
| Total (Overall) | 607 (59.2%) | 419 (40.8%) |
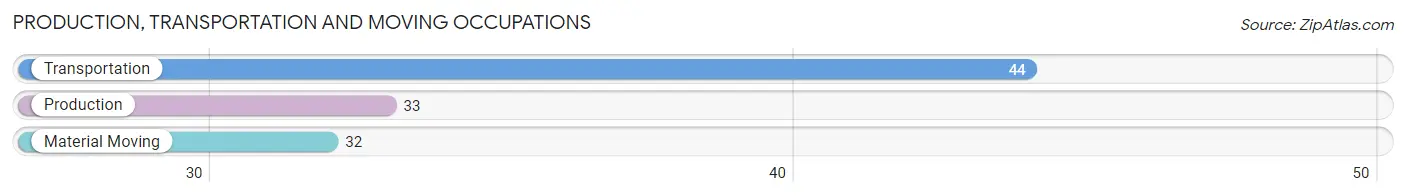
Production, Transportation and Moving Occupations
The most common Production, Transportation and Moving occupations in La Mesilla are Transportation (44 | 4.3%), Production (33 | 3.2%), and Material Moving (32 | 3.1%).
Production, Transportation and Moving Occupations by Sex
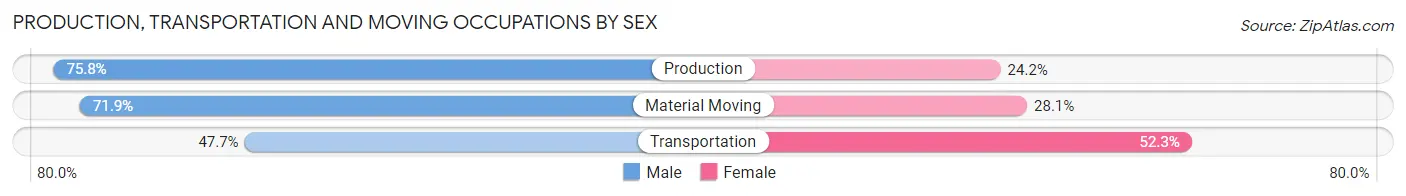
| Occupation | Male | Female |
| Production | 25 (75.8%) | 8 (24.2%) |
| Transportation | 21 (47.7%) | 23 (52.3%) |
| Material Moving | 23 (71.9%) | 9 (28.1%) |
| Total (Category) | 69 (63.3%) | 40 (36.7%) |
| Total (Overall) | 607 (59.2%) | 419 (40.8%) |
Employment Industries by Sex in La Mesilla
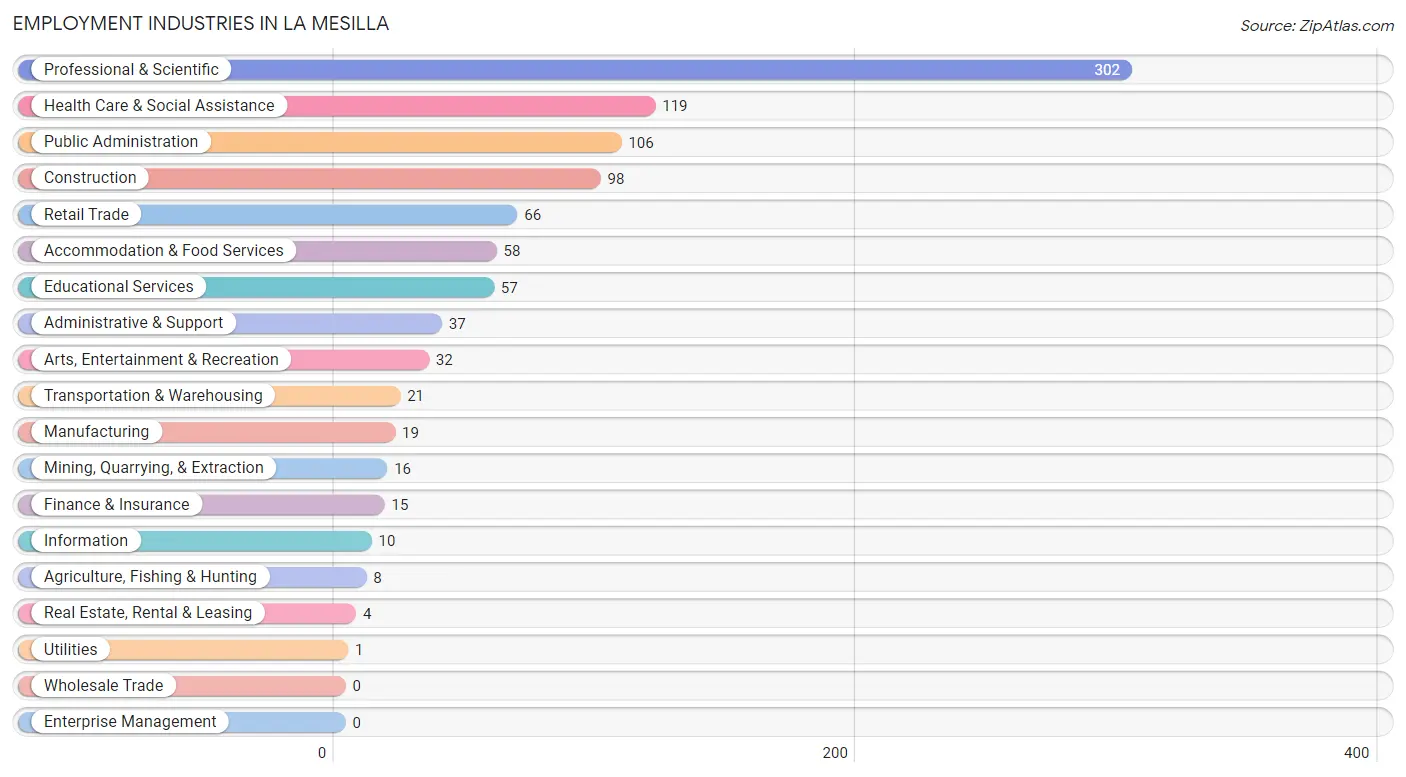
Employment Industries in La Mesilla
The major employment industries in La Mesilla include Professional & Scientific (302 | 29.4%), Health Care & Social Assistance (119 | 11.6%), Public Administration (106 | 10.3%), Construction (98 | 9.6%), and Retail Trade (66 | 6.4%).
Employment Industries by Sex in La Mesilla
The La Mesilla industries that see more men than women are Agriculture, Fishing & Hunting (100.0%), Mining, Quarrying, & Extraction (100.0%), and Transportation & Warehousing (100.0%), whereas the industries that tend to have a higher number of women are Utilities (100.0%), Health Care & Social Assistance (91.6%), and Retail Trade (72.7%).
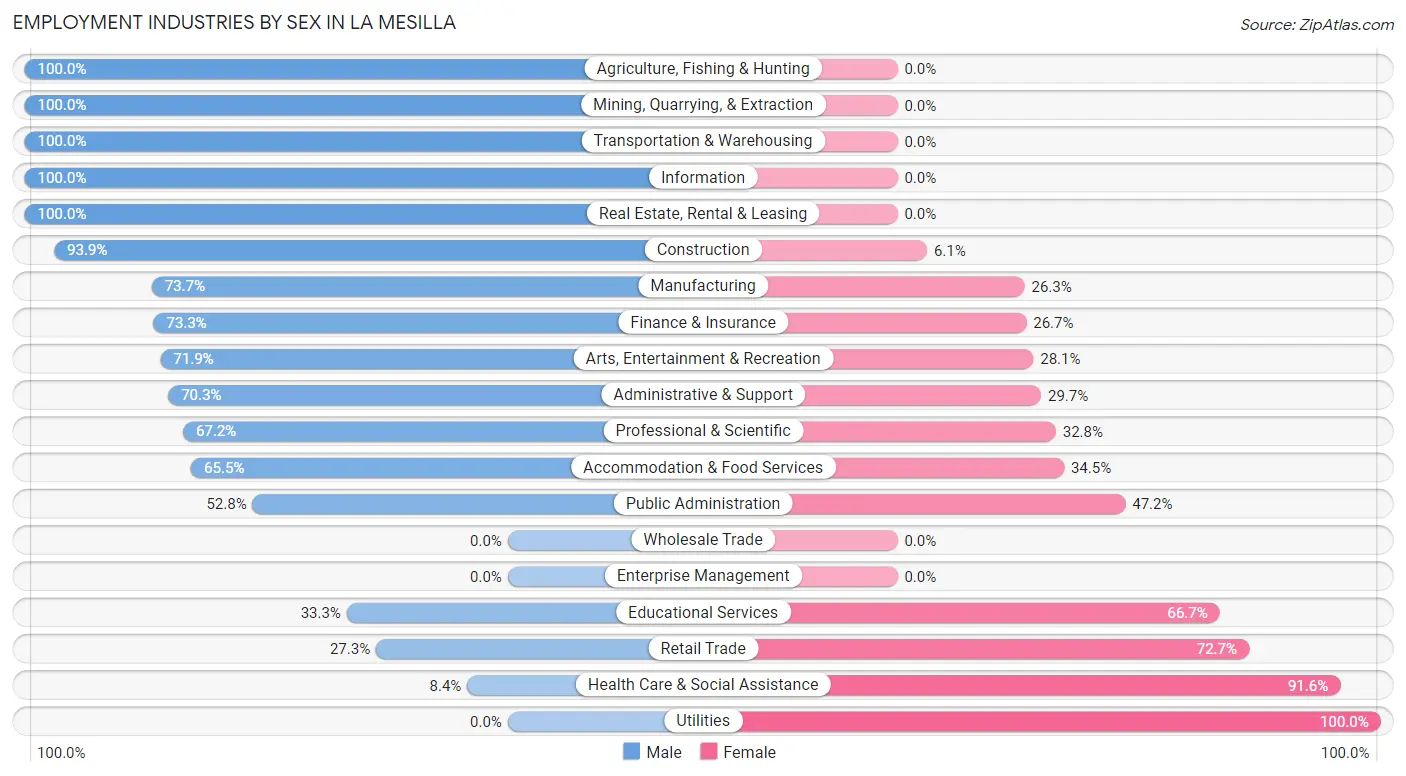
| Industry | Male | Female |
| Agriculture, Fishing & Hunting | 8 (100.0%) | 0 (0.0%) |
| Mining, Quarrying, & Extraction | 16 (100.0%) | 0 (0.0%) |
| Construction | 92 (93.9%) | 6 (6.1%) |
| Manufacturing | 14 (73.7%) | 5 (26.3%) |
| Wholesale Trade | 0 (0.0%) | 0 (0.0%) |
| Retail Trade | 18 (27.3%) | 48 (72.7%) |
| Transportation & Warehousing | 21 (100.0%) | 0 (0.0%) |
| Utilities | 0 (0.0%) | 1 (100.0%) |
| Information | 10 (100.0%) | 0 (0.0%) |
| Finance & Insurance | 11 (73.3%) | 4 (26.7%) |
| Real Estate, Rental & Leasing | 4 (100.0%) | 0 (0.0%) |
| Professional & Scientific | 203 (67.2%) | 99 (32.8%) |
| Enterprise Management | 0 (0.0%) | 0 (0.0%) |
| Administrative & Support | 26 (70.3%) | 11 (29.7%) |
| Educational Services | 19 (33.3%) | 38 (66.7%) |
| Health Care & Social Assistance | 10 (8.4%) | 109 (91.6%) |
| Arts, Entertainment & Recreation | 23 (71.9%) | 9 (28.1%) |
| Accommodation & Food Services | 38 (65.5%) | 20 (34.5%) |
| Public Administration | 56 (52.8%) | 50 (47.2%) |
| Total | 607 (59.2%) | 419 (40.8%) |
Education in La Mesilla
School Enrollment in La Mesilla
The most common levels of schooling among the 603 students in La Mesilla are middle school (196 | 32.5%), high school (159 | 26.4%), and elementary school (82 | 13.6%).
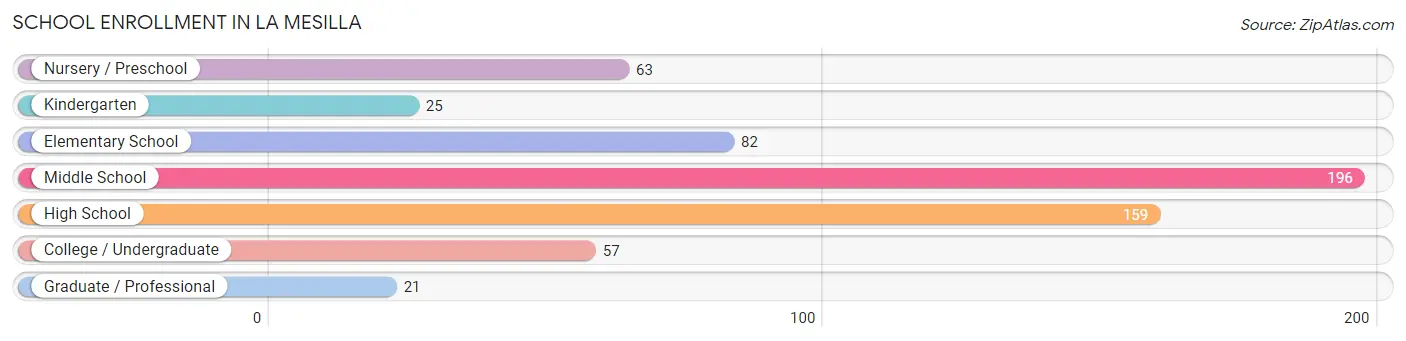
| School Level | # Students | % Students |
| Nursery / Preschool | 63 | 10.4% |
| Kindergarten | 25 | 4.2% |
| Elementary School | 82 | 13.6% |
| Middle School | 196 | 32.5% |
| High School | 159 | 26.4% |
| College / Undergraduate | 57 | 9.5% |
| Graduate / Professional | 21 | 3.5% |
| Total | 603 | 100.0% |
School Enrollment by Age by Funding Source in La Mesilla
Out of a total of 603 students who are enrolled in schools in La Mesilla, 20 (3.3%) attend a private institution, while the remaining 583 (96.7%) are enrolled in public schools. The age group of 35 years and over has the highest likelihood of being enrolled in private schools, with 12 (46.2% in the age bracket) enrolled. Conversely, the age group of 3 to 4 year olds has the lowest likelihood of being enrolled in a private school, with 63 (100.0% in the age bracket) attending a public institution.
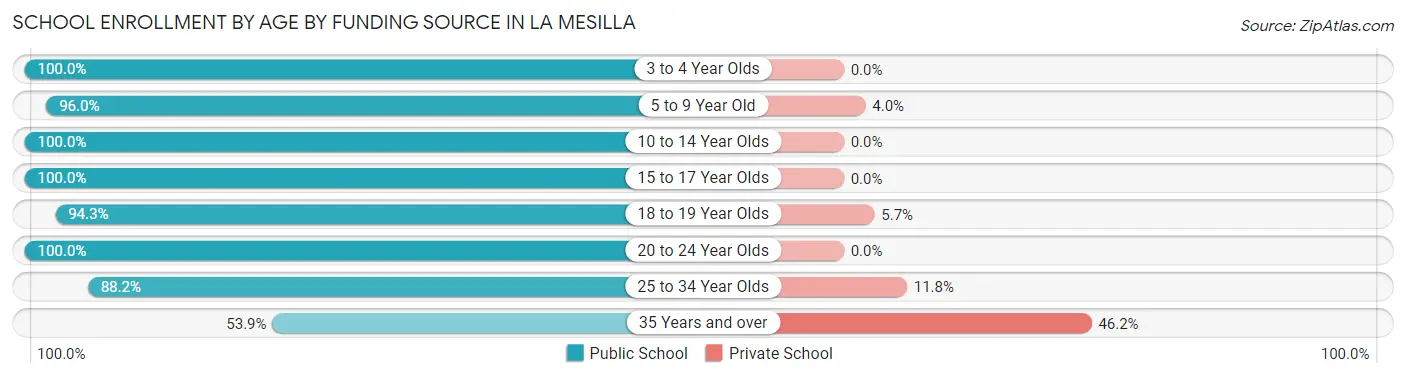
| Age Bracket | Public School | Private School |
| 3 to 4 Year Olds | 63 (100.0%) | 0 (0.0%) |
| 5 to 9 Year Old | 95 (96.0%) | 4 (4.0%) |
| 10 to 14 Year Olds | 228 (100.0%) | 0 (0.0%) |
| 15 to 17 Year Olds | 117 (100.0%) | 0 (0.0%) |
| 18 to 19 Year Olds | 33 (94.3%) | 2 (5.7%) |
| 20 to 24 Year Olds | 18 (100.0%) | 0 (0.0%) |
| 25 to 34 Year Olds | 15 (88.2%) | 2 (11.8%) |
| 35 Years and over | 14 (53.8%) | 12 (46.2%) |
| Total | 583 (96.7%) | 20 (3.3%) |
Educational Attainment by Field of Study in La Mesilla
Computers & mathematics (105 | 16.4%), liberal arts & history (70 | 10.9%), business (67 | 10.4%), bio, nature & agricultural (61 | 9.5%), and education (58 | 9.0%) are the most common fields of study among 642 individuals in La Mesilla who have obtained a bachelor's degree or higher.
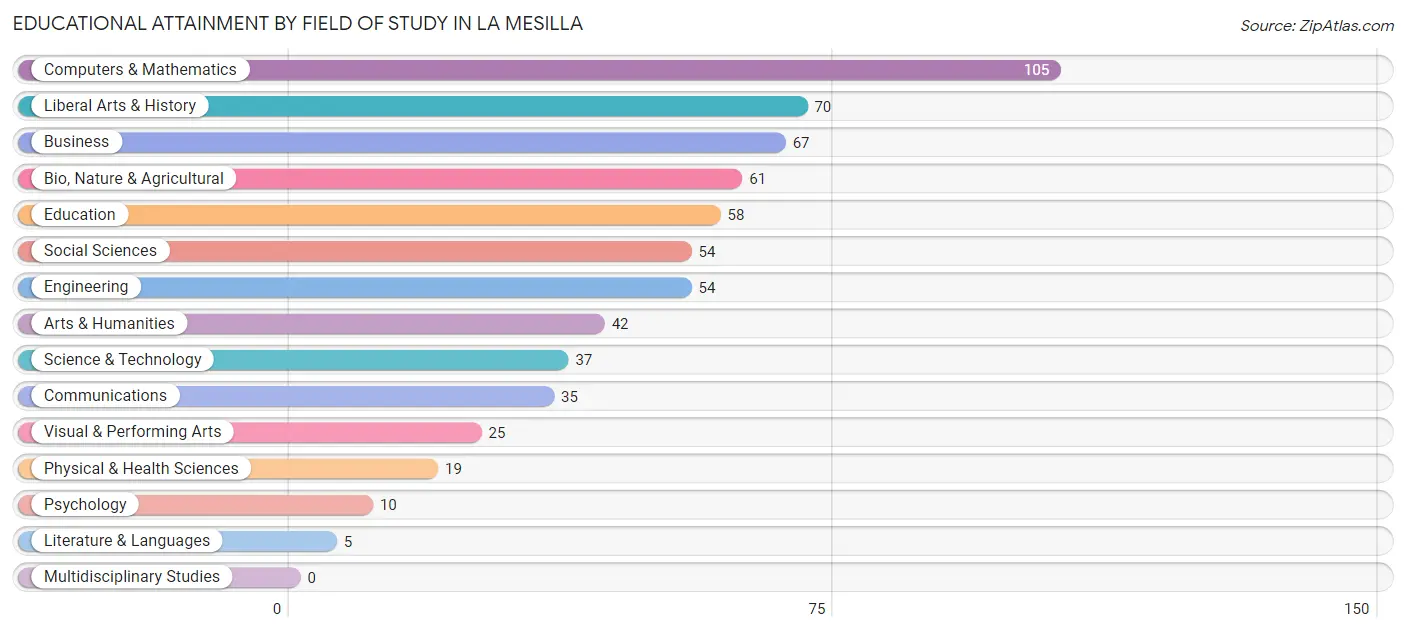
| Field of Study | # Graduates | % Graduates |
| Computers & Mathematics | 105 | 16.4% |
| Bio, Nature & Agricultural | 61 | 9.5% |
| Physical & Health Sciences | 19 | 3.0% |
| Psychology | 10 | 1.6% |
| Social Sciences | 54 | 8.4% |
| Engineering | 54 | 8.4% |
| Multidisciplinary Studies | 0 | 0.0% |
| Science & Technology | 37 | 5.8% |
| Business | 67 | 10.4% |
| Education | 58 | 9.0% |
| Literature & Languages | 5 | 0.8% |
| Liberal Arts & History | 70 | 10.9% |
| Visual & Performing Arts | 25 | 3.9% |
| Communications | 35 | 5.4% |
| Arts & Humanities | 42 | 6.5% |
| Total | 642 | 100.0% |
Transportation & Commute in La Mesilla
Vehicle Availability by Sex in La Mesilla
The most prevalent vehicle ownership categories in La Mesilla are males with 3 vehicles (234, accounting for 38.6%) and females with 3 vehicles (162, making up 57.1%).
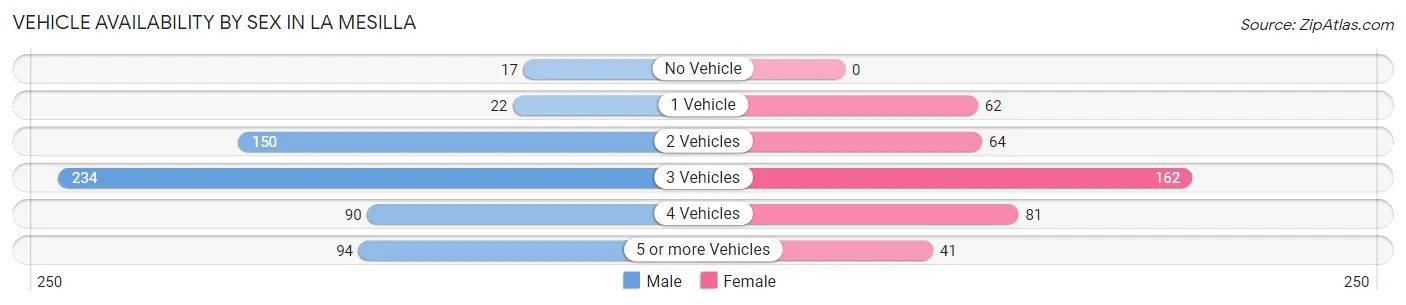
| Vehicles Available | Male | Female |
| No Vehicle | 17 (2.8%) | 0 (0.0%) |
| 1 Vehicle | 22 (3.6%) | 62 (15.1%) |
| 2 Vehicles | 150 (24.7%) | 64 (15.6%) |
| 3 Vehicles | 234 (38.6%) | 162 (39.5%) |
| 4 Vehicles | 90 (14.8%) | 81 (19.8%) |
| 5 or more Vehicles | 94 (15.5%) | 41 (10.0%) |
| Total | 607 (100.0%) | 410 (100.0%) |
Commute Time in La Mesilla
The most frequently occuring commute durations in La Mesilla are 45 to 59 minutes (263 commuters, 28.9%), 30 to 34 minutes (134 commuters, 14.7%), and 40 to 44 minutes (125 commuters, 13.7%).
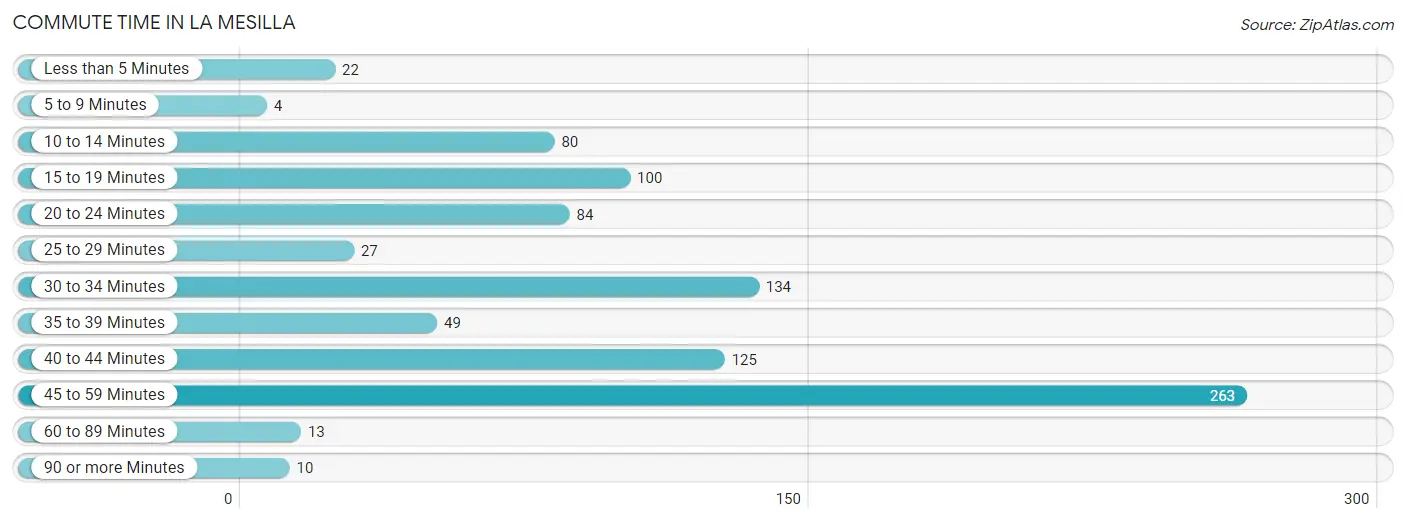
| Commute Time | # Commuters | % Commuters |
| Less than 5 Minutes | 22 | 2.4% |
| 5 to 9 Minutes | 4 | 0.4% |
| 10 to 14 Minutes | 80 | 8.8% |
| 15 to 19 Minutes | 100 | 11.0% |
| 20 to 24 Minutes | 84 | 9.2% |
| 25 to 29 Minutes | 27 | 3.0% |
| 30 to 34 Minutes | 134 | 14.7% |
| 35 to 39 Minutes | 49 | 5.4% |
| 40 to 44 Minutes | 125 | 13.7% |
| 45 to 59 Minutes | 263 | 28.9% |
| 60 to 89 Minutes | 13 | 1.4% |
| 90 or more Minutes | 10 | 1.1% |
Commute Time by Sex in La Mesilla
The most common commute times in La Mesilla are 45 to 59 minutes (187 commuters, 33.0%) for males and 30 to 34 minutes (78 commuters, 22.6%) for females.
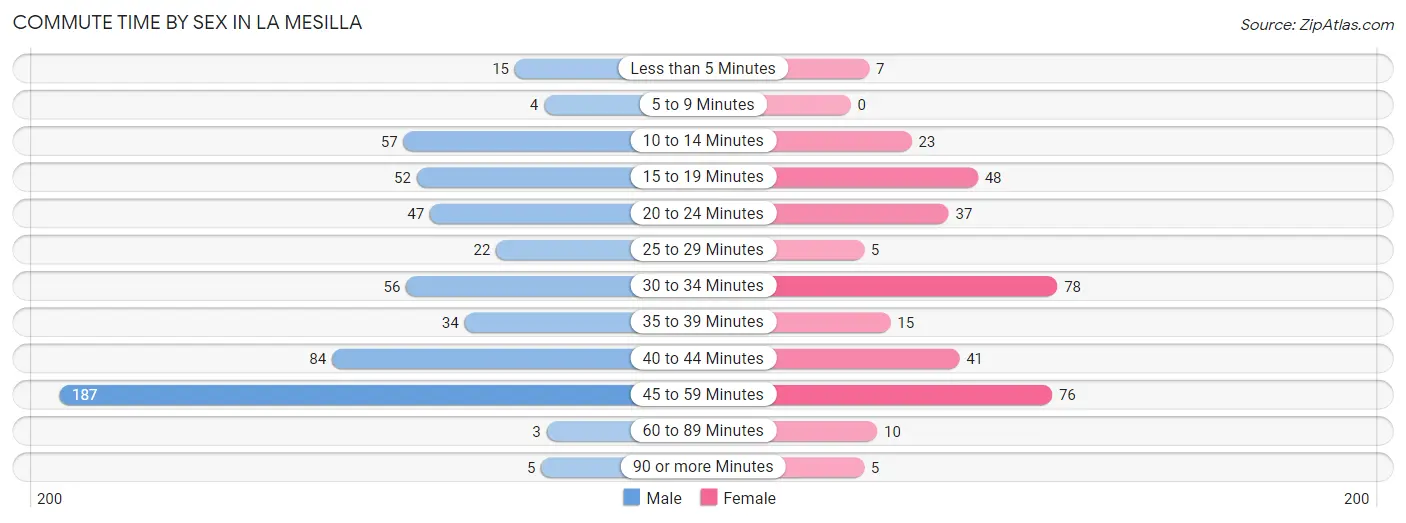
| Commute Time | Male | Female |
| Less than 5 Minutes | 15 (2.6%) | 7 (2.0%) |
| 5 to 9 Minutes | 4 (0.7%) | 0 (0.0%) |
| 10 to 14 Minutes | 57 (10.1%) | 23 (6.7%) |
| 15 to 19 Minutes | 52 (9.2%) | 48 (13.9%) |
| 20 to 24 Minutes | 47 (8.3%) | 37 (10.7%) |
| 25 to 29 Minutes | 22 (3.9%) | 5 (1.5%) |
| 30 to 34 Minutes | 56 (9.9%) | 78 (22.6%) |
| 35 to 39 Minutes | 34 (6.0%) | 15 (4.3%) |
| 40 to 44 Minutes | 84 (14.8%) | 41 (11.9%) |
| 45 to 59 Minutes | 187 (33.0%) | 76 (22.0%) |
| 60 to 89 Minutes | 3 (0.5%) | 10 (2.9%) |
| 90 or more Minutes | 5 (0.9%) | 5 (1.5%) |
Time of Departure to Work by Sex in La Mesilla
The most frequent times of departure to work in La Mesilla are 7:00 AM to 7:29 AM (111, 19.6%) for males and 7:00 AM to 7:29 AM (105, 30.4%) for females.
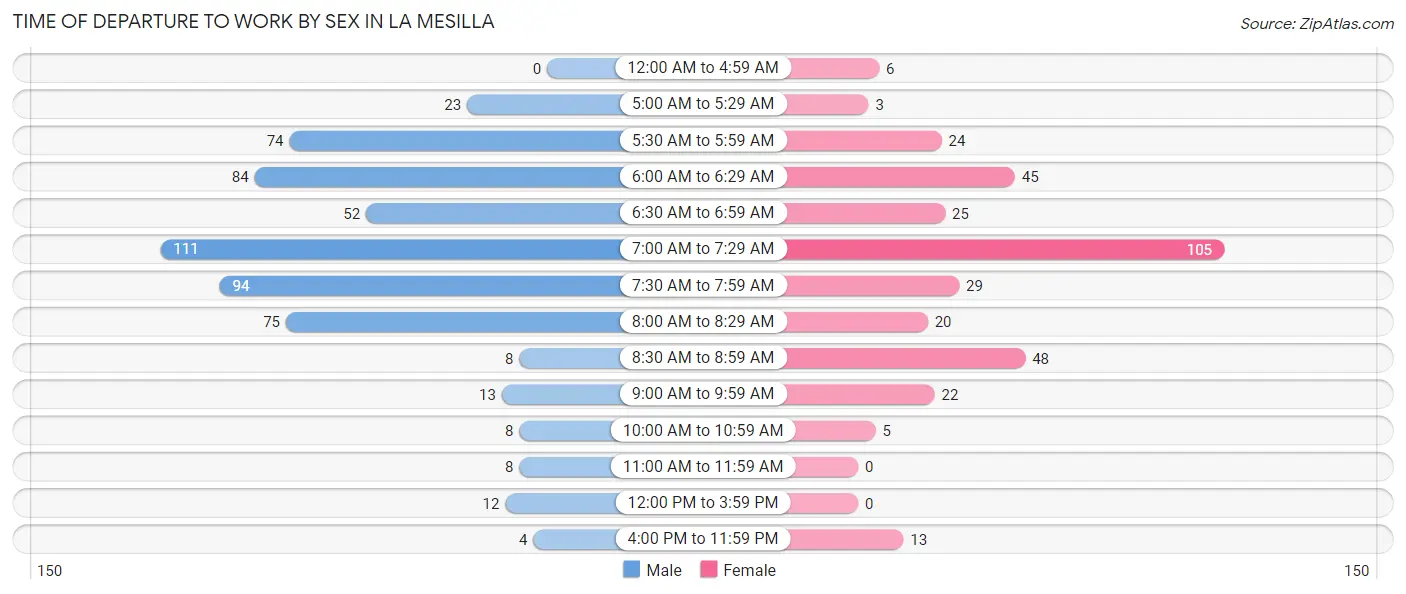
| Time of Departure | Male | Female |
| 12:00 AM to 4:59 AM | 0 (0.0%) | 6 (1.7%) |
| 5:00 AM to 5:29 AM | 23 (4.1%) | 3 (0.9%) |
| 5:30 AM to 5:59 AM | 74 (13.1%) | 24 (7.0%) |
| 6:00 AM to 6:29 AM | 84 (14.8%) | 45 (13.0%) |
| 6:30 AM to 6:59 AM | 52 (9.2%) | 25 (7.2%) |
| 7:00 AM to 7:29 AM | 111 (19.6%) | 105 (30.4%) |
| 7:30 AM to 7:59 AM | 94 (16.6%) | 29 (8.4%) |
| 8:00 AM to 8:29 AM | 75 (13.3%) | 20 (5.8%) |
| 8:30 AM to 8:59 AM | 8 (1.4%) | 48 (13.9%) |
| 9:00 AM to 9:59 AM | 13 (2.3%) | 22 (6.4%) |
| 10:00 AM to 10:59 AM | 8 (1.4%) | 5 (1.5%) |
| 11:00 AM to 11:59 AM | 8 (1.4%) | 0 (0.0%) |
| 12:00 PM to 3:59 PM | 12 (2.1%) | 0 (0.0%) |
| 4:00 PM to 11:59 PM | 4 (0.7%) | 13 (3.8%) |
| Total | 566 (100.0%) | 345 (100.0%) |
Housing Occupancy in La Mesilla
Occupancy by Ownership in La Mesilla
Of the total 852 dwellings in La Mesilla, owner-occupied units account for 746 (87.6%), while renter-occupied units make up 106 (12.4%).
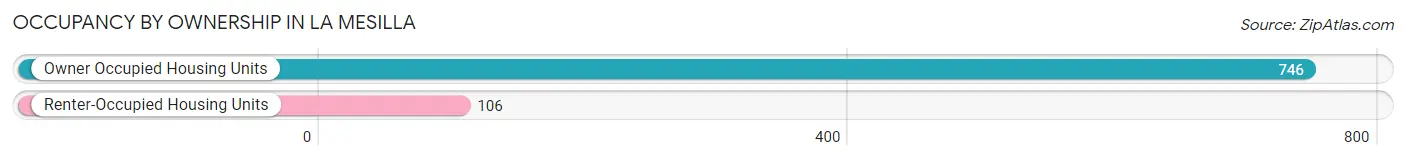
| Occupancy | # Housing Units | % Housing Units |
| Owner Occupied Housing Units | 746 | 87.6% |
| Renter-Occupied Housing Units | 106 | 12.4% |
| Total Occupied Housing Units | 852 | 100.0% |
Occupancy by Household Size in La Mesilla
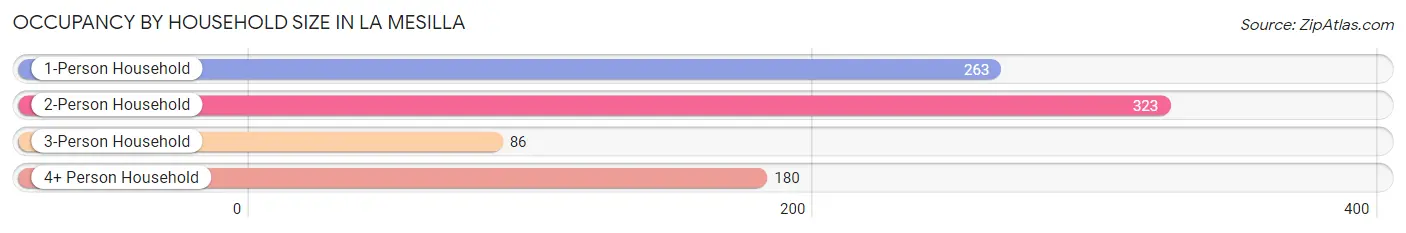
| Household Size | # Housing Units | % Housing Units |
| 1-Person Household | 263 | 30.9% |
| 2-Person Household | 323 | 37.9% |
| 3-Person Household | 86 | 10.1% |
| 4+ Person Household | 180 | 21.1% |
| Total Housing Units | 852 | 100.0% |
Occupancy by Ownership by Household Size in La Mesilla
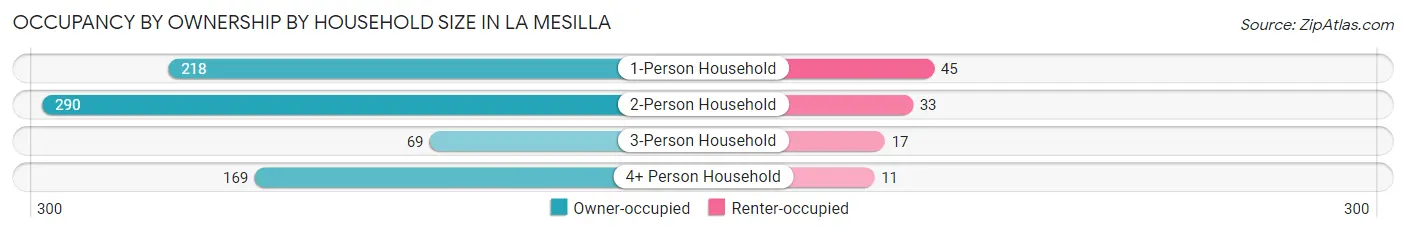
| Household Size | Owner-occupied | Renter-occupied |
| 1-Person Household | 218 (82.9%) | 45 (17.1%) |
| 2-Person Household | 290 (89.8%) | 33 (10.2%) |
| 3-Person Household | 69 (80.2%) | 17 (19.8%) |
| 4+ Person Household | 169 (93.9%) | 11 (6.1%) |
| Total Housing Units | 746 (87.6%) | 106 (12.4%) |
Occupancy by Educational Attainment in La Mesilla
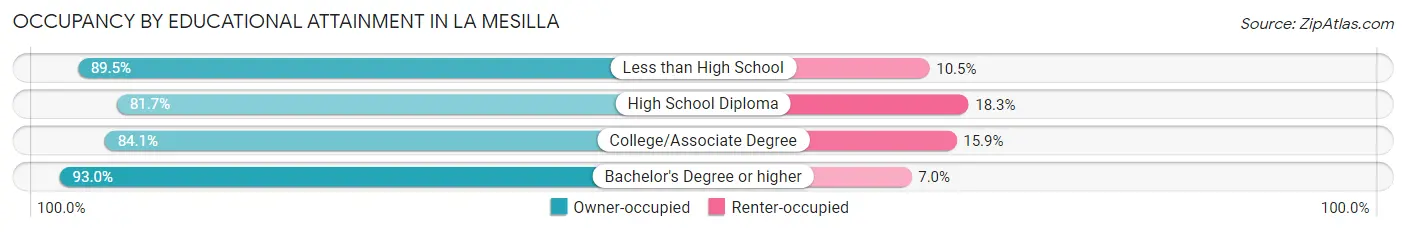
| Household Size | Owner-occupied | Renter-occupied |
| Less than High School | 34 (89.5%) | 4 (10.5%) |
| High School Diploma | 161 (81.7%) | 36 (18.3%) |
| College/Associate Degree | 217 (84.1%) | 41 (15.9%) |
| Bachelor's Degree or higher | 334 (93.0%) | 25 (7.0%) |
Occupancy by Age of Householder in La Mesilla
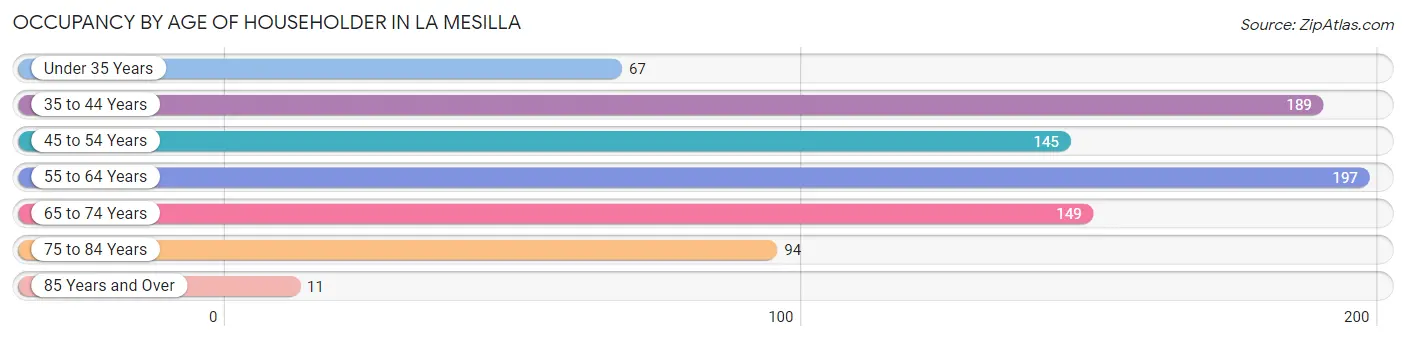
| Age Bracket | # Households | % Households |
| Under 35 Years | 67 | 7.9% |
| 35 to 44 Years | 189 | 22.2% |
| 45 to 54 Years | 145 | 17.0% |
| 55 to 64 Years | 197 | 23.1% |
| 65 to 74 Years | 149 | 17.5% |
| 75 to 84 Years | 94 | 11.0% |
| 85 Years and Over | 11 | 1.3% |
| Total | 852 | 100.0% |
Housing Finances in La Mesilla
Median Income by Occupancy in La Mesilla
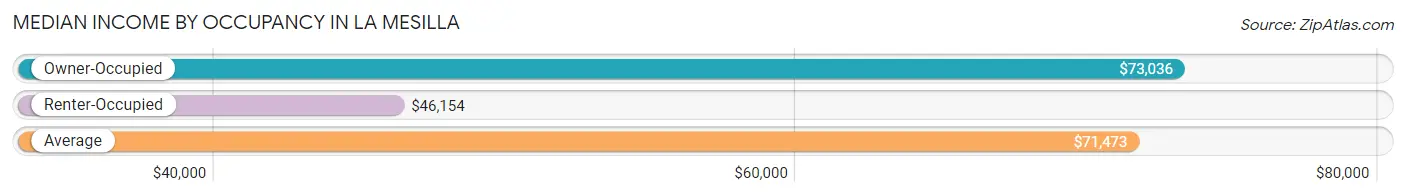
| Occupancy Type | # Households | Median Income |
| Owner-Occupied | 746 (87.6%) | $73,036 |
| Renter-Occupied | 106 (12.4%) | $46,154 |
| Average | 852 (100.0%) | $71,473 |
Occupancy by Householder Income Bracket in La Mesilla
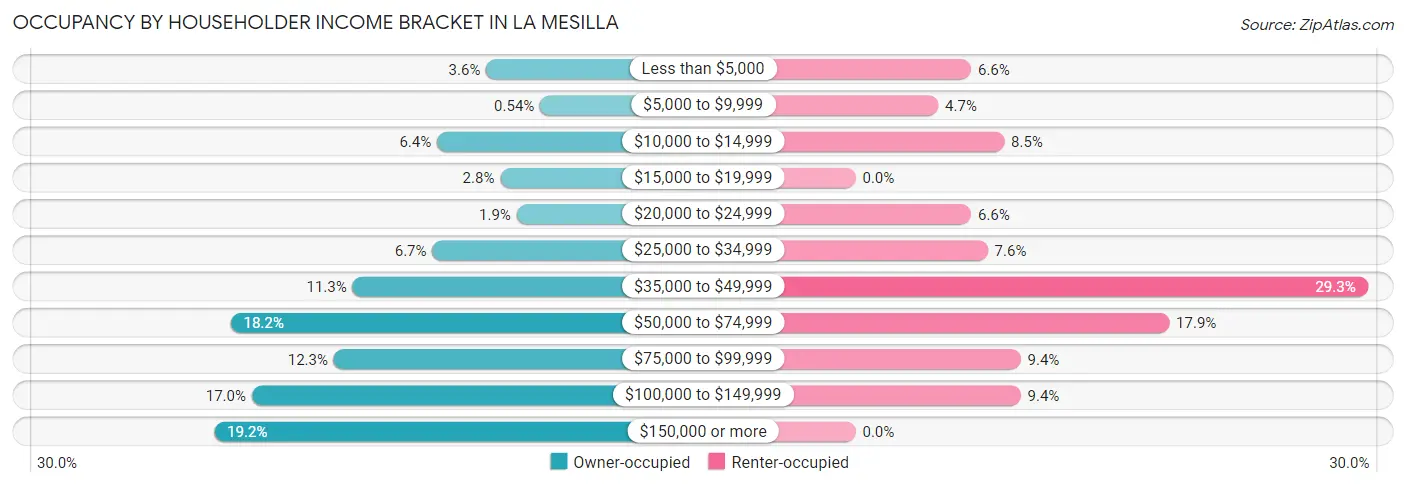
| Income Bracket | Owner-occupied | Renter-occupied |
| Less than $5,000 | 27 (3.6%) | 7 (6.6%) |
| $5,000 to $9,999 | 4 (0.5%) | 5 (4.7%) |
| $10,000 to $14,999 | 48 (6.4%) | 9 (8.5%) |
| $15,000 to $19,999 | 21 (2.8%) | 0 (0.0%) |
| $20,000 to $24,999 | 14 (1.9%) | 7 (6.6%) |
| $25,000 to $34,999 | 50 (6.7%) | 8 (7.5%) |
| $35,000 to $49,999 | 84 (11.3%) | 31 (29.2%) |
| $50,000 to $74,999 | 136 (18.2%) | 19 (17.9%) |
| $75,000 to $99,999 | 92 (12.3%) | 10 (9.4%) |
| $100,000 to $149,999 | 127 (17.0%) | 10 (9.4%) |
| $150,000 or more | 143 (19.2%) | 0 (0.0%) |
| Total | 746 (100.0%) | 106 (100.0%) |
Monthly Housing Cost Tiers in La Mesilla
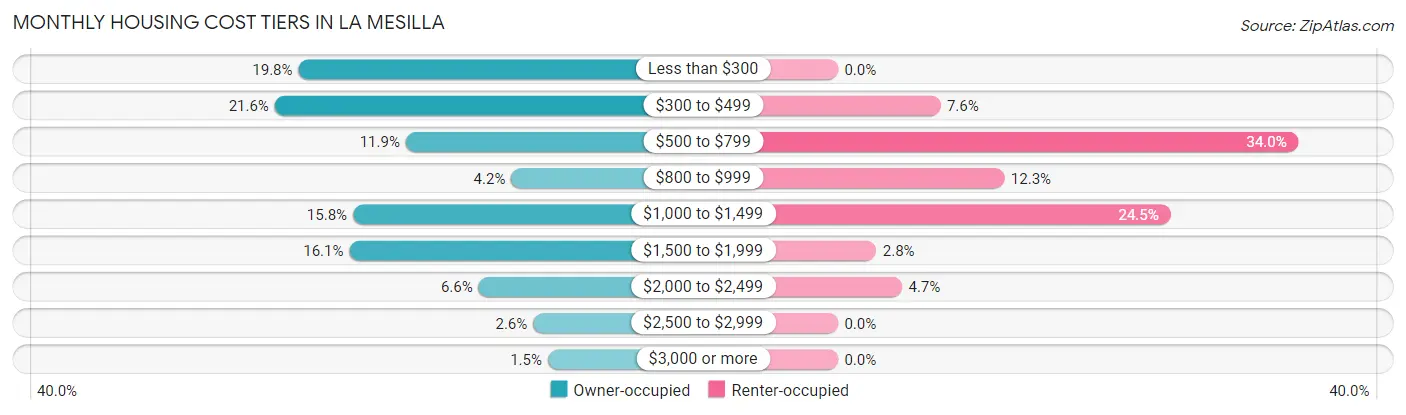
| Monthly Cost | Owner-occupied | Renter-occupied |
| Less than $300 | 148 (19.8%) | 0 (0.0%) |
| $300 to $499 | 161 (21.6%) | 8 (7.5%) |
| $500 to $799 | 89 (11.9%) | 36 (34.0%) |
| $800 to $999 | 31 (4.2%) | 13 (12.3%) |
| $1,000 to $1,499 | 118 (15.8%) | 26 (24.5%) |
| $1,500 to $1,999 | 120 (16.1%) | 3 (2.8%) |
| $2,000 to $2,499 | 49 (6.6%) | 5 (4.7%) |
| $2,500 to $2,999 | 19 (2.5%) | 0 (0.0%) |
| $3,000 or more | 11 (1.5%) | 0 (0.0%) |
| Total | 746 (100.0%) | 106 (100.0%) |
Physical Housing Characteristics in La Mesilla
Housing Structures in La Mesilla
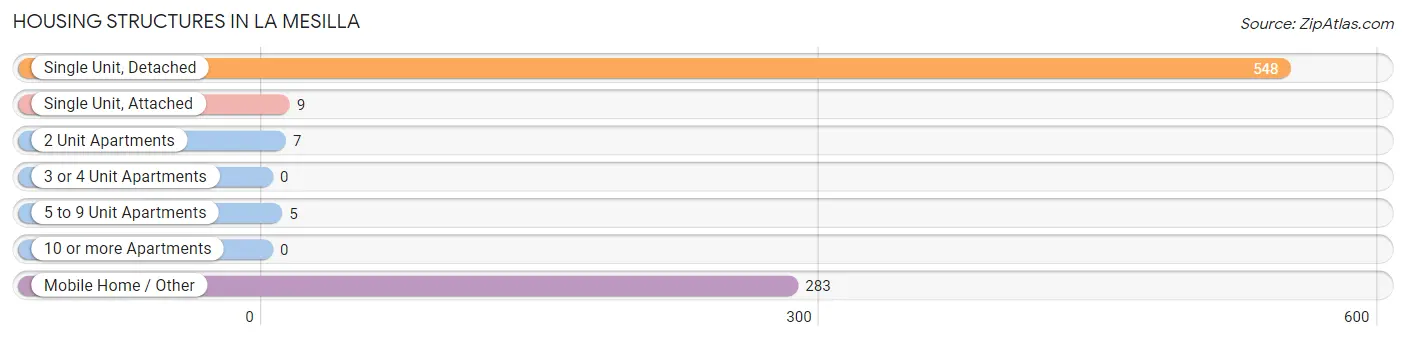
| Structure Type | # Housing Units | % Housing Units |
| Single Unit, Detached | 548 | 64.3% |
| Single Unit, Attached | 9 | 1.1% |
| 2 Unit Apartments | 7 | 0.8% |
| 3 or 4 Unit Apartments | 0 | 0.0% |
| 5 to 9 Unit Apartments | 5 | 0.6% |
| 10 or more Apartments | 0 | 0.0% |
| Mobile Home / Other | 283 | 33.2% |
| Total | 852 | 100.0% |
Housing Structures by Occupancy in La Mesilla
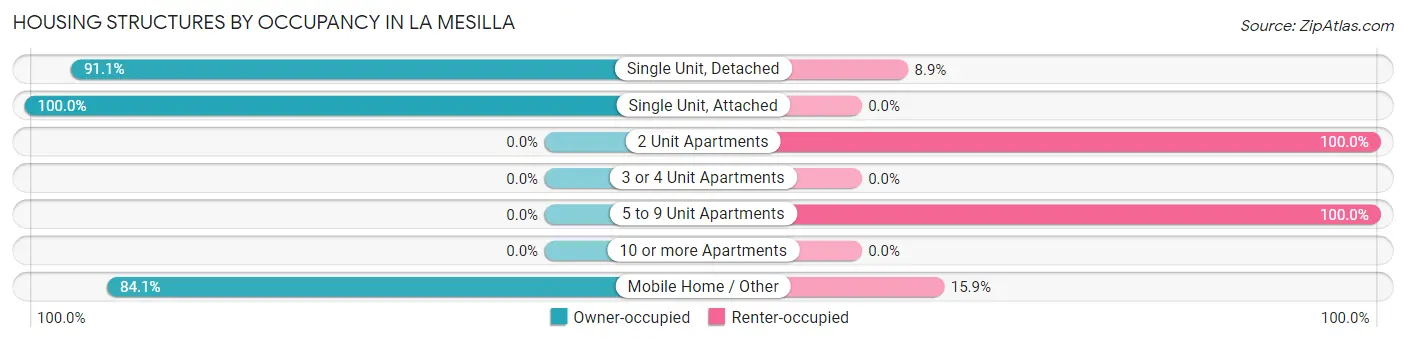
| Structure Type | Owner-occupied | Renter-occupied |
| Single Unit, Detached | 499 (91.1%) | 49 (8.9%) |
| Single Unit, Attached | 9 (100.0%) | 0 (0.0%) |
| 2 Unit Apartments | 0 (0.0%) | 7 (100.0%) |
| 3 or 4 Unit Apartments | 0 (0.0%) | 0 (0.0%) |
| 5 to 9 Unit Apartments | 0 (0.0%) | 5 (100.0%) |
| 10 or more Apartments | 0 (0.0%) | 0 (0.0%) |
| Mobile Home / Other | 238 (84.1%) | 45 (15.9%) |
| Total | 746 (87.6%) | 106 (12.4%) |
Housing Structures by Number of Rooms in La Mesilla
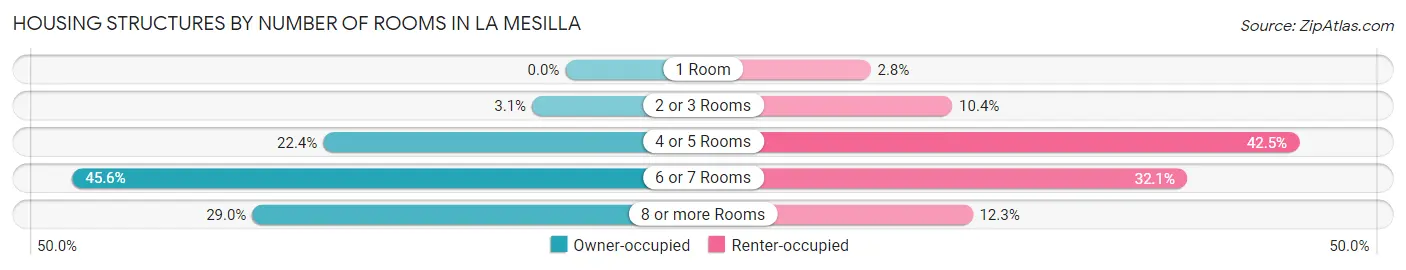
| Number of Rooms | Owner-occupied | Renter-occupied |
| 1 Room | 0 (0.0%) | 3 (2.8%) |
| 2 or 3 Rooms | 23 (3.1%) | 11 (10.4%) |
| 4 or 5 Rooms | 167 (22.4%) | 45 (42.4%) |
| 6 or 7 Rooms | 340 (45.6%) | 34 (32.1%) |
| 8 or more Rooms | 216 (28.9%) | 13 (12.3%) |
| Total | 746 (100.0%) | 106 (100.0%) |
Housing Structure by Heating Type in La Mesilla
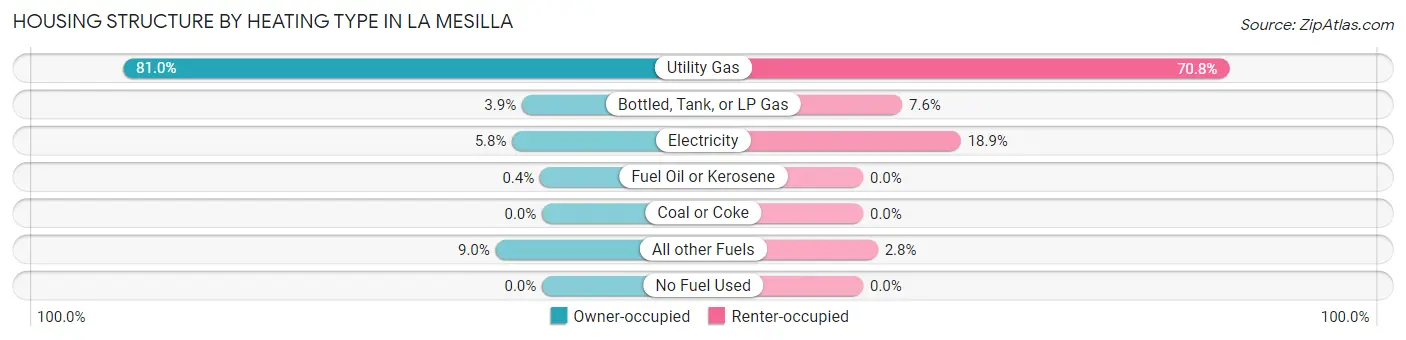
| Heating Type | Owner-occupied | Renter-occupied |
| Utility Gas | 604 (81.0%) | 75 (70.8%) |
| Bottled, Tank, or LP Gas | 29 (3.9%) | 8 (7.5%) |
| Electricity | 43 (5.8%) | 20 (18.9%) |
| Fuel Oil or Kerosene | 3 (0.4%) | 0 (0.0%) |
| Coal or Coke | 0 (0.0%) | 0 (0.0%) |
| All other Fuels | 67 (9.0%) | 3 (2.8%) |
| No Fuel Used | 0 (0.0%) | 0 (0.0%) |
| Total | 746 (100.0%) | 106 (100.0%) |
Household Vehicle Usage in La Mesilla
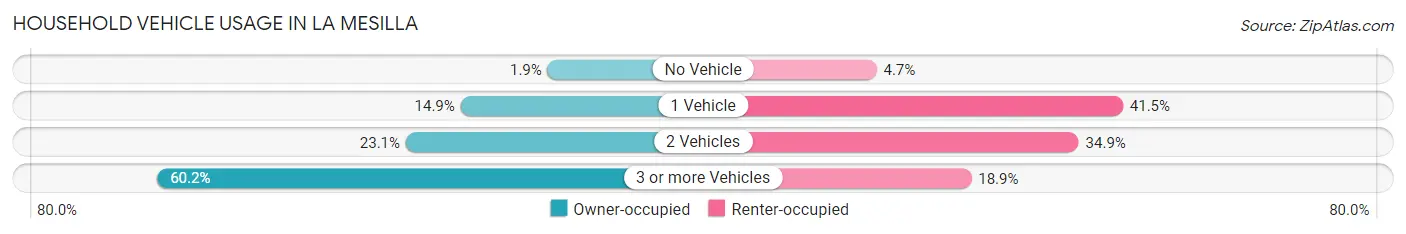
| Vehicles per Household | Owner-occupied | Renter-occupied |
| No Vehicle | 14 (1.9%) | 5 (4.7%) |
| 1 Vehicle | 111 (14.9%) | 44 (41.5%) |
| 2 Vehicles | 172 (23.1%) | 37 (34.9%) |
| 3 or more Vehicles | 449 (60.2%) | 20 (18.9%) |
| Total | 746 (100.0%) | 106 (100.0%) |
Real Estate & Mortgages in La Mesilla
Real Estate and Mortgage Overview in La Mesilla
| Characteristic | Without Mortgage | With Mortgage |
| Housing Units | 403 | 343 |
| Median Property Value | $229,400 | $313,900 |
| Median Household Income | $70,729 | $94 |
| Monthly Housing Costs | $357 | $11 |
| Real Estate Taxes | $1,101 | $28 |
Property Value by Mortgage Status in La Mesilla
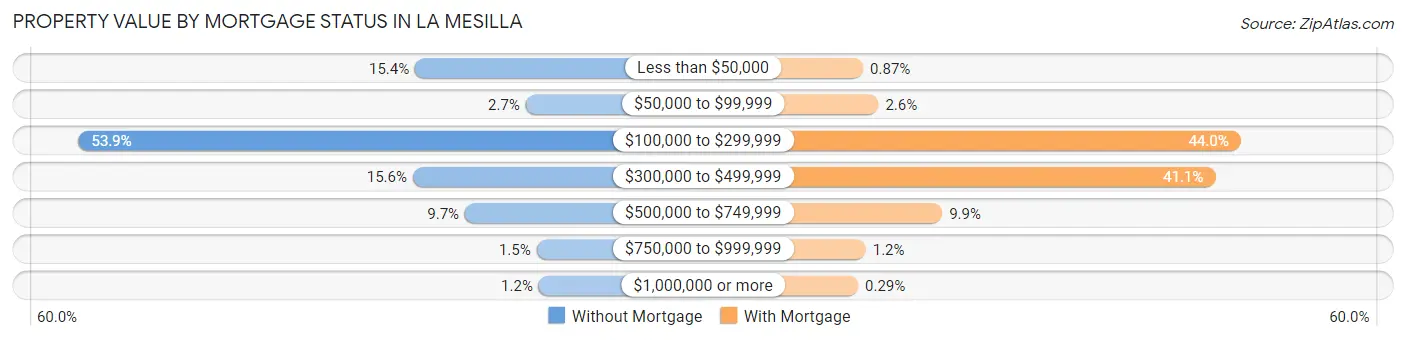
| Property Value | Without Mortgage | With Mortgage |
| Less than $50,000 | 62 (15.4%) | 3 (0.9%) |
| $50,000 to $99,999 | 11 (2.7%) | 9 (2.6%) |
| $100,000 to $299,999 | 217 (53.8%) | 151 (44.0%) |
| $300,000 to $499,999 | 63 (15.6%) | 141 (41.1%) |
| $500,000 to $749,999 | 39 (9.7%) | 34 (9.9%) |
| $750,000 to $999,999 | 6 (1.5%) | 4 (1.2%) |
| $1,000,000 or more | 5 (1.2%) | 1 (0.3%) |
| Total | 403 (100.0%) | 343 (100.0%) |
Household Income by Mortgage Status in La Mesilla
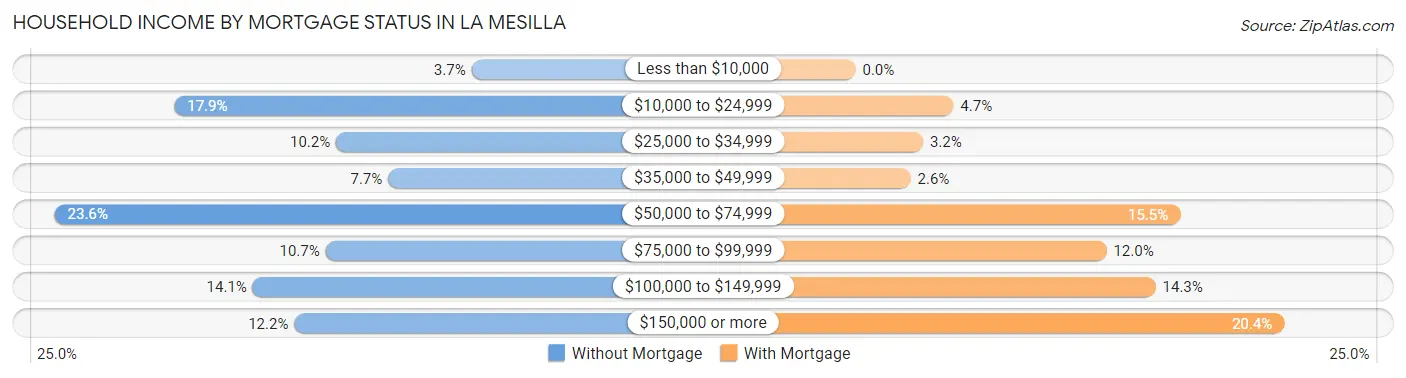
| Household Income | Without Mortgage | With Mortgage |
| Less than $10,000 | 15 (3.7%) | 0 (0.0%) |
| $10,000 to $24,999 | 72 (17.9%) | 16 (4.7%) |
| $25,000 to $34,999 | 41 (10.2%) | 11 (3.2%) |
| $35,000 to $49,999 | 31 (7.7%) | 9 (2.6%) |
| $50,000 to $74,999 | 95 (23.6%) | 53 (15.4%) |
| $75,000 to $99,999 | 43 (10.7%) | 41 (11.9%) |
| $100,000 to $149,999 | 57 (14.1%) | 49 (14.3%) |
| $150,000 or more | 49 (12.2%) | 70 (20.4%) |
| Total | 403 (100.0%) | 343 (100.0%) |
Property Value to Household Income Ratio in La Mesilla
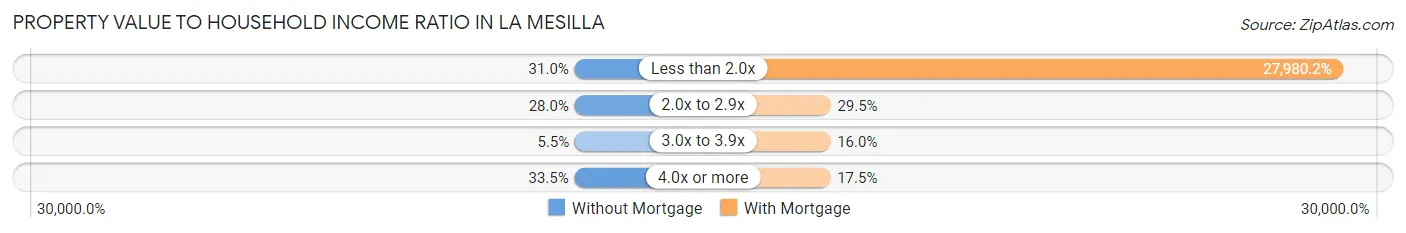
| Value-to-Income Ratio | Without Mortgage | With Mortgage |
| Less than 2.0x | 125 (31.0%) | 95,972 (27,980.2%) |
| 2.0x to 2.9x | 113 (28.0%) | 101 (29.4%) |
| 3.0x to 3.9x | 22 (5.5%) | 55 (16.0%) |
| 4.0x or more | 135 (33.5%) | 60 (17.5%) |
| Total | 403 (100.0%) | 343 (100.0%) |
Real Estate Taxes by Mortgage Status in La Mesilla

| Property Taxes | Without Mortgage | With Mortgage |
| Less than $800 | 56 (13.9%) | 6 (1.8%) |
| $800 to $1,499 | 172 (42.7%) | 24 (7.0%) |
| $800 to $1,499 | 113 (28.0%) | 137 (39.9%) |
| Total | 403 (100.0%) | 343 (100.0%) |
Health & Disability in La Mesilla
Health Insurance Coverage by Age in La Mesilla
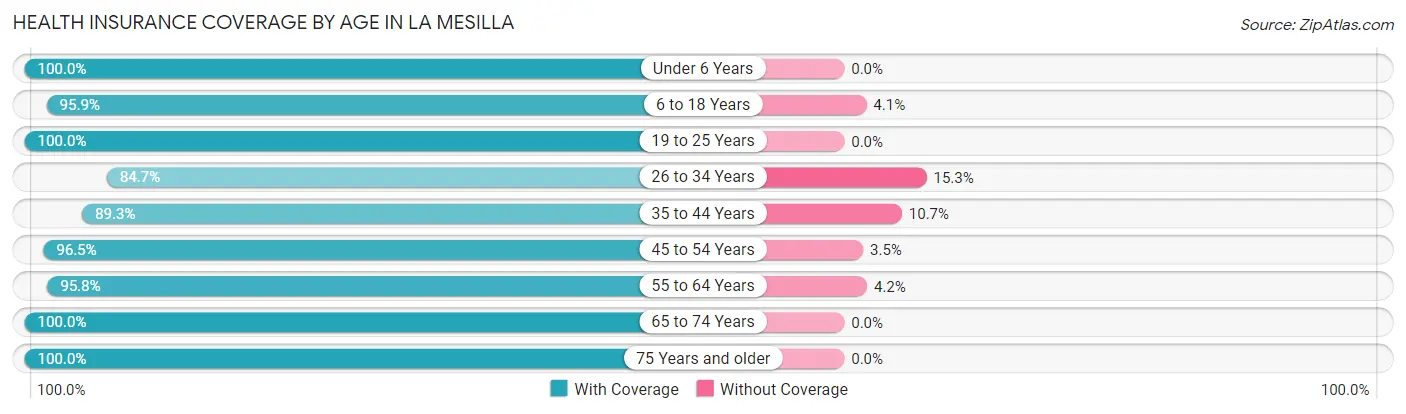
| Age Bracket | With Coverage | Without Coverage |
| Under 6 Years | 189 (100.0%) | 0 (0.0%) |
| 6 to 18 Years | 489 (95.9%) | 21 (4.1%) |
| 19 to 25 Years | 129 (100.0%) | 0 (0.0%) |
| 26 to 34 Years | 160 (84.7%) | 29 (15.3%) |
| 35 to 44 Years | 283 (89.3%) | 34 (10.7%) |
| 45 to 54 Years | 302 (96.5%) | 11 (3.5%) |
| 55 to 64 Years | 361 (95.8%) | 16 (4.2%) |
| 65 to 74 Years | 259 (100.0%) | 0 (0.0%) |
| 75 Years and older | 173 (100.0%) | 0 (0.0%) |
| Total | 2,345 (95.5%) | 111 (4.5%) |
Health Insurance Coverage by Citizenship Status in La Mesilla

| Citizenship Status | With Coverage | Without Coverage |
| Native Born | 189 (100.0%) | 0 (0.0%) |
| Foreign Born, Citizen | 489 (95.9%) | 21 (4.1%) |
| Foreign Born, not a Citizen | 129 (100.0%) | 0 (0.0%) |
Health Insurance Coverage by Household Income in La Mesilla
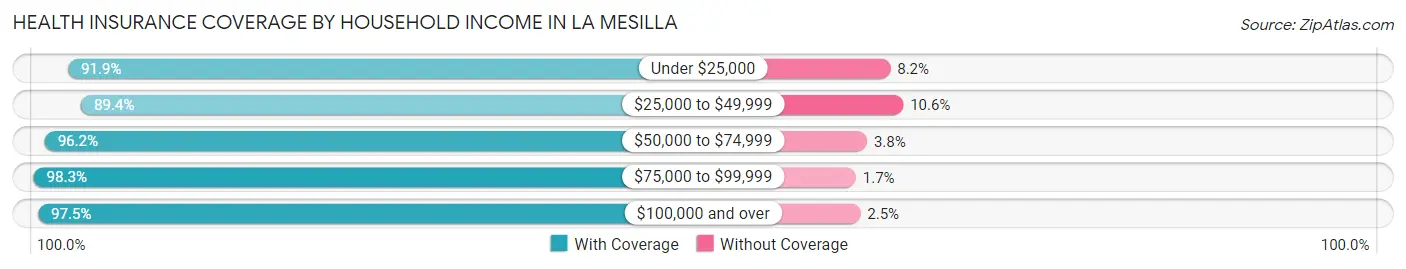
| Household Income | With Coverage | Without Coverage |
| Under $25,000 | 214 (91.8%) | 19 (8.2%) |
| $25,000 to $49,999 | 364 (89.4%) | 43 (10.6%) |
| $50,000 to $74,999 | 484 (96.2%) | 19 (3.8%) |
| $75,000 to $99,999 | 347 (98.3%) | 6 (1.7%) |
| $100,000 and over | 922 (97.5%) | 24 (2.5%) |
Public vs Private Health Insurance Coverage by Age in La Mesilla
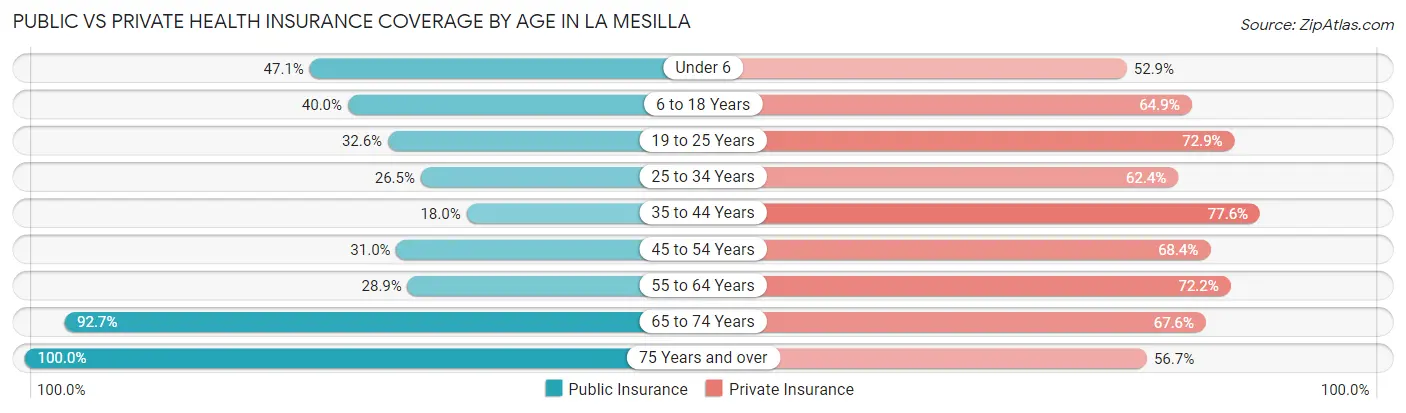
| Age Bracket | Public Insurance | Private Insurance |
| Under 6 | 89 (47.1%) | 100 (52.9%) |
| 6 to 18 Years | 204 (40.0%) | 331 (64.9%) |
| 19 to 25 Years | 42 (32.6%) | 94 (72.9%) |
| 25 to 34 Years | 50 (26.5%) | 118 (62.4%) |
| 35 to 44 Years | 57 (18.0%) | 246 (77.6%) |
| 45 to 54 Years | 97 (31.0%) | 214 (68.4%) |
| 55 to 64 Years | 109 (28.9%) | 272 (72.2%) |
| 65 to 74 Years | 240 (92.7%) | 175 (67.6%) |
| 75 Years and over | 173 (100.0%) | 98 (56.7%) |
| Total | 1,061 (43.2%) | 1,648 (67.1%) |
Disability Status by Sex by Age in La Mesilla
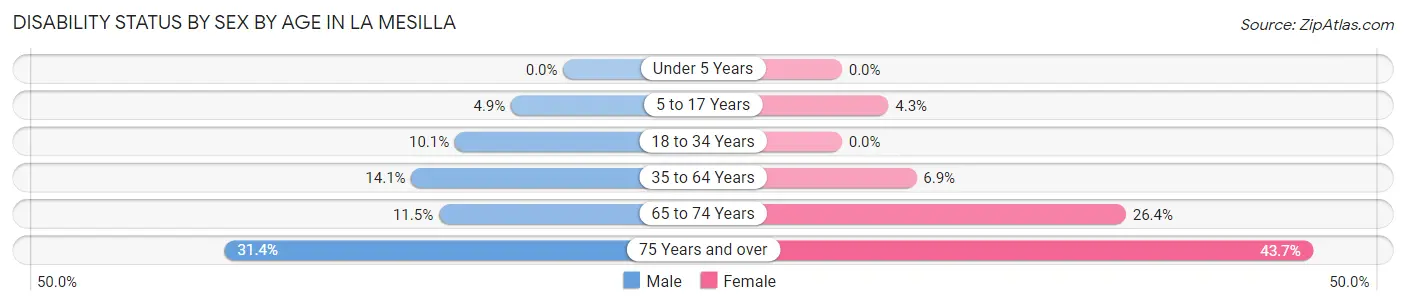
| Age Bracket | Male | Female |
| Under 5 Years | 0 (0.0%) | 0 (0.0%) |
| 5 to 17 Years | 16 (4.9%) | 7 (4.3%) |
| 18 to 34 Years | 22 (10.1%) | 0 (0.0%) |
| 35 to 64 Years | 87 (14.1%) | 27 (6.9%) |
| 65 to 74 Years | 15 (11.5%) | 34 (26.4%) |
| 75 Years and over | 22 (31.4%) | 45 (43.7%) |
Disability Class by Sex by Age in La Mesilla
Disability Class: Hearing Difficulty
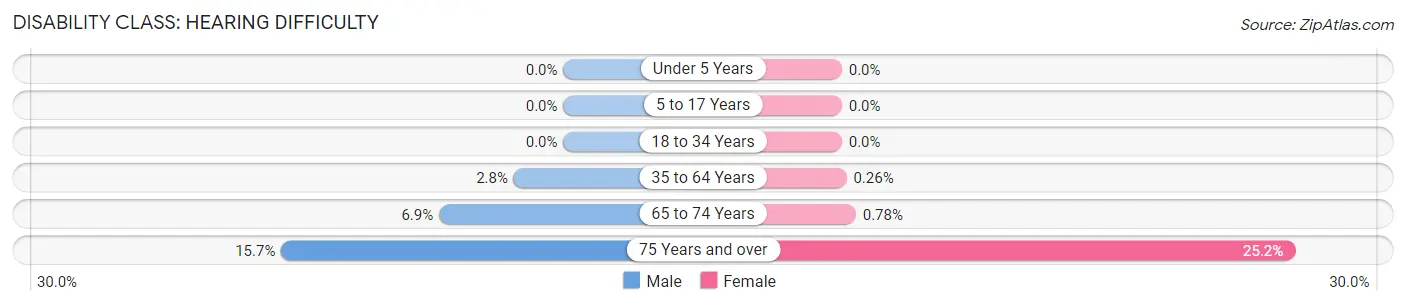
| Age Bracket | Male | Female |
| Under 5 Years | 0 (0.0%) | 0 (0.0%) |
| 5 to 17 Years | 0 (0.0%) | 0 (0.0%) |
| 18 to 34 Years | 0 (0.0%) | 0 (0.0%) |
| 35 to 64 Years | 17 (2.8%) | 1 (0.3%) |
| 65 to 74 Years | 9 (6.9%) | 1 (0.8%) |
| 75 Years and over | 11 (15.7%) | 26 (25.2%) |
Disability Class: Vision Difficulty
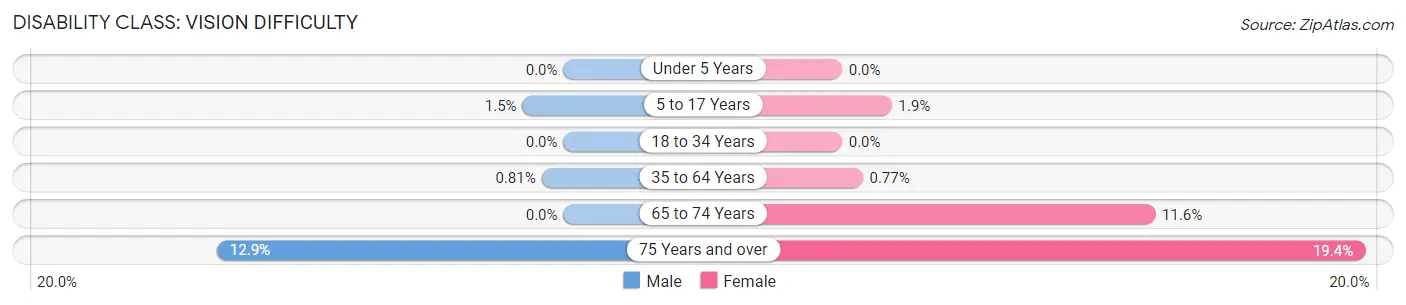
| Age Bracket | Male | Female |
| Under 5 Years | 0 (0.0%) | 0 (0.0%) |
| 5 to 17 Years | 5 (1.5%) | 3 (1.8%) |
| 18 to 34 Years | 0 (0.0%) | 0 (0.0%) |
| 35 to 64 Years | 5 (0.8%) | 3 (0.8%) |
| 65 to 74 Years | 0 (0.0%) | 15 (11.6%) |
| 75 Years and over | 9 (12.9%) | 20 (19.4%) |
Disability Class: Cognitive Difficulty
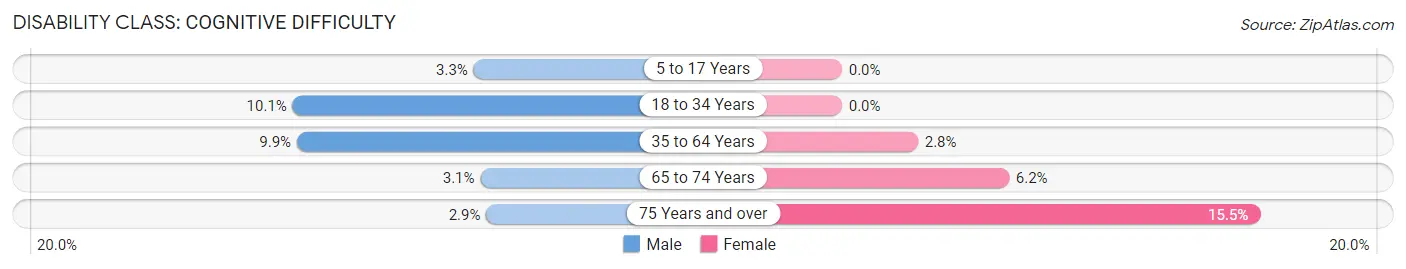
| Age Bracket | Male | Female |
| 5 to 17 Years | 11 (3.3%) | 0 (0.0%) |
| 18 to 34 Years | 22 (10.1%) | 0 (0.0%) |
| 35 to 64 Years | 61 (9.9%) | 11 (2.8%) |
| 65 to 74 Years | 4 (3.1%) | 8 (6.2%) |
| 75 Years and over | 2 (2.9%) | 16 (15.5%) |
Disability Class: Ambulatory Difficulty
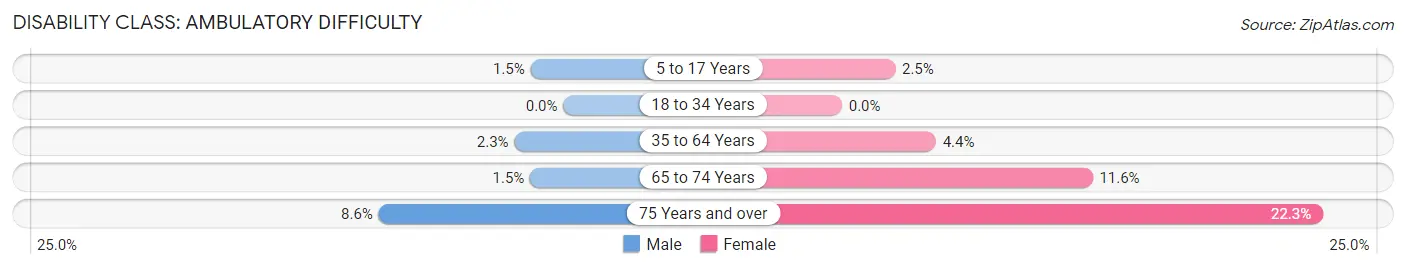
| Age Bracket | Male | Female |
| 5 to 17 Years | 5 (1.5%) | 4 (2.5%) |
| 18 to 34 Years | 0 (0.0%) | 0 (0.0%) |
| 35 to 64 Years | 14 (2.3%) | 17 (4.4%) |
| 65 to 74 Years | 2 (1.5%) | 15 (11.6%) |
| 75 Years and over | 6 (8.6%) | 23 (22.3%) |
Disability Class: Self-Care Difficulty
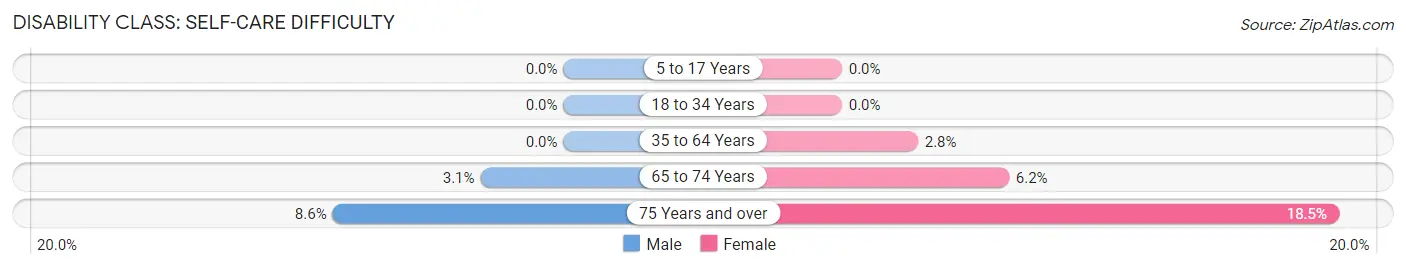
| Age Bracket | Male | Female |
| 5 to 17 Years | 0 (0.0%) | 0 (0.0%) |
| 18 to 34 Years | 0 (0.0%) | 0 (0.0%) |
| 35 to 64 Years | 0 (0.0%) | 11 (2.8%) |
| 65 to 74 Years | 4 (3.1%) | 8 (6.2%) |
| 75 Years and over | 6 (8.6%) | 19 (18.4%) |
Technology Access in La Mesilla
Computing Device Access in La Mesilla
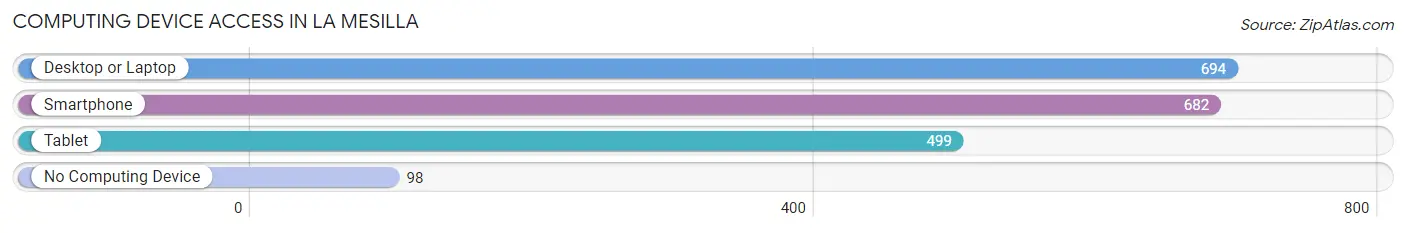
| Device Type | # Households | % Households |
| Desktop or Laptop | 694 | 81.5% |
| Smartphone | 682 | 80.0% |
| Tablet | 499 | 58.6% |
| No Computing Device | 98 | 11.5% |
| Total | 852 | 100.0% |
Internet Access in La Mesilla
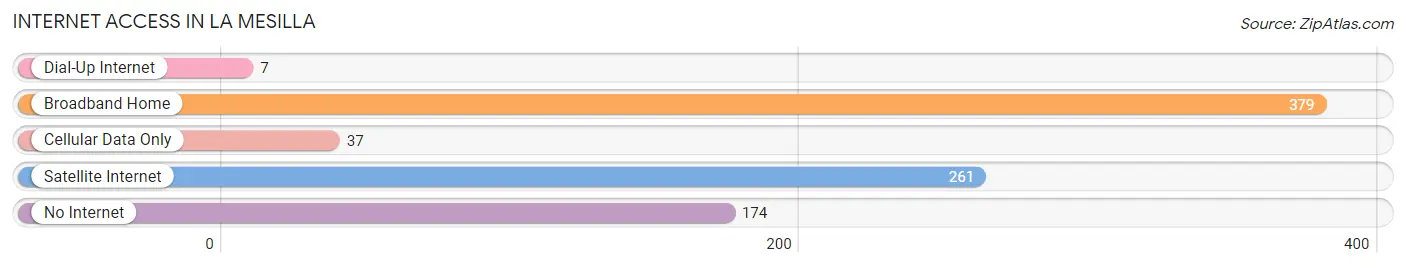
| Internet Type | # Households | % Households |
| Dial-Up Internet | 7 | 0.8% |
| Broadband Home | 379 | 44.5% |
| Cellular Data Only | 37 | 4.3% |
| Satellite Internet | 261 | 30.6% |
| No Internet | 174 | 20.4% |
| Total | 852 | 100.0% |
La Mesilla Summary
Mesilla, New Mexico is a small town located in the southern part of the state, just outside of Las Cruces. It is a part of Doña Ana County and is located in the Mesilla Valley. The town has a population of 2,196 people, according to the 2010 census.
History
Mesilla was founded in 1848, when the Treaty of Guadalupe Hidalgo was signed, ending the Mexican-American War. The treaty granted the United States control of the area, and the town was established as a Mexican settlement. The town was originally called La Mesilla, which means “the little table” in Spanish. The name was chosen because the town was located at the intersection of two major roads, which resembled a table.
In 1854, the Gadsden Purchase was signed, which gave the United States control of the area. The town was then renamed Mesilla. The town was an important stop on the Butterfield Overland Mail route, which ran from St. Louis to San Francisco.
In 1861, Mesilla became part of the Confederate Territory of Arizona. The town was briefly the capital of the territory, and it was the site of the Battle of Mesilla in 1862. The battle was a Confederate victory, and it was the only major battle of the Civil War to take place in New Mexico.
In 1881, Mesilla was incorporated as a village. The town was a popular stop on the Southern Pacific Railroad, and it was a major trading center for the region. The town was also home to several saloons, gambling halls, and brothels.
Geography
Mesilla is located in the Mesilla Valley, which is part of the Rio Grande Valley. The town is situated at an elevation of 3,912 feet above sea level. The town is located near the Rio Grande, and it is surrounded by the Organ Mountains to the east and the Franklin Mountains to the west.
The climate in Mesilla is semi-arid, with hot summers and mild winters. The average annual temperature is 64°F, and the average annual precipitation is 8.5 inches.
Economy
Mesilla’s economy is largely based on agriculture and tourism. The town is home to several wineries, and it is a popular destination for wine tasting. The town is also home to several restaurants, shops, and art galleries.
The town is also home to several manufacturing companies, including a furniture factory and a metal fabrication plant. The town is also home to a number of government offices, including the Doña Ana County Courthouse.
Demographics
According to the 2010 census, Mesilla has a population of 2,196 people. The town is predominantly Hispanic, with a population that is 77.3% Hispanic, 17.2% White, and 4.5% Native American. The median household income is $30,938, and the median age is 36.7 years.
Mesilla is a small town with a rich history and a vibrant culture. The town is home to a diverse population, and it is a popular destination for tourists. The town is also home to several businesses, and it is a major trading center for the region.
Common Questions
What is Per Capita Income in La Mesilla?
Per Capita income in La Mesilla is $34,781.
What is the Median Family Income in La Mesilla?
Median Family Income in La Mesilla is $76,429.
What is the Median Household income in La Mesilla?
Median Household Income in La Mesilla is $71,473.
What is Income or Wage Gap in La Mesilla?
Income or Wage Gap in La Mesilla is 5.3%.
Women in La Mesilla earn 94.7 cents for every dollar earned by a man.
What is Inequality or Gini Index in La Mesilla?
Inequality or Gini Index in La Mesilla is 0.45.
What is the Total Population of La Mesilla?
Total Population of La Mesilla is 2,456.
What is the Total Male Population of La Mesilla?
Total Male Population of La Mesilla is 1,437.
What is the Total Female Population of La Mesilla?
Total Female Population of La Mesilla is 1,019.
What is the Ratio of Males per 100 Females in La Mesilla?
There are 141.02 Males per 100 Females in La Mesilla.
What is the Ratio of Females per 100 Males in La Mesilla?
There are 70.91 Females per 100 Males in La Mesilla.
What is the Median Population Age in La Mesilla?
Median Population Age in La Mesilla is 41.4 Years.
What is the Average Family Size in La Mesilla
Average Family Size in La Mesilla is 3.7 People.
What is the Average Household Size in La Mesilla
Average Household Size in La Mesilla is 2.9 People.
How Large is the Labor Force in La Mesilla?
There are 1,054 People in the Labor Forcein in La Mesilla.
What is the Percentage of People in the Labor Force in La Mesilla?
56.0% of People are in the Labor Force in La Mesilla.
What is the Unemployment Rate in La Mesilla?
Unemployment Rate in La Mesilla is 2.7%.