Lufkin, TX Map & Demographics
Lufkin Map
Lufkin Overview
$26,904
PER CAPITA INCOME
$67,598
AVG FAMILY INCOME
$57,938
AVG HOUSEHOLD INCOME
34.4%
WAGE / INCOME GAP [ % ]
65.6¢/ $1
WAGE / INCOME GAP [ $ ]
$11,699
FAMILY INCOME DEFICIT
0.45
INEQUALITY / GINI INDEX
34,165
TOTAL POPULATION
16,139
MALE POPULATION
18,026
FEMALE POPULATION
89.53
MALES / 100 FEMALES
111.69
FEMALES / 100 MALES
33.6
MEDIAN AGE
3.3
AVG FAMILY SIZE
2.6
AVG HOUSEHOLD SIZE
16,270
LABOR FORCE [ PEOPLE ]
62.2%
PERCENT IN LABOR FORCE
6.9%
UNEMPLOYMENT RATE
Lufkin Area Codes
Income in Lufkin
Income Overview in Lufkin
Per Capita Income in Lufkin is $26,904, while median incomes of families and households are $67,598 and $57,938 respectively.
| Characteristic | Number | Measure |
| Per Capita Income | 34,165 | $26,904 |
| Median Family Income | 8,109 | $67,598 |
| Mean Family Income | 8,109 | $83,285 |
| Median Household Income | 12,544 | $57,938 |
| Mean Household Income | 12,544 | $71,243 |
| Income Deficit | 8,109 | $11,699 |
| Wage / Income Gap (%) | 34,165 | 34.44% |
| Wage / Income Gap ($) | 34,165 | 65.56¢ per $1 |
| Gini / Inequality Index | 34,165 | 0.45 |
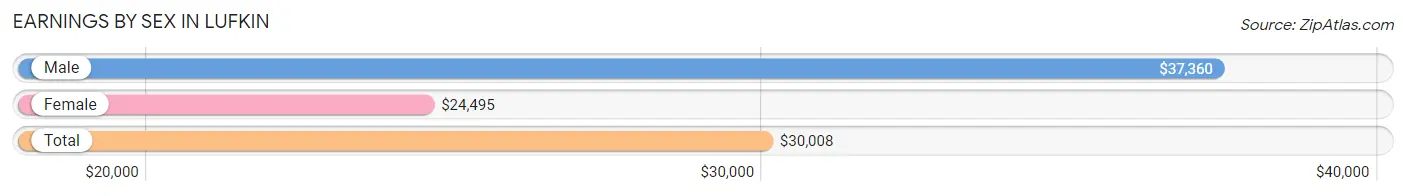
Earnings by Sex in Lufkin
Average Earnings in Lufkin are $30,008, $37,360 for men and $24,495 for women, a difference of 34.4%.
| Sex | Number | Average Earnings |
| Male | 8,525 (50.8%) | $37,360 |
| Female | 8,262 (49.2%) | $24,495 |
| Total | 16,787 (100.0%) | $30,008 |
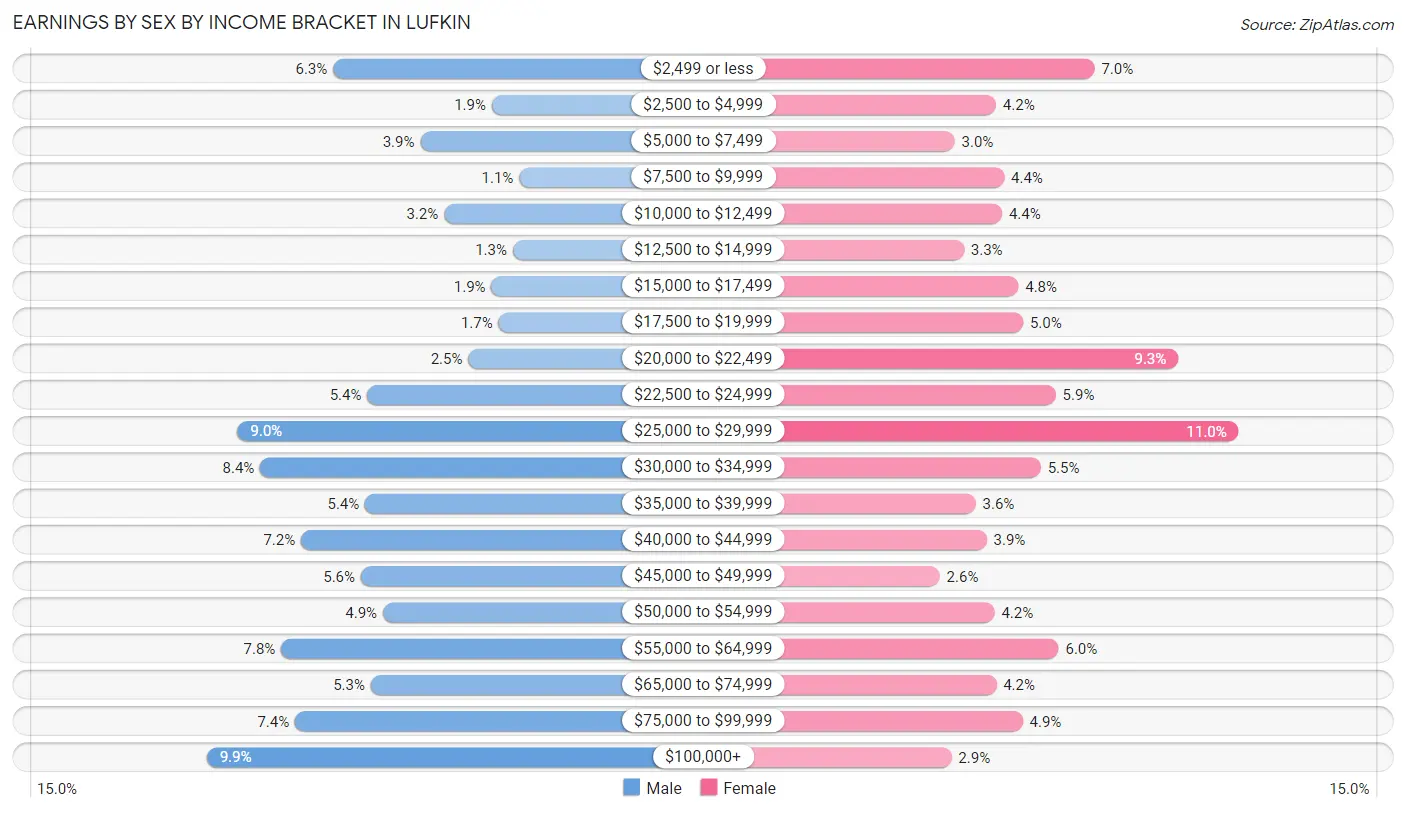
Earnings by Sex by Income Bracket in Lufkin
The most common earnings brackets in Lufkin are $100,000+ for men (842 | 9.9%) and $25,000 to $29,999 for women (910 | 11.0%).
| Income | Male | Female |
| $2,499 or less | 540 (6.3%) | 575 (7.0%) |
| $2,500 to $4,999 | 159 (1.9%) | 346 (4.2%) |
| $5,000 to $7,499 | 331 (3.9%) | 250 (3.0%) |
| $7,500 to $9,999 | 94 (1.1%) | 365 (4.4%) |
| $10,000 to $12,499 | 274 (3.2%) | 360 (4.4%) |
| $12,500 to $14,999 | 109 (1.3%) | 272 (3.3%) |
| $15,000 to $17,499 | 160 (1.9%) | 398 (4.8%) |
| $17,500 to $19,999 | 143 (1.7%) | 409 (5.0%) |
| $20,000 to $22,499 | 216 (2.5%) | 769 (9.3%) |
| $22,500 to $24,999 | 458 (5.4%) | 485 (5.9%) |
| $25,000 to $29,999 | 769 (9.0%) | 910 (11.0%) |
| $30,000 to $34,999 | 714 (8.4%) | 450 (5.4%) |
| $35,000 to $39,999 | 463 (5.4%) | 299 (3.6%) |
| $40,000 to $44,999 | 616 (7.2%) | 325 (3.9%) |
| $45,000 to $49,999 | 473 (5.6%) | 216 (2.6%) |
| $50,000 to $54,999 | 420 (4.9%) | 343 (4.2%) |
| $55,000 to $64,999 | 664 (7.8%) | 492 (5.9%) |
| $65,000 to $74,999 | 449 (5.3%) | 347 (4.2%) |
| $75,000 to $99,999 | 631 (7.4%) | 408 (4.9%) |
| $100,000+ | 842 (9.9%) | 243 (2.9%) |
| Total | 8,525 (100.0%) | 8,262 (100.0%) |
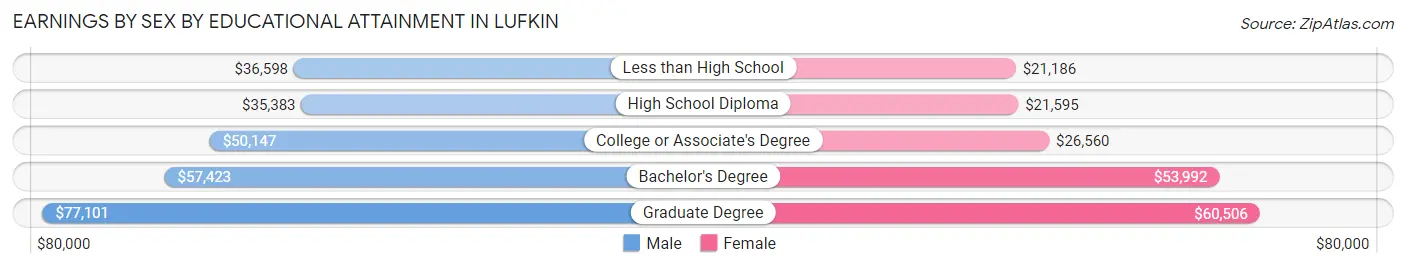
Earnings by Sex by Educational Attainment in Lufkin
Average earnings in Lufkin are $44,795 for men and $27,503 for women, a difference of 38.6%. Men with an educational attainment of graduate degree enjoy the highest average annual earnings of $77,101, while those with high school diploma education earn the least with $35,383. Women with an educational attainment of graduate degree earn the most with the average annual earnings of $60,506, while those with less than high school education have the smallest earnings of $21,186.
| Educational Attainment | Male Income | Female Income |
| Less than High School | $36,598 | $21,186 |
| High School Diploma | $35,383 | $21,595 |
| College or Associate's Degree | $50,147 | $26,560 |
| Bachelor's Degree | $57,423 | $53,992 |
| Graduate Degree | $77,101 | $60,506 |
| Total | $44,795 | $27,503 |
Family Income in Lufkin
Family Income Brackets in Lufkin
According to the Lufkin family income data, there are 1,995 families falling into the $50,000 to $74,999 income range, which is the most common income bracket and makes up 24.6% of all families. Conversely, the $10,000 to $14,999 income bracket is the least frequent group with only 178 families (2.2%) belonging to this category.
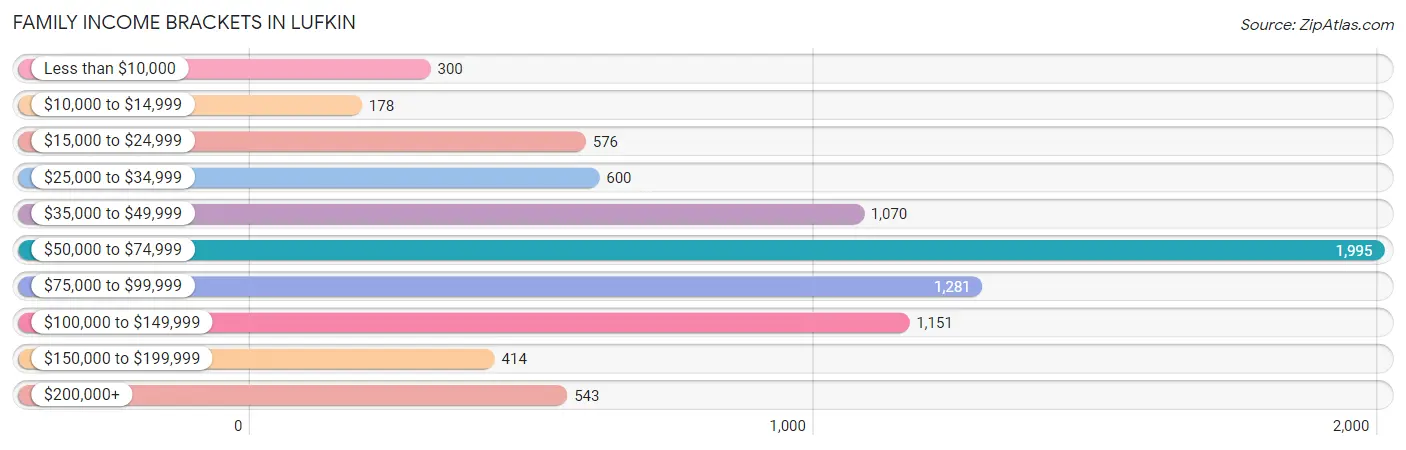
| Income Bracket | # Families | % Families |
| Less than $10,000 | 300 | 3.7% |
| $10,000 to $14,999 | 178 | 2.2% |
| $15,000 to $24,999 | 576 | 7.1% |
| $25,000 to $34,999 | 600 | 7.4% |
| $35,000 to $49,999 | 1,070 | 13.2% |
| $50,000 to $74,999 | 1,995 | 24.6% |
| $75,000 to $99,999 | 1,281 | 15.8% |
| $100,000 to $149,999 | 1,151 | 14.2% |
| $150,000 to $199,999 | 414 | 5.1% |
| $200,000+ | 543 | 6.7% |
Family Income by Famaliy Size in Lufkin
3-person families (2,009 | 24.8%) account for the highest median family income in Lufkin with $77,856 per family, while 2-person families (3,350 | 41.3%) have the highest median income of $28,636 per family member.
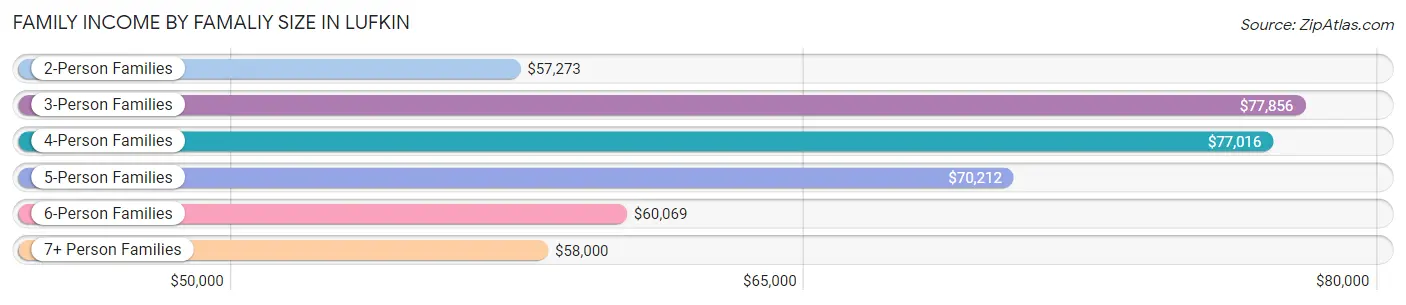
| Income Bracket | # Families | Median Income |
| 2-Person Families | 3,350 (41.3%) | $57,273 |
| 3-Person Families | 2,009 (24.8%) | $77,856 |
| 4-Person Families | 1,090 (13.4%) | $77,016 |
| 5-Person Families | 961 (11.8%) | $70,212 |
| 6-Person Families | 513 (6.3%) | $60,069 |
| 7+ Person Families | 186 (2.3%) | $58,000 |
| Total | 8,109 (100.0%) | $67,598 |
Family Income by Number of Earners in Lufkin
The median family income in Lufkin is $67,598, with families comprising 3+ earners (987) having the highest median family income of $105,856, while families with no earners (1,258) have the lowest median family income of $36,607, accounting for 12.2% and 15.5% of families, respectively.
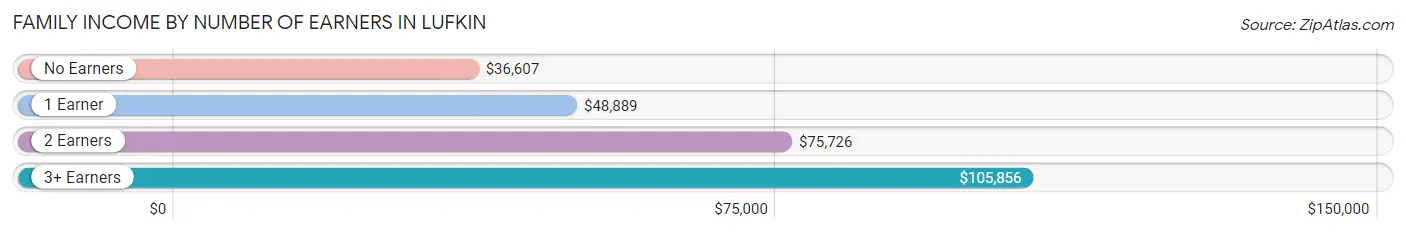
| Number of Earners | # Families | Median Income |
| No Earners | 1,258 (15.5%) | $36,607 |
| 1 Earner | 2,426 (29.9%) | $48,889 |
| 2 Earners | 3,438 (42.4%) | $75,726 |
| 3+ Earners | 987 (12.2%) | $105,856 |
| Total | 8,109 (100.0%) | $67,598 |
Household Income in Lufkin
Household Income Brackets in Lufkin
With 2,597 households falling in the category, the $50,000 to $74,999 income range is the most frequent in Lufkin, accounting for 20.7% of all households. In contrast, only 527 households (4.2%) fall into the $150,000 to $199,999 income bracket, making it the least populous group.
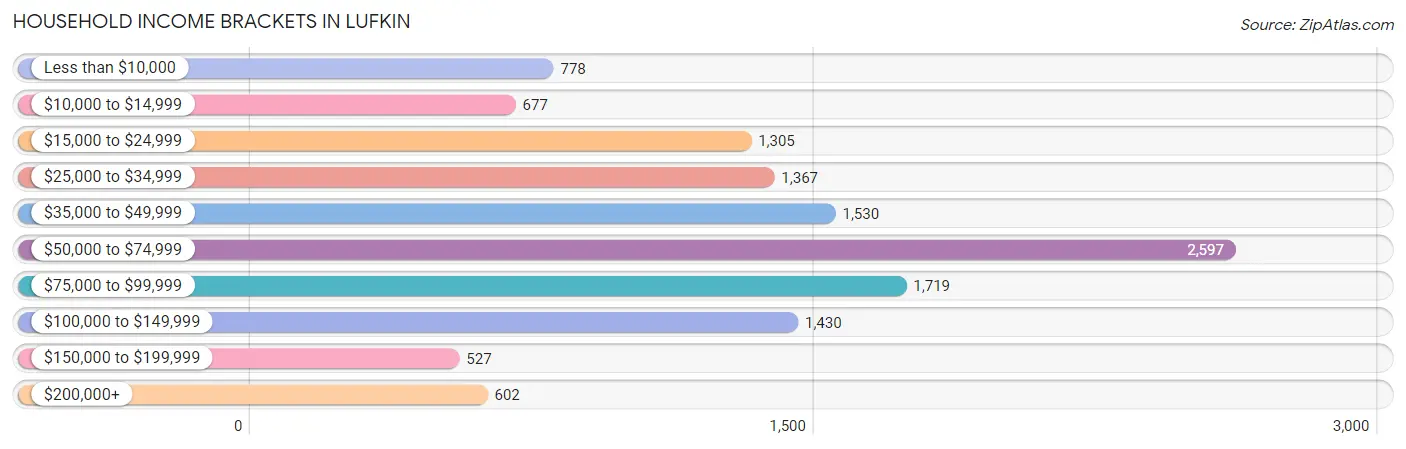
| Income Bracket | # Households | % Households |
| Less than $10,000 | 778 | 6.2% |
| $10,000 to $14,999 | 677 | 5.4% |
| $15,000 to $24,999 | 1,305 | 10.4% |
| $25,000 to $34,999 | 1,367 | 10.9% |
| $35,000 to $49,999 | 1,530 | 12.2% |
| $50,000 to $74,999 | 2,597 | 20.7% |
| $75,000 to $99,999 | 1,719 | 13.7% |
| $100,000 to $149,999 | 1,430 | 11.4% |
| $150,000 to $199,999 | 527 | 4.2% |
| $200,000+ | 602 | 4.8% |
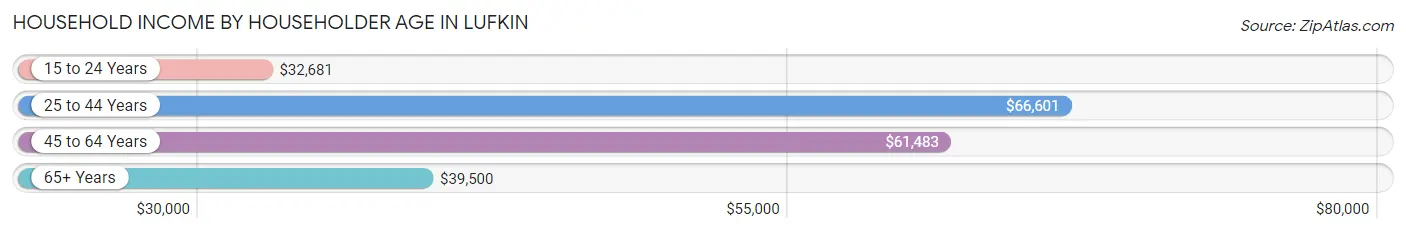
Household Income by Householder Age in Lufkin
The median household income in Lufkin is $57,938, with the highest median household income of $66,601 found in the 25 to 44 years age bracket for the primary householder. A total of 4,289 households (34.2%) fall into this category. Meanwhile, the 15 to 24 years age bracket for the primary householder has the lowest median household income of $32,681, with 931 households (7.4%) in this group.
| Income Bracket | # Households | Median Income |
| 15 to 24 Years | 931 (7.4%) | $32,681 |
| 25 to 44 Years | 4,289 (34.2%) | $66,601 |
| 45 to 64 Years | 4,502 (35.9%) | $61,483 |
| 65+ Years | 2,822 (22.5%) | $39,500 |
| Total | 12,544 (100.0%) | $57,938 |
Poverty in Lufkin
Income Below Poverty by Sex and Age in Lufkin
With 16.6% poverty level for males and 19.3% for females among the residents of Lufkin, 15 year old males and 5 year old females are the most vulnerable to poverty, with 104 males (35.0%) and 98 females (39.4%) in their respective age groups living below the poverty level.
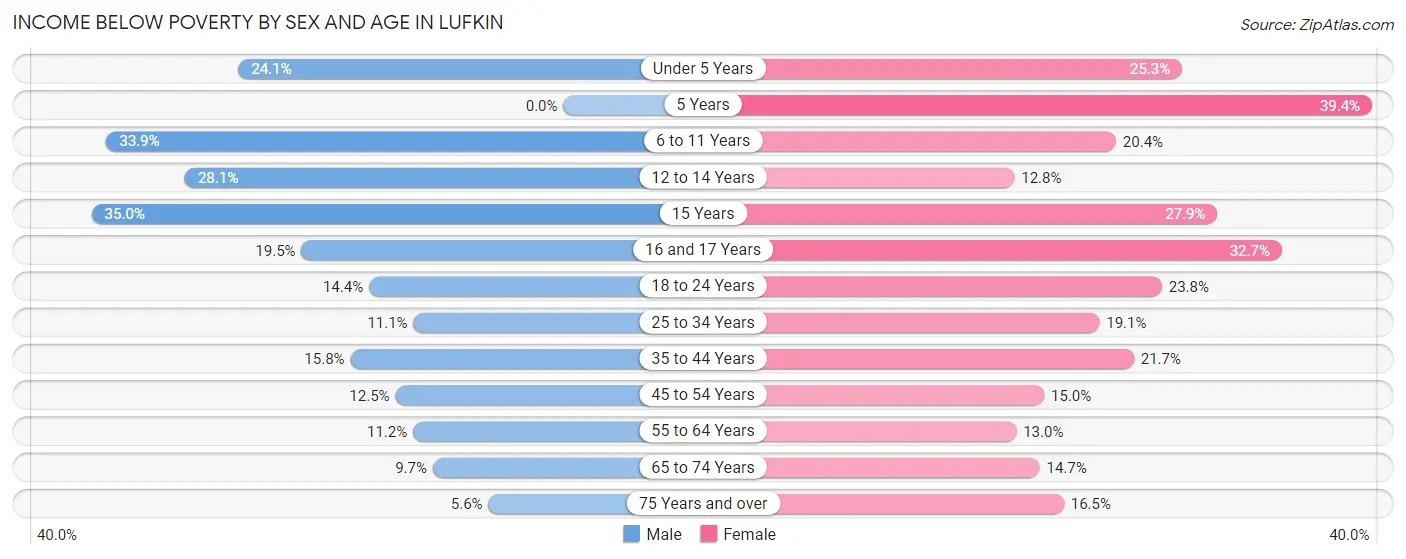
| Age Bracket | Male | Female |
| Under 5 Years | 228 (24.1%) | 317 (25.3%) |
| 5 Years | 0 (0.0%) | 98 (39.4%) |
| 6 to 11 Years | 590 (33.9%) | 306 (20.3%) |
| 12 to 14 Years | 209 (28.1%) | 73 (12.8%) |
| 15 Years | 104 (35.0%) | 109 (27.9%) |
| 16 and 17 Years | 113 (19.5%) | 145 (32.7%) |
| 18 to 24 Years | 238 (14.4%) | 365 (23.8%) |
| 25 to 34 Years | 266 (11.1%) | 489 (19.1%) |
| 35 to 44 Years | 285 (15.8%) | 467 (21.7%) |
| 45 to 54 Years | 233 (12.5%) | 265 (15.0%) |
| 55 to 64 Years | 177 (11.2%) | 289 (13.0%) |
| 65 to 74 Years | 106 (9.7%) | 210 (14.7%) |
| 75 Years and over | 39 (5.6%) | 219 (16.5%) |
| Total | 2,588 (16.6%) | 3,352 (19.3%) |
Income Above Poverty by Sex and Age in Lufkin
According to the poverty statistics in Lufkin, males aged 5 years and females aged 12 to 14 years are the age groups that are most secure financially, with 100.0% of males and 87.2% of females in these age groups living above the poverty line.
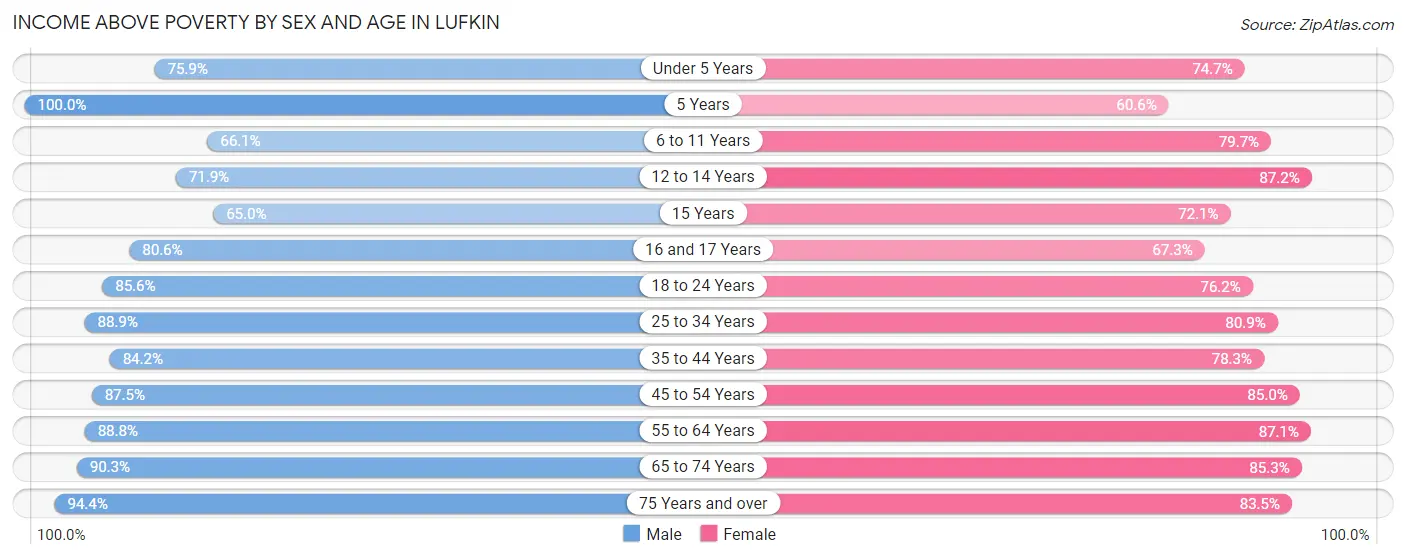
| Age Bracket | Male | Female |
| Under 5 Years | 717 (75.9%) | 938 (74.7%) |
| 5 Years | 190 (100.0%) | 151 (60.6%) |
| 6 to 11 Years | 1,149 (66.1%) | 1,198 (79.6%) |
| 12 to 14 Years | 535 (71.9%) | 497 (87.2%) |
| 15 Years | 193 (65.0%) | 282 (72.1%) |
| 16 and 17 Years | 468 (80.5%) | 299 (67.3%) |
| 18 to 24 Years | 1,411 (85.6%) | 1,171 (76.2%) |
| 25 to 34 Years | 2,124 (88.9%) | 2,068 (80.9%) |
| 35 to 44 Years | 1,518 (84.2%) | 1,687 (78.3%) |
| 45 to 54 Years | 1,636 (87.5%) | 1,499 (85.0%) |
| 55 to 64 Years | 1,409 (88.8%) | 1,942 (87.1%) |
| 65 to 74 Years | 988 (90.3%) | 1,221 (85.3%) |
| 75 Years and over | 663 (94.4%) | 1,110 (83.5%) |
| Total | 13,001 (83.4%) | 14,063 (80.7%) |
Income Below Poverty Among Married-Couple Families in Lufkin
The poverty statistics for married-couple families in Lufkin show that 6.1% or 320 of the total 5,233 families live below the poverty line. Families with 5 or more children have the highest poverty rate of 100.0%, comprising of 71 families. On the other hand, families with 1 or 2 children have the lowest poverty rate of 1.8%, which includes 33 families.
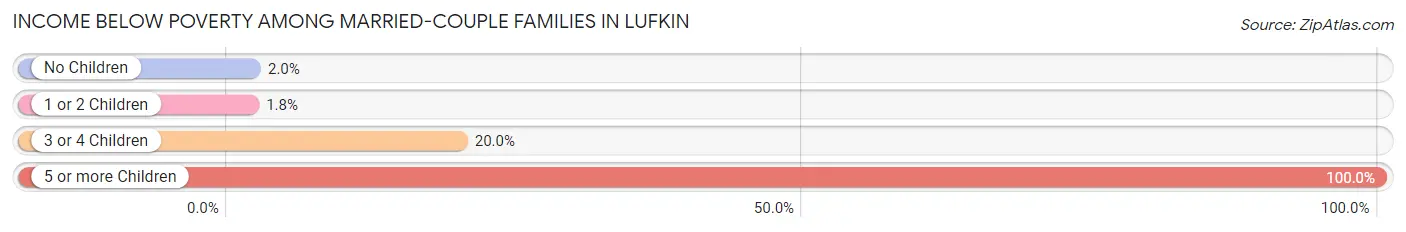
| Children | Above Poverty | Below Poverty |
| No Children | 2,494 (98.0%) | 51 (2.0%) |
| 1 or 2 Children | 1,759 (98.2%) | 33 (1.8%) |
| 3 or 4 Children | 660 (80.0%) | 165 (20.0%) |
| 5 or more Children | 0 (0.0%) | 71 (100.0%) |
| Total | 4,913 (93.9%) | 320 (6.1%) |
Income Below Poverty Among Single-Parent Households in Lufkin
According to the poverty data in Lufkin, 11.7% or 62 single-father households and 26.8% or 630 single-mother households are living below the poverty line. Among single-father households, those with 1 or 2 children have the highest poverty rate, with 53 households (23.3%) experiencing poverty. Likewise, among single-mother households, those with 3 or 4 children have the highest poverty rate, with 136 households (56.7%) falling below the poverty line.
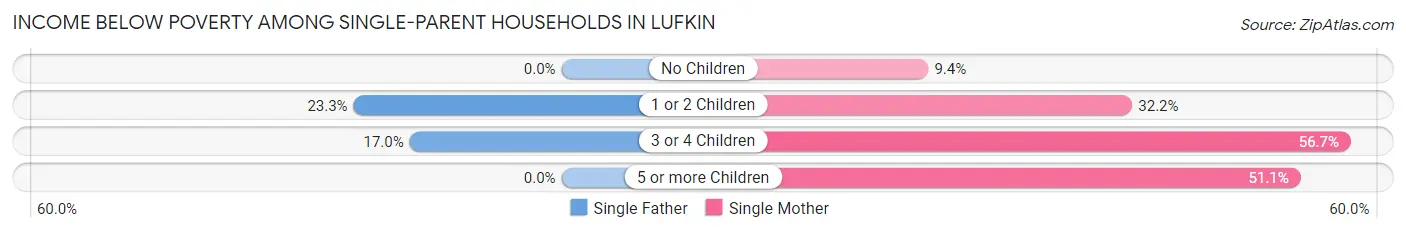
| Children | Single Father | Single Mother |
| No Children | 0 (0.0%) | 79 (9.4%) |
| 1 or 2 Children | 53 (23.3%) | 391 (32.2%) |
| 3 or 4 Children | 9 (17.0%) | 136 (56.7%) |
| 5 or more Children | 0 (0.0%) | 24 (51.1%) |
| Total | 62 (11.7%) | 630 (26.8%) |
Income Below Poverty Among Married-Couple vs Single-Parent Households in Lufkin
The poverty data for Lufkin shows that 320 of the married-couple family households (6.1%) and 692 of the single-parent households (24.1%) are living below the poverty level. Within the married-couple family households, those with 5 or more children have the highest poverty rate, with 71 households (100.0%) falling below the poverty line. Among the single-parent households, those with 5 or more children have the highest poverty rate, with 24 household (51.1%) living below poverty.
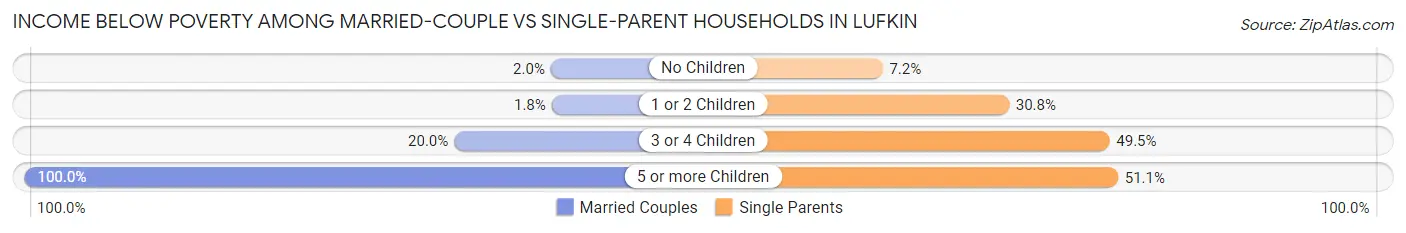
| Children | Married-Couple Families | Single-Parent Households |
| No Children | 51 (2.0%) | 79 (7.2%) |
| 1 or 2 Children | 33 (1.8%) | 444 (30.7%) |
| 3 or 4 Children | 165 (20.0%) | 145 (49.5%) |
| 5 or more Children | 71 (100.0%) | 24 (51.1%) |
| Total | 320 (6.1%) | 692 (24.1%) |
Race in Lufkin
The most populous races in Lufkin are White / Caucasian (20,341 | 59.5%), Hispanic or Latino (11,515 | 33.7%), and Black / African American (6,306 | 18.5%).
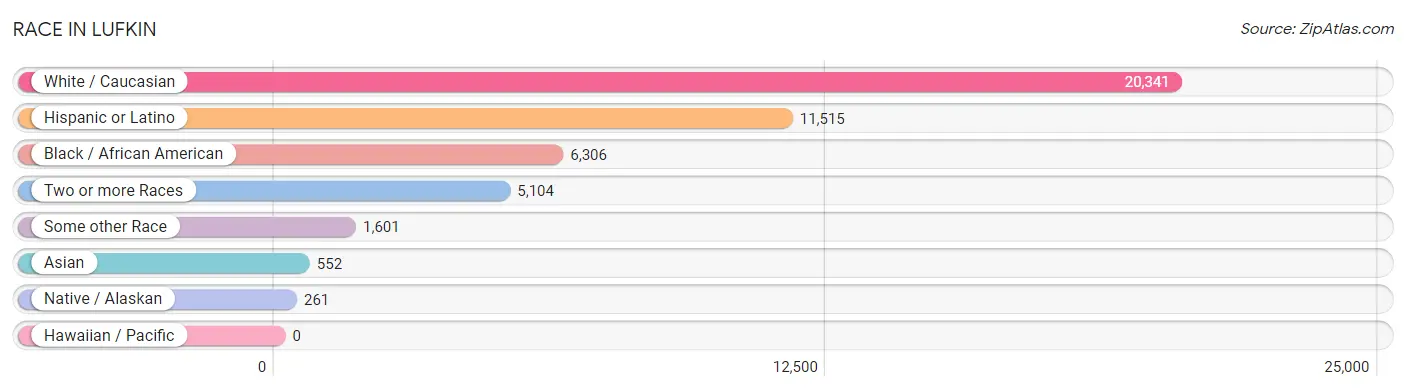
| Race | # Population | % Population |
| Asian | 552 | 1.6% |
| Black / African American | 6,306 | 18.5% |
| Hawaiian / Pacific | 0 | 0.0% |
| Hispanic or Latino | 11,515 | 33.7% |
| Native / Alaskan | 261 | 0.8% |
| White / Caucasian | 20,341 | 59.5% |
| Two or more Races | 5,104 | 14.9% |
| Some other Race | 1,601 | 4.7% |
| Total | 34,165 | 100.0% |
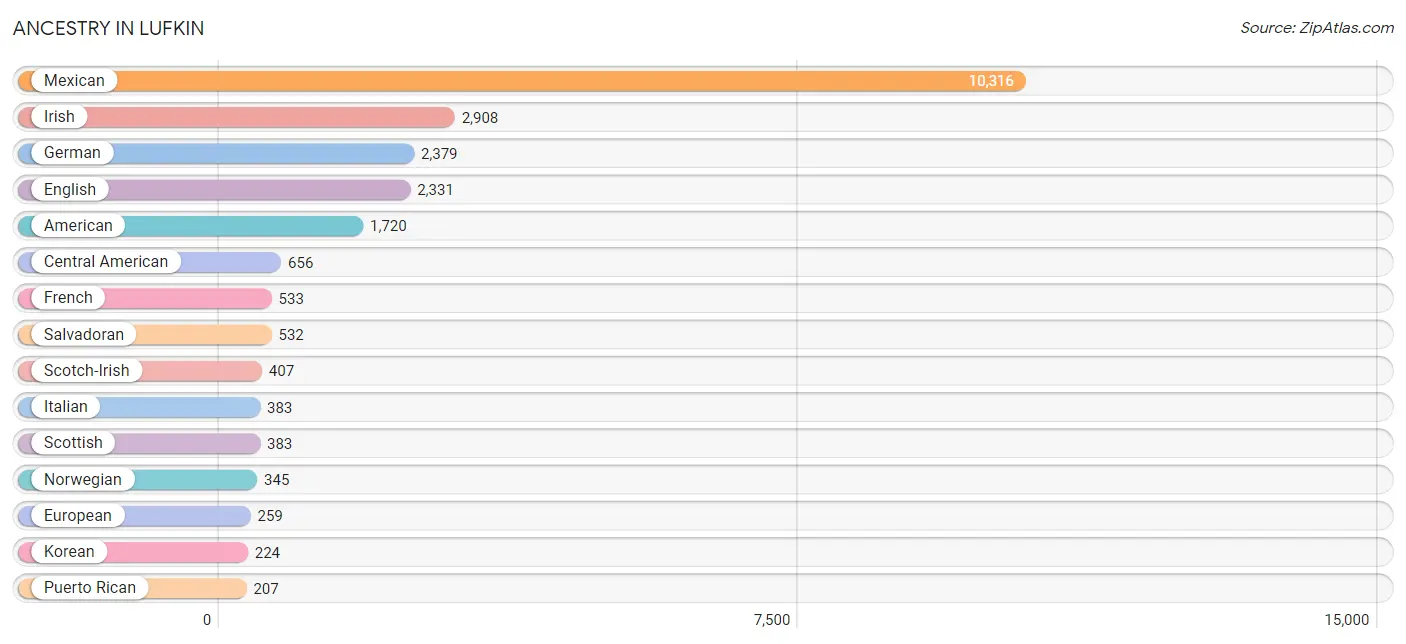
Ancestry in Lufkin
The most populous ancestries reported in Lufkin are Mexican (10,316 | 30.2%), Irish (2,908 | 8.5%), German (2,379 | 7.0%), English (2,331 | 6.8%), and American (1,720 | 5.0%), together accounting for 57.5% of all Lufkin residents.
| Ancestry | # Population | % Population |
| African | 63 | 0.2% |
| American | 1,720 | 5.0% |
| Arab | 90 | 0.3% |
| Argentinean | 1 | 0.0% |
| Bahamian | 6 | 0.0% |
| Bangladeshi | 12 | 0.0% |
| Belgian | 12 | 0.0% |
| Bhutanese | 38 | 0.1% |
| Blackfeet | 50 | 0.2% |
| British | 191 | 0.6% |
| Burmese | 21 | 0.1% |
| Central American | 656 | 1.9% |
| Central American Indian | 65 | 0.2% |
| Cherokee | 101 | 0.3% |
| Choctaw | 12 | 0.0% |
| Comanche | 11 | 0.0% |
| Costa Rican | 11 | 0.0% |
| Czech | 151 | 0.4% |
| Czechoslovakian | 79 | 0.2% |
| Danish | 65 | 0.2% |
| Dominican | 38 | 0.1% |
| Dutch | 98 | 0.3% |
| Eastern European | 148 | 0.4% |
| Egyptian | 33 | 0.1% |
| English | 2,331 | 6.8% |
| European | 259 | 0.8% |
| French | 533 | 1.6% |
| French American Indian | 13 | 0.0% |
| French Canadian | 58 | 0.2% |
| German | 2,379 | 7.0% |
| Greek | 15 | 0.0% |
| Guatemalan | 35 | 0.1% |
| Haitian | 36 | 0.1% |
| Honduran | 78 | 0.2% |
| Hungarian | 33 | 0.1% |
| Indian (Asian) | 127 | 0.4% |
| Inupiat | 18 | 0.1% |
| Irish | 2,908 | 8.5% |
| Italian | 383 | 1.1% |
| Korean | 224 | 0.7% |
| Mexican | 10,316 | 30.2% |
| Mexican American Indian | 53 | 0.2% |
| Nigerian | 51 | 0.2% |
| Norwegian | 345 | 1.0% |
| Pakistani | 19 | 0.1% |
| Palestinian | 57 | 0.2% |
| Polish | 157 | 0.5% |
| Puerto Rican | 207 | 0.6% |
| Salvadoran | 532 | 1.6% |
| Scandinavian | 1 | 0.0% |
| Scotch-Irish | 407 | 1.2% |
| Scottish | 383 | 1.1% |
| Seminole | 8 | 0.0% |
| South American | 34 | 0.1% |
| Spaniard | 46 | 0.1% |
| Spanish American Indian | 97 | 0.3% |
| Sri Lankan | 33 | 0.1% |
| Subsaharan African | 178 | 0.5% |
| Swedish | 10 | 0.0% |
| Swiss | 9 | 0.0% |
| Thai | 111 | 0.3% |
| Tongan | 12 | 0.0% |
| Turkish | 56 | 0.2% |
| Venezuelan | 33 | 0.1% |
| Welsh | 105 | 0.3% | View All 65 Rows |
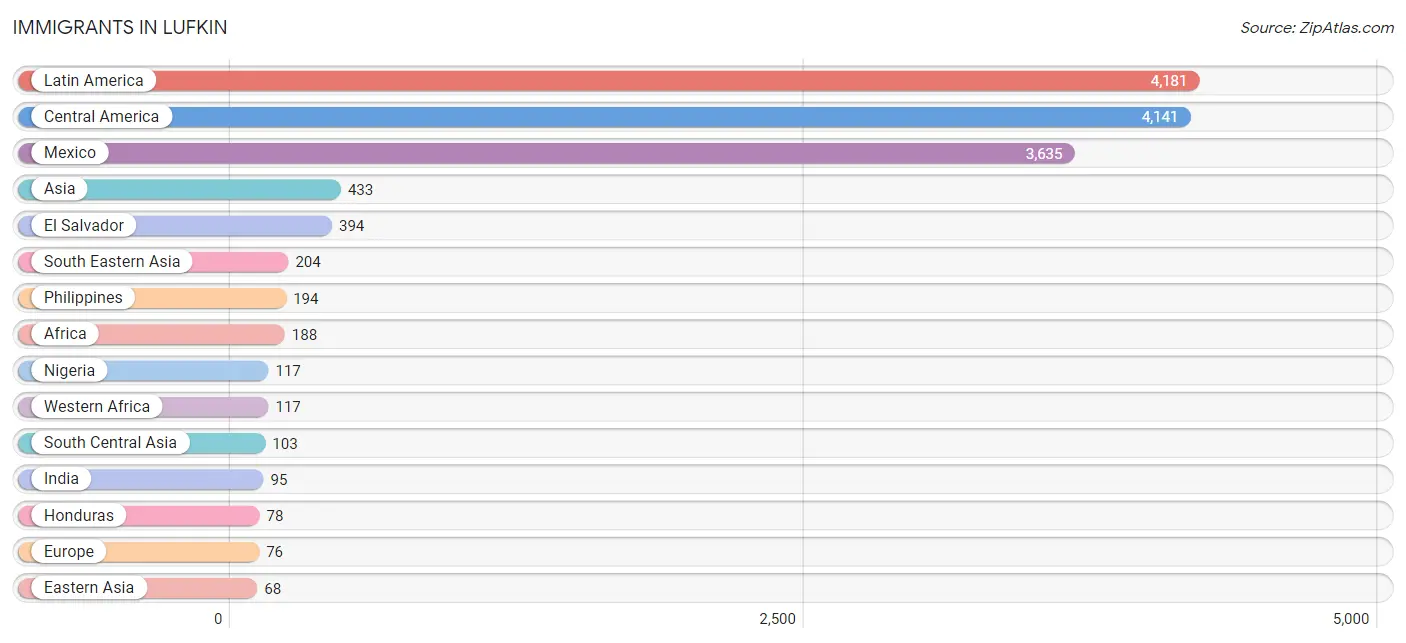
Immigrants in Lufkin
The most numerous immigrant groups reported in Lufkin came from Latin America (4,181 | 12.2%), Central America (4,141 | 12.1%), Mexico (3,635 | 10.6%), Asia (433 | 1.3%), and El Salvador (394 | 1.1%), together accounting for 37.4% of all Lufkin residents.
| Immigration Origin | # Population | % Population |
| Africa | 188 | 0.5% |
| Argentina | 1 | 0.0% |
| Asia | 433 | 1.3% |
| Bahamas | 6 | 0.0% |
| Canada | 13 | 0.0% |
| Caribbean | 6 | 0.0% |
| Central America | 4,141 | 12.1% |
| China | 9 | 0.0% |
| Costa Rica | 11 | 0.0% |
| Eastern Africa | 38 | 0.1% |
| Eastern Asia | 68 | 0.2% |
| Egypt | 33 | 0.1% |
| El Salvador | 394 | 1.1% |
| Europe | 76 | 0.2% |
| France | 27 | 0.1% |
| Guatemala | 23 | 0.1% |
| Honduras | 78 | 0.2% |
| India | 95 | 0.3% |
| Iran | 8 | 0.0% |
| Japan | 38 | 0.1% |
| Kenya | 26 | 0.1% |
| Korea | 21 | 0.1% |
| Latin America | 4,181 | 12.2% |
| Mexico | 3,635 | 10.6% |
| Nigeria | 117 | 0.3% |
| Northern Africa | 33 | 0.1% |
| Northern Europe | 17 | 0.1% |
| Norway | 1 | 0.0% |
| Philippines | 194 | 0.6% |
| South America | 34 | 0.1% |
| South Central Asia | 103 | 0.3% |
| South Eastern Asia | 204 | 0.6% |
| Southern Europe | 32 | 0.1% |
| Spain | 32 | 0.1% |
| Thailand | 10 | 0.0% |
| Turkey | 1 | 0.0% |
| Venezuela | 33 | 0.1% |
| Western Africa | 117 | 0.3% |
| Western Asia | 1 | 0.0% |
| Western Europe | 27 | 0.1% | View All 40 Rows |
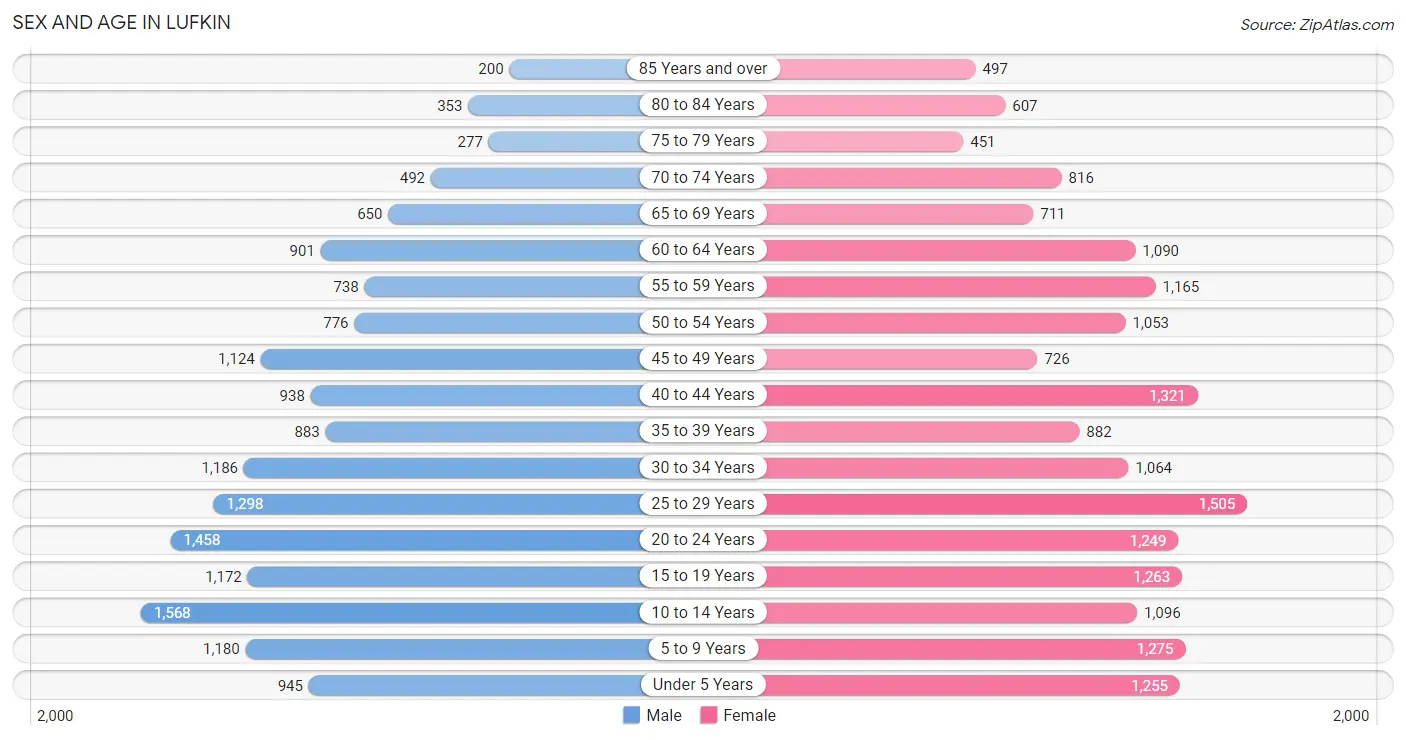
Sex and Age in Lufkin
Sex and Age in Lufkin
The most populous age groups in Lufkin are 10 to 14 Years (1,568 | 9.7%) for men and 25 to 29 Years (1,505 | 8.4%) for women.
| Age Bracket | Male | Female |
| Under 5 Years | 945 (5.9%) | 1,255 (7.0%) |
| 5 to 9 Years | 1,180 (7.3%) | 1,275 (7.1%) |
| 10 to 14 Years | 1,568 (9.7%) | 1,096 (6.1%) |
| 15 to 19 Years | 1,172 (7.3%) | 1,263 (7.0%) |
| 20 to 24 Years | 1,458 (9.0%) | 1,249 (6.9%) |
| 25 to 29 Years | 1,298 (8.0%) | 1,505 (8.4%) |
| 30 to 34 Years | 1,186 (7.3%) | 1,064 (5.9%) |
| 35 to 39 Years | 883 (5.5%) | 882 (4.9%) |
| 40 to 44 Years | 938 (5.8%) | 1,321 (7.3%) |
| 45 to 49 Years | 1,124 (7.0%) | 726 (4.0%) |
| 50 to 54 Years | 776 (4.8%) | 1,053 (5.8%) |
| 55 to 59 Years | 738 (4.6%) | 1,165 (6.5%) |
| 60 to 64 Years | 901 (5.6%) | 1,090 (6.0%) |
| 65 to 69 Years | 650 (4.0%) | 711 (3.9%) |
| 70 to 74 Years | 492 (3.0%) | 816 (4.5%) |
| 75 to 79 Years | 277 (1.7%) | 451 (2.5%) |
| 80 to 84 Years | 353 (2.2%) | 607 (3.4%) |
| 85 Years and over | 200 (1.2%) | 497 (2.8%) |
| Total | 16,139 (100.0%) | 18,026 (100.0%) |
Families and Households in Lufkin
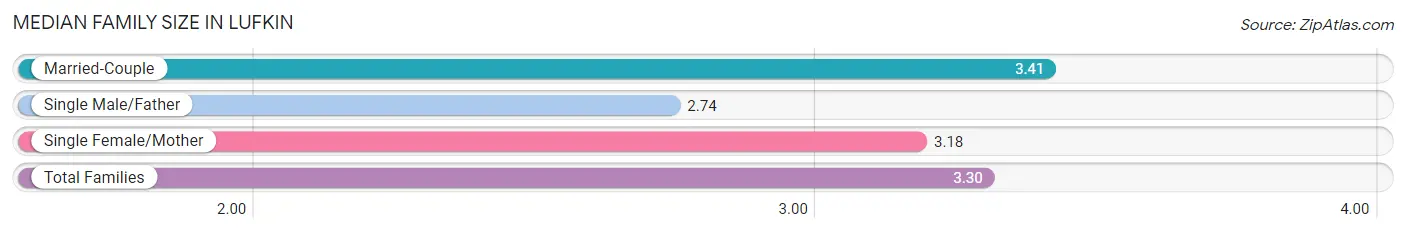
Median Family Size in Lufkin
The median family size in Lufkin is 3.30 persons per family, with married-couple families (5,233 | 64.5%) accounting for the largest median family size of 3.41 persons per family. On the other hand, single male/father families (529 | 6.5%) represent the smallest median family size with 2.74 persons per family.
| Family Type | # Families | Family Size |
| Married-Couple | 5,233 (64.5%) | 3.41 |
| Single Male/Father | 529 (6.5%) | 2.74 |
| Single Female/Mother | 2,347 (28.9%) | 3.18 |
| Total Families | 8,109 (100.0%) | 3.30 |
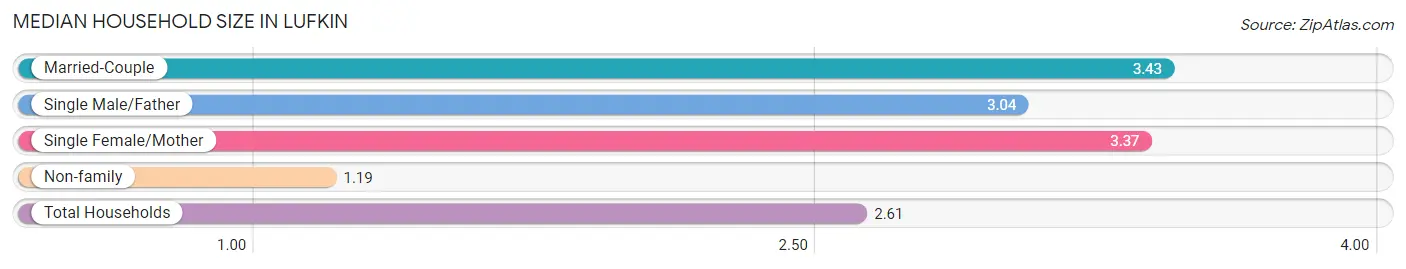
Median Household Size in Lufkin
The median household size in Lufkin is 2.61 persons per household, with married-couple households (5,233 | 41.7%) accounting for the largest median household size of 3.43 persons per household. non-family households (4,435 | 35.4%) represent the smallest median household size with 1.19 persons per household.
| Household Type | # Households | Household Size |
| Married-Couple | 5,233 (41.7%) | 3.43 |
| Single Male/Father | 529 (4.2%) | 3.04 |
| Single Female/Mother | 2,347 (18.7%) | 3.37 |
| Non-family | 4,435 (35.4%) | 1.19 |
| Total Households | 12,544 (100.0%) | 2.61 |
Household Size by Marriage Status in Lufkin
Out of a total of 12,544 households in Lufkin, 8,109 (64.6%) are family households, while 4,435 (35.4%) are nonfamily households. The most numerous type of family households are 2-person households, comprising 3,057, and the most common type of nonfamily households are 1-person households, comprising 3,778.
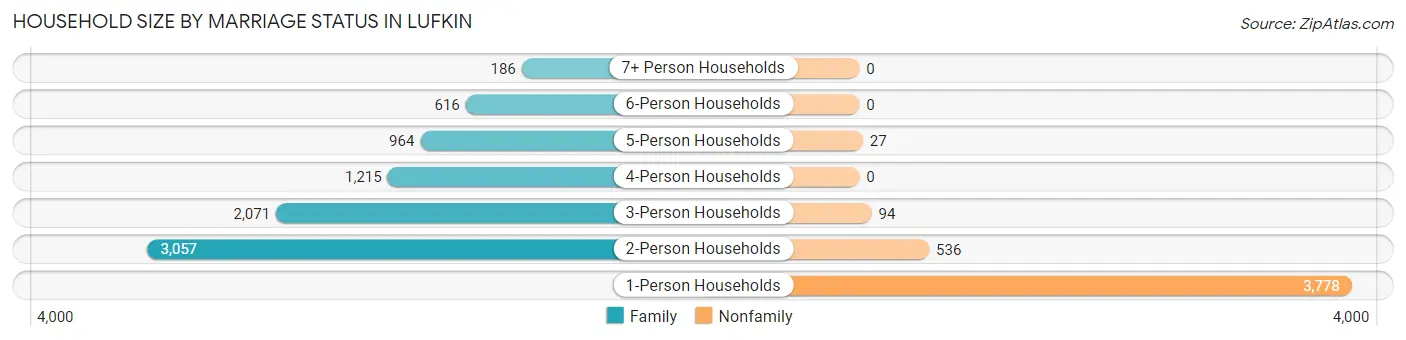
| Household Size | Family Households | Nonfamily Households |
| 1-Person Households | - | 3,778 (30.1%) |
| 2-Person Households | 3,057 (24.4%) | 536 (4.3%) |
| 3-Person Households | 2,071 (16.5%) | 94 (0.7%) |
| 4-Person Households | 1,215 (9.7%) | 0 (0.0%) |
| 5-Person Households | 964 (7.7%) | 27 (0.2%) |
| 6-Person Households | 616 (4.9%) | 0 (0.0%) |
| 7+ Person Households | 186 (1.5%) | 0 (0.0%) |
| Total | 8,109 (64.6%) | 4,435 (35.4%) |
Female Fertility in Lufkin
Fertility by Age in Lufkin
Average fertility rate in Lufkin is 25.0 births per 1,000 women. Women in the age bracket of 20 to 34 years have the highest fertility rate with 55.0 births per 1,000 women. Women in the age bracket of 20 to 34 years acount for 100.0% of all women with births.
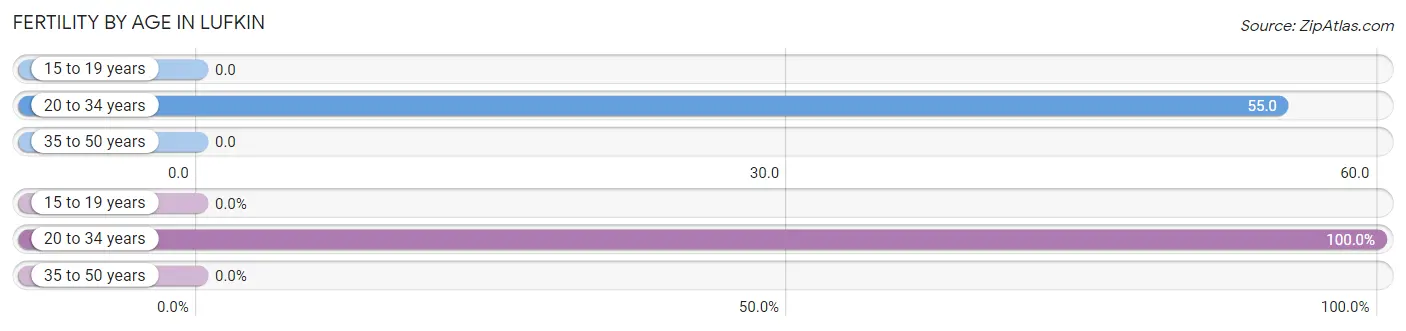
| Age Bracket | Women with Births | Births / 1,000 Women |
| 15 to 19 years | 0 (0.0%) | 0.0 |
| 20 to 34 years | 209 (100.0%) | 55.0 |
| 35 to 50 years | 0 (0.0%) | 0.0 |
| Total | 209 (100.0%) | 25.0 |
Fertility by Age by Marriage Status in Lufkin
59.8% of women with births (209) in Lufkin are married. The highest percentage of unmarried women with births falls into 20 to 34 years age bracket with 40.2% of them unmarried at the time of birth, while the lowest percentage of unmarried women with births belong to 20 to 34 years age bracket with 40.2% of them unmarried.
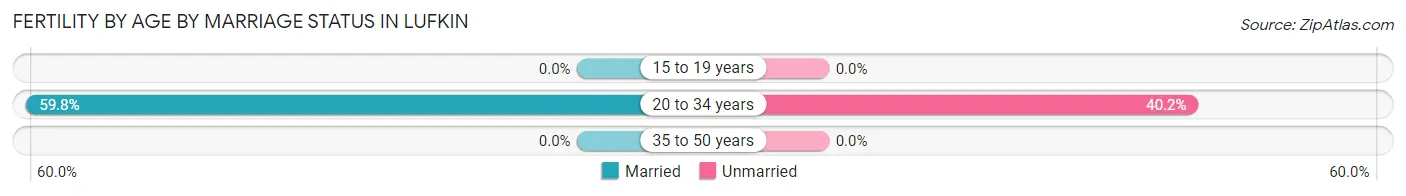
| Age Bracket | Married | Unmarried |
| 15 to 19 years | 0 (0.0%) | 0 (0.0%) |
| 20 to 34 years | 125 (59.8%) | 84 (40.2%) |
| 35 to 50 years | 0 (0.0%) | 0 (0.0%) |
| Total | 125 (59.8%) | 84 (40.2%) |
Fertility by Education in Lufkin
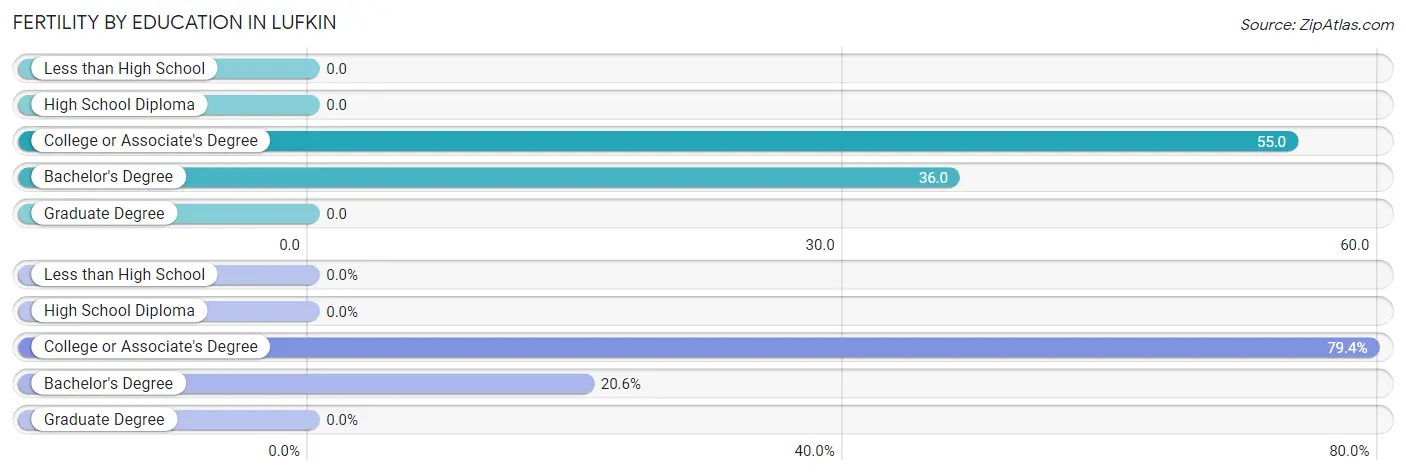
| Educational Attainment | Women with Births | Births / 1,000 Women |
| Less than High School | 0 (0.0%) | 0.0 |
| High School Diploma | 0 (0.0%) | 0.0 |
| College or Associate's Degree | 166 (79.4%) | 55.0 |
| Bachelor's Degree | 43 (20.6%) | 36.0 |
| Graduate Degree | 0 (0.0%) | 0.0 |
| Total | 209 (100.0%) | 25.0 |
Fertility by Education by Marriage Status in Lufkin
40.2% of women with births in Lufkin are unmarried. Women with the educational attainment of college or associate's degree are most likely to be married with 62.6% of them married at childbirth, while women with the educational attainment of bachelor's degree are least likely to be married with 51.2% of them unmarried at childbirth.
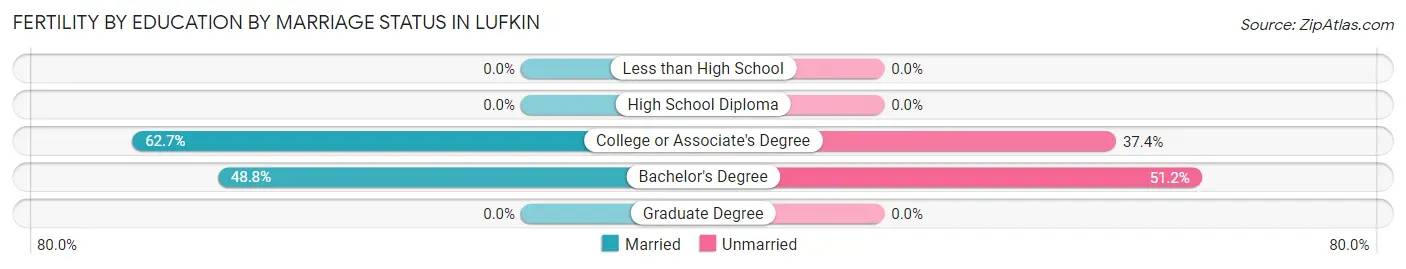
| Educational Attainment | Married | Unmarried |
| Less than High School | 0 (0.0%) | 0 (0.0%) |
| High School Diploma | 0 (0.0%) | 0 (0.0%) |
| College or Associate's Degree | 104 (62.6%) | 62 (37.3%) |
| Bachelor's Degree | 21 (48.8%) | 22 (51.2%) |
| Graduate Degree | 0 (0.0%) | 0 (0.0%) |
| Total | 125 (59.8%) | 84 (40.2%) |
Employment Characteristics in Lufkin
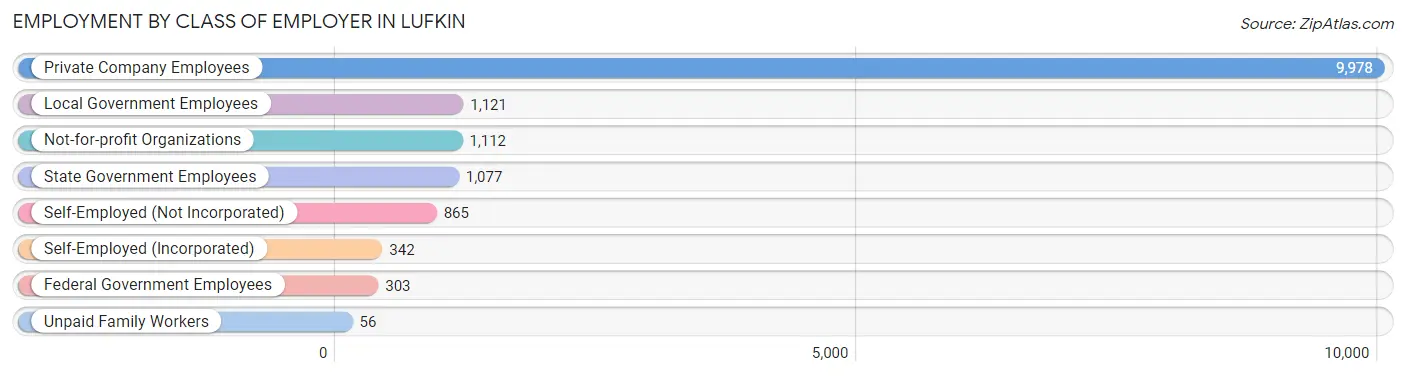
Employment by Class of Employer in Lufkin
Among the 14,854 employed individuals in Lufkin, private company employees (9,978 | 67.2%), local government employees (1,121 | 7.5%), and not-for-profit organizations (1,112 | 7.5%) make up the most common classes of employment.
| Employer Class | # Employees | % Employees |
| Private Company Employees | 9,978 | 67.2% |
| Self-Employed (Incorporated) | 342 | 2.3% |
| Self-Employed (Not Incorporated) | 865 | 5.8% |
| Not-for-profit Organizations | 1,112 | 7.5% |
| Local Government Employees | 1,121 | 7.5% |
| State Government Employees | 1,077 | 7.2% |
| Federal Government Employees | 303 | 2.0% |
| Unpaid Family Workers | 56 | 0.4% |
| Total | 14,854 | 100.0% |
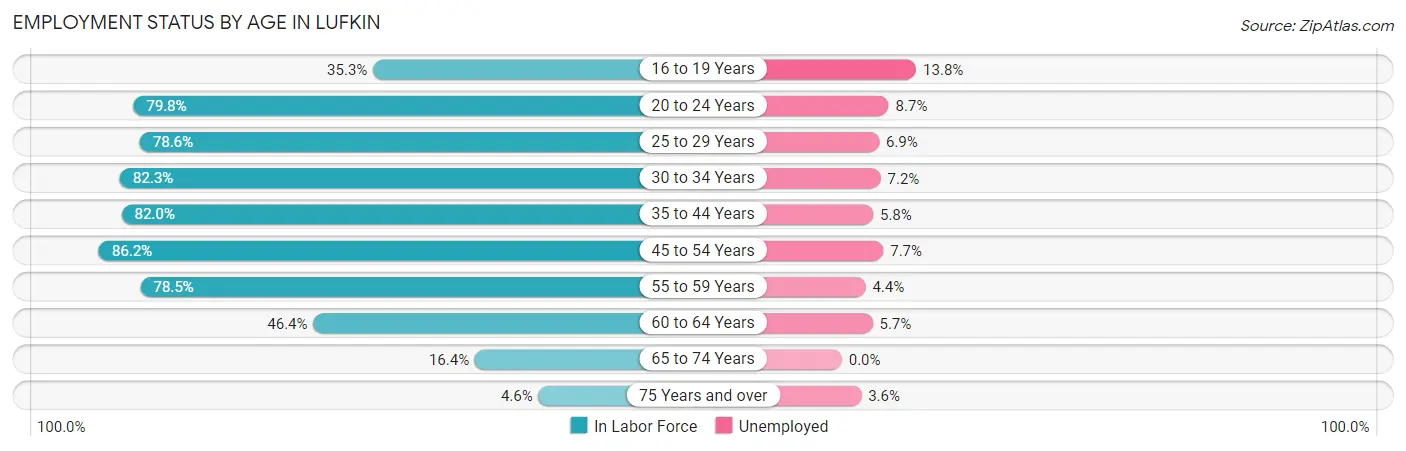
Employment Status by Age in Lufkin
According to the labor force statistics for Lufkin, out of the total population over 16 years of age (26,157), 62.2% or 16,270 individuals are in the labor force, with 6.9% or 1,123 of them unemployed. The age group with the highest labor force participation rate is 45 to 54 years, with 86.2% or 3,171 individuals in the labor force. Within the labor force, the 16 to 19 years age range has the highest percentage of unemployed individuals, with 13.8% or 85 of them being unemployed.
| Age Bracket | In Labor Force | Unemployed |
| 16 to 19 Years | 616 (35.3%) | 85 (13.8%) |
| 20 to 24 Years | 2,160 (79.8%) | 188 (8.7%) |
| 25 to 29 Years | 2,203 (78.6%) | 152 (6.9%) |
| 30 to 34 Years | 1,852 (82.3%) | 133 (7.2%) |
| 35 to 44 Years | 3,300 (82.0%) | 191 (5.8%) |
| 45 to 54 Years | 3,171 (86.2%) | 244 (7.7%) |
| 55 to 59 Years | 1,494 (78.5%) | 66 (4.4%) |
| 60 to 64 Years | 924 (46.4%) | 53 (5.7%) |
| 65 to 74 Years | 438 (16.4%) | 0 (0.0%) |
| 75 Years and over | 110 (4.6%) | 4 (3.6%) |
| Total | 16,270 (62.2%) | 1,123 (6.9%) |
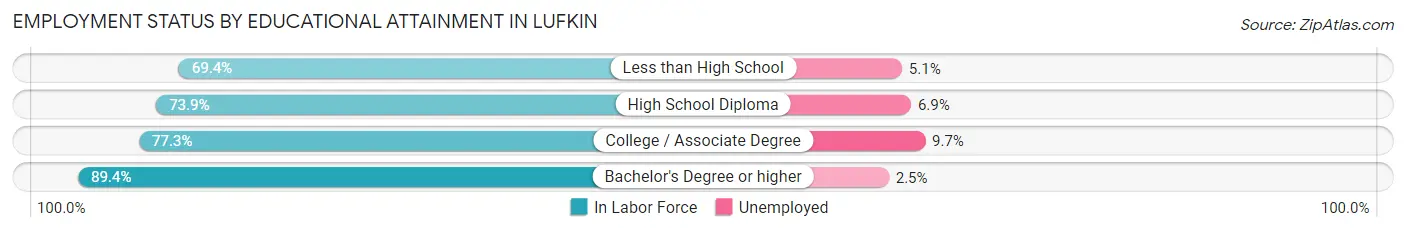
Employment Status by Educational Attainment in Lufkin
According to labor force statistics for Lufkin, 77.7% of individuals (12,937) out of the total population between 25 and 64 years of age (16,650) are in the labor force, with 6.5% or 841 of them being unemployed. The group with the highest labor force participation rate are those with the educational attainment of bachelor's degree or higher, with 89.4% or 3,245 individuals in the labor force. Within the labor force, individuals with college / associate degree education have the highest percentage of unemployment, with 9.7% or 416 of them being unemployed.
| Educational Attainment | In Labor Force | Unemployed |
| Less than High School | 1,849 (69.4%) | 136 (5.1%) |
| High School Diploma | 3,556 (73.9%) | 332 (6.9%) |
| College / Associate Degree | 4,286 (77.3%) | 538 (9.7%) |
| Bachelor's Degree or higher | 3,245 (89.4%) | 91 (2.5%) |
| Total | 12,937 (77.7%) | 1,082 (6.5%) |
Employment Occupations by Sex in Lufkin
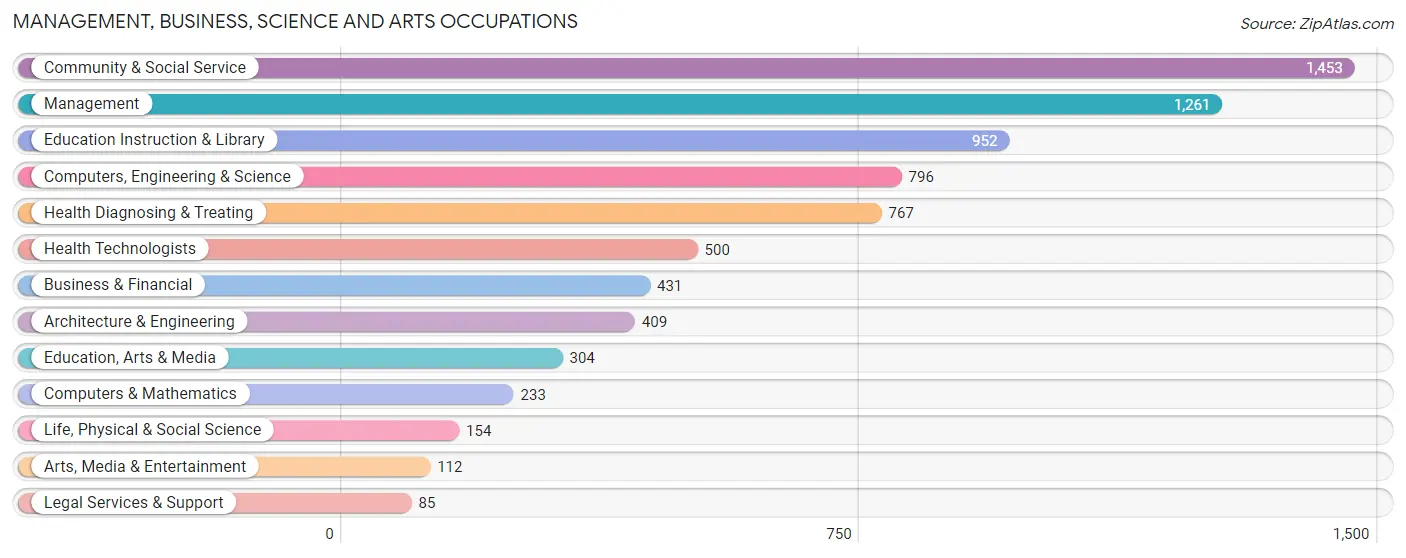
Management, Business, Science and Arts Occupations
The most common Management, Business, Science and Arts occupations in Lufkin are Community & Social Service (1,453 | 9.6%), Management (1,261 | 8.3%), Education Instruction & Library (952 | 6.3%), Computers, Engineering & Science (796 | 5.2%), and Health Diagnosing & Treating (767 | 5.1%).
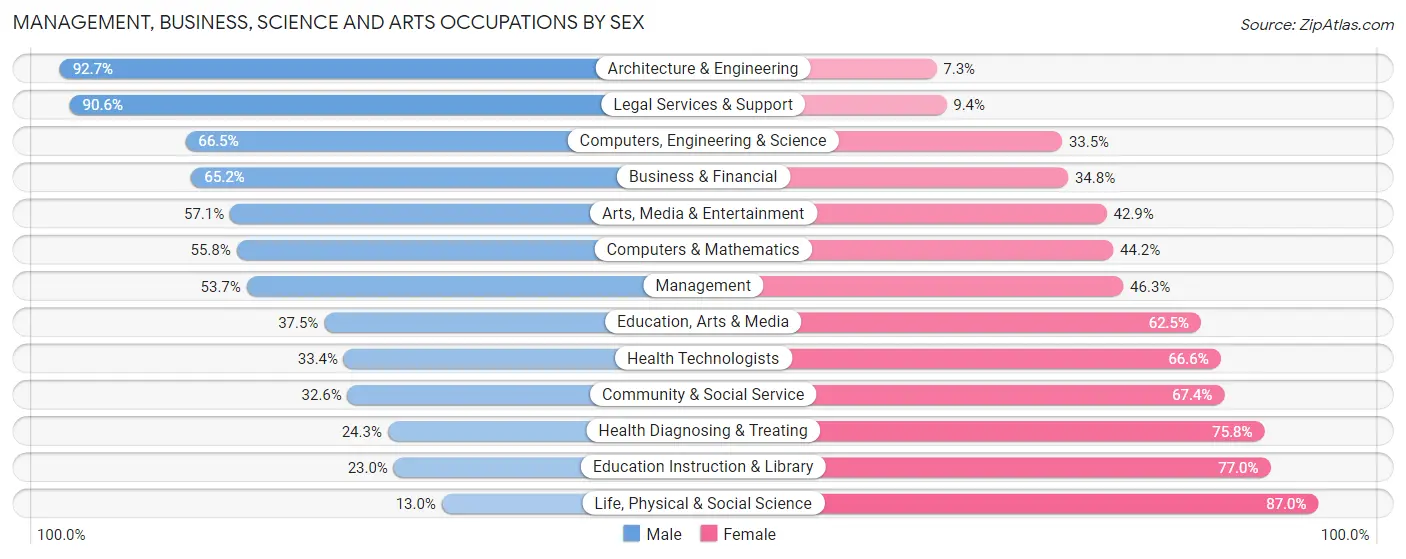
Management, Business, Science and Arts Occupations by Sex
Within the Management, Business, Science and Arts occupations in Lufkin, the most male-oriented occupations are Architecture & Engineering (92.7%), Legal Services & Support (90.6%), and Computers, Engineering & Science (66.5%), while the most female-oriented occupations are Life, Physical & Social Science (87.0%), Education Instruction & Library (77.0%), and Health Diagnosing & Treating (75.7%).
| Occupation | Male | Female |
| Management | 677 (53.7%) | 584 (46.3%) |
| Business & Financial | 281 (65.2%) | 150 (34.8%) |
| Computers, Engineering & Science | 529 (66.5%) | 267 (33.5%) |
| Computers & Mathematics | 130 (55.8%) | 103 (44.2%) |
| Architecture & Engineering | 379 (92.7%) | 30 (7.3%) |
| Life, Physical & Social Science | 20 (13.0%) | 134 (87.0%) |
| Community & Social Service | 474 (32.6%) | 979 (67.4%) |
| Education, Arts & Media | 114 (37.5%) | 190 (62.5%) |
| Legal Services & Support | 77 (90.6%) | 8 (9.4%) |
| Education Instruction & Library | 219 (23.0%) | 733 (77.0%) |
| Arts, Media & Entertainment | 64 (57.1%) | 48 (42.9%) |
| Health Diagnosing & Treating | 186 (24.2%) | 581 (75.7%) |
| Health Technologists | 167 (33.4%) | 333 (66.6%) |
| Total (Category) | 2,147 (45.6%) | 2,561 (54.4%) |
| Total (Overall) | 7,582 (50.0%) | 7,569 (50.0%) |
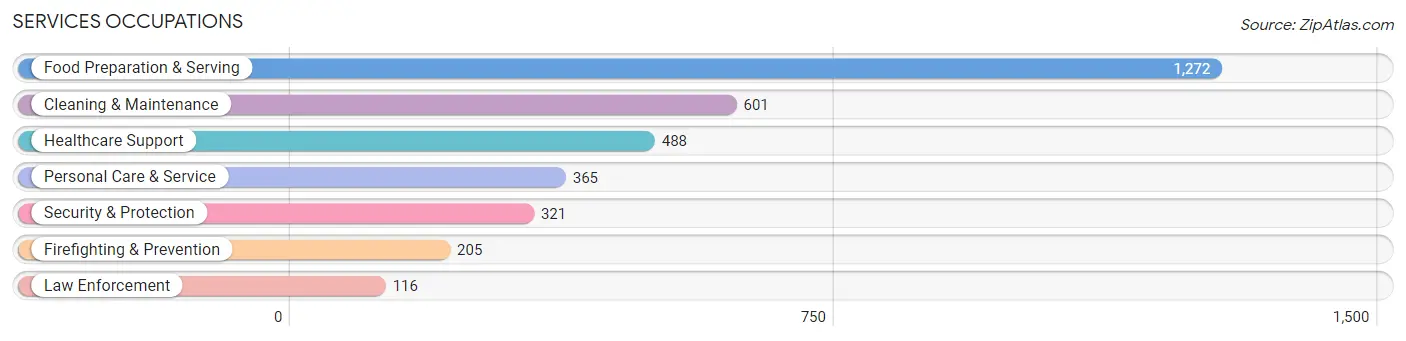
Services Occupations
The most common Services occupations in Lufkin are Food Preparation & Serving (1,272 | 8.4%), Cleaning & Maintenance (601 | 4.0%), Healthcare Support (488 | 3.2%), Personal Care & Service (365 | 2.4%), and Security & Protection (321 | 2.1%).
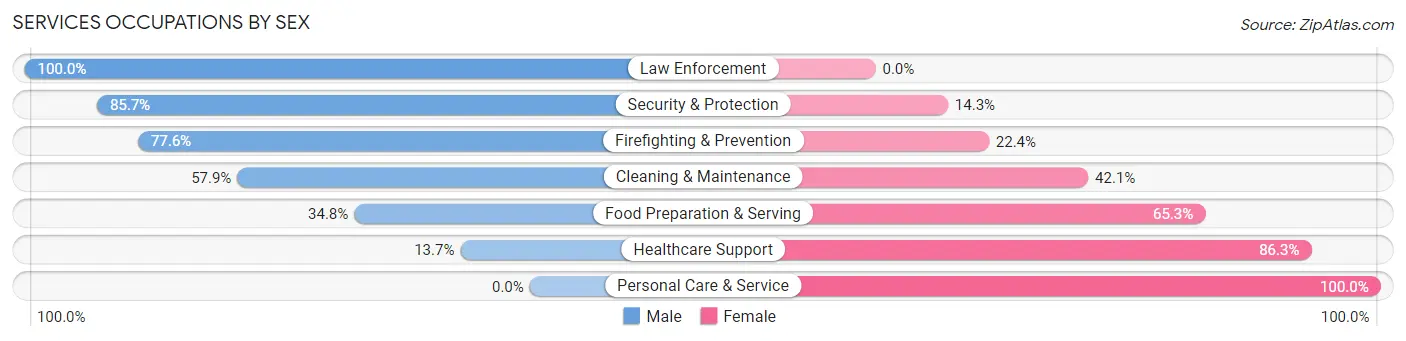
Services Occupations by Sex
Within the Services occupations in Lufkin, the most male-oriented occupations are Law Enforcement (100.0%), Security & Protection (85.7%), and Firefighting & Prevention (77.6%), while the most female-oriented occupations are Personal Care & Service (100.0%), Healthcare Support (86.3%), and Food Preparation & Serving (65.2%).
| Occupation | Male | Female |
| Healthcare Support | 67 (13.7%) | 421 (86.3%) |
| Security & Protection | 275 (85.7%) | 46 (14.3%) |
| Firefighting & Prevention | 159 (77.6%) | 46 (22.4%) |
| Law Enforcement | 116 (100.0%) | 0 (0.0%) |
| Food Preparation & Serving | 442 (34.7%) | 830 (65.2%) |
| Cleaning & Maintenance | 348 (57.9%) | 253 (42.1%) |
| Personal Care & Service | 0 (0.0%) | 365 (100.0%) |
| Total (Category) | 1,132 (37.1%) | 1,915 (62.8%) |
| Total (Overall) | 7,582 (50.0%) | 7,569 (50.0%) |
Sales and Office Occupations
The most common Sales and Office occupations in Lufkin are Office & Administration (1,752 | 11.6%), and Sales & Related (1,308 | 8.6%).

Sales and Office Occupations by Sex

| Occupation | Male | Female |
| Sales & Related | 500 (38.2%) | 808 (61.8%) |
| Office & Administration | 252 (14.4%) | 1,500 (85.6%) |
| Total (Category) | 752 (24.6%) | 2,308 (75.4%) |
| Total (Overall) | 7,582 (50.0%) | 7,569 (50.0%) |
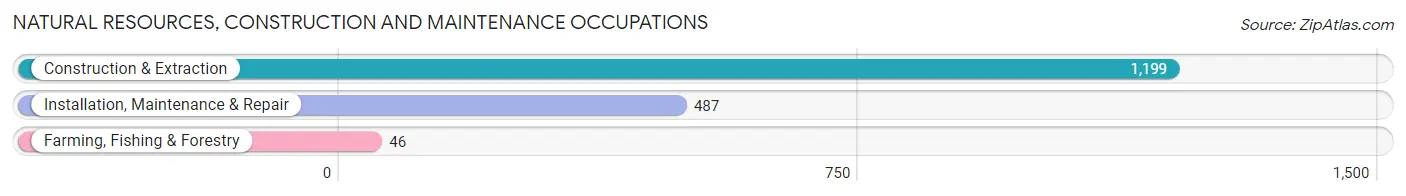
Natural Resources, Construction and Maintenance Occupations
The most common Natural Resources, Construction and Maintenance occupations in Lufkin are Construction & Extraction (1,199 | 7.9%), Installation, Maintenance & Repair (487 | 3.2%), and Farming, Fishing & Forestry (46 | 0.3%).
Natural Resources, Construction and Maintenance Occupations by Sex
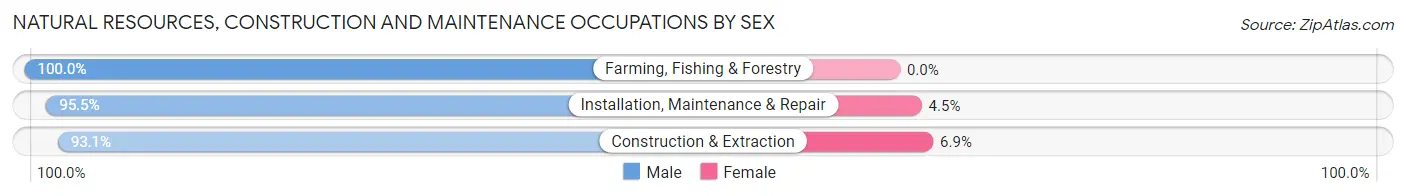
| Occupation | Male | Female |
| Farming, Fishing & Forestry | 46 (100.0%) | 0 (0.0%) |
| Construction & Extraction | 1,116 (93.1%) | 83 (6.9%) |
| Installation, Maintenance & Repair | 465 (95.5%) | 22 (4.5%) |
| Total (Category) | 1,627 (93.9%) | 105 (6.1%) |
| Total (Overall) | 7,582 (50.0%) | 7,569 (50.0%) |
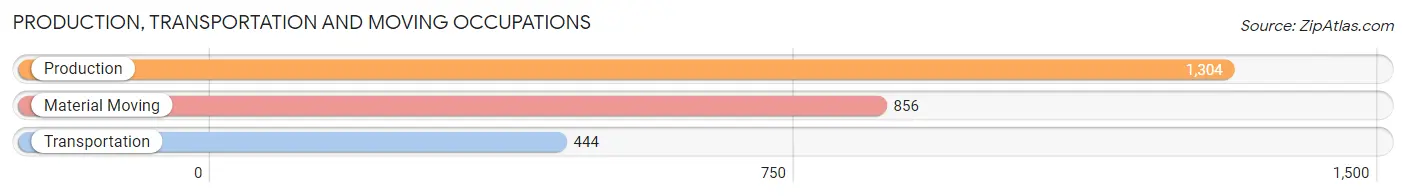
Production, Transportation and Moving Occupations
The most common Production, Transportation and Moving occupations in Lufkin are Production (1,304 | 8.6%), Material Moving (856 | 5.7%), and Transportation (444 | 2.9%).
Production, Transportation and Moving Occupations by Sex
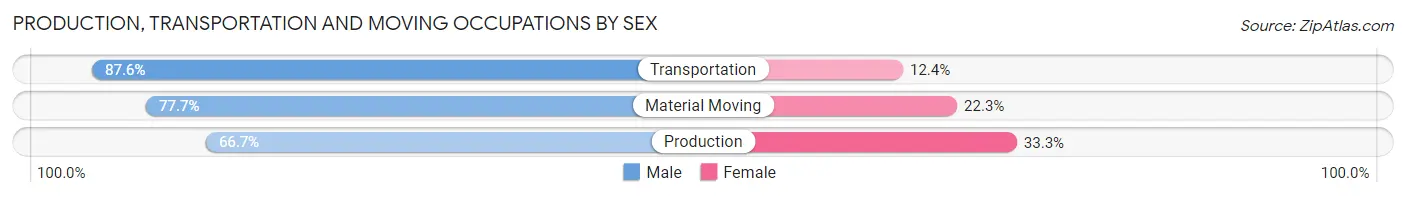
| Occupation | Male | Female |
| Production | 870 (66.7%) | 434 (33.3%) |
| Transportation | 389 (87.6%) | 55 (12.4%) |
| Material Moving | 665 (77.7%) | 191 (22.3%) |
| Total (Category) | 1,924 (73.9%) | 680 (26.1%) |
| Total (Overall) | 7,582 (50.0%) | 7,569 (50.0%) |
Employment Industries by Sex in Lufkin
Employment Industries in Lufkin
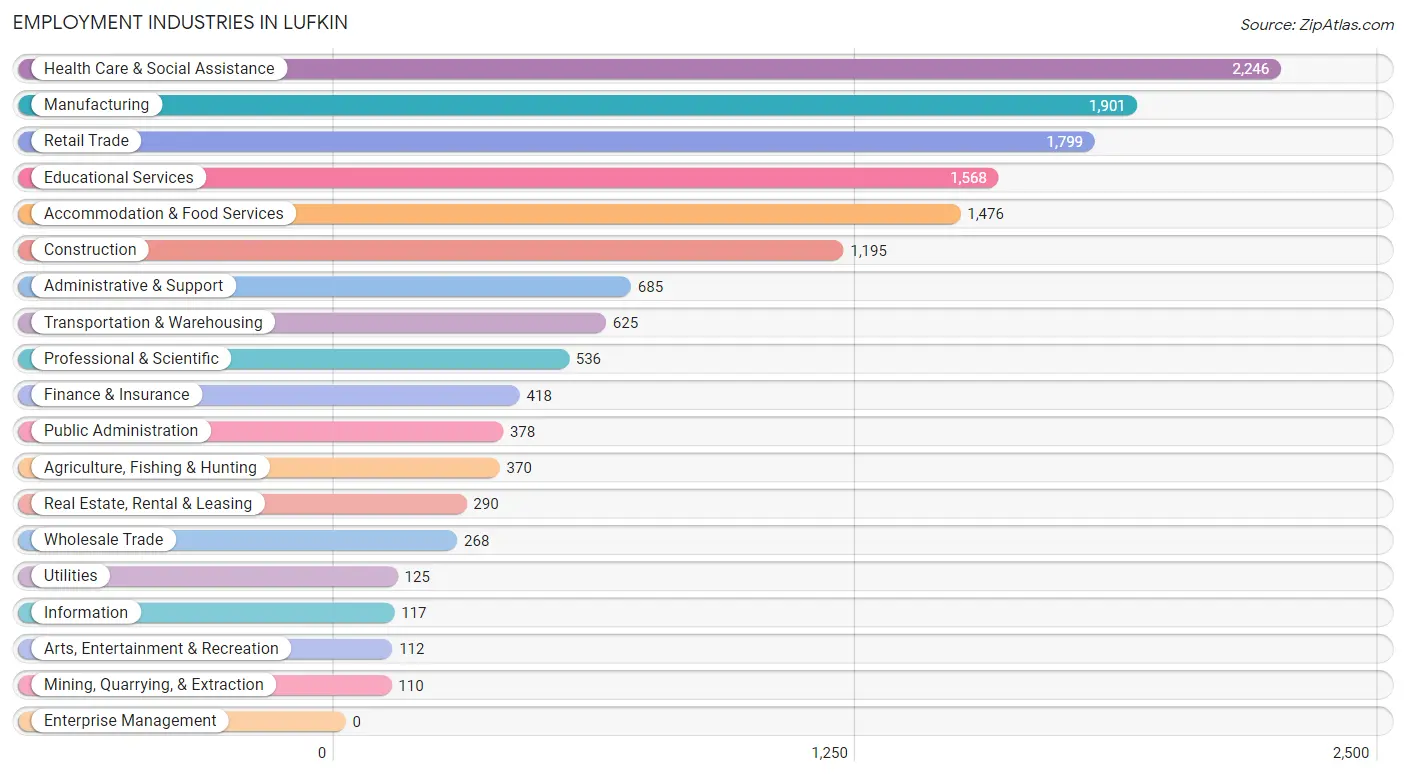
The major employment industries in Lufkin include Health Care & Social Assistance (2,246 | 14.8%), Manufacturing (1,901 | 12.6%), Retail Trade (1,799 | 11.9%), Educational Services (1,568 | 10.3%), and Accommodation & Food Services (1,476 | 9.7%).
Employment Industries by Sex in Lufkin
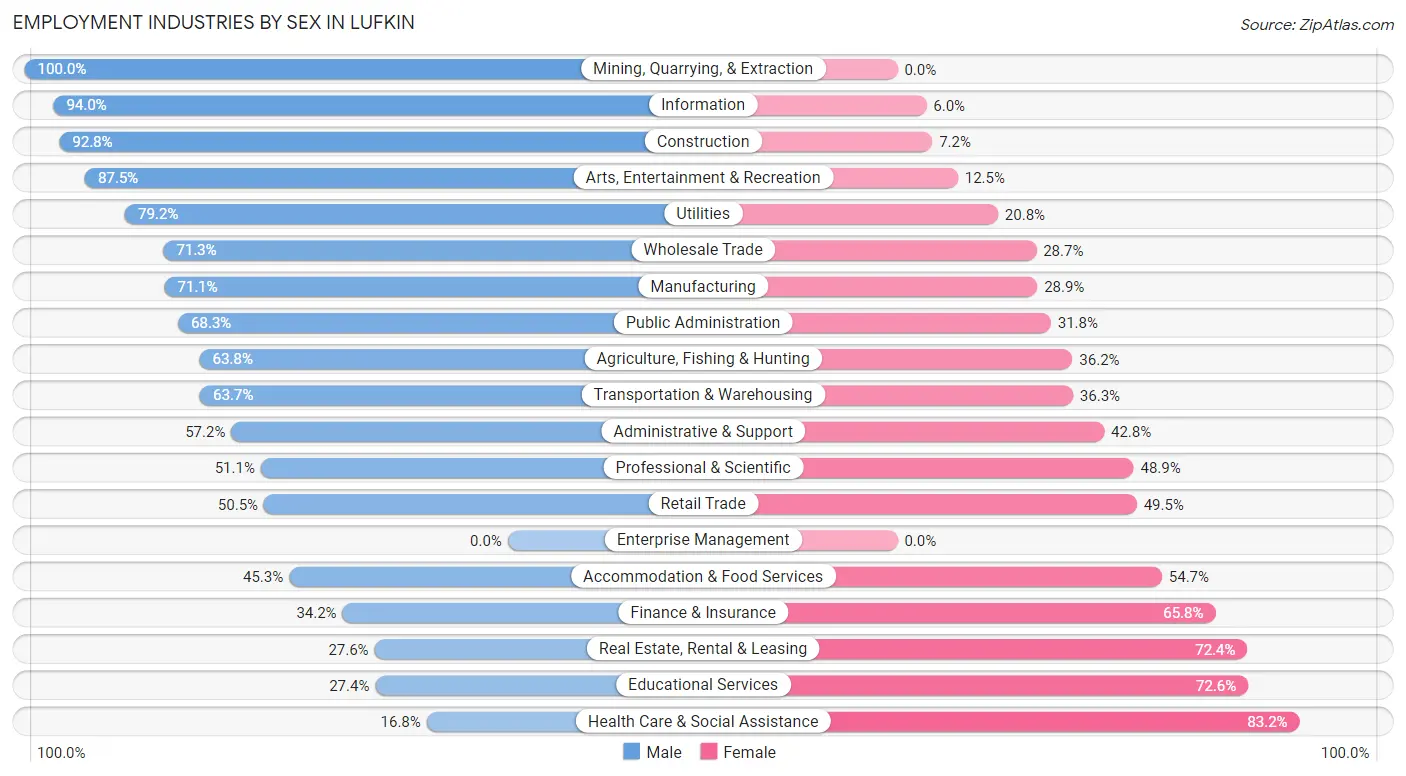
The Lufkin industries that see more men than women are Mining, Quarrying, & Extraction (100.0%), Information (94.0%), and Construction (92.8%), whereas the industries that tend to have a higher number of women are Health Care & Social Assistance (83.2%), Educational Services (72.6%), and Real Estate, Rental & Leasing (72.4%).
| Industry | Male | Female |
| Agriculture, Fishing & Hunting | 236 (63.8%) | 134 (36.2%) |
| Mining, Quarrying, & Extraction | 110 (100.0%) | 0 (0.0%) |
| Construction | 1,109 (92.8%) | 86 (7.2%) |
| Manufacturing | 1,351 (71.1%) | 550 (28.9%) |
| Wholesale Trade | 191 (71.3%) | 77 (28.7%) |
| Retail Trade | 908 (50.5%) | 891 (49.5%) |
| Transportation & Warehousing | 398 (63.7%) | 227 (36.3%) |
| Utilities | 99 (79.2%) | 26 (20.8%) |
| Information | 110 (94.0%) | 7 (6.0%) |
| Finance & Insurance | 143 (34.2%) | 275 (65.8%) |
| Real Estate, Rental & Leasing | 80 (27.6%) | 210 (72.4%) |
| Professional & Scientific | 274 (51.1%) | 262 (48.9%) |
| Enterprise Management | 0 (0.0%) | 0 (0.0%) |
| Administrative & Support | 392 (57.2%) | 293 (42.8%) |
| Educational Services | 430 (27.4%) | 1,138 (72.6%) |
| Health Care & Social Assistance | 377 (16.8%) | 1,869 (83.2%) |
| Arts, Entertainment & Recreation | 98 (87.5%) | 14 (12.5%) |
| Accommodation & Food Services | 668 (45.3%) | 808 (54.7%) |
| Public Administration | 258 (68.2%) | 120 (31.8%) |
| Total | 7,582 (50.0%) | 7,569 (50.0%) |
Education in Lufkin
School Enrollment in Lufkin
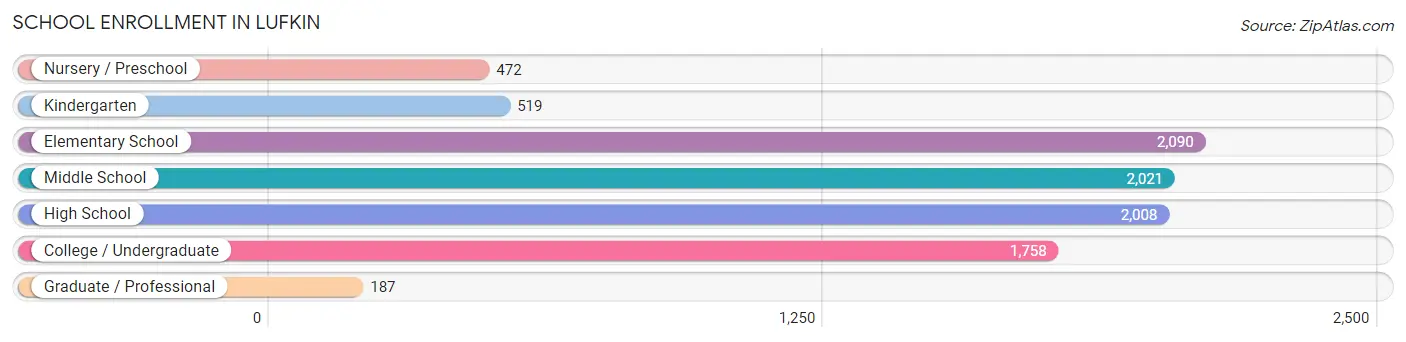
The most common levels of schooling among the 9,055 students in Lufkin are elementary school (2,090 | 23.1%), middle school (2,021 | 22.3%), and high school (2,008 | 22.2%).
| School Level | # Students | % Students |
| Nursery / Preschool | 472 | 5.2% |
| Kindergarten | 519 | 5.7% |
| Elementary School | 2,090 | 23.1% |
| Middle School | 2,021 | 22.3% |
| High School | 2,008 | 22.2% |
| College / Undergraduate | 1,758 | 19.4% |
| Graduate / Professional | 187 | 2.1% |
| Total | 9,055 | 100.0% |
School Enrollment by Age by Funding Source in Lufkin
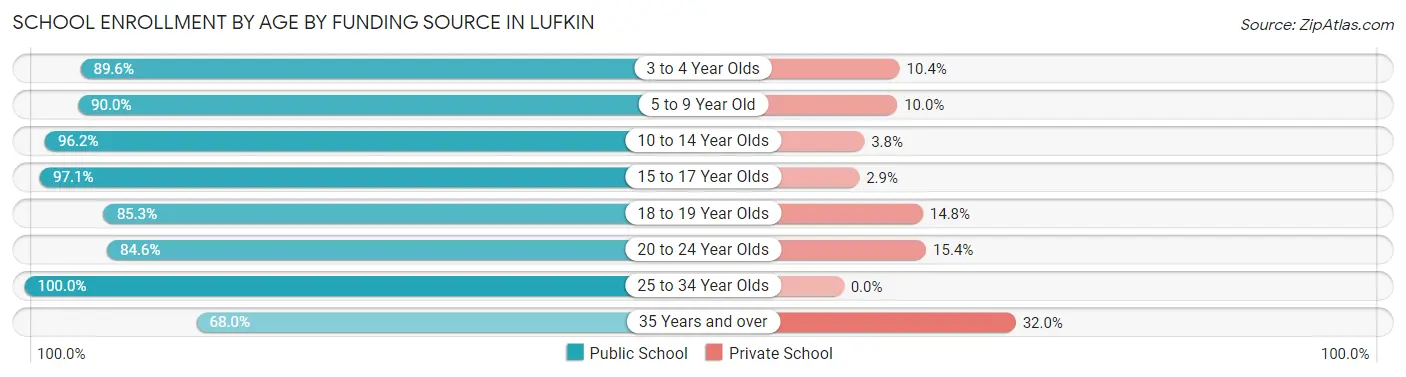
Out of a total of 9,055 students who are enrolled in schools in Lufkin, 779 (8.6%) attend a private institution, while the remaining 8,276 (91.4%) are enrolled in public schools. The age group of 35 years and over has the highest likelihood of being enrolled in private schools, with 182 (32.0% in the age bracket) enrolled. Conversely, the age group of 25 to 34 year olds has the lowest likelihood of being enrolled in a private school, with 318 (100.0% in the age bracket) attending a public institution.
| Age Bracket | Public School | Private School |
| 3 to 4 Year Olds | 309 (89.6%) | 36 (10.4%) |
| 5 to 9 Year Old | 2,105 (90.0%) | 233 (10.0%) |
| 10 to 14 Year Olds | 2,562 (96.2%) | 102 (3.8%) |
| 15 to 17 Year Olds | 1,572 (97.1%) | 47 (2.9%) |
| 18 to 19 Year Olds | 393 (85.3%) | 68 (14.7%) |
| 20 to 24 Year Olds | 628 (84.6%) | 114 (15.4%) |
| 25 to 34 Year Olds | 318 (100.0%) | 0 (0.0%) |
| 35 Years and over | 386 (68.0%) | 182 (32.0%) |
| Total | 8,276 (91.4%) | 779 (8.6%) |
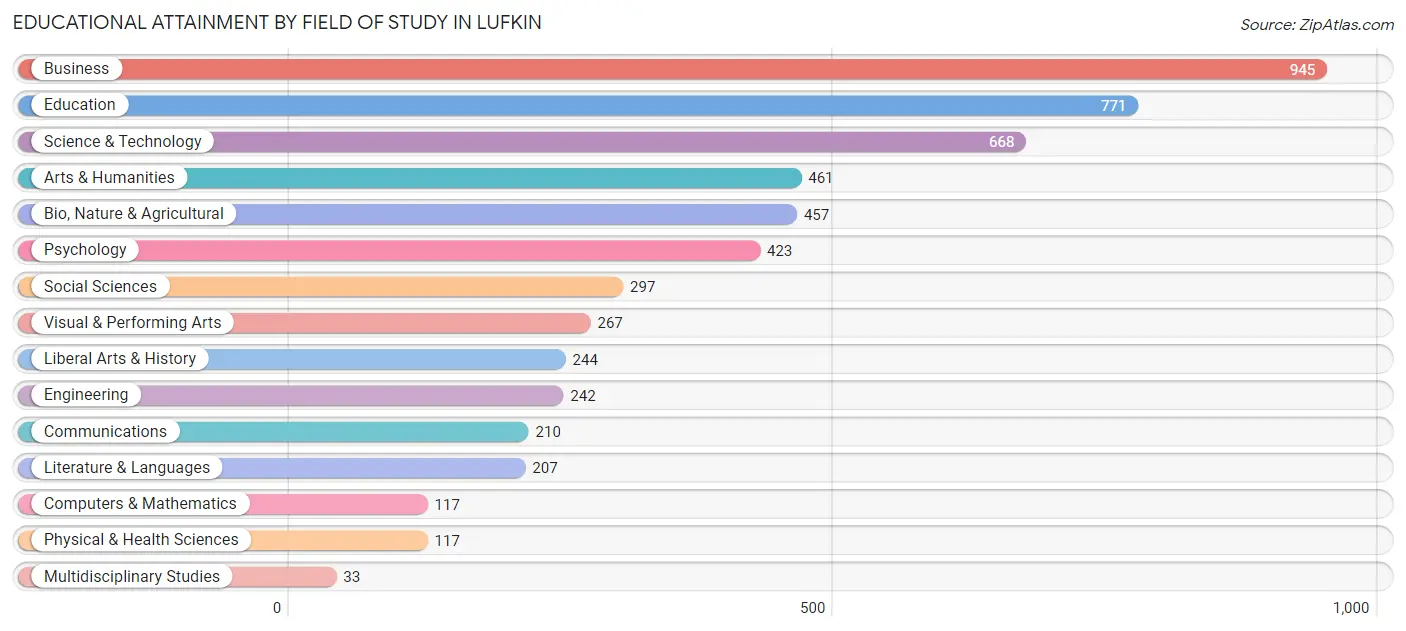
Educational Attainment by Field of Study in Lufkin
Business (945 | 17.3%), education (771 | 14.1%), science & technology (668 | 12.2%), arts & humanities (461 | 8.4%), and bio, nature & agricultural (457 | 8.4%) are the most common fields of study among 5,459 individuals in Lufkin who have obtained a bachelor's degree or higher.
| Field of Study | # Graduates | % Graduates |
| Computers & Mathematics | 117 | 2.1% |
| Bio, Nature & Agricultural | 457 | 8.4% |
| Physical & Health Sciences | 117 | 2.1% |
| Psychology | 423 | 7.7% |
| Social Sciences | 297 | 5.4% |
| Engineering | 242 | 4.4% |
| Multidisciplinary Studies | 33 | 0.6% |
| Science & Technology | 668 | 12.2% |
| Business | 945 | 17.3% |
| Education | 771 | 14.1% |
| Literature & Languages | 207 | 3.8% |
| Liberal Arts & History | 244 | 4.5% |
| Visual & Performing Arts | 267 | 4.9% |
| Communications | 210 | 3.8% |
| Arts & Humanities | 461 | 8.4% |
| Total | 5,459 | 100.0% |
Transportation & Commute in Lufkin
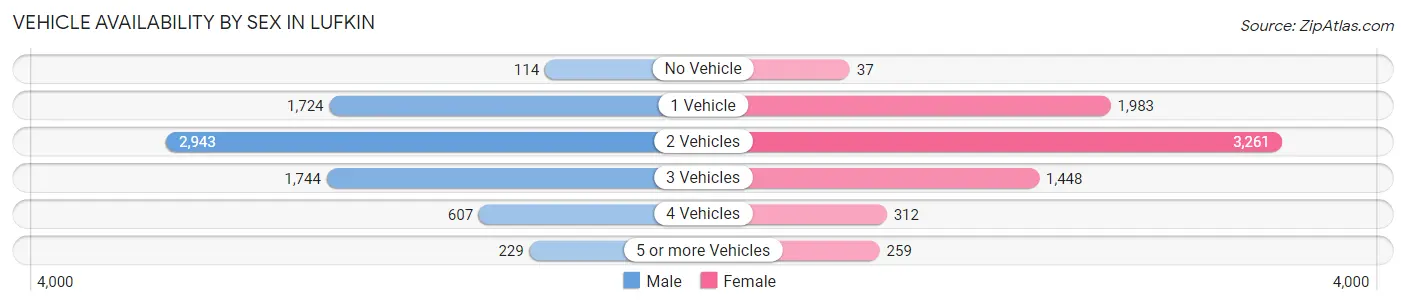
Vehicle Availability by Sex in Lufkin
The most prevalent vehicle ownership categories in Lufkin are males with 2 vehicles (2,943, accounting for 40.0%) and females with 2 vehicles (3,261, making up 40.3%).
| Vehicles Available | Male | Female |
| No Vehicle | 114 (1.5%) | 37 (0.5%) |
| 1 Vehicle | 1,724 (23.4%) | 1,983 (27.2%) |
| 2 Vehicles | 2,943 (40.0%) | 3,261 (44.7%) |
| 3 Vehicles | 1,744 (23.7%) | 1,448 (19.8%) |
| 4 Vehicles | 607 (8.3%) | 312 (4.3%) |
| 5 or more Vehicles | 229 (3.1%) | 259 (3.5%) |
| Total | 7,361 (100.0%) | 7,300 (100.0%) |
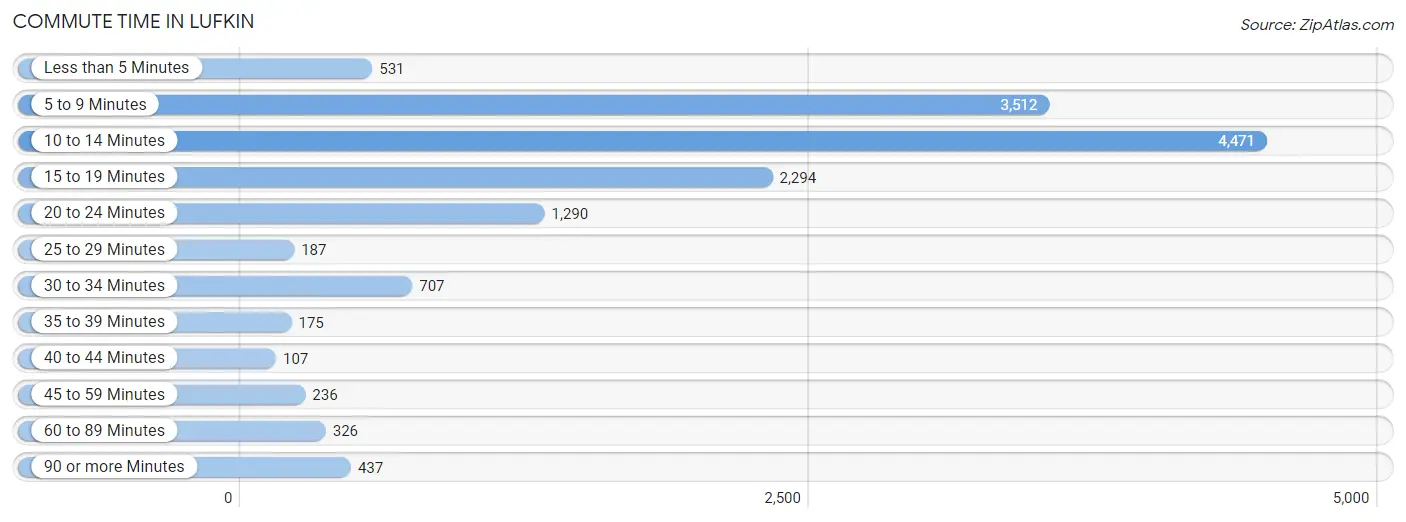
Commute Time in Lufkin
The most frequently occuring commute durations in Lufkin are 10 to 14 minutes (4,471 commuters, 31.3%), 5 to 9 minutes (3,512 commuters, 24.6%), and 15 to 19 minutes (2,294 commuters, 16.1%).
| Commute Time | # Commuters | % Commuters |
| Less than 5 Minutes | 531 | 3.7% |
| 5 to 9 Minutes | 3,512 | 24.6% |
| 10 to 14 Minutes | 4,471 | 31.3% |
| 15 to 19 Minutes | 2,294 | 16.1% |
| 20 to 24 Minutes | 1,290 | 9.0% |
| 25 to 29 Minutes | 187 | 1.3% |
| 30 to 34 Minutes | 707 | 5.0% |
| 35 to 39 Minutes | 175 | 1.2% |
| 40 to 44 Minutes | 107 | 0.7% |
| 45 to 59 Minutes | 236 | 1.7% |
| 60 to 89 Minutes | 326 | 2.3% |
| 90 or more Minutes | 437 | 3.1% |
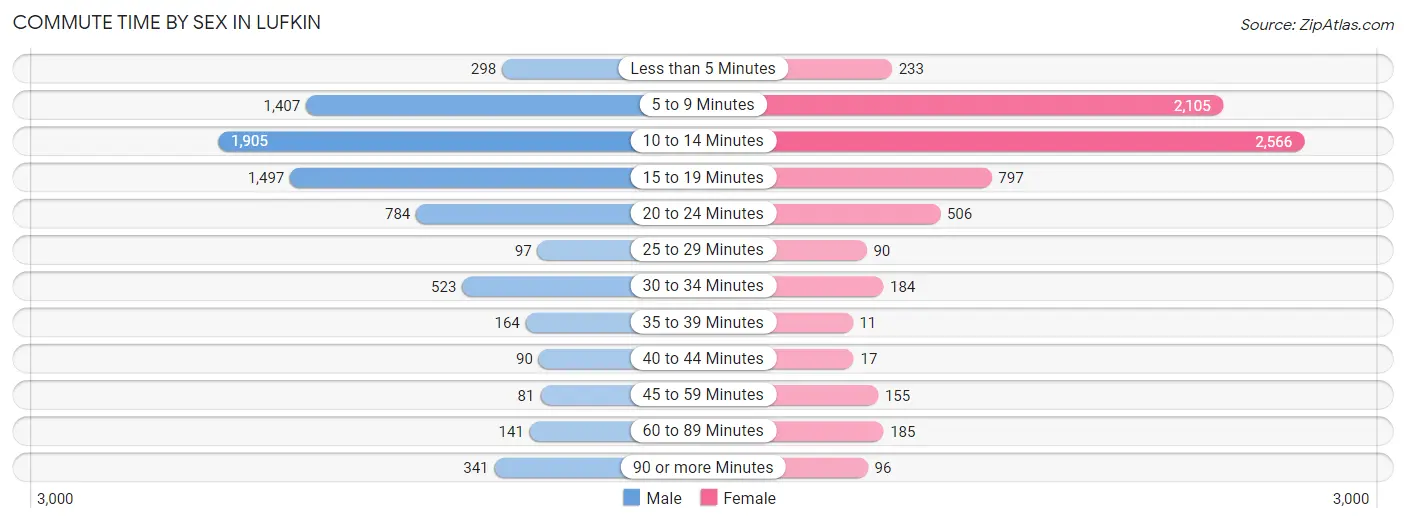
Commute Time by Sex in Lufkin
The most common commute times in Lufkin are 10 to 14 minutes (1,905 commuters, 26.0%) for males and 10 to 14 minutes (2,566 commuters, 36.9%) for females.
| Commute Time | Male | Female |
| Less than 5 Minutes | 298 (4.1%) | 233 (3.4%) |
| 5 to 9 Minutes | 1,407 (19.2%) | 2,105 (30.3%) |
| 10 to 14 Minutes | 1,905 (26.0%) | 2,566 (36.9%) |
| 15 to 19 Minutes | 1,497 (20.4%) | 797 (11.5%) |
| 20 to 24 Minutes | 784 (10.7%) | 506 (7.3%) |
| 25 to 29 Minutes | 97 (1.3%) | 90 (1.3%) |
| 30 to 34 Minutes | 523 (7.1%) | 184 (2.6%) |
| 35 to 39 Minutes | 164 (2.2%) | 11 (0.2%) |
| 40 to 44 Minutes | 90 (1.2%) | 17 (0.2%) |
| 45 to 59 Minutes | 81 (1.1%) | 155 (2.2%) |
| 60 to 89 Minutes | 141 (1.9%) | 185 (2.7%) |
| 90 or more Minutes | 341 (4.6%) | 96 (1.4%) |
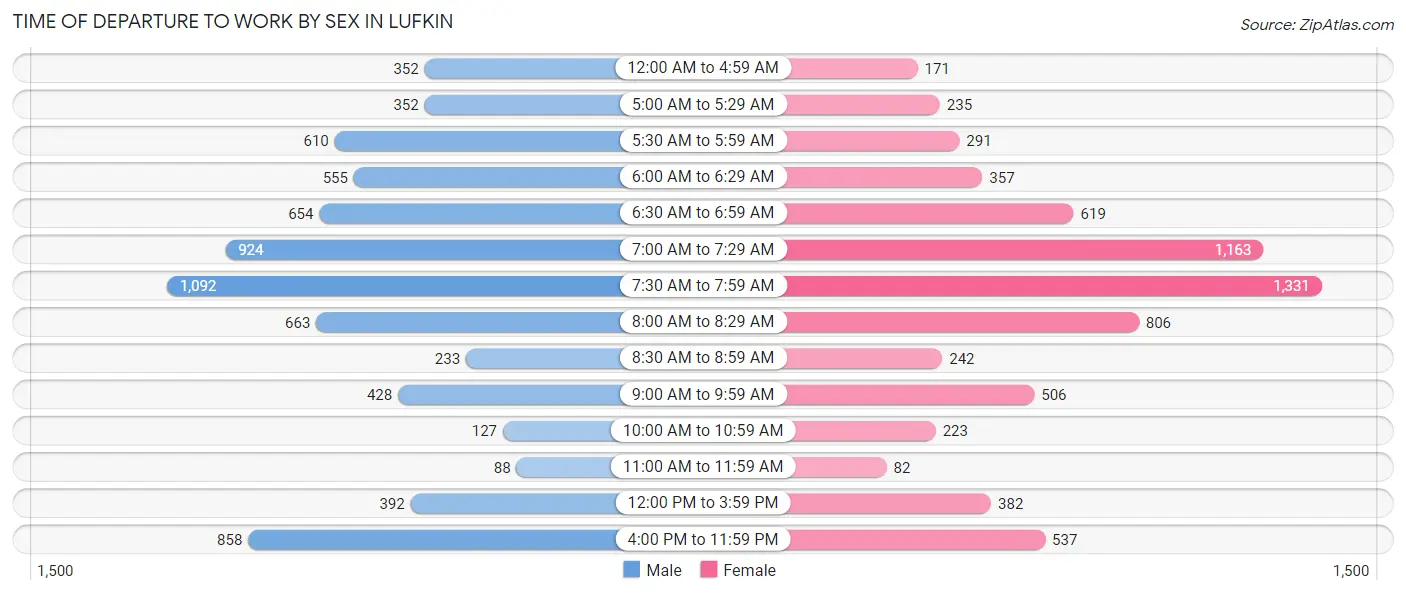
Time of Departure to Work by Sex in Lufkin
The most frequent times of departure to work in Lufkin are 7:30 AM to 7:59 AM (1,092, 14.9%) for males and 7:30 AM to 7:59 AM (1,331, 19.2%) for females.
| Time of Departure | Male | Female |
| 12:00 AM to 4:59 AM | 352 (4.8%) | 171 (2.5%) |
| 5:00 AM to 5:29 AM | 352 (4.8%) | 235 (3.4%) |
| 5:30 AM to 5:59 AM | 610 (8.3%) | 291 (4.2%) |
| 6:00 AM to 6:29 AM | 555 (7.6%) | 357 (5.1%) |
| 6:30 AM to 6:59 AM | 654 (8.9%) | 619 (8.9%) |
| 7:00 AM to 7:29 AM | 924 (12.6%) | 1,163 (16.8%) |
| 7:30 AM to 7:59 AM | 1,092 (14.9%) | 1,331 (19.2%) |
| 8:00 AM to 8:29 AM | 663 (9.0%) | 806 (11.6%) |
| 8:30 AM to 8:59 AM | 233 (3.2%) | 242 (3.5%) |
| 9:00 AM to 9:59 AM | 428 (5.8%) | 506 (7.3%) |
| 10:00 AM to 10:59 AM | 127 (1.7%) | 223 (3.2%) |
| 11:00 AM to 11:59 AM | 88 (1.2%) | 82 (1.2%) |
| 12:00 PM to 3:59 PM | 392 (5.3%) | 382 (5.5%) |
| 4:00 PM to 11:59 PM | 858 (11.7%) | 537 (7.7%) |
| Total | 7,328 (100.0%) | 6,945 (100.0%) |
Housing Occupancy in Lufkin
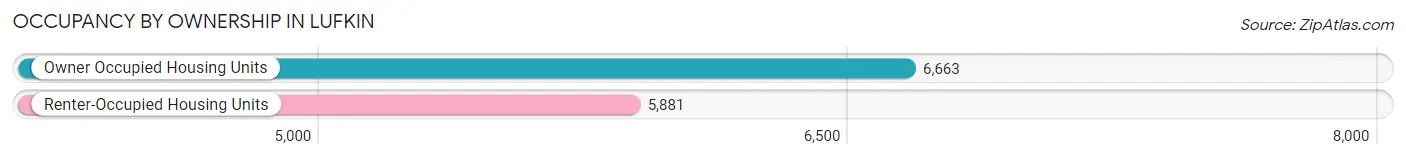
Occupancy by Ownership in Lufkin
Of the total 12,544 dwellings in Lufkin, owner-occupied units account for 6,663 (53.1%), while renter-occupied units make up 5,881 (46.9%).
| Occupancy | # Housing Units | % Housing Units |
| Owner Occupied Housing Units | 6,663 | 53.1% |
| Renter-Occupied Housing Units | 5,881 | 46.9% |
| Total Occupied Housing Units | 12,544 | 100.0% |
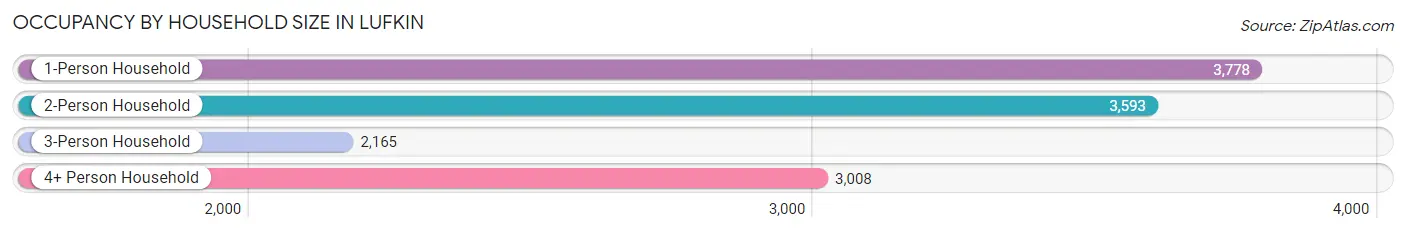
Occupancy by Household Size in Lufkin
| Household Size | # Housing Units | % Housing Units |
| 1-Person Household | 3,778 | 30.1% |
| 2-Person Household | 3,593 | 28.6% |
| 3-Person Household | 2,165 | 17.3% |
| 4+ Person Household | 3,008 | 24.0% |
| Total Housing Units | 12,544 | 100.0% |
Occupancy by Ownership by Household Size in Lufkin
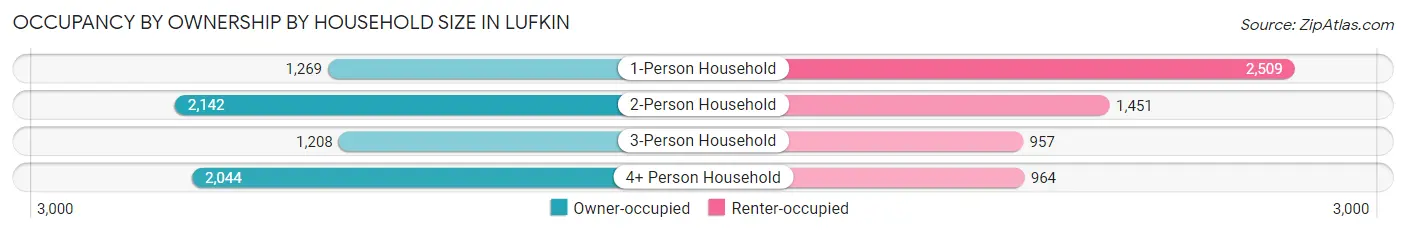
| Household Size | Owner-occupied | Renter-occupied |
| 1-Person Household | 1,269 (33.6%) | 2,509 (66.4%) |
| 2-Person Household | 2,142 (59.6%) | 1,451 (40.4%) |
| 3-Person Household | 1,208 (55.8%) | 957 (44.2%) |
| 4+ Person Household | 2,044 (67.9%) | 964 (32.1%) |
| Total Housing Units | 6,663 (53.1%) | 5,881 (46.9%) |
Occupancy by Educational Attainment in Lufkin
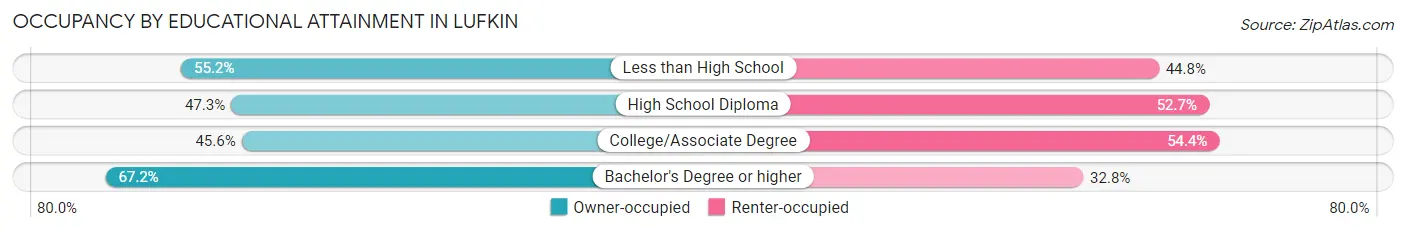
| Household Size | Owner-occupied | Renter-occupied |
| Less than High School | 1,118 (55.2%) | 908 (44.8%) |
| High School Diploma | 1,434 (47.3%) | 1,600 (52.7%) |
| College/Associate Degree | 1,936 (45.6%) | 2,310 (54.4%) |
| Bachelor's Degree or higher | 2,175 (67.2%) | 1,063 (32.8%) |
Occupancy by Age of Householder in Lufkin
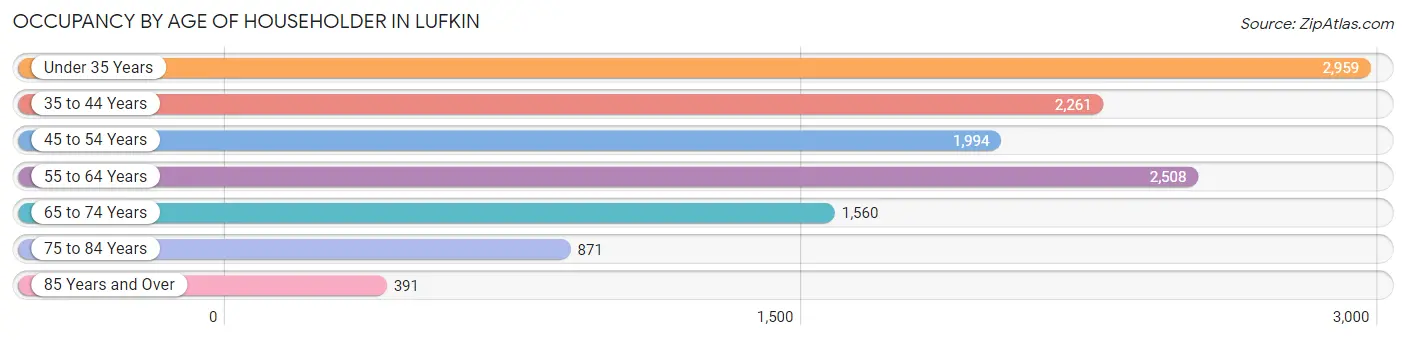
| Age Bracket | # Households | % Households |
| Under 35 Years | 2,959 | 23.6% |
| 35 to 44 Years | 2,261 | 18.0% |
| 45 to 54 Years | 1,994 | 15.9% |
| 55 to 64 Years | 2,508 | 20.0% |
| 65 to 74 Years | 1,560 | 12.4% |
| 75 to 84 Years | 871 | 6.9% |
| 85 Years and Over | 391 | 3.1% |
| Total | 12,544 | 100.0% |
Housing Finances in Lufkin
Median Income by Occupancy in Lufkin
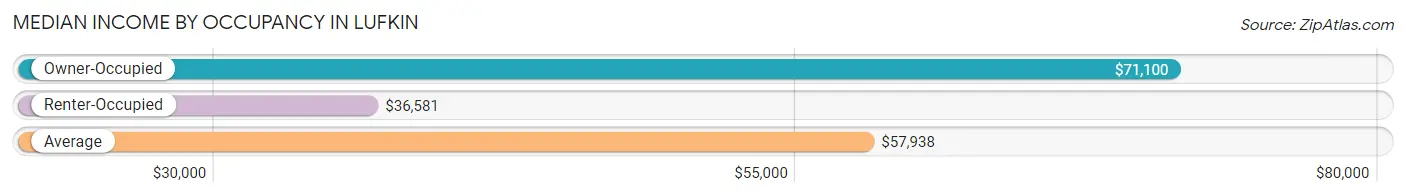
| Occupancy Type | # Households | Median Income |
| Owner-Occupied | 6,663 (53.1%) | $71,100 |
| Renter-Occupied | 5,881 (46.9%) | $36,581 |
| Average | 12,544 (100.0%) | $57,938 |
Occupancy by Householder Income Bracket in Lufkin
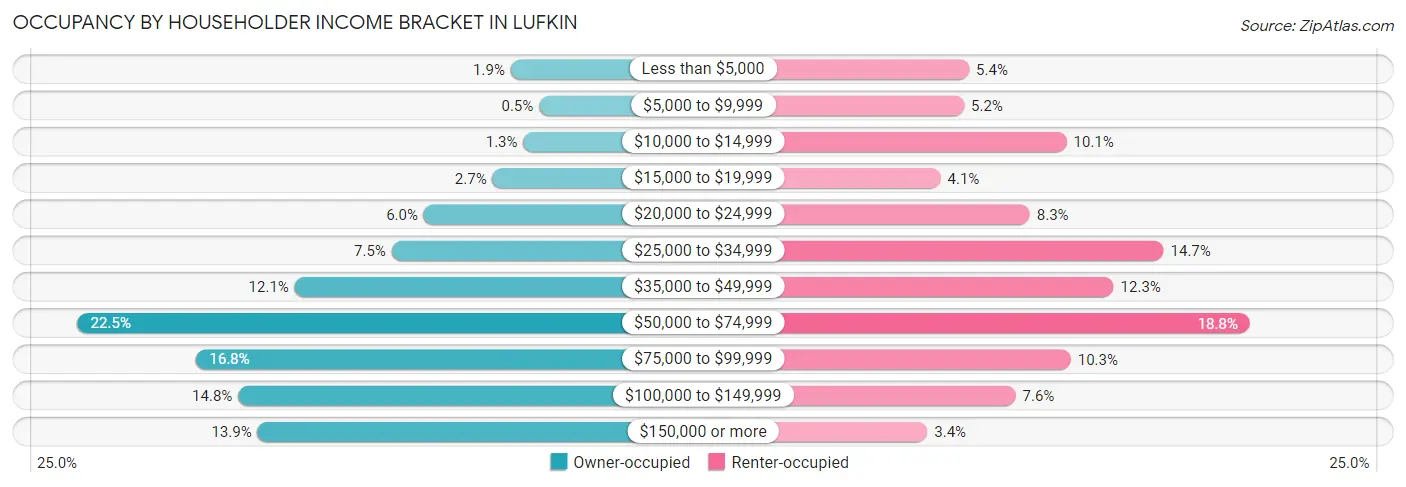
| Income Bracket | Owner-occupied | Renter-occupied |
| Less than $5,000 | 123 (1.8%) | 318 (5.4%) |
| $5,000 to $9,999 | 33 (0.5%) | 304 (5.2%) |
| $10,000 to $14,999 | 83 (1.3%) | 591 (10.1%) |
| $15,000 to $19,999 | 181 (2.7%) | 238 (4.1%) |
| $20,000 to $24,999 | 399 (6.0%) | 488 (8.3%) |
| $25,000 to $34,999 | 501 (7.5%) | 863 (14.7%) |
| $35,000 to $49,999 | 809 (12.1%) | 723 (12.3%) |
| $50,000 to $74,999 | 1,498 (22.5%) | 1,104 (18.8%) |
| $75,000 to $99,999 | 1,121 (16.8%) | 603 (10.2%) |
| $100,000 to $149,999 | 988 (14.8%) | 448 (7.6%) |
| $150,000 or more | 927 (13.9%) | 201 (3.4%) |
| Total | 6,663 (100.0%) | 5,881 (100.0%) |
Monthly Housing Cost Tiers in Lufkin
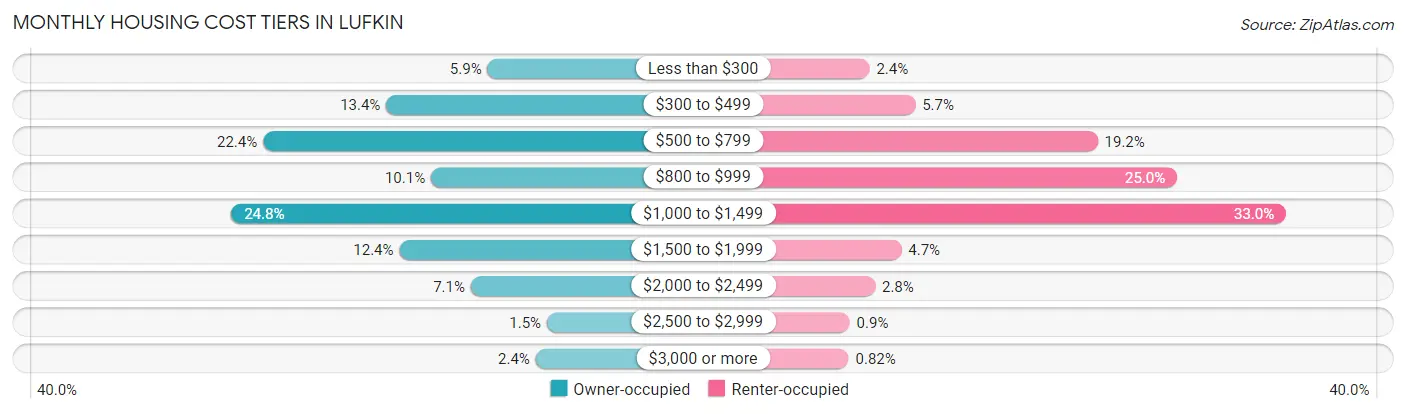
| Monthly Cost | Owner-occupied | Renter-occupied |
| Less than $300 | 394 (5.9%) | 139 (2.4%) |
| $300 to $499 | 891 (13.4%) | 337 (5.7%) |
| $500 to $799 | 1,495 (22.4%) | 1,127 (19.2%) |
| $800 to $999 | 671 (10.1%) | 1,471 (25.0%) |
| $1,000 to $1,499 | 1,651 (24.8%) | 1,943 (33.0%) |
| $1,500 to $1,999 | 826 (12.4%) | 277 (4.7%) |
| $2,000 to $2,499 | 476 (7.1%) | 163 (2.8%) |
| $2,500 to $2,999 | 102 (1.5%) | 53 (0.9%) |
| $3,000 or more | 157 (2.4%) | 48 (0.8%) |
| Total | 6,663 (100.0%) | 5,881 (100.0%) |
Physical Housing Characteristics in Lufkin
Housing Structures in Lufkin
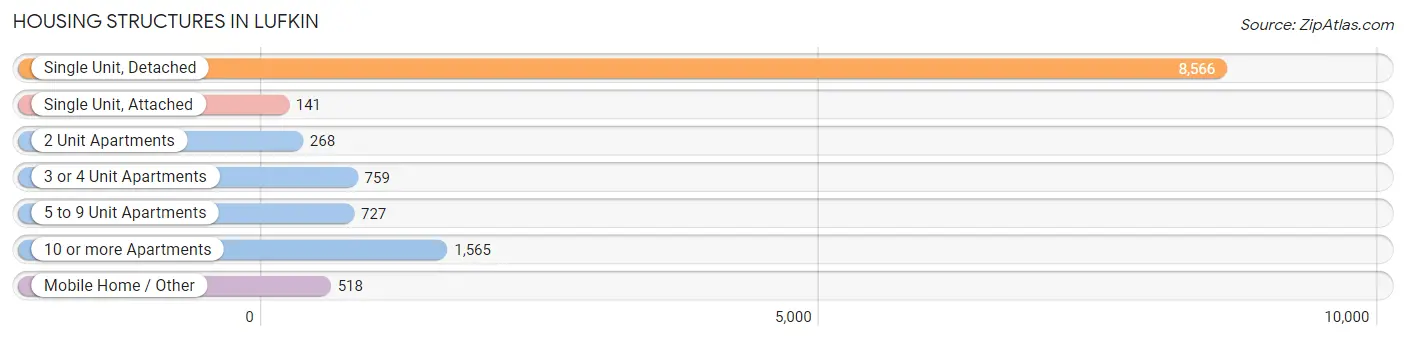
| Structure Type | # Housing Units | % Housing Units |
| Single Unit, Detached | 8,566 | 68.3% |
| Single Unit, Attached | 141 | 1.1% |
| 2 Unit Apartments | 268 | 2.1% |
| 3 or 4 Unit Apartments | 759 | 6.0% |
| 5 to 9 Unit Apartments | 727 | 5.8% |
| 10 or more Apartments | 1,565 | 12.5% |
| Mobile Home / Other | 518 | 4.1% |
| Total | 12,544 | 100.0% |
Housing Structures by Occupancy in Lufkin

| Structure Type | Owner-occupied | Renter-occupied |
| Single Unit, Detached | 6,210 (72.5%) | 2,356 (27.5%) |
| Single Unit, Attached | 64 (45.4%) | 77 (54.6%) |
| 2 Unit Apartments | 15 (5.6%) | 253 (94.4%) |
| 3 or 4 Unit Apartments | 0 (0.0%) | 759 (100.0%) |
| 5 to 9 Unit Apartments | 0 (0.0%) | 727 (100.0%) |
| 10 or more Apartments | 34 (2.2%) | 1,531 (97.8%) |
| Mobile Home / Other | 340 (65.6%) | 178 (34.4%) |
| Total | 6,663 (53.1%) | 5,881 (46.9%) |
Housing Structures by Number of Rooms in Lufkin
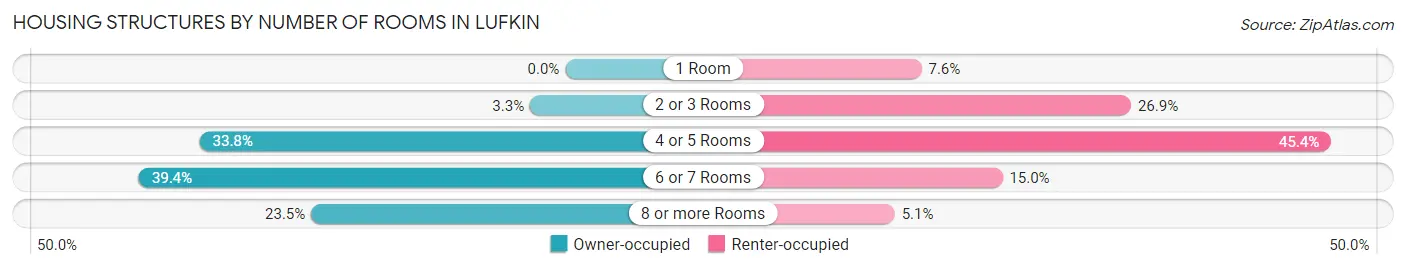
| Number of Rooms | Owner-occupied | Renter-occupied |
| 1 Room | 0 (0.0%) | 444 (7.5%) |
| 2 or 3 Rooms | 217 (3.3%) | 1,583 (26.9%) |
| 4 or 5 Rooms | 2,253 (33.8%) | 2,672 (45.4%) |
| 6 or 7 Rooms | 2,627 (39.4%) | 884 (15.0%) |
| 8 or more Rooms | 1,566 (23.5%) | 298 (5.1%) |
| Total | 6,663 (100.0%) | 5,881 (100.0%) |
Housing Structure by Heating Type in Lufkin
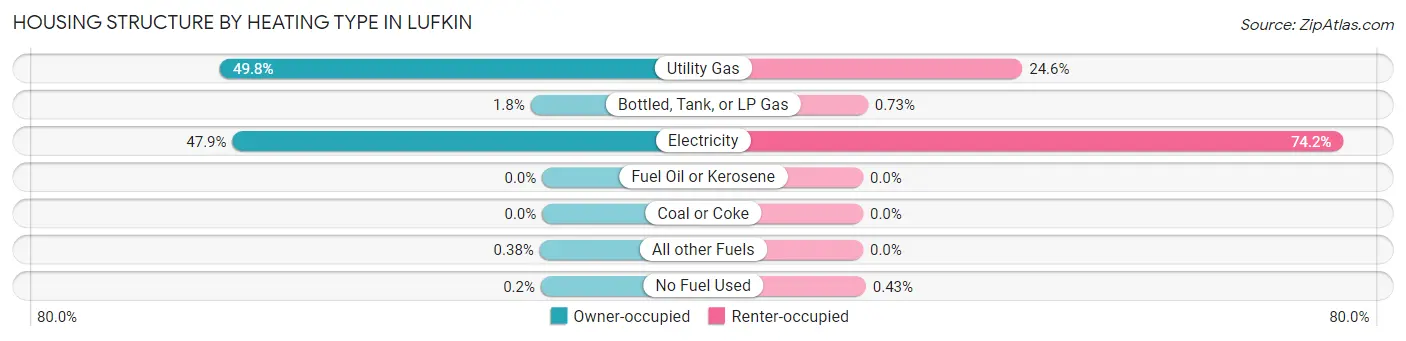
| Heating Type | Owner-occupied | Renter-occupied |
| Utility Gas | 3,316 (49.8%) | 1,448 (24.6%) |
| Bottled, Tank, or LP Gas | 119 (1.8%) | 43 (0.7%) |
| Electricity | 3,190 (47.9%) | 4,365 (74.2%) |
| Fuel Oil or Kerosene | 0 (0.0%) | 0 (0.0%) |
| Coal or Coke | 0 (0.0%) | 0 (0.0%) |
| All other Fuels | 25 (0.4%) | 0 (0.0%) |
| No Fuel Used | 13 (0.2%) | 25 (0.4%) |
| Total | 6,663 (100.0%) | 5,881 (100.0%) |
Household Vehicle Usage in Lufkin
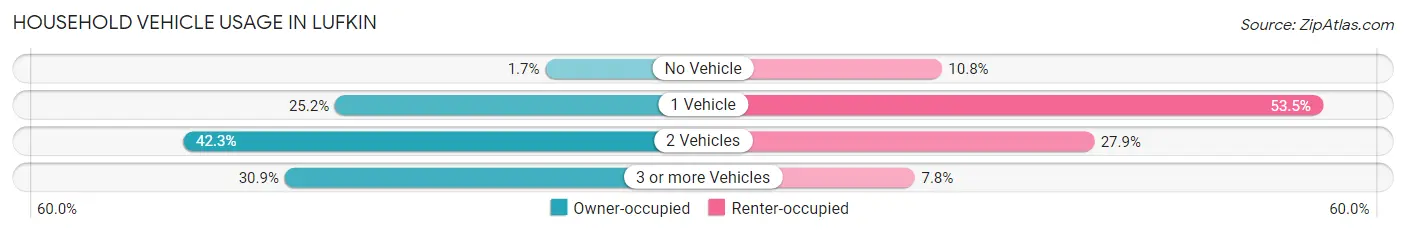
| Vehicles per Household | Owner-occupied | Renter-occupied |
| No Vehicle | 111 (1.7%) | 636 (10.8%) |
| 1 Vehicle | 1,681 (25.2%) | 3,147 (53.5%) |
| 2 Vehicles | 2,815 (42.2%) | 1,639 (27.9%) |
| 3 or more Vehicles | 2,056 (30.9%) | 459 (7.8%) |
| Total | 6,663 (100.0%) | 5,881 (100.0%) |
Real Estate & Mortgages in Lufkin
Real Estate and Mortgage Overview in Lufkin
| Characteristic | Without Mortgage | With Mortgage |
| Housing Units | 3,441 | 3,222 |
| Median Property Value | $132,000 | $152,100 |
| Median Household Income | $62,098 | $555 |
| Monthly Housing Costs | $561 | $141 |
| Real Estate Taxes | $1,838 | $28 |
Property Value by Mortgage Status in Lufkin
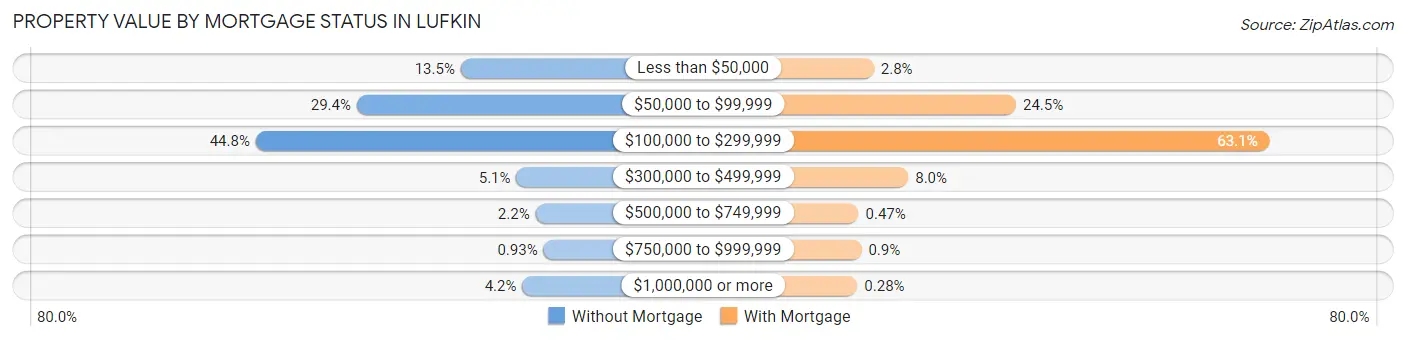
| Property Value | Without Mortgage | With Mortgage |
| Less than $50,000 | 466 (13.5%) | 90 (2.8%) |
| $50,000 to $99,999 | 1,011 (29.4%) | 788 (24.5%) |
| $100,000 to $299,999 | 1,541 (44.8%) | 2,032 (63.1%) |
| $300,000 to $499,999 | 174 (5.1%) | 259 (8.0%) |
| $500,000 to $749,999 | 74 (2.1%) | 15 (0.5%) |
| $750,000 to $999,999 | 32 (0.9%) | 29 (0.9%) |
| $1,000,000 or more | 143 (4.2%) | 9 (0.3%) |
| Total | 3,441 (100.0%) | 3,222 (100.0%) |
Household Income by Mortgage Status in Lufkin
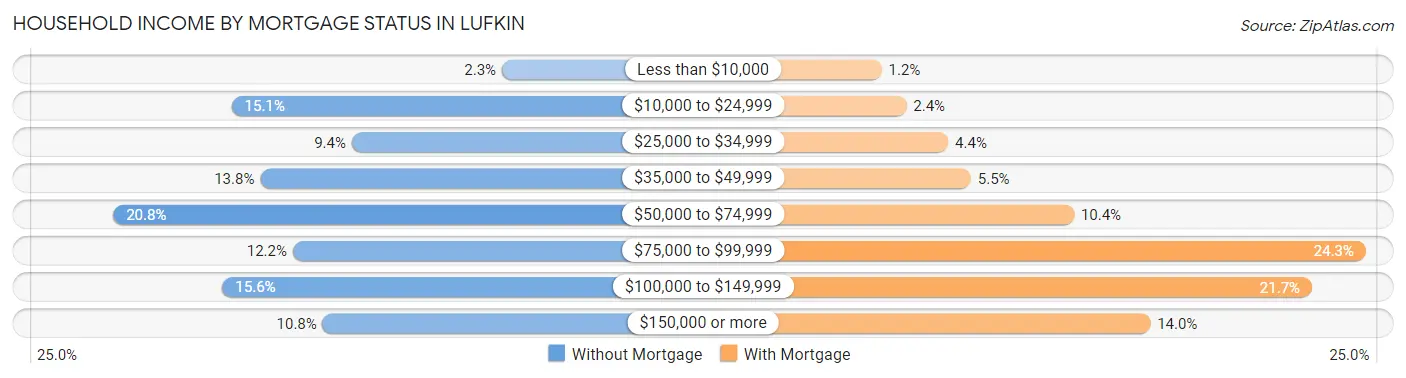
| Household Income | Without Mortgage | With Mortgage |
| Less than $10,000 | 78 (2.3%) | 40 (1.2%) |
| $10,000 to $24,999 | 521 (15.1%) | 78 (2.4%) |
| $25,000 to $34,999 | 324 (9.4%) | 142 (4.4%) |
| $35,000 to $49,999 | 474 (13.8%) | 177 (5.5%) |
| $50,000 to $74,999 | 715 (20.8%) | 335 (10.4%) |
| $75,000 to $99,999 | 421 (12.2%) | 783 (24.3%) |
| $100,000 to $149,999 | 536 (15.6%) | 700 (21.7%) |
| $150,000 or more | 372 (10.8%) | 452 (14.0%) |
| Total | 3,441 (100.0%) | 3,222 (100.0%) |
Property Value to Household Income Ratio in Lufkin
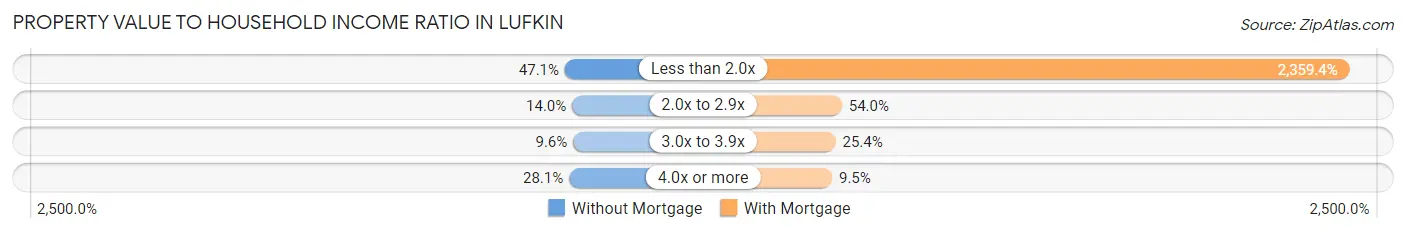
| Value-to-Income Ratio | Without Mortgage | With Mortgage |
| Less than 2.0x | 1,622 (47.1%) | 76,021 (2,359.4%) |
| 2.0x to 2.9x | 483 (14.0%) | 1,741 (54.0%) |
| 3.0x to 3.9x | 331 (9.6%) | 819 (25.4%) |
| 4.0x or more | 967 (28.1%) | 306 (9.5%) |
| Total | 3,441 (100.0%) | 3,222 (100.0%) |
Real Estate Taxes by Mortgage Status in Lufkin
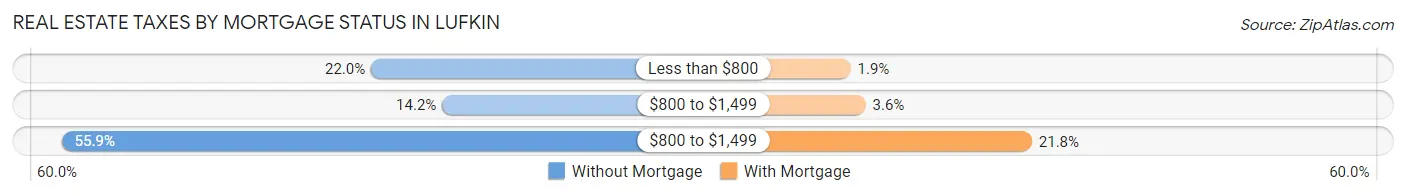
| Property Taxes | Without Mortgage | With Mortgage |
| Less than $800 | 758 (22.0%) | 62 (1.9%) |
| $800 to $1,499 | 490 (14.2%) | 115 (3.6%) |
| $800 to $1,499 | 1,925 (55.9%) | 702 (21.8%) |
| Total | 3,441 (100.0%) | 3,222 (100.0%) |
Health & Disability in Lufkin
Health Insurance Coverage by Age in Lufkin
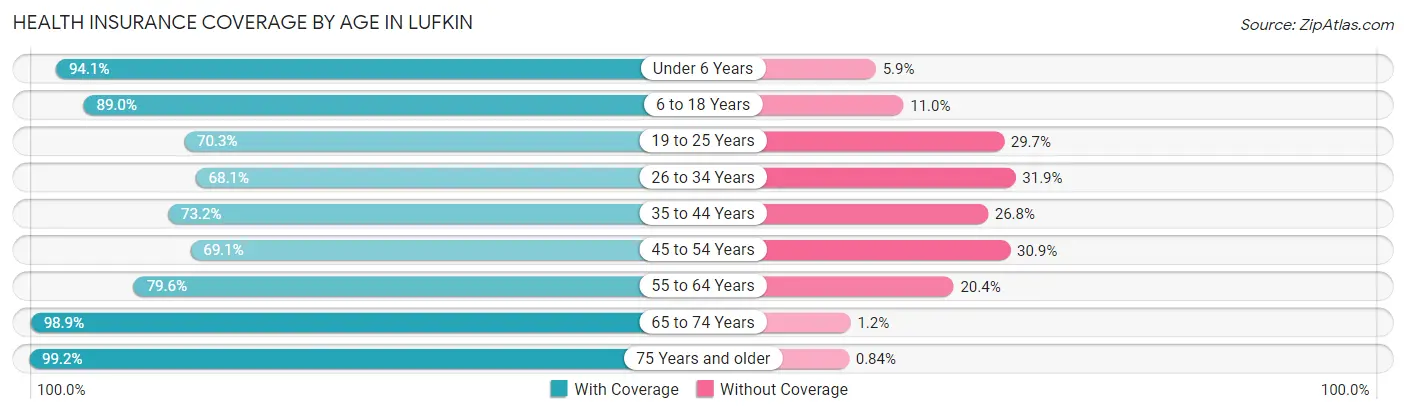
| Age Bracket | With Coverage | Without Coverage |
| Under 6 Years | 2,554 (94.1%) | 159 (5.9%) |
| 6 to 18 Years | 5,815 (89.0%) | 719 (11.0%) |
| 19 to 25 Years | 2,807 (70.3%) | 1,188 (29.7%) |
| 26 to 34 Years | 2,818 (68.1%) | 1,320 (31.9%) |
| 35 to 44 Years | 2,898 (73.2%) | 1,059 (26.8%) |
| 45 to 54 Years | 2,510 (69.1%) | 1,123 (30.9%) |
| 55 to 64 Years | 3,040 (79.6%) | 777 (20.4%) |
| 65 to 74 Years | 2,496 (98.9%) | 29 (1.1%) |
| 75 Years and older | 2,014 (99.2%) | 17 (0.8%) |
| Total | 26,952 (80.8%) | 6,391 (19.2%) |
Health Insurance Coverage by Citizenship Status in Lufkin
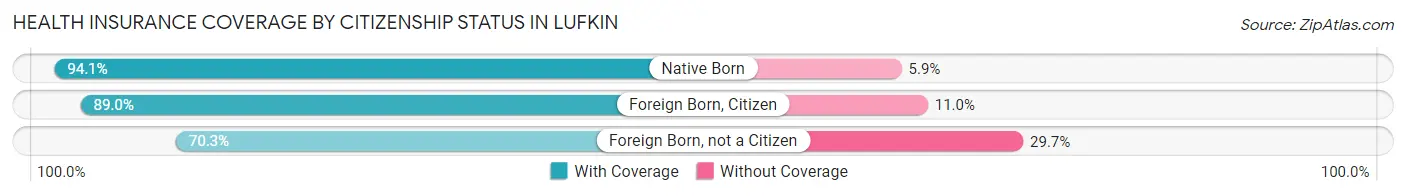
| Citizenship Status | With Coverage | Without Coverage |
| Native Born | 2,554 (94.1%) | 159 (5.9%) |
| Foreign Born, Citizen | 5,815 (89.0%) | 719 (11.0%) |
| Foreign Born, not a Citizen | 2,807 (70.3%) | 1,188 (29.7%) |
Health Insurance Coverage by Household Income in Lufkin
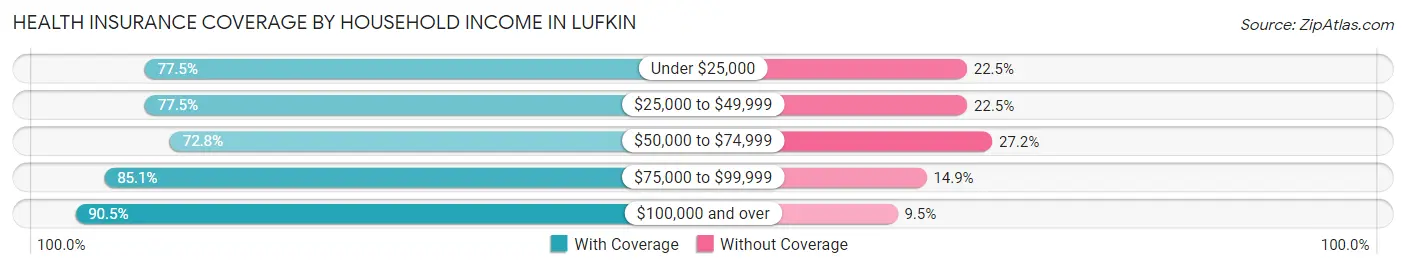
| Household Income | With Coverage | Without Coverage |
| Under $25,000 | 4,004 (77.5%) | 1,161 (22.5%) |
| $25,000 to $49,999 | 5,296 (77.5%) | 1,541 (22.5%) |
| $50,000 to $74,999 | 5,639 (72.8%) | 2,108 (27.2%) |
| $75,000 to $99,999 | 4,421 (85.1%) | 775 (14.9%) |
| $100,000 and over | 7,069 (90.5%) | 741 (9.5%) |
Public vs Private Health Insurance Coverage by Age in Lufkin
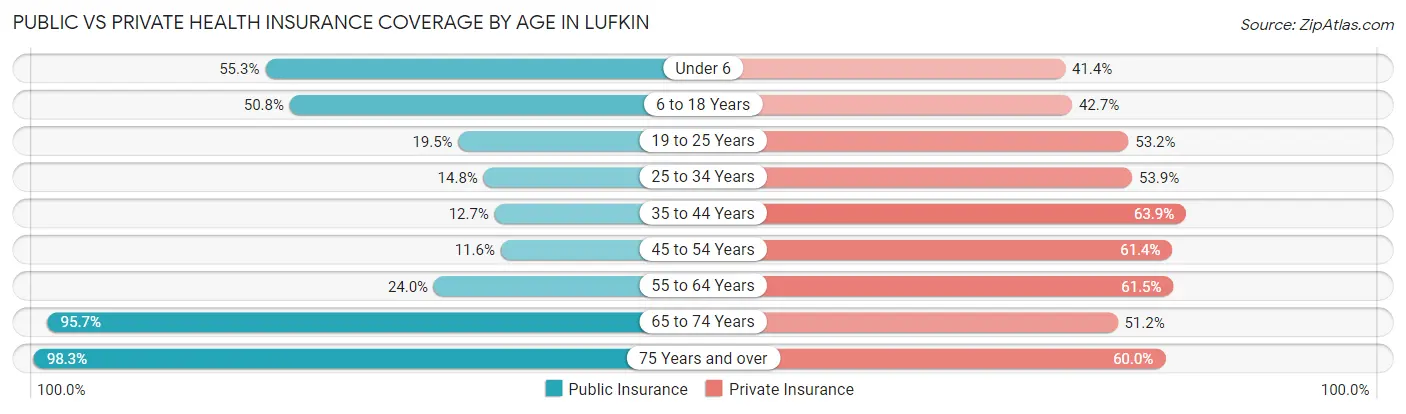
| Age Bracket | Public Insurance | Private Insurance |
| Under 6 | 1,501 (55.3%) | 1,124 (41.4%) |
| 6 to 18 Years | 3,317 (50.8%) | 2,792 (42.7%) |
| 19 to 25 Years | 778 (19.5%) | 2,125 (53.2%) |
| 25 to 34 Years | 612 (14.8%) | 2,229 (53.9%) |
| 35 to 44 Years | 504 (12.7%) | 2,528 (63.9%) |
| 45 to 54 Years | 422 (11.6%) | 2,229 (61.4%) |
| 55 to 64 Years | 917 (24.0%) | 2,349 (61.5%) |
| 65 to 74 Years | 2,417 (95.7%) | 1,292 (51.2%) |
| 75 Years and over | 1,996 (98.3%) | 1,219 (60.0%) |
| Total | 12,464 (37.4%) | 17,887 (53.6%) |
Disability Status by Sex by Age in Lufkin
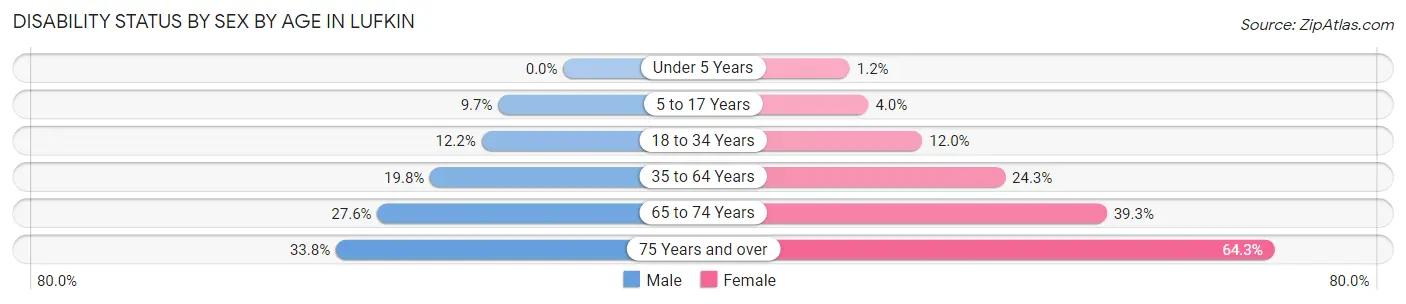
| Age Bracket | Male | Female |
| Under 5 Years | 0 (0.0%) | 15 (1.2%) |
| 5 to 17 Years | 350 (9.7%) | 127 (4.0%) |
| 18 to 34 Years | 500 (12.1%) | 507 (12.0%) |
| 35 to 64 Years | 1,040 (19.8%) | 1,491 (24.2%) |
| 65 to 74 Years | 302 (27.6%) | 563 (39.3%) |
| 75 Years and over | 237 (33.8%) | 854 (64.3%) |
Disability Class by Sex by Age in Lufkin
Disability Class: Hearing Difficulty
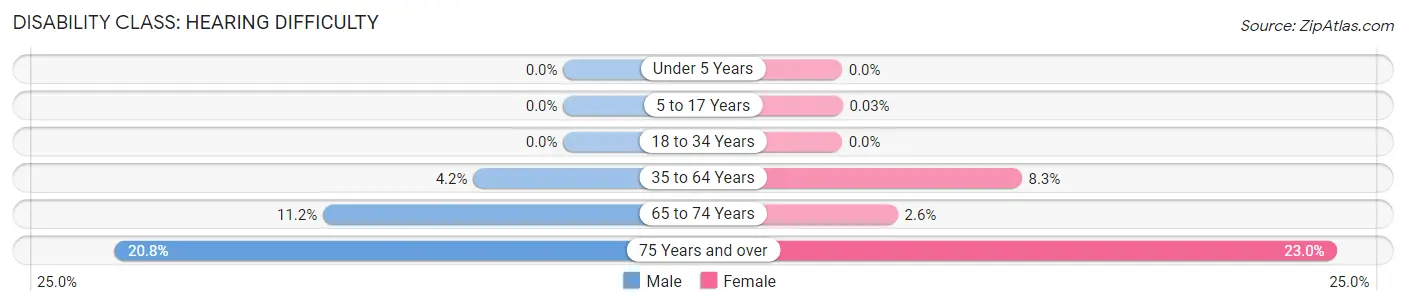
| Age Bracket | Male | Female |
| Under 5 Years | 0 (0.0%) | 0 (0.0%) |
| 5 to 17 Years | 0 (0.0%) | 1 (0.0%) |
| 18 to 34 Years | 0 (0.0%) | 0 (0.0%) |
| 35 to 64 Years | 220 (4.2%) | 513 (8.3%) |
| 65 to 74 Years | 122 (11.2%) | 37 (2.6%) |
| 75 Years and over | 146 (20.8%) | 305 (23.0%) |
Disability Class: Vision Difficulty
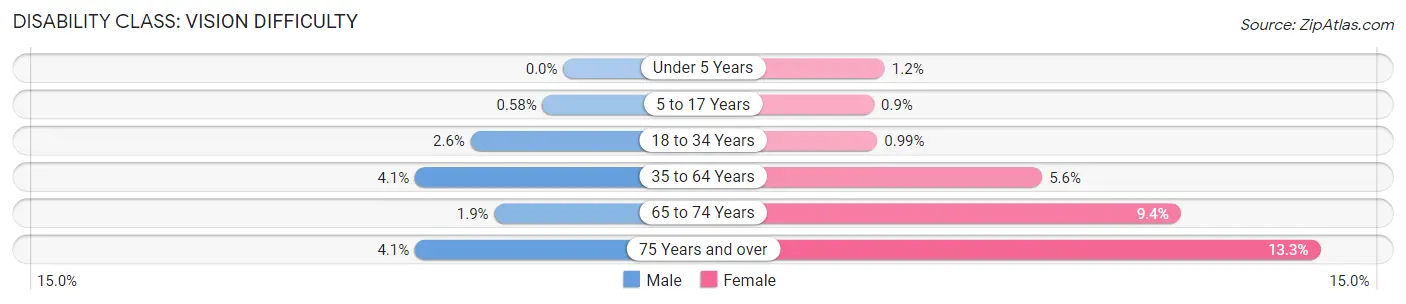
| Age Bracket | Male | Female |
| Under 5 Years | 0 (0.0%) | 15 (1.2%) |
| 5 to 17 Years | 21 (0.6%) | 29 (0.9%) |
| 18 to 34 Years | 106 (2.6%) | 42 (1.0%) |
| 35 to 64 Years | 217 (4.1%) | 343 (5.6%) |
| 65 to 74 Years | 21 (1.9%) | 135 (9.4%) |
| 75 Years and over | 29 (4.1%) | 177 (13.3%) |
Disability Class: Cognitive Difficulty
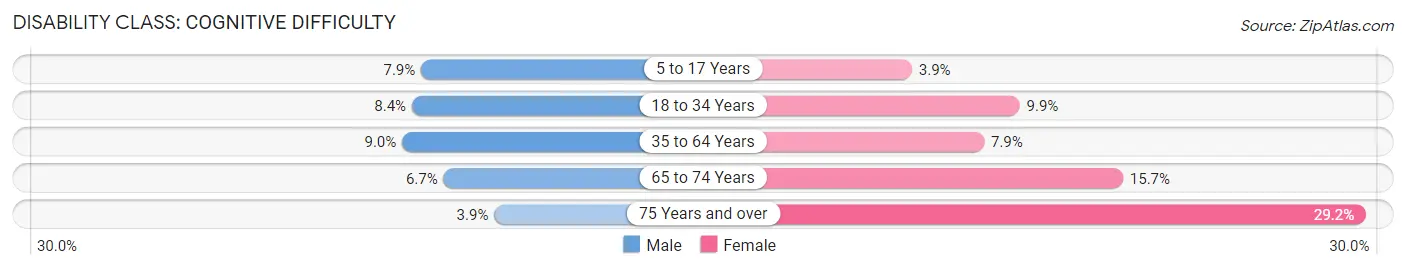
| Age Bracket | Male | Female |
| 5 to 17 Years | 287 (7.9%) | 125 (3.9%) |
| 18 to 34 Years | 347 (8.4%) | 419 (9.9%) |
| 35 to 64 Years | 472 (9.0%) | 487 (7.9%) |
| 65 to 74 Years | 73 (6.7%) | 224 (15.7%) |
| 75 Years and over | 27 (3.8%) | 388 (29.2%) |
Disability Class: Ambulatory Difficulty
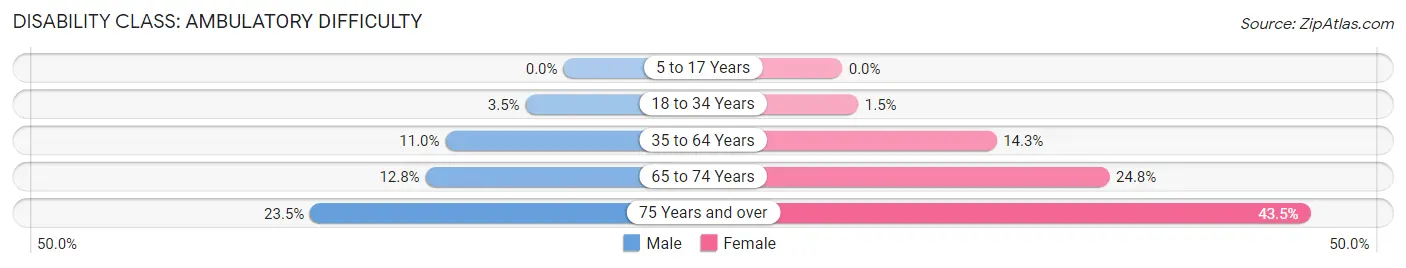
| Age Bracket | Male | Female |
| 5 to 17 Years | 0 (0.0%) | 0 (0.0%) |
| 18 to 34 Years | 145 (3.5%) | 63 (1.5%) |
| 35 to 64 Years | 576 (11.0%) | 881 (14.3%) |
| 65 to 74 Years | 140 (12.8%) | 355 (24.8%) |
| 75 Years and over | 165 (23.5%) | 578 (43.5%) |
Disability Class: Self-Care Difficulty
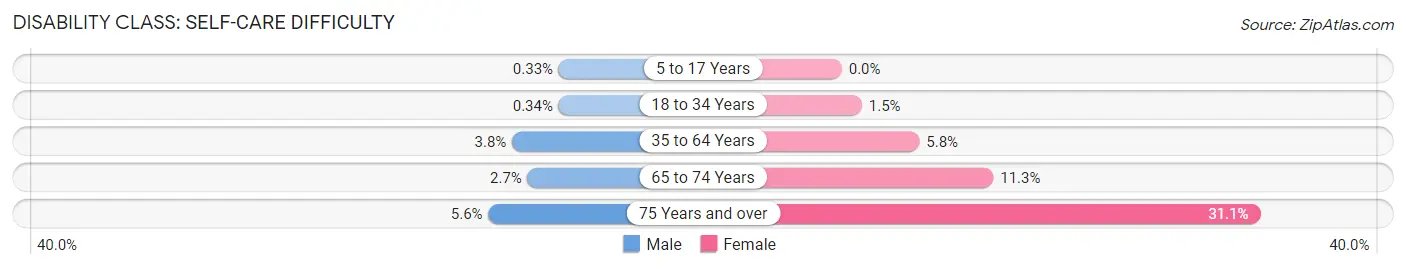
| Age Bracket | Male | Female |
| 5 to 17 Years | 12 (0.3%) | 0 (0.0%) |
| 18 to 34 Years | 14 (0.3%) | 63 (1.5%) |
| 35 to 64 Years | 200 (3.8%) | 354 (5.8%) |
| 65 to 74 Years | 29 (2.6%) | 161 (11.3%) |
| 75 Years and over | 39 (5.6%) | 413 (31.1%) |
Technology Access in Lufkin
Computing Device Access in Lufkin
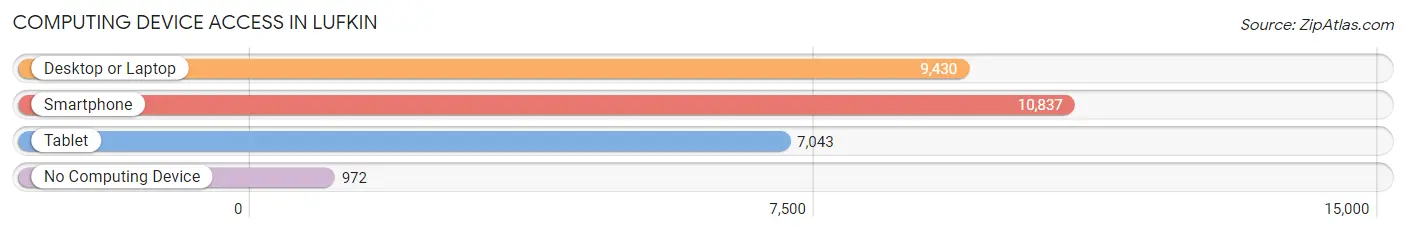
| Device Type | # Households | % Households |
| Desktop or Laptop | 9,430 | 75.2% |
| Smartphone | 10,837 | 86.4% |
| Tablet | 7,043 | 56.1% |
| No Computing Device | 972 | 7.7% |
| Total | 12,544 | 100.0% |
Internet Access in Lufkin
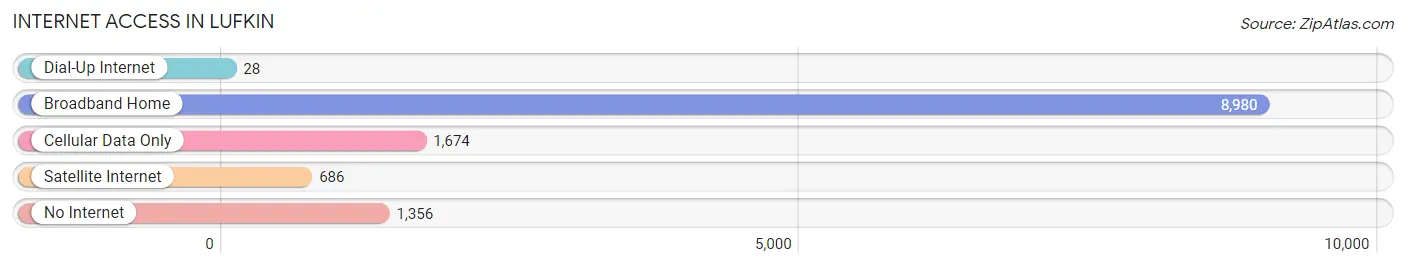
| Internet Type | # Households | % Households |
| Dial-Up Internet | 28 | 0.2% |
| Broadband Home | 8,980 | 71.6% |
| Cellular Data Only | 1,674 | 13.4% |
| Satellite Internet | 686 | 5.5% |
| No Internet | 1,356 | 10.8% |
| Total | 12,544 | 100.0% |
Lufkin Summary
Lufkin, Texas is a city located in Angelina County in the East Texas region of the United States. It is the county seat of Angelina County and is situated in the heart of the Piney Woods region of Texas. The city is located approximately 120 miles northeast of Houston and is the largest city in Angelina County. As of the 2010 census, the population of Lufkin was 35,067.
History
The area that is now Lufkin was first settled in the early 1840s by a group of settlers from Alabama. The settlement was originally known as “Davis’ Settlement” and was located near the present-day city of Diboll. In 1884, the Houston, East and West Texas Railway was built through the area and the settlement was renamed “Lufkin” after railroad official Abraham Lufkin. The city was officially incorporated in 1885 and quickly became a center for the lumber industry. The city’s population grew rapidly in the late 19th and early 20th centuries as the lumber industry flourished.
Geography
Lufkin is located in the East Texas region of the United States at the intersection of U.S. Highway 59 and State Highway 103. The city is situated in the heart of the Piney Woods region of Texas and is surrounded by dense forests of pine and hardwood trees. The city is located approximately 120 miles northeast of Houston and is the largest city in Angelina County. The city has a total area of 24.2 square miles, of which 24.1 square miles is land and 0.1 square miles is water.
Economy
Lufkin’s economy is largely based on the lumber industry. The city is home to several large lumber mills and is a major producer of lumber products. The city is also home to several manufacturing companies, including a large paper mill and a large steel mill. In addition, the city is home to several retail stores, restaurants, and other businesses.
Demographics
As of the 2010 census, the population of Lufkin was 35,067. The racial makeup of the city was 68.2% White, 24.3% African American, 0.7% Native American, 1.2% Asian, 0.1% Pacific Islander, 3.2% from other races, and 2.3% from two or more races. Hispanic or Latino of any race were 8.2% of the population. The median household income in Lufkin was $37,945 and the median family income was $45,945. The per capita income in Lufkin was $20,845.
Lufkin is a diverse city with a rich history and a vibrant economy. The city is home to a variety of businesses and industries and is a major producer of lumber products. The city is also home to a diverse population with a variety of racial and ethnic backgrounds. Lufkin is a great place to live, work, and play and is a great example of the beauty and diversity of East Texas.
Common Questions
What is Per Capita Income in Lufkin?
Per Capita income in Lufkin is $26,904.
What is the Median Family Income in Lufkin?
Median Family Income in Lufkin is $67,598.
What is the Median Household income in Lufkin?
Median Household Income in Lufkin is $57,938.
What is Income or Wage Gap in Lufkin?
Income or Wage Gap in Lufkin is 34.4%.
Women in Lufkin earn 65.6 cents for every dollar earned by a man.
What is Family Income Deficit in Lufkin?
Family Income Deficit in Lufkin is $11,699.
Families that are below poverty line in Lufkin earn $11,699 less on average than the poverty threshold level.
What is Inequality or Gini Index in Lufkin?
Inequality or Gini Index in Lufkin is 0.45.
What is the Total Population of Lufkin?
Total Population of Lufkin is 34,165.
What is the Total Male Population of Lufkin?
Total Male Population of Lufkin is 16,139.
What is the Total Female Population of Lufkin?
Total Female Population of Lufkin is 18,026.
What is the Ratio of Males per 100 Females in Lufkin?
There are 89.53 Males per 100 Females in Lufkin.
What is the Ratio of Females per 100 Males in Lufkin?
There are 111.69 Females per 100 Males in Lufkin.
What is the Median Population Age in Lufkin?
Median Population Age in Lufkin is 33.6 Years.
What is the Average Family Size in Lufkin
Average Family Size in Lufkin is 3.3 People.
What is the Average Household Size in Lufkin
Average Household Size in Lufkin is 2.6 People.
How Large is the Labor Force in Lufkin?
There are 16,270 People in the Labor Forcein in Lufkin.
What is the Percentage of People in the Labor Force in Lufkin?
62.2% of People are in the Labor Force in Lufkin.
What is the Unemployment Rate in Lufkin?
Unemployment Rate in Lufkin is 6.9%.