Hermleigh, TX Map & Demographics
Hermleigh Map
Hermleigh Overview
$22,511
PER CAPITA INCOME
$67,031
AVG FAMILY INCOME
$50,179
AVG HOUSEHOLD INCOME
33.1%
WAGE / INCOME GAP [ % ]
66.9¢/ $1
WAGE / INCOME GAP [ $ ]
0.39
INEQUALITY / GINI INDEX
429
TOTAL POPULATION
271
MALE POPULATION
158
FEMALE POPULATION
171.52
MALES / 100 FEMALES
58.30
FEMALES / 100 MALES
43.1
MEDIAN AGE
4.3
AVG FAMILY SIZE
3.1
AVG HOUSEHOLD SIZE
135
LABOR FORCE [ PEOPLE ]
44.9%
PERCENT IN LABOR FORCE
9.6%
UNEMPLOYMENT RATE
Hermleigh Zip Codes
Hermleigh Area Codes
Income in Hermleigh
Income Overview in Hermleigh
Per Capita Income in Hermleigh is $22,511, while median incomes of families and households are $67,031 and $50,179 respectively.
| Characteristic | Number | Measure |
| Per Capita Income | 429 | $22,511 |
| Median Family Income | 85 | $67,031 |
| Mean Family Income | 85 | $83,918 |
| Median Household Income | 139 | $50,179 |
| Mean Household Income | 139 | $63,662 |
| Income Deficit | 85 | $0 |
| Wage / Income Gap (%) | 429 | 33.10% |
| Wage / Income Gap ($) | 429 | 66.90¢ per $1 |
| Gini / Inequality Index | 429 | 0.39 |
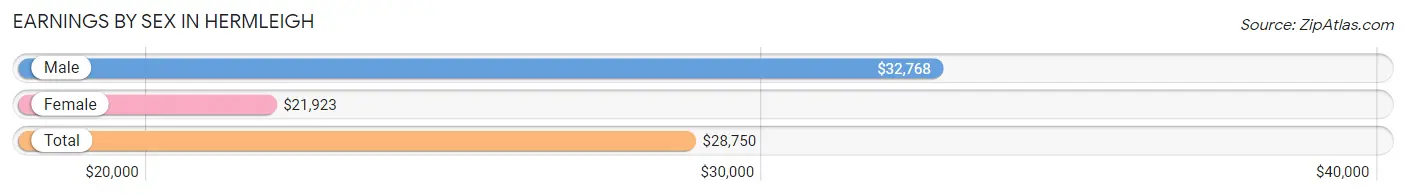
Earnings by Sex in Hermleigh
Average Earnings in Hermleigh are $28,750, $32,768 for men and $21,923 for women, a difference of 33.1%.
| Sex | Number | Average Earnings |
| Male | 77 (57.0%) | $32,768 |
| Female | 58 (43.0%) | $21,923 |
| Total | 135 (100.0%) | $28,750 |
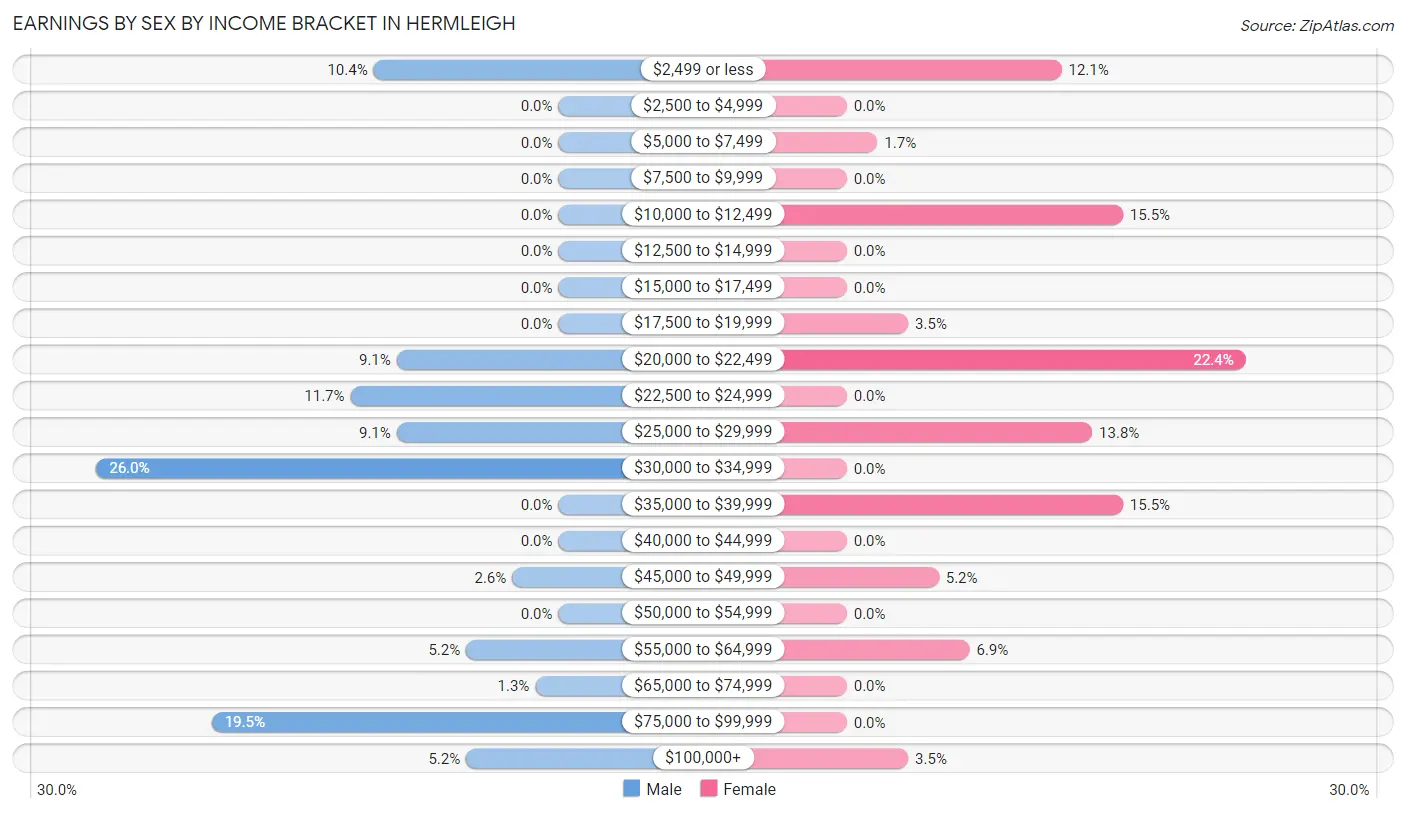
Earnings by Sex by Income Bracket in Hermleigh
The most common earnings brackets in Hermleigh are $30,000 to $34,999 for men (20 | 26.0%) and $20,000 to $22,499 for women (13 | 22.4%).
| Income | Male | Female |
| $2,499 or less | 8 (10.4%) | 7 (12.1%) |
| $2,500 to $4,999 | 0 (0.0%) | 0 (0.0%) |
| $5,000 to $7,499 | 0 (0.0%) | 1 (1.7%) |
| $7,500 to $9,999 | 0 (0.0%) | 0 (0.0%) |
| $10,000 to $12,499 | 0 (0.0%) | 9 (15.5%) |
| $12,500 to $14,999 | 0 (0.0%) | 0 (0.0%) |
| $15,000 to $17,499 | 0 (0.0%) | 0 (0.0%) |
| $17,500 to $19,999 | 0 (0.0%) | 2 (3.5%) |
| $20,000 to $22,499 | 7 (9.1%) | 13 (22.4%) |
| $22,500 to $24,999 | 9 (11.7%) | 0 (0.0%) |
| $25,000 to $29,999 | 7 (9.1%) | 8 (13.8%) |
| $30,000 to $34,999 | 20 (26.0%) | 0 (0.0%) |
| $35,000 to $39,999 | 0 (0.0%) | 9 (15.5%) |
| $40,000 to $44,999 | 0 (0.0%) | 0 (0.0%) |
| $45,000 to $49,999 | 2 (2.6%) | 3 (5.2%) |
| $50,000 to $54,999 | 0 (0.0%) | 0 (0.0%) |
| $55,000 to $64,999 | 4 (5.2%) | 4 (6.9%) |
| $65,000 to $74,999 | 1 (1.3%) | 0 (0.0%) |
| $75,000 to $99,999 | 15 (19.5%) | 0 (0.0%) |
| $100,000+ | 4 (5.2%) | 2 (3.5%) |
| Total | 77 (100.0%) | 58 (100.0%) |
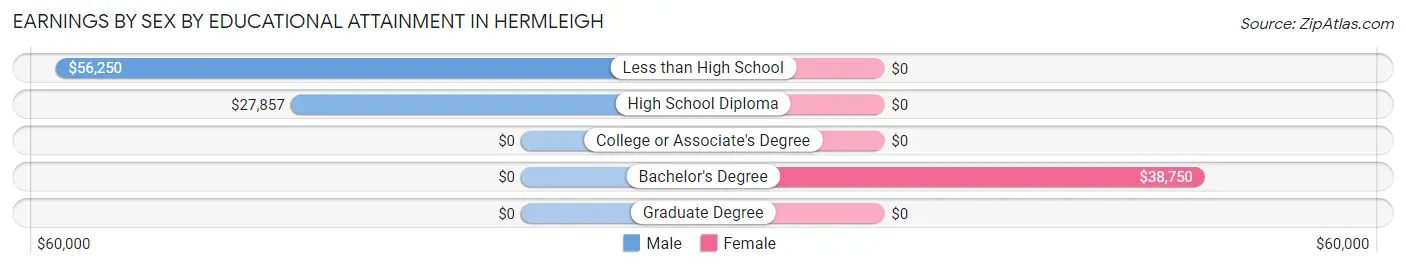
Earnings by Sex by Educational Attainment in Hermleigh
Average earnings in Hermleigh are $33,036 for men and $27,031 for women, a difference of 18.2%. Men with an educational attainment of less than high school enjoy the highest average annual earnings of $56,250, while those with high school diploma education earn the least with $27,857. Women with an educational attainment of bachelor's degree earn the most with the average annual earnings of $38,750, while those with bachelor's degree education have the smallest earnings of $38,750.
| Educational Attainment | Male Income | Female Income |
| Less than High School | $56,250 | $0 |
| High School Diploma | $27,857 | $0 |
| College or Associate's Degree | - | - |
| Bachelor's Degree | - | - |
| Graduate Degree | - | - |
| Total | $33,036 | $27,031 |
Family Income in Hermleigh
Family Income Brackets in Hermleigh
According to the Hermleigh family income data, there are 25 families falling into the $50,000 to $74,999 income range, which is the most common income bracket and makes up 29.4% of all families.
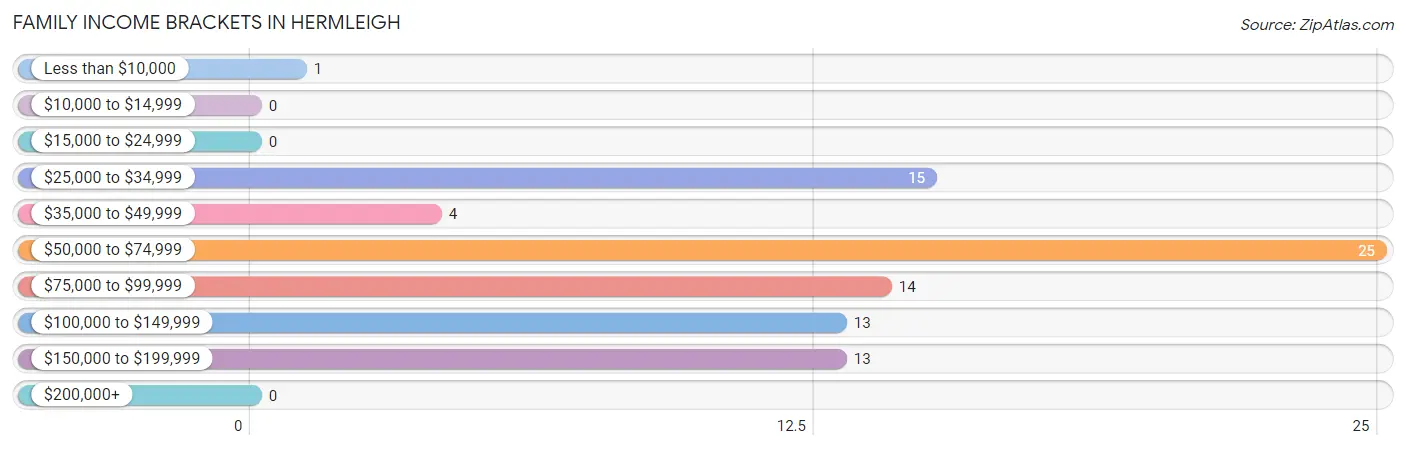
| Income Bracket | # Families | % Families |
| Less than $10,000 | 1 | 1.2% |
| $10,000 to $14,999 | 0 | 0.0% |
| $15,000 to $24,999 | 0 | 0.0% |
| $25,000 to $34,999 | 15 | 17.6% |
| $35,000 to $49,999 | 4 | 4.7% |
| $50,000 to $74,999 | 25 | 29.4% |
| $75,000 to $99,999 | 14 | 16.5% |
| $100,000 to $149,999 | 13 | 15.3% |
| $150,000 to $199,999 | 13 | 15.3% |
| $200,000+ | 0 | 0.0% |
Family Income by Famaliy Size in Hermleigh
3-person families (31 | 36.5%) account for the highest median family income in Hermleigh with $85,536 per family, while 2-person families (30 | 35.3%) have the highest median income of $37,916 per family member.
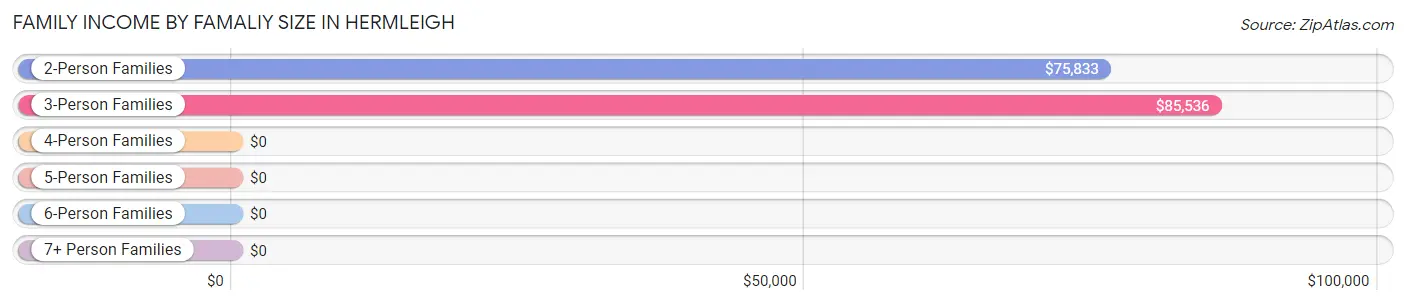
| Income Bracket | # Families | Median Income |
| 2-Person Families | 30 (35.3%) | $75,833 |
| 3-Person Families | 31 (36.5%) | $85,536 |
| 4-Person Families | 12 (14.1%) | $0 |
| 5-Person Families | 12 (14.1%) | $0 |
| 6-Person Families | 0 (0.0%) | $0 |
| 7+ Person Families | 0 (0.0%) | $0 |
| Total | 85 (100.0%) | $67,031 |
Family Income by Number of Earners in Hermleigh
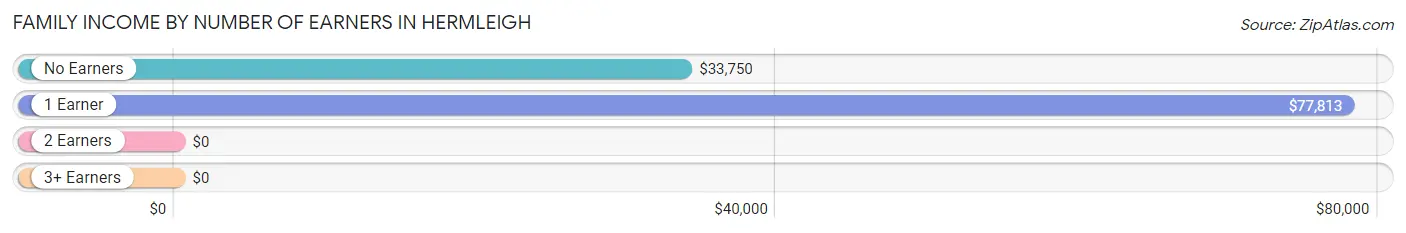
| Number of Earners | # Families | Median Income |
| No Earners | 16 (18.8%) | $33,750 |
| 1 Earner | 39 (45.9%) | $77,813 |
| 2 Earners | 24 (28.2%) | $0 |
| 3+ Earners | 6 (7.1%) | $0 |
| Total | 85 (100.0%) | $67,031 |
Household Income in Hermleigh
Household Income Brackets in Hermleigh
With 38 households falling in the category, the $25,000 to $34,999 income range is the most frequent in Hermleigh, accounting for 27.3% of all households.
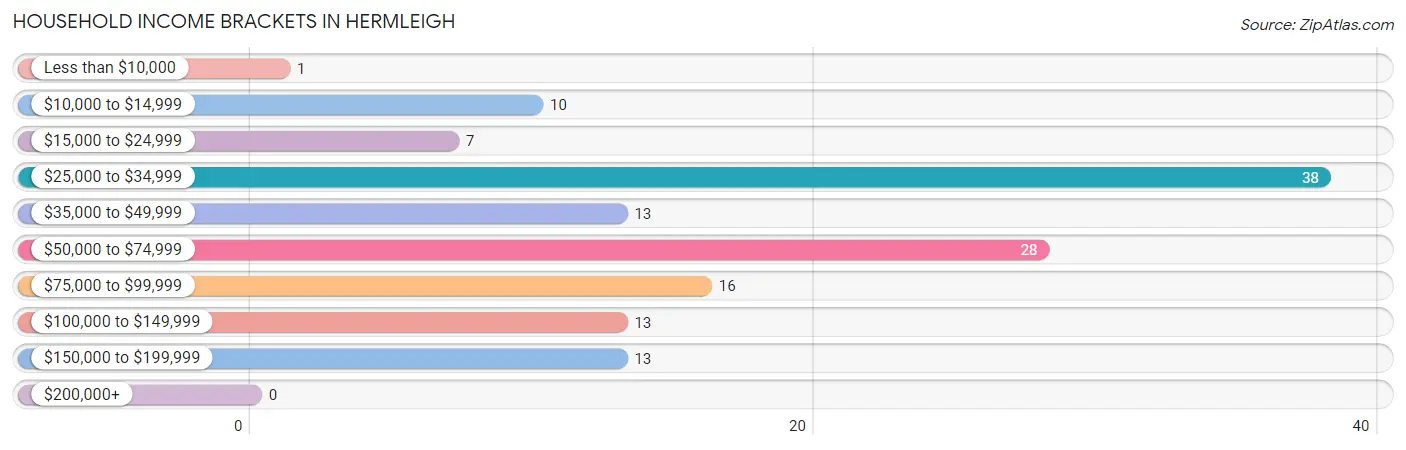
| Income Bracket | # Households | % Households |
| Less than $10,000 | 1 | 0.7% |
| $10,000 to $14,999 | 10 | 7.2% |
| $15,000 to $24,999 | 7 | 5.0% |
| $25,000 to $34,999 | 38 | 27.3% |
| $35,000 to $49,999 | 13 | 9.4% |
| $50,000 to $74,999 | 28 | 20.1% |
| $75,000 to $99,999 | 16 | 11.5% |
| $100,000 to $149,999 | 13 | 9.4% |
| $150,000 to $199,999 | 13 | 9.4% |
| $200,000+ | 0 | 0.0% |
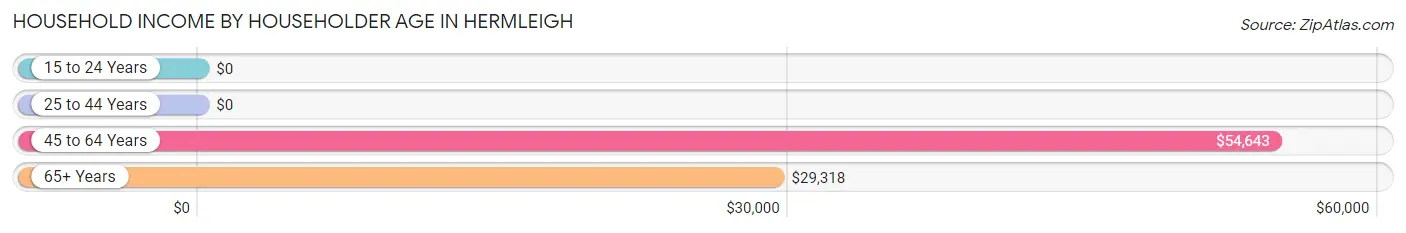
Household Income by Householder Age in Hermleigh
The median household income in Hermleigh is $50,179, with the highest median household income of $54,643 found in the 45 to 64 years age bracket for the primary householder. A total of 54 households (38.9%) fall into this category. Meanwhile, the 15 to 24 years age bracket for the primary householder has the lowest median household income of $0, with 1 households (0.7%) in this group.
| Income Bracket | # Households | Median Income |
| 15 to 24 Years | 1 (0.7%) | $0 |
| 25 to 44 Years | 18 (13.0%) | $0 |
| 45 to 64 Years | 54 (38.9%) | $54,643 |
| 65+ Years | 66 (47.5%) | $29,318 |
| Total | 139 (100.0%) | $50,179 |
Poverty in Hermleigh
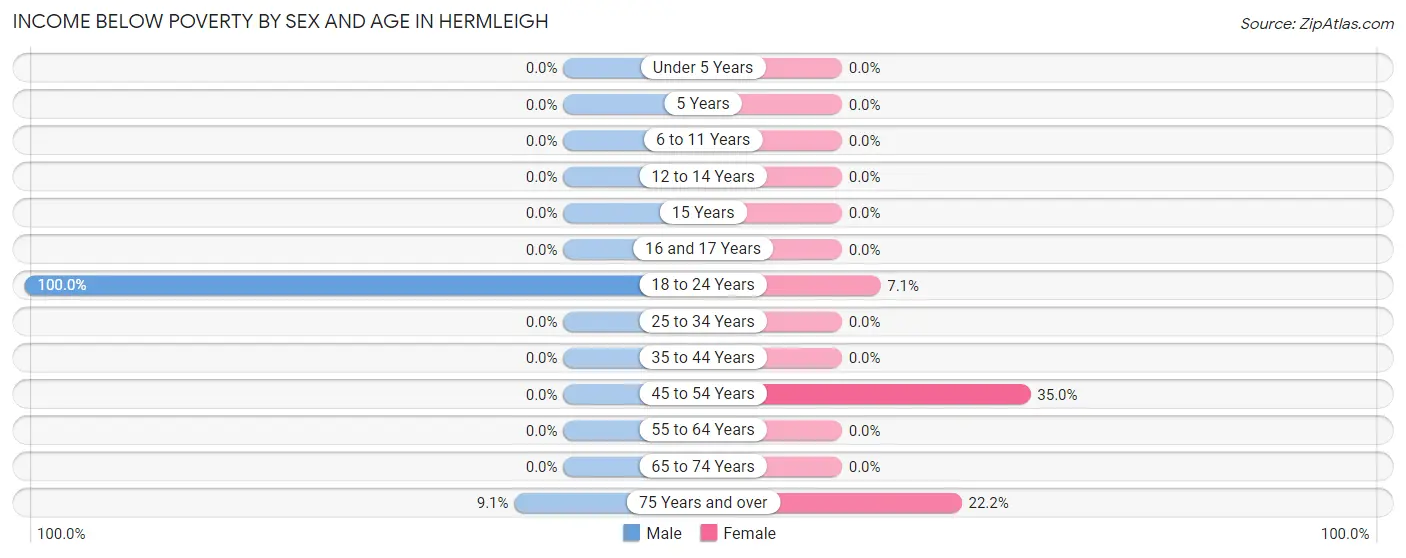
Income Below Poverty by Sex and Age in Hermleigh
With 1.8% poverty level for males and 10.1% for females among the residents of Hermleigh, 18 to 24 year old males and 45 to 54 year old females are the most vulnerable to poverty, with 3 males (100.0%) and 7 females (35.0%) in their respective age groups living below the poverty level.
| Age Bracket | Male | Female |
| Under 5 Years | 0 (0.0%) | 0 (0.0%) |
| 5 Years | 0 (0.0%) | 0 (0.0%) |
| 6 to 11 Years | 0 (0.0%) | 0 (0.0%) |
| 12 to 14 Years | 0 (0.0%) | 0 (0.0%) |
| 15 Years | 0 (0.0%) | 0 (0.0%) |
| 16 and 17 Years | 0 (0.0%) | 0 (0.0%) |
| 18 to 24 Years | 3 (100.0%) | 1 (7.1%) |
| 25 to 34 Years | 0 (0.0%) | 0 (0.0%) |
| 35 to 44 Years | 0 (0.0%) | 0 (0.0%) |
| 45 to 54 Years | 0 (0.0%) | 7 (35.0%) |
| 55 to 64 Years | 0 (0.0%) | 0 (0.0%) |
| 65 to 74 Years | 0 (0.0%) | 0 (0.0%) |
| 75 Years and over | 2 (9.1%) | 8 (22.2%) |
| Total | 5 (1.8%) | 16 (10.1%) |
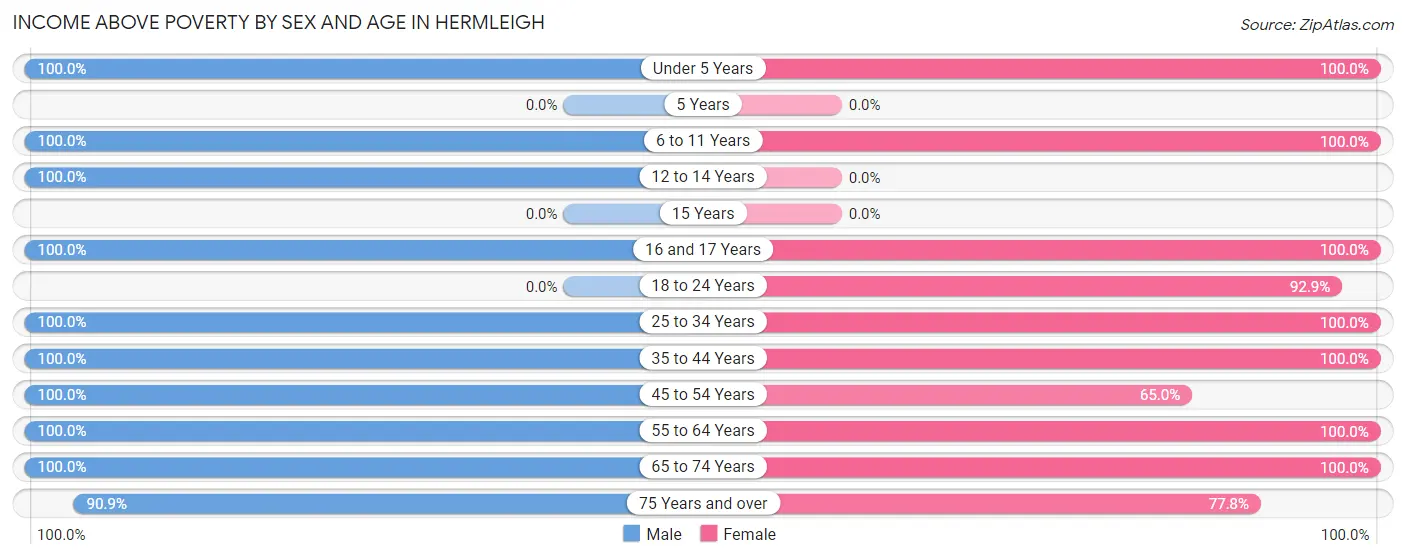
Income Above Poverty by Sex and Age in Hermleigh
According to the poverty statistics in Hermleigh, males aged under 5 years and females aged under 5 years are the age groups that are most secure financially, with 100.0% of males and 100.0% of females in these age groups living above the poverty line.
| Age Bracket | Male | Female |
| Under 5 Years | 37 (100.0%) | 3 (100.0%) |
| 5 Years | 0 (0.0%) | 0 (0.0%) |
| 6 to 11 Years | 52 (100.0%) | 19 (100.0%) |
| 12 to 14 Years | 17 (100.0%) | 0 (0.0%) |
| 15 Years | 0 (0.0%) | 0 (0.0%) |
| 16 and 17 Years | 18 (100.0%) | 6 (100.0%) |
| 18 to 24 Years | 0 (0.0%) | 13 (92.9%) |
| 25 to 34 Years | 20 (100.0%) | 19 (100.0%) |
| 35 to 44 Years | 4 (100.0%) | 9 (100.0%) |
| 45 to 54 Years | 45 (100.0%) | 13 (65.0%) |
| 55 to 64 Years | 13 (100.0%) | 24 (100.0%) |
| 65 to 74 Years | 40 (100.0%) | 8 (100.0%) |
| 75 Years and over | 20 (90.9%) | 28 (77.8%) |
| Total | 266 (98.2%) | 142 (89.9%) |
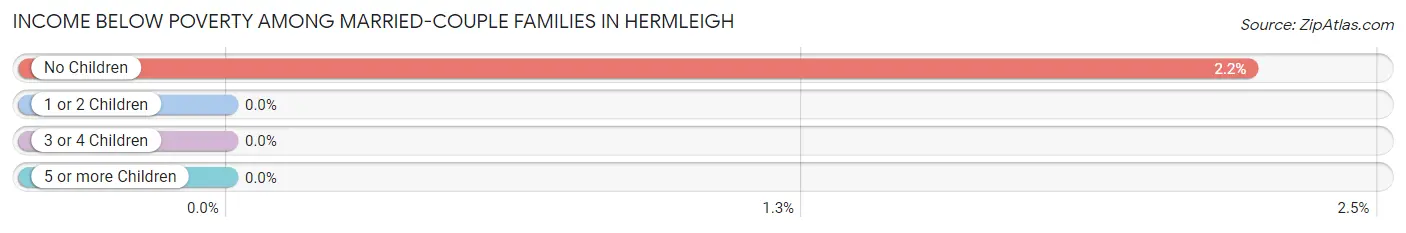
Income Below Poverty Among Married-Couple Families in Hermleigh
The poverty statistics for married-couple families in Hermleigh show that 1.6% or 1 of the total 63 families live below the poverty line. Families with no children have the highest poverty rate of 2.2%, comprising of 1 families. On the other hand, families with 1 or 2 children have the lowest poverty rate of 0.0%, which includes 0 families.
| Children | Above Poverty | Below Poverty |
| No Children | 44 (97.8%) | 1 (2.2%) |
| 1 or 2 Children | 6 (100.0%) | 0 (0.0%) |
| 3 or 4 Children | 12 (100.0%) | 0 (0.0%) |
| 5 or more Children | 0 (0.0%) | 0 (0.0%) |
| Total | 62 (98.4%) | 1 (1.6%) |
Income Below Poverty Among Single-Parent Households in Hermleigh
| Children | Single Father | Single Mother |
| No Children | 0 (0.0%) | 0 (0.0%) |
| 1 or 2 Children | 0 (0.0%) | 0 (0.0%) |
| 3 or 4 Children | 0 (0.0%) | 0 (0.0%) |
| 5 or more Children | 0 (0.0%) | 0 (0.0%) |
| Total | 0 (0.0%) | 0 (0.0%) |
Income Below Poverty Among Married-Couple vs Single-Parent Households in Hermleigh
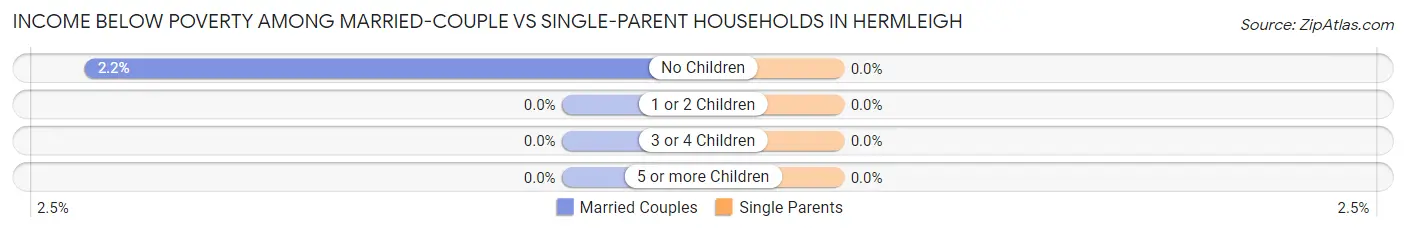
| Children | Married-Couple Families | Single-Parent Households |
| No Children | 1 (2.2%) | 0 (0.0%) |
| 1 or 2 Children | 0 (0.0%) | 0 (0.0%) |
| 3 or 4 Children | 0 (0.0%) | 0 (0.0%) |
| 5 or more Children | 0 (0.0%) | 0 (0.0%) |
| Total | 1 (1.6%) | 0 (0.0%) |
Race in Hermleigh
The most populous races in Hermleigh are White / Caucasian (387 | 90.2%), Hispanic or Latino (208 | 48.5%), and Two or more Races (32 | 7.5%).
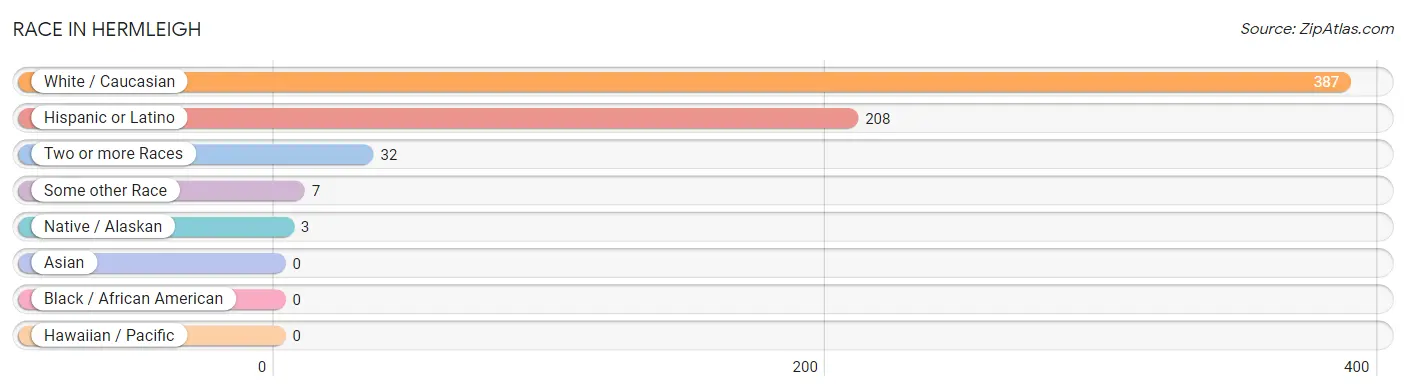
| Race | # Population | % Population |
| Asian | 0 | 0.0% |
| Black / African American | 0 | 0.0% |
| Hawaiian / Pacific | 0 | 0.0% |
| Hispanic or Latino | 208 | 48.5% |
| Native / Alaskan | 3 | 0.7% |
| White / Caucasian | 387 | 90.2% |
| Two or more Races | 32 | 7.5% |
| Some other Race | 7 | 1.6% |
| Total | 429 | 100.0% |
Ancestry in Hermleigh
The most populous ancestries reported in Hermleigh are Mexican (192 | 44.8%), German (70 | 16.3%), American (49 | 11.4%), Irish (44 | 10.3%), and English (14 | 3.3%), together accounting for 86.0% of all Hermleigh residents.
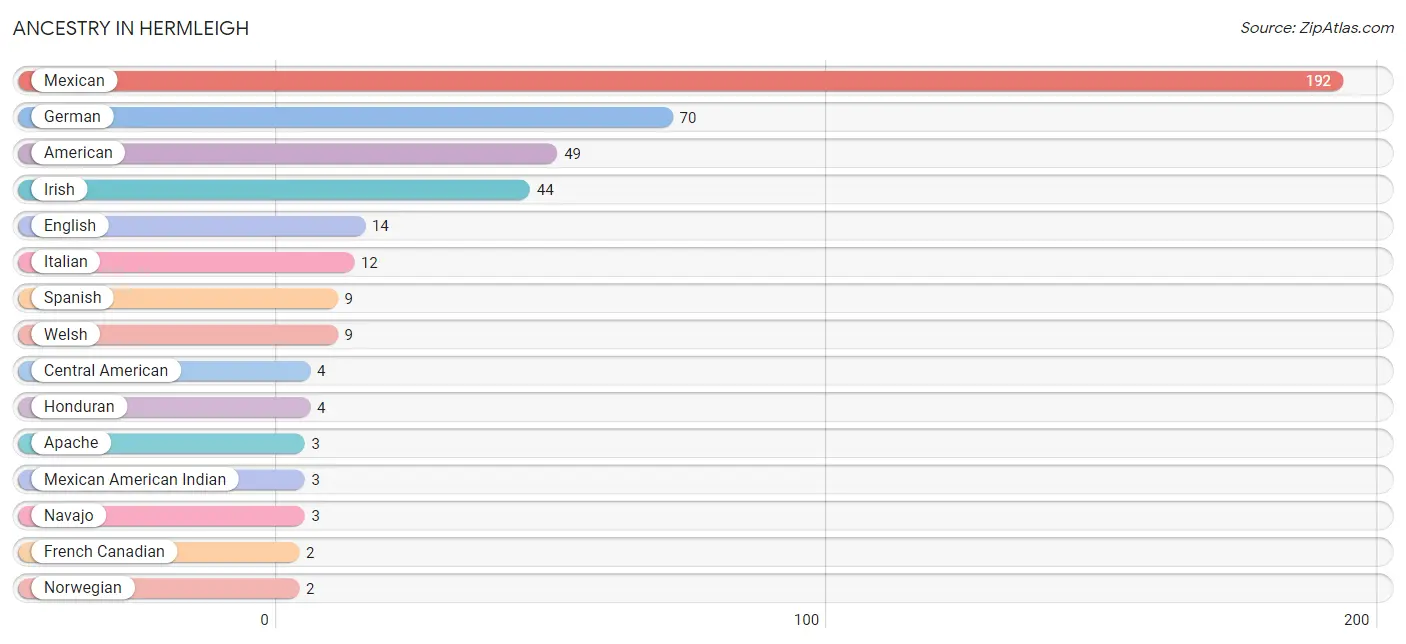
| Ancestry | # Population | % Population |
| American | 49 | 11.4% |
| Apache | 3 | 0.7% |
| Central American | 4 | 0.9% |
| English | 14 | 3.3% |
| French Canadian | 2 | 0.5% |
| German | 70 | 16.3% |
| Honduran | 4 | 0.9% |
| Irish | 44 | 10.3% |
| Italian | 12 | 2.8% |
| Mexican | 192 | 44.8% |
| Mexican American Indian | 3 | 0.7% |
| Navajo | 3 | 0.7% |
| Norwegian | 2 | 0.5% |
| Spanish | 9 | 2.1% |
| Spanish American Indian | 2 | 0.5% |
| Welsh | 9 | 2.1% | View All 16 Rows |
Immigrants in Hermleigh
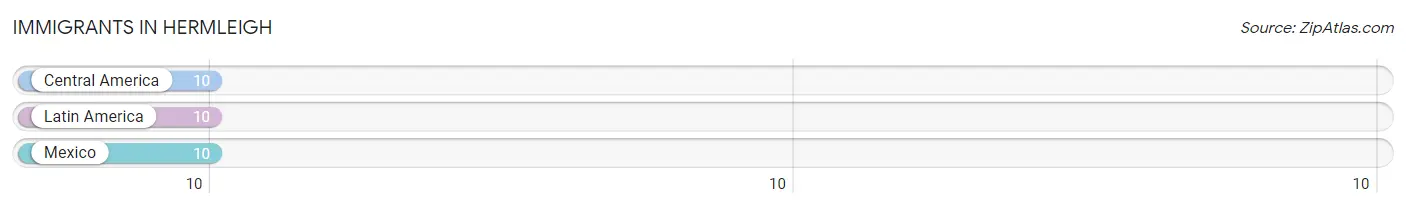
The most numerous immigrant groups reported in Hermleigh came from Central America (10 | 2.3%), Latin America (10 | 2.3%), and Mexico (10 | 2.3%), together accounting for 7.0% of all Hermleigh residents.
| Immigration Origin | # Population | % Population |
| Central America | 10 | 2.3% |
| Latin America | 10 | 2.3% |
| Mexico | 10 | 2.3% | View All 3 Rows |
Sex and Age in Hermleigh
Sex and Age in Hermleigh
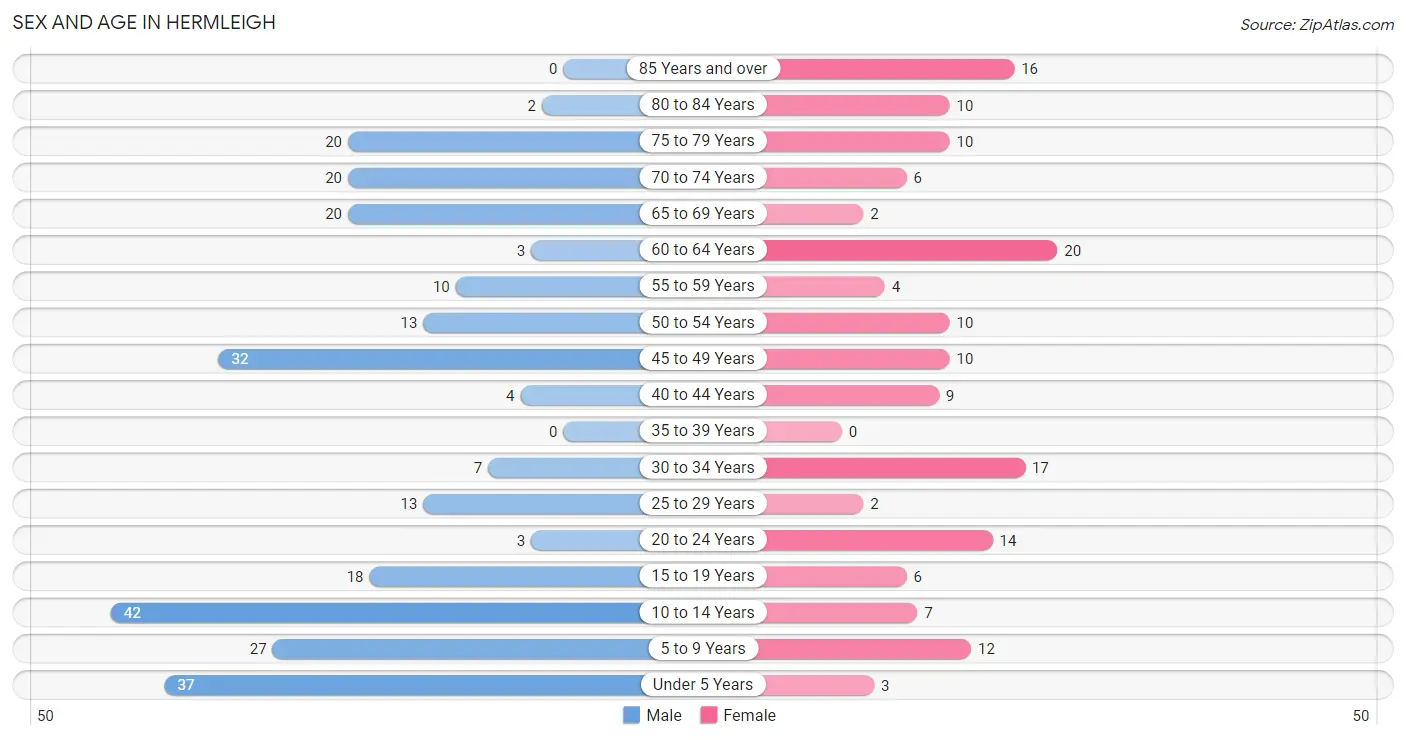
The most populous age groups in Hermleigh are 10 to 14 Years (42 | 15.5%) for men and 60 to 64 Years (20 | 12.7%) for women.
| Age Bracket | Male | Female |
| Under 5 Years | 37 (13.7%) | 3 (1.9%) |
| 5 to 9 Years | 27 (10.0%) | 12 (7.6%) |
| 10 to 14 Years | 42 (15.5%) | 7 (4.4%) |
| 15 to 19 Years | 18 (6.6%) | 6 (3.8%) |
| 20 to 24 Years | 3 (1.1%) | 14 (8.9%) |
| 25 to 29 Years | 13 (4.8%) | 2 (1.3%) |
| 30 to 34 Years | 7 (2.6%) | 17 (10.8%) |
| 35 to 39 Years | 0 (0.0%) | 0 (0.0%) |
| 40 to 44 Years | 4 (1.5%) | 9 (5.7%) |
| 45 to 49 Years | 32 (11.8%) | 10 (6.3%) |
| 50 to 54 Years | 13 (4.8%) | 10 (6.3%) |
| 55 to 59 Years | 10 (3.7%) | 4 (2.5%) |
| 60 to 64 Years | 3 (1.1%) | 20 (12.7%) |
| 65 to 69 Years | 20 (7.4%) | 2 (1.3%) |
| 70 to 74 Years | 20 (7.4%) | 6 (3.8%) |
| 75 to 79 Years | 20 (7.4%) | 10 (6.3%) |
| 80 to 84 Years | 2 (0.7%) | 10 (6.3%) |
| 85 Years and over | 0 (0.0%) | 16 (10.1%) |
| Total | 271 (100.0%) | 158 (100.0%) |
Families and Households in Hermleigh
Median Family Size in Hermleigh
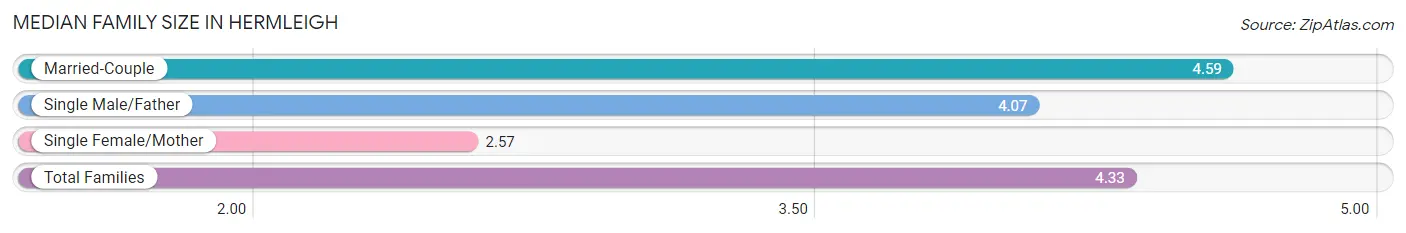
The median family size in Hermleigh is 4.33 persons per family, with married-couple families (63 | 74.1%) accounting for the largest median family size of 4.59 persons per family. On the other hand, single female/mother families (7 | 8.2%) represent the smallest median family size with 2.57 persons per family.
| Family Type | # Families | Family Size |
| Married-Couple | 63 (74.1%) | 4.59 |
| Single Male/Father | 15 (17.6%) | 4.07 |
| Single Female/Mother | 7 (8.2%) | 2.57 |
| Total Families | 85 (100.0%) | 4.33 |
Median Household Size in Hermleigh
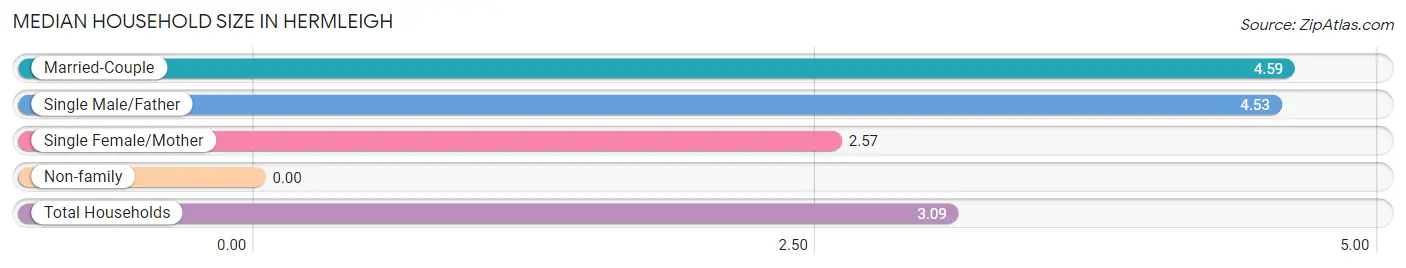
| Household Type | # Households | Household Size |
| Married-Couple | 63 (45.3%) | 4.59 |
| Single Male/Father | 15 (10.8%) | 4.53 |
| Single Female/Mother | 7 (5.0%) | 2.57 |
| Non-family | 54 (38.9%) | - |
| Total Households | 139 (100.0%) | 3.09 |
Household Size by Marriage Status in Hermleigh
Out of a total of 139 households in Hermleigh, 85 (61.2%) are family households, while 54 (38.9%) are nonfamily households. The most numerous type of family households are 3-person households, comprising 31, and the most common type of nonfamily households are 1-person households, comprising 54.
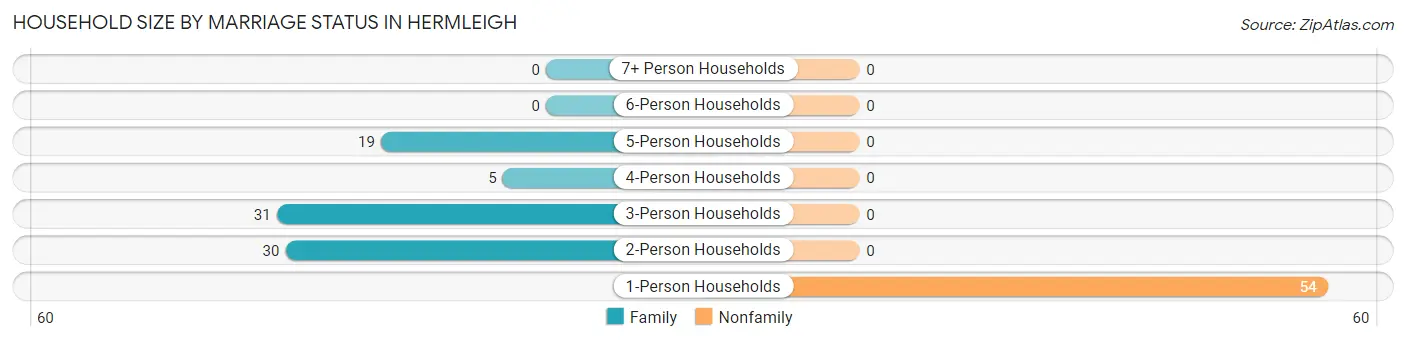
| Household Size | Family Households | Nonfamily Households |
| 1-Person Households | - | 54 (38.9%) |
| 2-Person Households | 30 (21.6%) | 0 (0.0%) |
| 3-Person Households | 31 (22.3%) | 0 (0.0%) |
| 4-Person Households | 5 (3.6%) | 0 (0.0%) |
| 5-Person Households | 19 (13.7%) | 0 (0.0%) |
| 6-Person Households | 0 (0.0%) | 0 (0.0%) |
| 7+ Person Households | 0 (0.0%) | 0 (0.0%) |
| Total | 85 (61.2%) | 54 (38.9%) |
Female Fertility in Hermleigh
Fertility by Age in Hermleigh
| Age Bracket | Women with Births | Births / 1,000 Women |
| 15 to 19 years | 0 (0.0%) | 0.0 |
| 20 to 34 years | 0 (0.0%) | 0.0 |
| 35 to 50 years | 0 (0.0%) | 0.0 |
| Total | 0 (0.0%) | 0.0 |
Fertility by Age by Marriage Status in Hermleigh
| Age Bracket | Married | Unmarried |
| 15 to 19 years | 0 (0.0%) | 0 (0.0%) |
| 20 to 34 years | 0 (0.0%) | 0 (0.0%) |
| 35 to 50 years | 0 (0.0%) | 0 (0.0%) |
| Total | 0 (0.0%) | 0 (0.0%) |
Fertility by Education in Hermleigh
| Educational Attainment | Women with Births | Births / 1,000 Women |
| Less than High School | 0 (0.0%) | 0.0 |
| High School Diploma | 0 (0.0%) | 0.0 |
| College or Associate's Degree | 0 (0.0%) | 0.0 |
| Bachelor's Degree | 0 (0.0%) | 0.0 |
| Graduate Degree | 0 (0.0%) | 0.0 |
| Total | 0 (0.0%) | 0.0 |
Fertility by Education by Marriage Status in Hermleigh
| Educational Attainment | Married | Unmarried |
| Less than High School | 0 (0.0%) | 0 (0.0%) |
| High School Diploma | 0 (0.0%) | 0 (0.0%) |
| College or Associate's Degree | 0 (0.0%) | 0 (0.0%) |
| Bachelor's Degree | 0 (0.0%) | 0 (0.0%) |
| Graduate Degree | 0 (0.0%) | 0 (0.0%) |
| Total | 0 (0.0%) | 0 (0.0%) |
Employment Characteristics in Hermleigh
Employment by Class of Employer in Hermleigh
Among the 122 employed individuals in Hermleigh, private company employees (104 | 85.3%), not-for-profit organizations (8 | 6.6%), and local government employees (4 | 3.3%) make up the most common classes of employment.
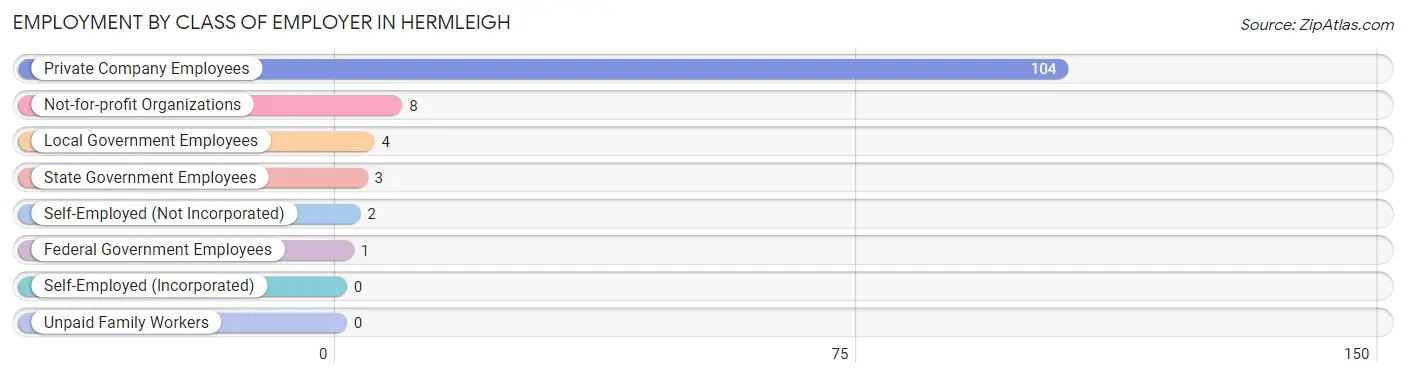
| Employer Class | # Employees | % Employees |
| Private Company Employees | 104 | 85.3% |
| Self-Employed (Incorporated) | 0 | 0.0% |
| Self-Employed (Not Incorporated) | 2 | 1.6% |
| Not-for-profit Organizations | 8 | 6.6% |
| Local Government Employees | 4 | 3.3% |
| State Government Employees | 3 | 2.5% |
| Federal Government Employees | 1 | 0.8% |
| Unpaid Family Workers | 0 | 0.0% |
| Total | 122 | 100.0% |
Employment Status by Age in Hermleigh
According to the labor force statistics for Hermleigh, out of the total population over 16 years of age (301), 44.9% or 135 individuals are in the labor force, with 9.6% or 13 of them unemployed. The age group with the highest labor force participation rate is 35 to 44 years, with 100.0% or 13 individuals in the labor force. Within the labor force, the 16 to 19 years age range has the highest percentage of unemployed individuals, with 75.0% or 9 of them being unemployed.
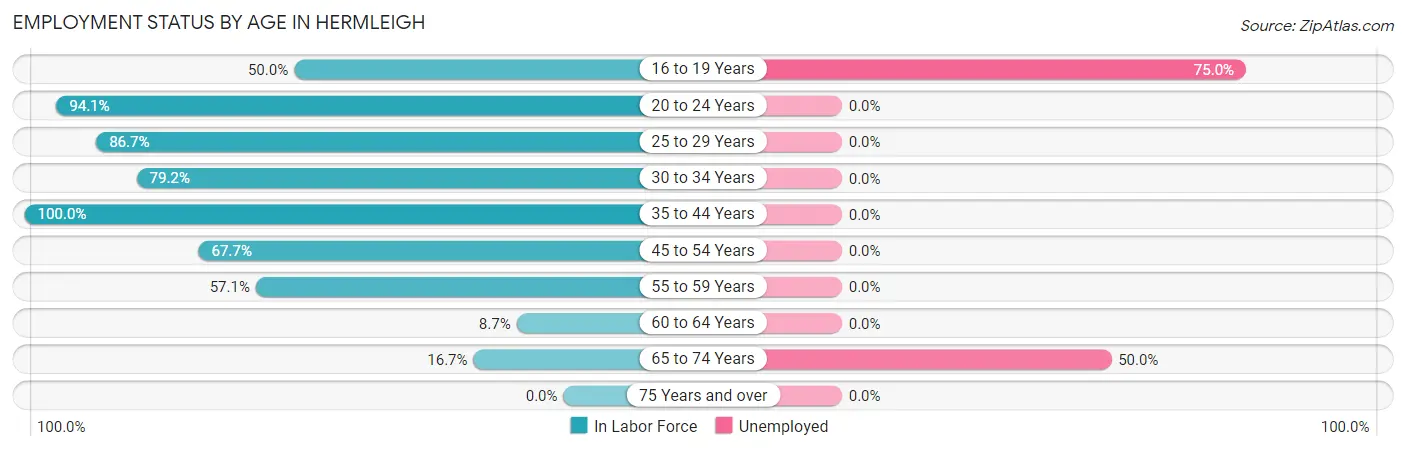
| Age Bracket | In Labor Force | Unemployed |
| 16 to 19 Years | 12 (50.0%) | 9 (75.0%) |
| 20 to 24 Years | 16 (94.1%) | 0 (0.0%) |
| 25 to 29 Years | 13 (86.7%) | 0 (0.0%) |
| 30 to 34 Years | 19 (79.2%) | 0 (0.0%) |
| 35 to 44 Years | 13 (100.0%) | 0 (0.0%) |
| 45 to 54 Years | 44 (67.7%) | 0 (0.0%) |
| 55 to 59 Years | 8 (57.1%) | 0 (0.0%) |
| 60 to 64 Years | 2 (8.7%) | 0 (0.0%) |
| 65 to 74 Years | 8 (16.7%) | 4 (50.0%) |
| 75 Years and over | 0 (0.0%) | 0 (0.0%) |
| Total | 135 (44.9%) | 13 (9.6%) |
Employment Status by Educational Attainment in Hermleigh
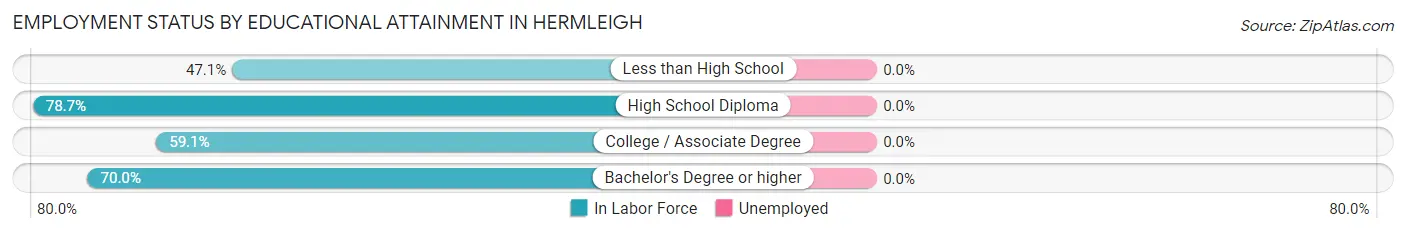
| Educational Attainment | In Labor Force | Unemployed |
| Less than High School | 24 (47.1%) | 0 (0.0%) |
| High School Diploma | 48 (78.7%) | 0 (0.0%) |
| College / Associate Degree | 13 (59.1%) | 0 (0.0%) |
| Bachelor's Degree or higher | 14 (70.0%) | 0 (0.0%) |
| Total | 99 (64.3%) | 0 (0.0%) |
Employment Occupations by Sex in Hermleigh
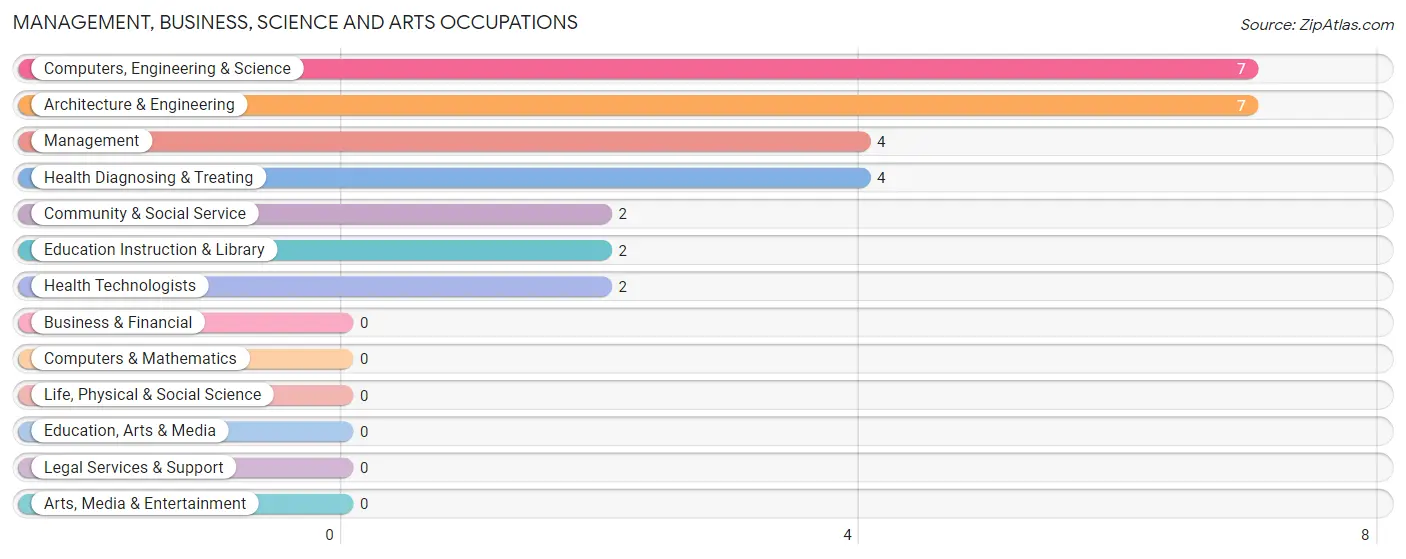
Management, Business, Science and Arts Occupations
The most common Management, Business, Science and Arts occupations in Hermleigh are Computers, Engineering & Science (7 | 5.7%), Architecture & Engineering (7 | 5.7%), Management (4 | 3.3%), Health Diagnosing & Treating (4 | 3.3%), and Community & Social Service (2 | 1.6%).
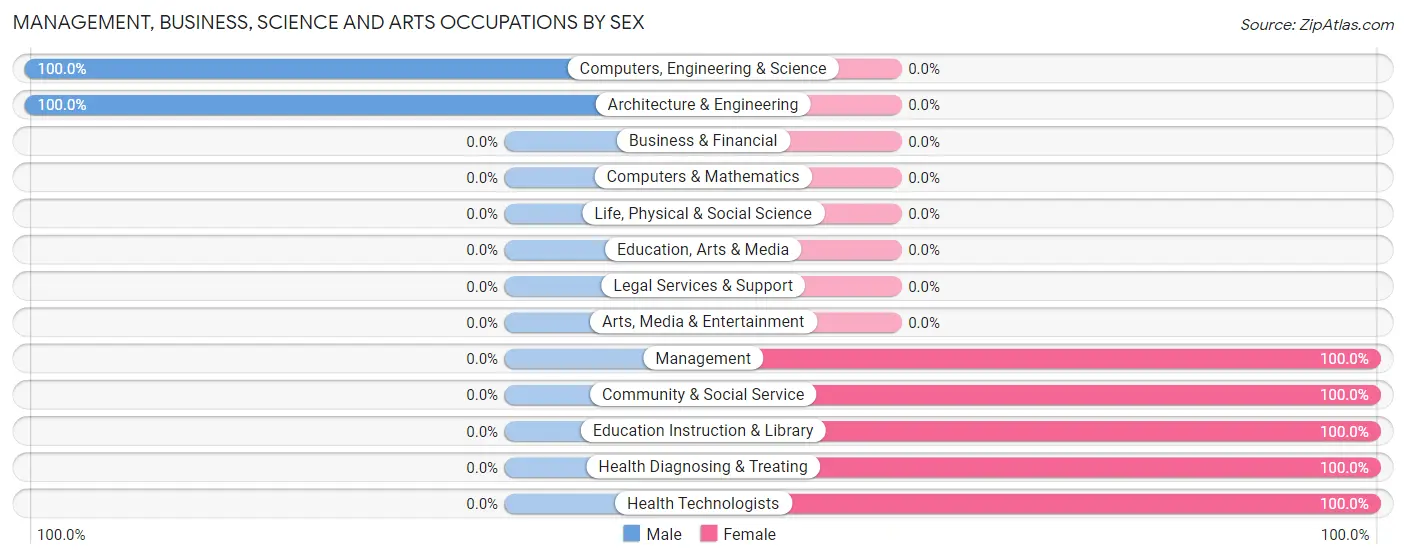
Management, Business, Science and Arts Occupations by Sex
Within the Management, Business, Science and Arts occupations in Hermleigh, the most male-oriented occupations are Computers, Engineering & Science (100.0%), and Architecture & Engineering (100.0%), while the most female-oriented occupations are Management (100.0%), Community & Social Service (100.0%), and Education Instruction & Library (100.0%).
| Occupation | Male | Female |
| Management | 0 (0.0%) | 4 (100.0%) |
| Business & Financial | 0 (0.0%) | 0 (0.0%) |
| Computers, Engineering & Science | 7 (100.0%) | 0 (0.0%) |
| Computers & Mathematics | 0 (0.0%) | 0 (0.0%) |
| Architecture & Engineering | 7 (100.0%) | 0 (0.0%) |
| Life, Physical & Social Science | 0 (0.0%) | 0 (0.0%) |
| Community & Social Service | 0 (0.0%) | 2 (100.0%) |
| Education, Arts & Media | 0 (0.0%) | 0 (0.0%) |
| Legal Services & Support | 0 (0.0%) | 0 (0.0%) |
| Education Instruction & Library | 0 (0.0%) | 2 (100.0%) |
| Arts, Media & Entertainment | 0 (0.0%) | 0 (0.0%) |
| Health Diagnosing & Treating | 0 (0.0%) | 4 (100.0%) |
| Health Technologists | 0 (0.0%) | 2 (100.0%) |
| Total (Category) | 7 (41.2%) | 10 (58.8%) |
| Total (Overall) | 72 (59.0%) | 50 (41.0%) |
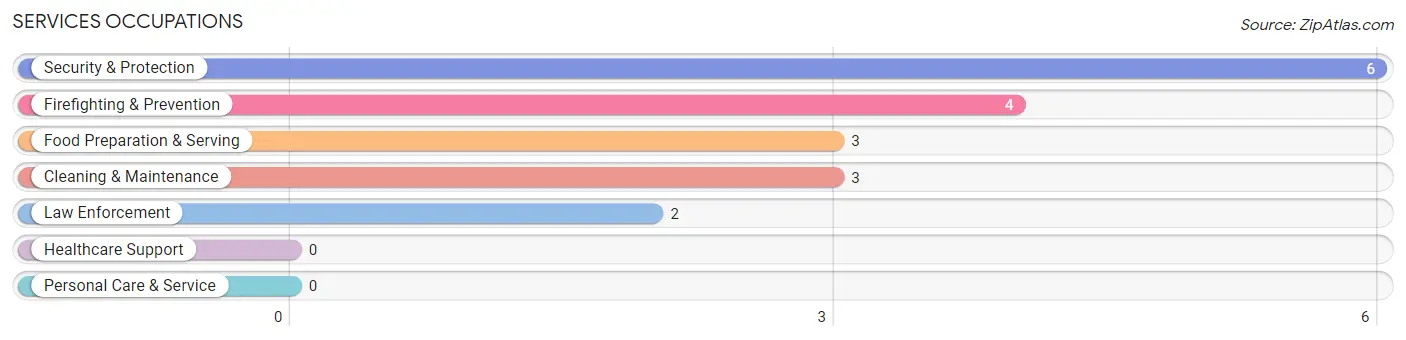
Services Occupations
The most common Services occupations in Hermleigh are Security & Protection (6 | 4.9%), Firefighting & Prevention (4 | 3.3%), Food Preparation & Serving (3 | 2.5%), Cleaning & Maintenance (3 | 2.5%), and Law Enforcement (2 | 1.6%).
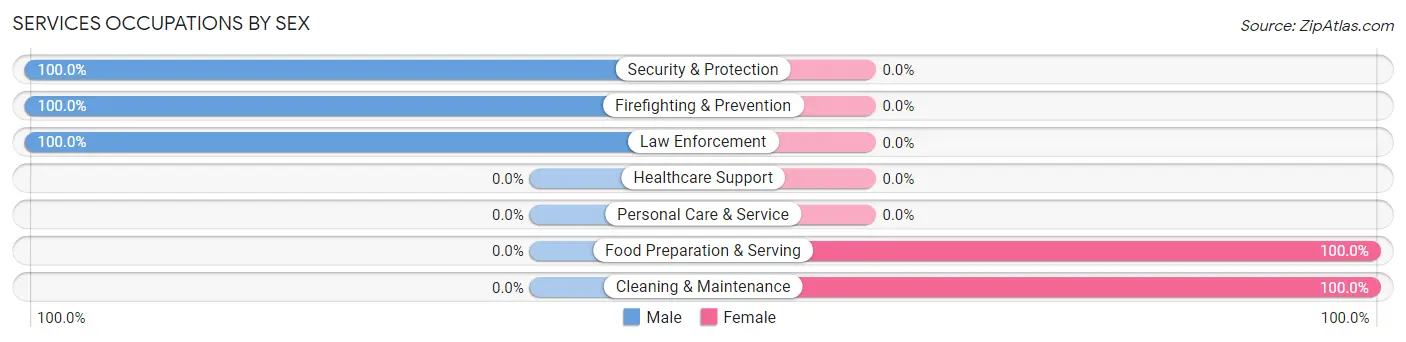
Services Occupations by Sex
Within the Services occupations in Hermleigh, the most male-oriented occupations are Security & Protection (100.0%), Firefighting & Prevention (100.0%), and Law Enforcement (100.0%), while the most female-oriented occupations are Food Preparation & Serving (100.0%), and Cleaning & Maintenance (100.0%).
| Occupation | Male | Female |
| Healthcare Support | 0 (0.0%) | 0 (0.0%) |
| Security & Protection | 6 (100.0%) | 0 (0.0%) |
| Firefighting & Prevention | 4 (100.0%) | 0 (0.0%) |
| Law Enforcement | 2 (100.0%) | 0 (0.0%) |
| Food Preparation & Serving | 0 (0.0%) | 3 (100.0%) |
| Cleaning & Maintenance | 0 (0.0%) | 3 (100.0%) |
| Personal Care & Service | 0 (0.0%) | 0 (0.0%) |
| Total (Category) | 6 (50.0%) | 6 (50.0%) |
| Total (Overall) | 72 (59.0%) | 50 (41.0%) |
Sales and Office Occupations
The most common Sales and Office occupations in Hermleigh are Office & Administration (27 | 22.1%), and Sales & Related (7 | 5.7%).
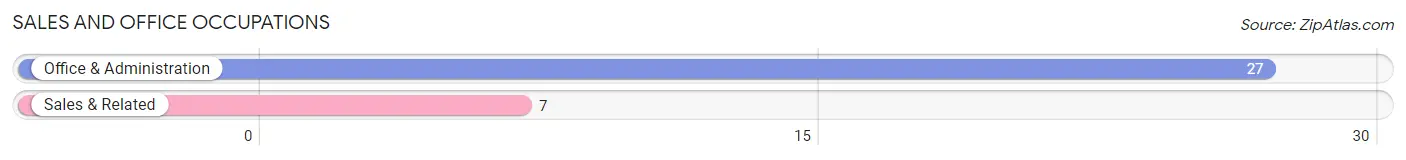
Sales and Office Occupations by Sex
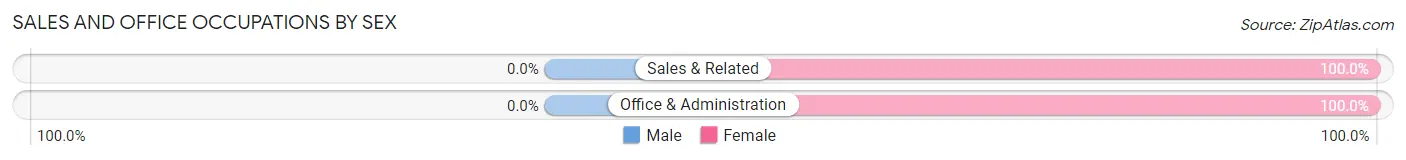
| Occupation | Male | Female |
| Sales & Related | 0 (0.0%) | 7 (100.0%) |
| Office & Administration | 0 (0.0%) | 27 (100.0%) |
| Total (Category) | 0 (0.0%) | 34 (100.0%) |
| Total (Overall) | 72 (59.0%) | 50 (41.0%) |
Natural Resources, Construction and Maintenance Occupations
The most common Natural Resources, Construction and Maintenance occupations in Hermleigh are Farming, Fishing & Forestry (12 | 9.8%), Construction & Extraction (3 | 2.5%), and Installation, Maintenance & Repair (2 | 1.6%).
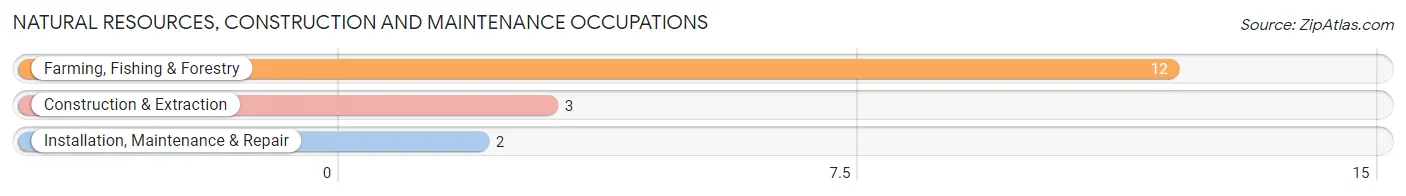
Natural Resources, Construction and Maintenance Occupations by Sex
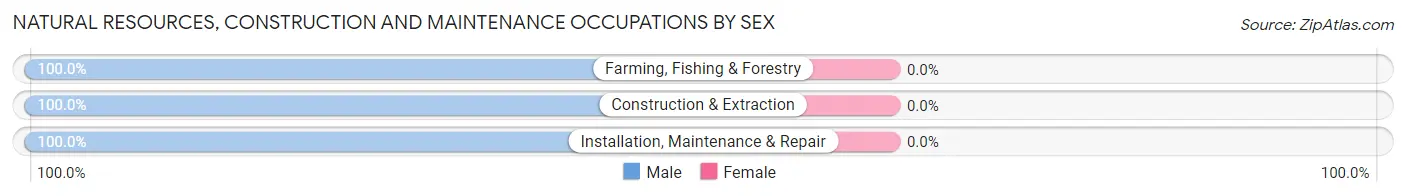
| Occupation | Male | Female |
| Farming, Fishing & Forestry | 12 (100.0%) | 0 (0.0%) |
| Construction & Extraction | 3 (100.0%) | 0 (0.0%) |
| Installation, Maintenance & Repair | 2 (100.0%) | 0 (0.0%) |
| Total (Category) | 17 (100.0%) | 0 (0.0%) |
| Total (Overall) | 72 (59.0%) | 50 (41.0%) |
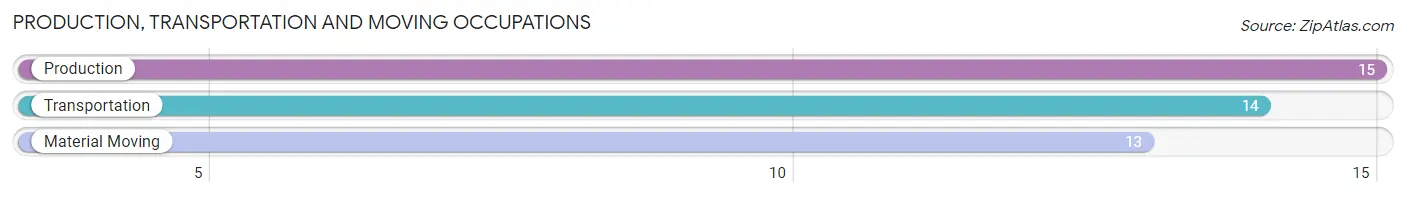
Production, Transportation and Moving Occupations
The most common Production, Transportation and Moving occupations in Hermleigh are Production (15 | 12.3%), Transportation (14 | 11.5%), and Material Moving (13 | 10.7%).
Production, Transportation and Moving Occupations by Sex
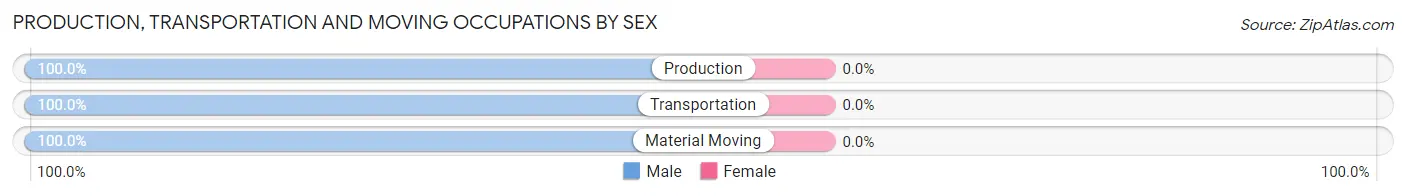
| Occupation | Male | Female |
| Production | 15 (100.0%) | 0 (0.0%) |
| Transportation | 14 (100.0%) | 0 (0.0%) |
| Material Moving | 13 (100.0%) | 0 (0.0%) |
| Total (Category) | 42 (100.0%) | 0 (0.0%) |
| Total (Overall) | 72 (59.0%) | 50 (41.0%) |
Employment Industries by Sex in Hermleigh
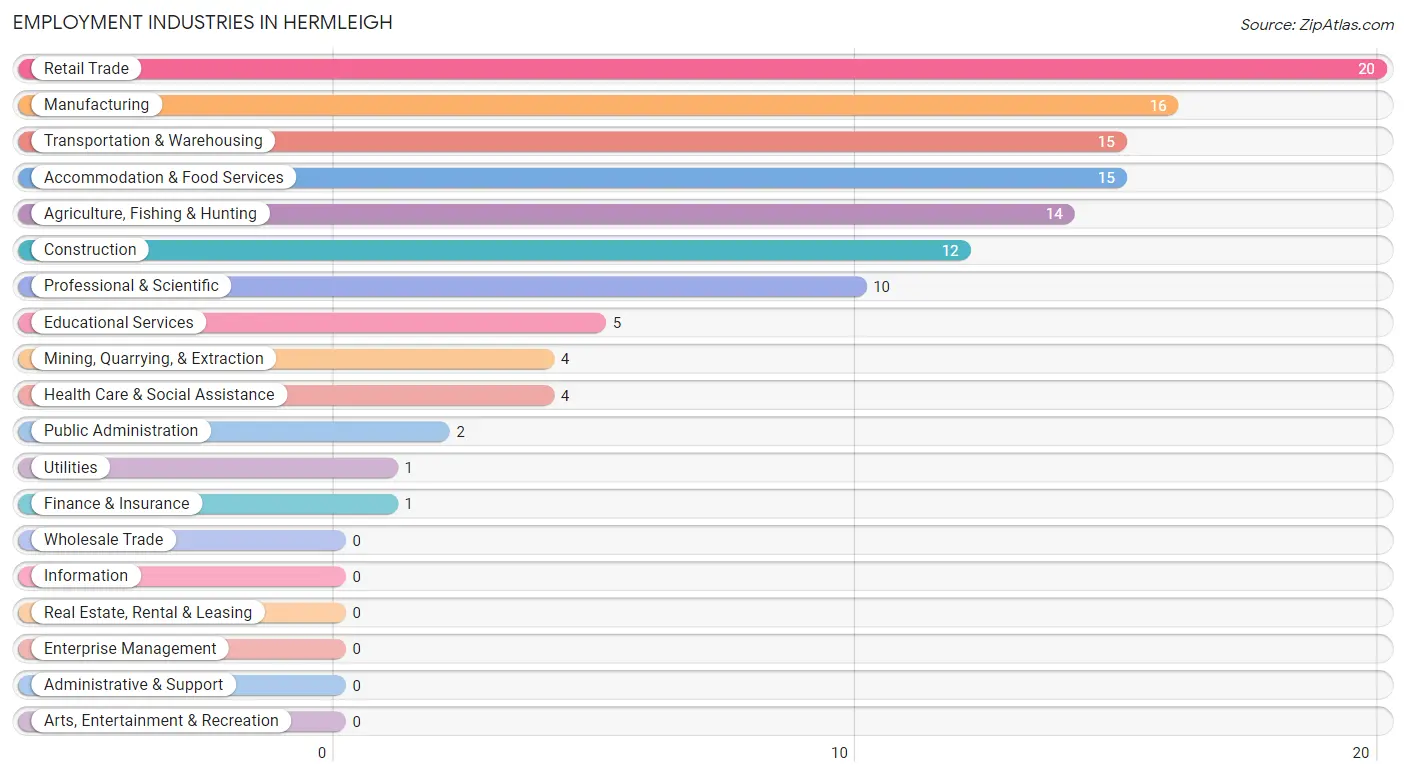
Employment Industries in Hermleigh
The major employment industries in Hermleigh include Retail Trade (20 | 16.4%), Manufacturing (16 | 13.1%), Transportation & Warehousing (15 | 12.3%), Accommodation & Food Services (15 | 12.3%), and Agriculture, Fishing & Hunting (14 | 11.5%).
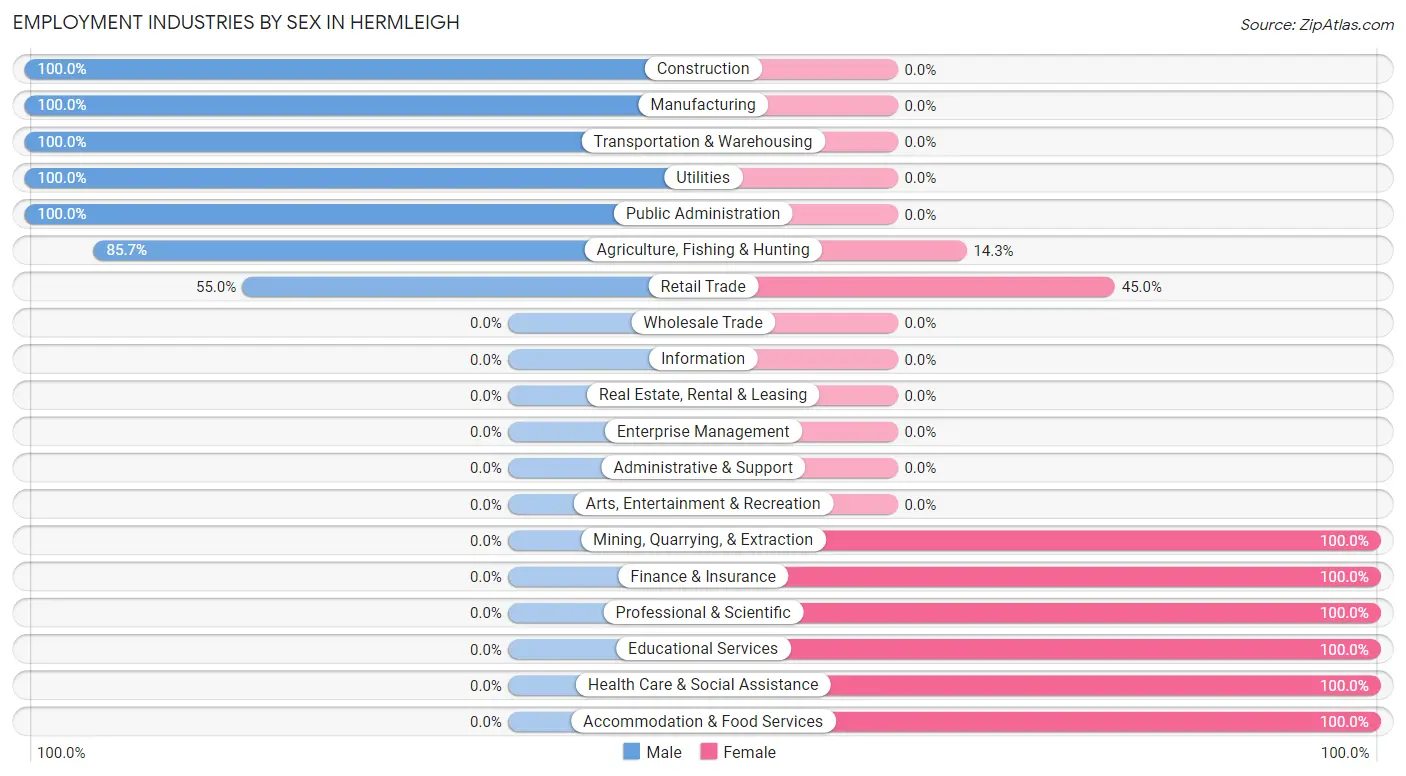
Employment Industries by Sex in Hermleigh
The Hermleigh industries that see more men than women are Construction (100.0%), Manufacturing (100.0%), and Transportation & Warehousing (100.0%), whereas the industries that tend to have a higher number of women are Mining, Quarrying, & Extraction (100.0%), Finance & Insurance (100.0%), and Professional & Scientific (100.0%).
| Industry | Male | Female |
| Agriculture, Fishing & Hunting | 12 (85.7%) | 2 (14.3%) |
| Mining, Quarrying, & Extraction | 0 (0.0%) | 4 (100.0%) |
| Construction | 12 (100.0%) | 0 (0.0%) |
| Manufacturing | 16 (100.0%) | 0 (0.0%) |
| Wholesale Trade | 0 (0.0%) | 0 (0.0%) |
| Retail Trade | 11 (55.0%) | 9 (45.0%) |
| Transportation & Warehousing | 15 (100.0%) | 0 (0.0%) |
| Utilities | 1 (100.0%) | 0 (0.0%) |
| Information | 0 (0.0%) | 0 (0.0%) |
| Finance & Insurance | 0 (0.0%) | 1 (100.0%) |
| Real Estate, Rental & Leasing | 0 (0.0%) | 0 (0.0%) |
| Professional & Scientific | 0 (0.0%) | 10 (100.0%) |
| Enterprise Management | 0 (0.0%) | 0 (0.0%) |
| Administrative & Support | 0 (0.0%) | 0 (0.0%) |
| Educational Services | 0 (0.0%) | 5 (100.0%) |
| Health Care & Social Assistance | 0 (0.0%) | 4 (100.0%) |
| Arts, Entertainment & Recreation | 0 (0.0%) | 0 (0.0%) |
| Accommodation & Food Services | 0 (0.0%) | 15 (100.0%) |
| Public Administration | 2 (100.0%) | 0 (0.0%) |
| Total | 72 (59.0%) | 50 (41.0%) |
Education in Hermleigh
School Enrollment in Hermleigh
The most common levels of schooling among the 112 students in Hermleigh are middle school (45 | 40.2%), elementary school (43 | 38.4%), and high school (15 | 13.4%).
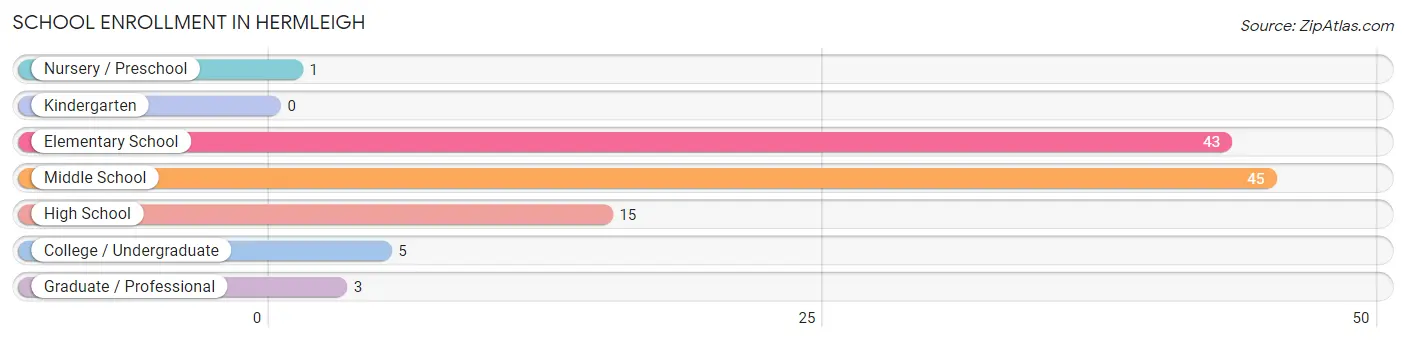
| School Level | # Students | % Students |
| Nursery / Preschool | 1 | 0.9% |
| Kindergarten | 0 | 0.0% |
| Elementary School | 43 | 38.4% |
| Middle School | 45 | 40.2% |
| High School | 15 | 13.4% |
| College / Undergraduate | 5 | 4.5% |
| Graduate / Professional | 3 | 2.7% |
| Total | 112 | 100.0% |
School Enrollment by Age by Funding Source in Hermleigh
Out of a total of 112 students who are enrolled in schools in Hermleigh, 21 (18.8%) attend a private institution, while the remaining 91 (81.2%) are enrolled in public schools. The age group of 3 to 4 year olds has the highest likelihood of being enrolled in private schools, with 1 (100.0% in the age bracket) enrolled. Conversely, the age group of 20 to 24 year olds has the lowest likelihood of being enrolled in a private school, with 3 (100.0% in the age bracket) attending a public institution.
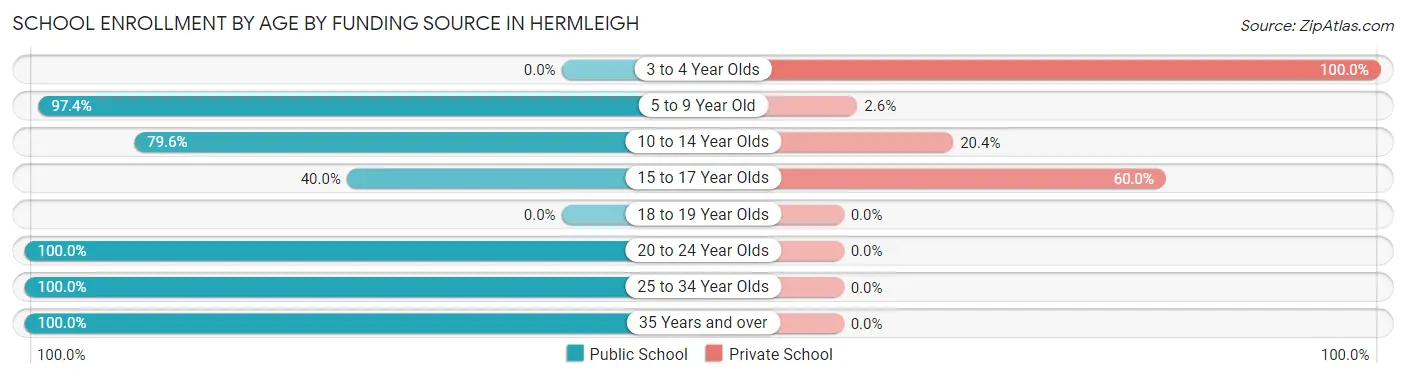
| Age Bracket | Public School | Private School |
| 3 to 4 Year Olds | 0 (0.0%) | 1 (100.0%) |
| 5 to 9 Year Old | 38 (97.4%) | 1 (2.6%) |
| 10 to 14 Year Olds | 39 (79.6%) | 10 (20.4%) |
| 15 to 17 Year Olds | 6 (40.0%) | 9 (60.0%) |
| 18 to 19 Year Olds | 0 (0.0%) | 0 (0.0%) |
| 20 to 24 Year Olds | 3 (100.0%) | 0 (0.0%) |
| 25 to 34 Year Olds | 3 (100.0%) | 0 (0.0%) |
| 35 Years and over | 2 (100.0%) | 0 (0.0%) |
| Total | 91 (81.3%) | 21 (18.8%) |
Educational Attainment by Field of Study in Hermleigh
Education (14 | 29.2%), bio, nature & agricultural (11 | 22.9%), multidisciplinary studies (7 | 14.6%), arts & humanities (6 | 12.5%), and computers & mathematics (5 | 10.4%) are the most common fields of study among 48 individuals in Hermleigh who have obtained a bachelor's degree or higher.
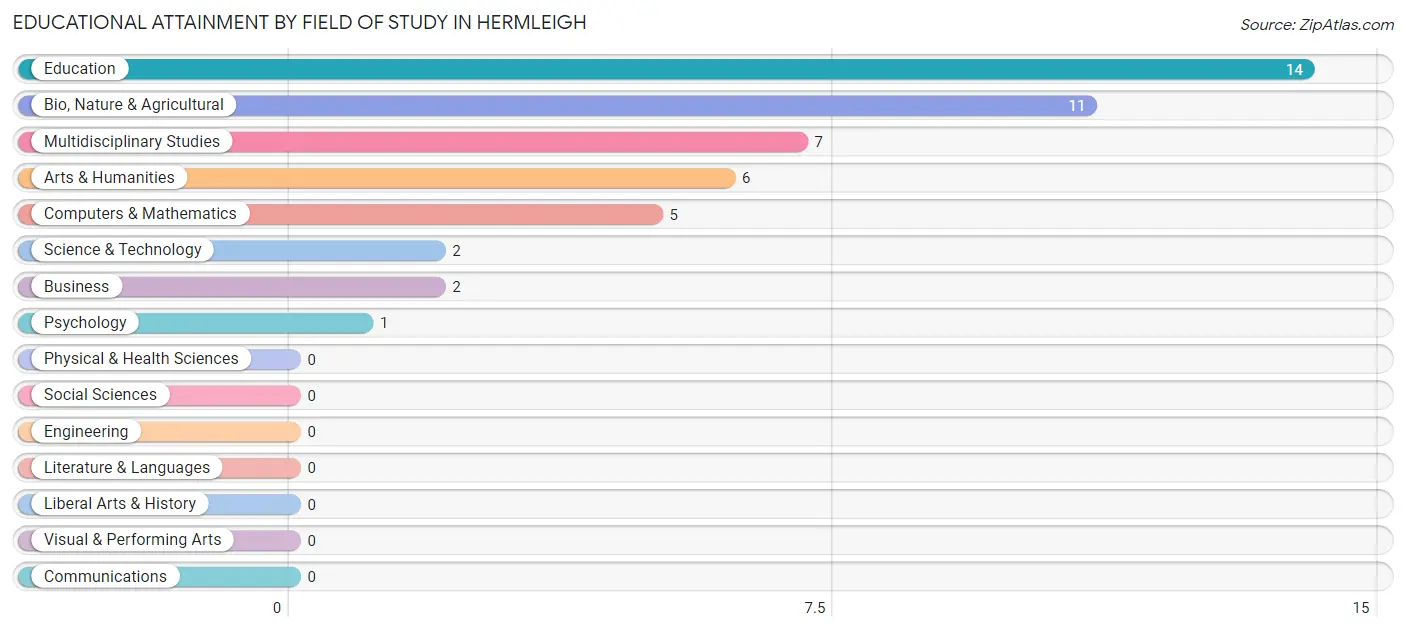
| Field of Study | # Graduates | % Graduates |
| Computers & Mathematics | 5 | 10.4% |
| Bio, Nature & Agricultural | 11 | 22.9% |
| Physical & Health Sciences | 0 | 0.0% |
| Psychology | 1 | 2.1% |
| Social Sciences | 0 | 0.0% |
| Engineering | 0 | 0.0% |
| Multidisciplinary Studies | 7 | 14.6% |
| Science & Technology | 2 | 4.2% |
| Business | 2 | 4.2% |
| Education | 14 | 29.2% |
| Literature & Languages | 0 | 0.0% |
| Liberal Arts & History | 0 | 0.0% |
| Visual & Performing Arts | 0 | 0.0% |
| Communications | 0 | 0.0% |
| Arts & Humanities | 6 | 12.5% |
| Total | 48 | 100.0% |
Transportation & Commute in Hermleigh
Vehicle Availability by Sex in Hermleigh
The most prevalent vehicle ownership categories in Hermleigh are males with 2 vehicles (39, accounting for 54.2%) and females with 2 vehicles (20, making up 78.0%).
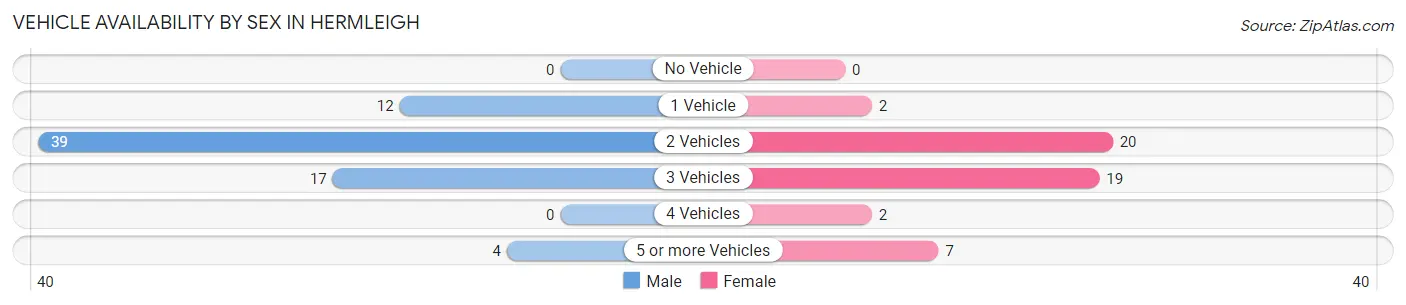
| Vehicles Available | Male | Female |
| No Vehicle | 0 (0.0%) | 0 (0.0%) |
| 1 Vehicle | 12 (16.7%) | 2 (4.0%) |
| 2 Vehicles | 39 (54.2%) | 20 (40.0%) |
| 3 Vehicles | 17 (23.6%) | 19 (38.0%) |
| 4 Vehicles | 0 (0.0%) | 2 (4.0%) |
| 5 or more Vehicles | 4 (5.6%) | 7 (14.0%) |
| Total | 72 (100.0%) | 50 (100.0%) |
Commute Time in Hermleigh
The most frequently occuring commute durations in Hermleigh are 15 to 19 minutes (30 commuters, 24.6%), 10 to 14 minutes (23 commuters, 18.9%), and 5 to 9 minutes (22 commuters, 18.0%).
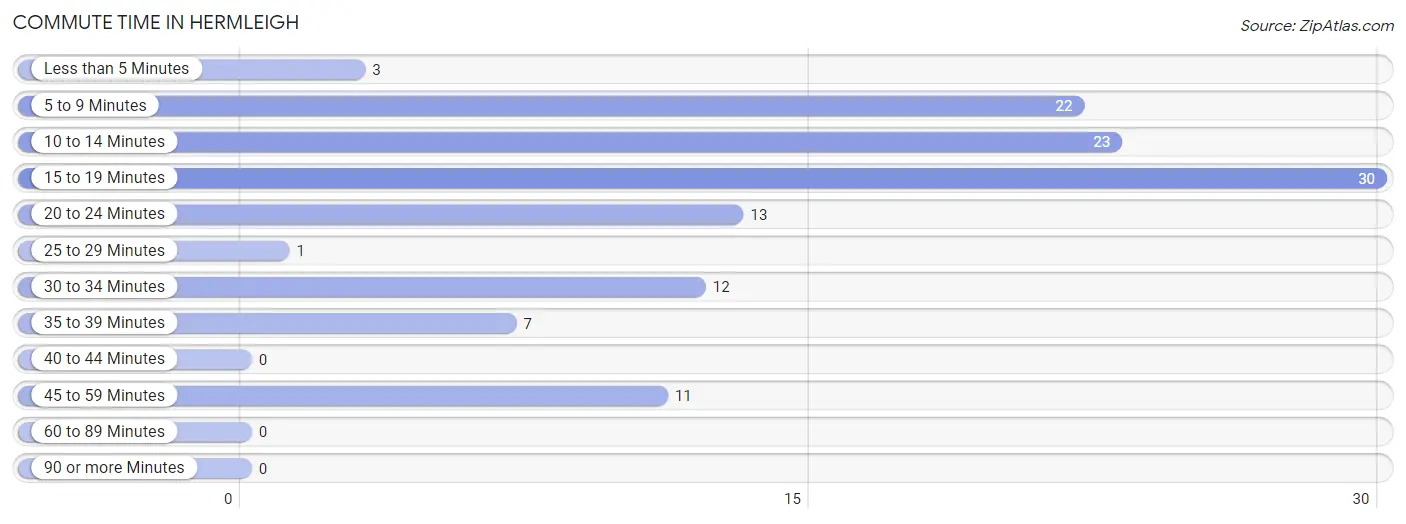
| Commute Time | # Commuters | % Commuters |
| Less than 5 Minutes | 3 | 2.5% |
| 5 to 9 Minutes | 22 | 18.0% |
| 10 to 14 Minutes | 23 | 18.9% |
| 15 to 19 Minutes | 30 | 24.6% |
| 20 to 24 Minutes | 13 | 10.7% |
| 25 to 29 Minutes | 1 | 0.8% |
| 30 to 34 Minutes | 12 | 9.8% |
| 35 to 39 Minutes | 7 | 5.7% |
| 40 to 44 Minutes | 0 | 0.0% |
| 45 to 59 Minutes | 11 | 9.0% |
| 60 to 89 Minutes | 0 | 0.0% |
| 90 or more Minutes | 0 | 0.0% |
Commute Time by Sex in Hermleigh
The most common commute times in Hermleigh are 15 to 19 minutes (18 commuters, 25.0%) for males and 5 to 9 minutes (12 commuters, 24.0%) for females.
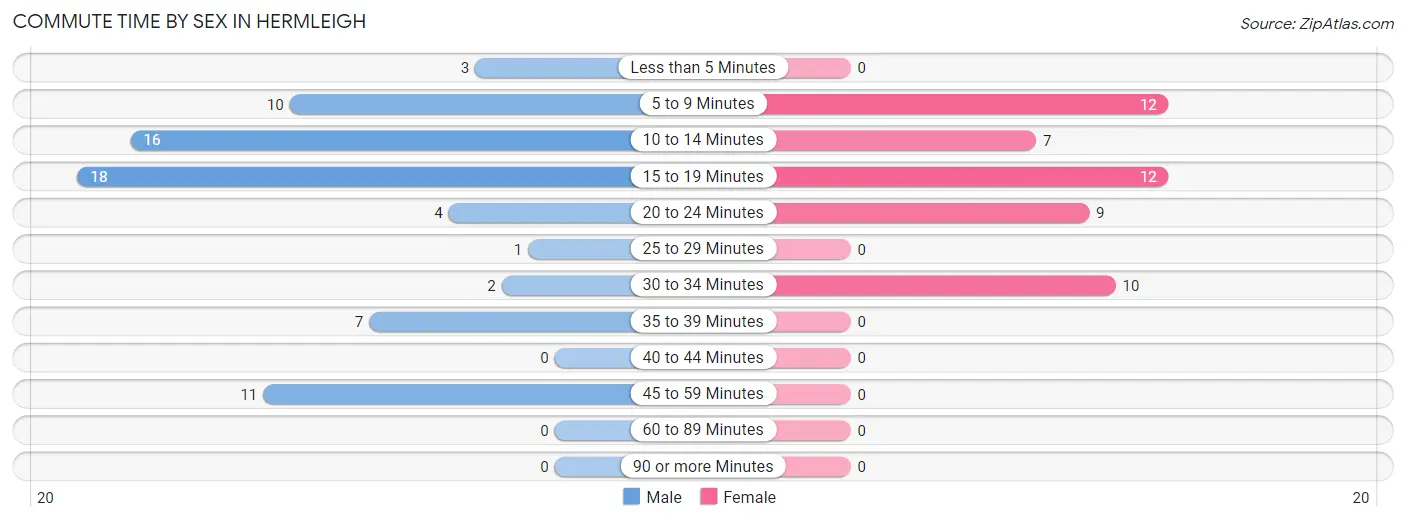
| Commute Time | Male | Female |
| Less than 5 Minutes | 3 (4.2%) | 0 (0.0%) |
| 5 to 9 Minutes | 10 (13.9%) | 12 (24.0%) |
| 10 to 14 Minutes | 16 (22.2%) | 7 (14.0%) |
| 15 to 19 Minutes | 18 (25.0%) | 12 (24.0%) |
| 20 to 24 Minutes | 4 (5.6%) | 9 (18.0%) |
| 25 to 29 Minutes | 1 (1.4%) | 0 (0.0%) |
| 30 to 34 Minutes | 2 (2.8%) | 10 (20.0%) |
| 35 to 39 Minutes | 7 (9.7%) | 0 (0.0%) |
| 40 to 44 Minutes | 0 (0.0%) | 0 (0.0%) |
| 45 to 59 Minutes | 11 (15.3%) | 0 (0.0%) |
| 60 to 89 Minutes | 0 (0.0%) | 0 (0.0%) |
| 90 or more Minutes | 0 (0.0%) | 0 (0.0%) |
Time of Departure to Work by Sex in Hermleigh
The most frequent times of departure to work in Hermleigh are 7:00 AM to 7:29 AM (27, 37.5%) for males and 8:00 AM to 8:29 AM (21, 42.0%) for females.
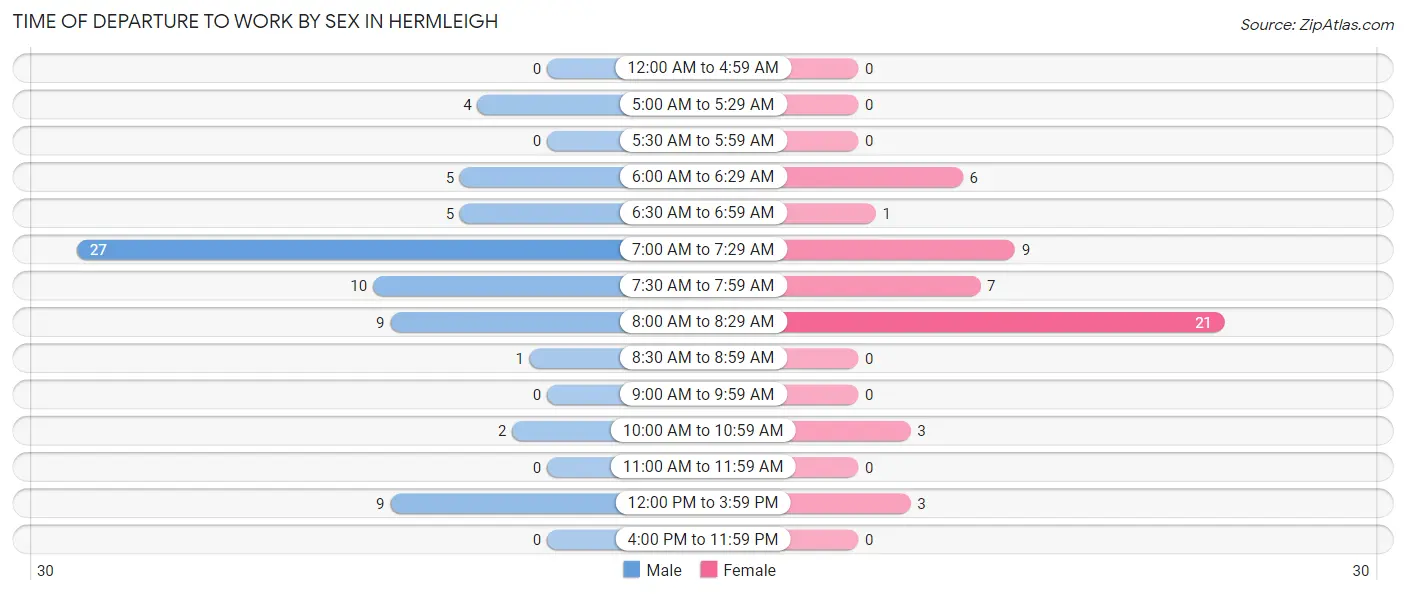
| Time of Departure | Male | Female |
| 12:00 AM to 4:59 AM | 0 (0.0%) | 0 (0.0%) |
| 5:00 AM to 5:29 AM | 4 (5.6%) | 0 (0.0%) |
| 5:30 AM to 5:59 AM | 0 (0.0%) | 0 (0.0%) |
| 6:00 AM to 6:29 AM | 5 (6.9%) | 6 (12.0%) |
| 6:30 AM to 6:59 AM | 5 (6.9%) | 1 (2.0%) |
| 7:00 AM to 7:29 AM | 27 (37.5%) | 9 (18.0%) |
| 7:30 AM to 7:59 AM | 10 (13.9%) | 7 (14.0%) |
| 8:00 AM to 8:29 AM | 9 (12.5%) | 21 (42.0%) |
| 8:30 AM to 8:59 AM | 1 (1.4%) | 0 (0.0%) |
| 9:00 AM to 9:59 AM | 0 (0.0%) | 0 (0.0%) |
| 10:00 AM to 10:59 AM | 2 (2.8%) | 3 (6.0%) |
| 11:00 AM to 11:59 AM | 0 (0.0%) | 0 (0.0%) |
| 12:00 PM to 3:59 PM | 9 (12.5%) | 3 (6.0%) |
| 4:00 PM to 11:59 PM | 0 (0.0%) | 0 (0.0%) |
| Total | 72 (100.0%) | 50 (100.0%) |
Housing Occupancy in Hermleigh
Occupancy by Ownership in Hermleigh
Of the total 139 dwellings in Hermleigh, owner-occupied units account for 118 (84.9%), while renter-occupied units make up 21 (15.1%).
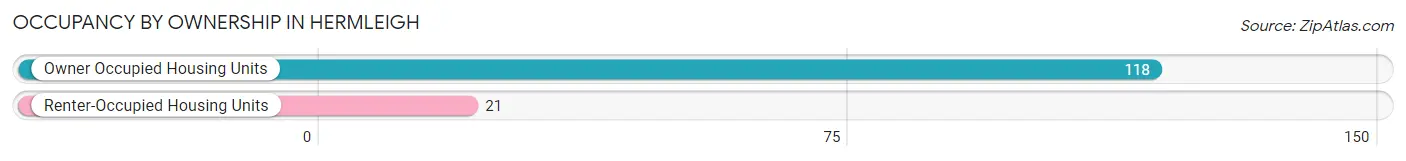
| Occupancy | # Housing Units | % Housing Units |
| Owner Occupied Housing Units | 118 | 84.9% |
| Renter-Occupied Housing Units | 21 | 15.1% |
| Total Occupied Housing Units | 139 | 100.0% |
Occupancy by Household Size in Hermleigh
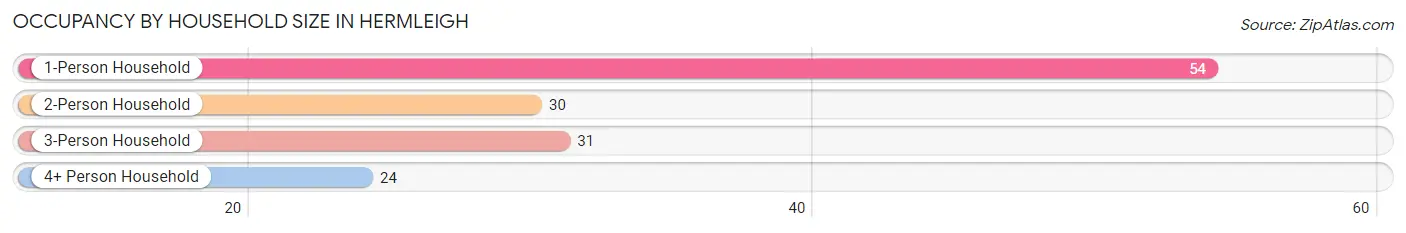
| Household Size | # Housing Units | % Housing Units |
| 1-Person Household | 54 | 38.9% |
| 2-Person Household | 30 | 21.6% |
| 3-Person Household | 31 | 22.3% |
| 4+ Person Household | 24 | 17.3% |
| Total Housing Units | 139 | 100.0% |
Occupancy by Ownership by Household Size in Hermleigh
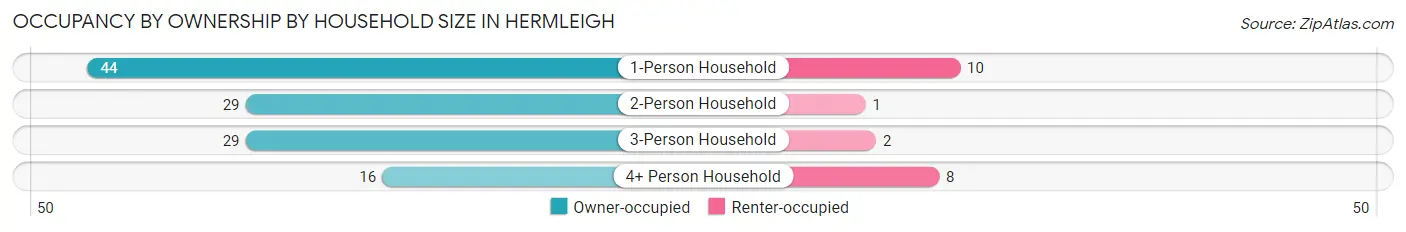
| Household Size | Owner-occupied | Renter-occupied |
| 1-Person Household | 44 (81.5%) | 10 (18.5%) |
| 2-Person Household | 29 (96.7%) | 1 (3.3%) |
| 3-Person Household | 29 (93.5%) | 2 (6.5%) |
| 4+ Person Household | 16 (66.7%) | 8 (33.3%) |
| Total Housing Units | 118 (84.9%) | 21 (15.1%) |
Occupancy by Educational Attainment in Hermleigh
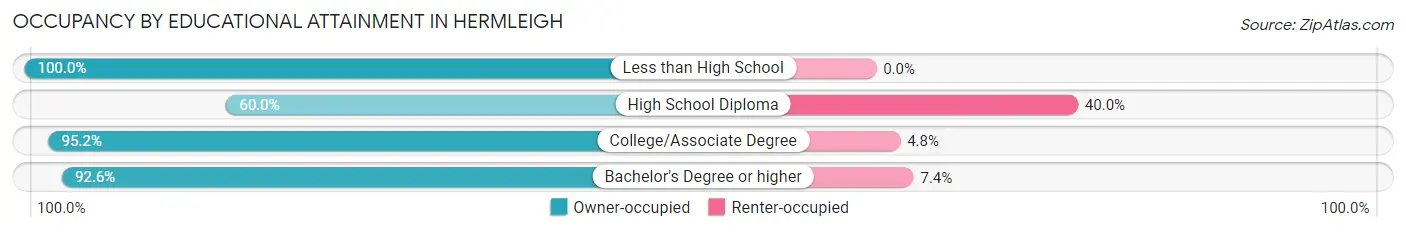
| Household Size | Owner-occupied | Renter-occupied |
| Less than High School | 46 (100.0%) | 0 (0.0%) |
| High School Diploma | 27 (60.0%) | 18 (40.0%) |
| College/Associate Degree | 20 (95.2%) | 1 (4.8%) |
| Bachelor's Degree or higher | 25 (92.6%) | 2 (7.4%) |
Occupancy by Age of Householder in Hermleigh
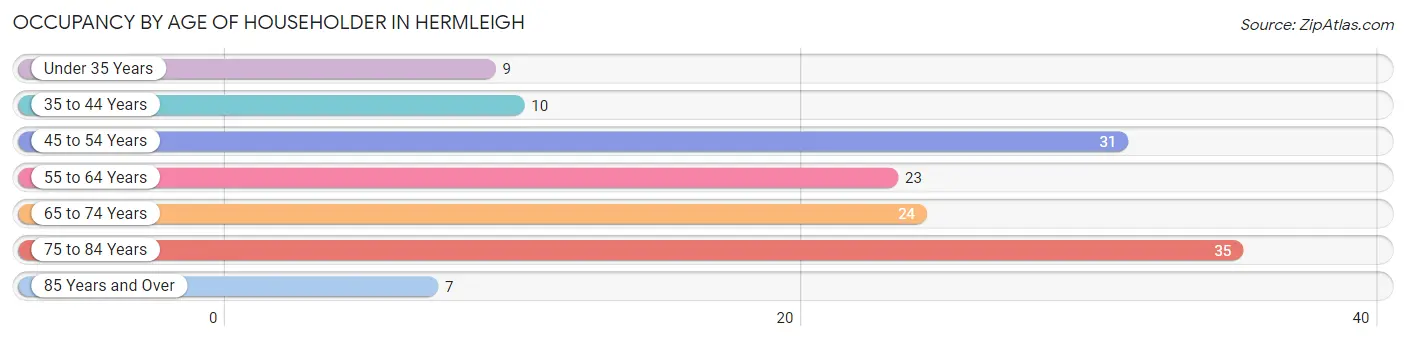
| Age Bracket | # Households | % Households |
| Under 35 Years | 9 | 6.5% |
| 35 to 44 Years | 10 | 7.2% |
| 45 to 54 Years | 31 | 22.3% |
| 55 to 64 Years | 23 | 16.6% |
| 65 to 74 Years | 24 | 17.3% |
| 75 to 84 Years | 35 | 25.2% |
| 85 Years and Over | 7 | 5.0% |
| Total | 139 | 100.0% |
Housing Finances in Hermleigh
Median Income by Occupancy in Hermleigh
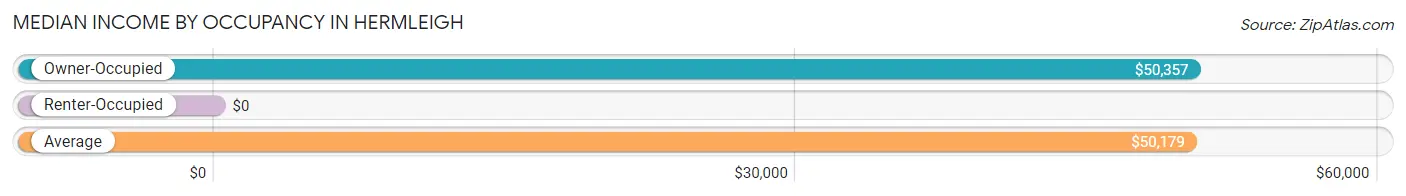
| Occupancy Type | # Households | Median Income |
| Owner-Occupied | 118 (84.9%) | $50,357 |
| Renter-Occupied | 21 (15.1%) | $0 |
| Average | 139 (100.0%) | $50,179 |
Occupancy by Householder Income Bracket in Hermleigh
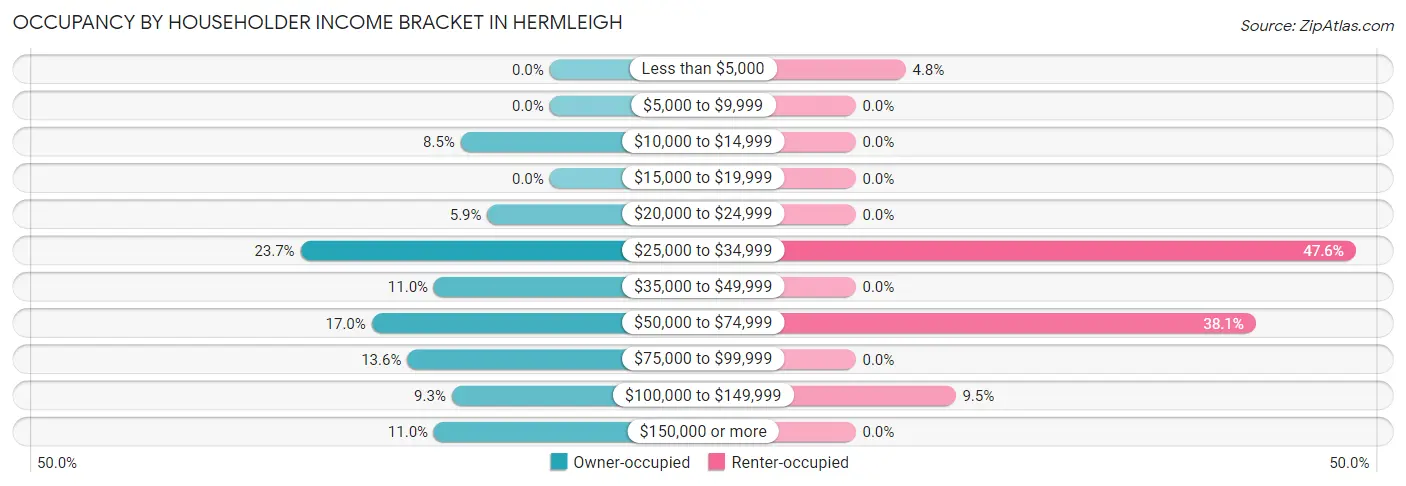
| Income Bracket | Owner-occupied | Renter-occupied |
| Less than $5,000 | 0 (0.0%) | 1 (4.8%) |
| $5,000 to $9,999 | 0 (0.0%) | 0 (0.0%) |
| $10,000 to $14,999 | 10 (8.5%) | 0 (0.0%) |
| $15,000 to $19,999 | 0 (0.0%) | 0 (0.0%) |
| $20,000 to $24,999 | 7 (5.9%) | 0 (0.0%) |
| $25,000 to $34,999 | 28 (23.7%) | 10 (47.6%) |
| $35,000 to $49,999 | 13 (11.0%) | 0 (0.0%) |
| $50,000 to $74,999 | 20 (17.0%) | 8 (38.1%) |
| $75,000 to $99,999 | 16 (13.6%) | 0 (0.0%) |
| $100,000 to $149,999 | 11 (9.3%) | 2 (9.5%) |
| $150,000 or more | 13 (11.0%) | 0 (0.0%) |
| Total | 118 (100.0%) | 21 (100.0%) |
Monthly Housing Cost Tiers in Hermleigh
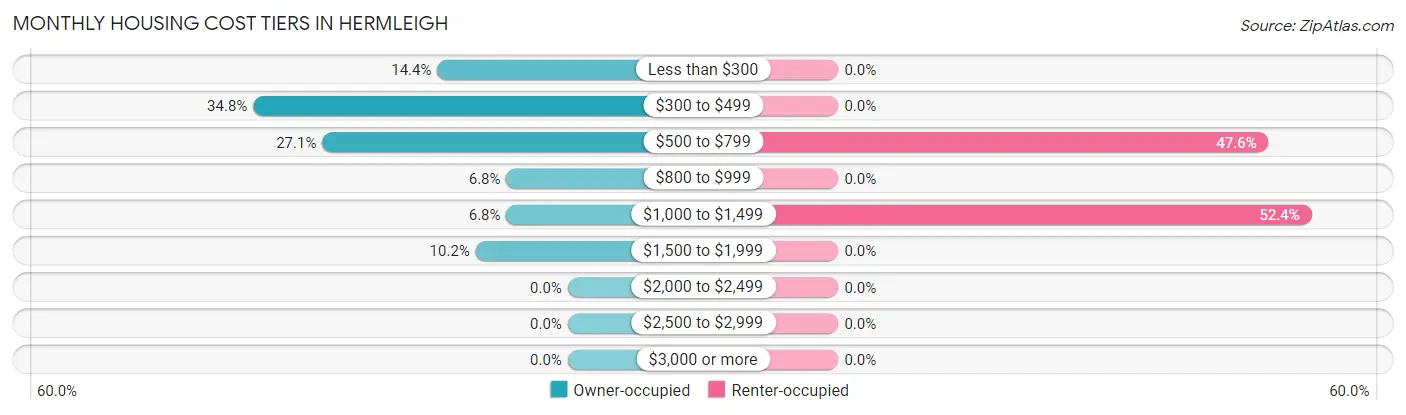
| Monthly Cost | Owner-occupied | Renter-occupied |
| Less than $300 | 17 (14.4%) | 0 (0.0%) |
| $300 to $499 | 41 (34.7%) | 0 (0.0%) |
| $500 to $799 | 32 (27.1%) | 10 (47.6%) |
| $800 to $999 | 8 (6.8%) | 0 (0.0%) |
| $1,000 to $1,499 | 8 (6.8%) | 11 (52.4%) |
| $1,500 to $1,999 | 12 (10.2%) | 0 (0.0%) |
| $2,000 to $2,499 | 0 (0.0%) | 0 (0.0%) |
| $2,500 to $2,999 | 0 (0.0%) | 0 (0.0%) |
| $3,000 or more | 0 (0.0%) | 0 (0.0%) |
| Total | 118 (100.0%) | 21 (100.0%) |
Physical Housing Characteristics in Hermleigh
Housing Structures in Hermleigh
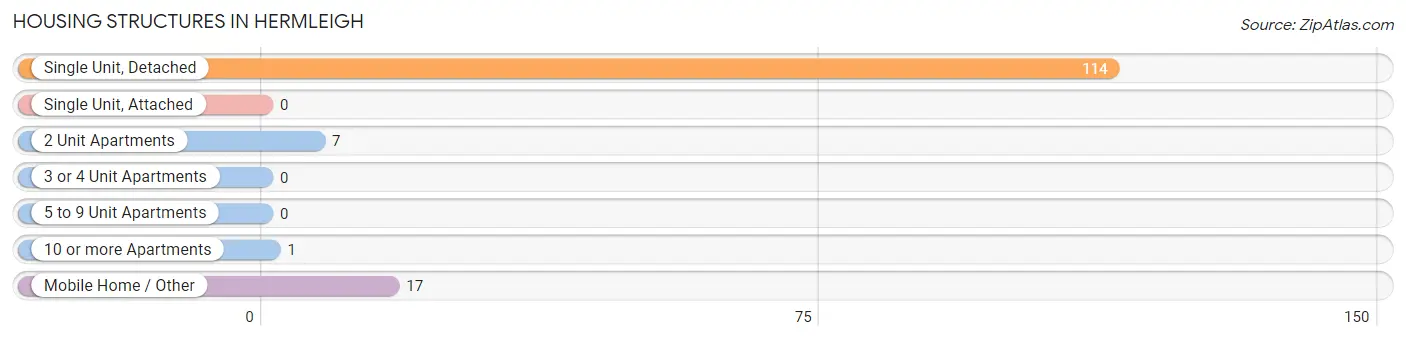
| Structure Type | # Housing Units | % Housing Units |
| Single Unit, Detached | 114 | 82.0% |
| Single Unit, Attached | 0 | 0.0% |
| 2 Unit Apartments | 7 | 5.0% |
| 3 or 4 Unit Apartments | 0 | 0.0% |
| 5 to 9 Unit Apartments | 0 | 0.0% |
| 10 or more Apartments | 1 | 0.7% |
| Mobile Home / Other | 17 | 12.2% |
| Total | 139 | 100.0% |
Housing Structures by Occupancy in Hermleigh
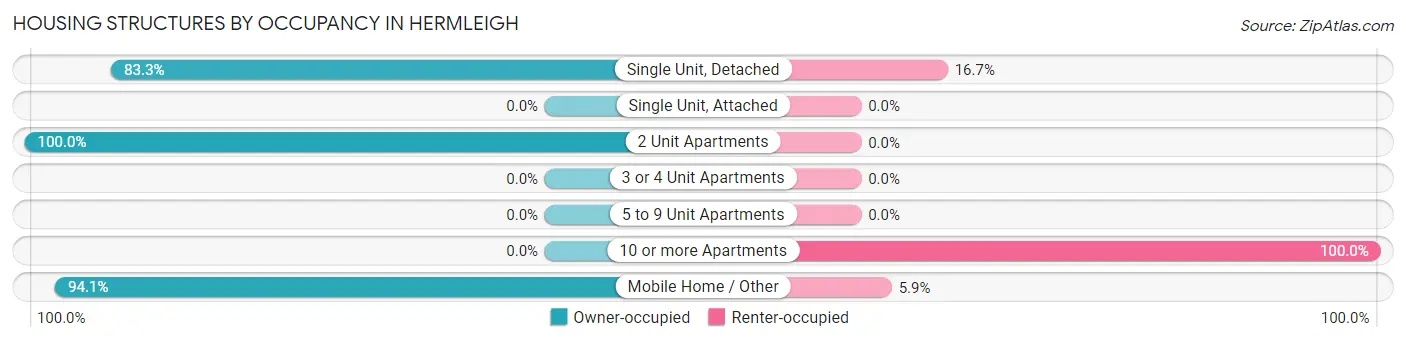
| Structure Type | Owner-occupied | Renter-occupied |
| Single Unit, Detached | 95 (83.3%) | 19 (16.7%) |
| Single Unit, Attached | 0 (0.0%) | 0 (0.0%) |
| 2 Unit Apartments | 7 (100.0%) | 0 (0.0%) |
| 3 or 4 Unit Apartments | 0 (0.0%) | 0 (0.0%) |
| 5 to 9 Unit Apartments | 0 (0.0%) | 0 (0.0%) |
| 10 or more Apartments | 0 (0.0%) | 1 (100.0%) |
| Mobile Home / Other | 16 (94.1%) | 1 (5.9%) |
| Total | 118 (84.9%) | 21 (15.1%) |
Housing Structures by Number of Rooms in Hermleigh
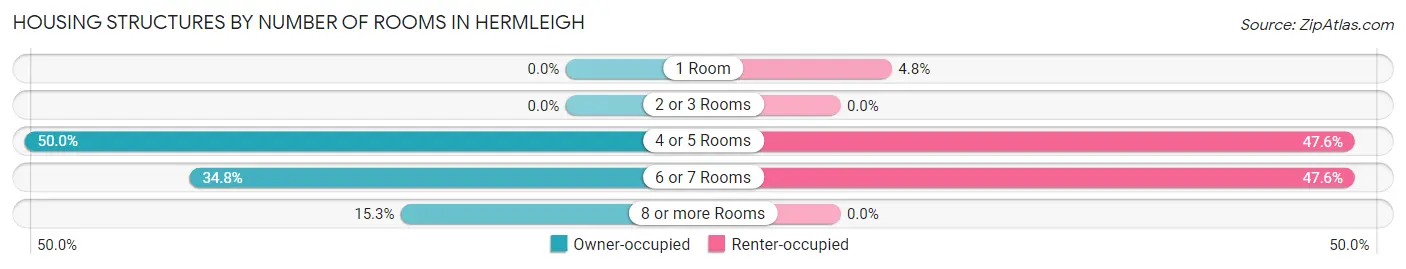
| Number of Rooms | Owner-occupied | Renter-occupied |
| 1 Room | 0 (0.0%) | 1 (4.8%) |
| 2 or 3 Rooms | 0 (0.0%) | 0 (0.0%) |
| 4 or 5 Rooms | 59 (50.0%) | 10 (47.6%) |
| 6 or 7 Rooms | 41 (34.7%) | 10 (47.6%) |
| 8 or more Rooms | 18 (15.2%) | 0 (0.0%) |
| Total | 118 (100.0%) | 21 (100.0%) |
Housing Structure by Heating Type in Hermleigh
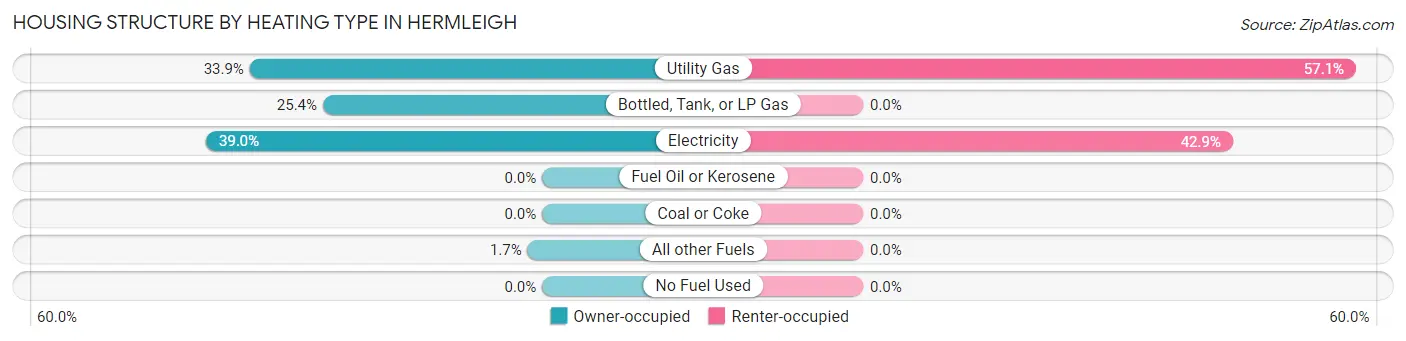
| Heating Type | Owner-occupied | Renter-occupied |
| Utility Gas | 40 (33.9%) | 12 (57.1%) |
| Bottled, Tank, or LP Gas | 30 (25.4%) | 0 (0.0%) |
| Electricity | 46 (39.0%) | 9 (42.9%) |
| Fuel Oil or Kerosene | 0 (0.0%) | 0 (0.0%) |
| Coal or Coke | 0 (0.0%) | 0 (0.0%) |
| All other Fuels | 2 (1.7%) | 0 (0.0%) |
| No Fuel Used | 0 (0.0%) | 0 (0.0%) |
| Total | 118 (100.0%) | 21 (100.0%) |
Household Vehicle Usage in Hermleigh
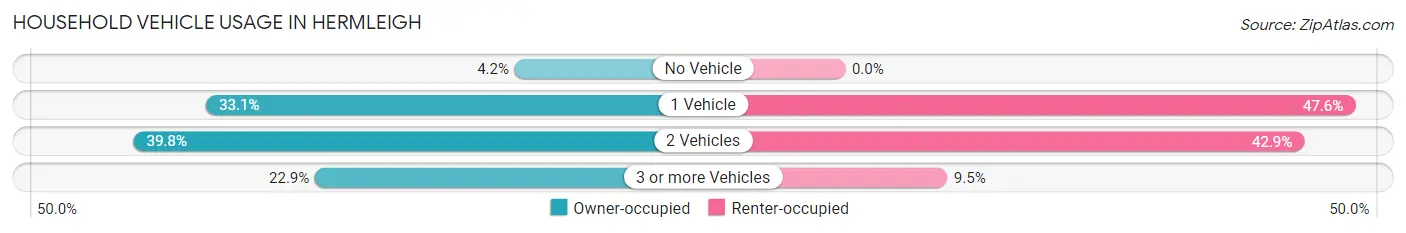
| Vehicles per Household | Owner-occupied | Renter-occupied |
| No Vehicle | 5 (4.2%) | 0 (0.0%) |
| 1 Vehicle | 39 (33.1%) | 10 (47.6%) |
| 2 Vehicles | 47 (39.8%) | 9 (42.9%) |
| 3 or more Vehicles | 27 (22.9%) | 2 (9.5%) |
| Total | 118 (100.0%) | 21 (100.0%) |
Real Estate & Mortgages in Hermleigh
Real Estate and Mortgage Overview in Hermleigh
| Characteristic | Without Mortgage | With Mortgage |
| Housing Units | 85 | 33 |
| Median Property Value | $52,300 | $133,900 |
| Median Household Income | $39,583 | $6 |
| Monthly Housing Costs | $398 | $0 |
| Real Estate Taxes | - | - |
Property Value by Mortgage Status in Hermleigh
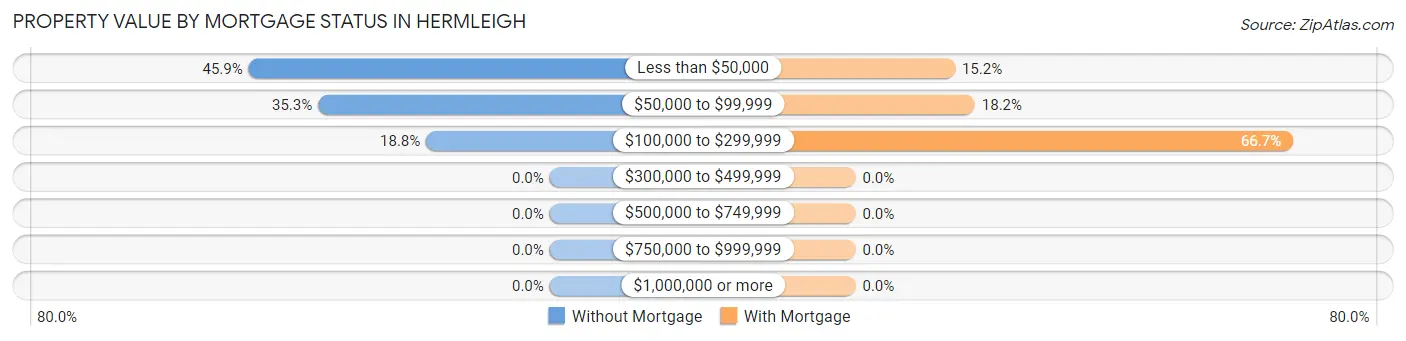
| Property Value | Without Mortgage | With Mortgage |
| Less than $50,000 | 39 (45.9%) | 5 (15.1%) |
| $50,000 to $99,999 | 30 (35.3%) | 6 (18.2%) |
| $100,000 to $299,999 | 16 (18.8%) | 22 (66.7%) |
| $300,000 to $499,999 | 0 (0.0%) | 0 (0.0%) |
| $500,000 to $749,999 | 0 (0.0%) | 0 (0.0%) |
| $750,000 to $999,999 | 0 (0.0%) | 0 (0.0%) |
| $1,000,000 or more | 0 (0.0%) | 0 (0.0%) |
| Total | 85 (100.0%) | 33 (100.0%) |
Household Income by Mortgage Status in Hermleigh
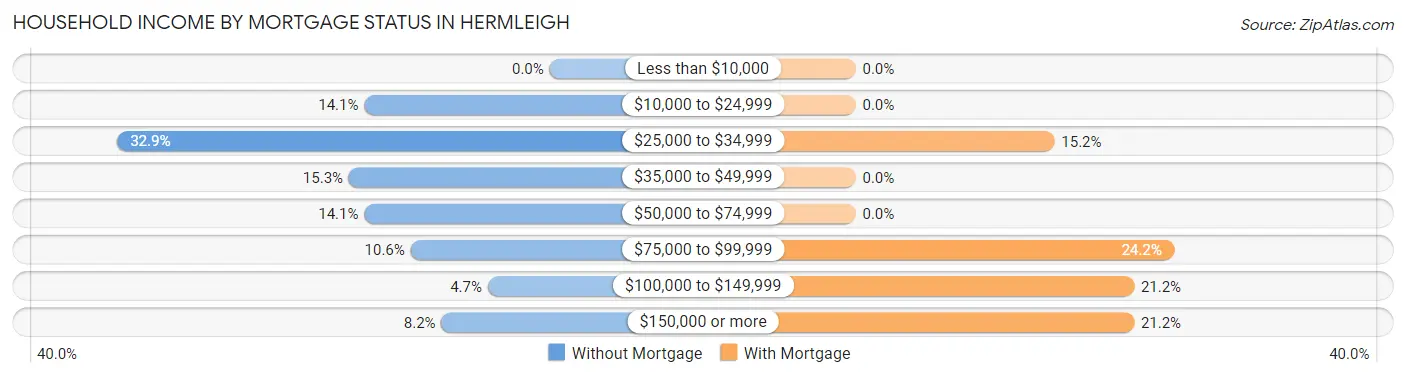
| Household Income | Without Mortgage | With Mortgage |
| Less than $10,000 | 0 (0.0%) | 0 (0.0%) |
| $10,000 to $24,999 | 12 (14.1%) | 0 (0.0%) |
| $25,000 to $34,999 | 28 (32.9%) | 5 (15.1%) |
| $35,000 to $49,999 | 13 (15.3%) | 0 (0.0%) |
| $50,000 to $74,999 | 12 (14.1%) | 0 (0.0%) |
| $75,000 to $99,999 | 9 (10.6%) | 8 (24.2%) |
| $100,000 to $149,999 | 4 (4.7%) | 7 (21.2%) |
| $150,000 or more | 7 (8.2%) | 7 (21.2%) |
| Total | 85 (100.0%) | 33 (100.0%) |
Property Value to Household Income Ratio in Hermleigh
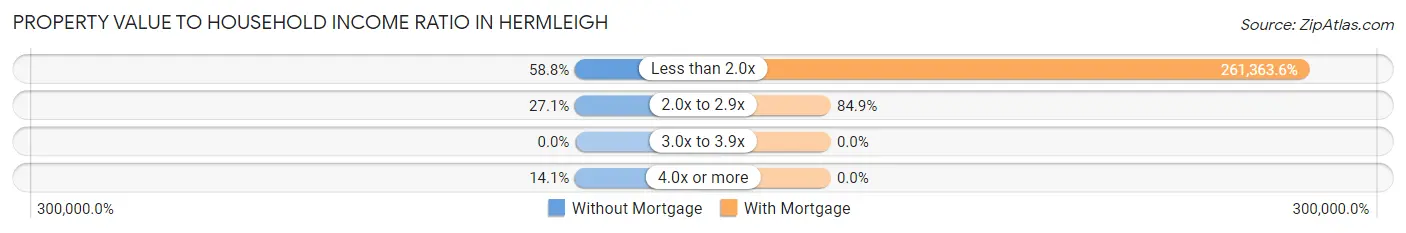
| Value-to-Income Ratio | Without Mortgage | With Mortgage |
| Less than 2.0x | 50 (58.8%) | 86,250 (261,363.6%) |
| 2.0x to 2.9x | 23 (27.1%) | 28 (84.9%) |
| 3.0x to 3.9x | 0 (0.0%) | 0 (0.0%) |
| 4.0x or more | 12 (14.1%) | 0 (0.0%) |
| Total | 85 (100.0%) | 33 (100.0%) |
Real Estate Taxes by Mortgage Status in Hermleigh
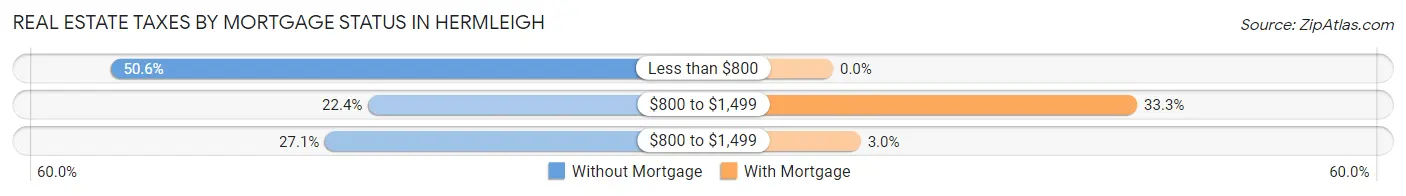
| Property Taxes | Without Mortgage | With Mortgage |
| Less than $800 | 43 (50.6%) | 0 (0.0%) |
| $800 to $1,499 | 19 (22.4%) | 11 (33.3%) |
| $800 to $1,499 | 23 (27.1%) | 1 (3.0%) |
| Total | 85 (100.0%) | 33 (100.0%) |
Health & Disability in Hermleigh
Health Insurance Coverage by Age in Hermleigh
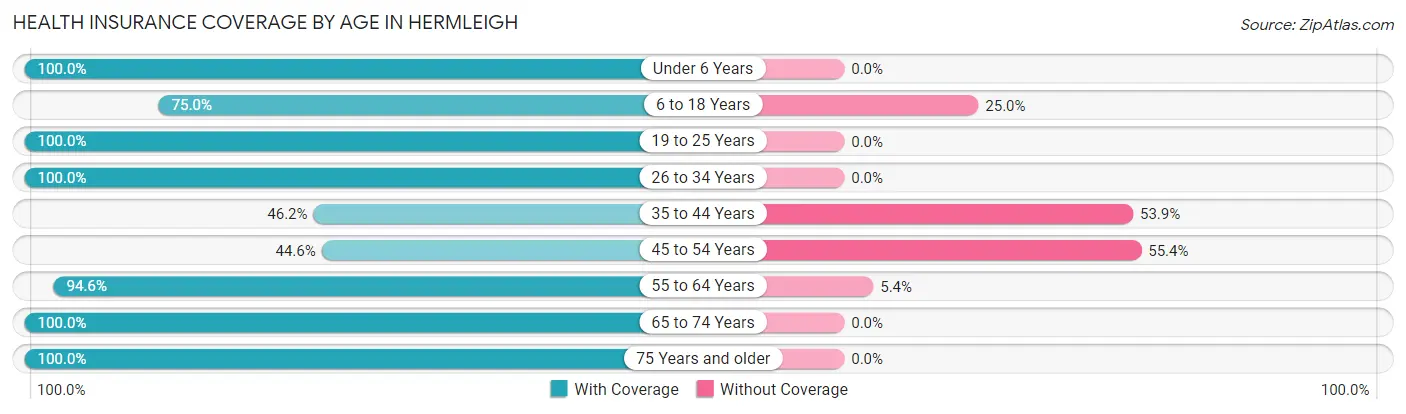
| Age Bracket | With Coverage | Without Coverage |
| Under 6 Years | 40 (100.0%) | 0 (0.0%) |
| 6 to 18 Years | 84 (75.0%) | 28 (25.0%) |
| 19 to 25 Years | 26 (100.0%) | 0 (0.0%) |
| 26 to 34 Years | 30 (100.0%) | 0 (0.0%) |
| 35 to 44 Years | 6 (46.2%) | 7 (53.8%) |
| 45 to 54 Years | 29 (44.6%) | 36 (55.4%) |
| 55 to 64 Years | 35 (94.6%) | 2 (5.4%) |
| 65 to 74 Years | 48 (100.0%) | 0 (0.0%) |
| 75 Years and older | 58 (100.0%) | 0 (0.0%) |
| Total | 356 (83.0%) | 73 (17.0%) |
Health Insurance Coverage by Citizenship Status in Hermleigh
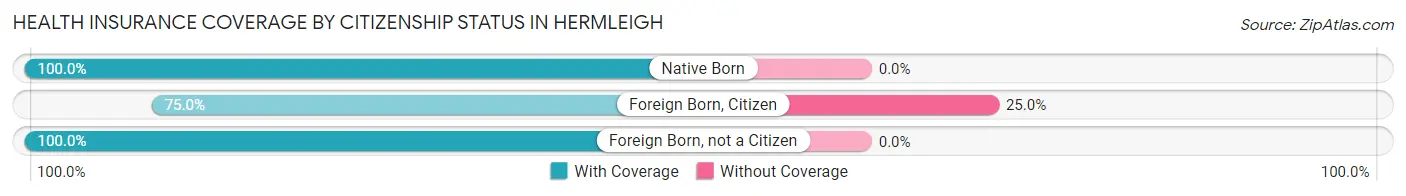
| Citizenship Status | With Coverage | Without Coverage |
| Native Born | 40 (100.0%) | 0 (0.0%) |
| Foreign Born, Citizen | 84 (75.0%) | 28 (25.0%) |
| Foreign Born, not a Citizen | 26 (100.0%) | 0 (0.0%) |
Health Insurance Coverage by Household Income in Hermleigh
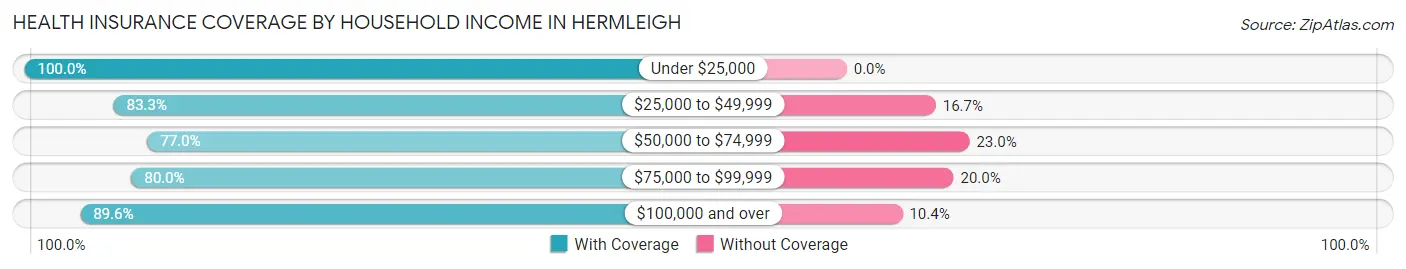
| Household Income | With Coverage | Without Coverage |
| Under $25,000 | 21 (100.0%) | 0 (0.0%) |
| $25,000 to $49,999 | 70 (83.3%) | 14 (16.7%) |
| $50,000 to $74,999 | 134 (77.0%) | 40 (23.0%) |
| $75,000 to $99,999 | 28 (80.0%) | 7 (20.0%) |
| $100,000 and over | 103 (89.6%) | 12 (10.4%) |
Public vs Private Health Insurance Coverage by Age in Hermleigh
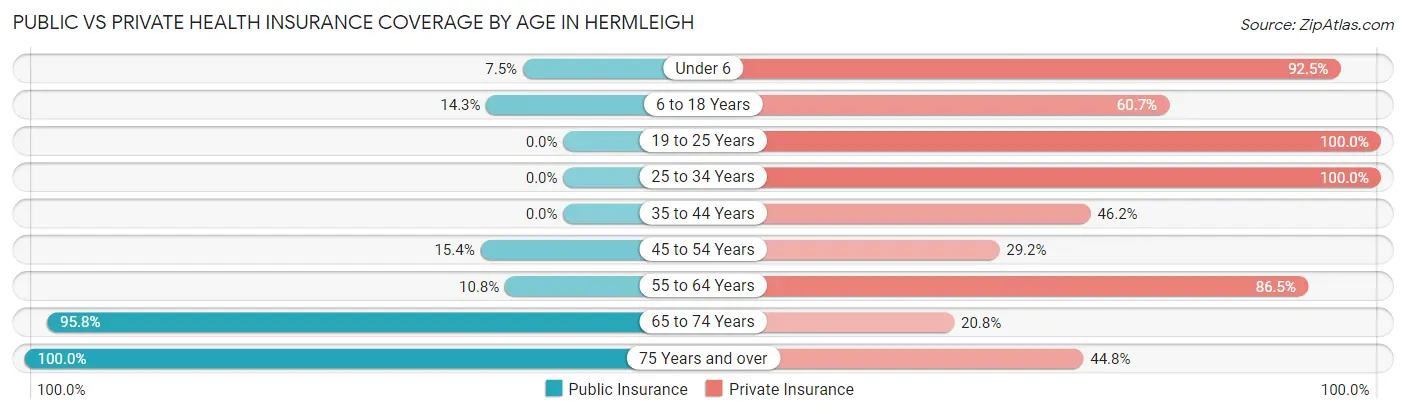
| Age Bracket | Public Insurance | Private Insurance |
| Under 6 | 3 (7.5%) | 37 (92.5%) |
| 6 to 18 Years | 16 (14.3%) | 68 (60.7%) |
| 19 to 25 Years | 0 (0.0%) | 26 (100.0%) |
| 25 to 34 Years | 0 (0.0%) | 30 (100.0%) |
| 35 to 44 Years | 0 (0.0%) | 6 (46.2%) |
| 45 to 54 Years | 10 (15.4%) | 19 (29.2%) |
| 55 to 64 Years | 4 (10.8%) | 32 (86.5%) |
| 65 to 74 Years | 46 (95.8%) | 10 (20.8%) |
| 75 Years and over | 58 (100.0%) | 26 (44.8%) |
| Total | 137 (31.9%) | 254 (59.2%) |
Disability Status by Sex by Age in Hermleigh
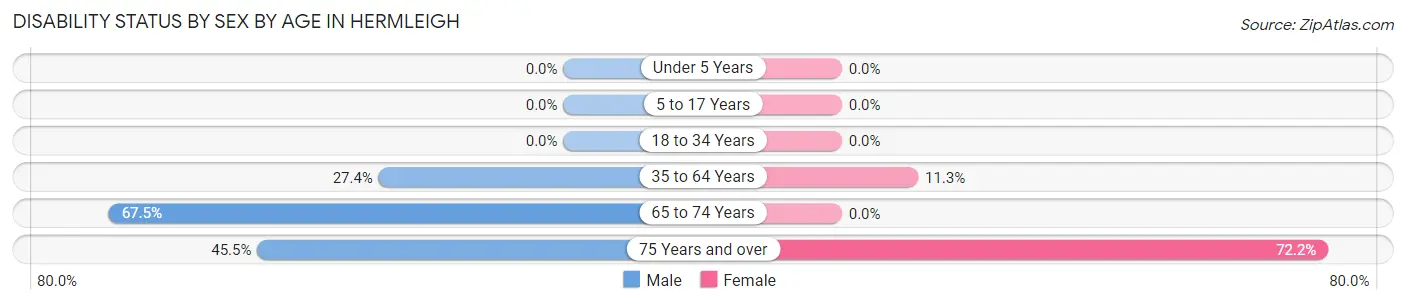
| Age Bracket | Male | Female |
| Under 5 Years | 0 (0.0%) | 0 (0.0%) |
| 5 to 17 Years | 0 (0.0%) | 0 (0.0%) |
| 18 to 34 Years | 0 (0.0%) | 0 (0.0%) |
| 35 to 64 Years | 17 (27.4%) | 6 (11.3%) |
| 65 to 74 Years | 27 (67.5%) | 0 (0.0%) |
| 75 Years and over | 10 (45.5%) | 26 (72.2%) |
Disability Class by Sex by Age in Hermleigh
Disability Class: Hearing Difficulty
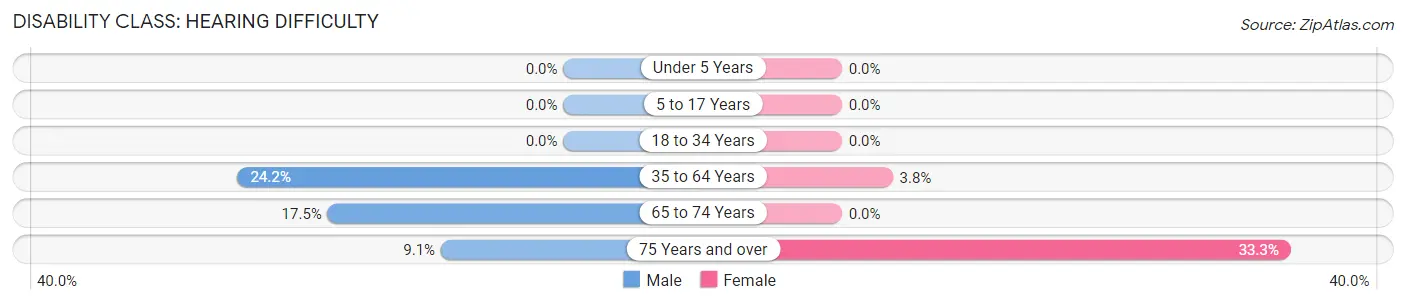
| Age Bracket | Male | Female |
| Under 5 Years | 0 (0.0%) | 0 (0.0%) |
| 5 to 17 Years | 0 (0.0%) | 0 (0.0%) |
| 18 to 34 Years | 0 (0.0%) | 0 (0.0%) |
| 35 to 64 Years | 15 (24.2%) | 2 (3.8%) |
| 65 to 74 Years | 7 (17.5%) | 0 (0.0%) |
| 75 Years and over | 2 (9.1%) | 12 (33.3%) |
Disability Class: Vision Difficulty
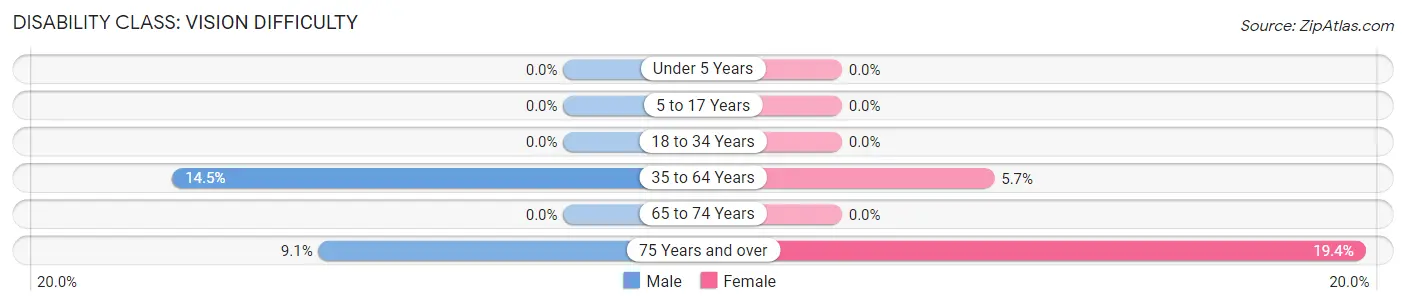
| Age Bracket | Male | Female |
| Under 5 Years | 0 (0.0%) | 0 (0.0%) |
| 5 to 17 Years | 0 (0.0%) | 0 (0.0%) |
| 18 to 34 Years | 0 (0.0%) | 0 (0.0%) |
| 35 to 64 Years | 9 (14.5%) | 3 (5.7%) |
| 65 to 74 Years | 0 (0.0%) | 0 (0.0%) |
| 75 Years and over | 2 (9.1%) | 7 (19.4%) |
Disability Class: Cognitive Difficulty
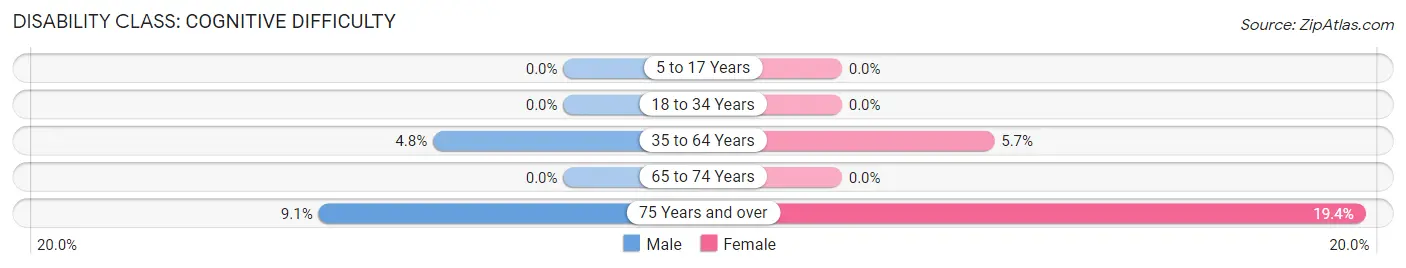
| Age Bracket | Male | Female |
| 5 to 17 Years | 0 (0.0%) | 0 (0.0%) |
| 18 to 34 Years | 0 (0.0%) | 0 (0.0%) |
| 35 to 64 Years | 3 (4.8%) | 3 (5.7%) |
| 65 to 74 Years | 0 (0.0%) | 0 (0.0%) |
| 75 Years and over | 2 (9.1%) | 7 (19.4%) |
Disability Class: Ambulatory Difficulty
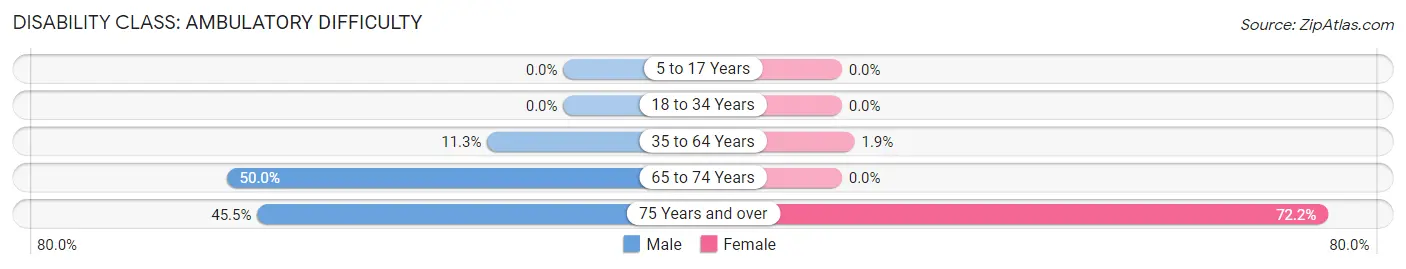
| Age Bracket | Male | Female |
| 5 to 17 Years | 0 (0.0%) | 0 (0.0%) |
| 18 to 34 Years | 0 (0.0%) | 0 (0.0%) |
| 35 to 64 Years | 7 (11.3%) | 1 (1.9%) |
| 65 to 74 Years | 20 (50.0%) | 0 (0.0%) |
| 75 Years and over | 10 (45.5%) | 26 (72.2%) |
Disability Class: Self-Care Difficulty
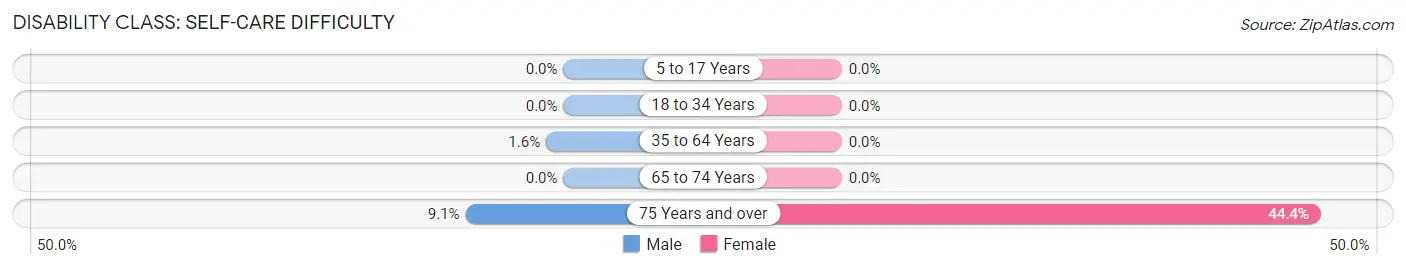
| Age Bracket | Male | Female |
| 5 to 17 Years | 0 (0.0%) | 0 (0.0%) |
| 18 to 34 Years | 0 (0.0%) | 0 (0.0%) |
| 35 to 64 Years | 1 (1.6%) | 0 (0.0%) |
| 65 to 74 Years | 0 (0.0%) | 0 (0.0%) |
| 75 Years and over | 2 (9.1%) | 16 (44.4%) |
Technology Access in Hermleigh
Computing Device Access in Hermleigh
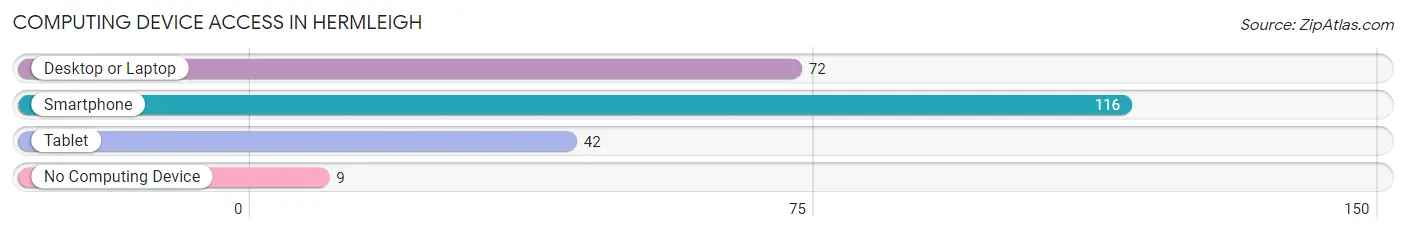
| Device Type | # Households | % Households |
| Desktop or Laptop | 72 | 51.8% |
| Smartphone | 116 | 83.5% |
| Tablet | 42 | 30.2% |
| No Computing Device | 9 | 6.5% |
| Total | 139 | 100.0% |
Internet Access in Hermleigh
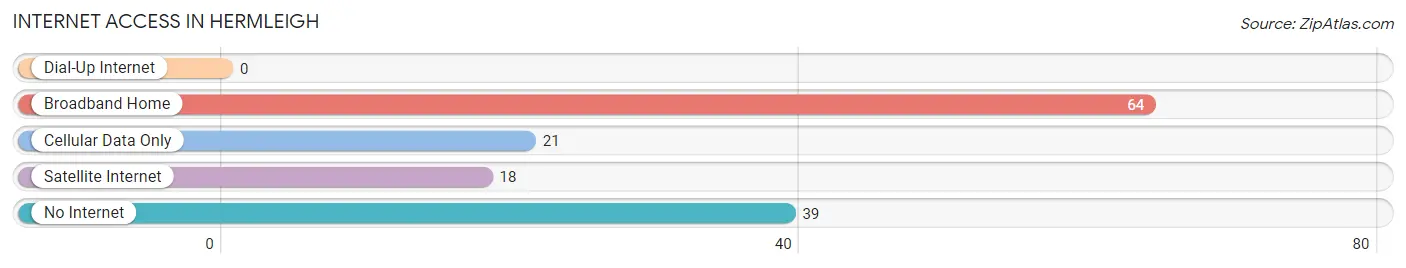
| Internet Type | # Households | % Households |
| Dial-Up Internet | 0 | 0.0% |
| Broadband Home | 64 | 46.0% |
| Cellular Data Only | 21 | 15.1% |
| Satellite Internet | 18 | 13.0% |
| No Internet | 39 | 28.1% |
| Total | 139 | 100.0% |
Hermleigh Summary
History
The small town of Hermleigh, Texas is located in Scurry County, Texas, and is situated about 20 miles south of Snyder, the county seat. The town was founded in the early 1900s by the Hermleigh family, who had moved to the area from Missouri. The family had purchased a large tract of land in the area and began to develop it for farming and ranching. The town was officially incorporated in 1911, and the first post office was established in 1912.
The town was named after the Hermleigh family, and the name is derived from the German word “herm”, which means “army”. The town was originally a farming and ranching community, and the main crops grown were cotton, corn, and wheat. The town also had a few small businesses, such as a general store, a blacksmith shop, and a livery stable.
In the 1920s, the town began to experience a period of growth and prosperity. The population increased from around 200 people in 1920 to over 500 by 1930. This growth was due in part to the discovery of oil in the area in the late 1920s. The oil boom brought many new people to the area, and the town experienced a period of rapid growth and development.
The town continued to grow and prosper throughout the 1930s and 1940s, and by 1950 the population had reached over 1,000 people. The town was home to several businesses, including a bank, a hotel, a movie theater, and several stores.
Geography
Hermleigh is located in the western part of Scurry County, Texas, about 20 miles south of Snyder, the county seat. The town is situated on the edge of the Rolling Plains region of Texas, and is surrounded by flat, open plains. The town is located at an elevation of 1,845 feet above sea level.
The climate in Hermleigh is semi-arid, with hot summers and mild winters. The average annual temperature is around 68 degrees Fahrenheit, and the average annual precipitation is around 22 inches.
Economy
The economy of Hermleigh is largely based on agriculture and oil production. The town is home to several large farms and ranches, and the main crops grown in the area are cotton, corn, and wheat. The town is also home to several oil and gas production companies, and the oil and gas industry is a major contributor to the local economy.
In addition to agriculture and oil production, the town is also home to several small businesses, including a bank, a hotel, a movie theater, and several stores. The town also has a few manufacturing companies, and the local economy is supported by the tourism industry.
Demographics
As of the 2010 census, the population of Hermleigh was 1,072 people. The racial makeup of the town was 94.3% White, 0.3% African American, 0.2% Native American, 0.2% Asian, 0.1% Pacific Islander, 3.3% from other races, and 1.6% from two or more races. Hispanic or Latino of any race were 6.2% of the population.
The median household income in Hermleigh was $37,500, and the median family income was $41,250. The per capita income in the town was $17,845. About 11.2% of the population was below the poverty line.
Common Questions
What is Per Capita Income in Hermleigh?
Per Capita income in Hermleigh is $22,511.
What is the Median Family Income in Hermleigh?
Median Family Income in Hermleigh is $67,031.
What is the Median Household income in Hermleigh?
Median Household Income in Hermleigh is $50,179.
What is Income or Wage Gap in Hermleigh?
Income or Wage Gap in Hermleigh is 33.1%.
Women in Hermleigh earn 66.9 cents for every dollar earned by a man.
What is Inequality or Gini Index in Hermleigh?
Inequality or Gini Index in Hermleigh is 0.39.
What is the Total Population of Hermleigh?
Total Population of Hermleigh is 429.
What is the Total Male Population of Hermleigh?
Total Male Population of Hermleigh is 271.
What is the Total Female Population of Hermleigh?
Total Female Population of Hermleigh is 158.
What is the Ratio of Males per 100 Females in Hermleigh?
There are 171.52 Males per 100 Females in Hermleigh.
What is the Ratio of Females per 100 Males in Hermleigh?
There are 58.30 Females per 100 Males in Hermleigh.
What is the Median Population Age in Hermleigh?
Median Population Age in Hermleigh is 43.1 Years.
What is the Average Family Size in Hermleigh
Average Family Size in Hermleigh is 4.3 People.
What is the Average Household Size in Hermleigh
Average Household Size in Hermleigh is 3.1 People.
How Large is the Labor Force in Hermleigh?
There are 135 People in the Labor Forcein in Hermleigh.
What is the Percentage of People in the Labor Force in Hermleigh?
44.9% of People are in the Labor Force in Hermleigh.
What is the Unemployment Rate in Hermleigh?
Unemployment Rate in Hermleigh is 9.6%.