Nambe, NM Map & Demographics
Nambe Map
Nambe Overview
$36,240
PER CAPITA INCOME
$69,083
AVG FAMILY INCOME
$42,596
AVG HOUSEHOLD INCOME
4.2%
WAGE / INCOME GAP [ % ]
95.8¢/ $1
WAGE / INCOME GAP [ $ ]
0.56
INEQUALITY / GINI INDEX
2,165
TOTAL POPULATION
1,105
MALE POPULATION
1,060
FEMALE POPULATION
104.25
MALES / 100 FEMALES
95.93
FEMALES / 100 MALES
50.7
MEDIAN AGE
3.1
AVG FAMILY SIZE
2.2
AVG HOUSEHOLD SIZE
899
LABOR FORCE [ PEOPLE ]
47.1%
PERCENT IN LABOR FORCE
10.7%
UNEMPLOYMENT RATE
Income in Nambe
Income Overview in Nambe
Per Capita Income in Nambe is $36,240, while median incomes of families and households are $69,083 and $42,596 respectively.
| Characteristic | Number | Measure |
| Per Capita Income | 2,165 | $36,240 |
| Median Family Income | 525 | $69,083 |
| Mean Family Income | 525 | $103,394 |
| Median Household Income | 986 | $42,596 |
| Mean Household Income | 986 | $73,380 |
| Income Deficit | 525 | $0 |
| Wage / Income Gap (%) | 2,165 | 4.20% |
| Wage / Income Gap ($) | 2,165 | 95.80¢ per $1 |
| Gini / Inequality Index | 2,165 | 0.56 |
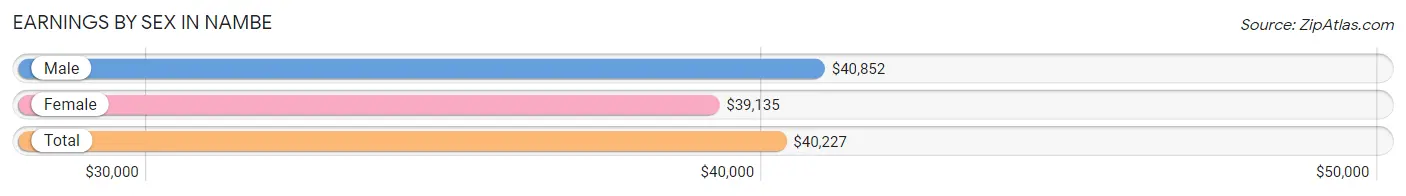
Earnings by Sex in Nambe
Average Earnings in Nambe are $40,227, $40,852 for men and $39,135 for women, a difference of 4.2%.
| Sex | Number | Average Earnings |
| Male | 477 (54.2%) | $40,852 |
| Female | 403 (45.8%) | $39,135 |
| Total | 880 (100.0%) | $40,227 |
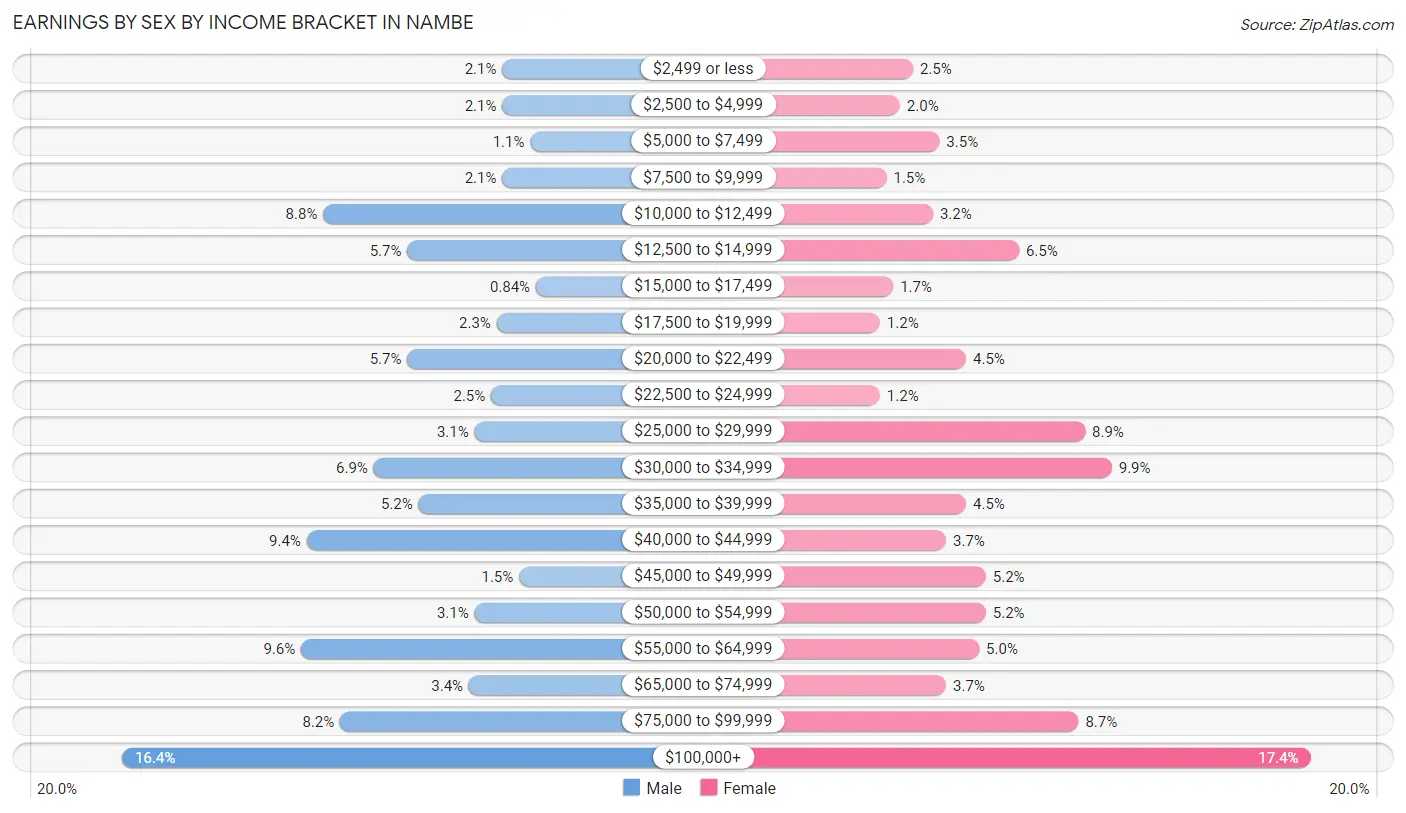
Earnings by Sex by Income Bracket in Nambe
The most common earnings brackets in Nambe are $100,000+ for men (78 | 16.4%) and $100,000+ for women (70 | 17.4%).
| Income | Male | Female |
| $2,499 or less | 10 (2.1%) | 10 (2.5%) |
| $2,500 to $4,999 | 10 (2.1%) | 8 (2.0%) |
| $5,000 to $7,499 | 5 (1.1%) | 14 (3.5%) |
| $7,500 to $9,999 | 10 (2.1%) | 6 (1.5%) |
| $10,000 to $12,499 | 42 (8.8%) | 13 (3.2%) |
| $12,500 to $14,999 | 27 (5.7%) | 26 (6.5%) |
| $15,000 to $17,499 | 4 (0.8%) | 7 (1.7%) |
| $17,500 to $19,999 | 11 (2.3%) | 5 (1.2%) |
| $20,000 to $22,499 | 27 (5.7%) | 18 (4.5%) |
| $22,500 to $24,999 | 12 (2.5%) | 5 (1.2%) |
| $25,000 to $29,999 | 15 (3.1%) | 36 (8.9%) |
| $30,000 to $34,999 | 33 (6.9%) | 40 (9.9%) |
| $35,000 to $39,999 | 25 (5.2%) | 18 (4.5%) |
| $40,000 to $44,999 | 45 (9.4%) | 15 (3.7%) |
| $45,000 to $49,999 | 7 (1.5%) | 21 (5.2%) |
| $50,000 to $54,999 | 15 (3.1%) | 21 (5.2%) |
| $55,000 to $64,999 | 46 (9.6%) | 20 (5.0%) |
| $65,000 to $74,999 | 16 (3.4%) | 15 (3.7%) |
| $75,000 to $99,999 | 39 (8.2%) | 35 (8.7%) |
| $100,000+ | 78 (16.4%) | 70 (17.4%) |
| Total | 477 (100.0%) | 403 (100.0%) |
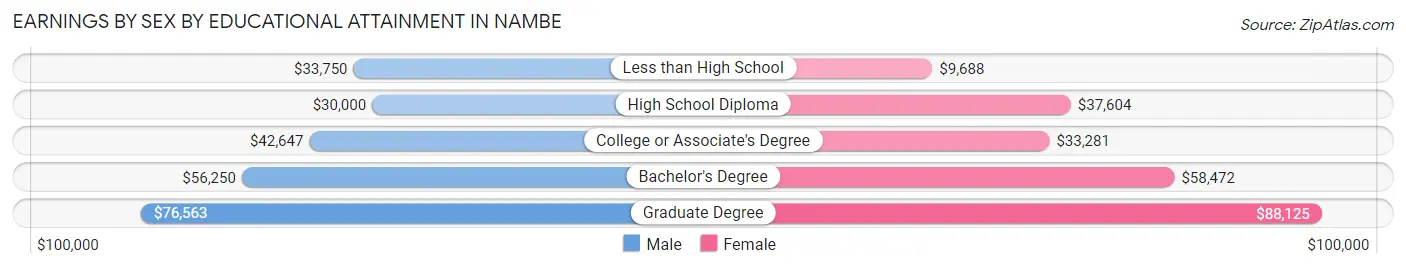
Earnings by Sex by Educational Attainment in Nambe
Average earnings in Nambe are $43,804 for men and $44,688 for women, a difference of 2.0%. Men with an educational attainment of graduate degree enjoy the highest average annual earnings of $76,563, while those with high school diploma education earn the least with $30,000. Women with an educational attainment of graduate degree earn the most with the average annual earnings of $88,125, while those with less than high school education have the smallest earnings of $9,688.
| Educational Attainment | Male Income | Female Income |
| Less than High School | $33,750 | $9,688 |
| High School Diploma | $30,000 | $37,604 |
| College or Associate's Degree | $42,647 | $33,281 |
| Bachelor's Degree | $56,250 | $58,472 |
| Graduate Degree | $76,563 | $88,125 |
| Total | $43,804 | $44,688 |
Family Income in Nambe
Family Income Brackets in Nambe
According to the Nambe family income data, there are 105 families falling into the $100,000 to $149,999 income range, which is the most common income bracket and makes up 20.0% of all families. Conversely, the less than $10,000 income bracket is the least frequent group with only 5 families (0.9%) belonging to this category.
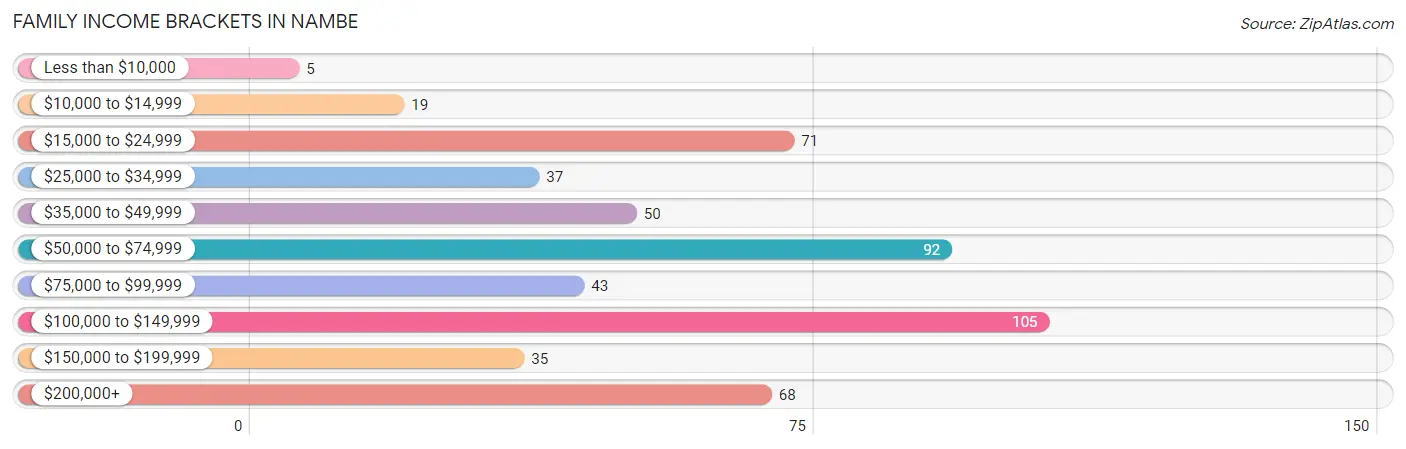
| Income Bracket | # Families | % Families |
| Less than $10,000 | 5 | 1.0% |
| $10,000 to $14,999 | 19 | 3.6% |
| $15,000 to $24,999 | 71 | 13.5% |
| $25,000 to $34,999 | 37 | 7.0% |
| $35,000 to $49,999 | 50 | 9.5% |
| $50,000 to $74,999 | 92 | 17.5% |
| $75,000 to $99,999 | 43 | 8.2% |
| $100,000 to $149,999 | 105 | 20.0% |
| $150,000 to $199,999 | 35 | 6.7% |
| $200,000+ | 68 | 13.0% |
Family Income by Famaliy Size in Nambe
7+ person families (15 | 2.9%) account for the highest median family income in Nambe with $225,417 per family, while 2-person families (332 | 63.2%) have the highest median income of $32,778 per family member.
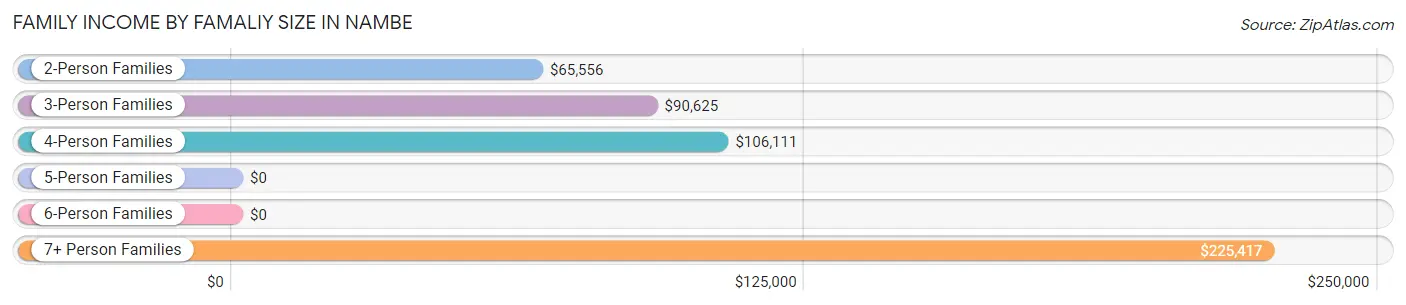
| Income Bracket | # Families | Median Income |
| 2-Person Families | 332 (63.2%) | $65,556 |
| 3-Person Families | 77 (14.7%) | $90,625 |
| 4-Person Families | 78 (14.9%) | $106,111 |
| 5-Person Families | 13 (2.5%) | $0 |
| 6-Person Families | 10 (1.9%) | $0 |
| 7+ Person Families | 15 (2.9%) | $225,417 |
| Total | 525 (100.0%) | $69,083 |
Family Income by Number of Earners in Nambe
The median family income in Nambe is $69,083, with families comprising 3+ earners (34) having the highest median family income of $153,000, while families with no earners (176) have the lowest median family income of $41,667, accounting for 6.5% and 33.5% of families, respectively.
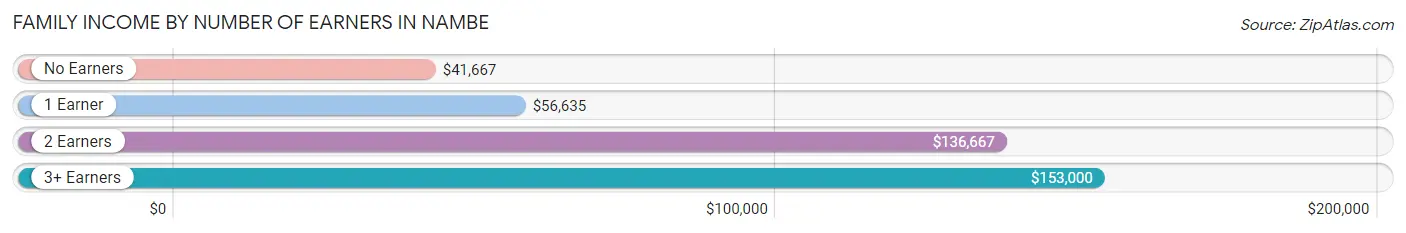
| Number of Earners | # Families | Median Income |
| No Earners | 176 (33.5%) | $41,667 |
| 1 Earner | 185 (35.2%) | $56,635 |
| 2 Earners | 130 (24.8%) | $136,667 |
| 3+ Earners | 34 (6.5%) | $153,000 |
| Total | 525 (100.0%) | $69,083 |
Household Income in Nambe
Household Income Brackets in Nambe
With 176 households falling in the category, the less than $10,000 income range is the most frequent in Nambe, accounting for 17.8% of all households. In contrast, only 46 households (4.7%) fall into the $150,000 to $199,999 income bracket, making it the least populous group.
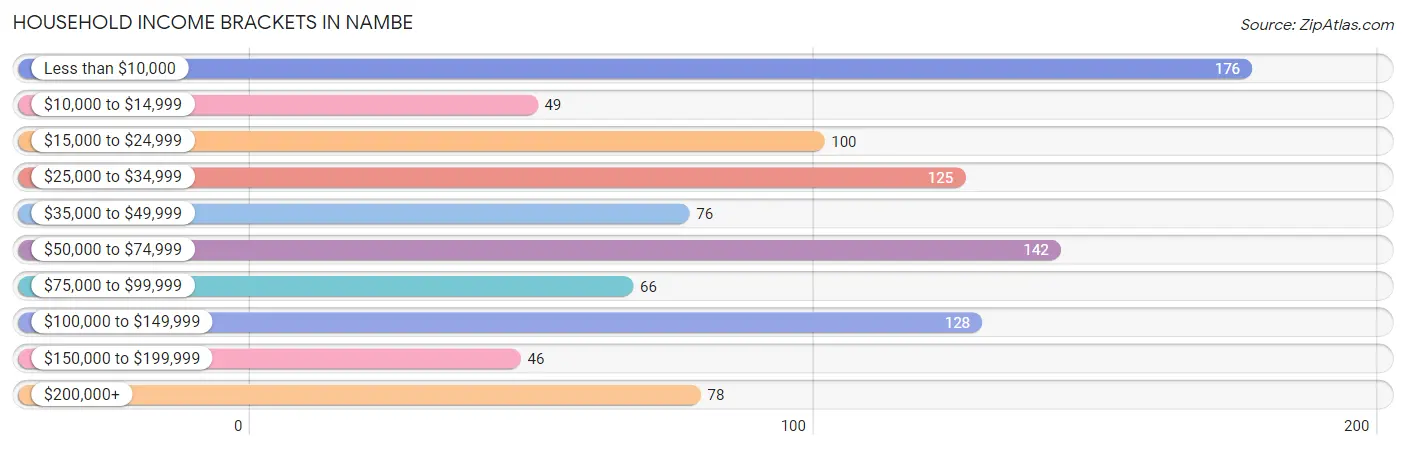
| Income Bracket | # Households | % Households |
| Less than $10,000 | 176 | 17.8% |
| $10,000 to $14,999 | 49 | 5.0% |
| $15,000 to $24,999 | 100 | 10.1% |
| $25,000 to $34,999 | 125 | 12.7% |
| $35,000 to $49,999 | 76 | 7.7% |
| $50,000 to $74,999 | 142 | 14.4% |
| $75,000 to $99,999 | 66 | 6.7% |
| $100,000 to $149,999 | 128 | 13.0% |
| $150,000 to $199,999 | 46 | 4.7% |
| $200,000+ | 78 | 7.9% |
Household Income by Householder Age in Nambe
The median household income in Nambe is $42,596, with the highest median household income of $83,750 found in the 25 to 44 years age bracket for the primary householder. A total of 160 households (16.2%) fall into this category. Meanwhile, the 15 to 24 years age bracket for the primary householder has the lowest median household income of $0, with 28 households (2.8%) in this group.
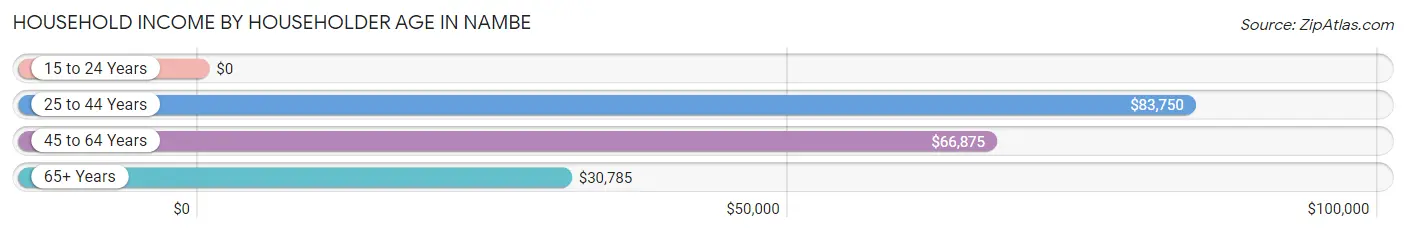
| Income Bracket | # Households | Median Income |
| 15 to 24 Years | 28 (2.8%) | $0 |
| 25 to 44 Years | 160 (16.2%) | $83,750 |
| 45 to 64 Years | 341 (34.6%) | $66,875 |
| 65+ Years | 457 (46.4%) | $30,785 |
| Total | 986 (100.0%) | $42,596 |
Poverty in Nambe
Income Below Poverty by Sex and Age in Nambe
With 17.8% poverty level for males and 14.9% for females among the residents of Nambe, 15 year old males and 15 year old females are the most vulnerable to poverty, with 11 males (84.6%) and 3 females (37.5%) in their respective age groups living below the poverty level.
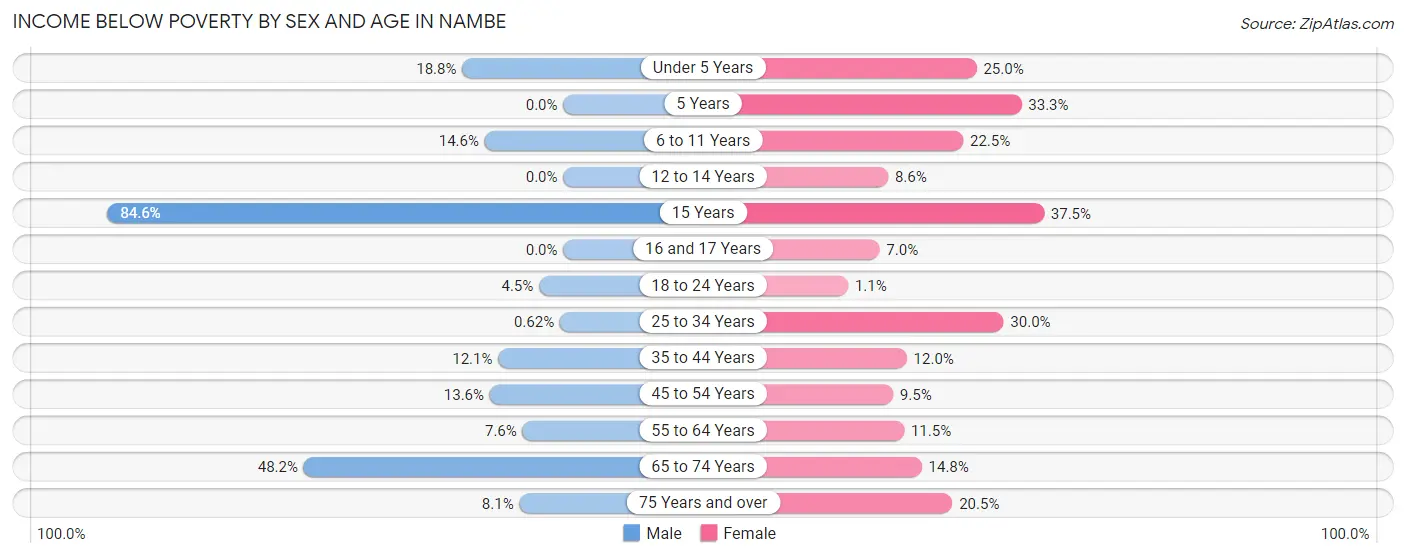
| Age Bracket | Male | Female |
| Under 5 Years | 9 (18.8%) | 9 (25.0%) |
| 5 Years | 0 (0.0%) | 2 (33.3%) |
| 6 to 11 Years | 7 (14.6%) | 9 (22.5%) |
| 12 to 14 Years | 0 (0.0%) | 3 (8.6%) |
| 15 Years | 11 (84.6%) | 3 (37.5%) |
| 16 and 17 Years | 0 (0.0%) | 3 (7.0%) |
| 18 to 24 Years | 5 (4.5%) | 1 (1.1%) |
| 25 to 34 Years | 1 (0.6%) | 33 (30.0%) |
| 35 to 44 Years | 7 (12.1%) | 13 (12.0%) |
| 45 to 54 Years | 18 (13.6%) | 15 (9.5%) |
| 55 to 64 Years | 13 (7.6%) | 18 (11.5%) |
| 65 to 74 Years | 119 (48.2%) | 16 (14.8%) |
| 75 Years and over | 7 (8.1%) | 33 (20.5%) |
| Total | 197 (17.8%) | 158 (14.9%) |
Income Above Poverty by Sex and Age in Nambe
According to the poverty statistics in Nambe, males aged 5 years and females aged 18 to 24 years are the age groups that are most secure financially, with 100.0% of males and 98.9% of females in these age groups living above the poverty line.
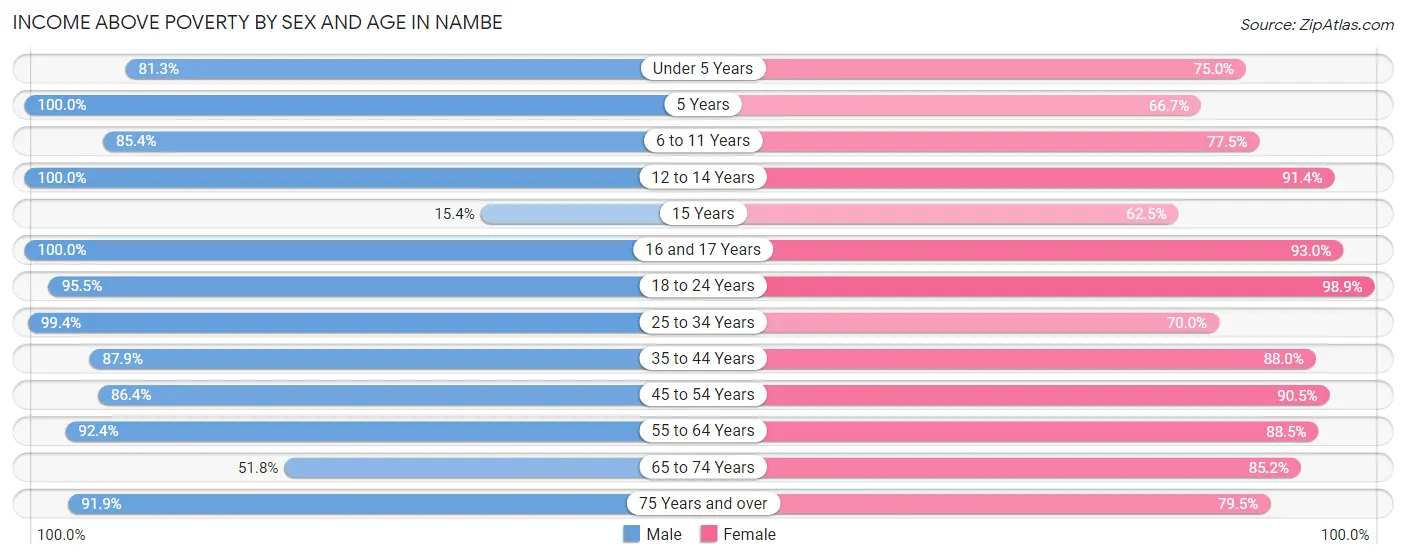
| Age Bracket | Male | Female |
| Under 5 Years | 39 (81.2%) | 27 (75.0%) |
| 5 Years | 3 (100.0%) | 4 (66.7%) |
| 6 to 11 Years | 41 (85.4%) | 31 (77.5%) |
| 12 to 14 Years | 16 (100.0%) | 32 (91.4%) |
| 15 Years | 2 (15.4%) | 5 (62.5%) |
| 16 and 17 Years | 9 (100.0%) | 40 (93.0%) |
| 18 to 24 Years | 106 (95.5%) | 87 (98.9%) |
| 25 to 34 Years | 161 (99.4%) | 77 (70.0%) |
| 35 to 44 Years | 51 (87.9%) | 95 (88.0%) |
| 45 to 54 Years | 114 (86.4%) | 143 (90.5%) |
| 55 to 64 Years | 159 (92.4%) | 138 (88.5%) |
| 65 to 74 Years | 128 (51.8%) | 92 (85.2%) |
| 75 Years and over | 79 (91.9%) | 128 (79.5%) |
| Total | 908 (82.2%) | 899 (85.1%) |
Income Below Poverty Among Married-Couple Families in Nambe
The poverty statistics for married-couple families in Nambe show that 1.5% or 5 of the total 336 families live below the poverty line. Families with 1 or 2 children have the highest poverty rate of 3.2%, comprising of 2 families. On the other hand, families with 3 or 4 children have the lowest poverty rate of 0.0%, which includes 0 families.
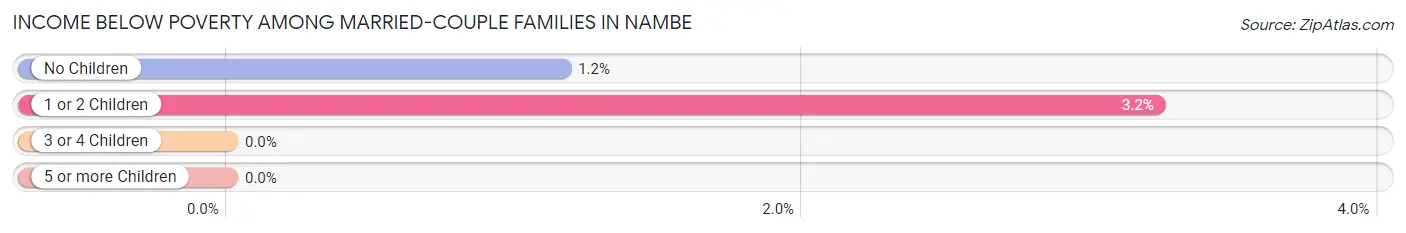
| Children | Above Poverty | Below Poverty |
| No Children | 255 (98.8%) | 3 (1.2%) |
| 1 or 2 Children | 60 (96.8%) | 2 (3.2%) |
| 3 or 4 Children | 7 (100.0%) | 0 (0.0%) |
| 5 or more Children | 9 (100.0%) | 0 (0.0%) |
| Total | 331 (98.5%) | 5 (1.5%) |
Income Below Poverty Among Single-Parent Households in Nambe
According to the poverty data in Nambe, 11.3% or 7 single-father households and 17.3% or 22 single-mother households are living below the poverty line. Among single-father households, those with 1 or 2 children have the highest poverty rate, with 3 households (14.3%) experiencing poverty. Likewise, among single-mother households, those with 5 or more children have the highest poverty rate, with 3 households (100.0%) falling below the poverty line.
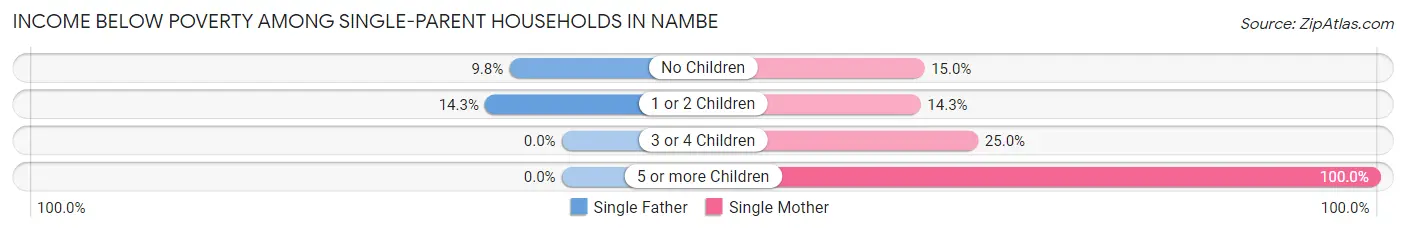
| Children | Single Father | Single Mother |
| No Children | 4 (9.8%) | 9 (15.0%) |
| 1 or 2 Children | 3 (14.3%) | 8 (14.3%) |
| 3 or 4 Children | 0 (0.0%) | 2 (25.0%) |
| 5 or more Children | 0 (0.0%) | 3 (100.0%) |
| Total | 7 (11.3%) | 22 (17.3%) |
Income Below Poverty Among Married-Couple vs Single-Parent Households in Nambe
The poverty data for Nambe shows that 5 of the married-couple family households (1.5%) and 29 of the single-parent households (15.3%) are living below the poverty level. Within the married-couple family households, those with 1 or 2 children have the highest poverty rate, with 2 households (3.2%) falling below the poverty line. Among the single-parent households, those with 5 or more children have the highest poverty rate, with 3 household (100.0%) living below poverty.
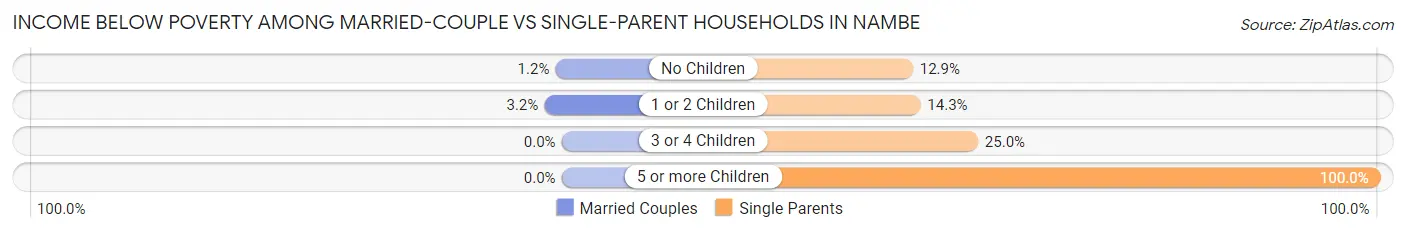
| Children | Married-Couple Families | Single-Parent Households |
| No Children | 3 (1.2%) | 13 (12.9%) |
| 1 or 2 Children | 2 (3.2%) | 11 (14.3%) |
| 3 or 4 Children | 0 (0.0%) | 2 (25.0%) |
| 5 or more Children | 0 (0.0%) | 3 (100.0%) |
| Total | 5 (1.5%) | 29 (15.3%) |
Race in Nambe
The most populous races in Nambe are Hispanic or Latino (1,395 | 64.4%), White / Caucasian (855 | 39.5%), and Native / Alaskan (511 | 23.6%).
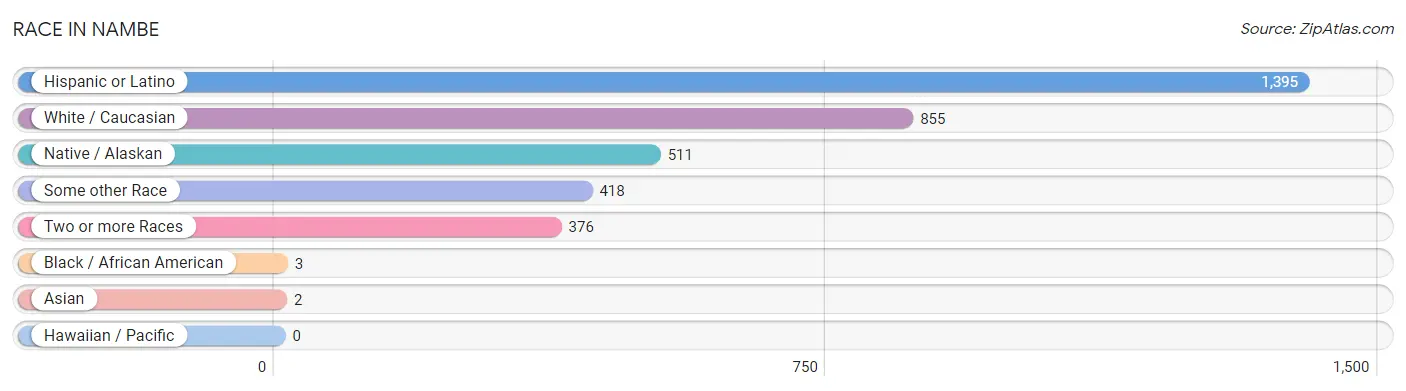
| Race | # Population | % Population |
| Asian | 2 | 0.1% |
| Black / African American | 3 | 0.1% |
| Hawaiian / Pacific | 0 | 0.0% |
| Hispanic or Latino | 1,395 | 64.4% |
| Native / Alaskan | 511 | 23.6% |
| White / Caucasian | 855 | 39.5% |
| Two or more Races | 376 | 17.4% |
| Some other Race | 418 | 19.3% |
| Total | 2,165 | 100.0% |
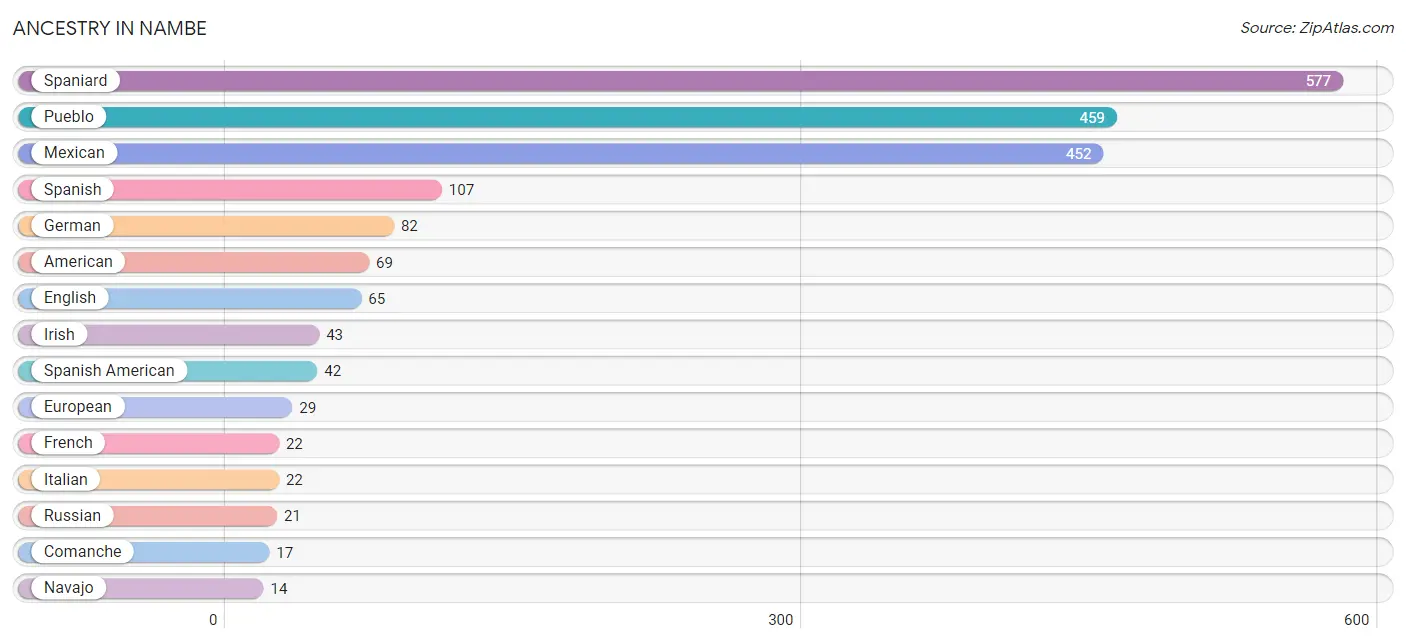
Ancestry in Nambe
The most populous ancestries reported in Nambe are Spaniard (577 | 26.7%), Pueblo (459 | 21.2%), Mexican (452 | 20.9%), Spanish (107 | 4.9%), and German (82 | 3.8%), together accounting for 77.5% of all Nambe residents.
| Ancestry | # Population | % Population |
| African | 2 | 0.1% |
| American | 69 | 3.2% |
| Apache | 3 | 0.1% |
| Bhutanese | 6 | 0.3% |
| British | 12 | 0.5% |
| Cherokee | 3 | 0.1% |
| Comanche | 17 | 0.8% |
| Cuban | 2 | 0.1% |
| Czech | 3 | 0.1% |
| Danish | 2 | 0.1% |
| Dutch | 7 | 0.3% |
| Eastern European | 5 | 0.2% |
| English | 65 | 3.0% |
| European | 29 | 1.3% |
| French | 22 | 1.0% |
| French Canadian | 2 | 0.1% |
| German | 82 | 3.8% |
| Hopi | 3 | 0.1% |
| Hungarian | 3 | 0.1% |
| Indian (Asian) | 1 | 0.1% |
| Indonesian | 1 | 0.1% |
| Irish | 43 | 2.0% |
| Italian | 22 | 1.0% |
| Mexican | 452 | 20.9% |
| Mexican American Indian | 3 | 0.1% |
| Navajo | 14 | 0.6% |
| Northern European | 5 | 0.2% |
| Norwegian | 6 | 0.3% |
| Portuguese | 2 | 0.1% |
| Pueblo | 459 | 21.2% |
| Russian | 21 | 1.0% |
| Scandinavian | 11 | 0.5% |
| Scotch-Irish | 5 | 0.2% |
| Scottish | 13 | 0.6% |
| Sioux | 14 | 0.6% |
| Slovak | 7 | 0.3% |
| Spaniard | 577 | 26.7% |
| Spanish | 107 | 4.9% |
| Spanish American | 42 | 1.9% |
| Spanish American Indian | 8 | 0.4% |
| Subsaharan African | 2 | 0.1% |
| Swedish | 5 | 0.2% |
| Thai | 3 | 0.1% |
| Turkish | 4 | 0.2% |
| Ukrainian | 13 | 0.6% |
| Welsh | 4 | 0.2% | View All 46 Rows |
Immigrants in Nambe
The most numerous immigrant groups reported in Nambe came from Central America (64 | 3.0%), Latin America (64 | 3.0%), Mexico (64 | 3.0%), Europe (19 | 0.9%), and Eastern Europe (10 | 0.5%), together accounting for 10.2% of all Nambe residents.
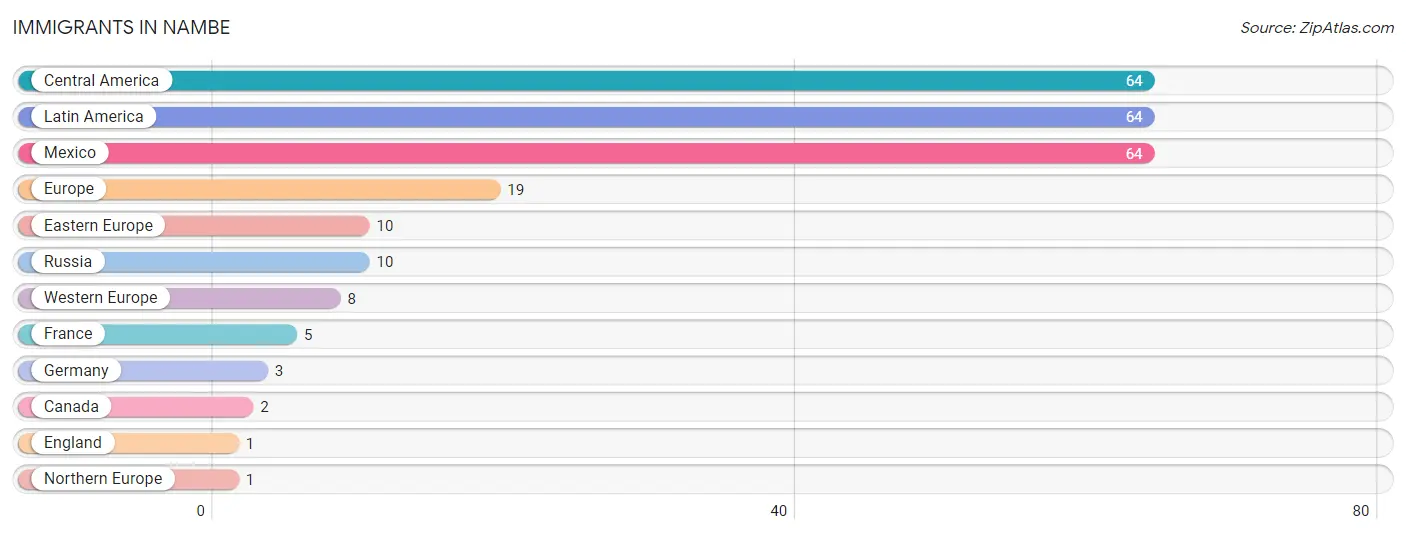
| Immigration Origin | # Population | % Population |
| Canada | 2 | 0.1% |
| Central America | 64 | 3.0% |
| Eastern Europe | 10 | 0.5% |
| England | 1 | 0.1% |
| Europe | 19 | 0.9% |
| France | 5 | 0.2% |
| Germany | 3 | 0.1% |
| Latin America | 64 | 3.0% |
| Mexico | 64 | 3.0% |
| Northern Europe | 1 | 0.1% |
| Russia | 10 | 0.5% |
| Western Europe | 8 | 0.4% | View All 12 Rows |
Sex and Age in Nambe
Sex and Age in Nambe
The most populous age groups in Nambe are 65 to 69 Years (180 | 16.3%) for men and 50 to 54 Years (107 | 10.1%) for women.
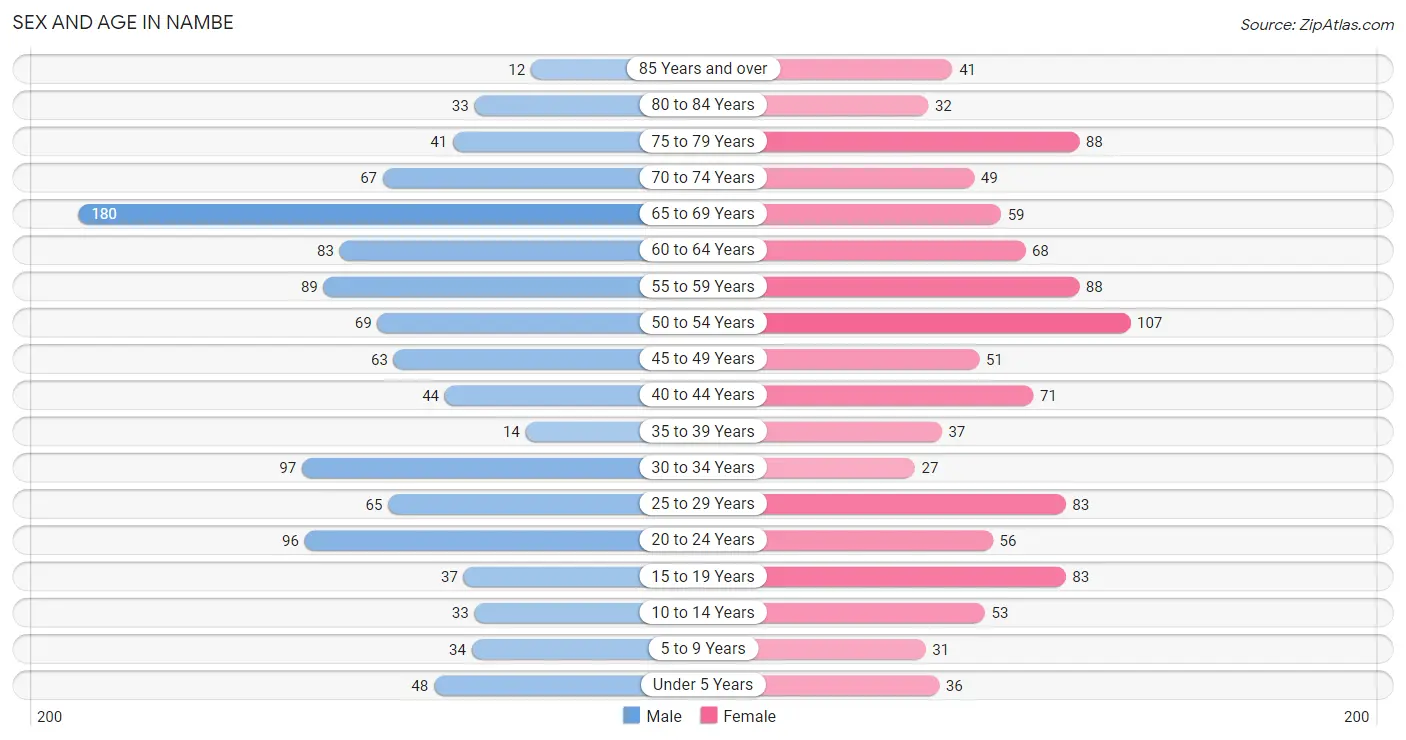
| Age Bracket | Male | Female |
| Under 5 Years | 48 (4.3%) | 36 (3.4%) |
| 5 to 9 Years | 34 (3.1%) | 31 (2.9%) |
| 10 to 14 Years | 33 (3.0%) | 53 (5.0%) |
| 15 to 19 Years | 37 (3.4%) | 83 (7.8%) |
| 20 to 24 Years | 96 (8.7%) | 56 (5.3%) |
| 25 to 29 Years | 65 (5.9%) | 83 (7.8%) |
| 30 to 34 Years | 97 (8.8%) | 27 (2.5%) |
| 35 to 39 Years | 14 (1.3%) | 37 (3.5%) |
| 40 to 44 Years | 44 (4.0%) | 71 (6.7%) |
| 45 to 49 Years | 63 (5.7%) | 51 (4.8%) |
| 50 to 54 Years | 69 (6.2%) | 107 (10.1%) |
| 55 to 59 Years | 89 (8.1%) | 88 (8.3%) |
| 60 to 64 Years | 83 (7.5%) | 68 (6.4%) |
| 65 to 69 Years | 180 (16.3%) | 59 (5.6%) |
| 70 to 74 Years | 67 (6.1%) | 49 (4.6%) |
| 75 to 79 Years | 41 (3.7%) | 88 (8.3%) |
| 80 to 84 Years | 33 (3.0%) | 32 (3.0%) |
| 85 Years and over | 12 (1.1%) | 41 (3.9%) |
| Total | 1,105 (100.0%) | 1,060 (100.0%) |
Families and Households in Nambe
Median Family Size in Nambe
The median family size in Nambe is 3.06 persons per family, with single female/mother families (127 | 24.2%) accounting for the largest median family size of 3.57 persons per family. On the other hand, single male/father families (62 | 11.8%) represent the smallest median family size with 2.73 persons per family.
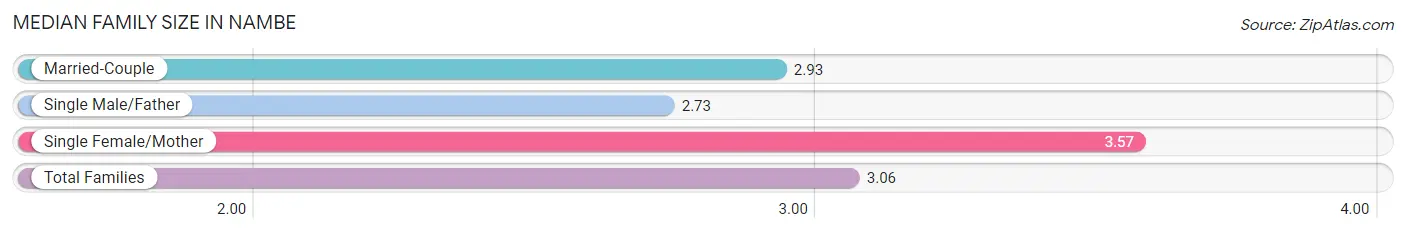
| Family Type | # Families | Family Size |
| Married-Couple | 336 (64.0%) | 2.93 |
| Single Male/Father | 62 (11.8%) | 2.73 |
| Single Female/Mother | 127 (24.2%) | 3.57 |
| Total Families | 525 (100.0%) | 3.06 |
Median Household Size in Nambe
The median household size in Nambe is 2.20 persons per household, with single female/mother households (127 | 12.9%) accounting for the largest median household size of 3.69 persons per household. non-family households (461 | 46.8%) represent the smallest median household size with 1.10 persons per household.
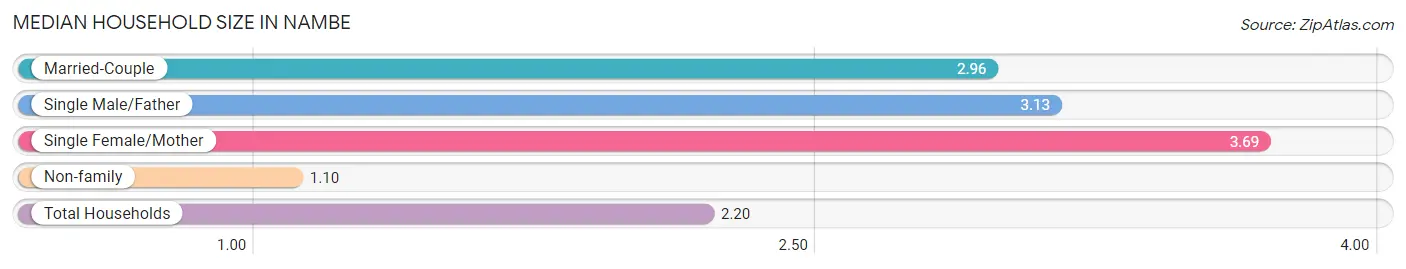
| Household Type | # Households | Household Size |
| Married-Couple | 336 (34.1%) | 2.96 |
| Single Male/Father | 62 (6.3%) | 3.13 |
| Single Female/Mother | 127 (12.9%) | 3.69 |
| Non-family | 461 (46.8%) | 1.10 |
| Total Households | 986 (100.0%) | 2.20 |
Household Size by Marriage Status in Nambe
Out of a total of 986 households in Nambe, 525 (53.2%) are family households, while 461 (46.8%) are nonfamily households. The most numerous type of family households are 2-person households, comprising 309, and the most common type of nonfamily households are 1-person households, comprising 411.
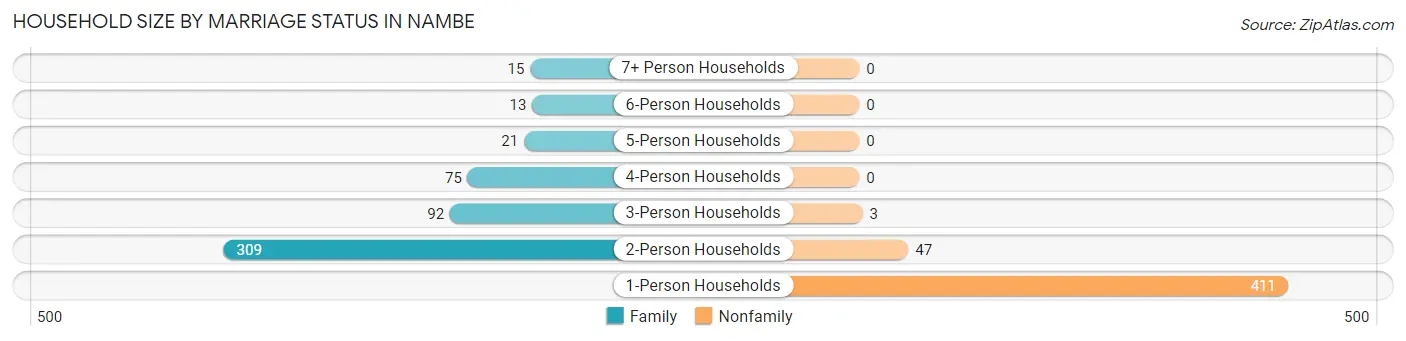
| Household Size | Family Households | Nonfamily Households |
| 1-Person Households | - | 411 (41.7%) |
| 2-Person Households | 309 (31.3%) | 47 (4.8%) |
| 3-Person Households | 92 (9.3%) | 3 (0.3%) |
| 4-Person Households | 75 (7.6%) | 0 (0.0%) |
| 5-Person Households | 21 (2.1%) | 0 (0.0%) |
| 6-Person Households | 13 (1.3%) | 0 (0.0%) |
| 7+ Person Households | 15 (1.5%) | 0 (0.0%) |
| Total | 525 (53.2%) | 461 (46.8%) |
Female Fertility in Nambe
Fertility by Age in Nambe
Average fertility rate in Nambe is 67.0 births per 1,000 women. Women in the age bracket of 20 to 34 years have the highest fertility rate with 90.0 births per 1,000 women. Women in the age bracket of 20 to 34 years acount for 51.7% of all women with births.
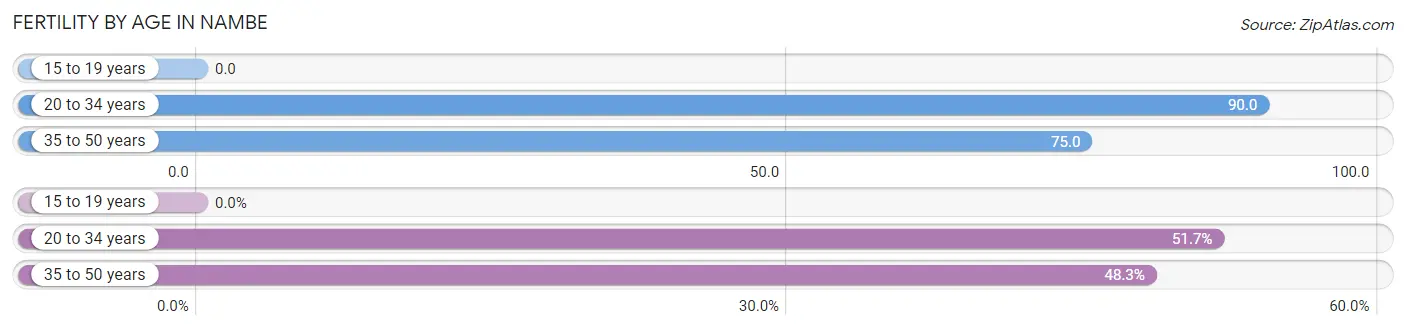
| Age Bracket | Women with Births | Births / 1,000 Women |
| 15 to 19 years | 0 (0.0%) | 0.0 |
| 20 to 34 years | 15 (51.7%) | 90.0 |
| 35 to 50 years | 14 (48.3%) | 75.0 |
| Total | 29 (100.0%) | 67.0 |
Fertility by Age by Marriage Status in Nambe
44.8% of women with births (29) in Nambe are married. The highest percentage of unmarried women with births falls into 20 to 34 years age bracket with 86.7% of them unmarried at the time of birth, while the lowest percentage of unmarried women with births belong to 35 to 50 years age bracket with 21.4% of them unmarried.
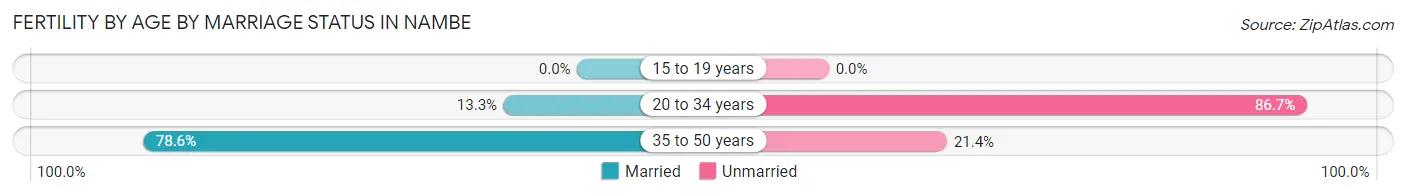
| Age Bracket | Married | Unmarried |
| 15 to 19 years | 0 (0.0%) | 0 (0.0%) |
| 20 to 34 years | 2 (13.3%) | 13 (86.7%) |
| 35 to 50 years | 11 (78.6%) | 3 (21.4%) |
| Total | 13 (44.8%) | 16 (55.2%) |
Fertility by Education in Nambe
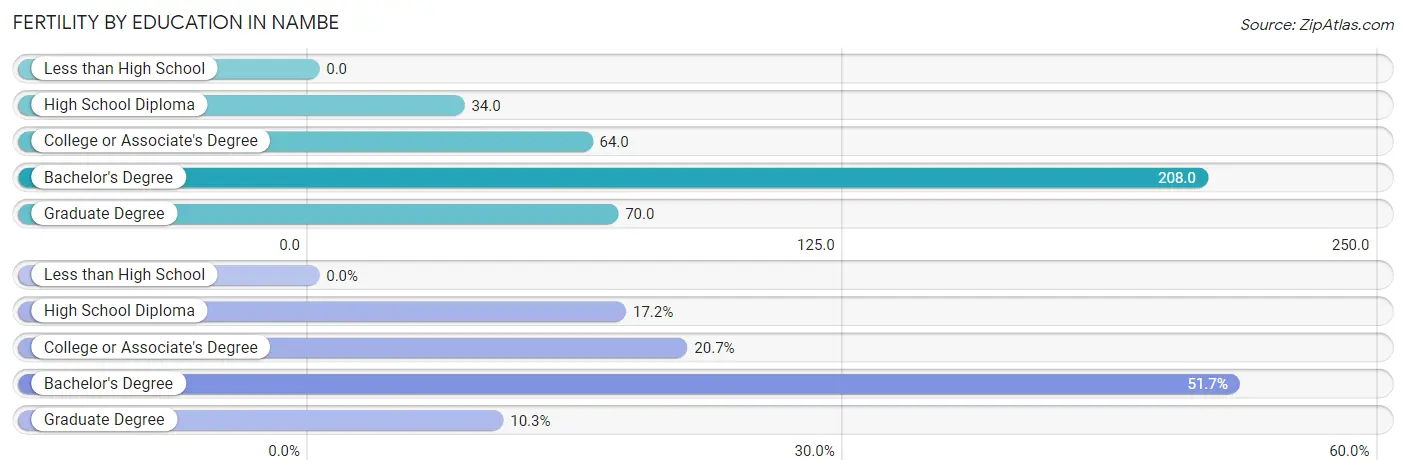
| Educational Attainment | Women with Births | Births / 1,000 Women |
| Less than High School | 0 (0.0%) | 0.0 |
| High School Diploma | 5 (17.2%) | 34.0 |
| College or Associate's Degree | 6 (20.7%) | 64.0 |
| Bachelor's Degree | 15 (51.7%) | 208.0 |
| Graduate Degree | 3 (10.3%) | 70.0 |
| Total | 29 (100.0%) | 67.0 |
Fertility by Education by Marriage Status in Nambe
55.2% of women with births in Nambe are unmarried. Women with the educational attainment of graduate degree are most likely to be married with 100.0% of them married at childbirth, while women with the educational attainment of high school diploma are least likely to be married with 100.0% of them unmarried at childbirth.
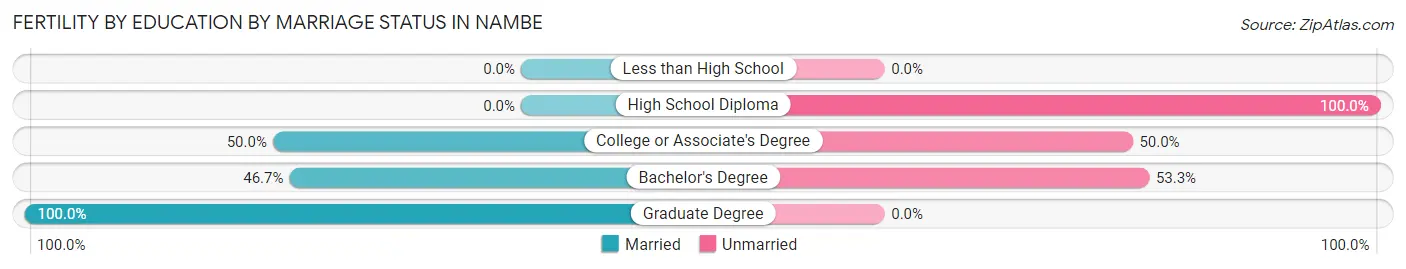
| Educational Attainment | Married | Unmarried |
| Less than High School | 0 (0.0%) | 0 (0.0%) |
| High School Diploma | 0 (0.0%) | 5 (100.0%) |
| College or Associate's Degree | 3 (50.0%) | 3 (50.0%) |
| Bachelor's Degree | 7 (46.7%) | 8 (53.3%) |
| Graduate Degree | 3 (100.0%) | 0 (0.0%) |
| Total | 13 (44.8%) | 16 (55.2%) |
Employment Characteristics in Nambe
Employment by Class of Employer in Nambe
Among the 802 employed individuals in Nambe, private company employees (295 | 36.8%), federal government employees (145 | 18.1%), and local government employees (111 | 13.8%) make up the most common classes of employment.
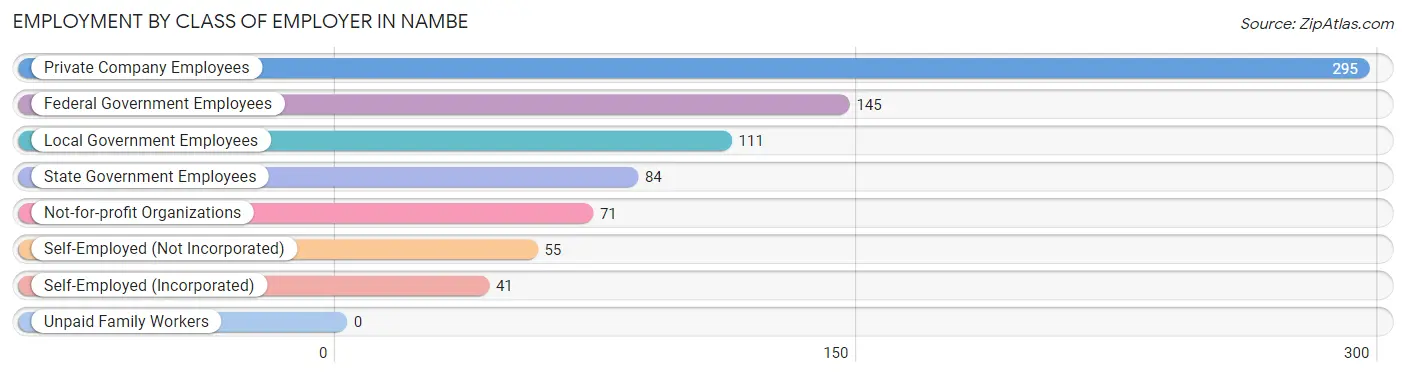
| Employer Class | # Employees | % Employees |
| Private Company Employees | 295 | 36.8% |
| Self-Employed (Incorporated) | 41 | 5.1% |
| Self-Employed (Not Incorporated) | 55 | 6.9% |
| Not-for-profit Organizations | 71 | 8.8% |
| Local Government Employees | 111 | 13.8% |
| State Government Employees | 84 | 10.5% |
| Federal Government Employees | 145 | 18.1% |
| Unpaid Family Workers | 0 | 0.0% |
| Total | 802 | 100.0% |
Employment Status by Age in Nambe
According to the labor force statistics for Nambe, out of the total population over 16 years of age (1,909), 47.1% or 899 individuals are in the labor force, with 10.7% or 96 of them unemployed. The age group with the highest labor force participation rate is 20 to 24 years, with 88.8% or 135 individuals in the labor force. Within the labor force, the 16 to 19 years age range has the highest percentage of unemployed individuals, with 100.0% or 3 of them being unemployed.
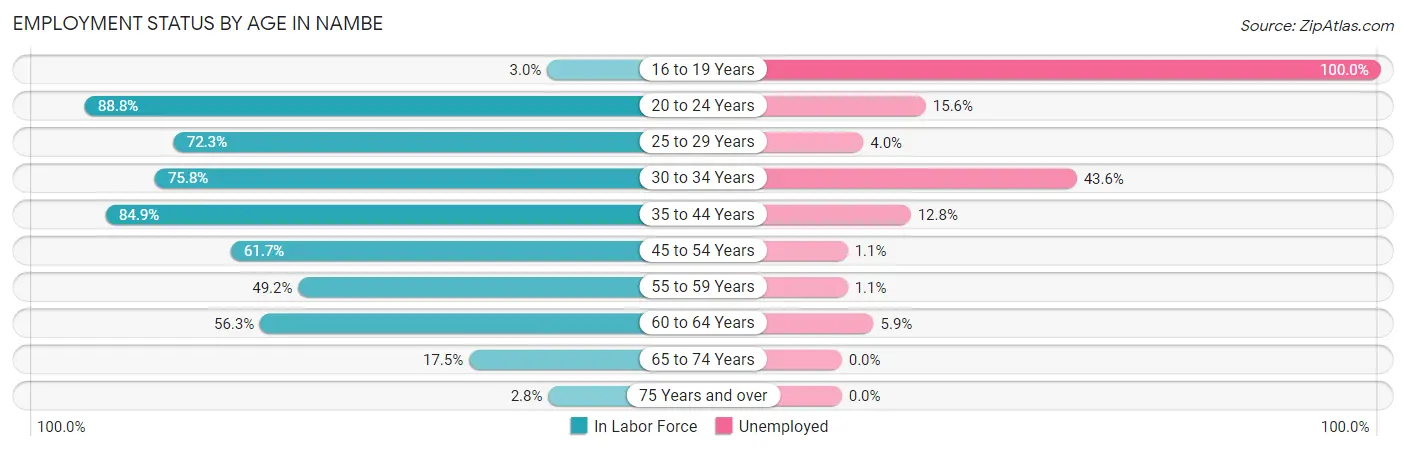
| Age Bracket | In Labor Force | Unemployed |
| 16 to 19 Years | 3 (3.0%) | 3 (100.0%) |
| 20 to 24 Years | 135 (88.8%) | 21 (15.6%) |
| 25 to 29 Years | 107 (72.3%) | 4 (4.0%) |
| 30 to 34 Years | 94 (75.8%) | 41 (43.6%) |
| 35 to 44 Years | 141 (84.9%) | 18 (12.8%) |
| 45 to 54 Years | 179 (61.7%) | 2 (1.1%) |
| 55 to 59 Years | 87 (49.2%) | 1 (1.1%) |
| 60 to 64 Years | 85 (56.3%) | 5 (5.9%) |
| 65 to 74 Years | 62 (17.5%) | 0 (0.0%) |
| 75 Years and over | 7 (2.8%) | 0 (0.0%) |
| Total | 899 (47.1%) | 96 (10.7%) |
Employment Status by Educational Attainment in Nambe
According to labor force statistics for Nambe, 65.6% of individuals (693) out of the total population between 25 and 64 years of age (1,056) are in the labor force, with 10.4% or 72 of them being unemployed. The group with the highest labor force participation rate are those with the educational attainment of bachelor's degree or higher, with 80.6% or 220 individuals in the labor force. Within the labor force, individuals with less than high school education have the highest percentage of unemployment, with 36.2% or 17 of them being unemployed.
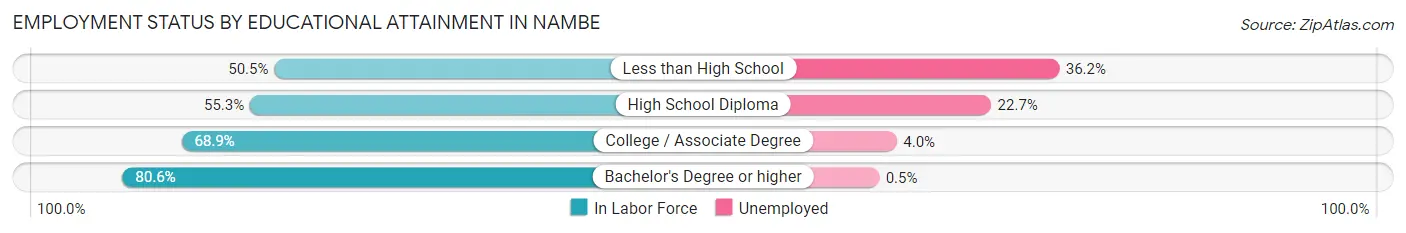
| Educational Attainment | In Labor Force | Unemployed |
| Less than High School | 47 (50.5%) | 34 (36.2%) |
| High School Diploma | 202 (55.3%) | 83 (22.7%) |
| College / Associate Degree | 224 (68.9%) | 13 (4.0%) |
| Bachelor's Degree or higher | 220 (80.6%) | 1 (0.5%) |
| Total | 693 (65.6%) | 110 (10.4%) |
Employment Occupations by Sex in Nambe
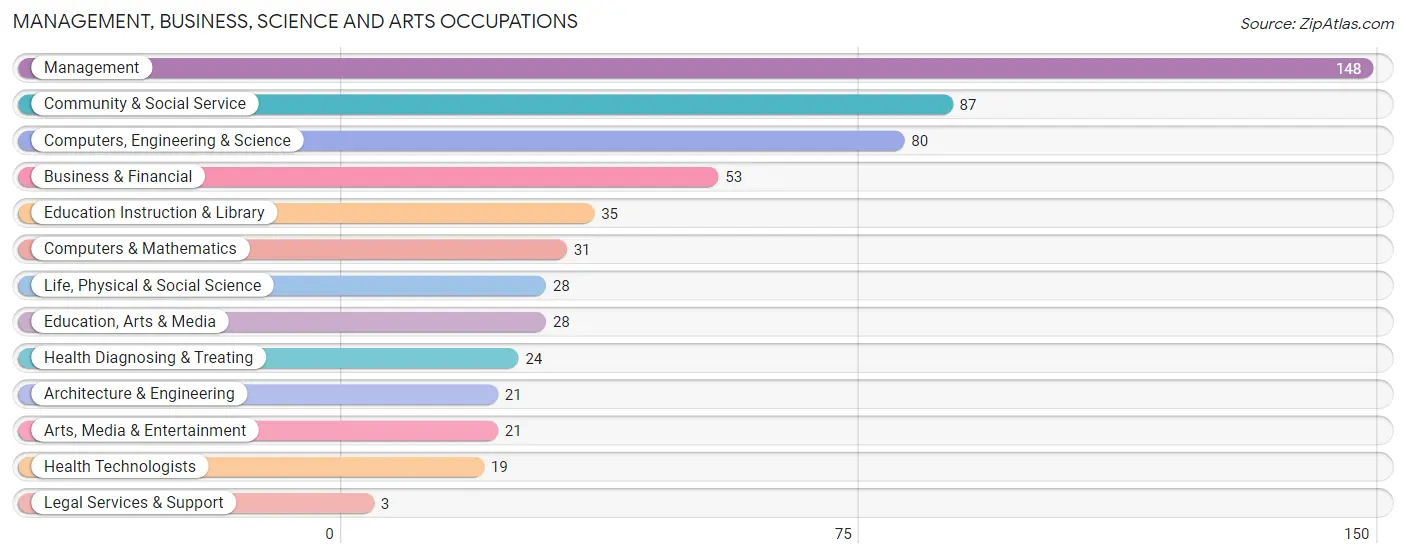
Management, Business, Science and Arts Occupations
The most common Management, Business, Science and Arts occupations in Nambe are Management (148 | 18.6%), Community & Social Service (87 | 10.9%), Computers, Engineering & Science (80 | 10.0%), Business & Financial (53 | 6.7%), and Education Instruction & Library (35 | 4.4%).
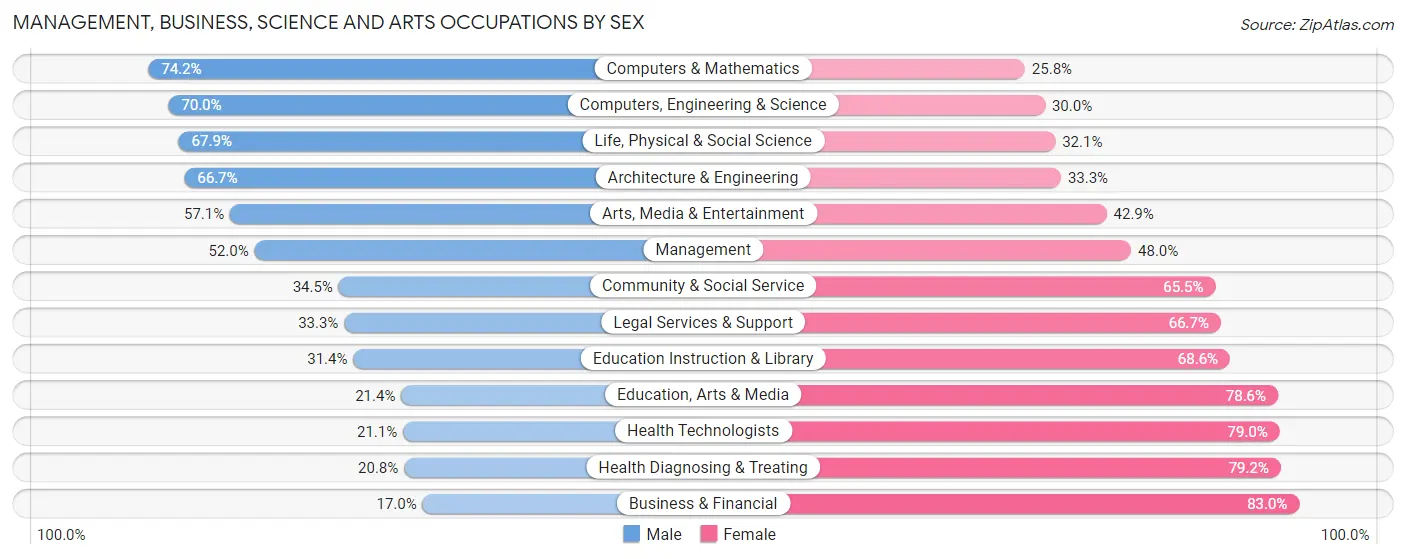
Management, Business, Science and Arts Occupations by Sex
Within the Management, Business, Science and Arts occupations in Nambe, the most male-oriented occupations are Computers & Mathematics (74.2%), Computers, Engineering & Science (70.0%), and Life, Physical & Social Science (67.9%), while the most female-oriented occupations are Business & Financial (83.0%), Health Diagnosing & Treating (79.2%), and Health Technologists (78.9%).
| Occupation | Male | Female |
| Management | 77 (52.0%) | 71 (48.0%) |
| Business & Financial | 9 (17.0%) | 44 (83.0%) |
| Computers, Engineering & Science | 56 (70.0%) | 24 (30.0%) |
| Computers & Mathematics | 23 (74.2%) | 8 (25.8%) |
| Architecture & Engineering | 14 (66.7%) | 7 (33.3%) |
| Life, Physical & Social Science | 19 (67.9%) | 9 (32.1%) |
| Community & Social Service | 30 (34.5%) | 57 (65.5%) |
| Education, Arts & Media | 6 (21.4%) | 22 (78.6%) |
| Legal Services & Support | 1 (33.3%) | 2 (66.7%) |
| Education Instruction & Library | 11 (31.4%) | 24 (68.6%) |
| Arts, Media & Entertainment | 12 (57.1%) | 9 (42.9%) |
| Health Diagnosing & Treating | 5 (20.8%) | 19 (79.2%) |
| Health Technologists | 4 (21.0%) | 15 (78.9%) |
| Total (Category) | 177 (45.2%) | 215 (54.8%) |
| Total (Overall) | 415 (52.1%) | 382 (47.9%) |
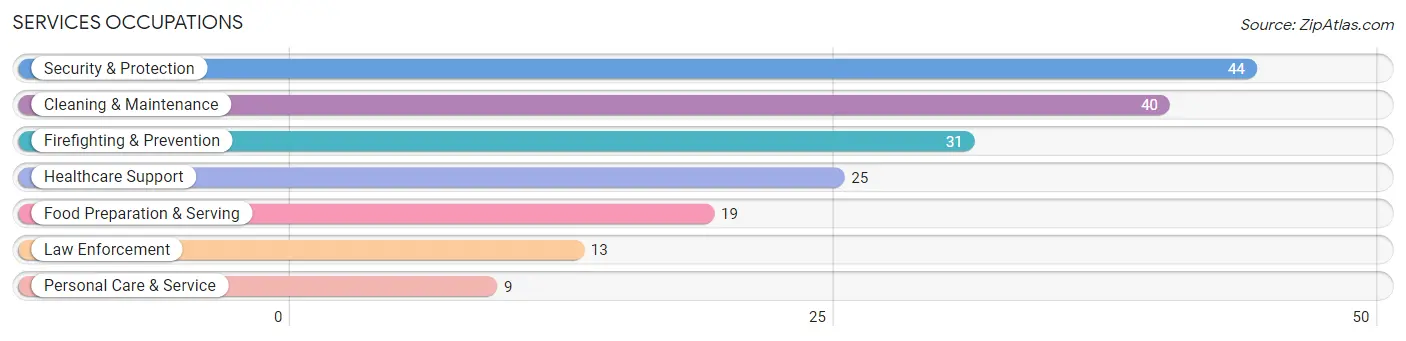
Services Occupations
The most common Services occupations in Nambe are Security & Protection (44 | 5.5%), Cleaning & Maintenance (40 | 5.0%), Firefighting & Prevention (31 | 3.9%), Healthcare Support (25 | 3.1%), and Food Preparation & Serving (19 | 2.4%).
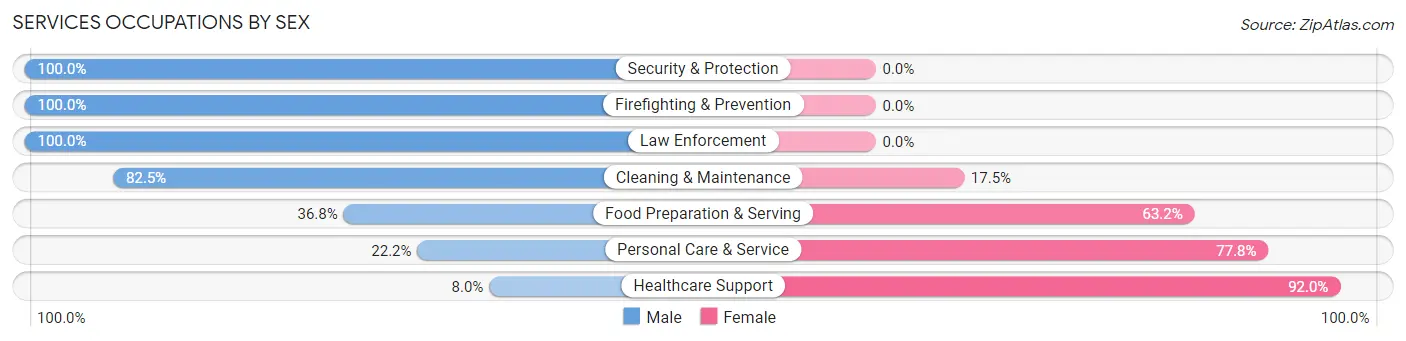
Services Occupations by Sex
Within the Services occupations in Nambe, the most male-oriented occupations are Security & Protection (100.0%), Firefighting & Prevention (100.0%), and Law Enforcement (100.0%), while the most female-oriented occupations are Healthcare Support (92.0%), Personal Care & Service (77.8%), and Food Preparation & Serving (63.2%).
| Occupation | Male | Female |
| Healthcare Support | 2 (8.0%) | 23 (92.0%) |
| Security & Protection | 44 (100.0%) | 0 (0.0%) |
| Firefighting & Prevention | 31 (100.0%) | 0 (0.0%) |
| Law Enforcement | 13 (100.0%) | 0 (0.0%) |
| Food Preparation & Serving | 7 (36.8%) | 12 (63.2%) |
| Cleaning & Maintenance | 33 (82.5%) | 7 (17.5%) |
| Personal Care & Service | 2 (22.2%) | 7 (77.8%) |
| Total (Category) | 88 (64.2%) | 49 (35.8%) |
| Total (Overall) | 415 (52.1%) | 382 (47.9%) |
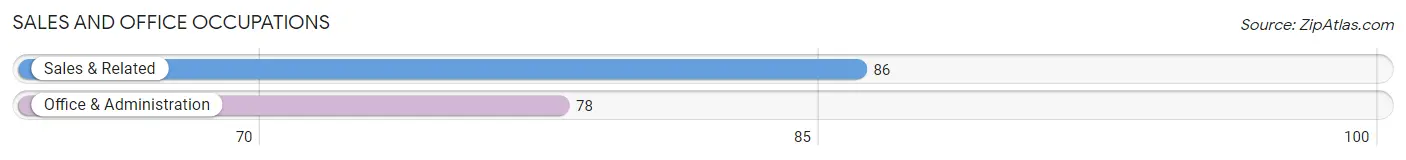
Sales and Office Occupations
The most common Sales and Office occupations in Nambe are Sales & Related (86 | 10.8%), and Office & Administration (78 | 9.8%).
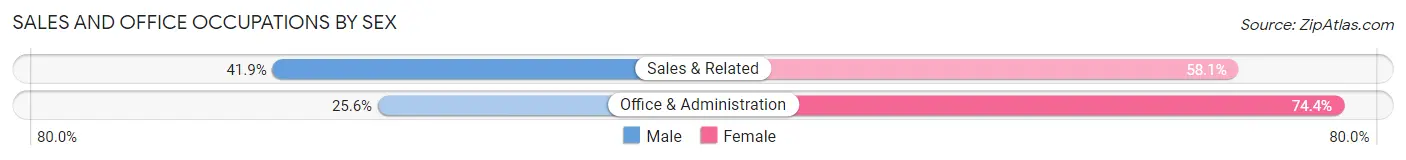
Sales and Office Occupations by Sex
| Occupation | Male | Female |
| Sales & Related | 36 (41.9%) | 50 (58.1%) |
| Office & Administration | 20 (25.6%) | 58 (74.4%) |
| Total (Category) | 56 (34.2%) | 108 (65.8%) |
| Total (Overall) | 415 (52.1%) | 382 (47.9%) |
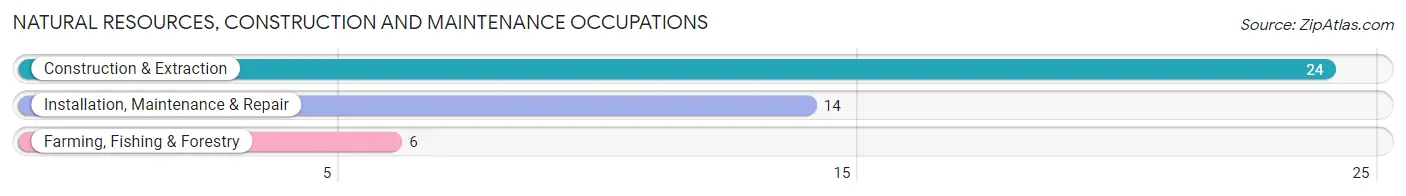
Natural Resources, Construction and Maintenance Occupations
The most common Natural Resources, Construction and Maintenance occupations in Nambe are Construction & Extraction (24 | 3.0%), Installation, Maintenance & Repair (14 | 1.8%), and Farming, Fishing & Forestry (6 | 0.7%).
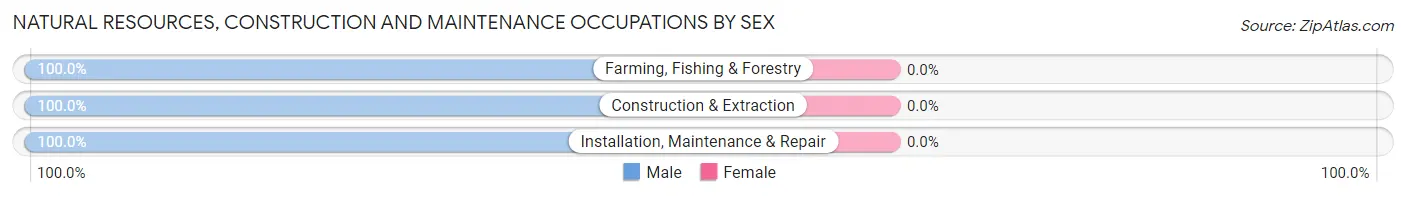
Natural Resources, Construction and Maintenance Occupations by Sex
| Occupation | Male | Female |
| Farming, Fishing & Forestry | 6 (100.0%) | 0 (0.0%) |
| Construction & Extraction | 24 (100.0%) | 0 (0.0%) |
| Installation, Maintenance & Repair | 14 (100.0%) | 0 (0.0%) |
| Total (Category) | 44 (100.0%) | 0 (0.0%) |
| Total (Overall) | 415 (52.1%) | 382 (47.9%) |
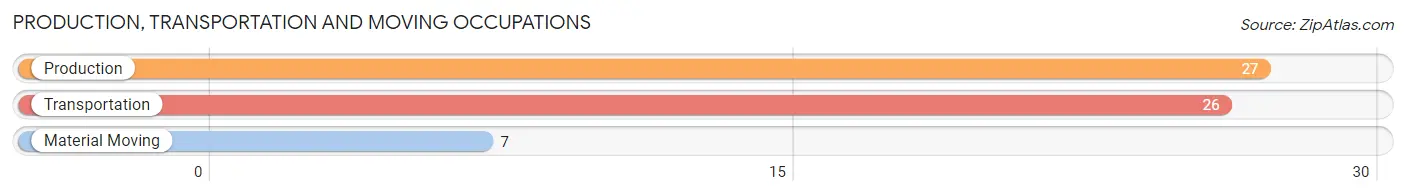
Production, Transportation and Moving Occupations
The most common Production, Transportation and Moving occupations in Nambe are Production (27 | 3.4%), Transportation (26 | 3.3%), and Material Moving (7 | 0.9%).
Production, Transportation and Moving Occupations by Sex
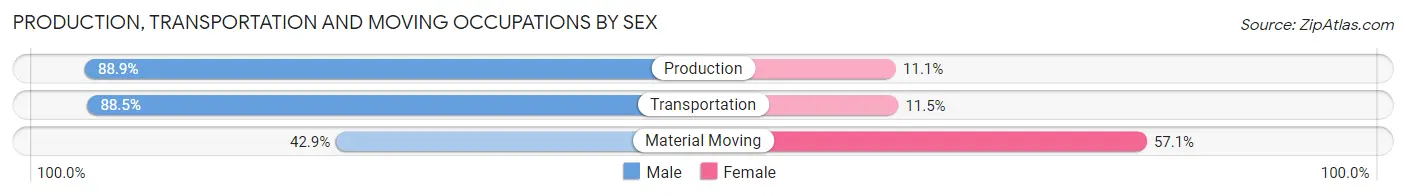
| Occupation | Male | Female |
| Production | 24 (88.9%) | 3 (11.1%) |
| Transportation | 23 (88.5%) | 3 (11.5%) |
| Material Moving | 3 (42.9%) | 4 (57.1%) |
| Total (Category) | 50 (83.3%) | 10 (16.7%) |
| Total (Overall) | 415 (52.1%) | 382 (47.9%) |
Employment Industries by Sex in Nambe
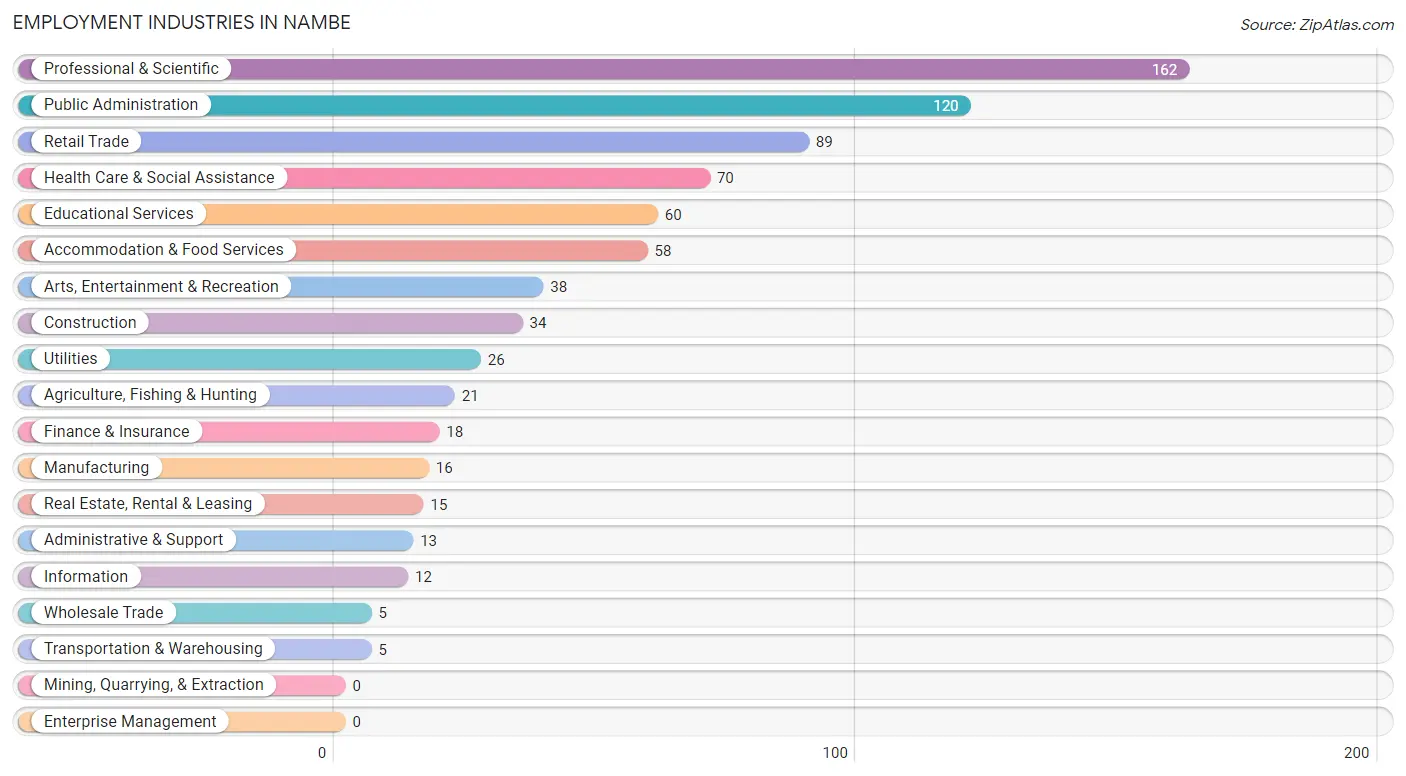
Employment Industries in Nambe
The major employment industries in Nambe include Professional & Scientific (162 | 20.3%), Public Administration (120 | 15.1%), Retail Trade (89 | 11.2%), Health Care & Social Assistance (70 | 8.8%), and Educational Services (60 | 7.5%).
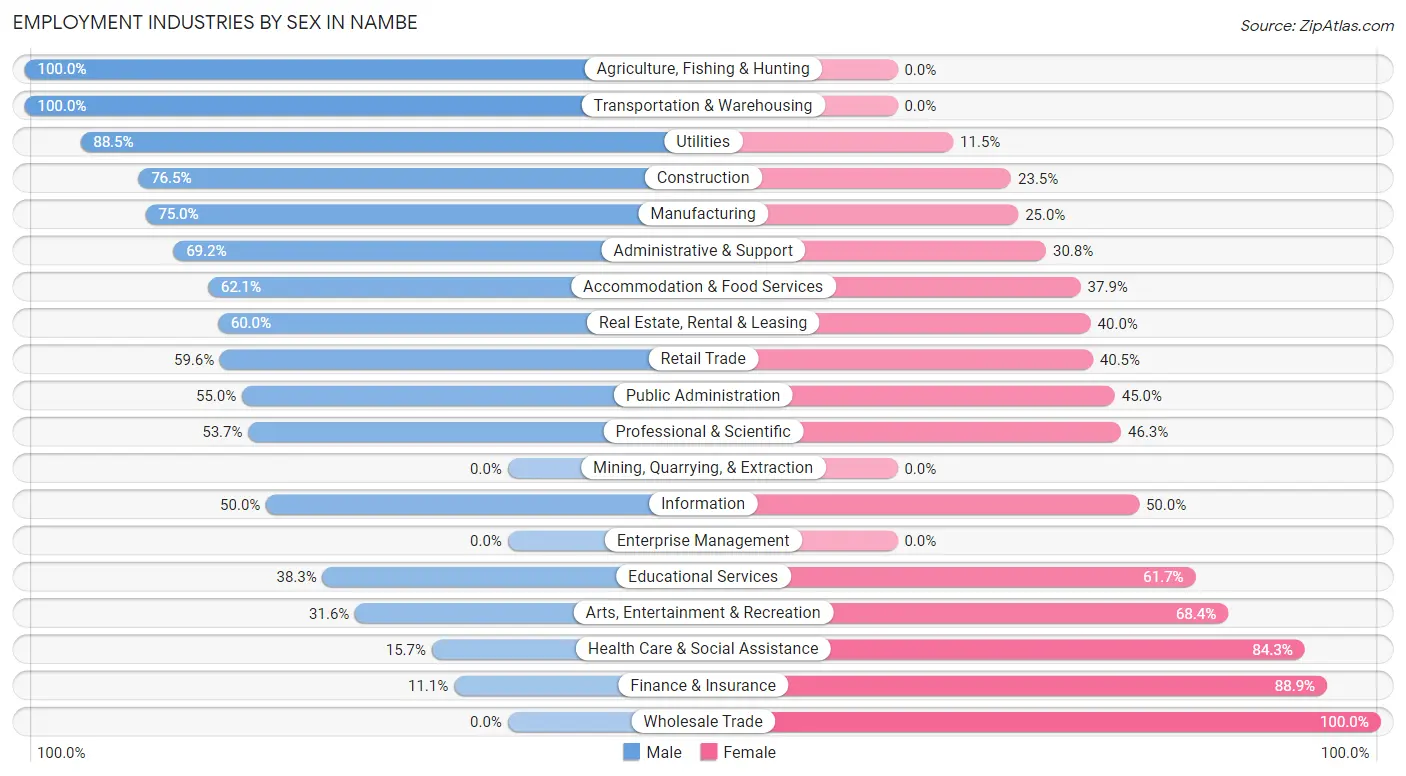
Employment Industries by Sex in Nambe
The Nambe industries that see more men than women are Agriculture, Fishing & Hunting (100.0%), Transportation & Warehousing (100.0%), and Utilities (88.5%), whereas the industries that tend to have a higher number of women are Wholesale Trade (100.0%), Finance & Insurance (88.9%), and Health Care & Social Assistance (84.3%).
| Industry | Male | Female |
| Agriculture, Fishing & Hunting | 21 (100.0%) | 0 (0.0%) |
| Mining, Quarrying, & Extraction | 0 (0.0%) | 0 (0.0%) |
| Construction | 26 (76.5%) | 8 (23.5%) |
| Manufacturing | 12 (75.0%) | 4 (25.0%) |
| Wholesale Trade | 0 (0.0%) | 5 (100.0%) |
| Retail Trade | 53 (59.6%) | 36 (40.5%) |
| Transportation & Warehousing | 5 (100.0%) | 0 (0.0%) |
| Utilities | 23 (88.5%) | 3 (11.5%) |
| Information | 6 (50.0%) | 6 (50.0%) |
| Finance & Insurance | 2 (11.1%) | 16 (88.9%) |
| Real Estate, Rental & Leasing | 9 (60.0%) | 6 (40.0%) |
| Professional & Scientific | 87 (53.7%) | 75 (46.3%) |
| Enterprise Management | 0 (0.0%) | 0 (0.0%) |
| Administrative & Support | 9 (69.2%) | 4 (30.8%) |
| Educational Services | 23 (38.3%) | 37 (61.7%) |
| Health Care & Social Assistance | 11 (15.7%) | 59 (84.3%) |
| Arts, Entertainment & Recreation | 12 (31.6%) | 26 (68.4%) |
| Accommodation & Food Services | 36 (62.1%) | 22 (37.9%) |
| Public Administration | 66 (55.0%) | 54 (45.0%) |
| Total | 415 (52.1%) | 382 (47.9%) |
Education in Nambe
School Enrollment in Nambe
The most common levels of schooling among the 323 students in Nambe are high school (105 | 32.5%), middle school (73 | 22.6%), and college / undergraduate (62 | 19.2%).
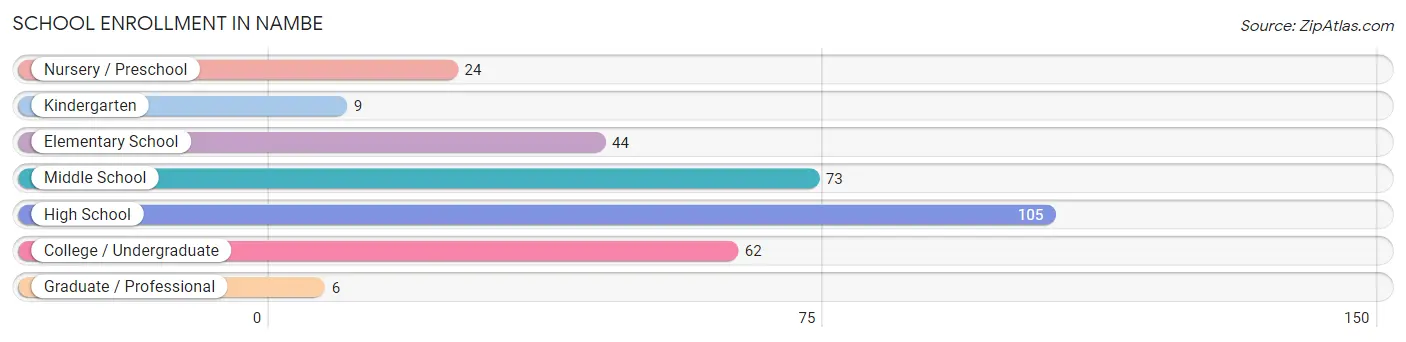
| School Level | # Students | % Students |
| Nursery / Preschool | 24 | 7.4% |
| Kindergarten | 9 | 2.8% |
| Elementary School | 44 | 13.6% |
| Middle School | 73 | 22.6% |
| High School | 105 | 32.5% |
| College / Undergraduate | 62 | 19.2% |
| Graduate / Professional | 6 | 1.9% |
| Total | 323 | 100.0% |
School Enrollment by Age by Funding Source in Nambe
Out of a total of 323 students who are enrolled in schools in Nambe, 35 (10.8%) attend a private institution, while the remaining 288 (89.2%) are enrolled in public schools. The age group of 3 to 4 year olds has the highest likelihood of being enrolled in private schools, with 11 (52.4% in the age bracket) enrolled. Conversely, the age group of 5 to 9 year old has the lowest likelihood of being enrolled in a private school, with 58 (100.0% in the age bracket) attending a public institution.
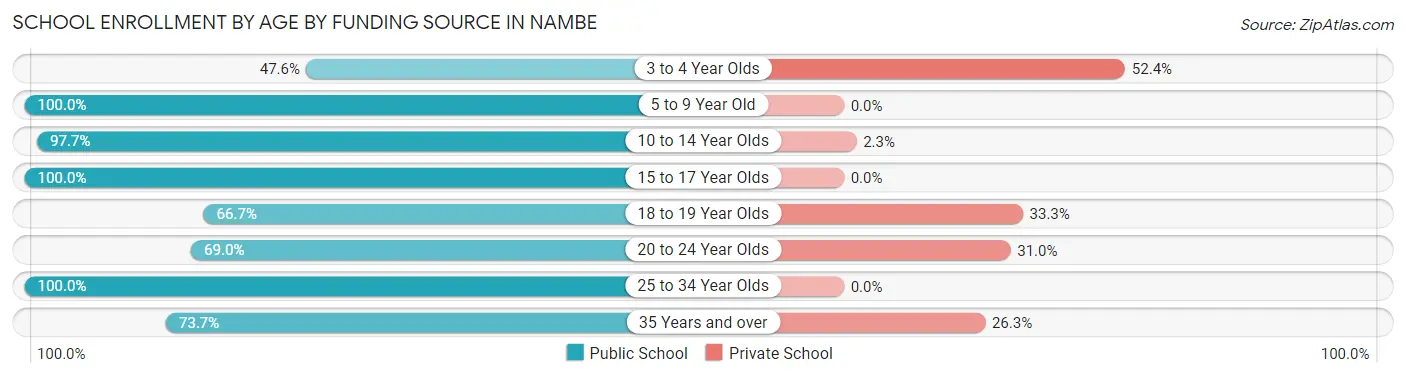
| Age Bracket | Public School | Private School |
| 3 to 4 Year Olds | 10 (47.6%) | 11 (52.4%) |
| 5 to 9 Year Old | 58 (100.0%) | 0 (0.0%) |
| 10 to 14 Year Olds | 84 (97.7%) | 2 (2.3%) |
| 15 to 17 Year Olds | 73 (100.0%) | 0 (0.0%) |
| 18 to 19 Year Olds | 16 (66.7%) | 8 (33.3%) |
| 20 to 24 Year Olds | 20 (69.0%) | 9 (31.0%) |
| 25 to 34 Year Olds | 13 (100.0%) | 0 (0.0%) |
| 35 Years and over | 14 (73.7%) | 5 (26.3%) |
| Total | 288 (89.2%) | 35 (10.8%) |
Educational Attainment by Field of Study in Nambe
Business (73 | 17.6%), physical & health sciences (48 | 11.6%), engineering (46 | 11.1%), bio, nature & agricultural (30 | 7.2%), and literature & languages (30 | 7.2%) are the most common fields of study among 415 individuals in Nambe who have obtained a bachelor's degree or higher.
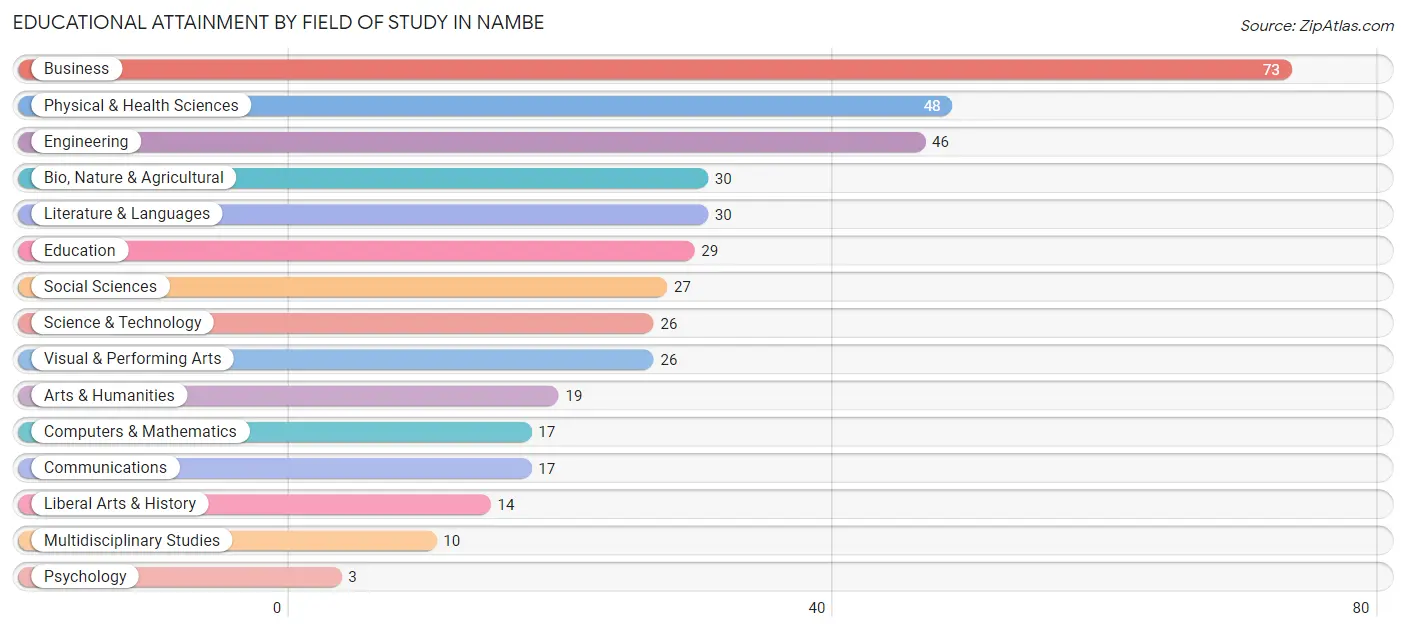
| Field of Study | # Graduates | % Graduates |
| Computers & Mathematics | 17 | 4.1% |
| Bio, Nature & Agricultural | 30 | 7.2% |
| Physical & Health Sciences | 48 | 11.6% |
| Psychology | 3 | 0.7% |
| Social Sciences | 27 | 6.5% |
| Engineering | 46 | 11.1% |
| Multidisciplinary Studies | 10 | 2.4% |
| Science & Technology | 26 | 6.3% |
| Business | 73 | 17.6% |
| Education | 29 | 7.0% |
| Literature & Languages | 30 | 7.2% |
| Liberal Arts & History | 14 | 3.4% |
| Visual & Performing Arts | 26 | 6.3% |
| Communications | 17 | 4.1% |
| Arts & Humanities | 19 | 4.6% |
| Total | 415 | 100.0% |
Transportation & Commute in Nambe
Vehicle Availability by Sex in Nambe
The most prevalent vehicle ownership categories in Nambe are males with 3 vehicles (126, accounting for 29.8%) and females with 3 vehicles (120, making up 33.3%).
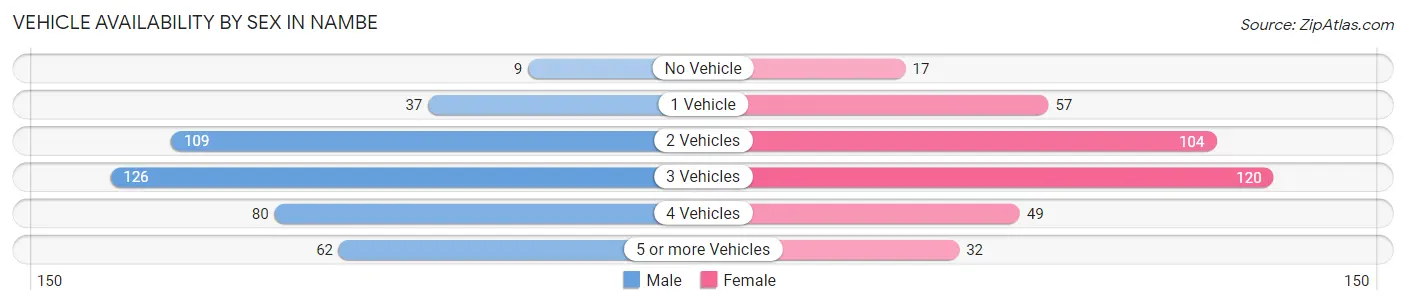
| Vehicles Available | Male | Female |
| No Vehicle | 9 (2.1%) | 17 (4.5%) |
| 1 Vehicle | 37 (8.7%) | 57 (15.0%) |
| 2 Vehicles | 109 (25.8%) | 104 (27.4%) |
| 3 Vehicles | 126 (29.8%) | 120 (31.7%) |
| 4 Vehicles | 80 (18.9%) | 49 (12.9%) |
| 5 or more Vehicles | 62 (14.7%) | 32 (8.4%) |
| Total | 423 (100.0%) | 379 (100.0%) |
Commute Time in Nambe
The most frequently occuring commute durations in Nambe are 30 to 34 minutes (169 commuters, 24.0%), 45 to 59 minutes (99 commuters, 14.1%), and 25 to 29 minutes (91 commuters, 12.9%).
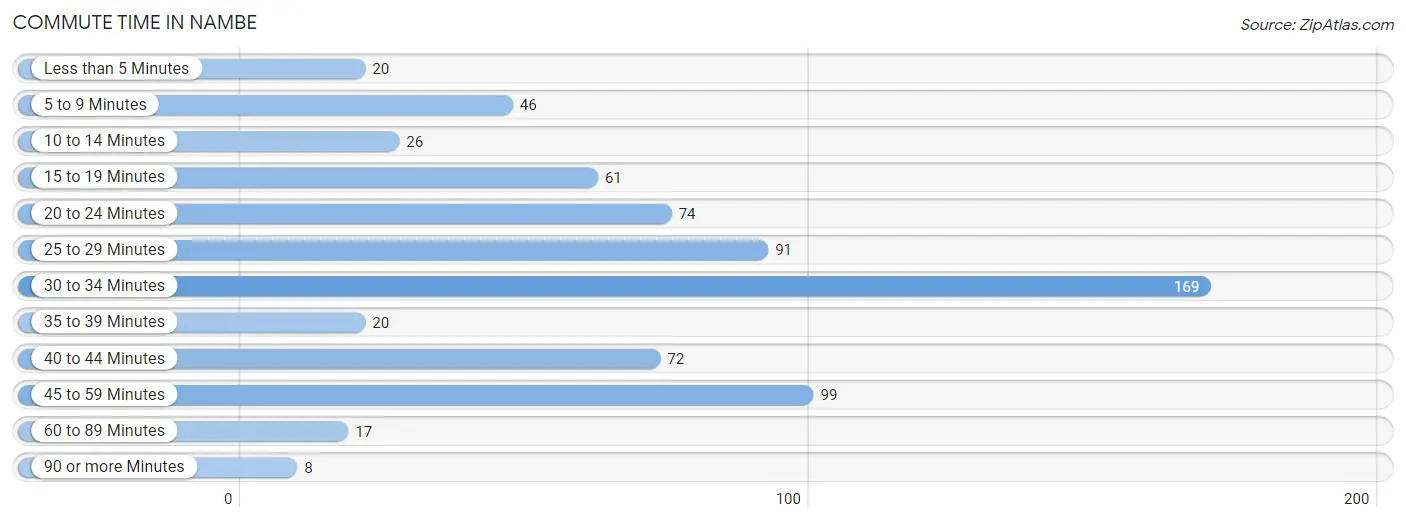
| Commute Time | # Commuters | % Commuters |
| Less than 5 Minutes | 20 | 2.8% |
| 5 to 9 Minutes | 46 | 6.5% |
| 10 to 14 Minutes | 26 | 3.7% |
| 15 to 19 Minutes | 61 | 8.7% |
| 20 to 24 Minutes | 74 | 10.5% |
| 25 to 29 Minutes | 91 | 12.9% |
| 30 to 34 Minutes | 169 | 24.0% |
| 35 to 39 Minutes | 20 | 2.8% |
| 40 to 44 Minutes | 72 | 10.2% |
| 45 to 59 Minutes | 99 | 14.1% |
| 60 to 89 Minutes | 17 | 2.4% |
| 90 or more Minutes | 8 | 1.1% |
Commute Time by Sex in Nambe
The most common commute times in Nambe are 30 to 34 minutes (92 commuters, 24.7%) for males and 30 to 34 minutes (77 commuters, 23.3%) for females.
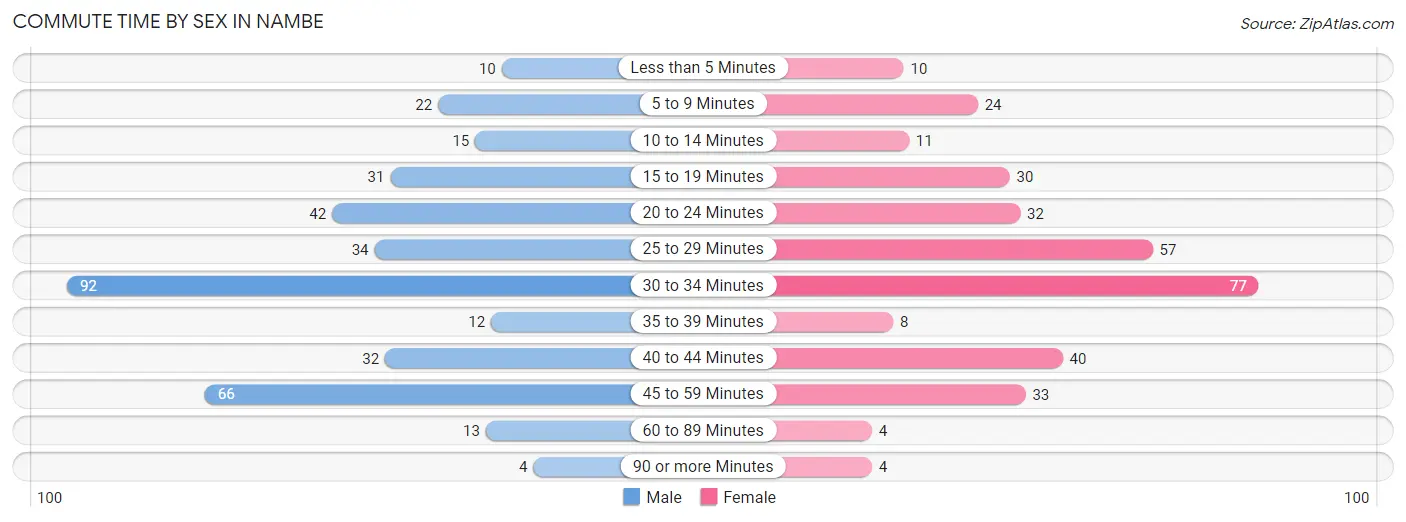
| Commute Time | Male | Female |
| Less than 5 Minutes | 10 (2.7%) | 10 (3.0%) |
| 5 to 9 Minutes | 22 (5.9%) | 24 (7.3%) |
| 10 to 14 Minutes | 15 (4.0%) | 11 (3.3%) |
| 15 to 19 Minutes | 31 (8.3%) | 30 (9.1%) |
| 20 to 24 Minutes | 42 (11.3%) | 32 (9.7%) |
| 25 to 29 Minutes | 34 (9.1%) | 57 (17.3%) |
| 30 to 34 Minutes | 92 (24.7%) | 77 (23.3%) |
| 35 to 39 Minutes | 12 (3.2%) | 8 (2.4%) |
| 40 to 44 Minutes | 32 (8.6%) | 40 (12.1%) |
| 45 to 59 Minutes | 66 (17.7%) | 33 (10.0%) |
| 60 to 89 Minutes | 13 (3.5%) | 4 (1.2%) |
| 90 or more Minutes | 4 (1.1%) | 4 (1.2%) |
Time of Departure to Work by Sex in Nambe
The most frequent times of departure to work in Nambe are 6:00 AM to 6:29 AM (75, 20.1%) for males and 7:00 AM to 7:29 AM (69, 20.9%) for females.
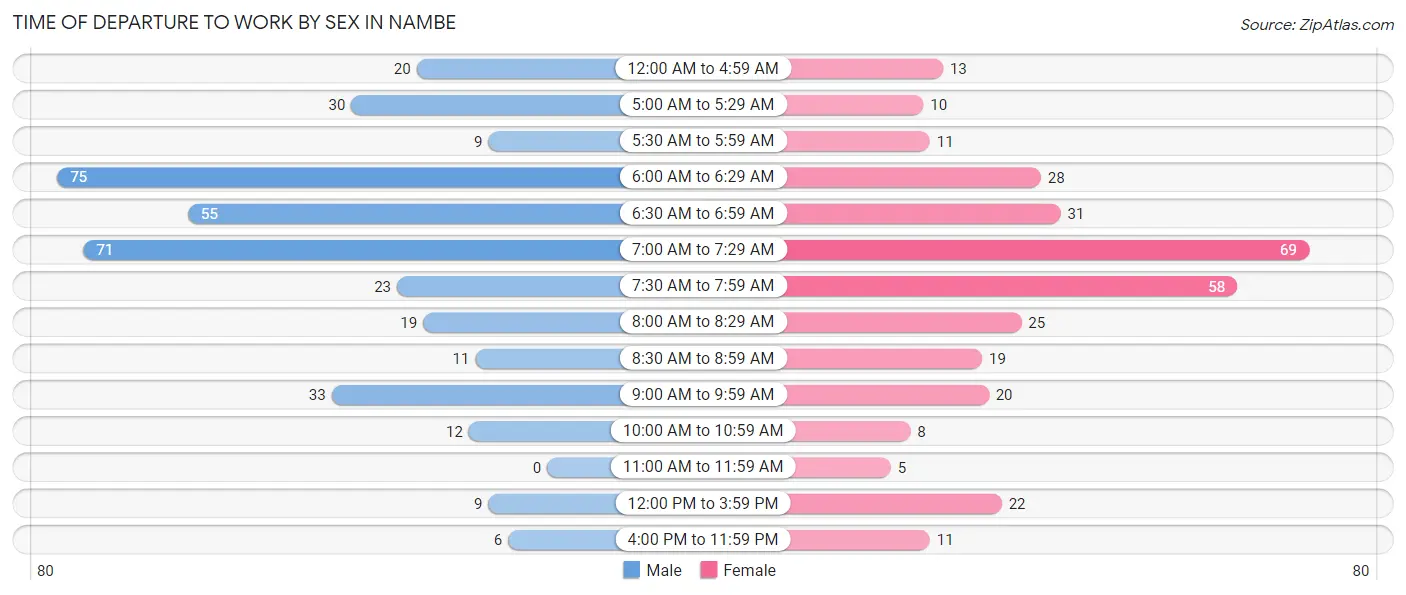
| Time of Departure | Male | Female |
| 12:00 AM to 4:59 AM | 20 (5.4%) | 13 (3.9%) |
| 5:00 AM to 5:29 AM | 30 (8.0%) | 10 (3.0%) |
| 5:30 AM to 5:59 AM | 9 (2.4%) | 11 (3.3%) |
| 6:00 AM to 6:29 AM | 75 (20.1%) | 28 (8.5%) |
| 6:30 AM to 6:59 AM | 55 (14.7%) | 31 (9.4%) |
| 7:00 AM to 7:29 AM | 71 (19.0%) | 69 (20.9%) |
| 7:30 AM to 7:59 AM | 23 (6.2%) | 58 (17.6%) |
| 8:00 AM to 8:29 AM | 19 (5.1%) | 25 (7.6%) |
| 8:30 AM to 8:59 AM | 11 (2.9%) | 19 (5.8%) |
| 9:00 AM to 9:59 AM | 33 (8.8%) | 20 (6.1%) |
| 10:00 AM to 10:59 AM | 12 (3.2%) | 8 (2.4%) |
| 11:00 AM to 11:59 AM | 0 (0.0%) | 5 (1.5%) |
| 12:00 PM to 3:59 PM | 9 (2.4%) | 22 (6.7%) |
| 4:00 PM to 11:59 PM | 6 (1.6%) | 11 (3.3%) |
| Total | 373 (100.0%) | 330 (100.0%) |
Housing Occupancy in Nambe
Occupancy by Ownership in Nambe
Of the total 986 dwellings in Nambe, owner-occupied units account for 835 (84.7%), while renter-occupied units make up 151 (15.3%).
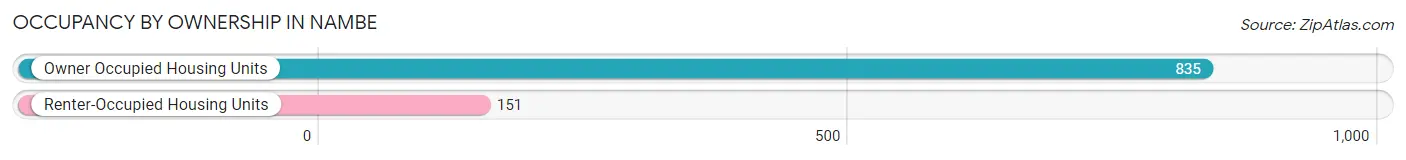
| Occupancy | # Housing Units | % Housing Units |
| Owner Occupied Housing Units | 835 | 84.7% |
| Renter-Occupied Housing Units | 151 | 15.3% |
| Total Occupied Housing Units | 986 | 100.0% |
Occupancy by Household Size in Nambe
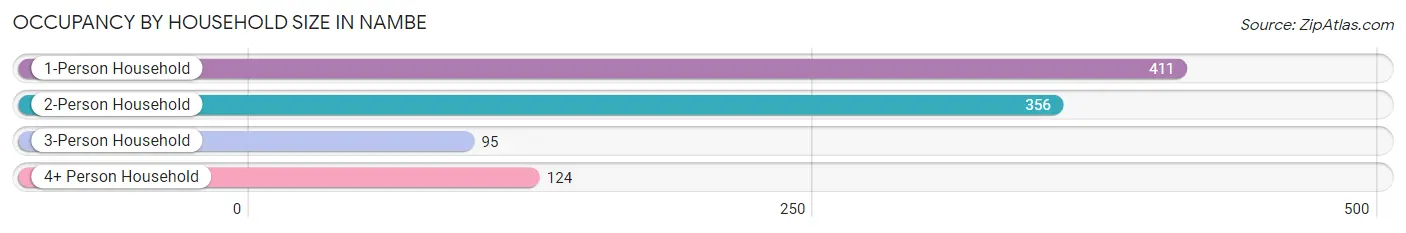
| Household Size | # Housing Units | % Housing Units |
| 1-Person Household | 411 | 41.7% |
| 2-Person Household | 356 | 36.1% |
| 3-Person Household | 95 | 9.6% |
| 4+ Person Household | 124 | 12.6% |
| Total Housing Units | 986 | 100.0% |
Occupancy by Ownership by Household Size in Nambe
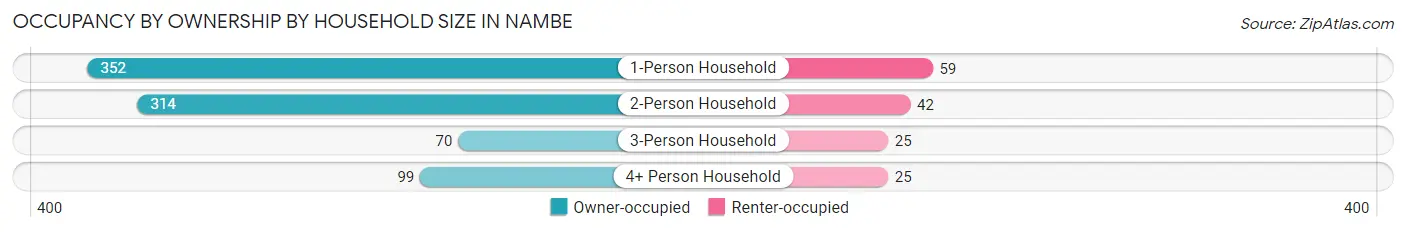
| Household Size | Owner-occupied | Renter-occupied |
| 1-Person Household | 352 (85.6%) | 59 (14.4%) |
| 2-Person Household | 314 (88.2%) | 42 (11.8%) |
| 3-Person Household | 70 (73.7%) | 25 (26.3%) |
| 4+ Person Household | 99 (79.8%) | 25 (20.2%) |
| Total Housing Units | 835 (84.7%) | 151 (15.3%) |
Occupancy by Educational Attainment in Nambe
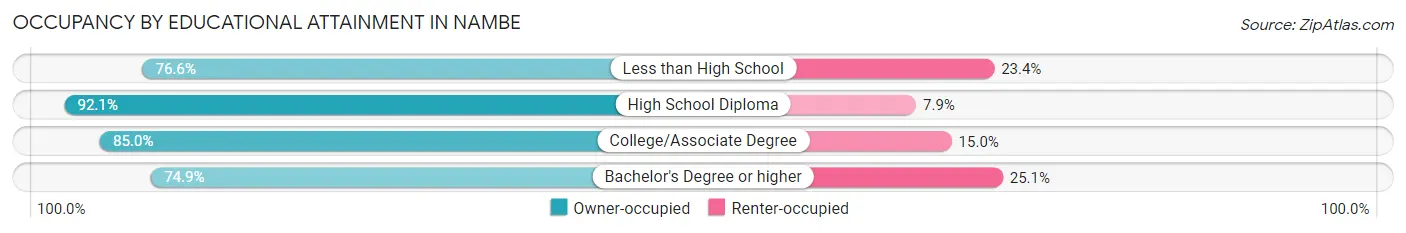
| Household Size | Owner-occupied | Renter-occupied |
| Less than High School | 72 (76.6%) | 22 (23.4%) |
| High School Diploma | 349 (92.1%) | 30 (7.9%) |
| College/Associate Degree | 250 (85.0%) | 44 (15.0%) |
| Bachelor's Degree or higher | 164 (74.9%) | 55 (25.1%) |
Occupancy by Age of Householder in Nambe
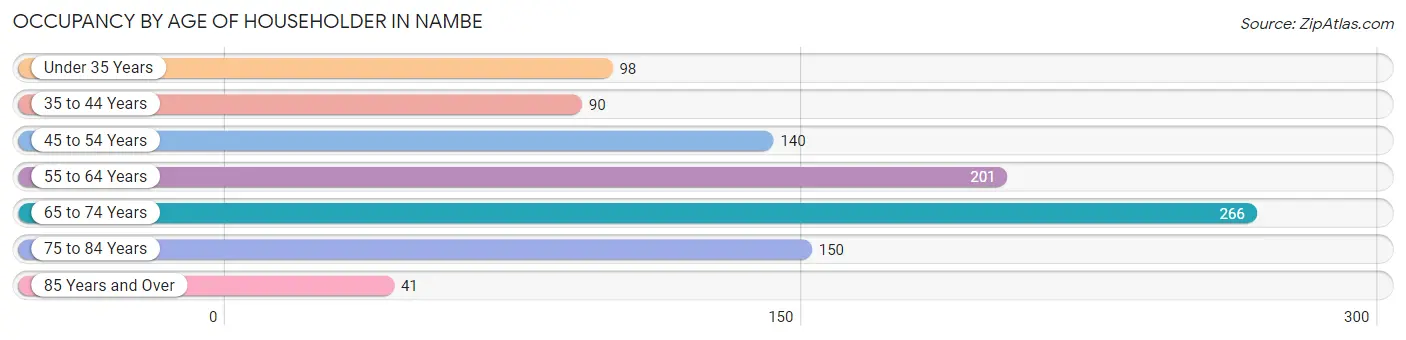
| Age Bracket | # Households | % Households |
| Under 35 Years | 98 | 9.9% |
| 35 to 44 Years | 90 | 9.1% |
| 45 to 54 Years | 140 | 14.2% |
| 55 to 64 Years | 201 | 20.4% |
| 65 to 74 Years | 266 | 27.0% |
| 75 to 84 Years | 150 | 15.2% |
| 85 Years and Over | 41 | 4.2% |
| Total | 986 | 100.0% |
Housing Finances in Nambe
Median Income by Occupancy in Nambe
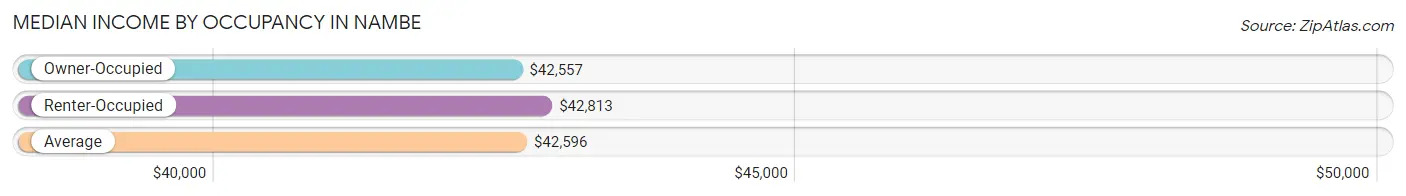
| Occupancy Type | # Households | Median Income |
| Owner-Occupied | 835 (84.7%) | $42,557 |
| Renter-Occupied | 151 (15.3%) | $42,813 |
| Average | 986 (100.0%) | $42,596 |
Occupancy by Householder Income Bracket in Nambe
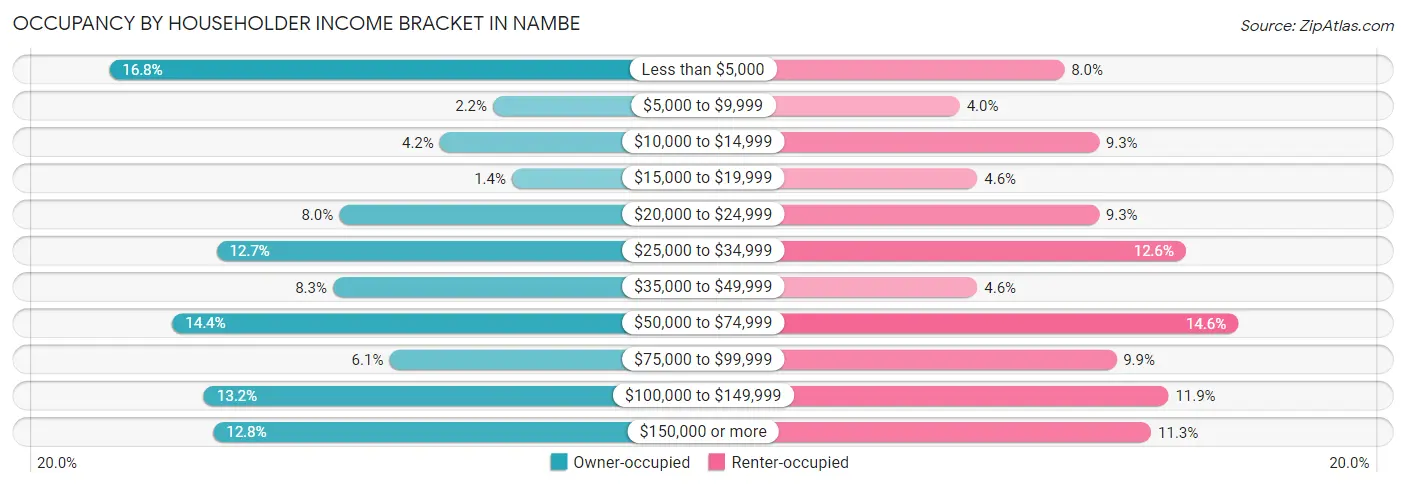
| Income Bracket | Owner-occupied | Renter-occupied |
| Less than $5,000 | 140 (16.8%) | 12 (8.0%) |
| $5,000 to $9,999 | 18 (2.2%) | 6 (4.0%) |
| $10,000 to $14,999 | 35 (4.2%) | 14 (9.3%) |
| $15,000 to $19,999 | 12 (1.4%) | 7 (4.6%) |
| $20,000 to $24,999 | 67 (8.0%) | 14 (9.3%) |
| $25,000 to $34,999 | 106 (12.7%) | 19 (12.6%) |
| $35,000 to $49,999 | 69 (8.3%) | 7 (4.6%) |
| $50,000 to $74,999 | 120 (14.4%) | 22 (14.6%) |
| $75,000 to $99,999 | 51 (6.1%) | 15 (9.9%) |
| $100,000 to $149,999 | 110 (13.2%) | 18 (11.9%) |
| $150,000 or more | 107 (12.8%) | 17 (11.3%) |
| Total | 835 (100.0%) | 151 (100.0%) |
Monthly Housing Cost Tiers in Nambe
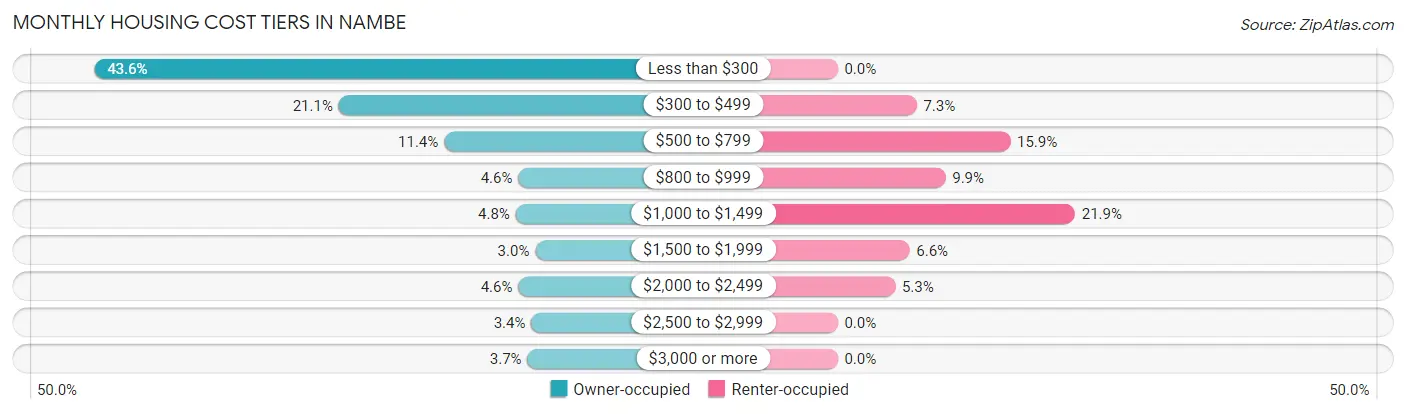
| Monthly Cost | Owner-occupied | Renter-occupied |
| Less than $300 | 364 (43.6%) | 0 (0.0%) |
| $300 to $499 | 176 (21.1%) | 11 (7.3%) |
| $500 to $799 | 95 (11.4%) | 24 (15.9%) |
| $800 to $999 | 38 (4.5%) | 15 (9.9%) |
| $1,000 to $1,499 | 40 (4.8%) | 33 (21.8%) |
| $1,500 to $1,999 | 25 (3.0%) | 10 (6.6%) |
| $2,000 to $2,499 | 38 (4.5%) | 8 (5.3%) |
| $2,500 to $2,999 | 28 (3.4%) | 0 (0.0%) |
| $3,000 or more | 31 (3.7%) | 0 (0.0%) |
| Total | 835 (100.0%) | 151 (100.0%) |
Physical Housing Characteristics in Nambe
Housing Structures in Nambe
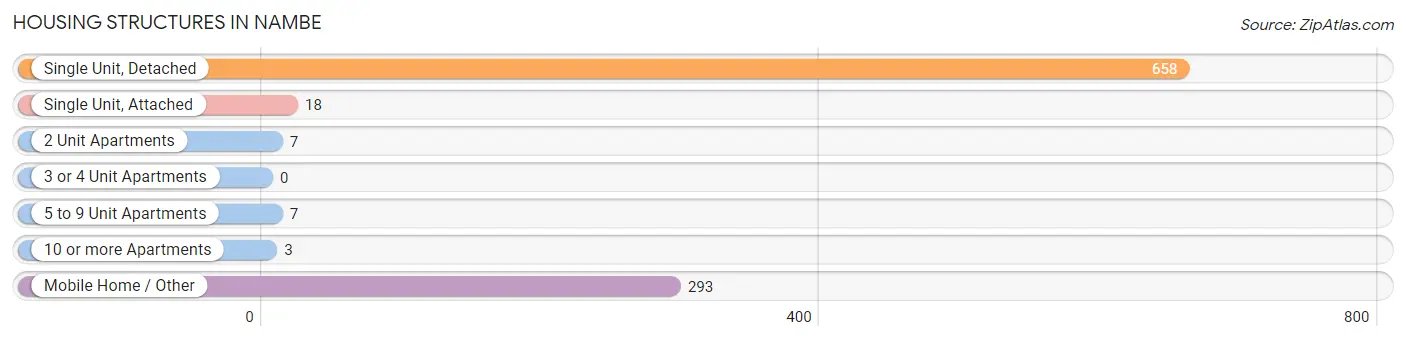
| Structure Type | # Housing Units | % Housing Units |
| Single Unit, Detached | 658 | 66.7% |
| Single Unit, Attached | 18 | 1.8% |
| 2 Unit Apartments | 7 | 0.7% |
| 3 or 4 Unit Apartments | 0 | 0.0% |
| 5 to 9 Unit Apartments | 7 | 0.7% |
| 10 or more Apartments | 3 | 0.3% |
| Mobile Home / Other | 293 | 29.7% |
| Total | 986 | 100.0% |
Housing Structures by Occupancy in Nambe
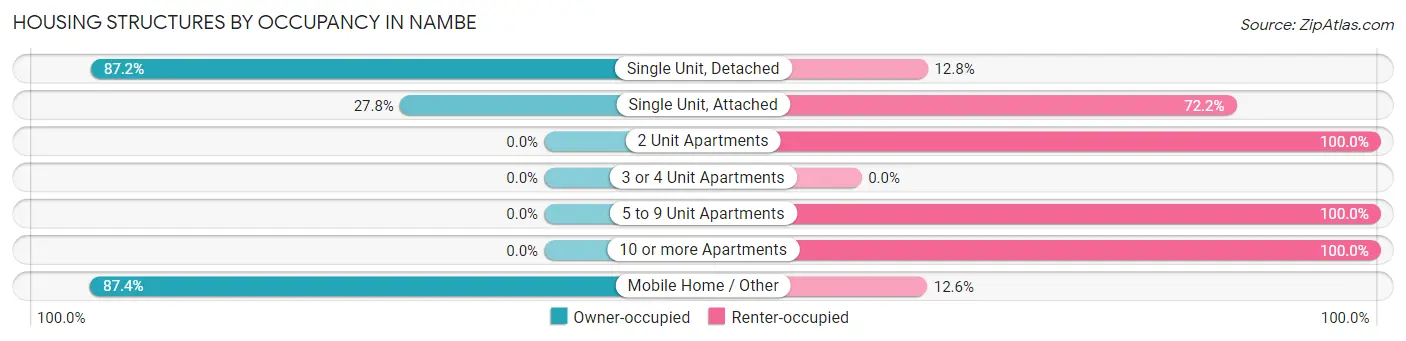
| Structure Type | Owner-occupied | Renter-occupied |
| Single Unit, Detached | 574 (87.2%) | 84 (12.8%) |
| Single Unit, Attached | 5 (27.8%) | 13 (72.2%) |
| 2 Unit Apartments | 0 (0.0%) | 7 (100.0%) |
| 3 or 4 Unit Apartments | 0 (0.0%) | 0 (0.0%) |
| 5 to 9 Unit Apartments | 0 (0.0%) | 7 (100.0%) |
| 10 or more Apartments | 0 (0.0%) | 3 (100.0%) |
| Mobile Home / Other | 256 (87.4%) | 37 (12.6%) |
| Total | 835 (84.7%) | 151 (15.3%) |
Housing Structures by Number of Rooms in Nambe
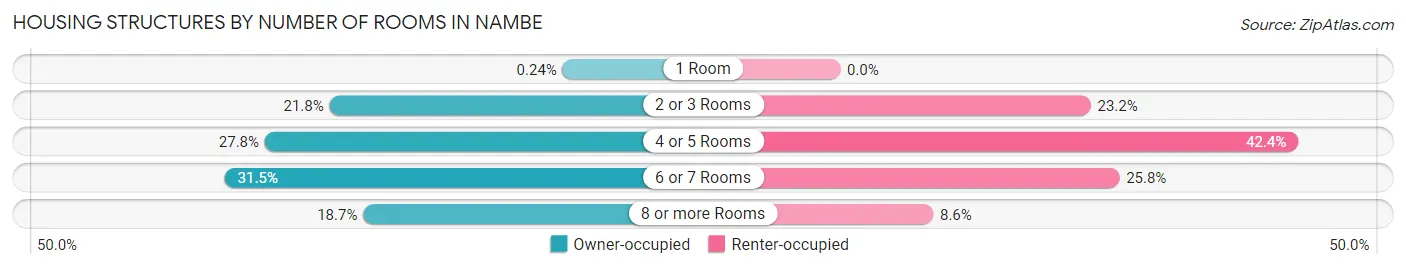
| Number of Rooms | Owner-occupied | Renter-occupied |
| 1 Room | 2 (0.2%) | 0 (0.0%) |
| 2 or 3 Rooms | 182 (21.8%) | 35 (23.2%) |
| 4 or 5 Rooms | 232 (27.8%) | 64 (42.4%) |
| 6 or 7 Rooms | 263 (31.5%) | 39 (25.8%) |
| 8 or more Rooms | 156 (18.7%) | 13 (8.6%) |
| Total | 835 (100.0%) | 151 (100.0%) |
Housing Structure by Heating Type in Nambe
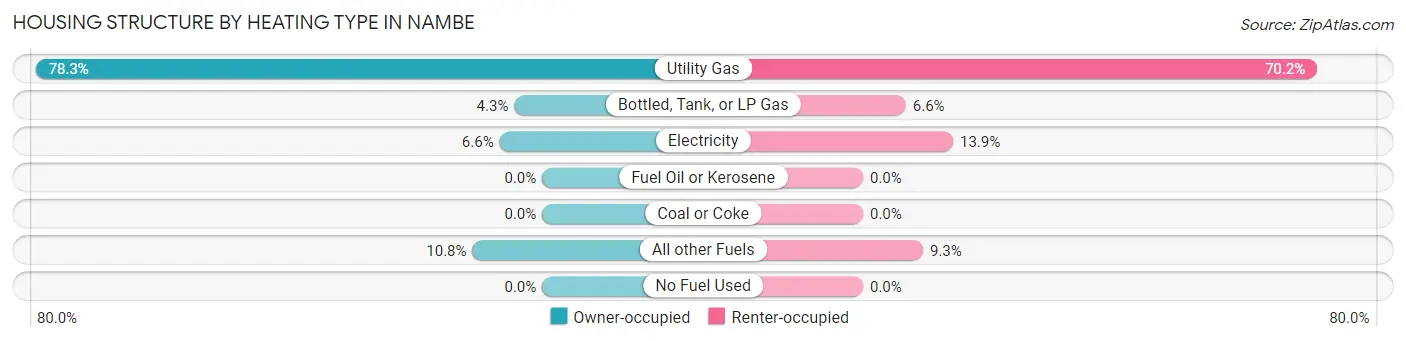
| Heating Type | Owner-occupied | Renter-occupied |
| Utility Gas | 654 (78.3%) | 106 (70.2%) |
| Bottled, Tank, or LP Gas | 36 (4.3%) | 10 (6.6%) |
| Electricity | 55 (6.6%) | 21 (13.9%) |
| Fuel Oil or Kerosene | 0 (0.0%) | 0 (0.0%) |
| Coal or Coke | 0 (0.0%) | 0 (0.0%) |
| All other Fuels | 90 (10.8%) | 14 (9.3%) |
| No Fuel Used | 0 (0.0%) | 0 (0.0%) |
| Total | 835 (100.0%) | 151 (100.0%) |
Household Vehicle Usage in Nambe
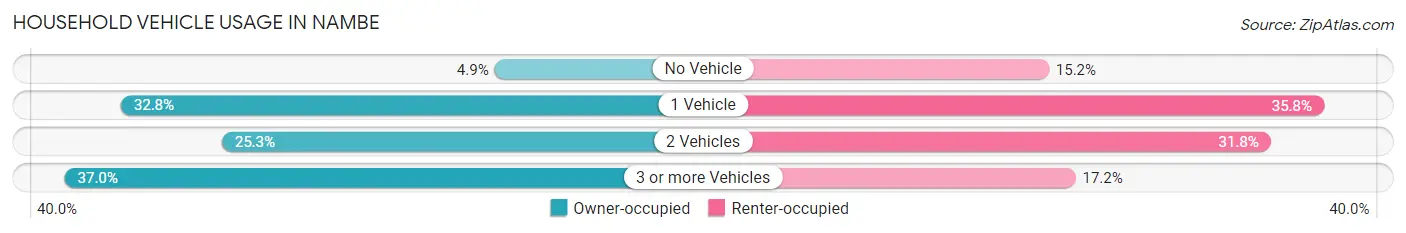
| Vehicles per Household | Owner-occupied | Renter-occupied |
| No Vehicle | 41 (4.9%) | 23 (15.2%) |
| 1 Vehicle | 274 (32.8%) | 54 (35.8%) |
| 2 Vehicles | 211 (25.3%) | 48 (31.8%) |
| 3 or more Vehicles | 309 (37.0%) | 26 (17.2%) |
| Total | 835 (100.0%) | 151 (100.0%) |
Real Estate & Mortgages in Nambe
Real Estate and Mortgage Overview in Nambe
| Characteristic | Without Mortgage | With Mortgage |
| Housing Units | 619 | 216 |
| Median Property Value | $198,300 | $394,400 |
| Median Household Income | $31,925 | $57 |
| Monthly Housing Costs | $283 | $31 |
| Real Estate Taxes | $1,330 | $46 |
Property Value by Mortgage Status in Nambe
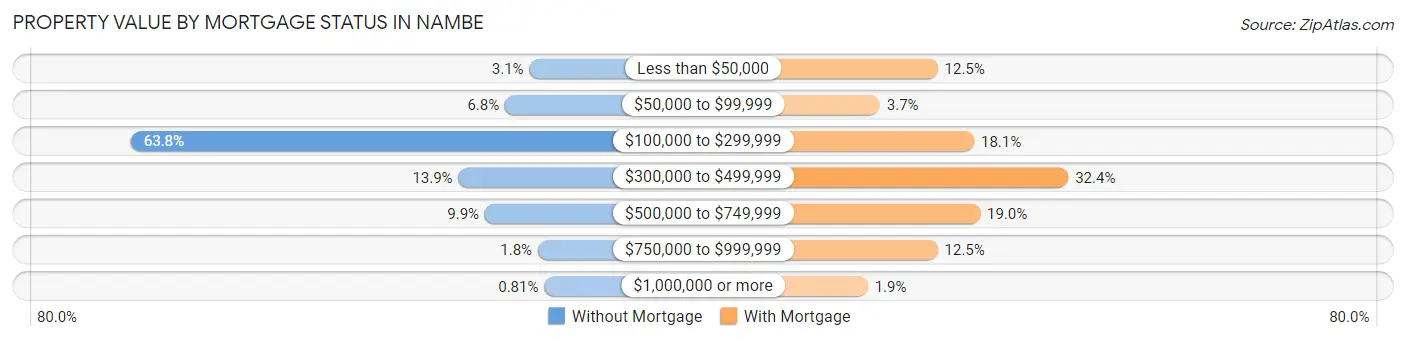
| Property Value | Without Mortgage | With Mortgage |
| Less than $50,000 | 19 (3.1%) | 27 (12.5%) |
| $50,000 to $99,999 | 42 (6.8%) | 8 (3.7%) |
| $100,000 to $299,999 | 395 (63.8%) | 39 (18.1%) |
| $300,000 to $499,999 | 86 (13.9%) | 70 (32.4%) |
| $500,000 to $749,999 | 61 (9.9%) | 41 (19.0%) |
| $750,000 to $999,999 | 11 (1.8%) | 27 (12.5%) |
| $1,000,000 or more | 5 (0.8%) | 4 (1.8%) |
| Total | 619 (100.0%) | 216 (100.0%) |
Household Income by Mortgage Status in Nambe
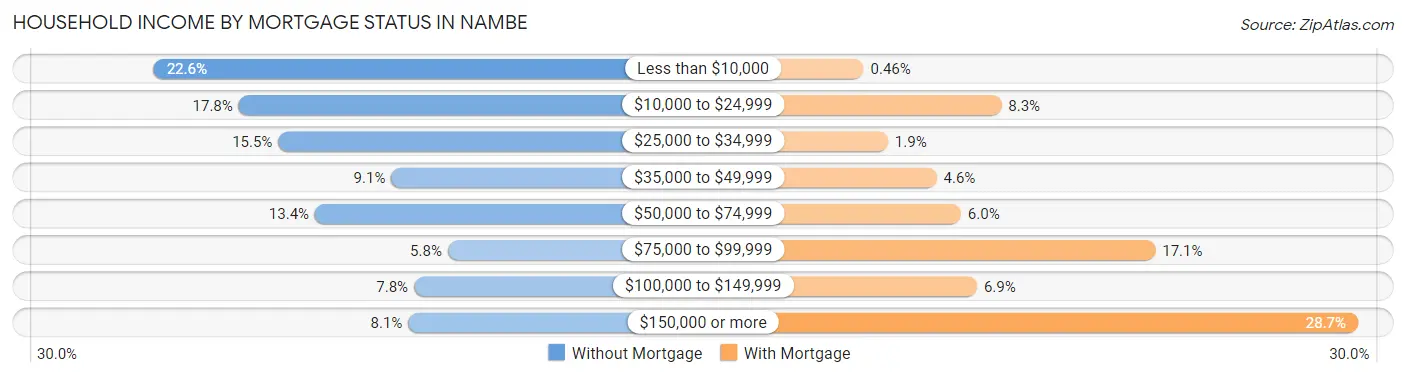
| Household Income | Without Mortgage | With Mortgage |
| Less than $10,000 | 140 (22.6%) | 1 (0.5%) |
| $10,000 to $24,999 | 110 (17.8%) | 18 (8.3%) |
| $25,000 to $34,999 | 96 (15.5%) | 4 (1.8%) |
| $35,000 to $49,999 | 56 (9.0%) | 10 (4.6%) |
| $50,000 to $74,999 | 83 (13.4%) | 13 (6.0%) |
| $75,000 to $99,999 | 36 (5.8%) | 37 (17.1%) |
| $100,000 to $149,999 | 48 (7.7%) | 15 (6.9%) |
| $150,000 or more | 50 (8.1%) | 62 (28.7%) |
| Total | 619 (100.0%) | 216 (100.0%) |
Property Value to Household Income Ratio in Nambe
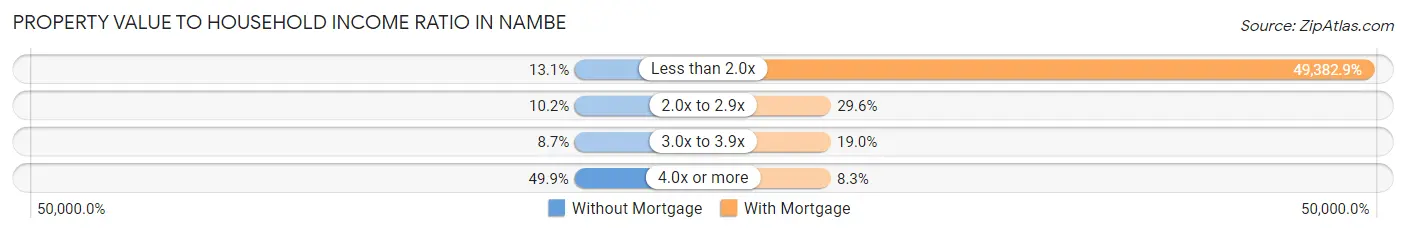
| Value-to-Income Ratio | Without Mortgage | With Mortgage |
| Less than 2.0x | 81 (13.1%) | 106,667 (49,382.9%) |
| 2.0x to 2.9x | 63 (10.2%) | 64 (29.6%) |
| 3.0x to 3.9x | 54 (8.7%) | 41 (19.0%) |
| 4.0x or more | 309 (49.9%) | 18 (8.3%) |
| Total | 619 (100.0%) | 216 (100.0%) |
Real Estate Taxes by Mortgage Status in Nambe
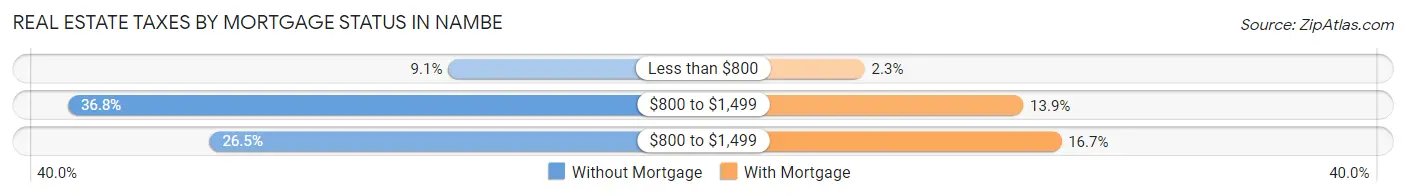
| Property Taxes | Without Mortgage | With Mortgage |
| Less than $800 | 56 (9.0%) | 5 (2.3%) |
| $800 to $1,499 | 228 (36.8%) | 30 (13.9%) |
| $800 to $1,499 | 164 (26.5%) | 36 (16.7%) |
| Total | 619 (100.0%) | 216 (100.0%) |
Health & Disability in Nambe
Health Insurance Coverage by Age in Nambe
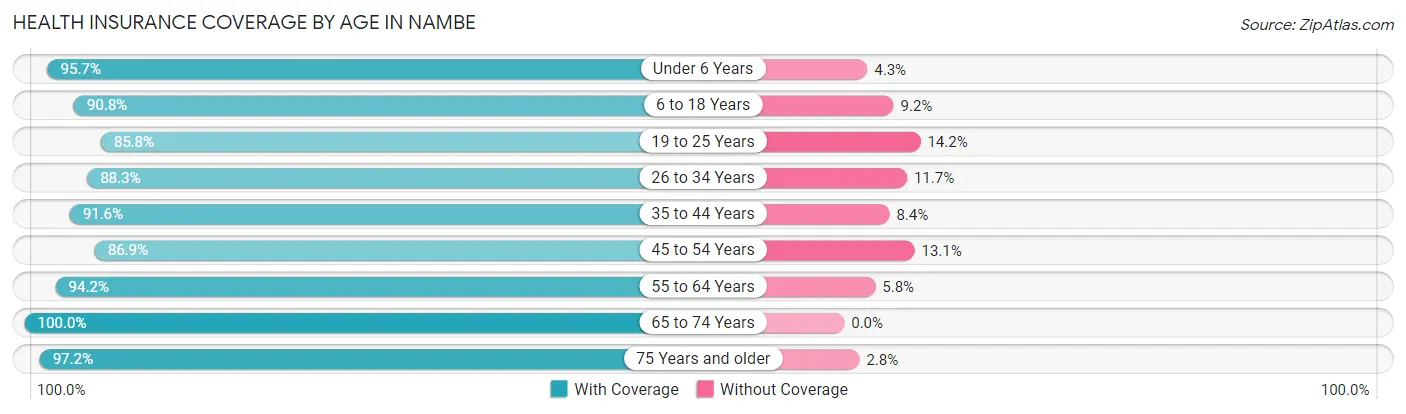
| Age Bracket | With Coverage | Without Coverage |
| Under 6 Years | 89 (95.7%) | 4 (4.3%) |
| 6 to 18 Years | 227 (90.8%) | 23 (9.2%) |
| 19 to 25 Years | 169 (85.8%) | 28 (14.2%) |
| 26 to 34 Years | 204 (88.3%) | 27 (11.7%) |
| 35 to 44 Years | 152 (91.6%) | 14 (8.4%) |
| 45 to 54 Years | 252 (86.9%) | 38 (13.1%) |
| 55 to 64 Years | 309 (94.2%) | 19 (5.8%) |
| 65 to 74 Years | 355 (100.0%) | 0 (0.0%) |
| 75 Years and older | 240 (97.2%) | 7 (2.8%) |
| Total | 1,997 (92.6%) | 160 (7.4%) |
Health Insurance Coverage by Citizenship Status in Nambe
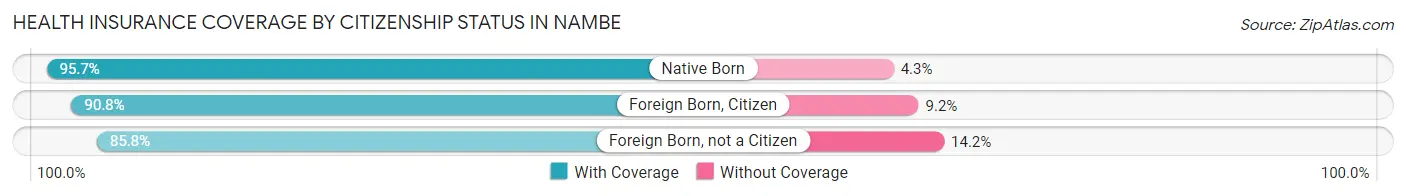
| Citizenship Status | With Coverage | Without Coverage |
| Native Born | 89 (95.7%) | 4 (4.3%) |
| Foreign Born, Citizen | 227 (90.8%) | 23 (9.2%) |
| Foreign Born, not a Citizen | 169 (85.8%) | 28 (14.2%) |
Health Insurance Coverage by Household Income in Nambe
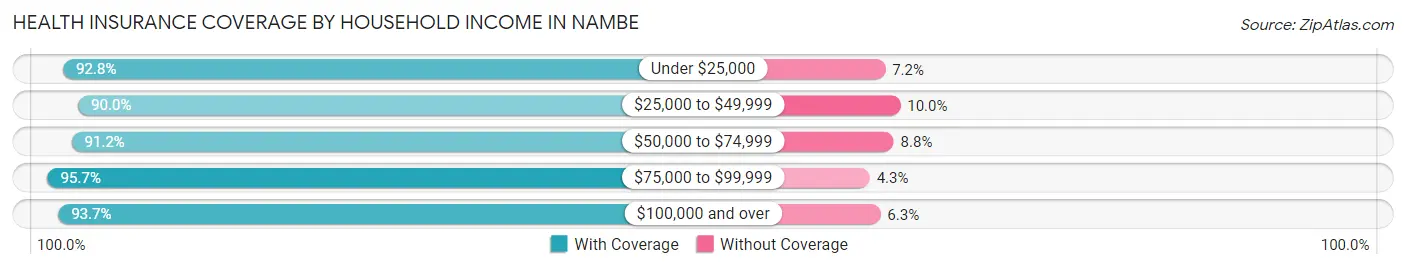
| Household Income | With Coverage | Without Coverage |
| Under $25,000 | 438 (92.8%) | 34 (7.2%) |
| $25,000 to $49,999 | 368 (90.0%) | 41 (10.0%) |
| $50,000 to $74,999 | 291 (91.2%) | 28 (8.8%) |
| $75,000 to $99,999 | 156 (95.7%) | 7 (4.3%) |
| $100,000 and over | 744 (93.7%) | 50 (6.3%) |
Public vs Private Health Insurance Coverage by Age in Nambe

| Age Bracket | Public Insurance | Private Insurance |
| Under 6 | 45 (48.4%) | 51 (54.8%) |
| 6 to 18 Years | 109 (43.6%) | 129 (51.6%) |
| 19 to 25 Years | 78 (39.6%) | 95 (48.2%) |
| 25 to 34 Years | 102 (44.2%) | 110 (47.6%) |
| 35 to 44 Years | 29 (17.5%) | 125 (75.3%) |
| 45 to 54 Years | 84 (29.0%) | 181 (62.4%) |
| 55 to 64 Years | 93 (28.3%) | 250 (76.2%) |
| 65 to 74 Years | 342 (96.3%) | 137 (38.6%) |
| 75 Years and over | 238 (96.4%) | 145 (58.7%) |
| Total | 1,120 (51.9%) | 1,223 (56.7%) |
Disability Status by Sex by Age in Nambe
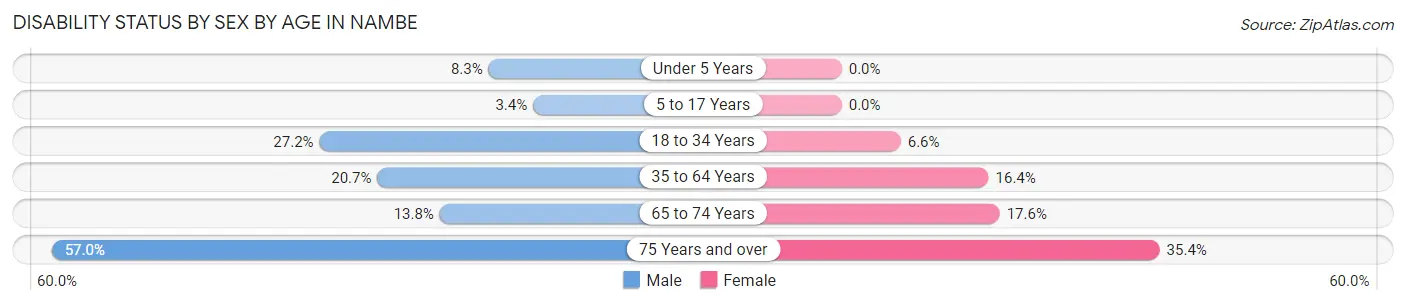
| Age Bracket | Male | Female |
| Under 5 Years | 4 (8.3%) | 0 (0.0%) |
| 5 to 17 Years | 3 (3.4%) | 0 (0.0%) |
| 18 to 34 Years | 72 (27.2%) | 13 (6.6%) |
| 35 to 64 Years | 75 (20.7%) | 69 (16.4%) |
| 65 to 74 Years | 34 (13.8%) | 19 (17.6%) |
| 75 Years and over | 49 (57.0%) | 57 (35.4%) |
Disability Class by Sex by Age in Nambe
Disability Class: Hearing Difficulty
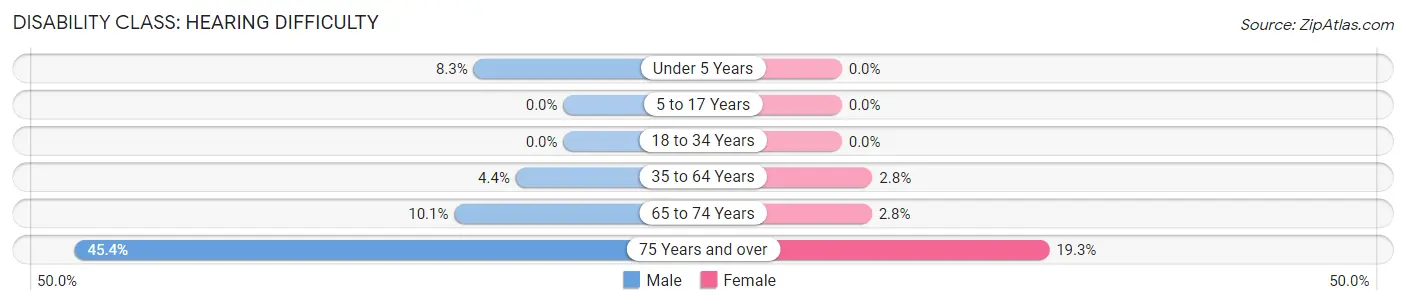
| Age Bracket | Male | Female |
| Under 5 Years | 4 (8.3%) | 0 (0.0%) |
| 5 to 17 Years | 0 (0.0%) | 0 (0.0%) |
| 18 to 34 Years | 0 (0.0%) | 0 (0.0%) |
| 35 to 64 Years | 16 (4.4%) | 12 (2.8%) |
| 65 to 74 Years | 25 (10.1%) | 3 (2.8%) |
| 75 Years and over | 39 (45.4%) | 31 (19.3%) |
Disability Class: Vision Difficulty
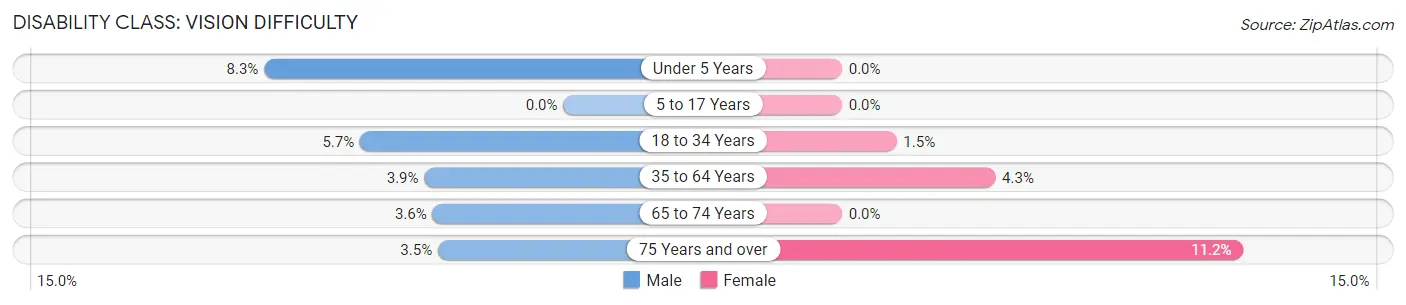
| Age Bracket | Male | Female |
| Under 5 Years | 4 (8.3%) | 0 (0.0%) |
| 5 to 17 Years | 0 (0.0%) | 0 (0.0%) |
| 18 to 34 Years | 15 (5.7%) | 3 (1.5%) |
| 35 to 64 Years | 14 (3.9%) | 18 (4.3%) |
| 65 to 74 Years | 9 (3.6%) | 0 (0.0%) |
| 75 Years and over | 3 (3.5%) | 18 (11.2%) |
Disability Class: Cognitive Difficulty
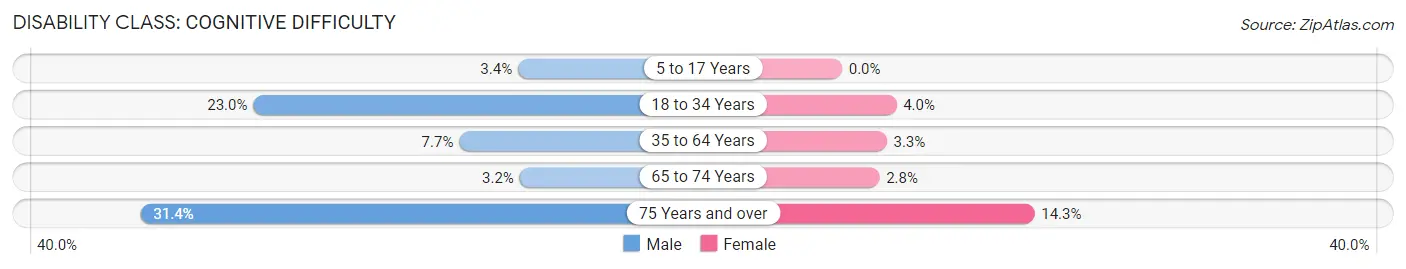
| Age Bracket | Male | Female |
| 5 to 17 Years | 3 (3.4%) | 0 (0.0%) |
| 18 to 34 Years | 61 (23.0%) | 8 (4.0%) |
| 35 to 64 Years | 28 (7.7%) | 14 (3.3%) |
| 65 to 74 Years | 8 (3.2%) | 3 (2.8%) |
| 75 Years and over | 27 (31.4%) | 23 (14.3%) |
Disability Class: Ambulatory Difficulty
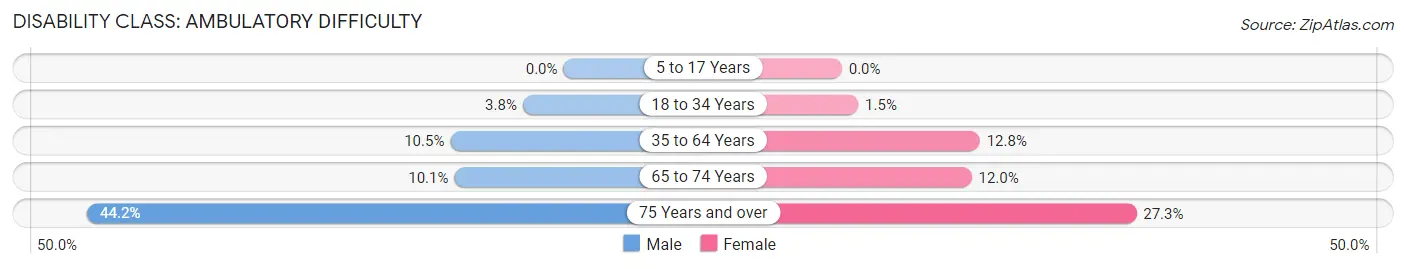
| Age Bracket | Male | Female |
| 5 to 17 Years | 0 (0.0%) | 0 (0.0%) |
| 18 to 34 Years | 10 (3.8%) | 3 (1.5%) |
| 35 to 64 Years | 38 (10.5%) | 54 (12.8%) |
| 65 to 74 Years | 25 (10.1%) | 13 (12.0%) |
| 75 Years and over | 38 (44.2%) | 44 (27.3%) |
Disability Class: Self-Care Difficulty
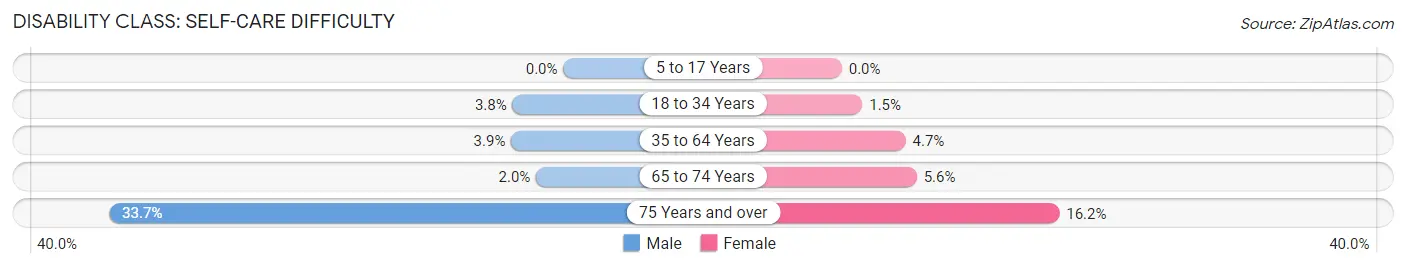
| Age Bracket | Male | Female |
| 5 to 17 Years | 0 (0.0%) | 0 (0.0%) |
| 18 to 34 Years | 10 (3.8%) | 3 (1.5%) |
| 35 to 64 Years | 14 (3.9%) | 20 (4.7%) |
| 65 to 74 Years | 5 (2.0%) | 6 (5.6%) |
| 75 Years and over | 29 (33.7%) | 26 (16.2%) |
Technology Access in Nambe
Computing Device Access in Nambe
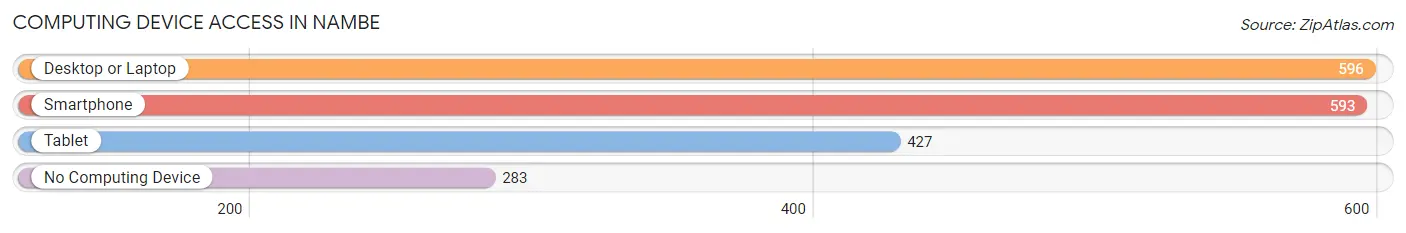
| Device Type | # Households | % Households |
| Desktop or Laptop | 596 | 60.5% |
| Smartphone | 593 | 60.1% |
| Tablet | 427 | 43.3% |
| No Computing Device | 283 | 28.7% |
| Total | 986 | 100.0% |
Internet Access in Nambe
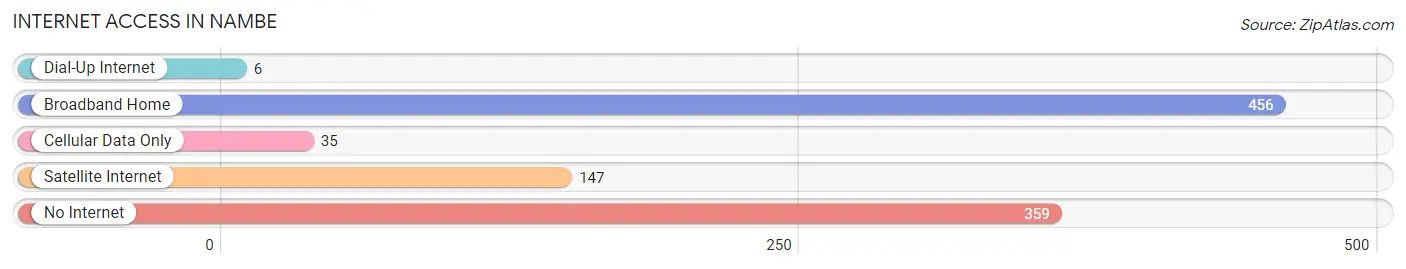
| Internet Type | # Households | % Households |
| Dial-Up Internet | 6 | 0.6% |
| Broadband Home | 456 | 46.3% |
| Cellular Data Only | 35 | 3.5% |
| Satellite Internet | 147 | 14.9% |
| No Internet | 359 | 36.4% |
| Total | 986 | 100.0% |
Nambe Summary
Nambe is a small unincorporated community located in Santa Fe County, New Mexico. It is situated in the foothills of the Sangre de Cristo Mountains, approximately 20 miles north of Santa Fe. The population of Nambe was estimated to be around 1,000 in 2020.
History
The area that is now Nambe was originally inhabited by the Tewa people, who were part of the Pueblo culture. The Tewa people lived in the area for centuries before the arrival of Spanish settlers in the late 16th century. The Spanish settlers established a mission in the area, which was later abandoned.
In the late 19th century, the area was settled by Anglo-American settlers, who established a small farming community. The community was named Nambe, which is derived from the Tewa word for “people of the sun”.
Geography
Nambe is located in the foothills of the Sangre de Cristo Mountains, approximately 20 miles north of Santa Fe. The area is characterized by rolling hills and mesas, with elevations ranging from 5,000 to 8,000 feet. The climate is semi-arid, with hot summers and cold winters.
Economy
The economy of Nambe is largely based on agriculture and tourism. The area is home to several small farms, which produce a variety of crops, including alfalfa, hay, and vegetables. The area is also popular with tourists, who come to enjoy the scenic beauty of the Sangre de Cristo Mountains.
Demographics
As of the 2010 census, the population of Nambe was 1,000. The racial makeup of the town was 94.2% White, 0.7% African American, 0.7% Native American, 0.7% Asian, 0.3% Pacific Islander, and 3.1% from other races. The median household income was $37,500, and the median family income was $41,250.
Conclusion
Nambe is a small unincorporated community located in Santa Fe County, New Mexico. It is situated in the foothills of the Sangre de Cristo Mountains, approximately 20 miles north of Santa Fe. The population of Nambe was estimated to be around 1,000 in 2020. The economy of Nambe is largely based on agriculture and tourism, and the area is popular with tourists who come to enjoy the scenic beauty of the Sangre de Cristo Mountains. The racial makeup of the town was 94.2% White, 0.7% African American, 0.7% Native American, 0.7% Asian, 0.3% Pacific Islander, and 3.1% from other races. The median household income was $37,500, and the median family income was $41,250.
Common Questions
What is Per Capita Income in Nambe?
Per Capita income in Nambe is $36,240.
What is the Median Family Income in Nambe?
Median Family Income in Nambe is $69,083.
What is the Median Household income in Nambe?
Median Household Income in Nambe is $42,596.
What is Income or Wage Gap in Nambe?
Income or Wage Gap in Nambe is 4.2%.
Women in Nambe earn 95.8 cents for every dollar earned by a man.
What is Inequality or Gini Index in Nambe?
Inequality or Gini Index in Nambe is 0.56.
What is the Total Population of Nambe?
Total Population of Nambe is 2,165.
What is the Total Male Population of Nambe?
Total Male Population of Nambe is 1,105.
What is the Total Female Population of Nambe?
Total Female Population of Nambe is 1,060.
What is the Ratio of Males per 100 Females in Nambe?
There are 104.25 Males per 100 Females in Nambe.
What is the Ratio of Females per 100 Males in Nambe?
There are 95.93 Females per 100 Males in Nambe.
What is the Median Population Age in Nambe?
Median Population Age in Nambe is 50.7 Years.
What is the Average Family Size in Nambe
Average Family Size in Nambe is 3.1 People.
What is the Average Household Size in Nambe
Average Household Size in Nambe is 2.2 People.
How Large is the Labor Force in Nambe?
There are 899 People in the Labor Forcein in Nambe.
What is the Percentage of People in the Labor Force in Nambe?
47.1% of People are in the Labor Force in Nambe.
What is the Unemployment Rate in Nambe?
Unemployment Rate in Nambe is 10.7%.