Trinidad, CO Map & Demographics
Trinidad Map
Trinidad Overview
$29,213
PER CAPITA INCOME
$62,795
AVG FAMILY INCOME
$47,908
AVG HOUSEHOLD INCOME
25.2%
WAGE / INCOME GAP [ % ]
74.8¢/ $1
WAGE / INCOME GAP [ $ ]
0.47
INEQUALITY / GINI INDEX
8,334
TOTAL POPULATION
4,356
MALE POPULATION
3,978
FEMALE POPULATION
109.50
MALES / 100 FEMALES
91.32
FEMALES / 100 MALES
43.7
MEDIAN AGE
2.5
AVG FAMILY SIZE
2.0
AVG HOUSEHOLD SIZE
4,071
LABOR FORCE [ PEOPLE ]
57.4%
PERCENT IN LABOR FORCE
8.2%
UNEMPLOYMENT RATE
Trinidad Zip Codes
Trinidad Area Codes
Income in Trinidad
Income Overview in Trinidad
Per Capita Income in Trinidad is $29,213, while median incomes of families and households are $62,795 and $47,908 respectively.
| Characteristic | Number | Measure |
| Per Capita Income | 8,334 | $29,213 |
| Median Family Income | 2,196 | $62,795 |
| Mean Family Income | 2,196 | $77,973 |
| Median Household Income | 3,930 | $47,908 |
| Mean Household Income | 3,930 | $62,532 |
| Income Deficit | 2,196 | $0 |
| Wage / Income Gap (%) | 8,334 | 25.24% |
| Wage / Income Gap ($) | 8,334 | 74.76¢ per $1 |
| Gini / Inequality Index | 8,334 | 0.47 |
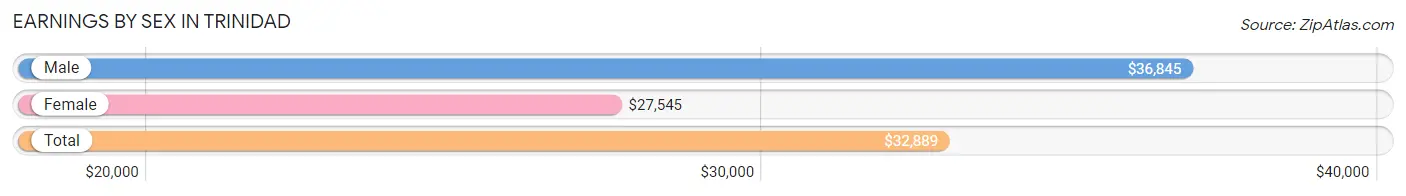
Earnings by Sex in Trinidad
Average Earnings in Trinidad are $32,889, $36,845 for men and $27,545 for women, a difference of 25.2%.
| Sex | Number | Average Earnings |
| Male | 2,208 (53.5%) | $36,845 |
| Female | 1,915 (46.5%) | $27,545 |
| Total | 4,123 (100.0%) | $32,889 |
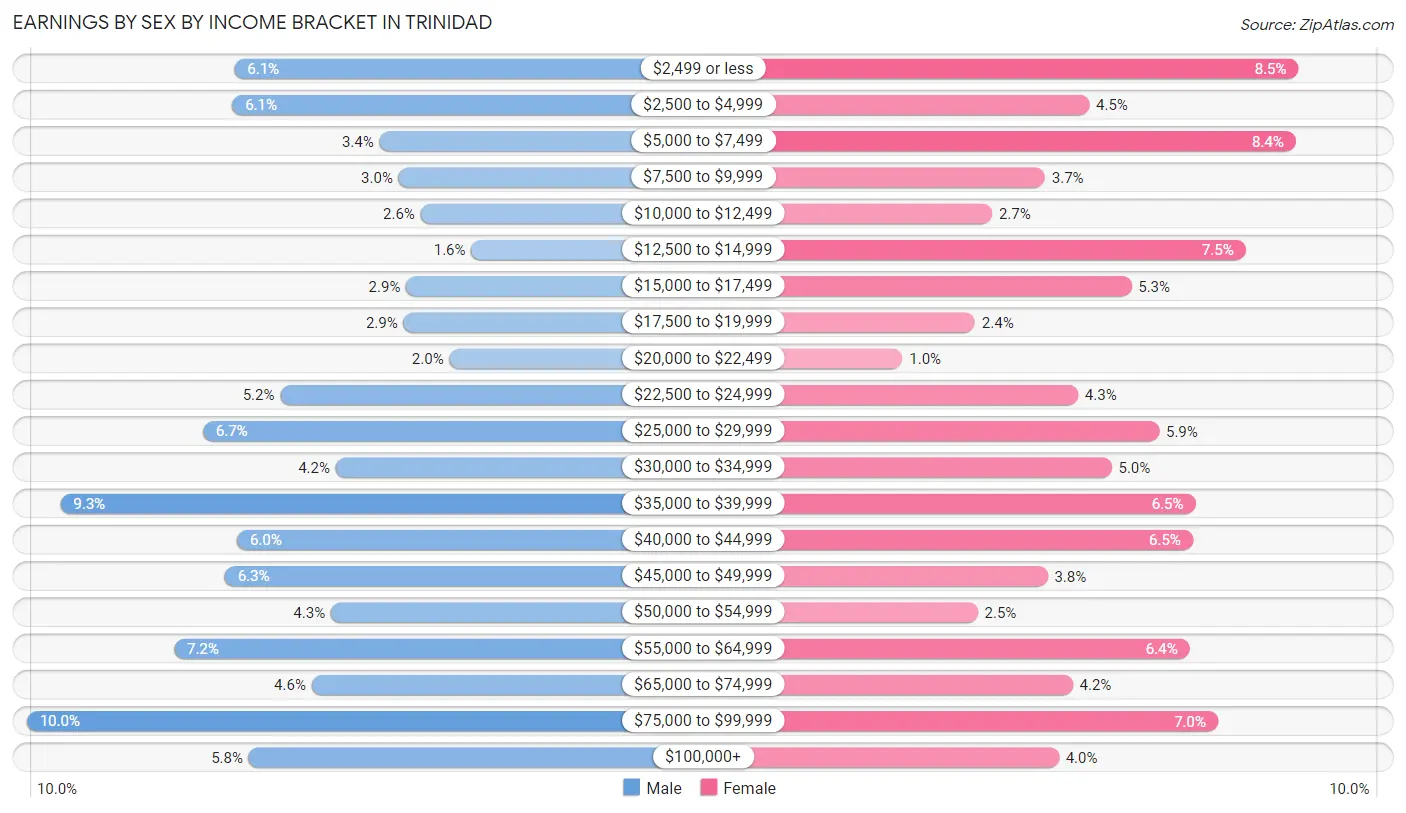
Earnings by Sex by Income Bracket in Trinidad
The most common earnings brackets in Trinidad are $75,000 to $99,999 for men (220 | 10.0%) and $2,499 or less for women (162 | 8.5%).
| Income | Male | Female |
| $2,499 or less | 134 (6.1%) | 162 (8.5%) |
| $2,500 to $4,999 | 135 (6.1%) | 87 (4.5%) |
| $5,000 to $7,499 | 74 (3.4%) | 161 (8.4%) |
| $7,500 to $9,999 | 66 (3.0%) | 71 (3.7%) |
| $10,000 to $12,499 | 57 (2.6%) | 52 (2.7%) |
| $12,500 to $14,999 | 36 (1.6%) | 143 (7.5%) |
| $15,000 to $17,499 | 63 (2.9%) | 102 (5.3%) |
| $17,500 to $19,999 | 64 (2.9%) | 46 (2.4%) |
| $20,000 to $22,499 | 45 (2.0%) | 20 (1.0%) |
| $22,500 to $24,999 | 115 (5.2%) | 83 (4.3%) |
| $25,000 to $29,999 | 147 (6.7%) | 112 (5.9%) |
| $30,000 to $34,999 | 92 (4.2%) | 95 (5.0%) |
| $35,000 to $39,999 | 206 (9.3%) | 125 (6.5%) |
| $40,000 to $44,999 | 133 (6.0%) | 124 (6.5%) |
| $45,000 to $49,999 | 138 (6.2%) | 72 (3.8%) |
| $50,000 to $54,999 | 94 (4.3%) | 47 (2.5%) |
| $55,000 to $64,999 | 159 (7.2%) | 123 (6.4%) |
| $65,000 to $74,999 | 102 (4.6%) | 81 (4.2%) |
| $75,000 to $99,999 | 220 (10.0%) | 133 (7.0%) |
| $100,000+ | 128 (5.8%) | 76 (4.0%) |
| Total | 2,208 (100.0%) | 1,915 (100.0%) |
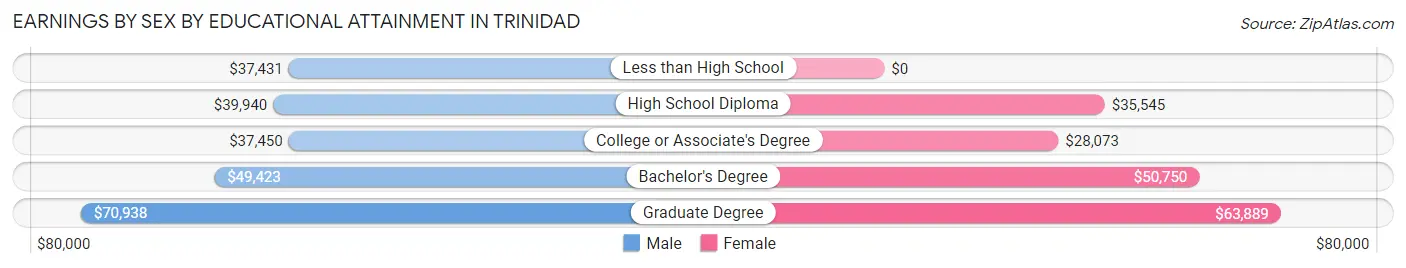
Earnings by Sex by Educational Attainment in Trinidad
Average earnings in Trinidad are $42,435 for men and $33,218 for women, a difference of 21.7%. Men with an educational attainment of graduate degree enjoy the highest average annual earnings of $70,938, while those with less than high school education earn the least with $37,431. Women with an educational attainment of graduate degree earn the most with the average annual earnings of $63,889, while those with college or associate's degree education have the smallest earnings of $28,073.
| Educational Attainment | Male Income | Female Income |
| Less than High School | $37,431 | $0 |
| High School Diploma | $39,940 | $35,545 |
| College or Associate's Degree | $37,450 | $28,073 |
| Bachelor's Degree | $49,423 | $50,750 |
| Graduate Degree | $70,938 | $63,889 |
| Total | $42,435 | $33,218 |
Family Income in Trinidad
Family Income Brackets in Trinidad
According to the Trinidad family income data, there are 523 families falling into the $50,000 to $74,999 income range, which is the most common income bracket and makes up 23.8% of all families. Conversely, the $10,000 to $14,999 income bracket is the least frequent group with only 66 families (3.0%) belonging to this category.
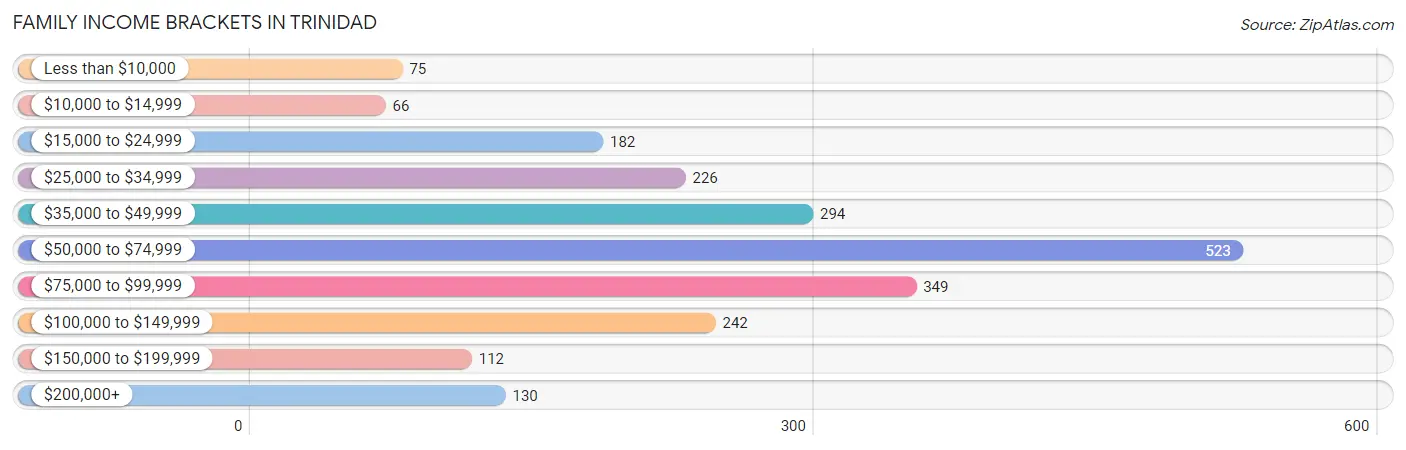
| Income Bracket | # Families | % Families |
| Less than $10,000 | 75 | 3.4% |
| $10,000 to $14,999 | 66 | 3.0% |
| $15,000 to $24,999 | 182 | 8.3% |
| $25,000 to $34,999 | 226 | 10.3% |
| $35,000 to $49,999 | 294 | 13.4% |
| $50,000 to $74,999 | 523 | 23.8% |
| $75,000 to $99,999 | 349 | 15.9% |
| $100,000 to $149,999 | 242 | 11.0% |
| $150,000 to $199,999 | 112 | 5.1% |
| $200,000+ | 130 | 5.9% |
Family Income by Famaliy Size in Trinidad
6-person families (42 | 1.9%) account for the highest median family income in Trinidad with $87,019 per family, while 2-person families (1,337 | 60.9%) have the highest median income of $28,862 per family member.
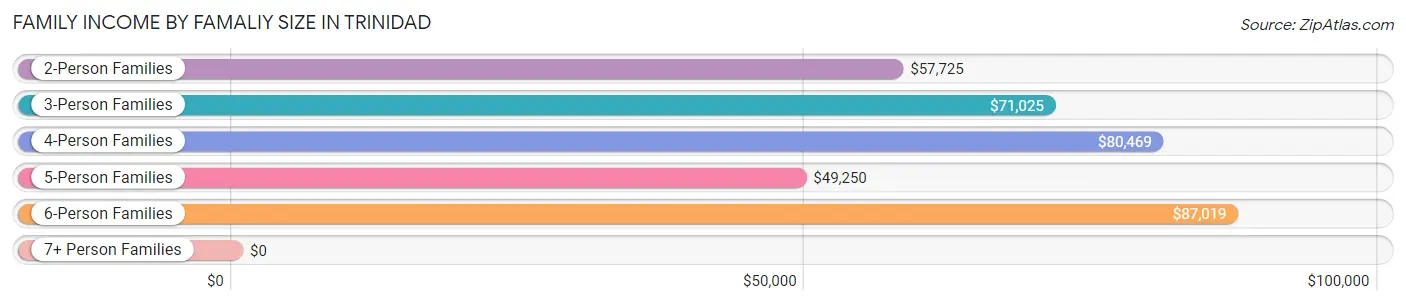
| Income Bracket | # Families | Median Income |
| 2-Person Families | 1,337 (60.9%) | $57,725 |
| 3-Person Families | 448 (20.4%) | $71,025 |
| 4-Person Families | 294 (13.4%) | $80,469 |
| 5-Person Families | 55 (2.5%) | $49,250 |
| 6-Person Families | 42 (1.9%) | $87,019 |
| 7+ Person Families | 20 (0.9%) | $0 |
| Total | 2,196 (100.0%) | $62,795 |
Family Income by Number of Earners in Trinidad
The median family income in Trinidad is $62,795, with families comprising 3+ earners (124) having the highest median family income of $86,635, while families with no earners (386) have the lowest median family income of $43,750, accounting for 5.7% and 17.6% of families, respectively.
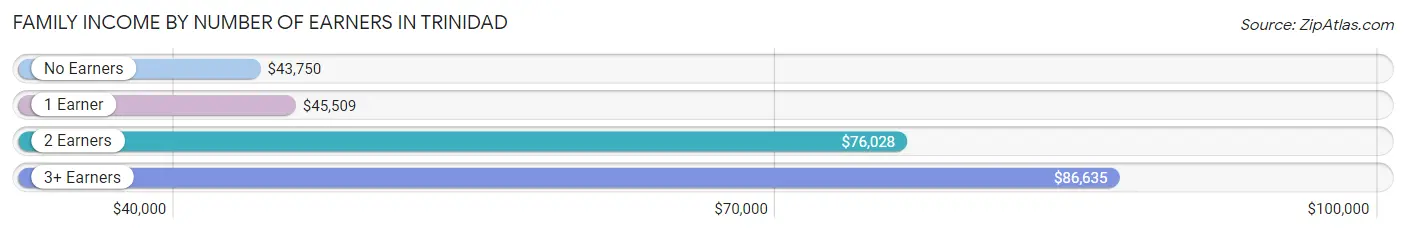
| Number of Earners | # Families | Median Income |
| No Earners | 386 (17.6%) | $43,750 |
| 1 Earner | 861 (39.2%) | $45,509 |
| 2 Earners | 825 (37.6%) | $76,028 |
| 3+ Earners | 124 (5.7%) | $86,635 |
| Total | 2,196 (100.0%) | $62,795 |
Household Income in Trinidad
Household Income Brackets in Trinidad
With 802 households falling in the category, the $50,000 to $74,999 income range is the most frequent in Trinidad, accounting for 20.4% of all households. In contrast, only 63 households (1.6%) fall into the $150,000 to $199,999 income bracket, making it the least populous group.
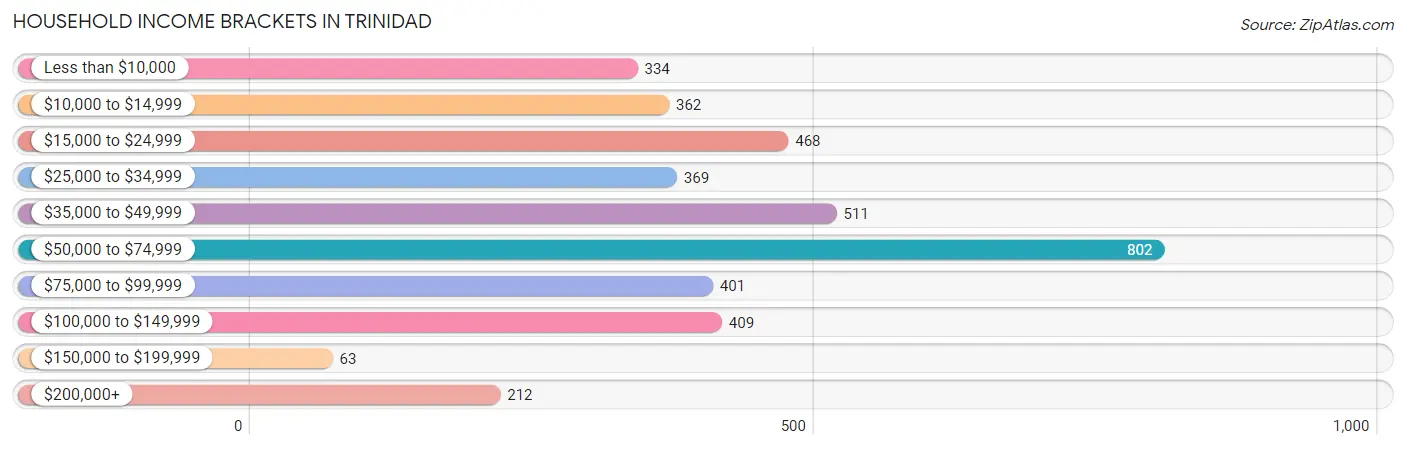
| Income Bracket | # Households | % Households |
| Less than $10,000 | 334 | 8.5% |
| $10,000 to $14,999 | 362 | 9.2% |
| $15,000 to $24,999 | 468 | 11.9% |
| $25,000 to $34,999 | 369 | 9.4% |
| $35,000 to $49,999 | 511 | 13.0% |
| $50,000 to $74,999 | 802 | 20.4% |
| $75,000 to $99,999 | 401 | 10.2% |
| $100,000 to $149,999 | 409 | 10.4% |
| $150,000 to $199,999 | 63 | 1.6% |
| $200,000+ | 212 | 5.4% |
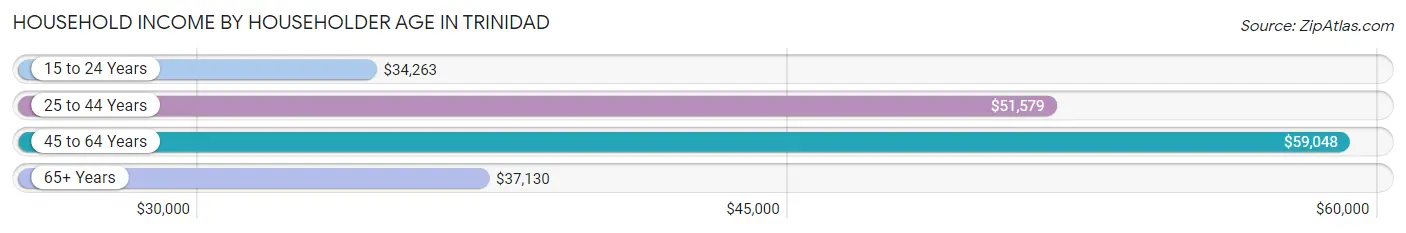
Household Income by Householder Age in Trinidad
The median household income in Trinidad is $47,908, with the highest median household income of $59,048 found in the 45 to 64 years age bracket for the primary householder. A total of 1,340 households (34.1%) fall into this category. Meanwhile, the 15 to 24 years age bracket for the primary householder has the lowest median household income of $34,263, with 209 households (5.3%) in this group.
| Income Bracket | # Households | Median Income |
| 15 to 24 Years | 209 (5.3%) | $34,263 |
| 25 to 44 Years | 1,076 (27.4%) | $51,579 |
| 45 to 64 Years | 1,340 (34.1%) | $59,048 |
| 65+ Years | 1,305 (33.2%) | $37,130 |
| Total | 3,930 (100.0%) | $47,908 |
Poverty in Trinidad
Income Below Poverty by Sex and Age in Trinidad
With 19.7% poverty level for males and 20.6% for females among the residents of Trinidad, 15 year old males and 25 to 34 year old females are the most vulnerable to poverty, with 45 males (91.8%) and 164 females (41.7%) in their respective age groups living below the poverty level.
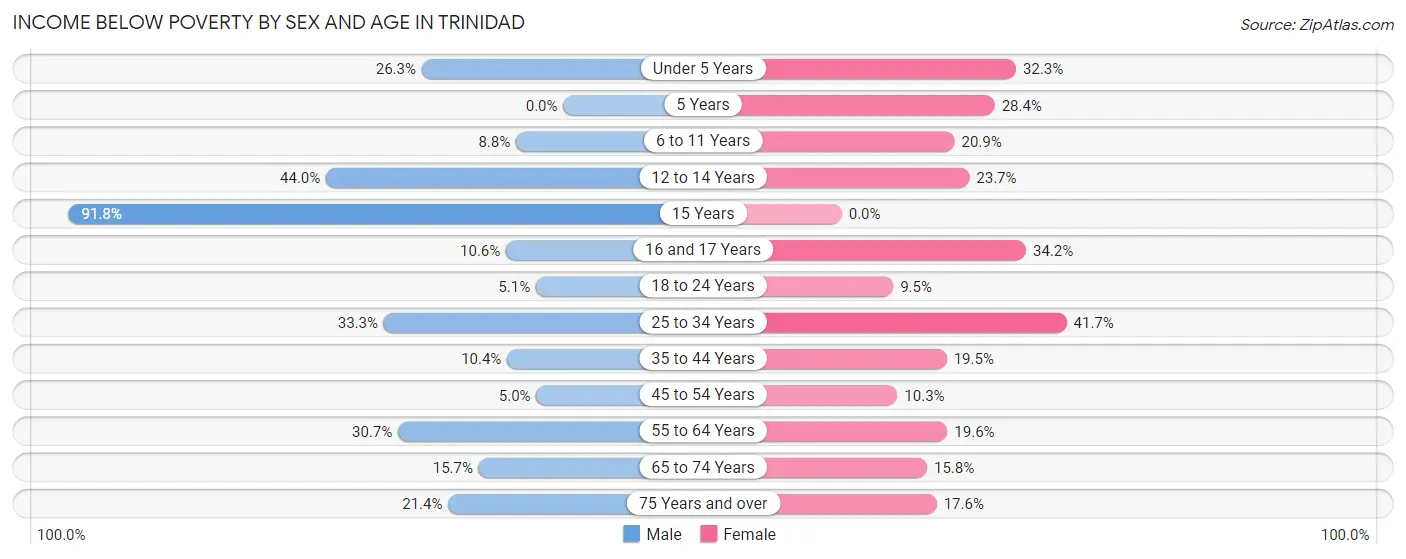
| Age Bracket | Male | Female |
| Under 5 Years | 57 (26.3%) | 43 (32.3%) |
| 5 Years | 0 (0.0%) | 21 (28.4%) |
| 6 to 11 Years | 23 (8.8%) | 45 (20.9%) |
| 12 to 14 Years | 59 (44.0%) | 27 (23.7%) |
| 15 Years | 45 (91.8%) | 0 (0.0%) |
| 16 and 17 Years | 17 (10.6%) | 39 (34.2%) |
| 18 to 24 Years | 16 (5.1%) | 23 (9.5%) |
| 25 to 34 Years | 185 (33.3%) | 164 (41.7%) |
| 35 to 44 Years | 57 (10.4%) | 105 (19.5%) |
| 45 to 54 Years | 22 (5.0%) | 48 (10.3%) |
| 55 to 64 Years | 185 (30.7%) | 119 (19.6%) |
| 65 to 74 Years | 89 (15.7%) | 85 (15.8%) |
| 75 Years and over | 66 (21.4%) | 65 (17.6%) |
| Total | 821 (19.7%) | 784 (20.6%) |
Income Above Poverty by Sex and Age in Trinidad
According to the poverty statistics in Trinidad, males aged 5 years and females aged 15 years are the age groups that are most secure financially, with 100.0% of males and 100.0% of females in these age groups living above the poverty line.
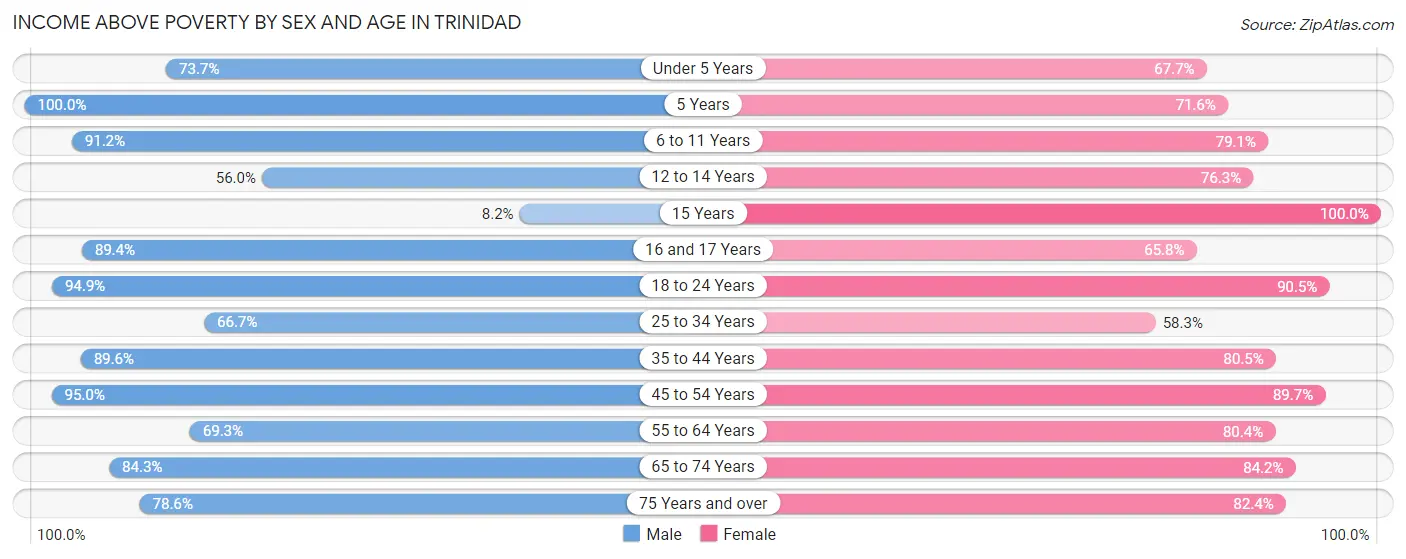
| Age Bracket | Male | Female |
| Under 5 Years | 160 (73.7%) | 90 (67.7%) |
| 5 Years | 16 (100.0%) | 53 (71.6%) |
| 6 to 11 Years | 239 (91.2%) | 170 (79.1%) |
| 12 to 14 Years | 75 (56.0%) | 87 (76.3%) |
| 15 Years | 4 (8.2%) | 11 (100.0%) |
| 16 and 17 Years | 143 (89.4%) | 75 (65.8%) |
| 18 to 24 Years | 299 (94.9%) | 218 (90.5%) |
| 25 to 34 Years | 370 (66.7%) | 229 (58.3%) |
| 35 to 44 Years | 490 (89.6%) | 434 (80.5%) |
| 45 to 54 Years | 418 (95.0%) | 417 (89.7%) |
| 55 to 64 Years | 418 (69.3%) | 488 (80.4%) |
| 65 to 74 Years | 478 (84.3%) | 452 (84.2%) |
| 75 Years and over | 243 (78.6%) | 304 (82.4%) |
| Total | 3,353 (80.3%) | 3,028 (79.4%) |
Income Below Poverty Among Married-Couple Families in Trinidad
The poverty statistics for married-couple families in Trinidad show that 2.8% or 35 of the total 1,239 families live below the poverty line. Families with 1 or 2 children have the highest poverty rate of 3.5%, comprising of 10 families. On the other hand, families with 3 or 4 children have the lowest poverty rate of 0.0%, which includes 0 families.
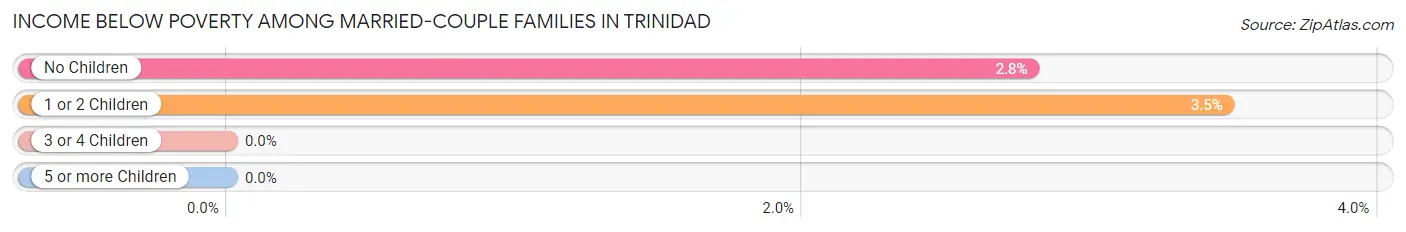
| Children | Above Poverty | Below Poverty |
| No Children | 871 (97.2%) | 25 (2.8%) |
| 1 or 2 Children | 278 (96.5%) | 10 (3.5%) |
| 3 or 4 Children | 55 (100.0%) | 0 (0.0%) |
| 5 or more Children | 0 (0.0%) | 0 (0.0%) |
| Total | 1,204 (97.2%) | 35 (2.8%) |
Income Below Poverty Among Single-Parent Households in Trinidad
According to the poverty data in Trinidad, 3.9% or 7 single-father households and 26.4% or 205 single-mother households are living below the poverty line. Among single-father households, those with no children have the highest poverty rate, with 3 households (5.7%) experiencing poverty. Likewise, among single-mother households, those with 3 or 4 children have the highest poverty rate, with 55 households (58.5%) falling below the poverty line.
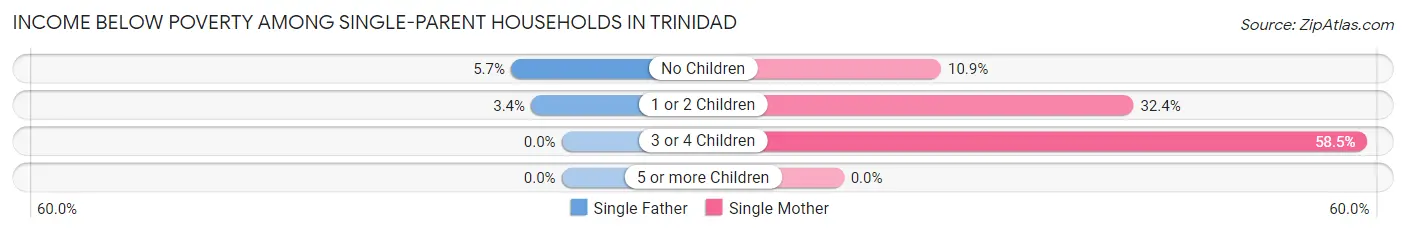
| Children | Single Father | Single Mother |
| No Children | 3 (5.7%) | 36 (10.9%) |
| 1 or 2 Children | 4 (3.4%) | 114 (32.4%) |
| 3 or 4 Children | 0 (0.0%) | 55 (58.5%) |
| 5 or more Children | 0 (0.0%) | 0 (0.0%) |
| Total | 7 (3.9%) | 205 (26.4%) |
Income Below Poverty Among Married-Couple vs Single-Parent Households in Trinidad
The poverty data for Trinidad shows that 35 of the married-couple family households (2.8%) and 212 of the single-parent households (22.2%) are living below the poverty level. Within the married-couple family households, those with 1 or 2 children have the highest poverty rate, with 10 households (3.5%) falling below the poverty line. Among the single-parent households, those with 3 or 4 children have the highest poverty rate, with 55 household (52.9%) living below poverty.
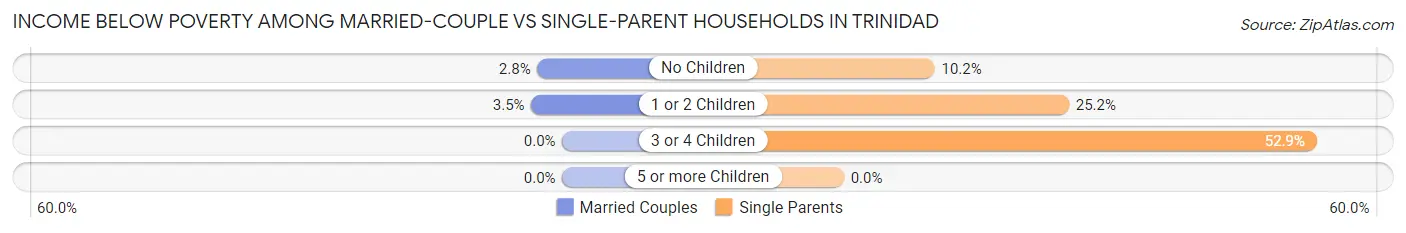
| Children | Married-Couple Families | Single-Parent Households |
| No Children | 25 (2.8%) | 39 (10.2%) |
| 1 or 2 Children | 10 (3.5%) | 118 (25.2%) |
| 3 or 4 Children | 0 (0.0%) | 55 (52.9%) |
| 5 or more Children | 0 (0.0%) | 0 (0.0%) |
| Total | 35 (2.8%) | 212 (22.2%) |
Race in Trinidad
The most populous races in Trinidad are White / Caucasian (5,970 | 71.6%), Hispanic or Latino (3,848 | 46.2%), and Two or more Races (1,609 | 19.3%).
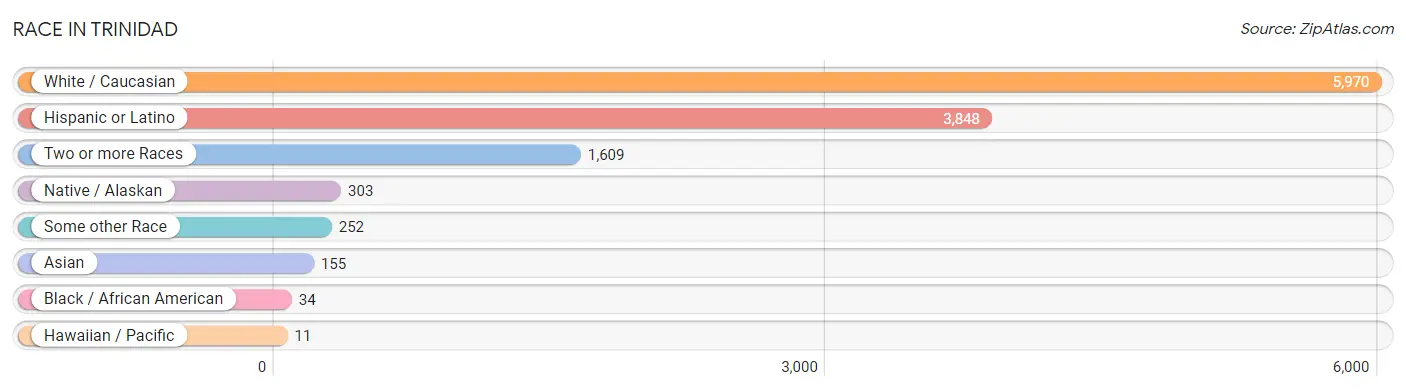
| Race | # Population | % Population |
| Asian | 155 | 1.9% |
| Black / African American | 34 | 0.4% |
| Hawaiian / Pacific | 11 | 0.1% |
| Hispanic or Latino | 3,848 | 46.2% |
| Native / Alaskan | 303 | 3.6% |
| White / Caucasian | 5,970 | 71.6% |
| Two or more Races | 1,609 | 19.3% |
| Some other Race | 252 | 3.0% |
| Total | 8,334 | 100.0% |
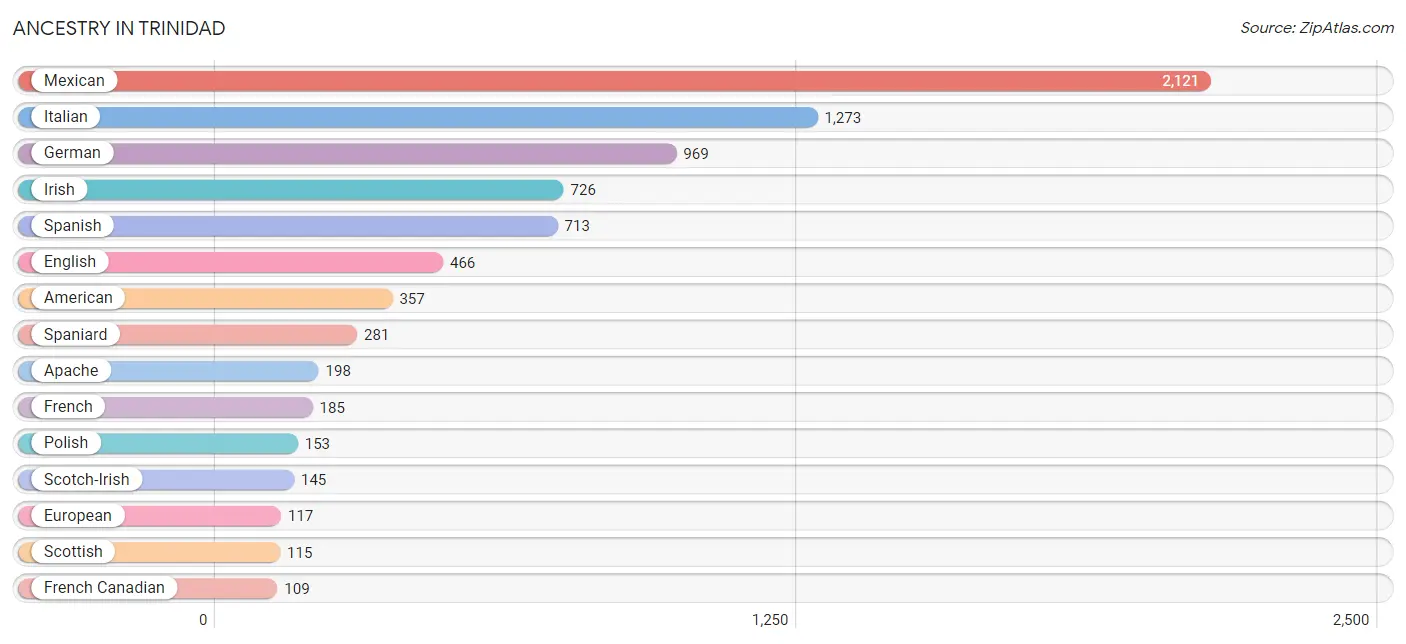
Ancestry in Trinidad
The most populous ancestries reported in Trinidad are Mexican (2,121 | 25.5%), Italian (1,273 | 15.3%), German (969 | 11.6%), Irish (726 | 8.7%), and Spanish (713 | 8.6%), together accounting for 69.6% of all Trinidad residents.
| Ancestry | # Population | % Population |
| American | 357 | 4.3% |
| Apache | 198 | 2.4% |
| Arab | 4 | 0.1% |
| Austrian | 25 | 0.3% |
| Belgian | 11 | 0.1% |
| Brazilian | 11 | 0.1% |
| British | 26 | 0.3% |
| Central American | 7 | 0.1% |
| Cherokee | 39 | 0.5% |
| Cheyenne | 5 | 0.1% |
| Comanche | 18 | 0.2% |
| Costa Rican | 7 | 0.1% |
| Cree | 15 | 0.2% |
| Croatian | 24 | 0.3% |
| Czech | 15 | 0.2% |
| Czechoslovakian | 2 | 0.0% |
| Danish | 11 | 0.1% |
| Dutch | 76 | 0.9% |
| Eastern European | 6 | 0.1% |
| English | 466 | 5.6% |
| European | 117 | 1.4% |
| Finnish | 7 | 0.1% |
| French | 185 | 2.2% |
| French Canadian | 109 | 1.3% |
| German | 969 | 11.6% |
| Greek | 28 | 0.3% |
| Indian (Asian) | 52 | 0.6% |
| Irish | 726 | 8.7% |
| Italian | 1,273 | 15.3% |
| Korean | 80 | 1.0% |
| Laotian | 21 | 0.3% |
| Lebanese | 4 | 0.1% |
| Mexican | 2,121 | 25.5% |
| Mexican American Indian | 10 | 0.1% |
| Mongolian | 20 | 0.2% |
| Native Hawaiian | 15 | 0.2% |
| Navajo | 56 | 0.7% |
| Northern European | 7 | 0.1% |
| Norwegian | 75 | 0.9% |
| Polish | 153 | 1.8% |
| Portuguese | 18 | 0.2% |
| Pueblo | 31 | 0.4% |
| Puerto Rican | 11 | 0.1% |
| Romanian | 8 | 0.1% |
| Russian | 21 | 0.3% |
| Samoan | 11 | 0.1% |
| Scandinavian | 31 | 0.4% |
| Scotch-Irish | 145 | 1.7% |
| Scottish | 115 | 1.4% |
| Seminole | 26 | 0.3% |
| Serbian | 7 | 0.1% |
| Slavic | 30 | 0.4% |
| Slovene | 8 | 0.1% |
| Spaniard | 281 | 3.4% |
| Spanish | 713 | 8.6% |
| Spanish American | 42 | 0.5% |
| Spanish American Indian | 15 | 0.2% |
| Sri Lankan | 4 | 0.1% |
| Swedish | 30 | 0.4% |
| Swiss | 34 | 0.4% |
| Thai | 4 | 0.1% |
| Ukrainian | 11 | 0.1% |
| Ute | 36 | 0.4% |
| Welsh | 7 | 0.1% |
| Yaqui | 10 | 0.1% | View All 65 Rows |
Immigrants in Trinidad
The most numerous immigrant groups reported in Trinidad came from Latin America (170 | 2.0%), Central America (134 | 1.6%), Mexico (127 | 1.5%), Asia (98 | 1.2%), and South Eastern Asia (75 | 0.9%), together accounting for 7.2% of all Trinidad residents.
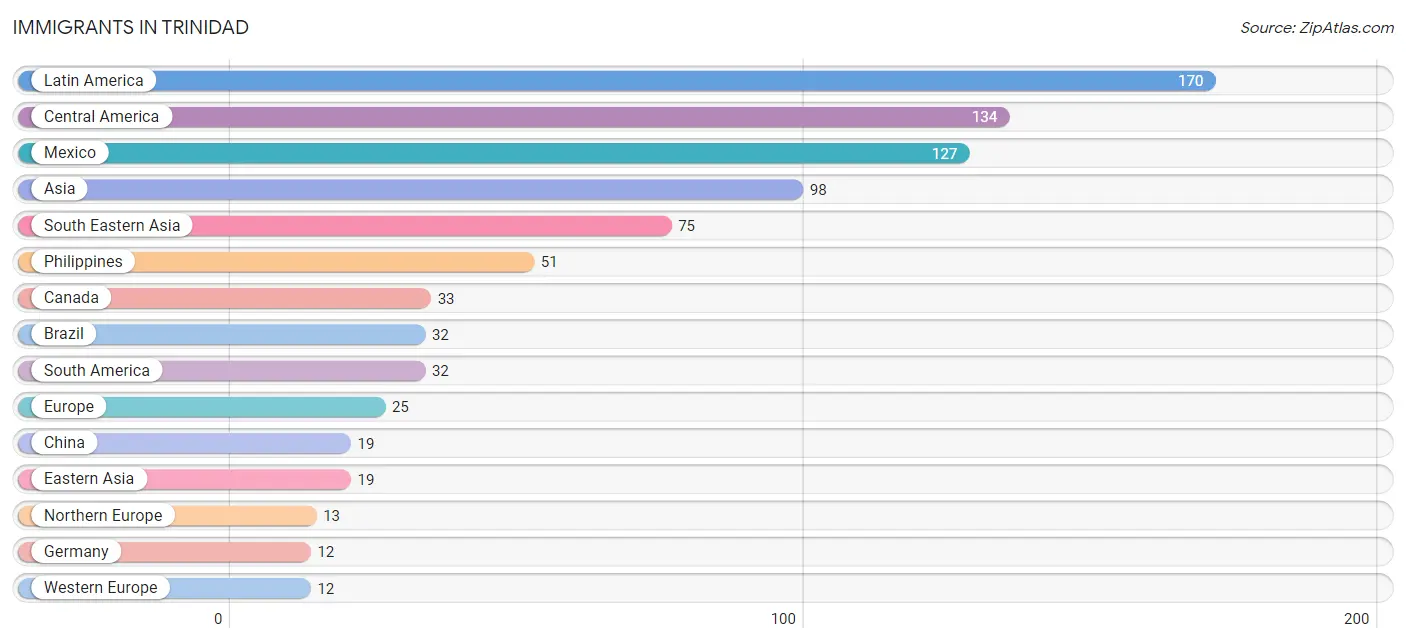
| Immigration Origin | # Population | % Population |
| Africa | 2 | 0.0% |
| Asia | 98 | 1.2% |
| Brazil | 32 | 0.4% |
| Canada | 33 | 0.4% |
| Caribbean | 4 | 0.1% |
| Central America | 134 | 1.6% |
| China | 19 | 0.2% |
| Costa Rica | 7 | 0.1% |
| Eastern Asia | 19 | 0.2% |
| Egypt | 2 | 0.0% |
| Europe | 25 | 0.3% |
| Germany | 12 | 0.1% |
| India | 4 | 0.1% |
| Jamaica | 4 | 0.1% |
| Latin America | 170 | 2.0% |
| Mexico | 127 | 1.5% |
| Northern Africa | 2 | 0.0% |
| Northern Europe | 13 | 0.2% |
| Philippines | 51 | 0.6% |
| South America | 32 | 0.4% |
| South Central Asia | 4 | 0.1% |
| South Eastern Asia | 75 | 0.9% |
| Vietnam | 4 | 0.1% |
| Western Europe | 12 | 0.1% | View All 24 Rows |
Sex and Age in Trinidad
Sex and Age in Trinidad
The most populous age groups in Trinidad are 65 to 69 Years (373 | 8.6%) for men and 65 to 69 Years (353 | 8.9%) for women.
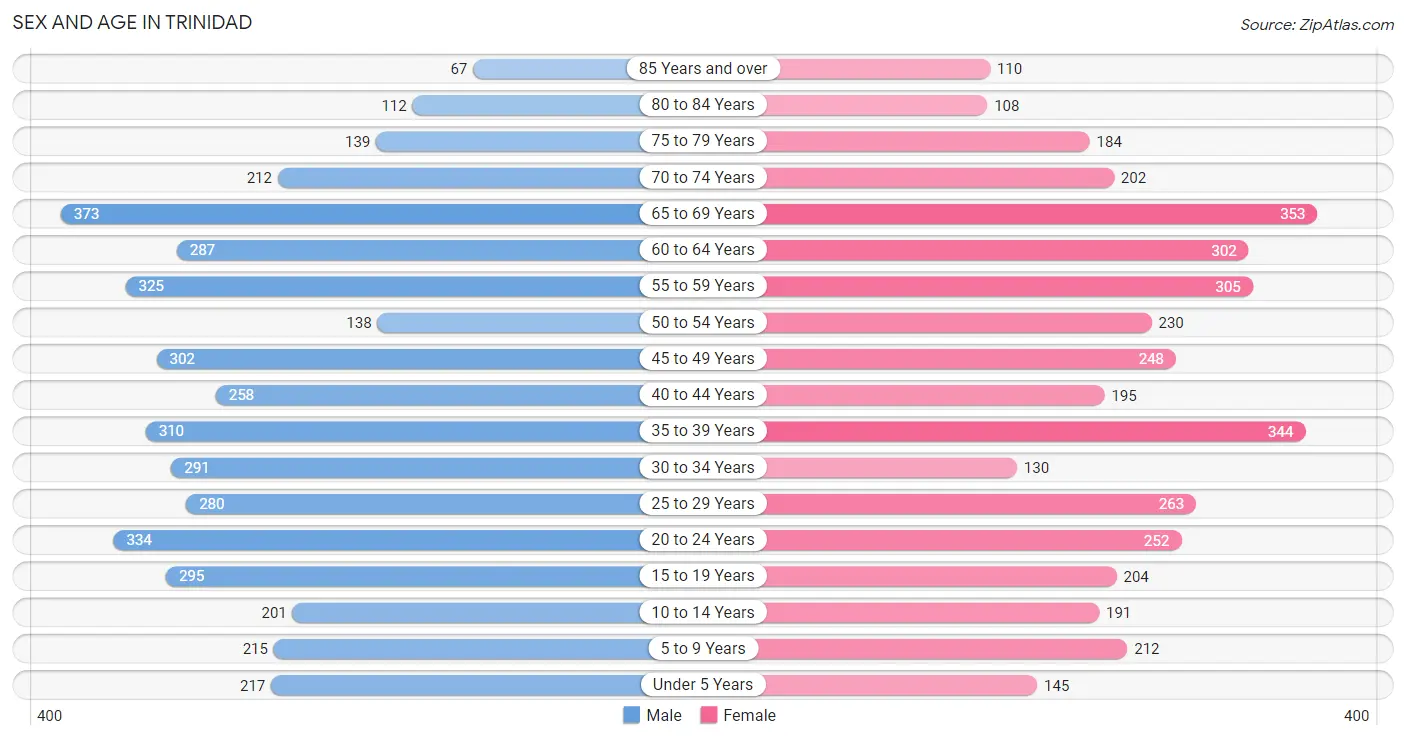
| Age Bracket | Male | Female |
| Under 5 Years | 217 (5.0%) | 145 (3.6%) |
| 5 to 9 Years | 215 (4.9%) | 212 (5.3%) |
| 10 to 14 Years | 201 (4.6%) | 191 (4.8%) |
| 15 to 19 Years | 295 (6.8%) | 204 (5.1%) |
| 20 to 24 Years | 334 (7.7%) | 252 (6.3%) |
| 25 to 29 Years | 280 (6.4%) | 263 (6.6%) |
| 30 to 34 Years | 291 (6.7%) | 130 (3.3%) |
| 35 to 39 Years | 310 (7.1%) | 344 (8.6%) |
| 40 to 44 Years | 258 (5.9%) | 195 (4.9%) |
| 45 to 49 Years | 302 (6.9%) | 248 (6.2%) |
| 50 to 54 Years | 138 (3.2%) | 230 (5.8%) |
| 55 to 59 Years | 325 (7.5%) | 305 (7.7%) |
| 60 to 64 Years | 287 (6.6%) | 302 (7.6%) |
| 65 to 69 Years | 373 (8.6%) | 353 (8.9%) |
| 70 to 74 Years | 212 (4.9%) | 202 (5.1%) |
| 75 to 79 Years | 139 (3.2%) | 184 (4.6%) |
| 80 to 84 Years | 112 (2.6%) | 108 (2.7%) |
| 85 Years and over | 67 (1.5%) | 110 (2.8%) |
| Total | 4,356 (100.0%) | 3,978 (100.0%) |
Families and Households in Trinidad
Median Family Size in Trinidad
The median family size in Trinidad is 2.54 persons per family, with married-couple families (1,239 | 56.4%) accounting for the largest median family size of 2.61 persons per family. On the other hand, single male/father families (180 | 8.2%) represent the smallest median family size with 2.22 persons per family.
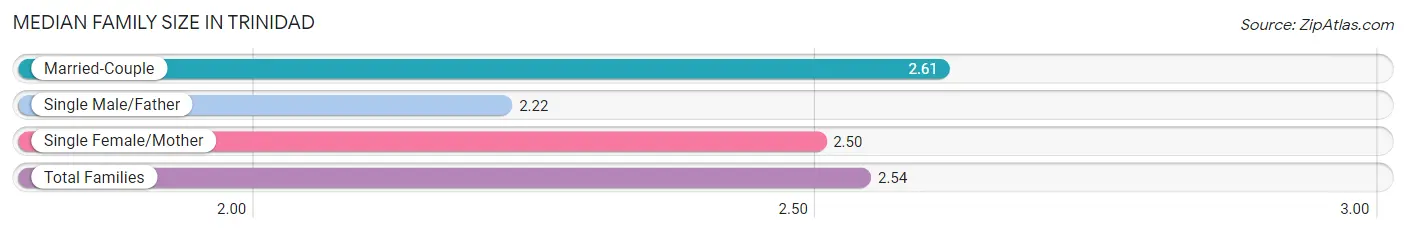
| Family Type | # Families | Family Size |
| Married-Couple | 1,239 (56.4%) | 2.61 |
| Single Male/Father | 180 (8.2%) | 2.22 |
| Single Female/Mother | 777 (35.4%) | 2.50 |
| Total Families | 2,196 (100.0%) | 2.54 |
Median Household Size in Trinidad
The median household size in Trinidad is 2.02 persons per household, with single female/mother households (777 | 19.8%) accounting for the largest median household size of 2.82 persons per household. non-family households (1,734 | 44.1%) represent the smallest median household size with 1.15 persons per household.
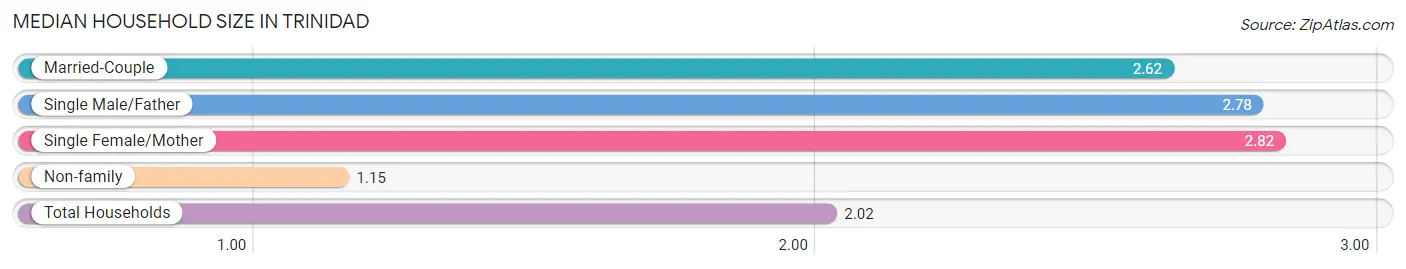
| Household Type | # Households | Household Size |
| Married-Couple | 1,239 (31.5%) | 2.62 |
| Single Male/Father | 180 (4.6%) | 2.78 |
| Single Female/Mother | 777 (19.8%) | 2.82 |
| Non-family | 1,734 (44.1%) | 1.15 |
| Total Households | 3,930 (100.0%) | 2.02 |
Household Size by Marriage Status in Trinidad
Out of a total of 3,930 households in Trinidad, 2,196 (55.9%) are family households, while 1,734 (44.1%) are nonfamily households. The most numerous type of family households are 2-person households, comprising 1,151, and the most common type of nonfamily households are 1-person households, comprising 1,505.
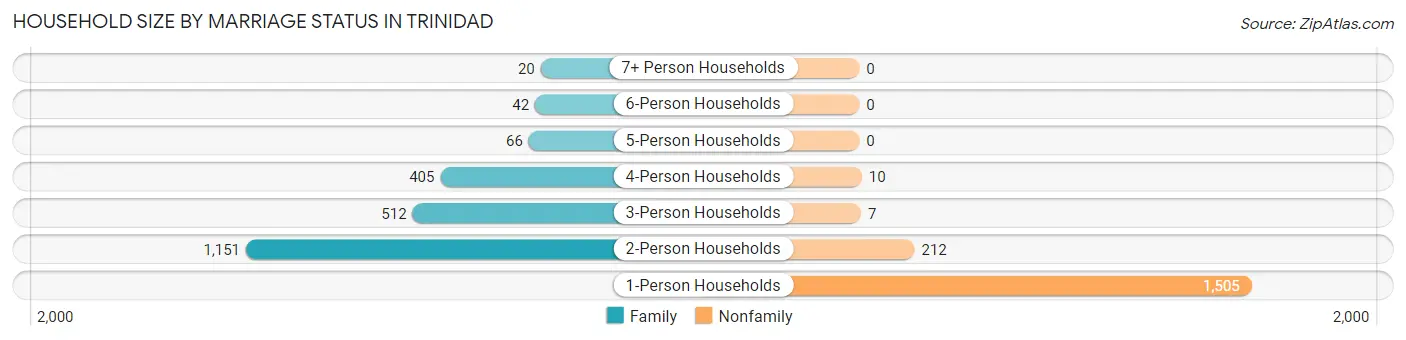
| Household Size | Family Households | Nonfamily Households |
| 1-Person Households | - | 1,505 (38.3%) |
| 2-Person Households | 1,151 (29.3%) | 212 (5.4%) |
| 3-Person Households | 512 (13.0%) | 7 (0.2%) |
| 4-Person Households | 405 (10.3%) | 10 (0.3%) |
| 5-Person Households | 66 (1.7%) | 0 (0.0%) |
| 6-Person Households | 42 (1.1%) | 0 (0.0%) |
| 7+ Person Households | 20 (0.5%) | 0 (0.0%) |
| Total | 2,196 (55.9%) | 1,734 (44.1%) |
Female Fertility in Trinidad
Fertility by Age in Trinidad
Average fertility rate in Trinidad is 31.0 births per 1,000 women. Women in the age bracket of 20 to 34 years have the highest fertility rate with 74.0 births per 1,000 women. Women in the age bracket of 20 to 34 years acount for 92.3% of all women with births.
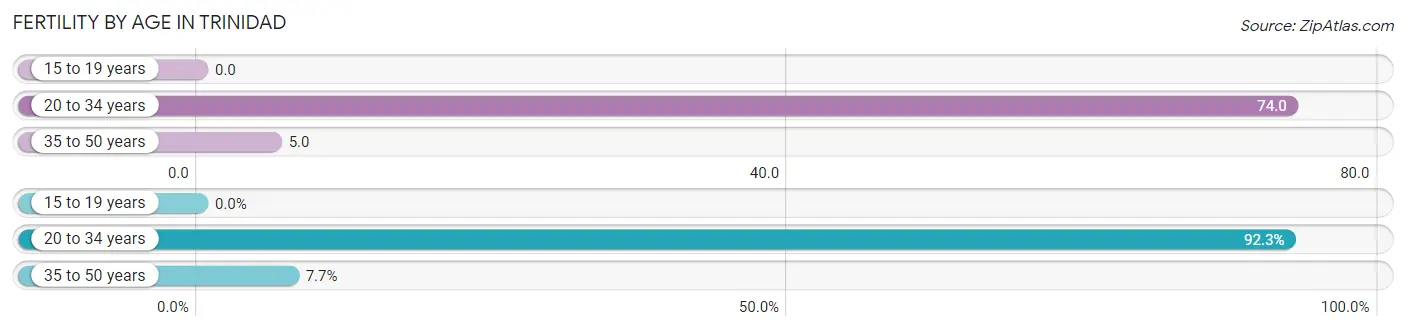
| Age Bracket | Women with Births | Births / 1,000 Women |
| 15 to 19 years | 0 (0.0%) | 0.0 |
| 20 to 34 years | 48 (92.3%) | 74.0 |
| 35 to 50 years | 4 (7.7%) | 5.0 |
| Total | 52 (100.0%) | 31.0 |
Fertility by Age by Marriage Status in Trinidad
57.7% of women with births (52) in Trinidad are married. The highest percentage of unmarried women with births falls into 20 to 34 years age bracket with 45.8% of them unmarried at the time of birth, while the lowest percentage of unmarried women with births belong to 35 to 50 years age bracket with 0.0% of them unmarried.
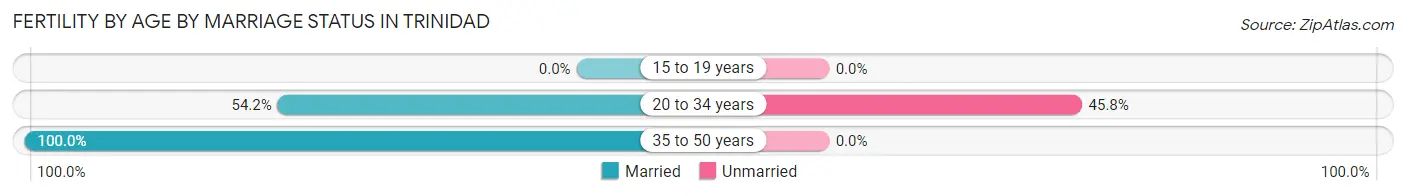
| Age Bracket | Married | Unmarried |
| 15 to 19 years | 0 (0.0%) | 0 (0.0%) |
| 20 to 34 years | 26 (54.2%) | 22 (45.8%) |
| 35 to 50 years | 4 (100.0%) | 0 (0.0%) |
| Total | 30 (57.7%) | 22 (42.3%) |
Fertility by Education in Trinidad
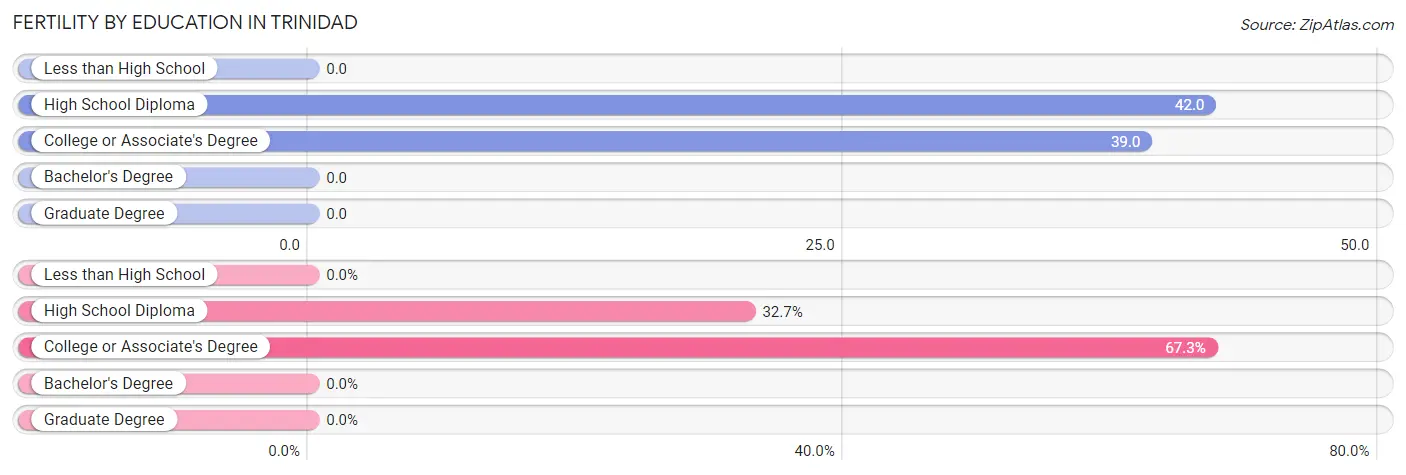
| Educational Attainment | Women with Births | Births / 1,000 Women |
| Less than High School | 0 (0.0%) | 0.0 |
| High School Diploma | 17 (32.7%) | 42.0 |
| College or Associate's Degree | 35 (67.3%) | 39.0 |
| Bachelor's Degree | 0 (0.0%) | 0.0 |
| Graduate Degree | 0 (0.0%) | 0.0 |
| Total | 52 (100.0%) | 31.0 |
Fertility by Education by Marriage Status in Trinidad
42.3% of women with births in Trinidad are unmarried. Women with the educational attainment of college or associate's degree are most likely to be married with 85.7% of them married at childbirth, while women with the educational attainment of high school diploma are least likely to be married with 100.0% of them unmarried at childbirth.
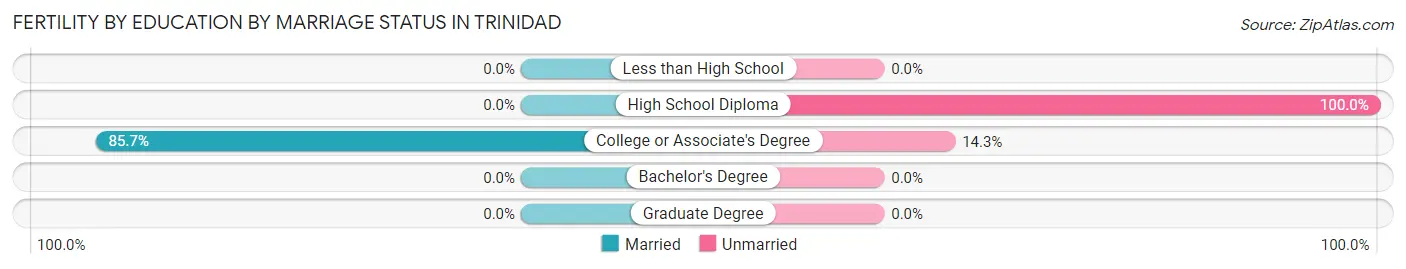
| Educational Attainment | Married | Unmarried |
| Less than High School | 0 (0.0%) | 0 (0.0%) |
| High School Diploma | 0 (0.0%) | 17 (100.0%) |
| College or Associate's Degree | 30 (85.7%) | 5 (14.3%) |
| Bachelor's Degree | 0 (0.0%) | 0 (0.0%) |
| Graduate Degree | 0 (0.0%) | 0 (0.0%) |
| Total | 30 (57.7%) | 22 (42.3%) |
Employment Characteristics in Trinidad
Employment by Class of Employer in Trinidad
Among the 3,628 employed individuals in Trinidad, private company employees (2,137 | 58.9%), local government employees (500 | 13.8%), and self-employed (not incorporated) (275 | 7.6%) make up the most common classes of employment.
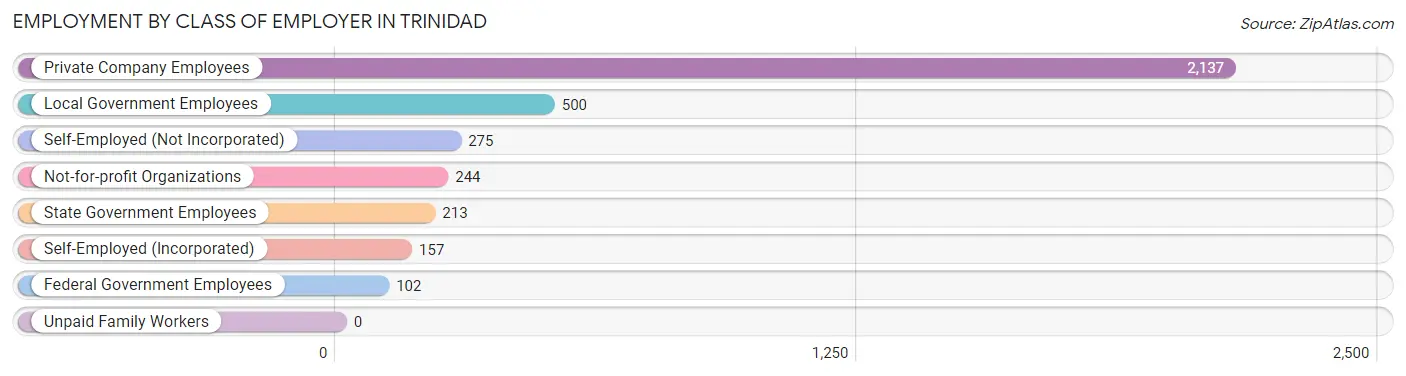
| Employer Class | # Employees | % Employees |
| Private Company Employees | 2,137 | 58.9% |
| Self-Employed (Incorporated) | 157 | 4.3% |
| Self-Employed (Not Incorporated) | 275 | 7.6% |
| Not-for-profit Organizations | 244 | 6.7% |
| Local Government Employees | 500 | 13.8% |
| State Government Employees | 213 | 5.9% |
| Federal Government Employees | 102 | 2.8% |
| Unpaid Family Workers | 0 | 0.0% |
| Total | 3,628 | 100.0% |
Employment Status by Age in Trinidad
According to the labor force statistics for Trinidad, out of the total population over 16 years of age (7,093), 57.4% or 4,071 individuals are in the labor force, with 8.2% or 334 of them unemployed. The age group with the highest labor force participation rate is 45 to 54 years, with 89.4% or 821 individuals in the labor force. Within the labor force, the 16 to 19 years age range has the highest percentage of unemployed individuals, with 26.5% or 49 of them being unemployed.
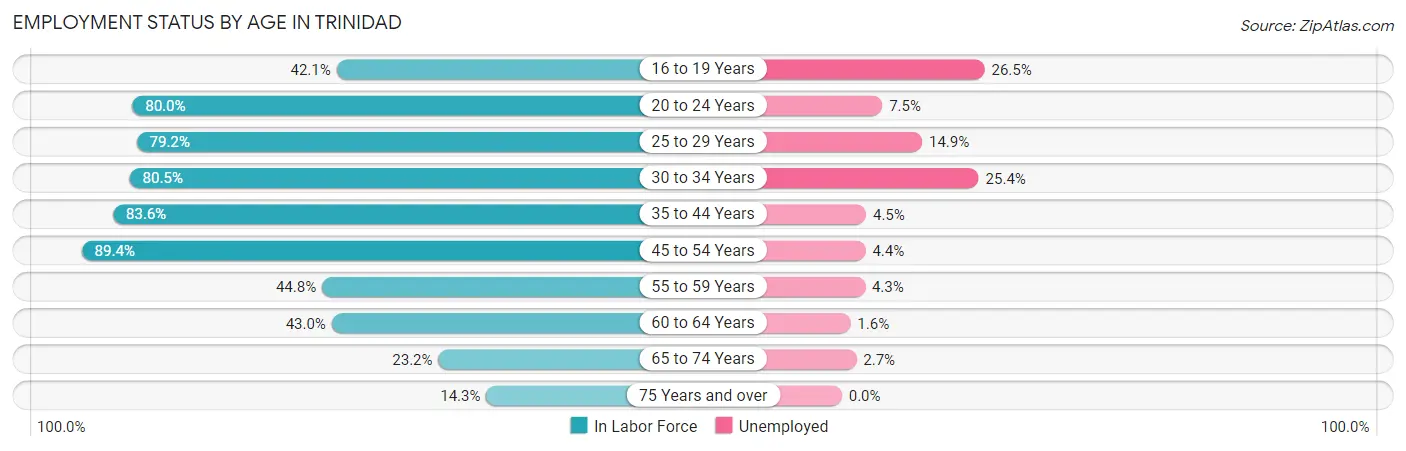
| Age Bracket | In Labor Force | Unemployed |
| 16 to 19 Years | 185 (42.1%) | 49 (26.5%) |
| 20 to 24 Years | 469 (80.0%) | 35 (7.5%) |
| 25 to 29 Years | 430 (79.2%) | 64 (14.9%) |
| 30 to 34 Years | 339 (80.5%) | 86 (25.4%) |
| 35 to 44 Years | 925 (83.6%) | 42 (4.5%) |
| 45 to 54 Years | 821 (89.4%) | 36 (4.4%) |
| 55 to 59 Years | 282 (44.8%) | 12 (4.3%) |
| 60 to 64 Years | 253 (43.0%) | 4 (1.6%) |
| 65 to 74 Years | 264 (23.2%) | 7 (2.7%) |
| 75 Years and over | 103 (14.3%) | 0 (0.0%) |
| Total | 4,071 (57.4%) | 334 (8.2%) |
Employment Status by Educational Attainment in Trinidad
According to labor force statistics for Trinidad, 72.5% of individuals (3,051) out of the total population between 25 and 64 years of age (4,208) are in the labor force, with 8.0% or 244 of them being unemployed. The group with the highest labor force participation rate are those with the educational attainment of bachelor's degree or higher, with 84.4% or 394 individuals in the labor force. Within the labor force, individuals with less than high school education have the highest percentage of unemployment, with 30.1% or 65 of them being unemployed.
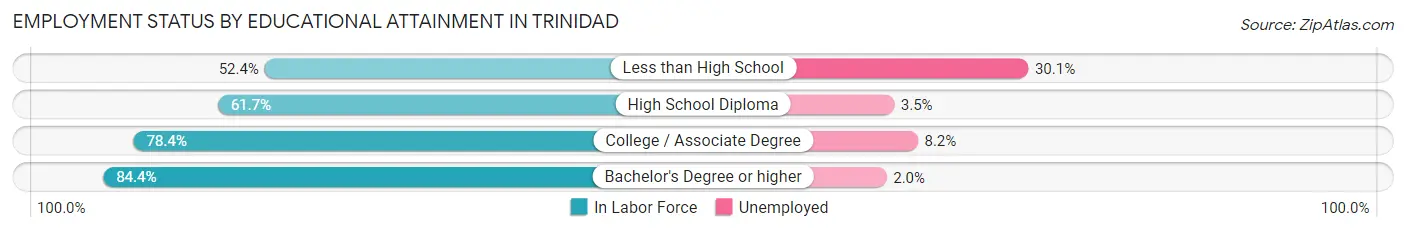
| Educational Attainment | In Labor Force | Unemployed |
| Less than High School | 216 (52.4%) | 124 (30.1%) |
| High School Diploma | 622 (61.7%) | 35 (3.5%) |
| College / Associate Degree | 1,820 (78.4%) | 190 (8.2%) |
| Bachelor's Degree or higher | 394 (84.4%) | 9 (2.0%) |
| Total | 3,051 (72.5%) | 337 (8.0%) |
Employment Occupations by Sex in Trinidad
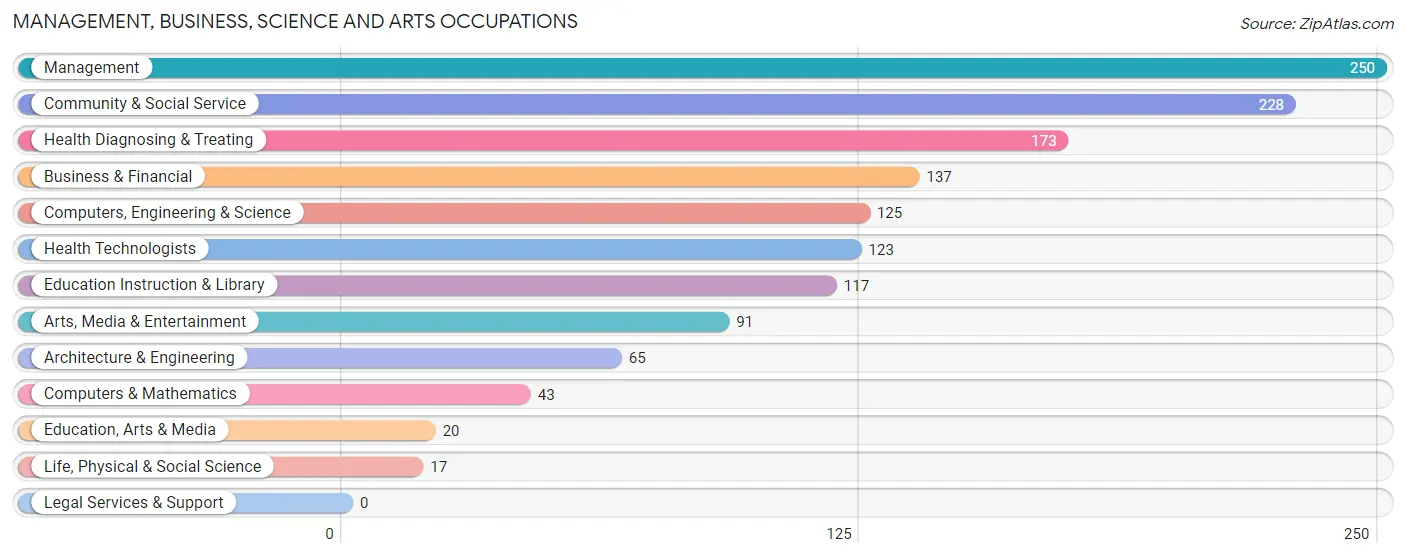
Management, Business, Science and Arts Occupations
The most common Management, Business, Science and Arts occupations in Trinidad are Management (250 | 6.7%), Community & Social Service (228 | 6.1%), Health Diagnosing & Treating (173 | 4.6%), Business & Financial (137 | 3.7%), and Computers, Engineering & Science (125 | 3.3%).
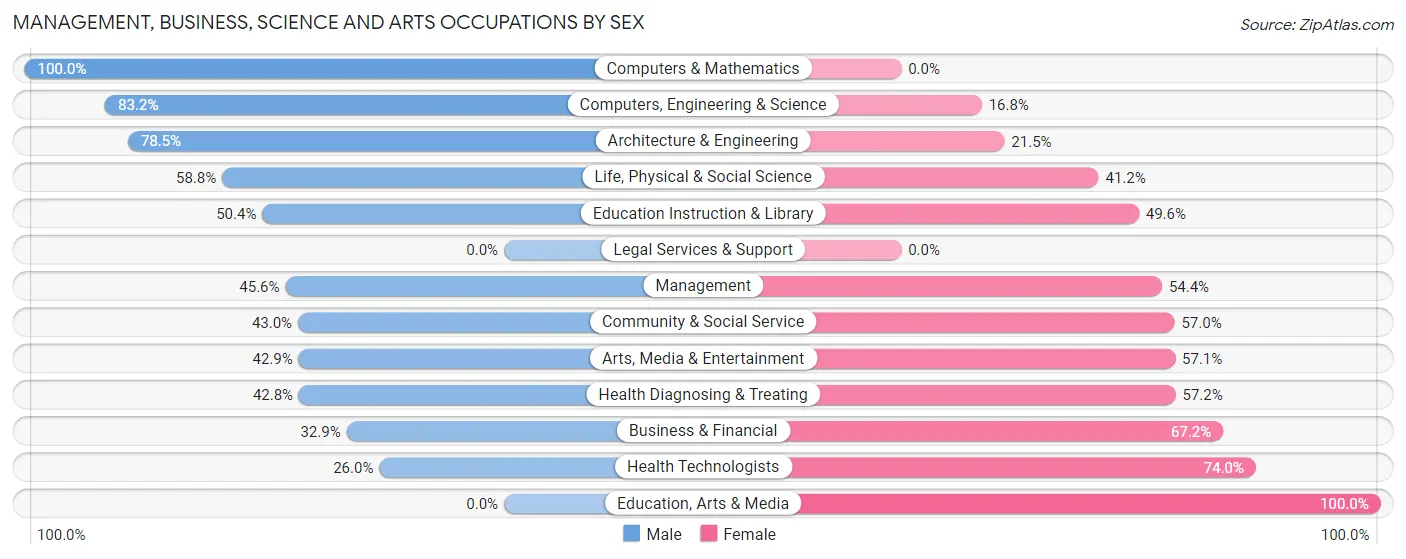
Management, Business, Science and Arts Occupations by Sex
Within the Management, Business, Science and Arts occupations in Trinidad, the most male-oriented occupations are Computers & Mathematics (100.0%), Computers, Engineering & Science (83.2%), and Architecture & Engineering (78.5%), while the most female-oriented occupations are Education, Arts & Media (100.0%), Health Technologists (74.0%), and Business & Financial (67.1%).
| Occupation | Male | Female |
| Management | 114 (45.6%) | 136 (54.4%) |
| Business & Financial | 45 (32.9%) | 92 (67.1%) |
| Computers, Engineering & Science | 104 (83.2%) | 21 (16.8%) |
| Computers & Mathematics | 43 (100.0%) | 0 (0.0%) |
| Architecture & Engineering | 51 (78.5%) | 14 (21.5%) |
| Life, Physical & Social Science | 10 (58.8%) | 7 (41.2%) |
| Community & Social Service | 98 (43.0%) | 130 (57.0%) |
| Education, Arts & Media | 0 (0.0%) | 20 (100.0%) |
| Legal Services & Support | 0 (0.0%) | 0 (0.0%) |
| Education Instruction & Library | 59 (50.4%) | 58 (49.6%) |
| Arts, Media & Entertainment | 39 (42.9%) | 52 (57.1%) |
| Health Diagnosing & Treating | 74 (42.8%) | 99 (57.2%) |
| Health Technologists | 32 (26.0%) | 91 (74.0%) |
| Total (Category) | 435 (47.6%) | 478 (52.3%) |
| Total (Overall) | 2,026 (54.2%) | 1,711 (45.8%) |
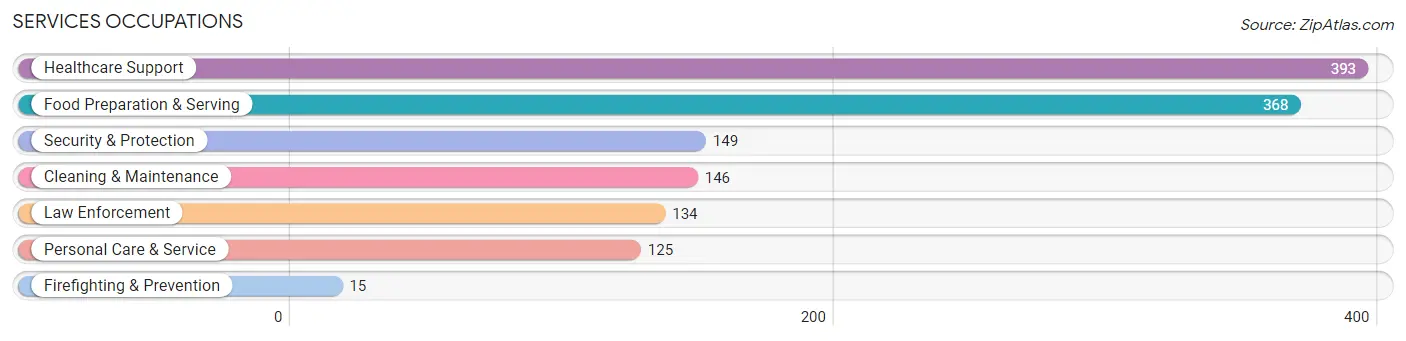
Services Occupations
The most common Services occupations in Trinidad are Healthcare Support (393 | 10.5%), Food Preparation & Serving (368 | 9.9%), Security & Protection (149 | 4.0%), Cleaning & Maintenance (146 | 3.9%), and Law Enforcement (134 | 3.6%).
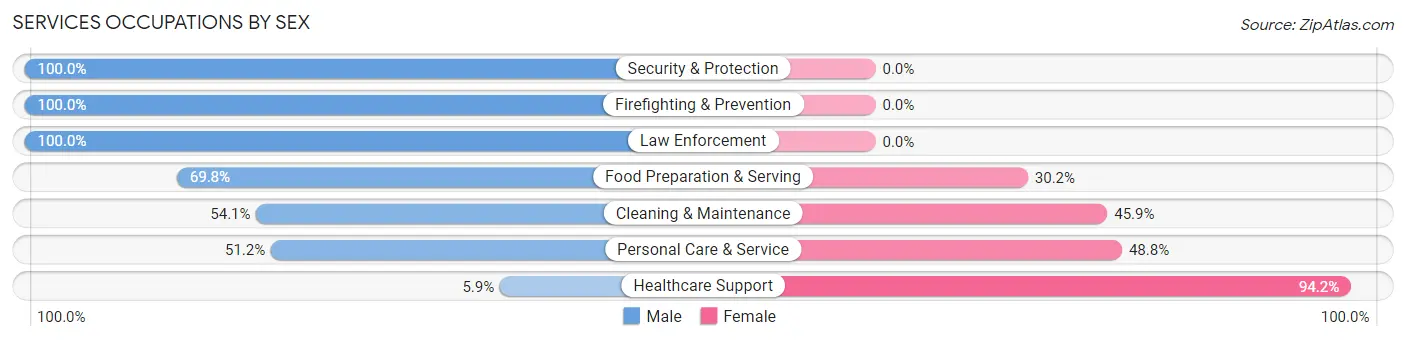
Services Occupations by Sex
Within the Services occupations in Trinidad, the most male-oriented occupations are Security & Protection (100.0%), Firefighting & Prevention (100.0%), and Law Enforcement (100.0%), while the most female-oriented occupations are Healthcare Support (94.2%), Personal Care & Service (48.8%), and Cleaning & Maintenance (45.9%).
| Occupation | Male | Female |
| Healthcare Support | 23 (5.9%) | 370 (94.2%) |
| Security & Protection | 149 (100.0%) | 0 (0.0%) |
| Firefighting & Prevention | 15 (100.0%) | 0 (0.0%) |
| Law Enforcement | 134 (100.0%) | 0 (0.0%) |
| Food Preparation & Serving | 257 (69.8%) | 111 (30.2%) |
| Cleaning & Maintenance | 79 (54.1%) | 67 (45.9%) |
| Personal Care & Service | 64 (51.2%) | 61 (48.8%) |
| Total (Category) | 572 (48.4%) | 609 (51.6%) |
| Total (Overall) | 2,026 (54.2%) | 1,711 (45.8%) |
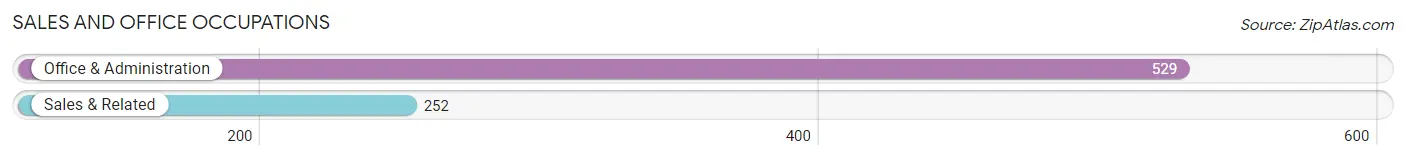
Sales and Office Occupations
The most common Sales and Office occupations in Trinidad are Office & Administration (529 | 14.2%), and Sales & Related (252 | 6.7%).
Sales and Office Occupations by Sex
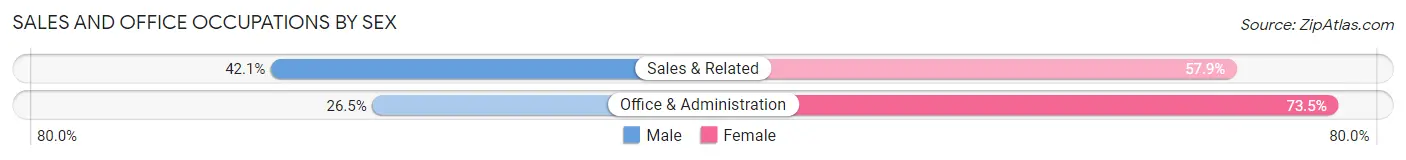
| Occupation | Male | Female |
| Sales & Related | 106 (42.1%) | 146 (57.9%) |
| Office & Administration | 140 (26.5%) | 389 (73.5%) |
| Total (Category) | 246 (31.5%) | 535 (68.5%) |
| Total (Overall) | 2,026 (54.2%) | 1,711 (45.8%) |
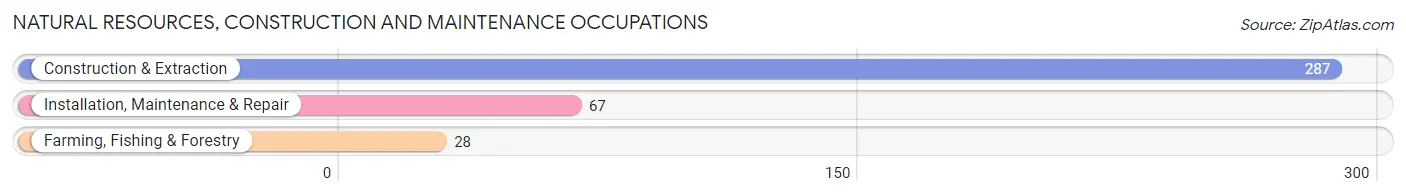
Natural Resources, Construction and Maintenance Occupations
The most common Natural Resources, Construction and Maintenance occupations in Trinidad are Construction & Extraction (287 | 7.7%), Installation, Maintenance & Repair (67 | 1.8%), and Farming, Fishing & Forestry (28 | 0.7%).
Natural Resources, Construction and Maintenance Occupations by Sex
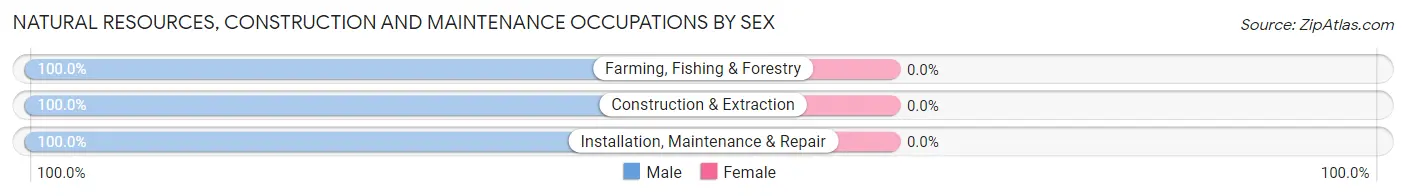
| Occupation | Male | Female |
| Farming, Fishing & Forestry | 28 (100.0%) | 0 (0.0%) |
| Construction & Extraction | 287 (100.0%) | 0 (0.0%) |
| Installation, Maintenance & Repair | 67 (100.0%) | 0 (0.0%) |
| Total (Category) | 382 (100.0%) | 0 (0.0%) |
| Total (Overall) | 2,026 (54.2%) | 1,711 (45.8%) |
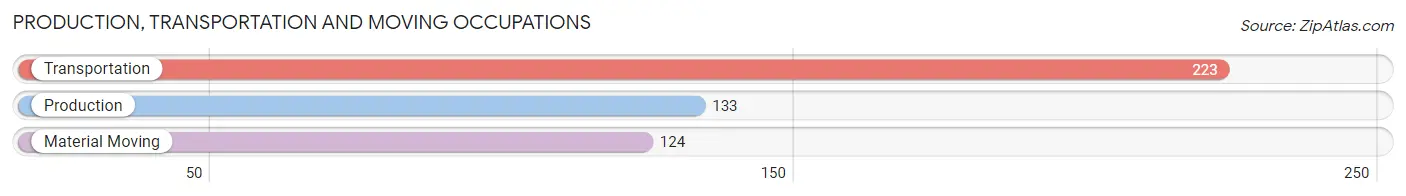
Production, Transportation and Moving Occupations
The most common Production, Transportation and Moving occupations in Trinidad are Transportation (223 | 6.0%), Production (133 | 3.6%), and Material Moving (124 | 3.3%).
Production, Transportation and Moving Occupations by Sex
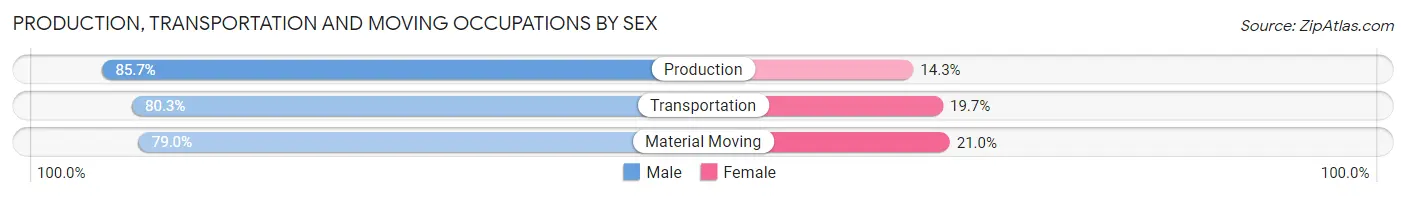
| Occupation | Male | Female |
| Production | 114 (85.7%) | 19 (14.3%) |
| Transportation | 179 (80.3%) | 44 (19.7%) |
| Material Moving | 98 (79.0%) | 26 (21.0%) |
| Total (Category) | 391 (81.5%) | 89 (18.5%) |
| Total (Overall) | 2,026 (54.2%) | 1,711 (45.8%) |
Employment Industries by Sex in Trinidad
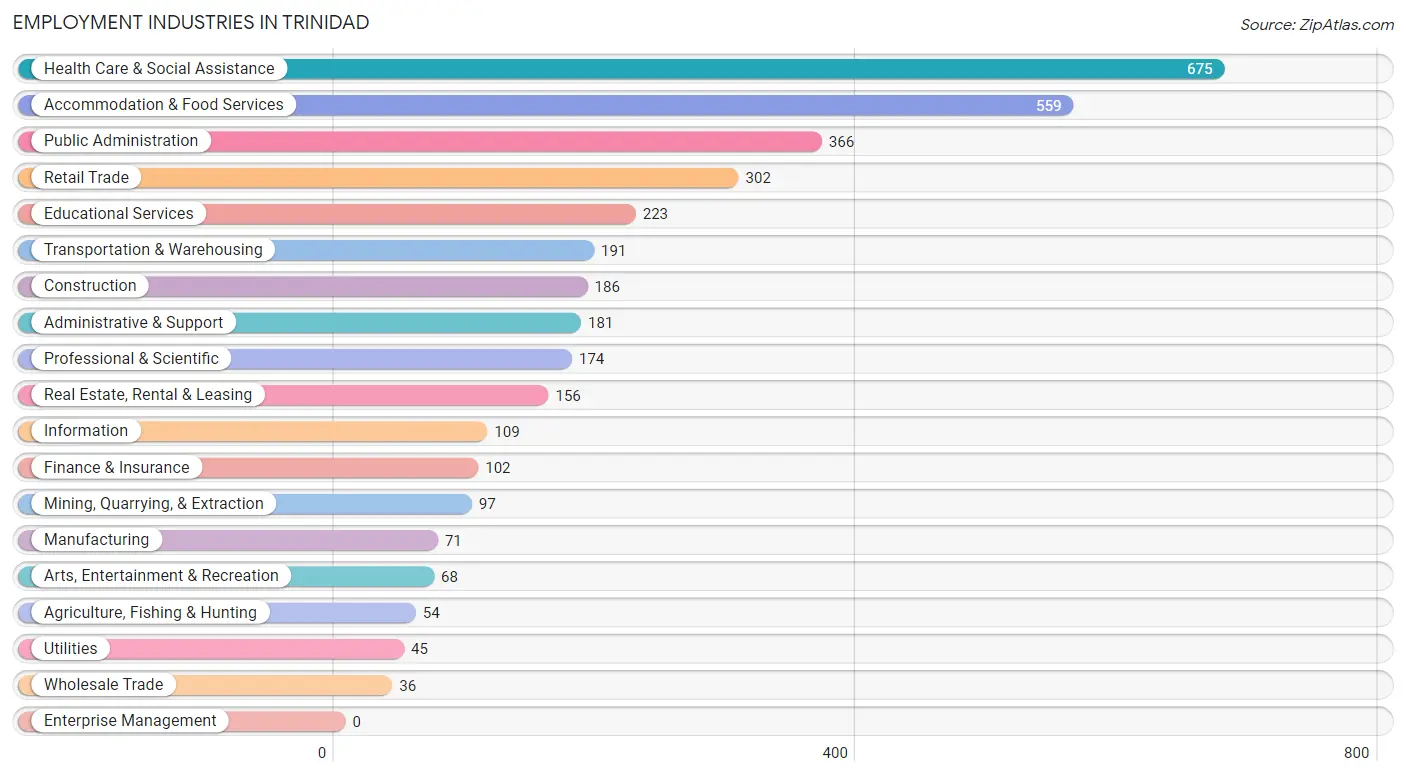
Employment Industries in Trinidad
The major employment industries in Trinidad include Health Care & Social Assistance (675 | 18.1%), Accommodation & Food Services (559 | 15.0%), Public Administration (366 | 9.8%), Retail Trade (302 | 8.1%), and Educational Services (223 | 6.0%).
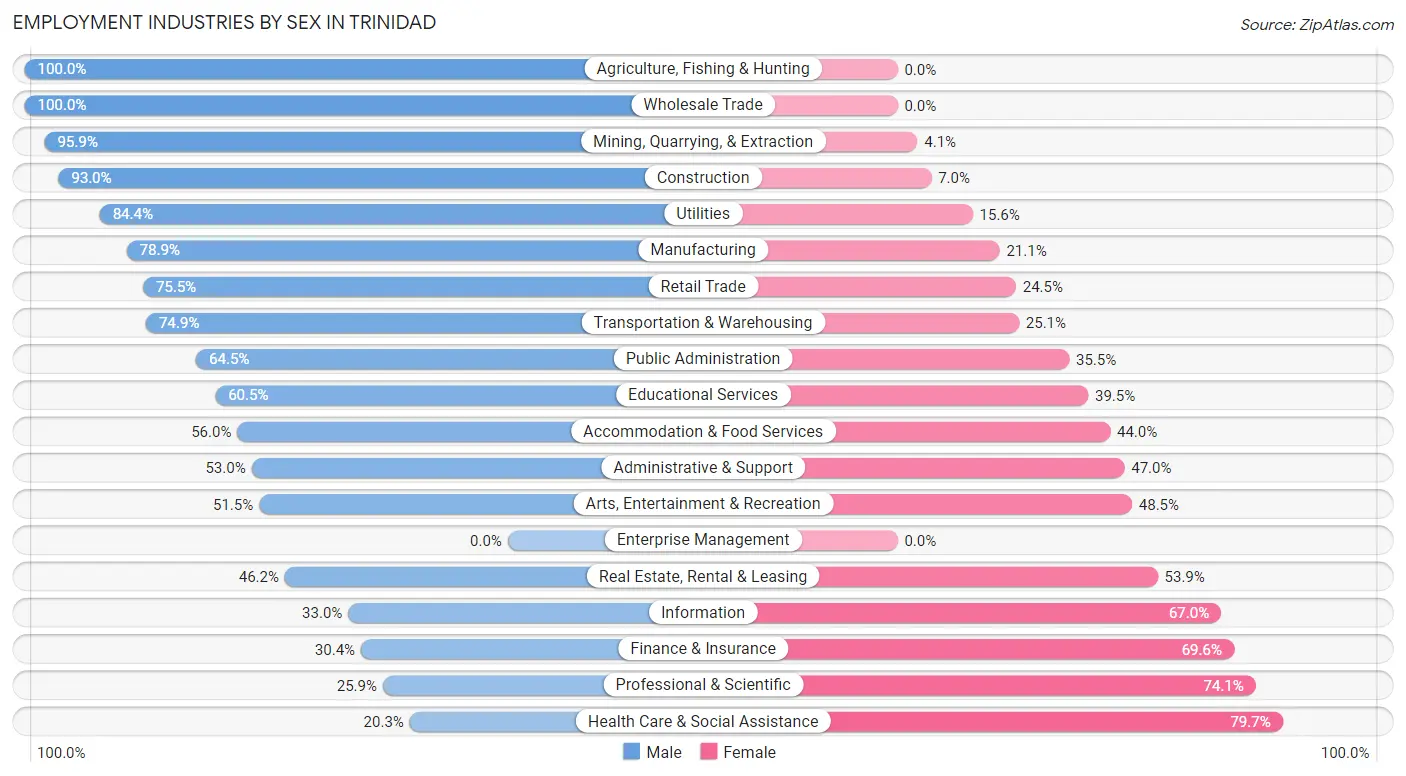
Employment Industries by Sex in Trinidad
The Trinidad industries that see more men than women are Agriculture, Fishing & Hunting (100.0%), Wholesale Trade (100.0%), and Mining, Quarrying, & Extraction (95.9%), whereas the industries that tend to have a higher number of women are Health Care & Social Assistance (79.7%), Professional & Scientific (74.1%), and Finance & Insurance (69.6%).
| Industry | Male | Female |
| Agriculture, Fishing & Hunting | 54 (100.0%) | 0 (0.0%) |
| Mining, Quarrying, & Extraction | 93 (95.9%) | 4 (4.1%) |
| Construction | 173 (93.0%) | 13 (7.0%) |
| Manufacturing | 56 (78.9%) | 15 (21.1%) |
| Wholesale Trade | 36 (100.0%) | 0 (0.0%) |
| Retail Trade | 228 (75.5%) | 74 (24.5%) |
| Transportation & Warehousing | 143 (74.9%) | 48 (25.1%) |
| Utilities | 38 (84.4%) | 7 (15.6%) |
| Information | 36 (33.0%) | 73 (67.0%) |
| Finance & Insurance | 31 (30.4%) | 71 (69.6%) |
| Real Estate, Rental & Leasing | 72 (46.2%) | 84 (53.8%) |
| Professional & Scientific | 45 (25.9%) | 129 (74.1%) |
| Enterprise Management | 0 (0.0%) | 0 (0.0%) |
| Administrative & Support | 96 (53.0%) | 85 (47.0%) |
| Educational Services | 135 (60.5%) | 88 (39.5%) |
| Health Care & Social Assistance | 137 (20.3%) | 538 (79.7%) |
| Arts, Entertainment & Recreation | 35 (51.5%) | 33 (48.5%) |
| Accommodation & Food Services | 313 (56.0%) | 246 (44.0%) |
| Public Administration | 236 (64.5%) | 130 (35.5%) |
| Total | 2,026 (54.2%) | 1,711 (45.8%) |
Education in Trinidad
School Enrollment in Trinidad
The most common levels of schooling among the 1,887 students in Trinidad are college / undergraduate (661 | 35.0%), elementary school (376 | 19.9%), and high school (369 | 19.6%).
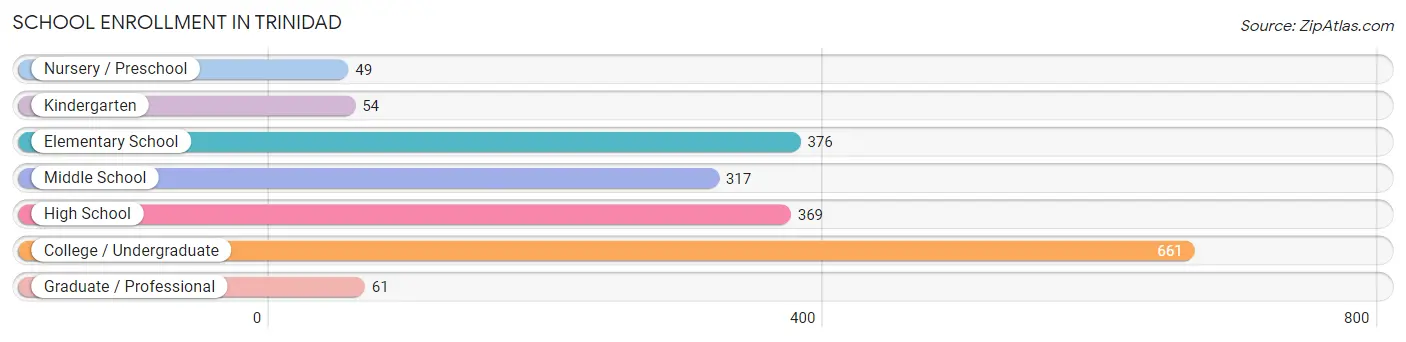
| School Level | # Students | % Students |
| Nursery / Preschool | 49 | 2.6% |
| Kindergarten | 54 | 2.9% |
| Elementary School | 376 | 19.9% |
| Middle School | 317 | 16.8% |
| High School | 369 | 19.6% |
| College / Undergraduate | 661 | 35.0% |
| Graduate / Professional | 61 | 3.2% |
| Total | 1,887 | 100.0% |
School Enrollment by Age by Funding Source in Trinidad
Out of a total of 1,887 students who are enrolled in schools in Trinidad, 187 (9.9%) attend a private institution, while the remaining 1,700 (90.1%) are enrolled in public schools. The age group of 25 to 34 year olds has the highest likelihood of being enrolled in private schools, with 34 (23.6% in the age bracket) enrolled. Conversely, the age group of 3 to 4 year olds has the lowest likelihood of being enrolled in a private school, with 13 (100.0% in the age bracket) attending a public institution.
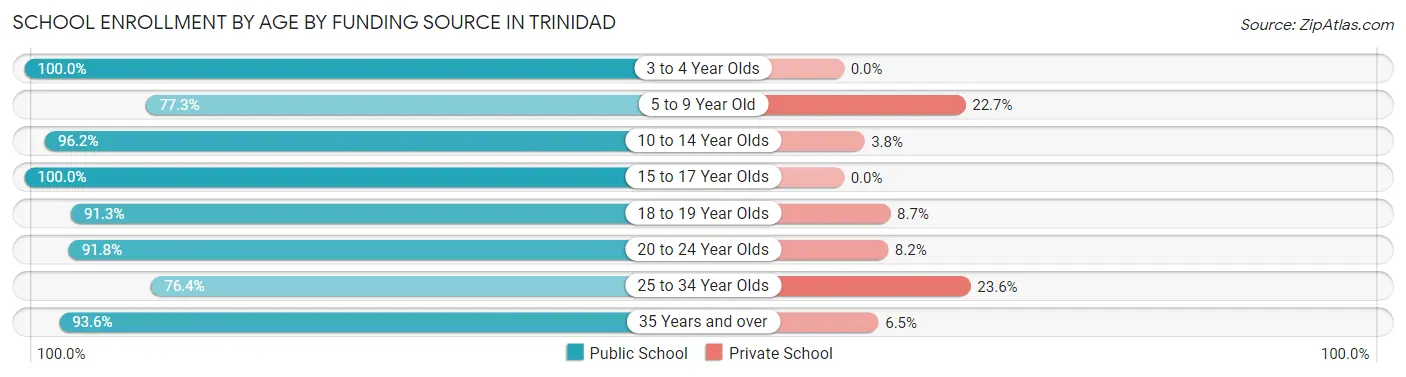
| Age Bracket | Public School | Private School |
| 3 to 4 Year Olds | 13 (100.0%) | 0 (0.0%) |
| 5 to 9 Year Old | 314 (77.3%) | 92 (22.7%) |
| 10 to 14 Year Olds | 377 (96.2%) | 15 (3.8%) |
| 15 to 17 Year Olds | 333 (100.0%) | 0 (0.0%) |
| 18 to 19 Year Olds | 116 (91.3%) | 11 (8.7%) |
| 20 to 24 Year Olds | 234 (91.8%) | 21 (8.2%) |
| 25 to 34 Year Olds | 110 (76.4%) | 34 (23.6%) |
| 35 Years and over | 203 (93.5%) | 14 (6.5%) |
| Total | 1,700 (90.1%) | 187 (9.9%) |
Educational Attainment by Field of Study in Trinidad
Education (183 | 19.3%), business (138 | 14.6%), social sciences (100 | 10.6%), arts & humanities (89 | 9.4%), and psychology (76 | 8.0%) are the most common fields of study among 947 individuals in Trinidad who have obtained a bachelor's degree or higher.
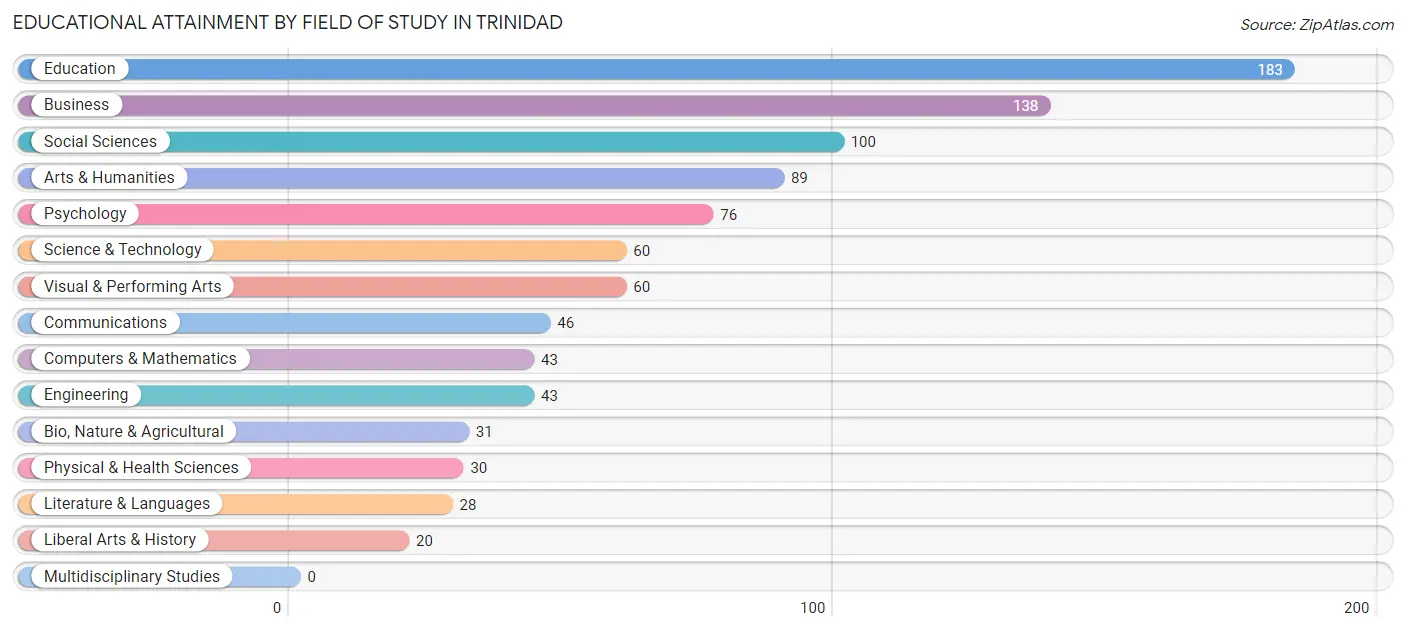
| Field of Study | # Graduates | % Graduates |
| Computers & Mathematics | 43 | 4.5% |
| Bio, Nature & Agricultural | 31 | 3.3% |
| Physical & Health Sciences | 30 | 3.2% |
| Psychology | 76 | 8.0% |
| Social Sciences | 100 | 10.6% |
| Engineering | 43 | 4.5% |
| Multidisciplinary Studies | 0 | 0.0% |
| Science & Technology | 60 | 6.3% |
| Business | 138 | 14.6% |
| Education | 183 | 19.3% |
| Literature & Languages | 28 | 3.0% |
| Liberal Arts & History | 20 | 2.1% |
| Visual & Performing Arts | 60 | 6.3% |
| Communications | 46 | 4.9% |
| Arts & Humanities | 89 | 9.4% |
| Total | 947 | 100.0% |
Transportation & Commute in Trinidad
Vehicle Availability by Sex in Trinidad
The most prevalent vehicle ownership categories in Trinidad are males with 2 vehicles (845, accounting for 44.5%) and females with 2 vehicles (730, making up 50.0%).
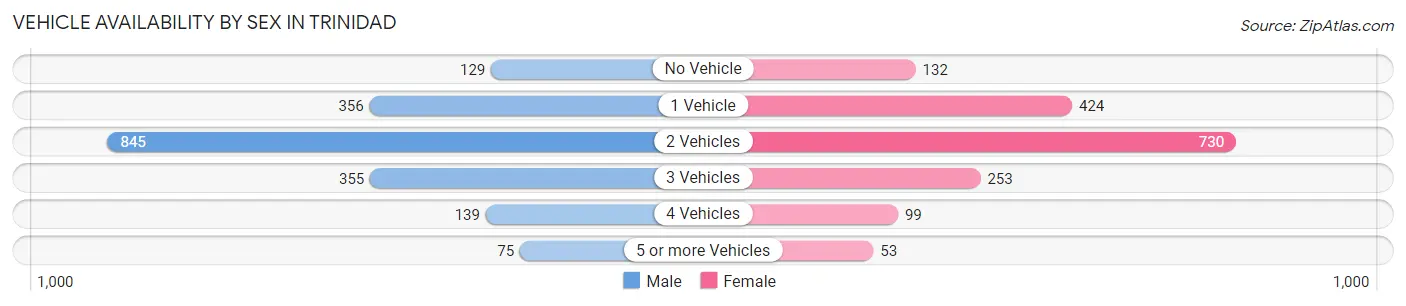
| Vehicles Available | Male | Female |
| No Vehicle | 129 (6.8%) | 132 (7.8%) |
| 1 Vehicle | 356 (18.8%) | 424 (25.1%) |
| 2 Vehicles | 845 (44.5%) | 730 (43.2%) |
| 3 Vehicles | 355 (18.7%) | 253 (15.0%) |
| 4 Vehicles | 139 (7.3%) | 99 (5.9%) |
| 5 or more Vehicles | 75 (4.0%) | 53 (3.1%) |
| Total | 1,899 (100.0%) | 1,691 (100.0%) |
Commute Time in Trinidad
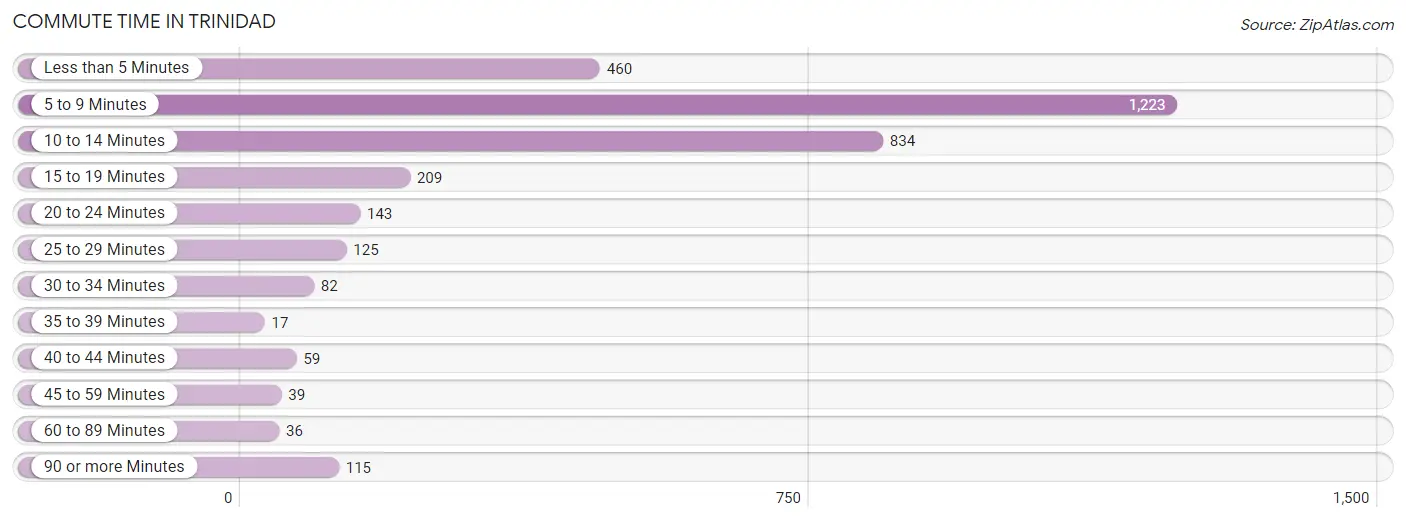
The most frequently occuring commute durations in Trinidad are 5 to 9 minutes (1,223 commuters, 36.6%), 10 to 14 minutes (834 commuters, 25.0%), and less than 5 minutes (460 commuters, 13.8%).
| Commute Time | # Commuters | % Commuters |
| Less than 5 Minutes | 460 | 13.8% |
| 5 to 9 Minutes | 1,223 | 36.6% |
| 10 to 14 Minutes | 834 | 25.0% |
| 15 to 19 Minutes | 209 | 6.2% |
| 20 to 24 Minutes | 143 | 4.3% |
| 25 to 29 Minutes | 125 | 3.7% |
| 30 to 34 Minutes | 82 | 2.5% |
| 35 to 39 Minutes | 17 | 0.5% |
| 40 to 44 Minutes | 59 | 1.8% |
| 45 to 59 Minutes | 39 | 1.2% |
| 60 to 89 Minutes | 36 | 1.1% |
| 90 or more Minutes | 115 | 3.4% |
Commute Time by Sex in Trinidad
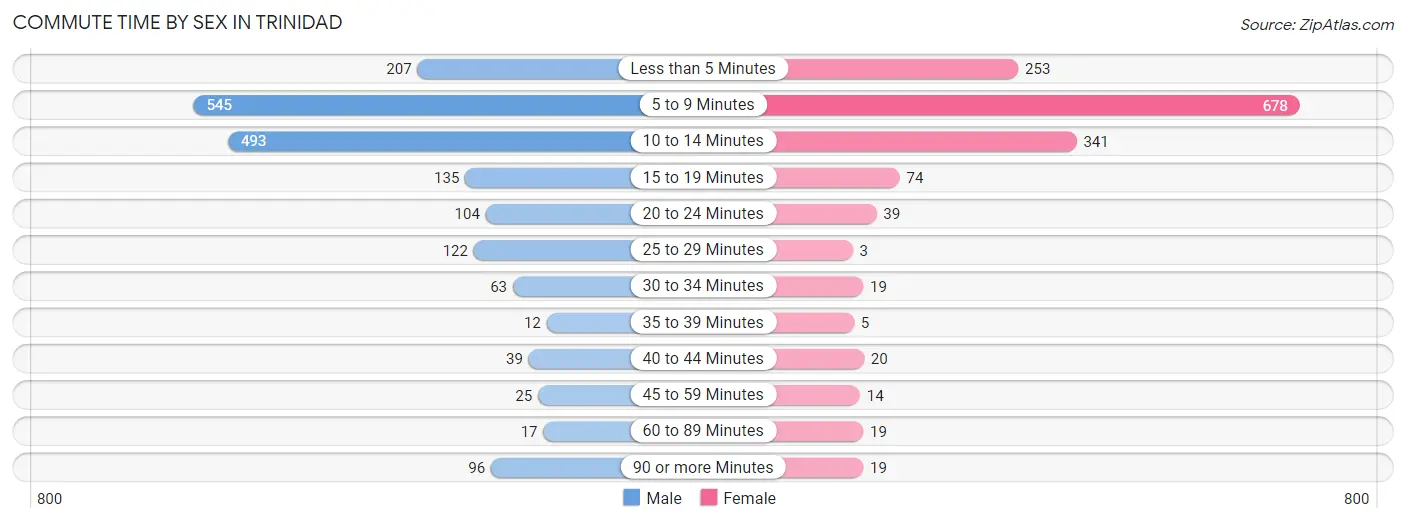
The most common commute times in Trinidad are 5 to 9 minutes (545 commuters, 29.3%) for males and 5 to 9 minutes (678 commuters, 45.7%) for females.
| Commute Time | Male | Female |
| Less than 5 Minutes | 207 (11.1%) | 253 (17.1%) |
| 5 to 9 Minutes | 545 (29.3%) | 678 (45.7%) |
| 10 to 14 Minutes | 493 (26.5%) | 341 (23.0%) |
| 15 to 19 Minutes | 135 (7.3%) | 74 (5.0%) |
| 20 to 24 Minutes | 104 (5.6%) | 39 (2.6%) |
| 25 to 29 Minutes | 122 (6.6%) | 3 (0.2%) |
| 30 to 34 Minutes | 63 (3.4%) | 19 (1.3%) |
| 35 to 39 Minutes | 12 (0.6%) | 5 (0.3%) |
| 40 to 44 Minutes | 39 (2.1%) | 20 (1.3%) |
| 45 to 59 Minutes | 25 (1.3%) | 14 (0.9%) |
| 60 to 89 Minutes | 17 (0.9%) | 19 (1.3%) |
| 90 or more Minutes | 96 (5.2%) | 19 (1.3%) |
Time of Departure to Work by Sex in Trinidad
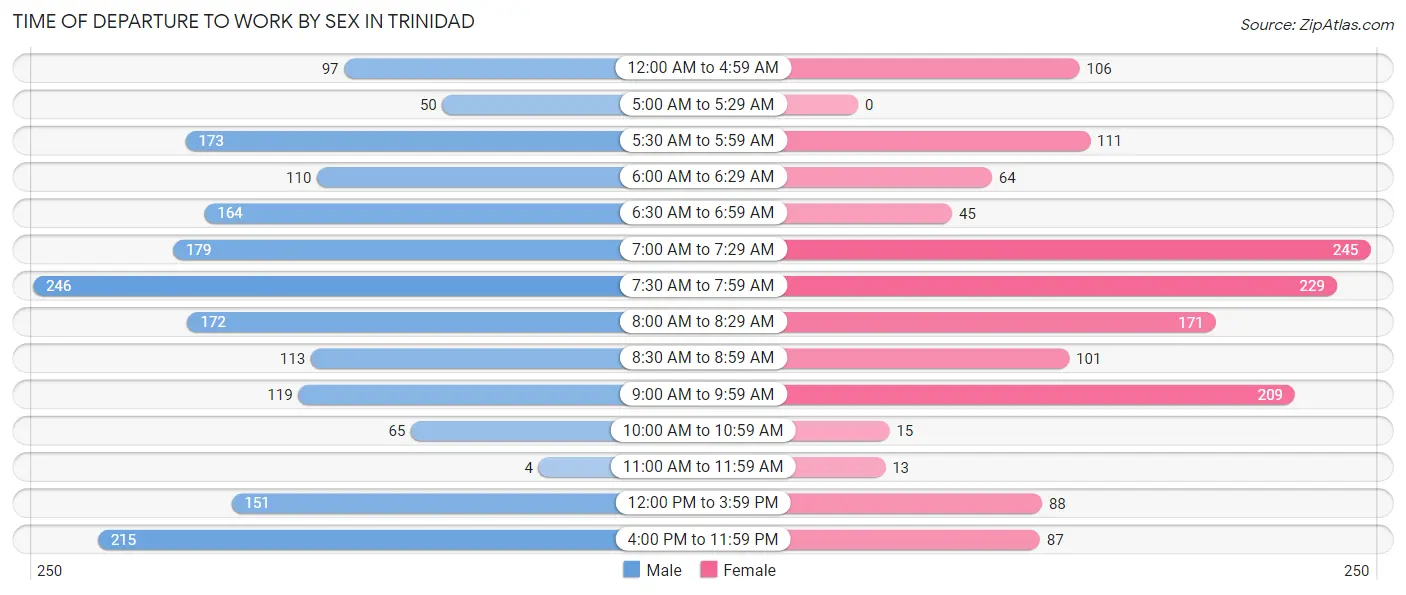
The most frequent times of departure to work in Trinidad are 7:30 AM to 7:59 AM (246, 13.2%) for males and 7:00 AM to 7:29 AM (245, 16.5%) for females.
| Time of Departure | Male | Female |
| 12:00 AM to 4:59 AM | 97 (5.2%) | 106 (7.1%) |
| 5:00 AM to 5:29 AM | 50 (2.7%) | 0 (0.0%) |
| 5:30 AM to 5:59 AM | 173 (9.3%) | 111 (7.5%) |
| 6:00 AM to 6:29 AM | 110 (5.9%) | 64 (4.3%) |
| 6:30 AM to 6:59 AM | 164 (8.8%) | 45 (3.0%) |
| 7:00 AM to 7:29 AM | 179 (9.6%) | 245 (16.5%) |
| 7:30 AM to 7:59 AM | 246 (13.2%) | 229 (15.4%) |
| 8:00 AM to 8:29 AM | 172 (9.3%) | 171 (11.5%) |
| 8:30 AM to 8:59 AM | 113 (6.1%) | 101 (6.8%) |
| 9:00 AM to 9:59 AM | 119 (6.4%) | 209 (14.1%) |
| 10:00 AM to 10:59 AM | 65 (3.5%) | 15 (1.0%) |
| 11:00 AM to 11:59 AM | 4 (0.2%) | 13 (0.9%) |
| 12:00 PM to 3:59 PM | 151 (8.1%) | 88 (5.9%) |
| 4:00 PM to 11:59 PM | 215 (11.6%) | 87 (5.9%) |
| Total | 1,858 (100.0%) | 1,484 (100.0%) |
Housing Occupancy in Trinidad
Occupancy by Ownership in Trinidad
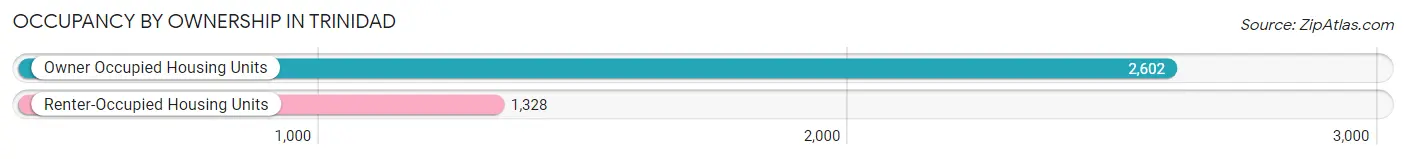
Of the total 3,930 dwellings in Trinidad, owner-occupied units account for 2,602 (66.2%), while renter-occupied units make up 1,328 (33.8%).
| Occupancy | # Housing Units | % Housing Units |
| Owner Occupied Housing Units | 2,602 | 66.2% |
| Renter-Occupied Housing Units | 1,328 | 33.8% |
| Total Occupied Housing Units | 3,930 | 100.0% |
Occupancy by Household Size in Trinidad
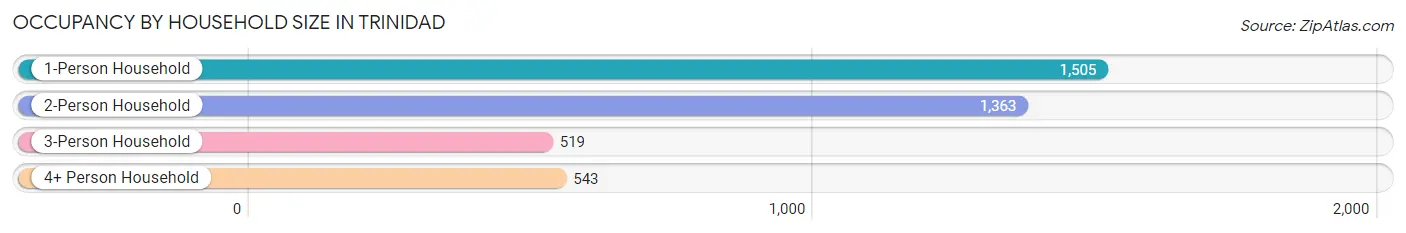
| Household Size | # Housing Units | % Housing Units |
| 1-Person Household | 1,505 | 38.3% |
| 2-Person Household | 1,363 | 34.7% |
| 3-Person Household | 519 | 13.2% |
| 4+ Person Household | 543 | 13.8% |
| Total Housing Units | 3,930 | 100.0% |
Occupancy by Ownership by Household Size in Trinidad
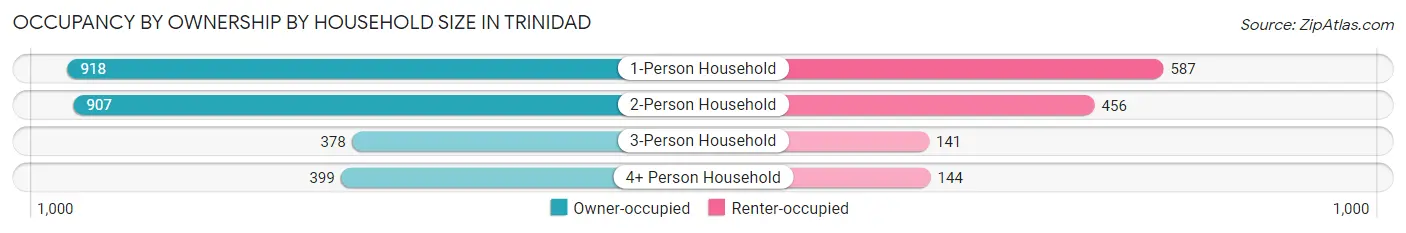
| Household Size | Owner-occupied | Renter-occupied |
| 1-Person Household | 918 (61.0%) | 587 (39.0%) |
| 2-Person Household | 907 (66.5%) | 456 (33.5%) |
| 3-Person Household | 378 (72.8%) | 141 (27.2%) |
| 4+ Person Household | 399 (73.5%) | 144 (26.5%) |
| Total Housing Units | 2,602 (66.2%) | 1,328 (33.8%) |
Occupancy by Educational Attainment in Trinidad
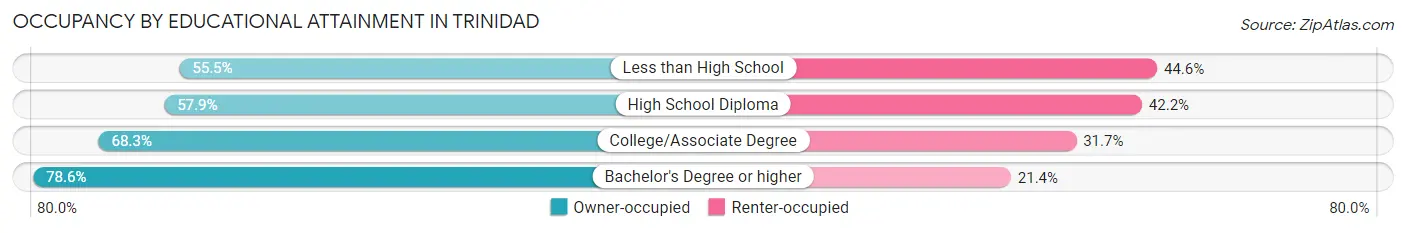
| Household Size | Owner-occupied | Renter-occupied |
| Less than High School | 244 (55.4%) | 196 (44.6%) |
| High School Diploma | 457 (57.9%) | 333 (42.1%) |
| College/Associate Degree | 1,463 (68.3%) | 680 (31.7%) |
| Bachelor's Degree or higher | 438 (78.6%) | 119 (21.4%) |
Occupancy by Age of Householder in Trinidad
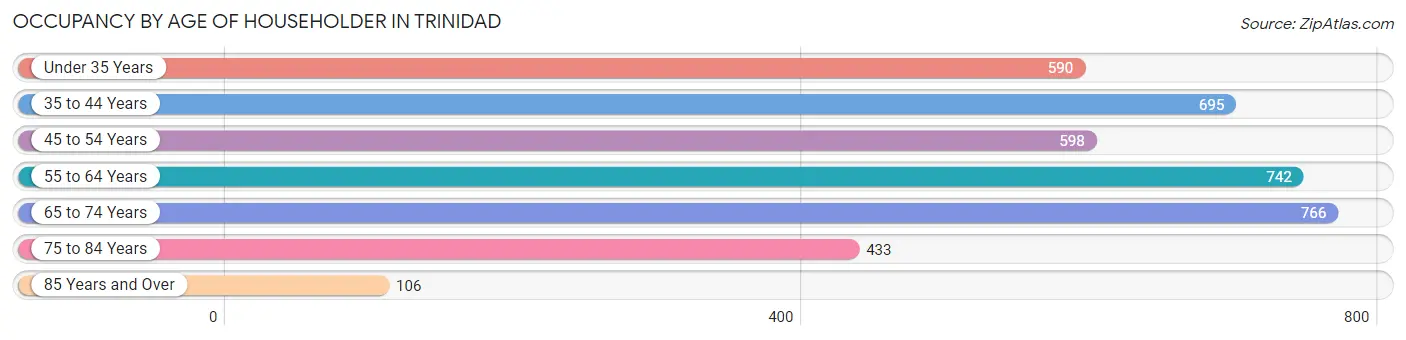
| Age Bracket | # Households | % Households |
| Under 35 Years | 590 | 15.0% |
| 35 to 44 Years | 695 | 17.7% |
| 45 to 54 Years | 598 | 15.2% |
| 55 to 64 Years | 742 | 18.9% |
| 65 to 74 Years | 766 | 19.5% |
| 75 to 84 Years | 433 | 11.0% |
| 85 Years and Over | 106 | 2.7% |
| Total | 3,930 | 100.0% |
Housing Finances in Trinidad
Median Income by Occupancy in Trinidad
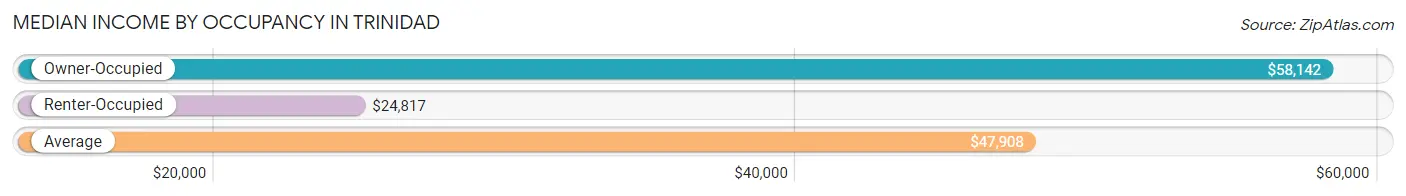
| Occupancy Type | # Households | Median Income |
| Owner-Occupied | 2,602 (66.2%) | $58,142 |
| Renter-Occupied | 1,328 (33.8%) | $24,817 |
| Average | 3,930 (100.0%) | $47,908 |
Occupancy by Householder Income Bracket in Trinidad
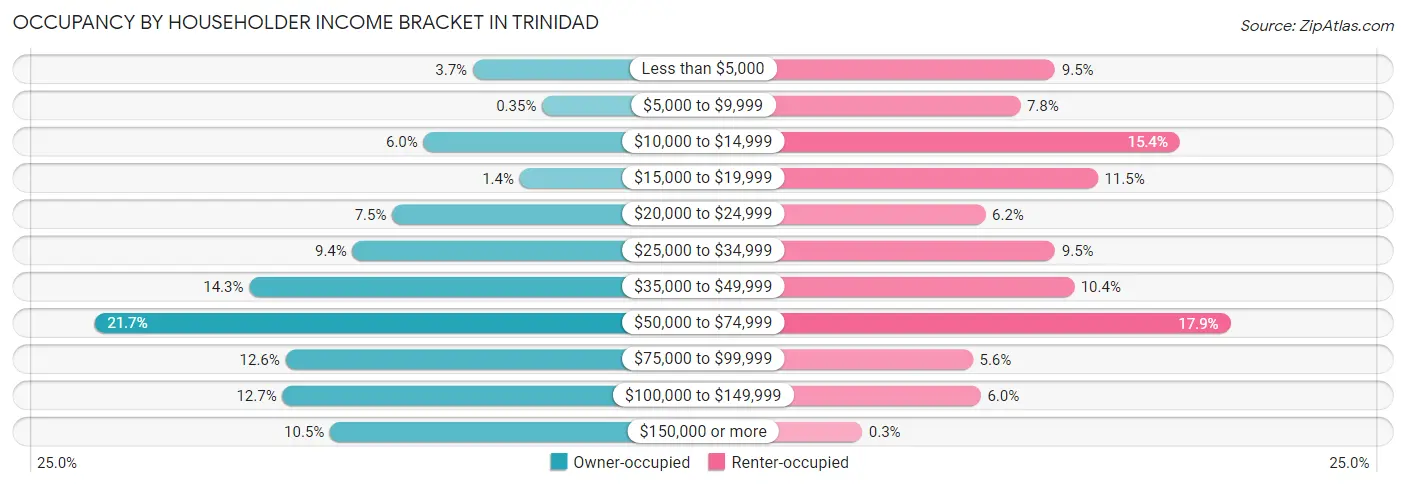
| Income Bracket | Owner-occupied | Renter-occupied |
| Less than $5,000 | 95 (3.6%) | 126 (9.5%) |
| $5,000 to $9,999 | 9 (0.4%) | 104 (7.8%) |
| $10,000 to $14,999 | 156 (6.0%) | 205 (15.4%) |
| $15,000 to $19,999 | 37 (1.4%) | 153 (11.5%) |
| $20,000 to $24,999 | 195 (7.5%) | 82 (6.2%) |
| $25,000 to $34,999 | 244 (9.4%) | 126 (9.5%) |
| $35,000 to $49,999 | 372 (14.3%) | 138 (10.4%) |
| $50,000 to $74,999 | 564 (21.7%) | 237 (17.8%) |
| $75,000 to $99,999 | 327 (12.6%) | 74 (5.6%) |
| $100,000 to $149,999 | 331 (12.7%) | 79 (5.9%) |
| $150,000 or more | 272 (10.4%) | 4 (0.3%) |
| Total | 2,602 (100.0%) | 1,328 (100.0%) |
Monthly Housing Cost Tiers in Trinidad
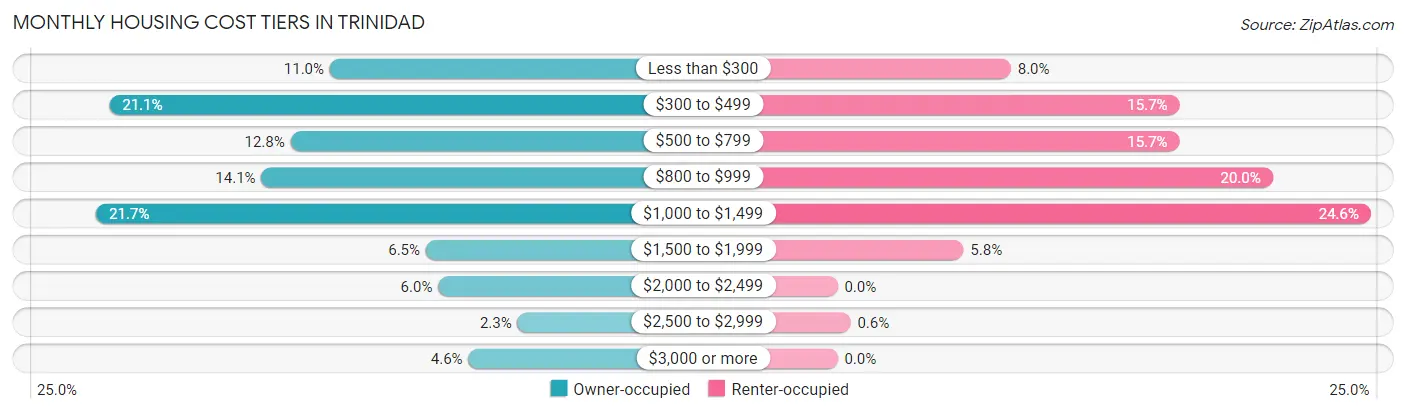
| Monthly Cost | Owner-occupied | Renter-occupied |
| Less than $300 | 285 (11.0%) | 106 (8.0%) |
| $300 to $499 | 549 (21.1%) | 209 (15.7%) |
| $500 to $799 | 332 (12.8%) | 209 (15.7%) |
| $800 to $999 | 367 (14.1%) | 266 (20.0%) |
| $1,000 to $1,499 | 565 (21.7%) | 326 (24.5%) |
| $1,500 to $1,999 | 170 (6.5%) | 77 (5.8%) |
| $2,000 to $2,499 | 155 (6.0%) | 0 (0.0%) |
| $2,500 to $2,999 | 60 (2.3%) | 8 (0.6%) |
| $3,000 or more | 119 (4.6%) | 0 (0.0%) |
| Total | 2,602 (100.0%) | 1,328 (100.0%) |
Physical Housing Characteristics in Trinidad
Housing Structures in Trinidad
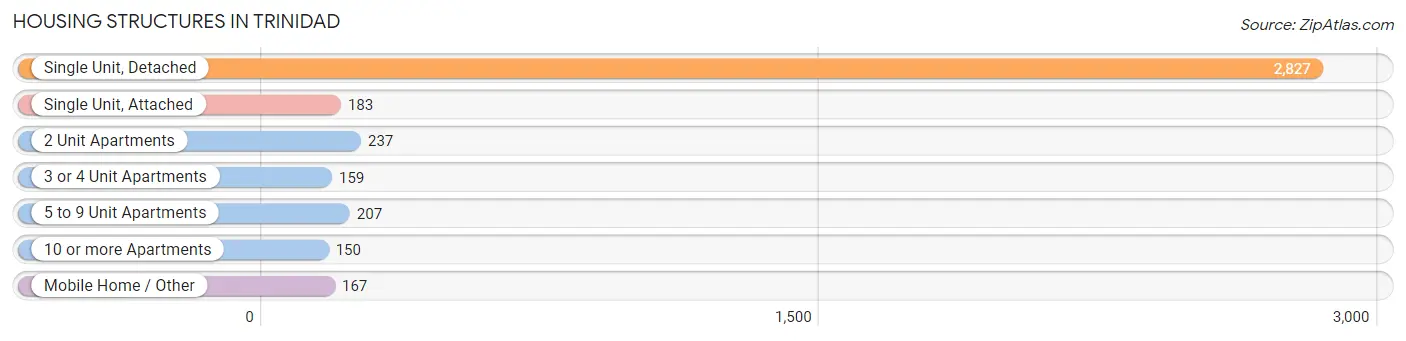
| Structure Type | # Housing Units | % Housing Units |
| Single Unit, Detached | 2,827 | 71.9% |
| Single Unit, Attached | 183 | 4.7% |
| 2 Unit Apartments | 237 | 6.0% |
| 3 or 4 Unit Apartments | 159 | 4.1% |
| 5 to 9 Unit Apartments | 207 | 5.3% |
| 10 or more Apartments | 150 | 3.8% |
| Mobile Home / Other | 167 | 4.3% |
| Total | 3,930 | 100.0% |
Housing Structures by Occupancy in Trinidad
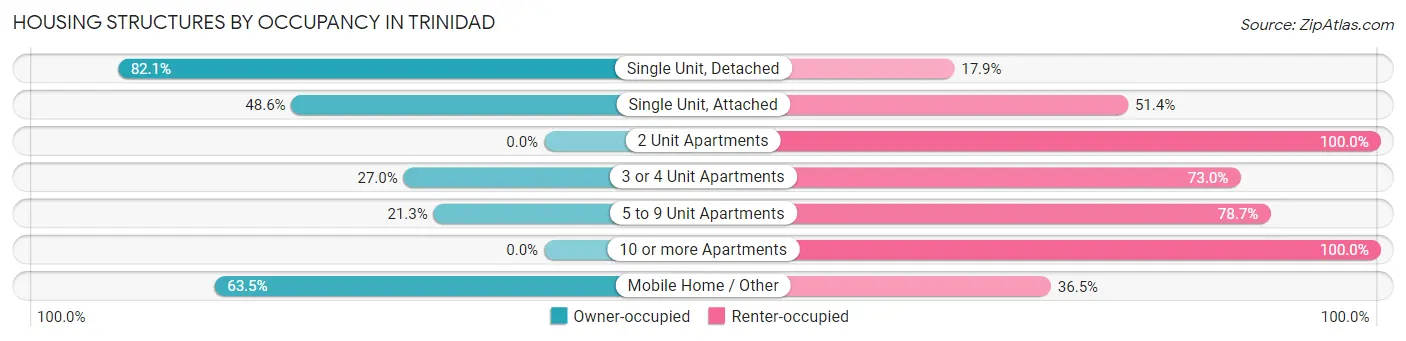
| Structure Type | Owner-occupied | Renter-occupied |
| Single Unit, Detached | 2,320 (82.1%) | 507 (17.9%) |
| Single Unit, Attached | 89 (48.6%) | 94 (51.4%) |
| 2 Unit Apartments | 0 (0.0%) | 237 (100.0%) |
| 3 or 4 Unit Apartments | 43 (27.0%) | 116 (73.0%) |
| 5 to 9 Unit Apartments | 44 (21.3%) | 163 (78.7%) |
| 10 or more Apartments | 0 (0.0%) | 150 (100.0%) |
| Mobile Home / Other | 106 (63.5%) | 61 (36.5%) |
| Total | 2,602 (66.2%) | 1,328 (33.8%) |
Housing Structures by Number of Rooms in Trinidad
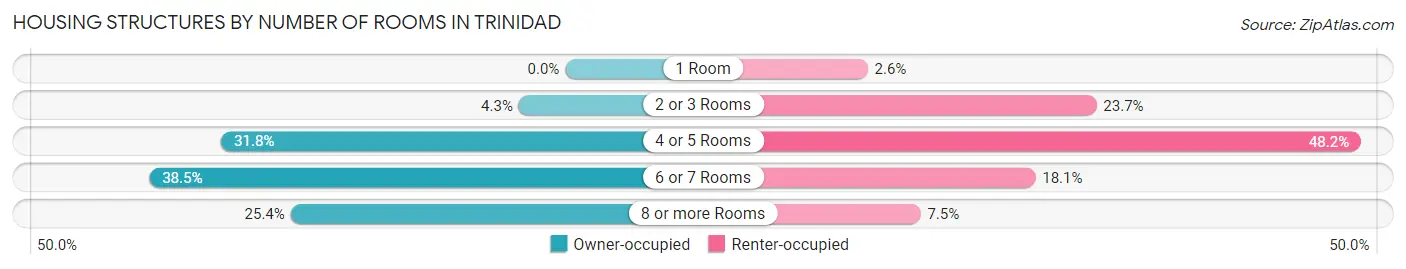
| Number of Rooms | Owner-occupied | Renter-occupied |
| 1 Room | 0 (0.0%) | 34 (2.6%) |
| 2 or 3 Rooms | 112 (4.3%) | 315 (23.7%) |
| 4 or 5 Rooms | 828 (31.8%) | 640 (48.2%) |
| 6 or 7 Rooms | 1,001 (38.5%) | 240 (18.1%) |
| 8 or more Rooms | 661 (25.4%) | 99 (7.4%) |
| Total | 2,602 (100.0%) | 1,328 (100.0%) |
Housing Structure by Heating Type in Trinidad
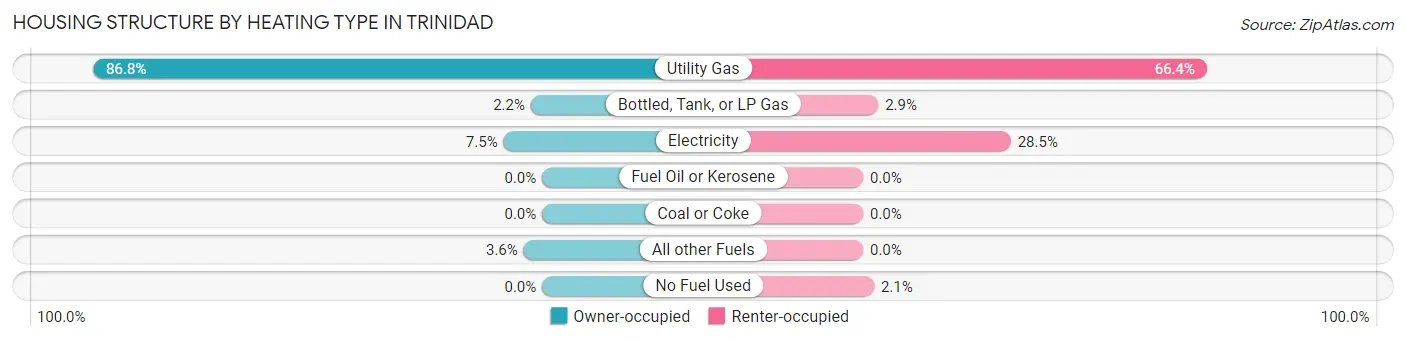
| Heating Type | Owner-occupied | Renter-occupied |
| Utility Gas | 2,258 (86.8%) | 882 (66.4%) |
| Bottled, Tank, or LP Gas | 57 (2.2%) | 39 (2.9%) |
| Electricity | 194 (7.5%) | 379 (28.5%) |
| Fuel Oil or Kerosene | 0 (0.0%) | 0 (0.0%) |
| Coal or Coke | 0 (0.0%) | 0 (0.0%) |
| All other Fuels | 93 (3.6%) | 0 (0.0%) |
| No Fuel Used | 0 (0.0%) | 28 (2.1%) |
| Total | 2,602 (100.0%) | 1,328 (100.0%) |
Household Vehicle Usage in Trinidad
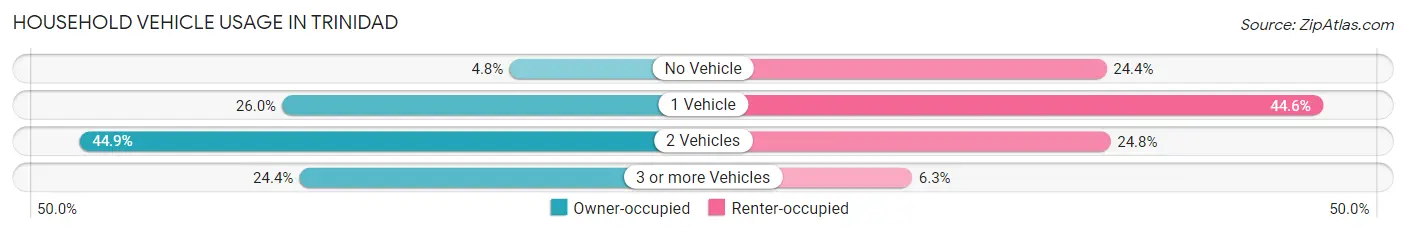
| Vehicles per Household | Owner-occupied | Renter-occupied |
| No Vehicle | 124 (4.8%) | 324 (24.4%) |
| 1 Vehicle | 676 (26.0%) | 592 (44.6%) |
| 2 Vehicles | 1,168 (44.9%) | 329 (24.8%) |
| 3 or more Vehicles | 634 (24.4%) | 83 (6.2%) |
| Total | 2,602 (100.0%) | 1,328 (100.0%) |
Real Estate & Mortgages in Trinidad
Real Estate and Mortgage Overview in Trinidad
| Characteristic | Without Mortgage | With Mortgage |
| Housing Units | 1,061 | 1,541 |
| Median Property Value | $163,800 | $205,800 |
| Median Household Income | $40,446 | $217 |
| Monthly Housing Costs | $378 | $111 |
| Real Estate Taxes | $387 | $24 |
Property Value by Mortgage Status in Trinidad
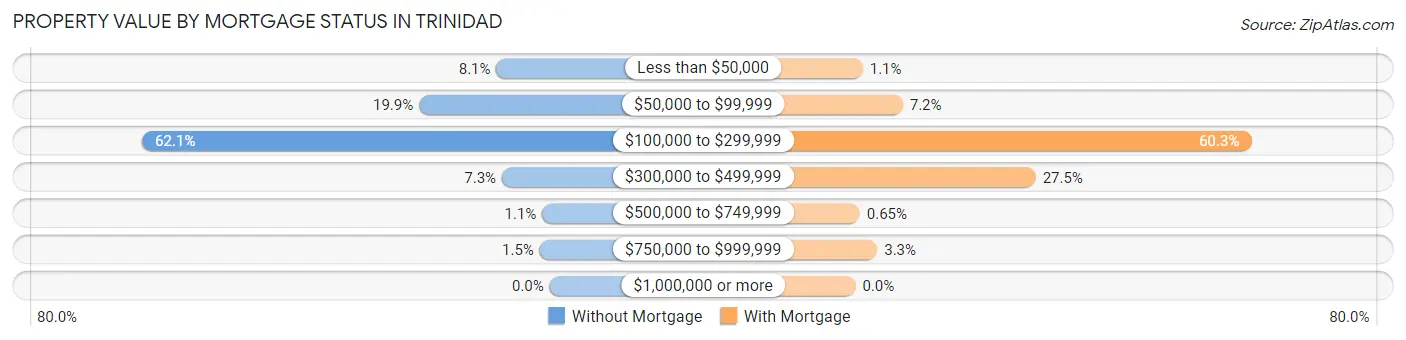
| Property Value | Without Mortgage | With Mortgage |
| Less than $50,000 | 86 (8.1%) | 17 (1.1%) |
| $50,000 to $99,999 | 211 (19.9%) | 111 (7.2%) |
| $100,000 to $299,999 | 659 (62.1%) | 929 (60.3%) |
| $300,000 to $499,999 | 77 (7.3%) | 423 (27.5%) |
| $500,000 to $749,999 | 12 (1.1%) | 10 (0.6%) |
| $750,000 to $999,999 | 16 (1.5%) | 51 (3.3%) |
| $1,000,000 or more | 0 (0.0%) | 0 (0.0%) |
| Total | 1,061 (100.0%) | 1,541 (100.0%) |
Household Income by Mortgage Status in Trinidad
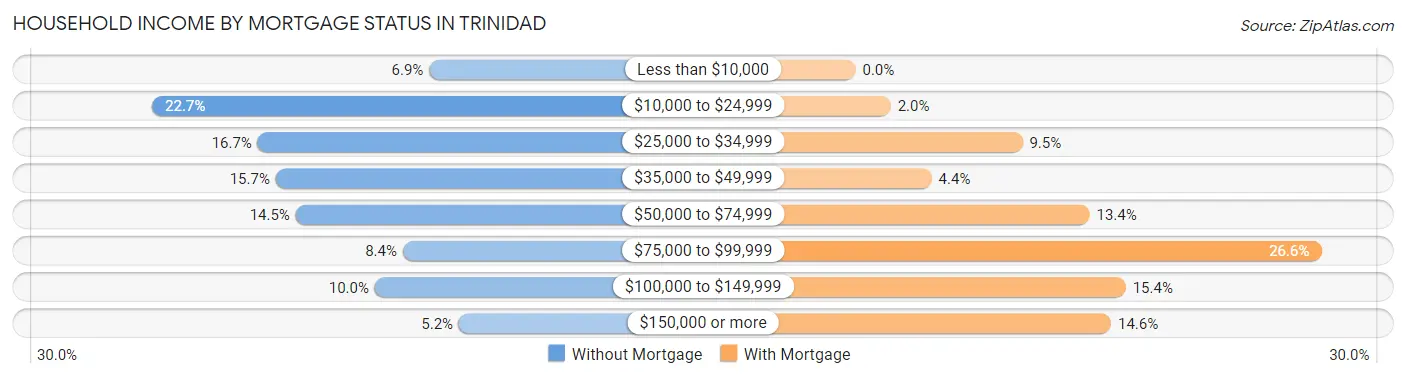
| Household Income | Without Mortgage | With Mortgage |
| Less than $10,000 | 73 (6.9%) | 0 (0.0%) |
| $10,000 to $24,999 | 241 (22.7%) | 31 (2.0%) |
| $25,000 to $34,999 | 177 (16.7%) | 147 (9.5%) |
| $35,000 to $49,999 | 166 (15.7%) | 67 (4.3%) |
| $50,000 to $74,999 | 154 (14.5%) | 206 (13.4%) |
| $75,000 to $99,999 | 89 (8.4%) | 410 (26.6%) |
| $100,000 to $149,999 | 106 (10.0%) | 238 (15.4%) |
| $150,000 or more | 55 (5.2%) | 225 (14.6%) |
| Total | 1,061 (100.0%) | 1,541 (100.0%) |
Property Value to Household Income Ratio in Trinidad
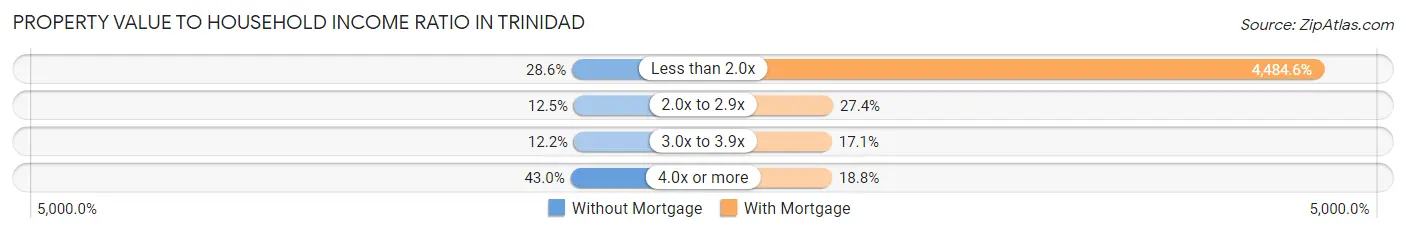
| Value-to-Income Ratio | Without Mortgage | With Mortgage |
| Less than 2.0x | 303 (28.6%) | 69,107 (4,484.6%) |
| 2.0x to 2.9x | 133 (12.5%) | 422 (27.4%) |
| 3.0x to 3.9x | 129 (12.2%) | 263 (17.1%) |
| 4.0x or more | 456 (43.0%) | 290 (18.8%) |
| Total | 1,061 (100.0%) | 1,541 (100.0%) |
Real Estate Taxes by Mortgage Status in Trinidad
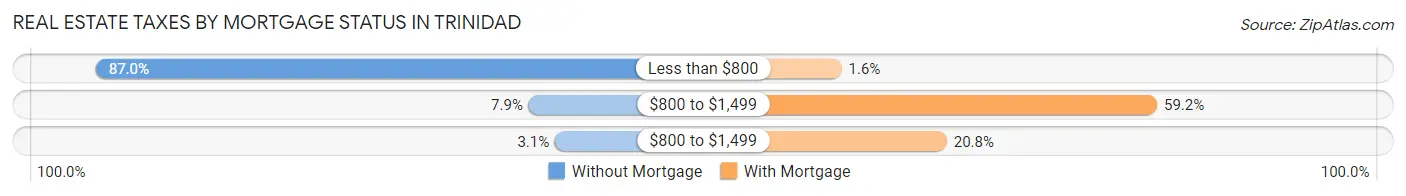
| Property Taxes | Without Mortgage | With Mortgage |
| Less than $800 | 923 (87.0%) | 24 (1.6%) |
| $800 to $1,499 | 84 (7.9%) | 912 (59.2%) |
| $800 to $1,499 | 33 (3.1%) | 320 (20.8%) |
| Total | 1,061 (100.0%) | 1,541 (100.0%) |
Health & Disability in Trinidad
Health Insurance Coverage by Age in Trinidad
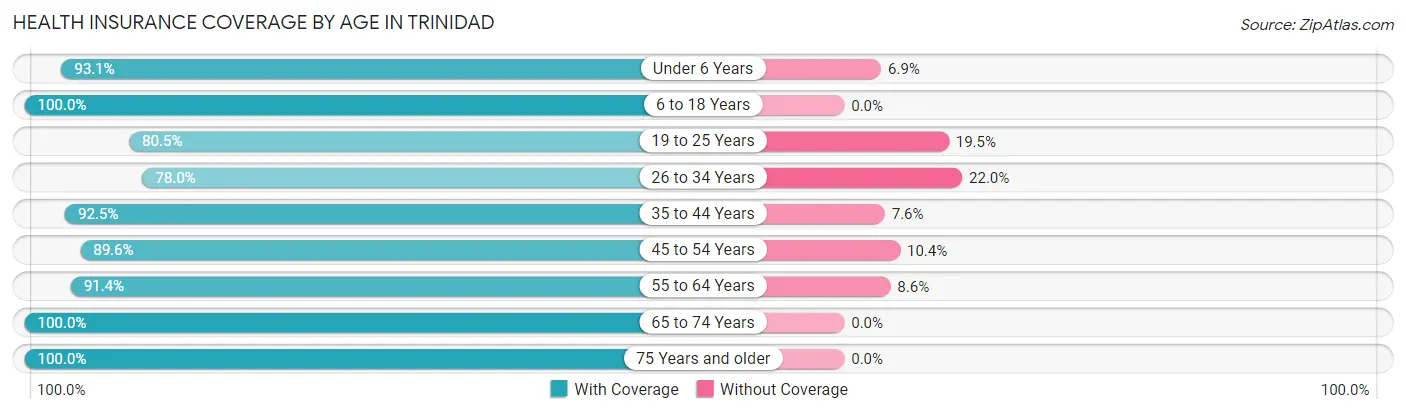
| Age Bracket | With Coverage | Without Coverage |
| Under 6 Years | 421 (93.1%) | 31 (6.9%) |
| 6 to 18 Years | 1,173 (100.0%) | 0 (0.0%) |
| 19 to 25 Years | 570 (80.5%) | 138 (19.5%) |
| 26 to 34 Years | 689 (78.0%) | 194 (22.0%) |
| 35 to 44 Years | 1,004 (92.4%) | 82 (7.5%) |
| 45 to 54 Years | 811 (89.6%) | 94 (10.4%) |
| 55 to 64 Years | 1,106 (91.4%) | 104 (8.6%) |
| 65 to 74 Years | 1,104 (100.0%) | 0 (0.0%) |
| 75 Years and older | 678 (100.0%) | 0 (0.0%) |
| Total | 7,556 (92.2%) | 643 (7.8%) |
Health Insurance Coverage by Citizenship Status in Trinidad
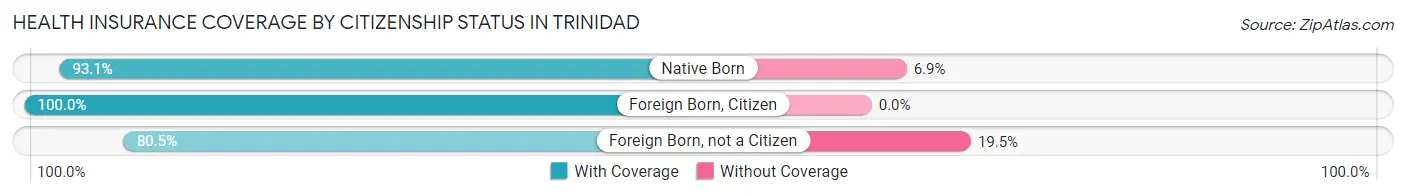
| Citizenship Status | With Coverage | Without Coverage |
| Native Born | 421 (93.1%) | 31 (6.9%) |
| Foreign Born, Citizen | 1,173 (100.0%) | 0 (0.0%) |
| Foreign Born, not a Citizen | 570 (80.5%) | 138 (19.5%) |
Health Insurance Coverage by Household Income in Trinidad
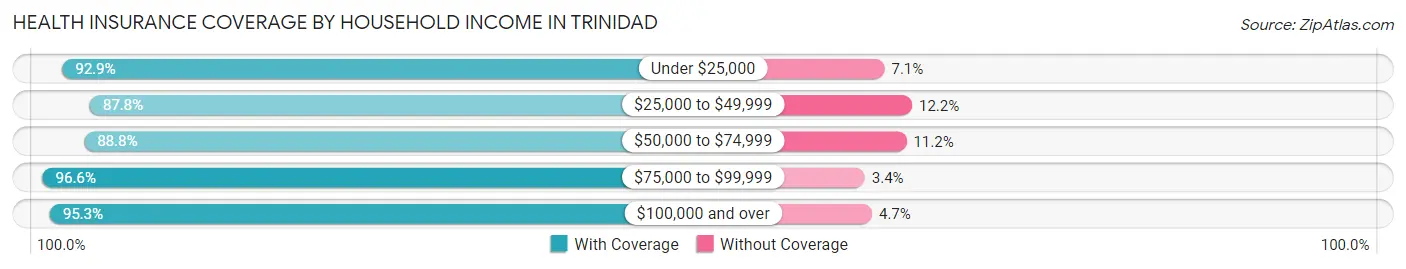
| Household Income | With Coverage | Without Coverage |
| Under $25,000 | 1,551 (92.9%) | 118 (7.1%) |
| $25,000 to $49,999 | 1,508 (87.8%) | 210 (12.2%) |
| $50,000 to $74,999 | 1,494 (88.8%) | 188 (11.2%) |
| $75,000 to $99,999 | 885 (96.6%) | 31 (3.4%) |
| $100,000 and over | 1,853 (95.3%) | 92 (4.7%) |
Public vs Private Health Insurance Coverage by Age in Trinidad
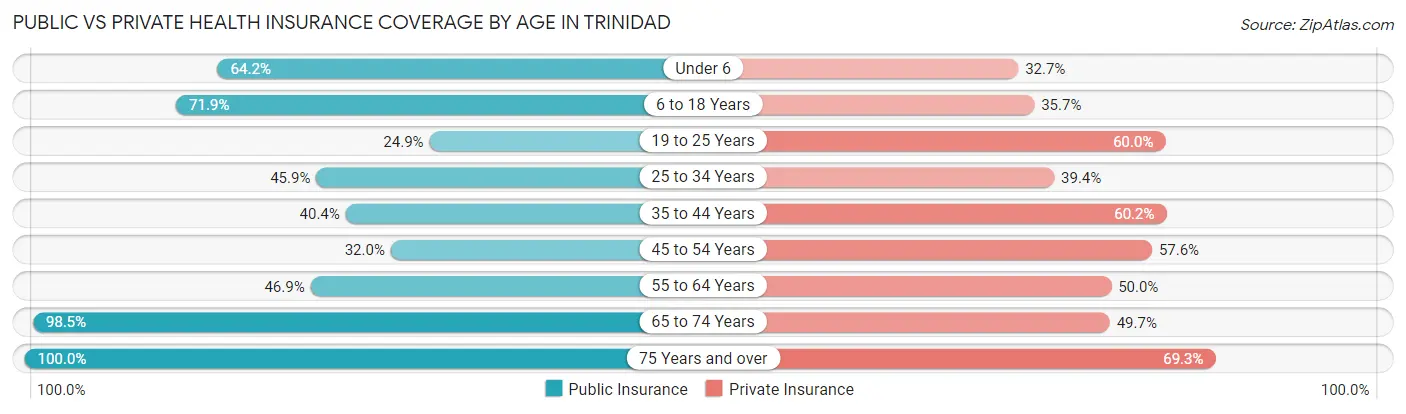
| Age Bracket | Public Insurance | Private Insurance |
| Under 6 | 290 (64.2%) | 148 (32.7%) |
| 6 to 18 Years | 843 (71.9%) | 419 (35.7%) |
| 19 to 25 Years | 176 (24.9%) | 425 (60.0%) |
| 25 to 34 Years | 405 (45.9%) | 348 (39.4%) |
| 35 to 44 Years | 439 (40.4%) | 654 (60.2%) |
| 45 to 54 Years | 290 (32.0%) | 521 (57.6%) |
| 55 to 64 Years | 568 (46.9%) | 605 (50.0%) |
| 65 to 74 Years | 1,087 (98.5%) | 549 (49.7%) |
| 75 Years and over | 678 (100.0%) | 470 (69.3%) |
| Total | 4,776 (58.3%) | 4,139 (50.5%) |
Disability Status by Sex by Age in Trinidad
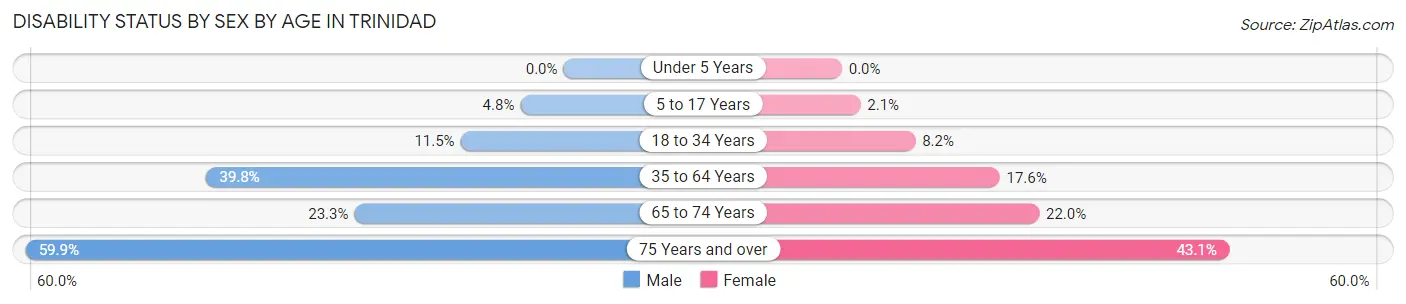
| Age Bracket | Male | Female |
| Under 5 Years | 0 (0.0%) | 0 (0.0%) |
| 5 to 17 Years | 30 (4.8%) | 11 (2.1%) |
| 18 to 34 Years | 112 (11.5%) | 59 (8.2%) |
| 35 to 64 Years | 632 (39.8%) | 283 (17.6%) |
| 65 to 74 Years | 132 (23.3%) | 118 (22.0%) |
| 75 Years and over | 185 (59.9%) | 159 (43.1%) |
Disability Class by Sex by Age in Trinidad
Disability Class: Hearing Difficulty
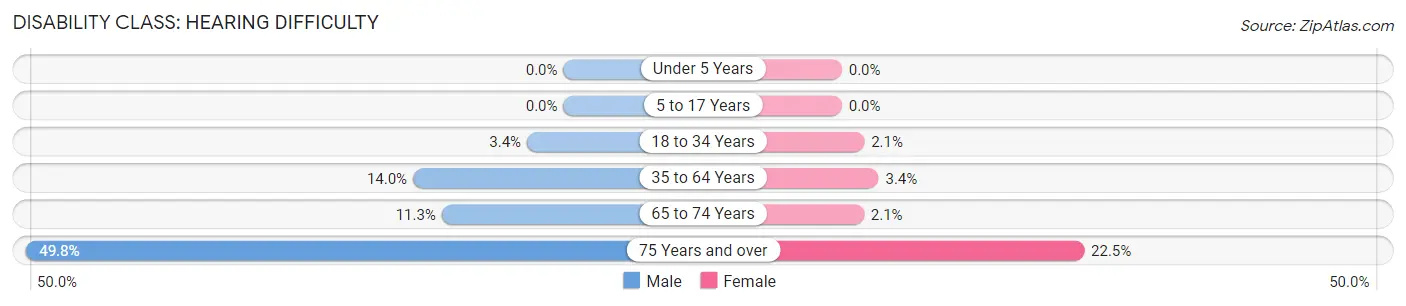
| Age Bracket | Male | Female |
| Under 5 Years | 0 (0.0%) | 0 (0.0%) |
| 5 to 17 Years | 0 (0.0%) | 0 (0.0%) |
| 18 to 34 Years | 33 (3.4%) | 15 (2.1%) |
| 35 to 64 Years | 222 (14.0%) | 55 (3.4%) |
| 65 to 74 Years | 64 (11.3%) | 11 (2.1%) |
| 75 Years and over | 154 (49.8%) | 83 (22.5%) |
Disability Class: Vision Difficulty
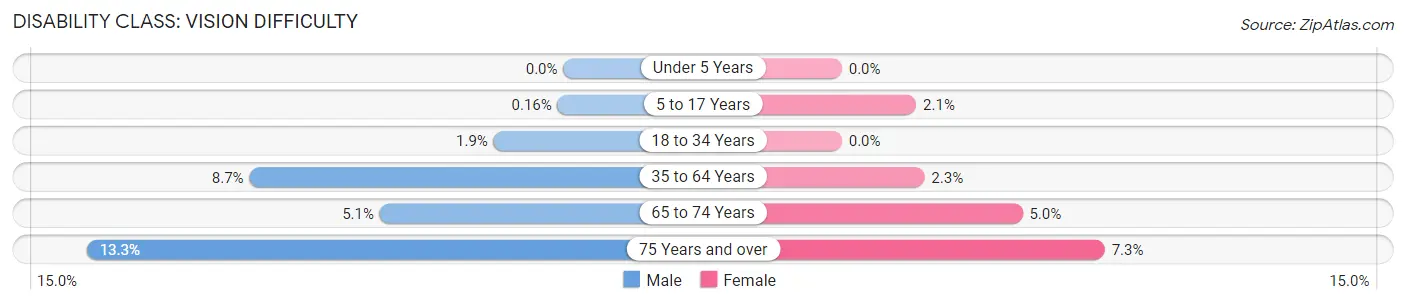
| Age Bracket | Male | Female |
| Under 5 Years | 0 (0.0%) | 0 (0.0%) |
| 5 to 17 Years | 1 (0.2%) | 11 (2.1%) |
| 18 to 34 Years | 19 (1.9%) | 0 (0.0%) |
| 35 to 64 Years | 139 (8.7%) | 37 (2.3%) |
| 65 to 74 Years | 29 (5.1%) | 27 (5.0%) |
| 75 Years and over | 41 (13.3%) | 27 (7.3%) |
Disability Class: Cognitive Difficulty
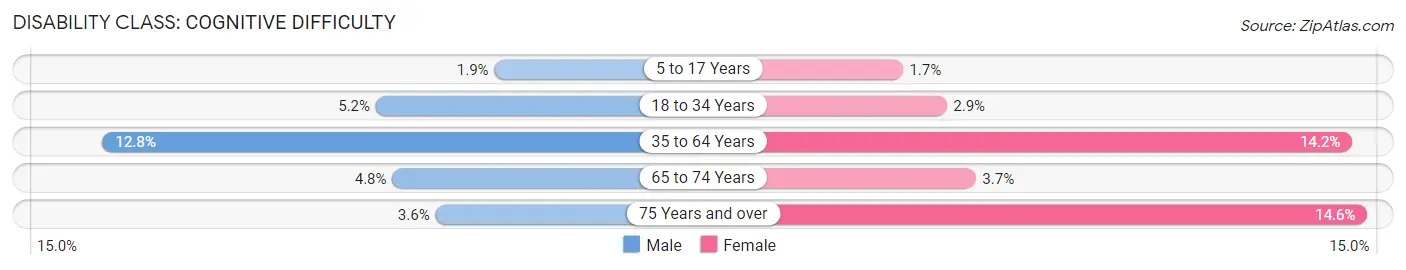
| Age Bracket | Male | Female |
| 5 to 17 Years | 12 (1.9%) | 9 (1.7%) |
| 18 to 34 Years | 51 (5.2%) | 21 (2.9%) |
| 35 to 64 Years | 204 (12.8%) | 229 (14.2%) |
| 65 to 74 Years | 27 (4.8%) | 20 (3.7%) |
| 75 Years and over | 11 (3.6%) | 54 (14.6%) |
Disability Class: Ambulatory Difficulty
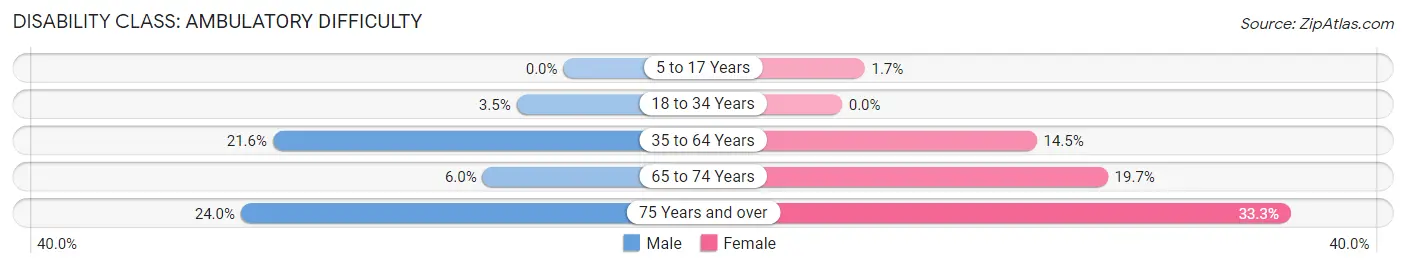
| Age Bracket | Male | Female |
| 5 to 17 Years | 0 (0.0%) | 9 (1.7%) |
| 18 to 34 Years | 34 (3.5%) | 0 (0.0%) |
| 35 to 64 Years | 343 (21.6%) | 233 (14.5%) |
| 65 to 74 Years | 34 (6.0%) | 106 (19.7%) |
| 75 Years and over | 74 (23.9%) | 123 (33.3%) |
Disability Class: Self-Care Difficulty
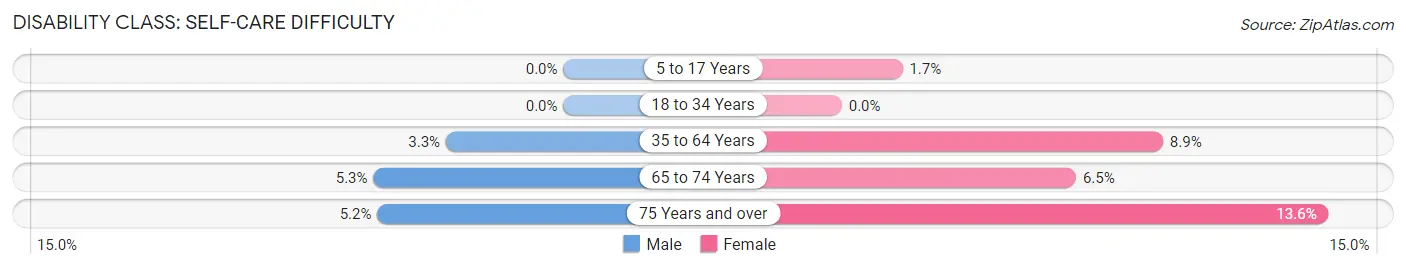
| Age Bracket | Male | Female |
| 5 to 17 Years | 0 (0.0%) | 9 (1.7%) |
| 18 to 34 Years | 0 (0.0%) | 0 (0.0%) |
| 35 to 64 Years | 52 (3.3%) | 144 (8.9%) |
| 65 to 74 Years | 30 (5.3%) | 35 (6.5%) |
| 75 Years and over | 16 (5.2%) | 50 (13.6%) |
Technology Access in Trinidad
Computing Device Access in Trinidad
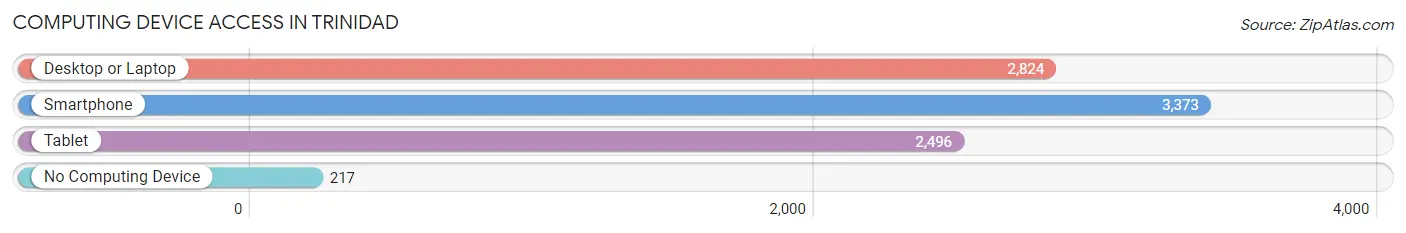
| Device Type | # Households | % Households |
| Desktop or Laptop | 2,824 | 71.9% |
| Smartphone | 3,373 | 85.8% |
| Tablet | 2,496 | 63.5% |
| No Computing Device | 217 | 5.5% |
| Total | 3,930 | 100.0% |
Internet Access in Trinidad
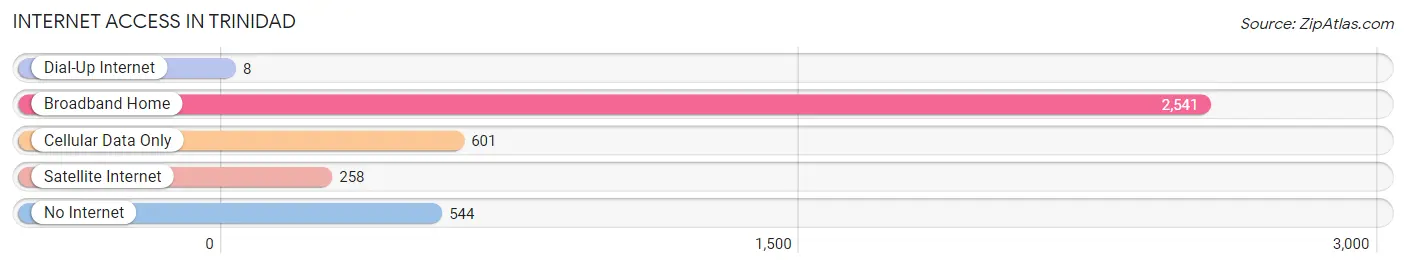
| Internet Type | # Households | % Households |
| Dial-Up Internet | 8 | 0.2% |
| Broadband Home | 2,541 | 64.7% |
| Cellular Data Only | 601 | 15.3% |
| Satellite Internet | 258 | 6.6% |
| No Internet | 544 | 13.8% |
| Total | 3,930 | 100.0% |
Trinidad Summary
Trinidad, Colorado is a small city located in Las Animas County in the southeastern corner of the state. It is situated at the base of the Sangre de Cristo Mountains and is the county seat of Las Animas County. The city is located along the historic Santa Fe Trail and is known for its rich history and culture.
History
Trinidad was founded in 1876 by a group of settlers from Trinidad, Cuba. The city was named after the Cuban city and was originally a mining town. The city was incorporated in 1879 and quickly became a hub for the coal mining industry. The city was also a major stop on the Santa Fe Trail, which was used by traders and settlers to travel between the Midwest and the Southwest.
In the late 19th century, Trinidad was a major center for the cattle industry. The city was also home to a large number of saloons and gambling halls. In the early 20th century, the city was a major center for the oil and gas industry.
Geography
Trinidad is located in the southeastern corner of Colorado, at the base of the Sangre de Cristo Mountains. The city is situated at an elevation of 6,000 feet and is surrounded by rolling hills and mountains. The Purgatoire River runs through the city and is a major source of water for the area.
The climate in Trinidad is semi-arid, with hot summers and cold winters. The average annual temperature is around 50 degrees Fahrenheit. The city receives an average of 16 inches of precipitation per year.
Economy
Trinidad’s economy is largely based on the energy industry. The city is home to several oil and gas companies, as well as coal mining operations. The city is also a major center for the tourism industry, with many visitors coming to the area to explore the city’s rich history and culture.
The city is also home to several manufacturing companies, including a large food processing plant. The city is also home to several retail stores, restaurants, and other businesses.
Demographics
As of the 2010 census, the population of Trinidad was 9,096. The city has a population density of 1,845 people per square mile. The median age of the population is 38.7 years, and the median household income is $37,945.
The racial makeup of the city is predominantly white (83.3%), followed by Hispanic or Latino (11.2%), African American (2.2%), and Native American (1.2%). The majority of the population (90.2%) speaks English as their primary language.
Trinidad is a diverse city with a rich history and culture. The city is home to a variety of businesses and industries, and is a major center for the energy industry. The city is also a popular tourist destination, with many visitors coming to explore the city’s history and culture.
Common Questions
What is Per Capita Income in Trinidad?
Per Capita income in Trinidad is $29,213.
What is the Median Family Income in Trinidad?
Median Family Income in Trinidad is $62,795.
What is the Median Household income in Trinidad?
Median Household Income in Trinidad is $47,908.
What is Income or Wage Gap in Trinidad?
Income or Wage Gap in Trinidad is 25.2%.
Women in Trinidad earn 74.8 cents for every dollar earned by a man.
What is Inequality or Gini Index in Trinidad?
Inequality or Gini Index in Trinidad is 0.47.
What is the Total Population of Trinidad?
Total Population of Trinidad is 8,334.
What is the Total Male Population of Trinidad?
Total Male Population of Trinidad is 4,356.
What is the Total Female Population of Trinidad?
Total Female Population of Trinidad is 3,978.
What is the Ratio of Males per 100 Females in Trinidad?
There are 109.50 Males per 100 Females in Trinidad.
What is the Ratio of Females per 100 Males in Trinidad?
There are 91.32 Females per 100 Males in Trinidad.
What is the Median Population Age in Trinidad?
Median Population Age in Trinidad is 43.7 Years.
What is the Average Family Size in Trinidad
Average Family Size in Trinidad is 2.5 People.
What is the Average Household Size in Trinidad
Average Household Size in Trinidad is 2.0 People.
How Large is the Labor Force in Trinidad?
There are 4,071 People in the Labor Forcein in Trinidad.
What is the Percentage of People in the Labor Force in Trinidad?
57.4% of People are in the Labor Force in Trinidad.
What is the Unemployment Rate in Trinidad?
Unemployment Rate in Trinidad is 8.2%.