Frederick, OK Map & Demographics
Frederick Map
Frederick Overview
$21,161
PER CAPITA INCOME
$52,273
AVG FAMILY INCOME
$41,555
AVG HOUSEHOLD INCOME
28.1%
WAGE / INCOME GAP [ % ]
71.9¢/ $1
WAGE / INCOME GAP [ $ ]
$12,637
FAMILY INCOME DEFICIT
0.43
INEQUALITY / GINI INDEX
3,486
TOTAL POPULATION
1,626
MALE POPULATION
1,860
FEMALE POPULATION
87.42
MALES / 100 FEMALES
114.39
FEMALES / 100 MALES
37.8
MEDIAN AGE
3.4
AVG FAMILY SIZE
2.6
AVG HOUSEHOLD SIZE
1,370
LABOR FORCE [ PEOPLE ]
51.4%
PERCENT IN LABOR FORCE
2.8%
UNEMPLOYMENT RATE
Frederick Zip Codes
Frederick Area Codes
Income in Frederick
Income Overview in Frederick
Per Capita Income in Frederick is $21,161, while median incomes of families and households are $52,273 and $41,555 respectively.
| Characteristic | Number | Measure |
| Per Capita Income | 3,486 | $21,161 |
| Median Family Income | 826 | $52,273 |
| Mean Family Income | 826 | $60,578 |
| Median Household Income | 1,317 | $41,555 |
| Mean Household Income | 1,317 | $53,106 |
| Income Deficit | 826 | $12,637 |
| Wage / Income Gap (%) | 3,486 | 28.14% |
| Wage / Income Gap ($) | 3,486 | 71.86¢ per $1 |
| Gini / Inequality Index | 3,486 | 0.43 |
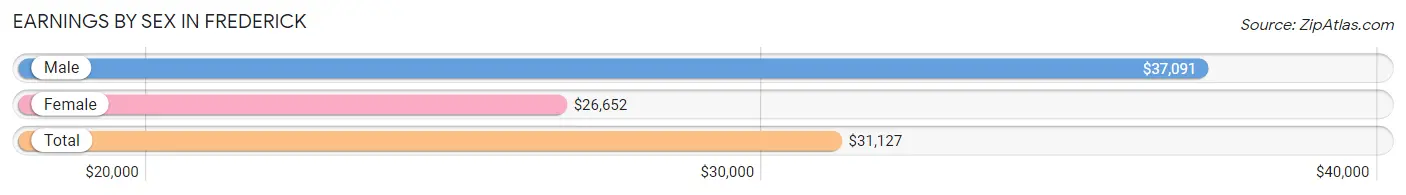
Earnings by Sex in Frederick
Average Earnings in Frederick are $31,127, $37,091 for men and $26,652 for women, a difference of 28.1%.
| Sex | Number | Average Earnings |
| Male | 809 (52.8%) | $37,091 |
| Female | 722 (47.2%) | $26,652 |
| Total | 1,531 (100.0%) | $31,127 |
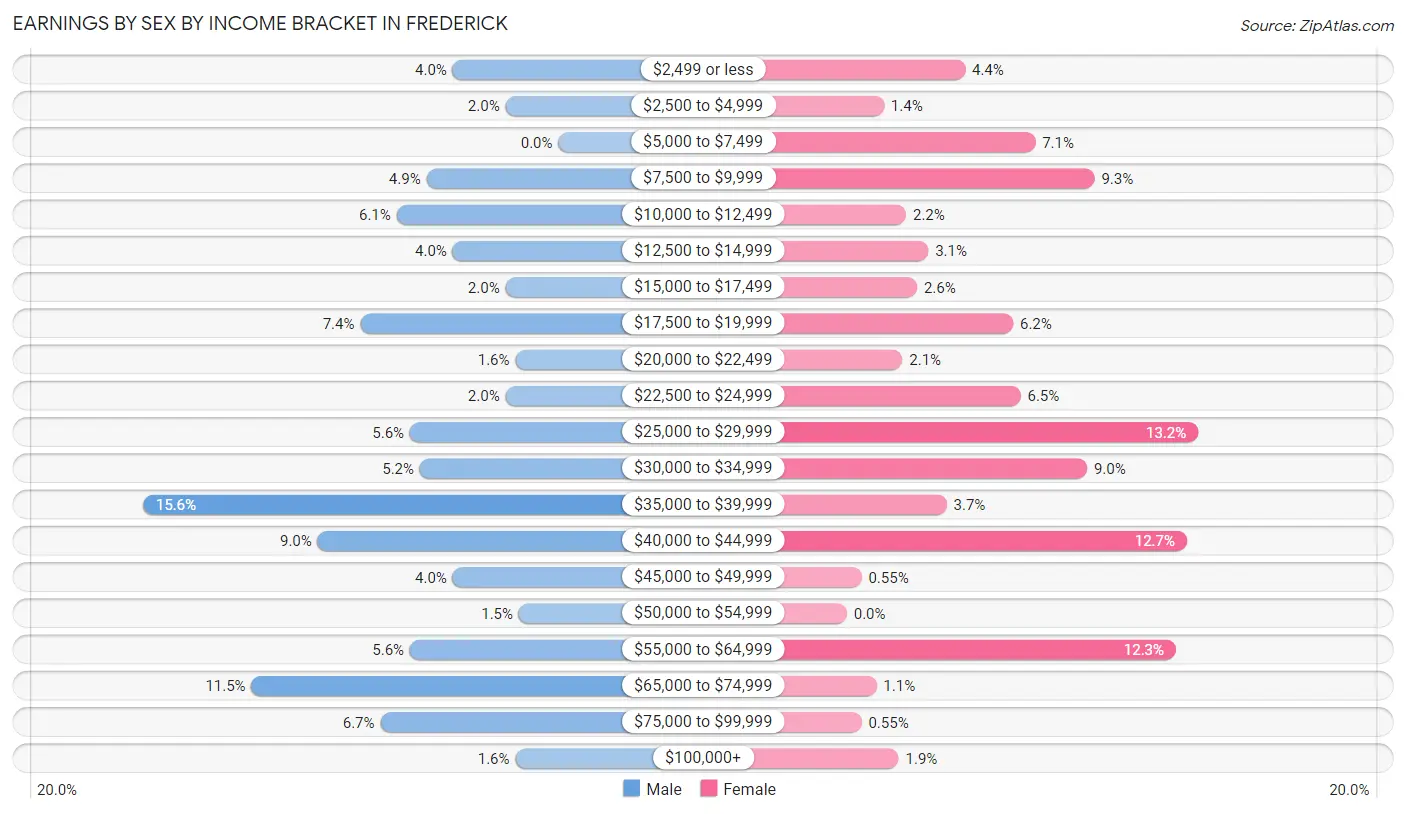
Earnings by Sex by Income Bracket in Frederick
The most common earnings brackets in Frederick are $35,000 to $39,999 for men (126 | 15.6%) and $25,000 to $29,999 for women (95 | 13.2%).
| Income | Male | Female |
| $2,499 or less | 32 (4.0%) | 32 (4.4%) |
| $2,500 to $4,999 | 16 (2.0%) | 10 (1.4%) |
| $5,000 to $7,499 | 0 (0.0%) | 51 (7.1%) |
| $7,500 to $9,999 | 40 (4.9%) | 67 (9.3%) |
| $10,000 to $12,499 | 49 (6.1%) | 16 (2.2%) |
| $12,500 to $14,999 | 32 (4.0%) | 22 (3.0%) |
| $15,000 to $17,499 | 16 (2.0%) | 19 (2.6%) |
| $17,500 to $19,999 | 60 (7.4%) | 45 (6.2%) |
| $20,000 to $22,499 | 13 (1.6%) | 15 (2.1%) |
| $22,500 to $24,999 | 16 (2.0%) | 47 (6.5%) |
| $25,000 to $29,999 | 45 (5.6%) | 95 (13.2%) |
| $30,000 to $34,999 | 42 (5.2%) | 65 (9.0%) |
| $35,000 to $39,999 | 126 (15.6%) | 27 (3.7%) |
| $40,000 to $44,999 | 73 (9.0%) | 92 (12.7%) |
| $45,000 to $49,999 | 32 (4.0%) | 4 (0.5%) |
| $50,000 to $54,999 | 12 (1.5%) | 0 (0.0%) |
| $55,000 to $64,999 | 45 (5.6%) | 89 (12.3%) |
| $65,000 to $74,999 | 93 (11.5%) | 8 (1.1%) |
| $75,000 to $99,999 | 54 (6.7%) | 4 (0.5%) |
| $100,000+ | 13 (1.6%) | 14 (1.9%) |
| Total | 809 (100.0%) | 722 (100.0%) |
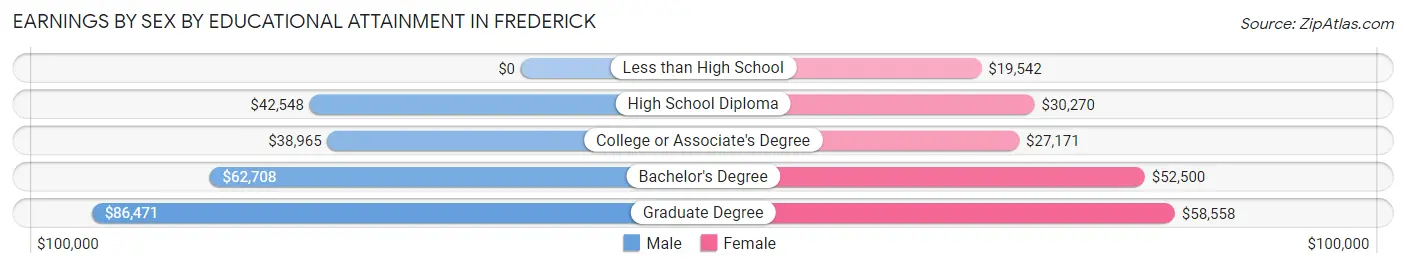
Earnings by Sex by Educational Attainment in Frederick
Average earnings in Frederick are $39,003 for men and $31,068 for women, a difference of 20.3%. Men with an educational attainment of graduate degree enjoy the highest average annual earnings of $86,471, while those with college or associate's degree education earn the least with $38,965. Women with an educational attainment of graduate degree earn the most with the average annual earnings of $58,558, while those with less than high school education have the smallest earnings of $19,542.
| Educational Attainment | Male Income | Female Income |
| Less than High School | - | - |
| High School Diploma | $42,548 | $30,270 |
| College or Associate's Degree | $38,965 | $27,171 |
| Bachelor's Degree | $62,708 | $52,500 |
| Graduate Degree | $86,471 | $58,558 |
| Total | $39,003 | $31,068 |
Family Income in Frederick
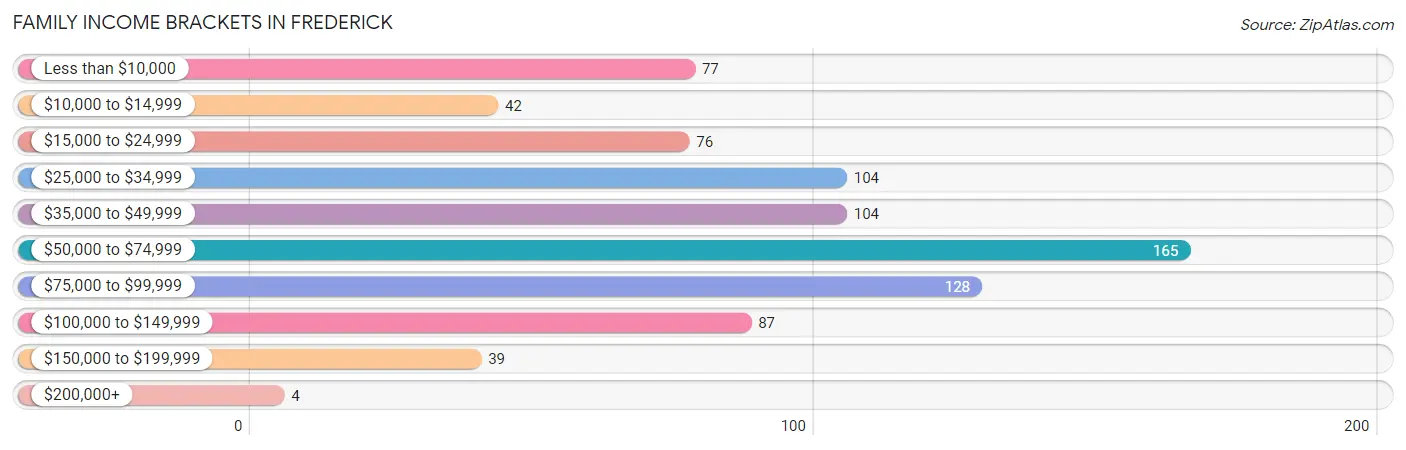
Family Income Brackets in Frederick
According to the Frederick family income data, there are 165 families falling into the $50,000 to $74,999 income range, which is the most common income bracket and makes up 20.0% of all families. Conversely, the $200,000+ income bracket is the least frequent group with only 4 families (0.5%) belonging to this category.
| Income Bracket | # Families | % Families |
| Less than $10,000 | 77 | 9.3% |
| $10,000 to $14,999 | 42 | 5.1% |
| $15,000 to $24,999 | 76 | 9.2% |
| $25,000 to $34,999 | 104 | 12.6% |
| $35,000 to $49,999 | 104 | 12.6% |
| $50,000 to $74,999 | 165 | 20.0% |
| $75,000 to $99,999 | 128 | 15.5% |
| $100,000 to $149,999 | 87 | 10.5% |
| $150,000 to $199,999 | 39 | 4.7% |
| $200,000+ | 4 | 0.5% |
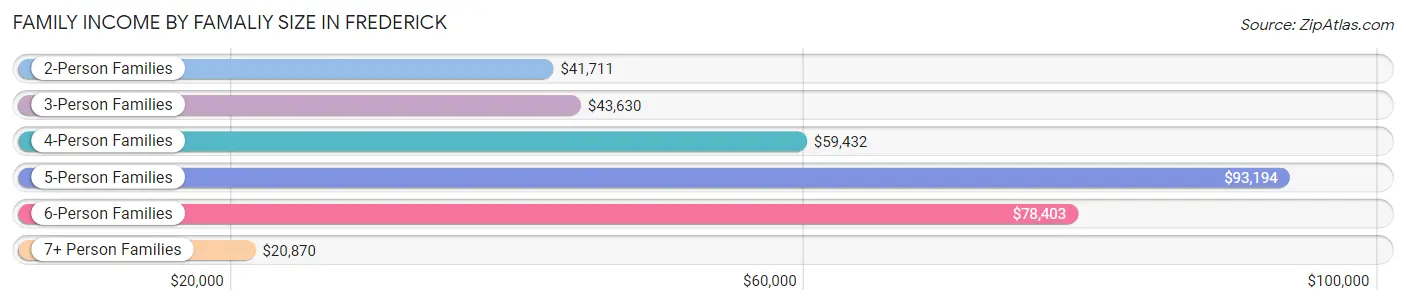
Family Income by Famaliy Size in Frederick
5-person families (83 | 10.1%) account for the highest median family income in Frederick with $93,194 per family, while 2-person families (296 | 35.8%) have the highest median income of $20,856 per family member.
| Income Bracket | # Families | Median Income |
| 2-Person Families | 296 (35.8%) | $41,711 |
| 3-Person Families | 237 (28.7%) | $43,630 |
| 4-Person Families | 131 (15.9%) | $59,432 |
| 5-Person Families | 83 (10.1%) | $93,194 |
| 6-Person Families | 39 (4.7%) | $78,403 |
| 7+ Person Families | 40 (4.8%) | $20,870 |
| Total | 826 (100.0%) | $52,273 |
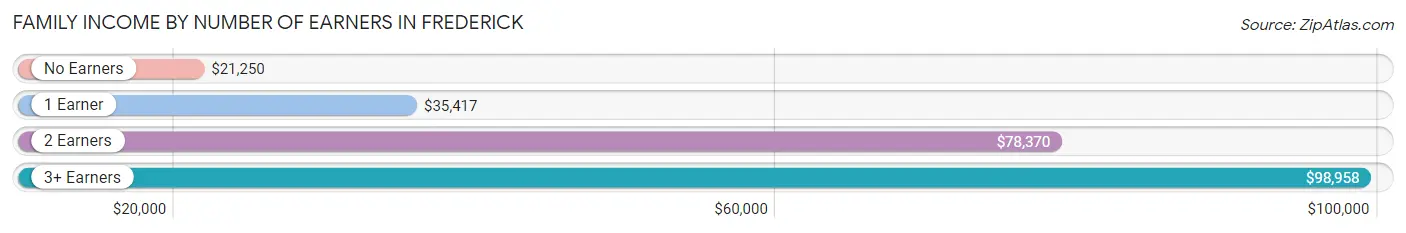
Family Income by Number of Earners in Frederick
The median family income in Frederick is $52,273, with families comprising 3+ earners (67) having the highest median family income of $98,958, while families with no earners (151) have the lowest median family income of $21,250, accounting for 8.1% and 18.3% of families, respectively.
| Number of Earners | # Families | Median Income |
| No Earners | 151 (18.3%) | $21,250 |
| 1 Earner | 338 (40.9%) | $35,417 |
| 2 Earners | 270 (32.7%) | $78,370 |
| 3+ Earners | 67 (8.1%) | $98,958 |
| Total | 826 (100.0%) | $52,273 |
Household Income in Frederick
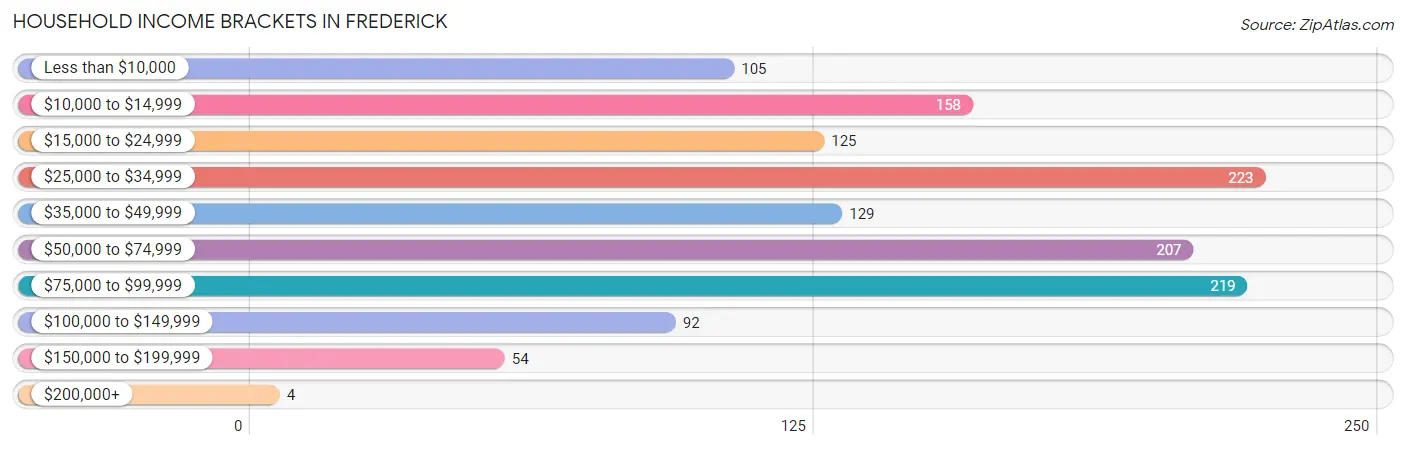
Household Income Brackets in Frederick
With 223 households falling in the category, the $25,000 to $34,999 income range is the most frequent in Frederick, accounting for 16.9% of all households. In contrast, only 4 households (0.3%) fall into the $200,000+ income bracket, making it the least populous group.
| Income Bracket | # Households | % Households |
| Less than $10,000 | 105 | 8.0% |
| $10,000 to $14,999 | 158 | 12.0% |
| $15,000 to $24,999 | 125 | 9.5% |
| $25,000 to $34,999 | 223 | 16.9% |
| $35,000 to $49,999 | 129 | 9.8% |
| $50,000 to $74,999 | 207 | 15.7% |
| $75,000 to $99,999 | 219 | 16.6% |
| $100,000 to $149,999 | 92 | 7.0% |
| $150,000 to $199,999 | 54 | 4.1% |
| $200,000+ | 4 | 0.3% |
Household Income by Householder Age in Frederick
The median household income in Frederick is $41,555, with the highest median household income of $63,313 found in the 25 to 44 years age bracket for the primary householder. A total of 331 households (25.1%) fall into this category. Meanwhile, the 15 to 24 years age bracket for the primary householder has the lowest median household income of $9,545, with 90 households (6.8%) in this group.
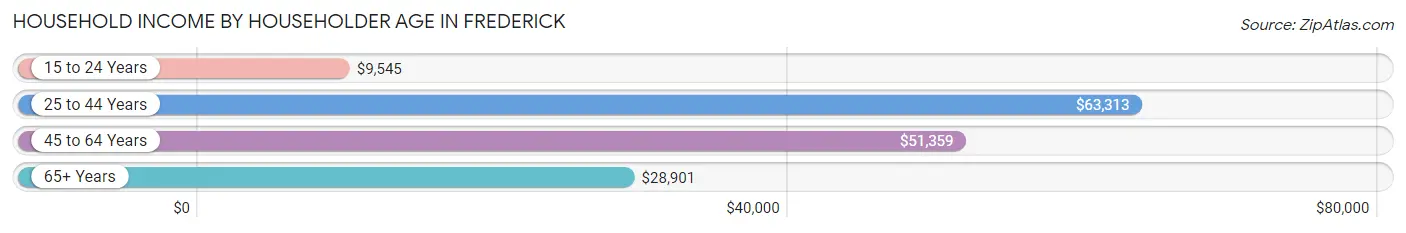
| Income Bracket | # Households | Median Income |
| 15 to 24 Years | 90 (6.8%) | $9,545 |
| 25 to 44 Years | 331 (25.1%) | $63,313 |
| 45 to 64 Years | 491 (37.3%) | $51,359 |
| 65+ Years | 405 (30.7%) | $28,901 |
| Total | 1,317 (100.0%) | $41,555 |
Poverty in Frederick
Income Below Poverty by Sex and Age in Frederick
With 18.1% poverty level for males and 21.8% for females among the residents of Frederick, under 5 year old males and 18 to 24 year old females are the most vulnerable to poverty, with 100 males (66.7%) and 77 females (43.3%) in their respective age groups living below the poverty level.
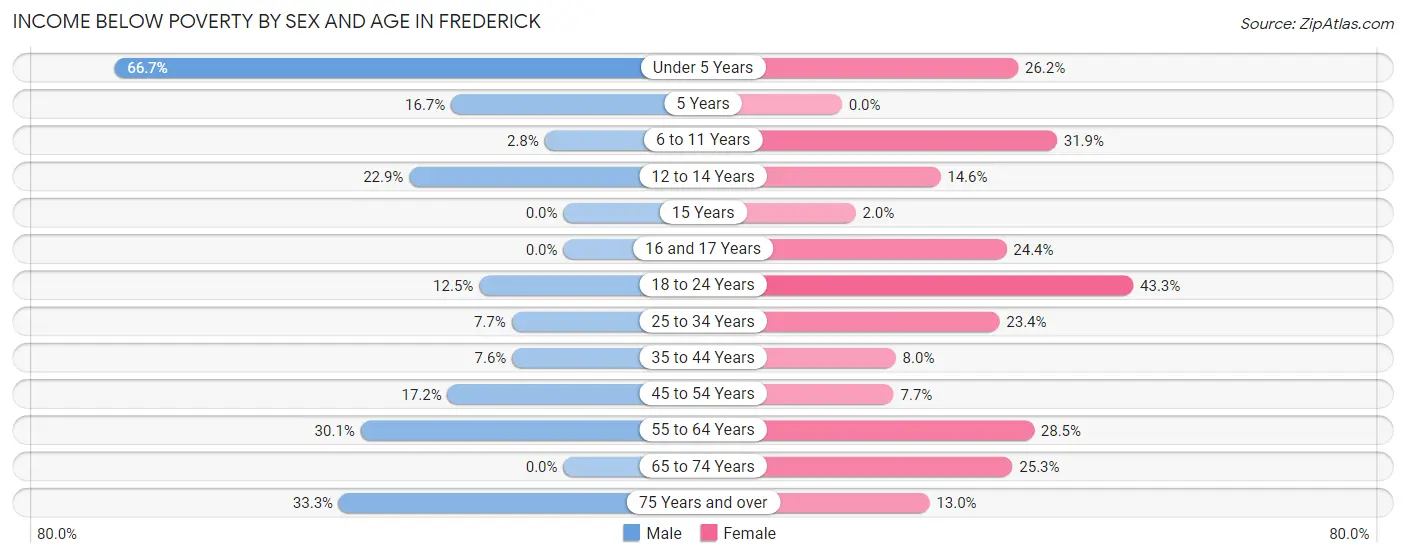
| Age Bracket | Male | Female |
| Under 5 Years | 100 (66.7%) | 28 (26.2%) |
| 5 Years | 4 (16.7%) | 0 (0.0%) |
| 6 to 11 Years | 4 (2.8%) | 53 (31.9%) |
| 12 to 14 Years | 19 (22.9%) | 12 (14.6%) |
| 15 Years | 0 (0.0%) | 1 (2.0%) |
| 16 and 17 Years | 0 (0.0%) | 11 (24.4%) |
| 18 to 24 Years | 18 (12.5%) | 77 (43.3%) |
| 25 to 34 Years | 16 (7.7%) | 33 (23.4%) |
| 35 to 44 Years | 13 (7.6%) | 20 (8.0%) |
| 45 to 54 Years | 27 (17.2%) | 14 (7.7%) |
| 55 to 64 Years | 59 (30.1%) | 75 (28.5%) |
| 65 to 74 Years | 0 (0.0%) | 58 (25.3%) |
| 75 Years and over | 22 (33.3%) | 19 (13.0%) |
| Total | 282 (18.1%) | 401 (21.8%) |
Income Above Poverty by Sex and Age in Frederick
According to the poverty statistics in Frederick, males aged 15 years and females aged 5 years are the age groups that are most secure financially, with 100.0% of males and 100.0% of females in these age groups living above the poverty line.
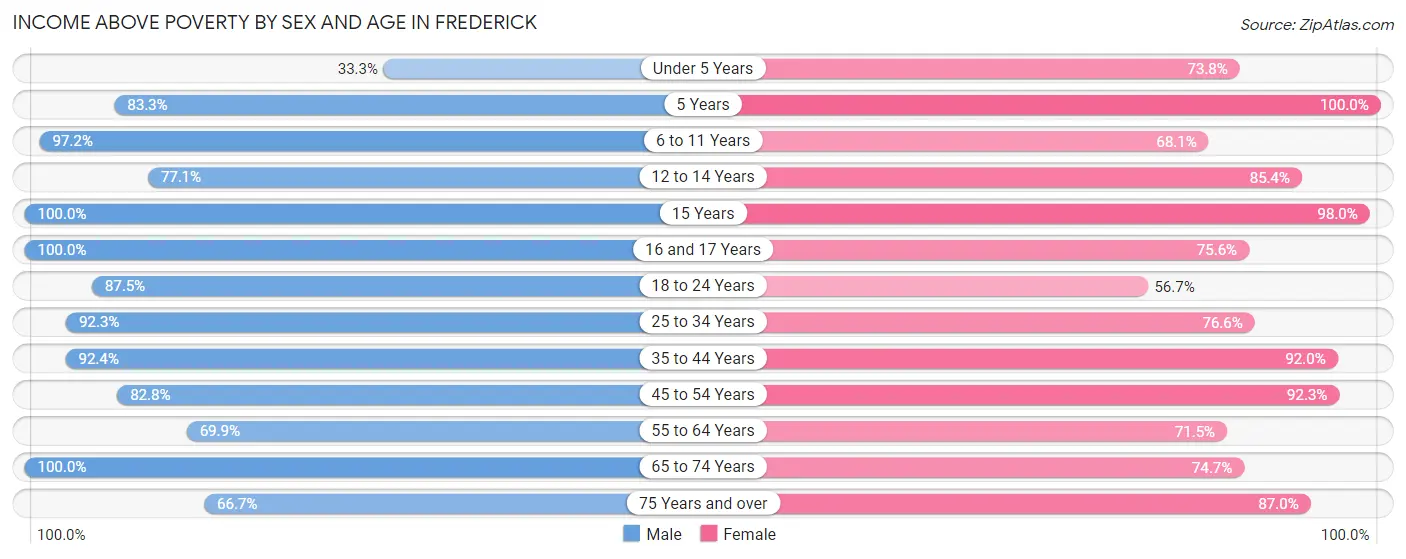
| Age Bracket | Male | Female |
| Under 5 Years | 50 (33.3%) | 79 (73.8%) |
| 5 Years | 20 (83.3%) | 5 (100.0%) |
| 6 to 11 Years | 140 (97.2%) | 113 (68.1%) |
| 12 to 14 Years | 64 (77.1%) | 70 (85.4%) |
| 15 Years | 10 (100.0%) | 48 (98.0%) |
| 16 and 17 Years | 12 (100.0%) | 34 (75.6%) |
| 18 to 24 Years | 126 (87.5%) | 101 (56.7%) |
| 25 to 34 Years | 192 (92.3%) | 108 (76.6%) |
| 35 to 44 Years | 158 (92.4%) | 230 (92.0%) |
| 45 to 54 Years | 130 (82.8%) | 168 (92.3%) |
| 55 to 64 Years | 137 (69.9%) | 188 (71.5%) |
| 65 to 74 Years | 189 (100.0%) | 171 (74.7%) |
| 75 Years and over | 44 (66.7%) | 127 (87.0%) |
| Total | 1,272 (81.9%) | 1,442 (78.2%) |
Income Below Poverty Among Married-Couple Families in Frederick
The poverty statistics for married-couple families in Frederick show that 13.8% or 75 of the total 545 families live below the poverty line. Families with 5 or more children have the highest poverty rate of 100.0%, comprising of 23 families. On the other hand, families with 3 or 4 children have the lowest poverty rate of 2.3%, which includes 2 families.
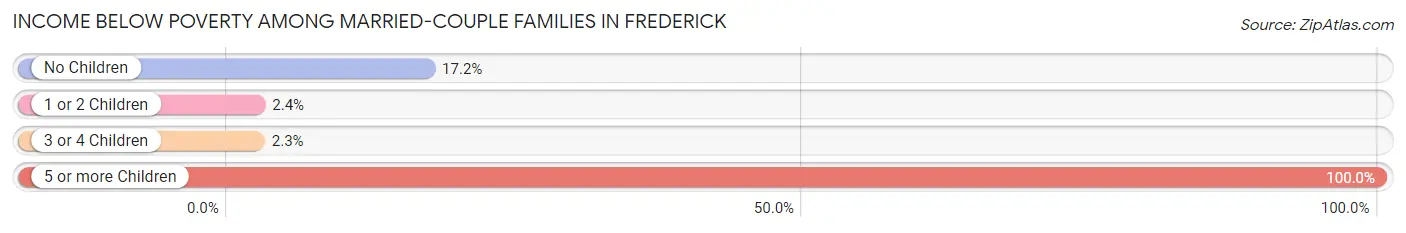
| Children | Above Poverty | Below Poverty |
| No Children | 222 (82.8%) | 46 (17.2%) |
| 1 or 2 Children | 164 (97.6%) | 4 (2.4%) |
| 3 or 4 Children | 84 (97.7%) | 2 (2.3%) |
| 5 or more Children | 0 (0.0%) | 23 (100.0%) |
| Total | 470 (86.2%) | 75 (13.8%) |
Income Below Poverty Among Single-Parent Households in Frederick
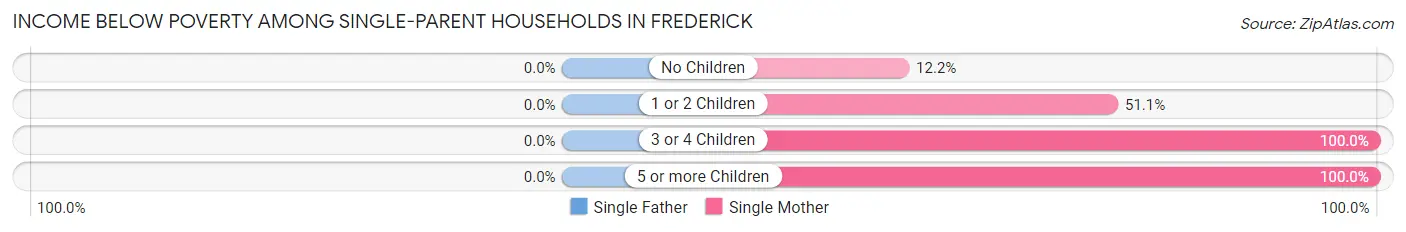
| Children | Single Father | Single Mother |
| No Children | 0 (0.0%) | 5 (12.2%) |
| 1 or 2 Children | 0 (0.0%) | 69 (51.1%) |
| 3 or 4 Children | 0 (0.0%) | 6 (100.0%) |
| 5 or more Children | 0 (0.0%) | 16 (100.0%) |
| Total | 0 (0.0%) | 96 (48.5%) |
Income Below Poverty Among Married-Couple vs Single-Parent Households in Frederick
The poverty data for Frederick shows that 75 of the married-couple family households (13.8%) and 96 of the single-parent households (34.2%) are living below the poverty level. Within the married-couple family households, those with 5 or more children have the highest poverty rate, with 23 households (100.0%) falling below the poverty line. Among the single-parent households, those with 3 or 4 children have the highest poverty rate, with 6 household (100.0%) living below poverty.
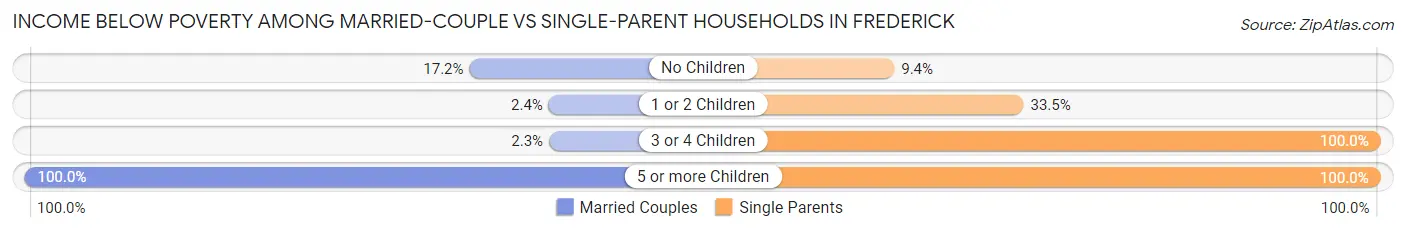
| Children | Married-Couple Families | Single-Parent Households |
| No Children | 46 (17.2%) | 5 (9.4%) |
| 1 or 2 Children | 4 (2.4%) | 69 (33.5%) |
| 3 or 4 Children | 2 (2.3%) | 6 (100.0%) |
| 5 or more Children | 23 (100.0%) | 16 (100.0%) |
| Total | 75 (13.8%) | 96 (34.2%) |
Race in Frederick
The most populous races in Frederick are White / Caucasian (2,174 | 62.4%), Hispanic or Latino (1,176 | 33.7%), and Some other Race (540 | 15.5%).
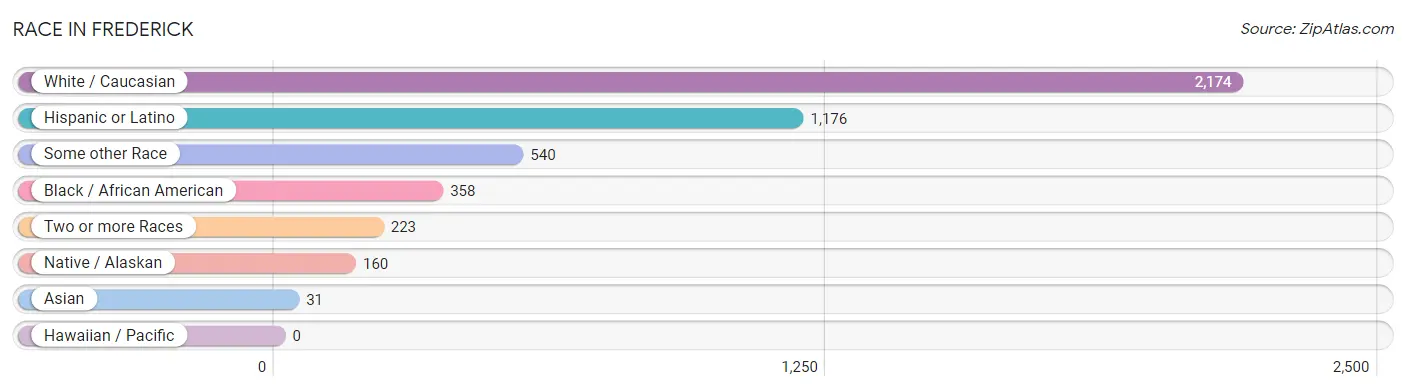
| Race | # Population | % Population |
| Asian | 31 | 0.9% |
| Black / African American | 358 | 10.3% |
| Hawaiian / Pacific | 0 | 0.0% |
| Hispanic or Latino | 1,176 | 33.7% |
| Native / Alaskan | 160 | 4.6% |
| White / Caucasian | 2,174 | 62.4% |
| Two or more Races | 223 | 6.4% |
| Some other Race | 540 | 15.5% |
| Total | 3,486 | 100.0% |
Ancestry in Frederick
The most populous ancestries reported in Frederick are Mexican (1,147 | 32.9%), American (443 | 12.7%), English (394 | 11.3%), German (312 | 8.9%), and Irish (194 | 5.6%), together accounting for 71.4% of all Frederick residents.
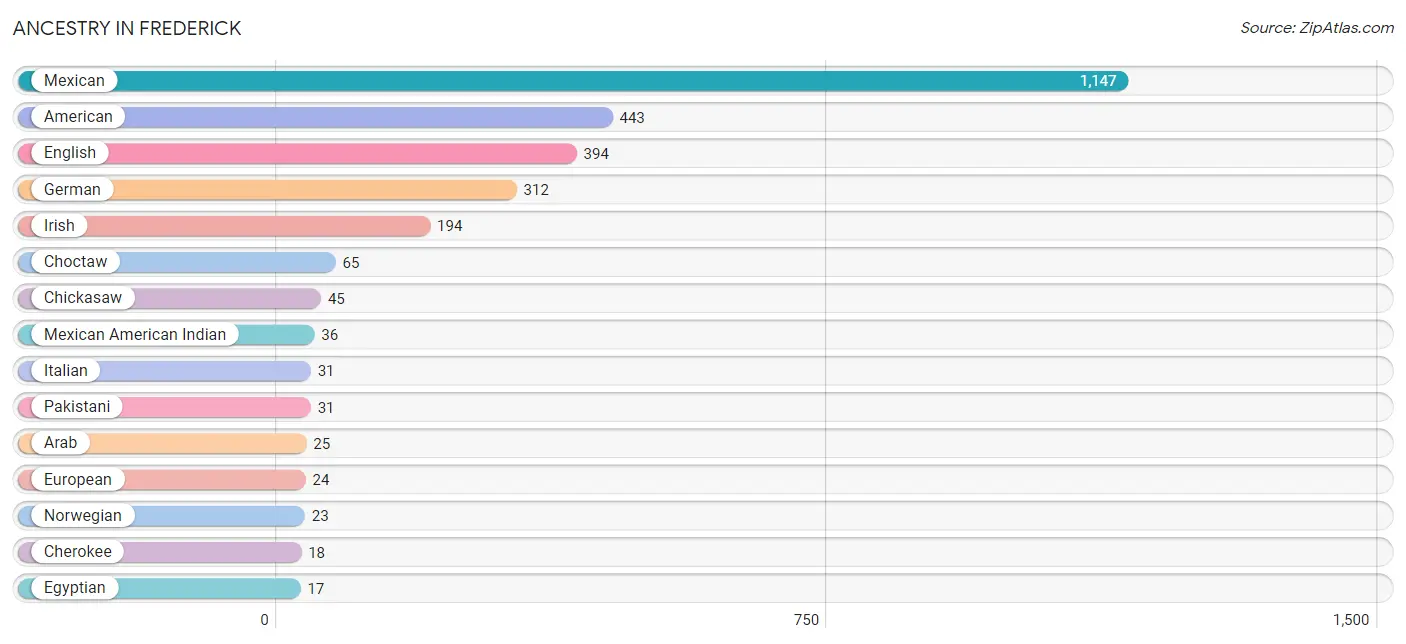
| Ancestry | # Population | % Population |
| African | 7 | 0.2% |
| American | 443 | 12.7% |
| Arab | 25 | 0.7% |
| British | 4 | 0.1% |
| Burmese | 4 | 0.1% |
| Cherokee | 18 | 0.5% |
| Chickasaw | 45 | 1.3% |
| Choctaw | 65 | 1.9% |
| Egyptian | 17 | 0.5% |
| English | 394 | 11.3% |
| European | 24 | 0.7% |
| French | 17 | 0.5% |
| German | 312 | 8.9% |
| Irish | 194 | 5.6% |
| Iroquois | 14 | 0.4% |
| Italian | 31 | 0.9% |
| Mexican | 1,147 | 32.9% |
| Mexican American Indian | 36 | 1.0% |
| Norwegian | 23 | 0.7% |
| Pakistani | 31 | 0.9% |
| Polish | 13 | 0.4% |
| Portuguese | 6 | 0.2% |
| Scotch-Irish | 6 | 0.2% |
| Scottish | 17 | 0.5% |
| Spaniard | 14 | 0.4% |
| Spanish American Indian | 10 | 0.3% |
| Subsaharan African | 7 | 0.2% |
| Swedish | 16 | 0.5% |
| Welsh | 5 | 0.1% | View All 29 Rows |
Immigrants in Frederick
The most numerous immigrant groups reported in Frederick came from Central America (163 | 4.7%), Latin America (163 | 4.7%), Mexico (163 | 4.7%), Asia (31 | 0.9%), and Europe (18 | 0.5%), together accounting for 15.4% of all Frederick residents.
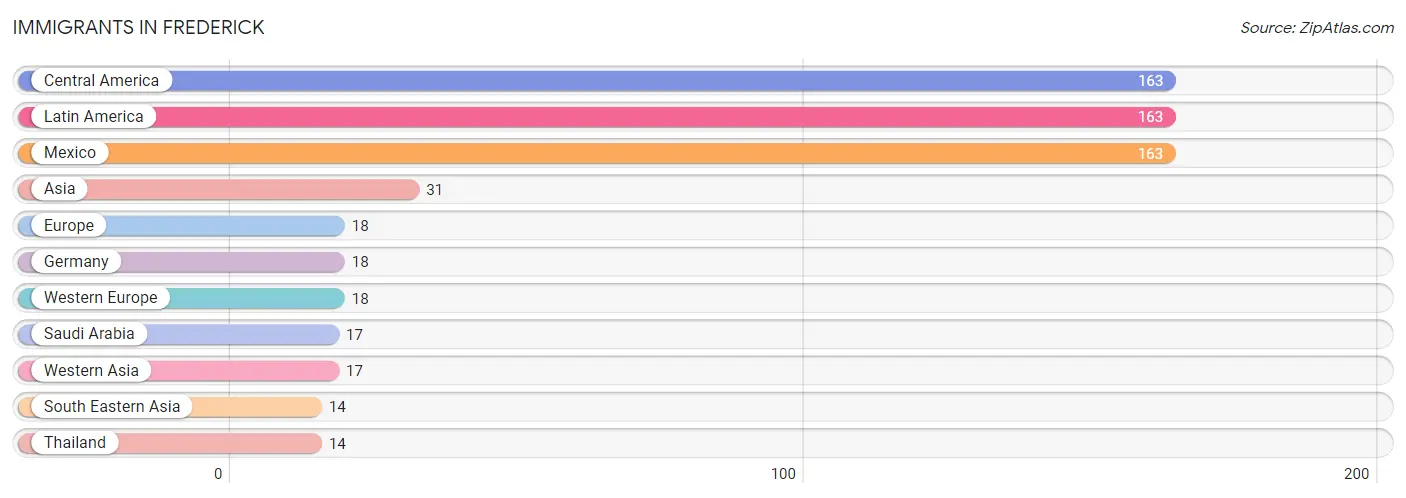
| Immigration Origin | # Population | % Population |
| Asia | 31 | 0.9% |
| Central America | 163 | 4.7% |
| Europe | 18 | 0.5% |
| Germany | 18 | 0.5% |
| Latin America | 163 | 4.7% |
| Mexico | 163 | 4.7% |
| Saudi Arabia | 17 | 0.5% |
| South Eastern Asia | 14 | 0.4% |
| Thailand | 14 | 0.4% |
| Western Asia | 17 | 0.5% |
| Western Europe | 18 | 0.5% | View All 11 Rows |
Sex and Age in Frederick
Sex and Age in Frederick
The most populous age groups in Frederick are Under 5 Years (150 | 9.2%) for men and 35 to 39 Years (167 | 9.0%) for women.
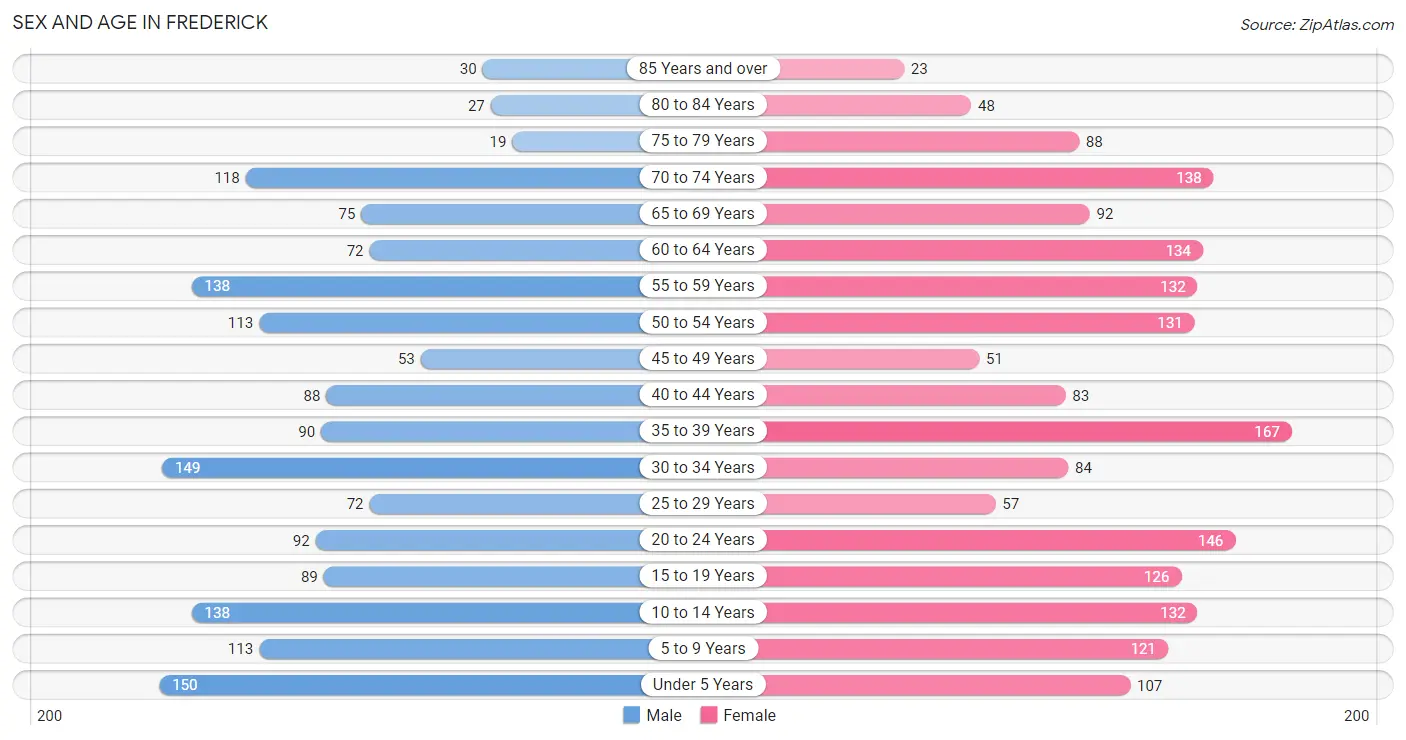
| Age Bracket | Male | Female |
| Under 5 Years | 150 (9.2%) | 107 (5.8%) |
| 5 to 9 Years | 113 (7.0%) | 121 (6.5%) |
| 10 to 14 Years | 138 (8.5%) | 132 (7.1%) |
| 15 to 19 Years | 89 (5.5%) | 126 (6.8%) |
| 20 to 24 Years | 92 (5.7%) | 146 (7.9%) |
| 25 to 29 Years | 72 (4.4%) | 57 (3.1%) |
| 30 to 34 Years | 149 (9.2%) | 84 (4.5%) |
| 35 to 39 Years | 90 (5.5%) | 167 (9.0%) |
| 40 to 44 Years | 88 (5.4%) | 83 (4.5%) |
| 45 to 49 Years | 53 (3.3%) | 51 (2.7%) |
| 50 to 54 Years | 113 (7.0%) | 131 (7.0%) |
| 55 to 59 Years | 138 (8.5%) | 132 (7.1%) |
| 60 to 64 Years | 72 (4.4%) | 134 (7.2%) |
| 65 to 69 Years | 75 (4.6%) | 92 (5.0%) |
| 70 to 74 Years | 118 (7.3%) | 138 (7.4%) |
| 75 to 79 Years | 19 (1.2%) | 88 (4.7%) |
| 80 to 84 Years | 27 (1.7%) | 48 (2.6%) |
| 85 Years and over | 30 (1.8%) | 23 (1.2%) |
| Total | 1,626 (100.0%) | 1,860 (100.0%) |
Families and Households in Frederick
Median Family Size in Frederick
The median family size in Frederick is 3.36 persons per family, with married-couple families (545 | 66.0%) accounting for the largest median family size of 3.53 persons per family. On the other hand, single male/father families (83 | 10.1%) represent the smallest median family size with 1.88 persons per family.
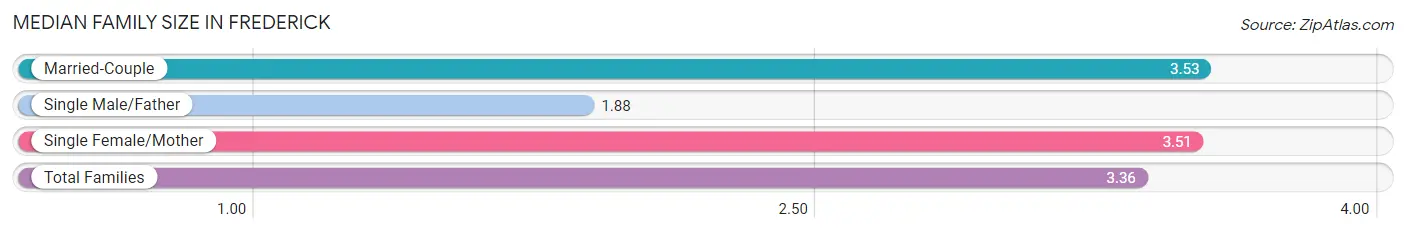
| Family Type | # Families | Family Size |
| Married-Couple | 545 (66.0%) | 3.53 |
| Single Male/Father | 83 (10.1%) | 1.88 |
| Single Female/Mother | 198 (24.0%) | 3.51 |
| Total Families | 826 (100.0%) | 3.36 |
Median Household Size in Frederick
The median household size in Frederick is 2.58 persons per household, with single female/mother households (198 | 15.0%) accounting for the largest median household size of 3.78 persons per household. non-family households (491 | 37.3%) represent the smallest median household size with 1.05 persons per household.
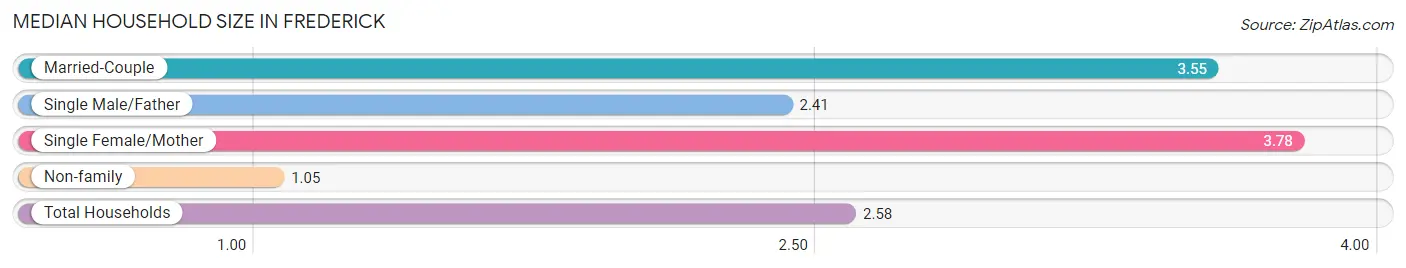
| Household Type | # Households | Household Size |
| Married-Couple | 545 (41.4%) | 3.55 |
| Single Male/Father | 83 (6.3%) | 2.41 |
| Single Female/Mother | 198 (15.0%) | 3.78 |
| Non-family | 491 (37.3%) | 1.05 |
| Total Households | 1,317 (100.0%) | 2.58 |
Household Size by Marriage Status in Frederick
Out of a total of 1,317 households in Frederick, 826 (62.7%) are family households, while 491 (37.3%) are nonfamily households. The most numerous type of family households are 2-person households, comprising 286, and the most common type of nonfamily households are 1-person households, comprising 458.
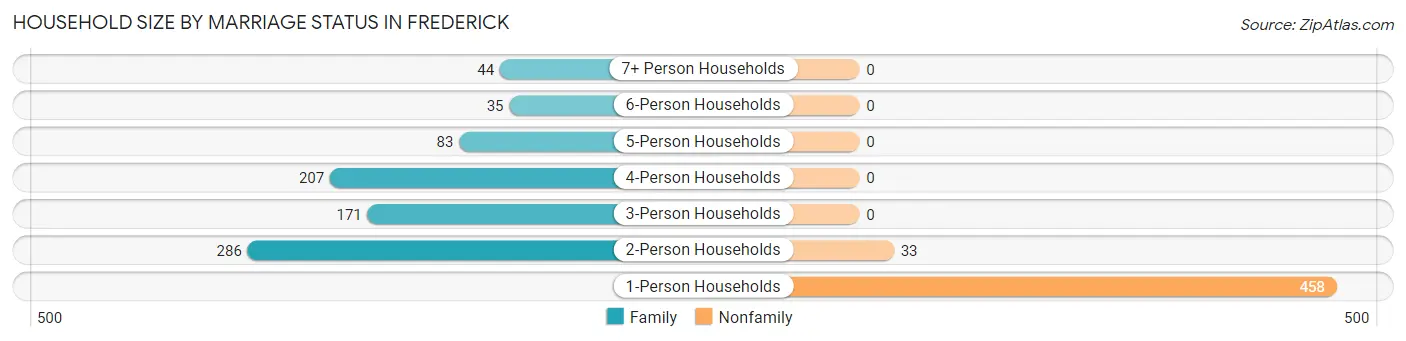
| Household Size | Family Households | Nonfamily Households |
| 1-Person Households | - | 458 (34.8%) |
| 2-Person Households | 286 (21.7%) | 33 (2.5%) |
| 3-Person Households | 171 (13.0%) | 0 (0.0%) |
| 4-Person Households | 207 (15.7%) | 0 (0.0%) |
| 5-Person Households | 83 (6.3%) | 0 (0.0%) |
| 6-Person Households | 35 (2.7%) | 0 (0.0%) |
| 7+ Person Households | 44 (3.3%) | 0 (0.0%) |
| Total | 826 (62.7%) | 491 (37.3%) |
Female Fertility in Frederick
Fertility by Age in Frederick
Average fertility rate in Frederick is 107.0 births per 1,000 women. Women in the age bracket of 20 to 34 years have the highest fertility rate with 275.0 births per 1,000 women. Women in the age bracket of 20 to 34 years acount for 100.0% of all women with births.
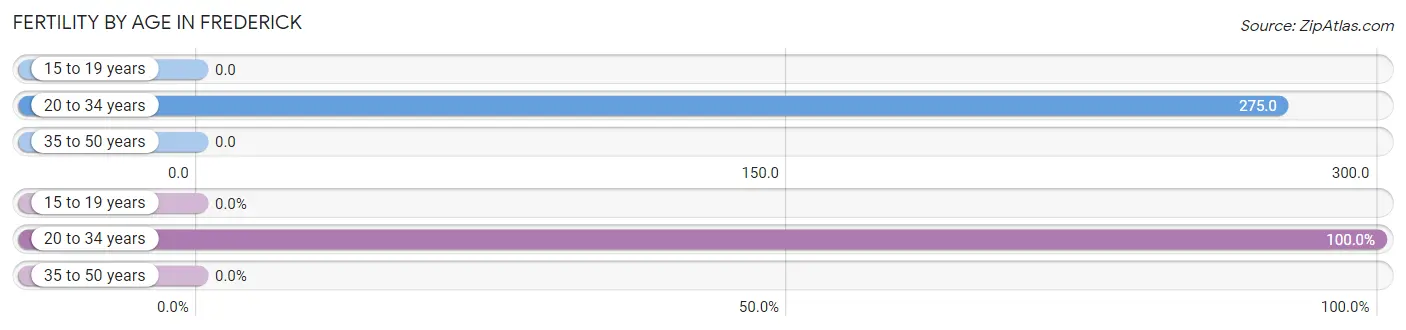
| Age Bracket | Women with Births | Births / 1,000 Women |
| 15 to 19 years | 0 (0.0%) | 0.0 |
| 20 to 34 years | 79 (100.0%) | 275.0 |
| 35 to 50 years | 0 (0.0%) | 0.0 |
| Total | 79 (100.0%) | 107.0 |
Fertility by Age by Marriage Status in Frederick
8.9% of women with births (79) in Frederick are married. The highest percentage of unmarried women with births falls into 20 to 34 years age bracket with 91.1% of them unmarried at the time of birth, while the lowest percentage of unmarried women with births belong to 20 to 34 years age bracket with 91.1% of them unmarried.
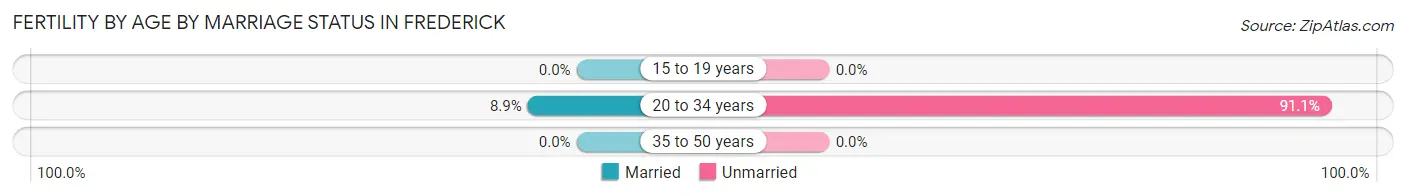
| Age Bracket | Married | Unmarried |
| 15 to 19 years | 0 (0.0%) | 0 (0.0%) |
| 20 to 34 years | 7 (8.9%) | 72 (91.1%) |
| 35 to 50 years | 0 (0.0%) | 0 (0.0%) |
| Total | 7 (8.9%) | 72 (91.1%) |
Fertility by Education in Frederick
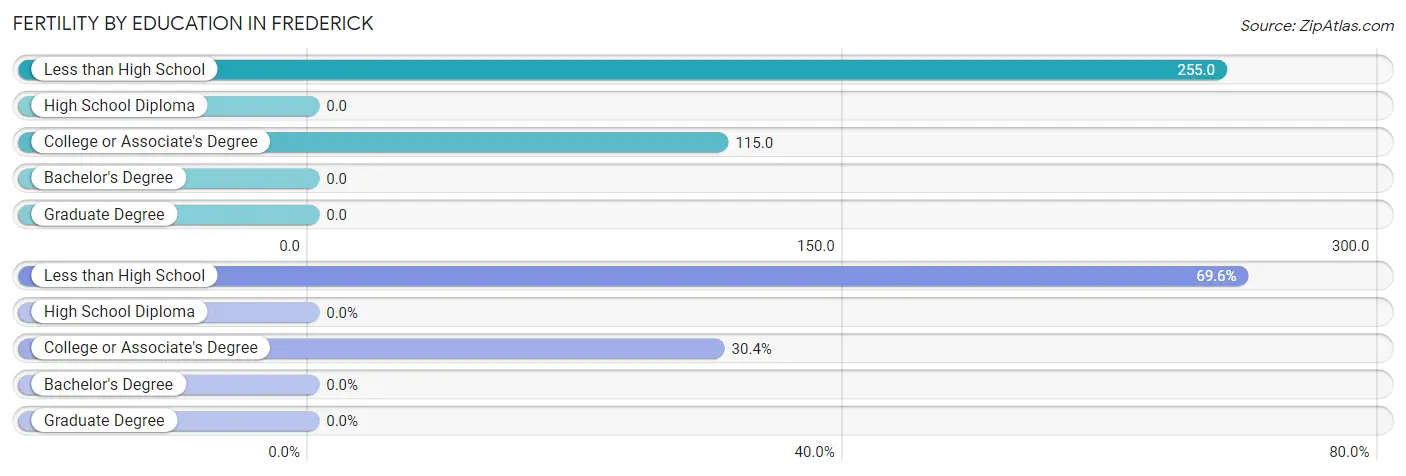
| Educational Attainment | Women with Births | Births / 1,000 Women |
| Less than High School | 55 (69.6%) | 255.0 |
| High School Diploma | 0 (0.0%) | 0.0 |
| College or Associate's Degree | 24 (30.4%) | 115.0 |
| Bachelor's Degree | 0 (0.0%) | 0.0 |
| Graduate Degree | 0 (0.0%) | 0.0 |
| Total | 79 (100.0%) | 107.0 |
Fertility by Education by Marriage Status in Frederick
91.1% of women with births in Frederick are unmarried. Women with the educational attainment of college or associate's degree are most likely to be married with 29.2% of them married at childbirth, while women with the educational attainment of less than high school are least likely to be married with 100.0% of them unmarried at childbirth.
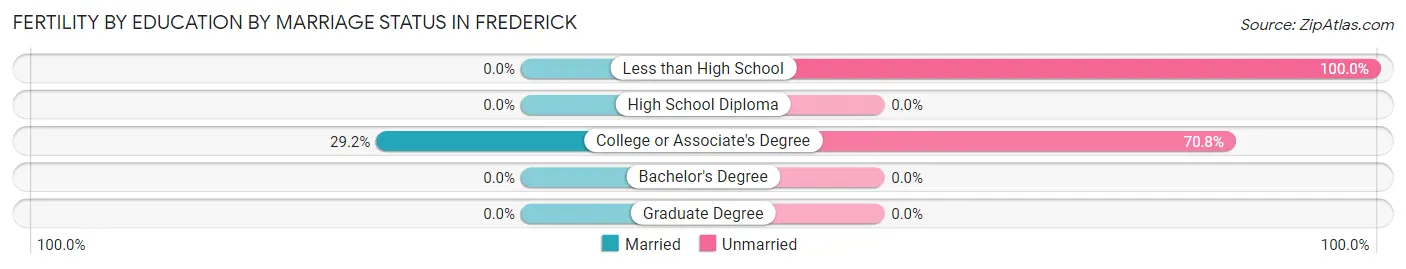
| Educational Attainment | Married | Unmarried |
| Less than High School | 0 (0.0%) | 55 (100.0%) |
| High School Diploma | 0 (0.0%) | 0 (0.0%) |
| College or Associate's Degree | 7 (29.2%) | 17 (70.8%) |
| Bachelor's Degree | 0 (0.0%) | 0 (0.0%) |
| Graduate Degree | 0 (0.0%) | 0 (0.0%) |
| Total | 7 (8.9%) | 72 (91.1%) |
Employment Characteristics in Frederick
Employment by Class of Employer in Frederick
Among the 1,283 employed individuals in Frederick, private company employees (857 | 66.8%), local government employees (156 | 12.2%), and state government employees (74 | 5.8%) make up the most common classes of employment.
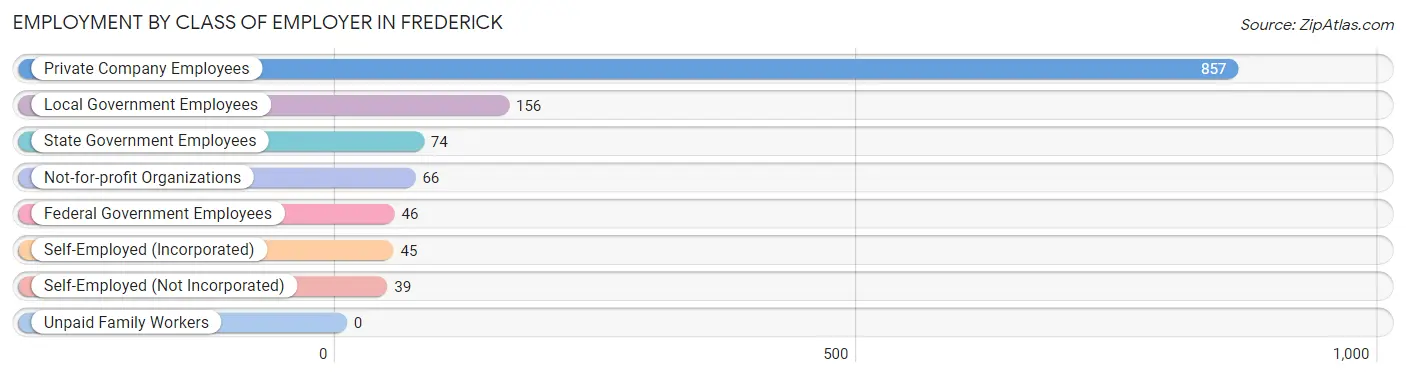
| Employer Class | # Employees | % Employees |
| Private Company Employees | 857 | 66.8% |
| Self-Employed (Incorporated) | 45 | 3.5% |
| Self-Employed (Not Incorporated) | 39 | 3.0% |
| Not-for-profit Organizations | 66 | 5.1% |
| Local Government Employees | 156 | 12.2% |
| State Government Employees | 74 | 5.8% |
| Federal Government Employees | 46 | 3.6% |
| Unpaid Family Workers | 0 | 0.0% |
| Total | 1,283 | 100.0% |
Employment Status by Age in Frederick
According to the labor force statistics for Frederick, out of the total population over 16 years of age (2,666), 51.4% or 1,370 individuals are in the labor force, with 2.8% or 38 of them unemployed. The age group with the highest labor force participation rate is 30 to 34 years, with 86.7% or 202 individuals in the labor force. Within the labor force, the 60 to 64 years age range has the highest percentage of unemployed individuals, with 17.4% or 12 of them being unemployed.
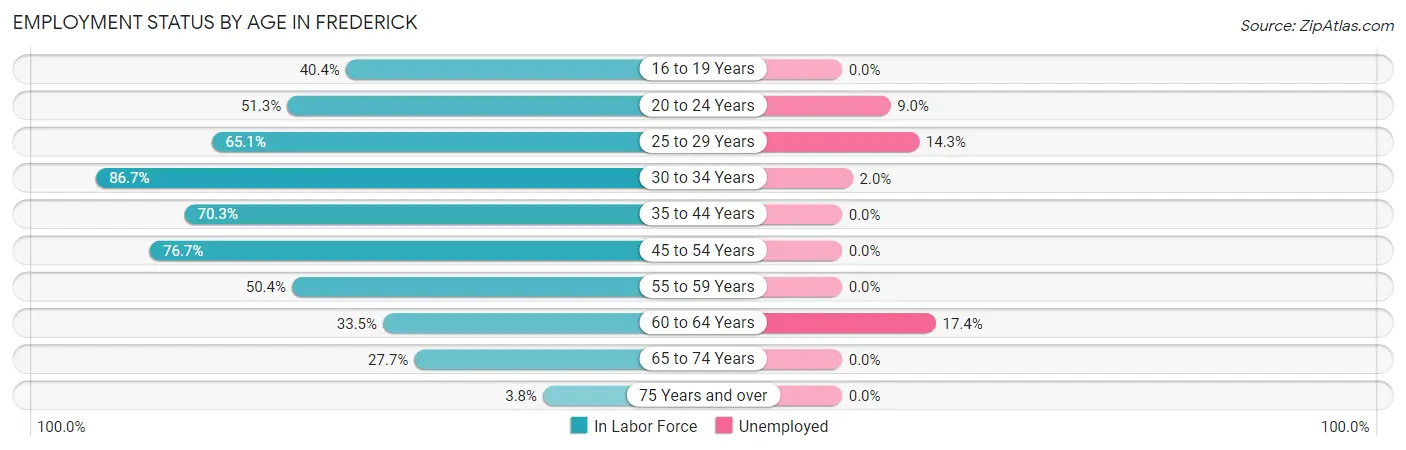
| Age Bracket | In Labor Force | Unemployed |
| 16 to 19 Years | 63 (40.4%) | 0 (0.0%) |
| 20 to 24 Years | 122 (51.3%) | 11 (9.0%) |
| 25 to 29 Years | 84 (65.1%) | 12 (14.3%) |
| 30 to 34 Years | 202 (86.7%) | 4 (2.0%) |
| 35 to 44 Years | 301 (70.3%) | 0 (0.0%) |
| 45 to 54 Years | 267 (76.7%) | 0 (0.0%) |
| 55 to 59 Years | 136 (50.4%) | 0 (0.0%) |
| 60 to 64 Years | 69 (33.5%) | 12 (17.4%) |
| 65 to 74 Years | 117 (27.7%) | 0 (0.0%) |
| 75 Years and over | 9 (3.8%) | 0 (0.0%) |
| Total | 1,370 (51.4%) | 38 (2.8%) |
Employment Status by Educational Attainment in Frederick
According to labor force statistics for Frederick, 65.6% of individuals (1,059) out of the total population between 25 and 64 years of age (1,614) are in the labor force, with 2.6% or 28 of them being unemployed. The group with the highest labor force participation rate are those with the educational attainment of bachelor's degree or higher, with 80.2% or 174 individuals in the labor force. Within the labor force, individuals with less than high school education have the highest percentage of unemployment, with 6.7% or 12 of them being unemployed.
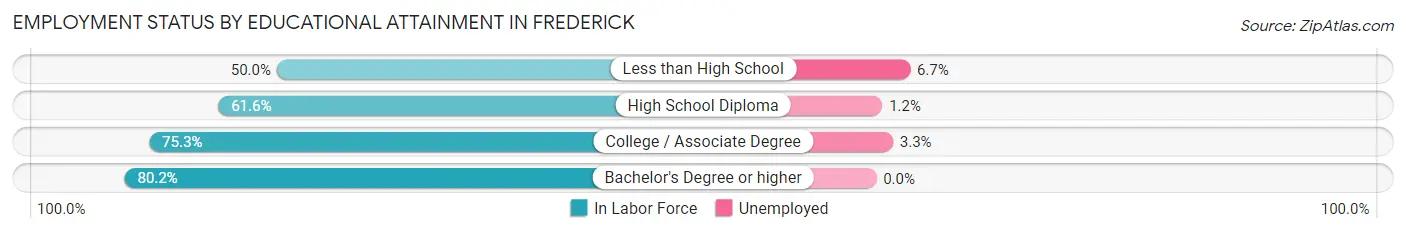
| Educational Attainment | In Labor Force | Unemployed |
| Less than High School | 180 (50.0%) | 24 (6.7%) |
| High School Diploma | 340 (61.6%) | 7 (1.2%) |
| College / Associate Degree | 365 (75.3%) | 16 (3.3%) |
| Bachelor's Degree or higher | 174 (80.2%) | 0 (0.0%) |
| Total | 1,059 (65.6%) | 42 (2.6%) |
Employment Occupations by Sex in Frederick
Management, Business, Science and Arts Occupations
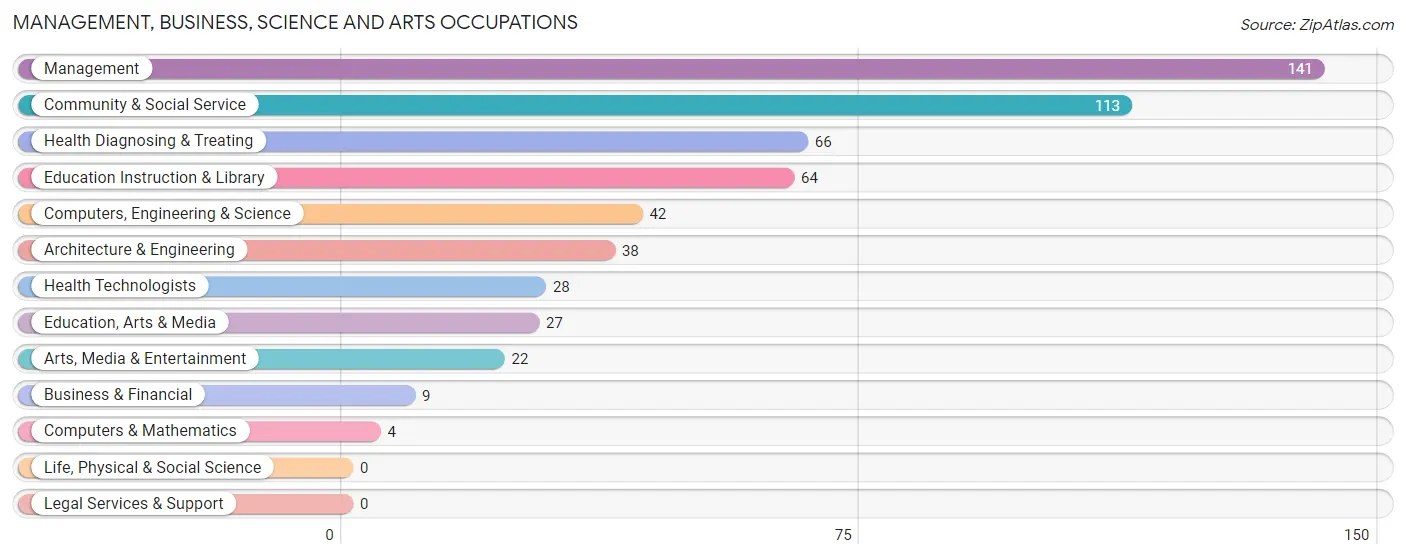
The most common Management, Business, Science and Arts occupations in Frederick are Management (141 | 10.6%), Community & Social Service (113 | 8.5%), Health Diagnosing & Treating (66 | 5.0%), Education Instruction & Library (64 | 4.8%), and Computers, Engineering & Science (42 | 3.2%).
Management, Business, Science and Arts Occupations by Sex
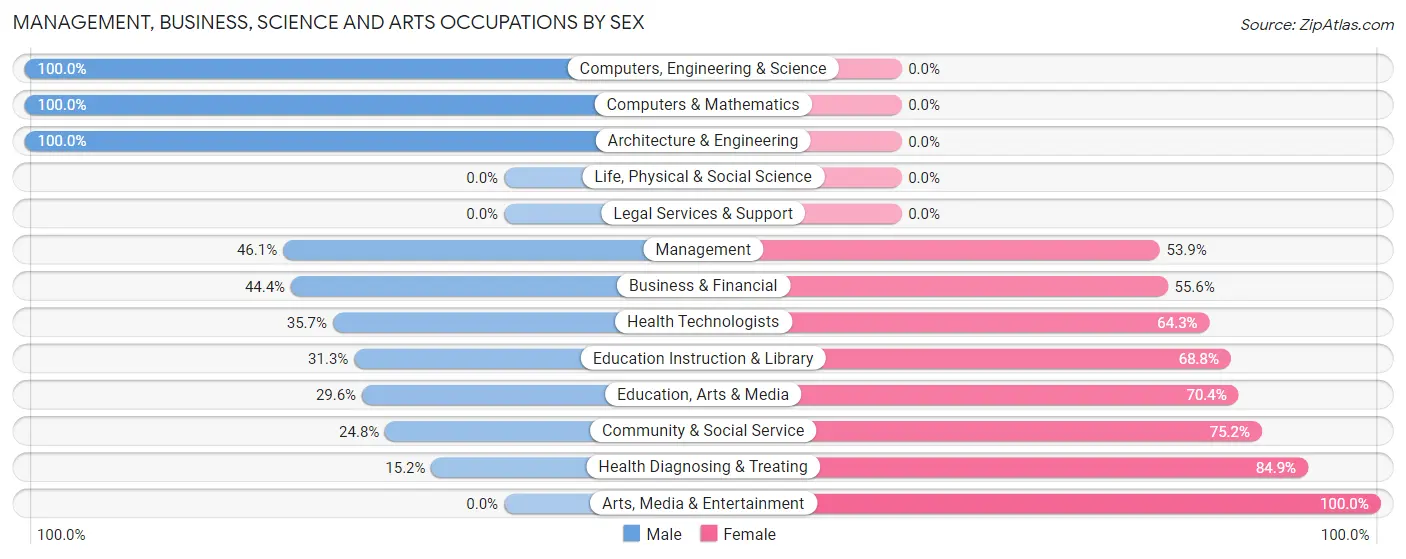
Within the Management, Business, Science and Arts occupations in Frederick, the most male-oriented occupations are Computers, Engineering & Science (100.0%), Computers & Mathematics (100.0%), and Architecture & Engineering (100.0%), while the most female-oriented occupations are Arts, Media & Entertainment (100.0%), Health Diagnosing & Treating (84.9%), and Community & Social Service (75.2%).
| Occupation | Male | Female |
| Management | 65 (46.1%) | 76 (53.9%) |
| Business & Financial | 4 (44.4%) | 5 (55.6%) |
| Computers, Engineering & Science | 42 (100.0%) | 0 (0.0%) |
| Computers & Mathematics | 4 (100.0%) | 0 (0.0%) |
| Architecture & Engineering | 38 (100.0%) | 0 (0.0%) |
| Life, Physical & Social Science | 0 (0.0%) | 0 (0.0%) |
| Community & Social Service | 28 (24.8%) | 85 (75.2%) |
| Education, Arts & Media | 8 (29.6%) | 19 (70.4%) |
| Legal Services & Support | 0 (0.0%) | 0 (0.0%) |
| Education Instruction & Library | 20 (31.2%) | 44 (68.8%) |
| Arts, Media & Entertainment | 0 (0.0%) | 22 (100.0%) |
| Health Diagnosing & Treating | 10 (15.1%) | 56 (84.9%) |
| Health Technologists | 10 (35.7%) | 18 (64.3%) |
| Total (Category) | 149 (40.2%) | 222 (59.8%) |
| Total (Overall) | 751 (56.4%) | 580 (43.6%) |
Services Occupations
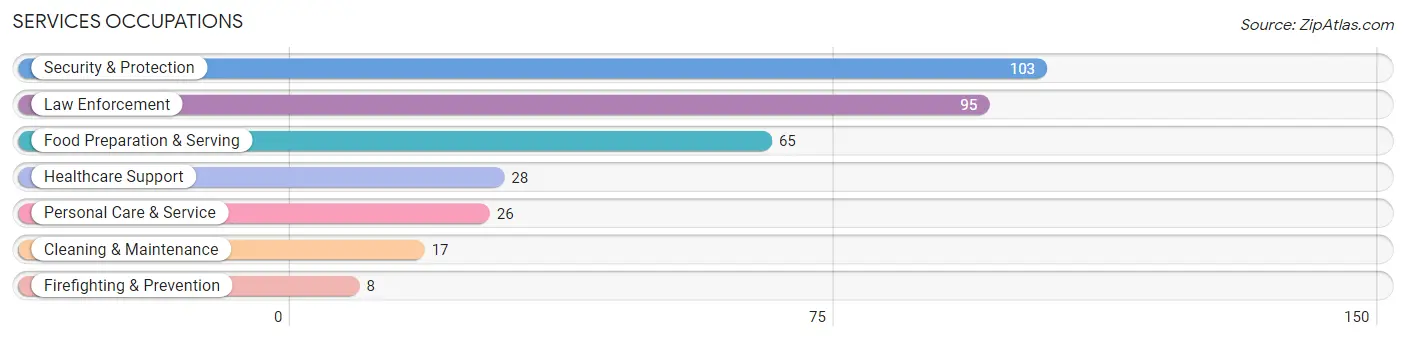
The most common Services occupations in Frederick are Security & Protection (103 | 7.7%), Law Enforcement (95 | 7.1%), Food Preparation & Serving (65 | 4.9%), Healthcare Support (28 | 2.1%), and Personal Care & Service (26 | 1.9%).
Services Occupations by Sex
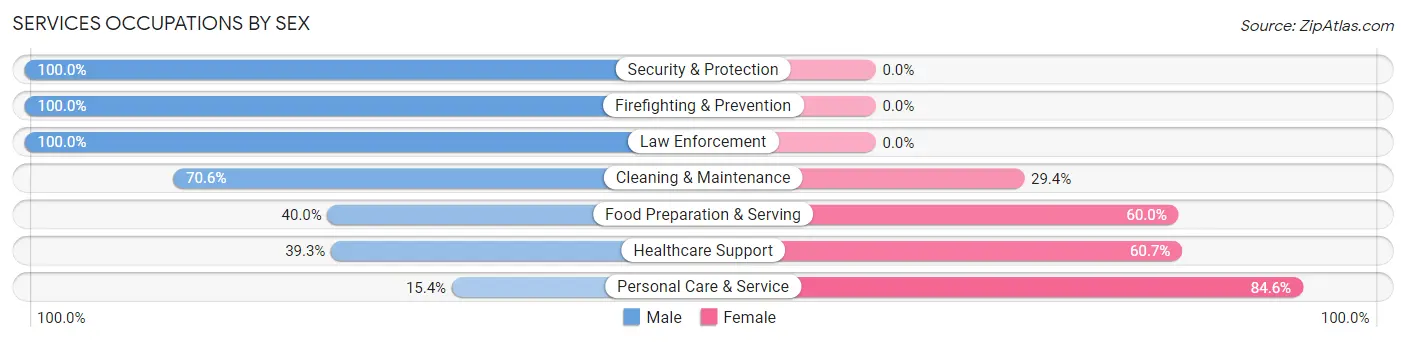
Within the Services occupations in Frederick, the most male-oriented occupations are Security & Protection (100.0%), Firefighting & Prevention (100.0%), and Law Enforcement (100.0%), while the most female-oriented occupations are Personal Care & Service (84.6%), Healthcare Support (60.7%), and Food Preparation & Serving (60.0%).
| Occupation | Male | Female |
| Healthcare Support | 11 (39.3%) | 17 (60.7%) |
| Security & Protection | 103 (100.0%) | 0 (0.0%) |
| Firefighting & Prevention | 8 (100.0%) | 0 (0.0%) |
| Law Enforcement | 95 (100.0%) | 0 (0.0%) |
| Food Preparation & Serving | 26 (40.0%) | 39 (60.0%) |
| Cleaning & Maintenance | 12 (70.6%) | 5 (29.4%) |
| Personal Care & Service | 4 (15.4%) | 22 (84.6%) |
| Total (Category) | 156 (65.3%) | 83 (34.7%) |
| Total (Overall) | 751 (56.4%) | 580 (43.6%) |
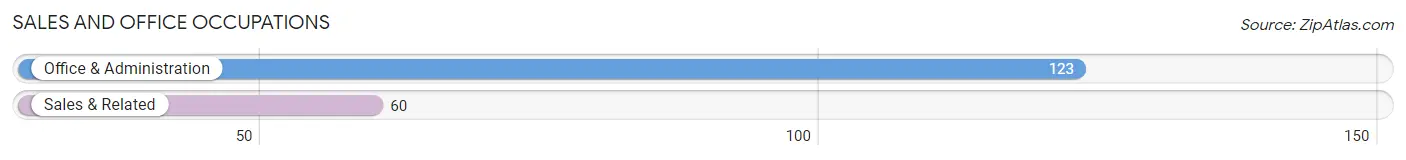
Sales and Office Occupations
The most common Sales and Office occupations in Frederick are Office & Administration (123 | 9.2%), and Sales & Related (60 | 4.5%).
Sales and Office Occupations by Sex
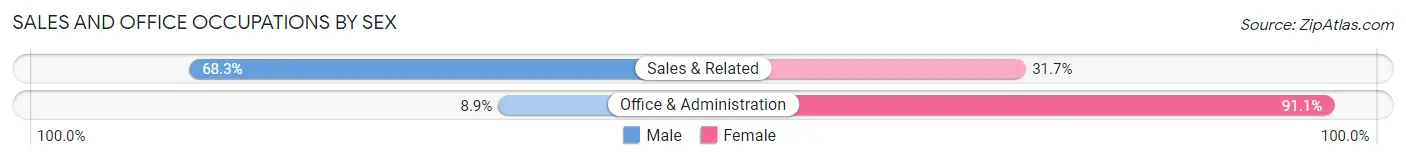
| Occupation | Male | Female |
| Sales & Related | 41 (68.3%) | 19 (31.7%) |
| Office & Administration | 11 (8.9%) | 112 (91.1%) |
| Total (Category) | 52 (28.4%) | 131 (71.6%) |
| Total (Overall) | 751 (56.4%) | 580 (43.6%) |
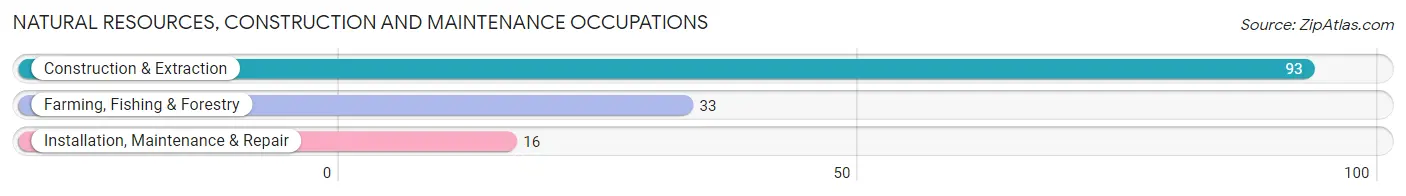
Natural Resources, Construction and Maintenance Occupations
The most common Natural Resources, Construction and Maintenance occupations in Frederick are Construction & Extraction (93 | 7.0%), Farming, Fishing & Forestry (33 | 2.5%), and Installation, Maintenance & Repair (16 | 1.2%).
Natural Resources, Construction and Maintenance Occupations by Sex
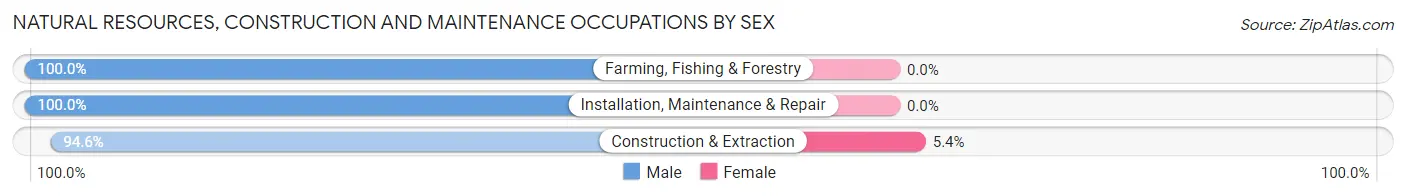
| Occupation | Male | Female |
| Farming, Fishing & Forestry | 33 (100.0%) | 0 (0.0%) |
| Construction & Extraction | 88 (94.6%) | 5 (5.4%) |
| Installation, Maintenance & Repair | 16 (100.0%) | 0 (0.0%) |
| Total (Category) | 137 (96.5%) | 5 (3.5%) |
| Total (Overall) | 751 (56.4%) | 580 (43.6%) |
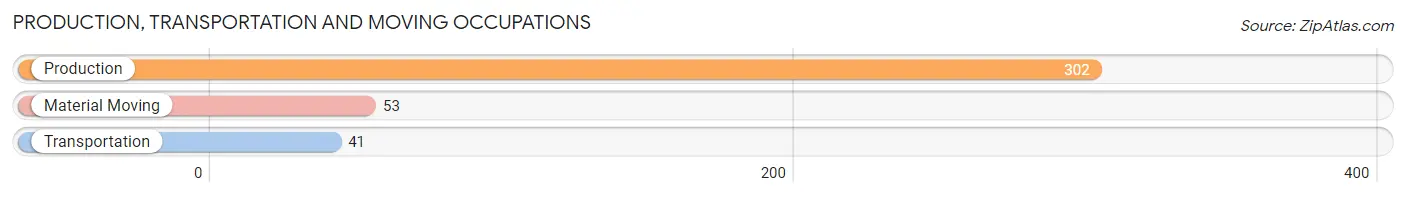
Production, Transportation and Moving Occupations
The most common Production, Transportation and Moving occupations in Frederick are Production (302 | 22.7%), Material Moving (53 | 4.0%), and Transportation (41 | 3.1%).
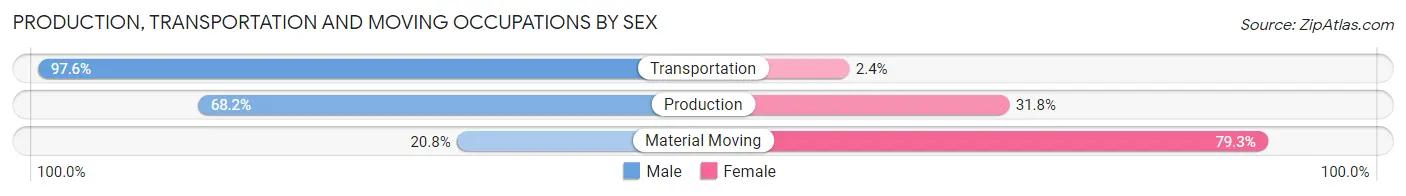
Production, Transportation and Moving Occupations by Sex
| Occupation | Male | Female |
| Production | 206 (68.2%) | 96 (31.8%) |
| Transportation | 40 (97.6%) | 1 (2.4%) |
| Material Moving | 11 (20.7%) | 42 (79.2%) |
| Total (Category) | 257 (64.9%) | 139 (35.1%) |
| Total (Overall) | 751 (56.4%) | 580 (43.6%) |
Employment Industries by Sex in Frederick
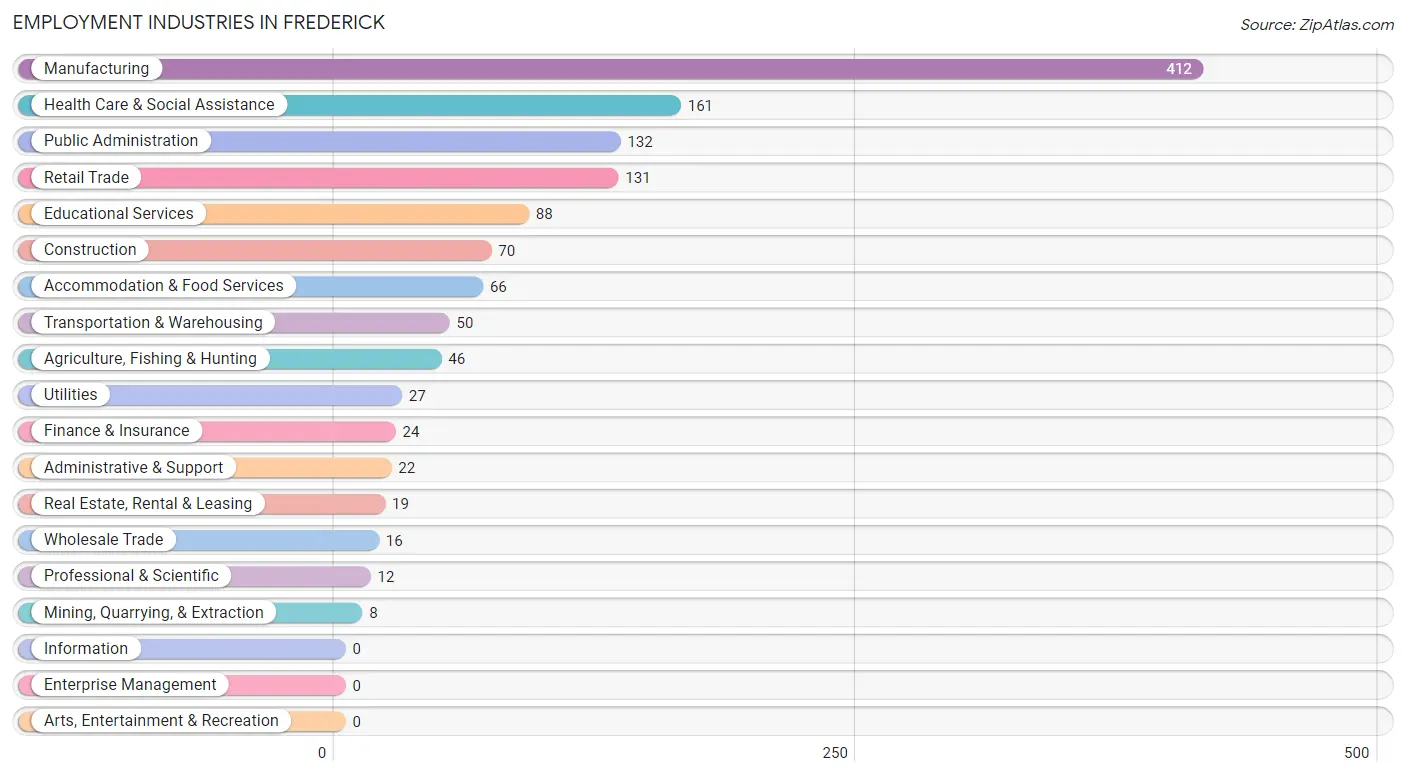
Employment Industries in Frederick
The major employment industries in Frederick include Manufacturing (412 | 30.9%), Health Care & Social Assistance (161 | 12.1%), Public Administration (132 | 9.9%), Retail Trade (131 | 9.8%), and Educational Services (88 | 6.6%).
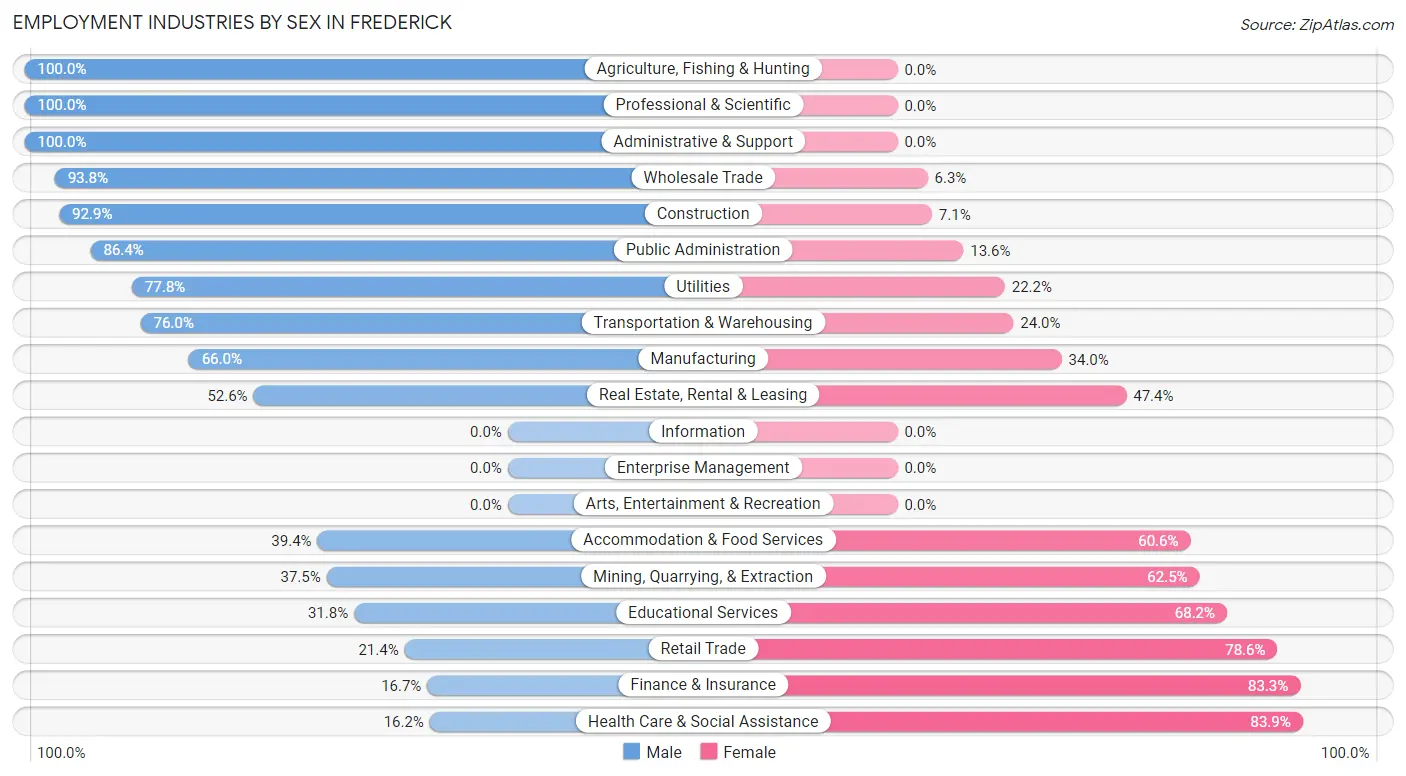
Employment Industries by Sex in Frederick
The Frederick industries that see more men than women are Agriculture, Fishing & Hunting (100.0%), Professional & Scientific (100.0%), and Administrative & Support (100.0%), whereas the industries that tend to have a higher number of women are Health Care & Social Assistance (83.9%), Finance & Insurance (83.3%), and Retail Trade (78.6%).
| Industry | Male | Female |
| Agriculture, Fishing & Hunting | 46 (100.0%) | 0 (0.0%) |
| Mining, Quarrying, & Extraction | 3 (37.5%) | 5 (62.5%) |
| Construction | 65 (92.9%) | 5 (7.1%) |
| Manufacturing | 272 (66.0%) | 140 (34.0%) |
| Wholesale Trade | 15 (93.8%) | 1 (6.2%) |
| Retail Trade | 28 (21.4%) | 103 (78.6%) |
| Transportation & Warehousing | 38 (76.0%) | 12 (24.0%) |
| Utilities | 21 (77.8%) | 6 (22.2%) |
| Information | 0 (0.0%) | 0 (0.0%) |
| Finance & Insurance | 4 (16.7%) | 20 (83.3%) |
| Real Estate, Rental & Leasing | 10 (52.6%) | 9 (47.4%) |
| Professional & Scientific | 12 (100.0%) | 0 (0.0%) |
| Enterprise Management | 0 (0.0%) | 0 (0.0%) |
| Administrative & Support | 22 (100.0%) | 0 (0.0%) |
| Educational Services | 28 (31.8%) | 60 (68.2%) |
| Health Care & Social Assistance | 26 (16.2%) | 135 (83.9%) |
| Arts, Entertainment & Recreation | 0 (0.0%) | 0 (0.0%) |
| Accommodation & Food Services | 26 (39.4%) | 40 (60.6%) |
| Public Administration | 114 (86.4%) | 18 (13.6%) |
| Total | 751 (56.4%) | 580 (43.6%) |
Education in Frederick
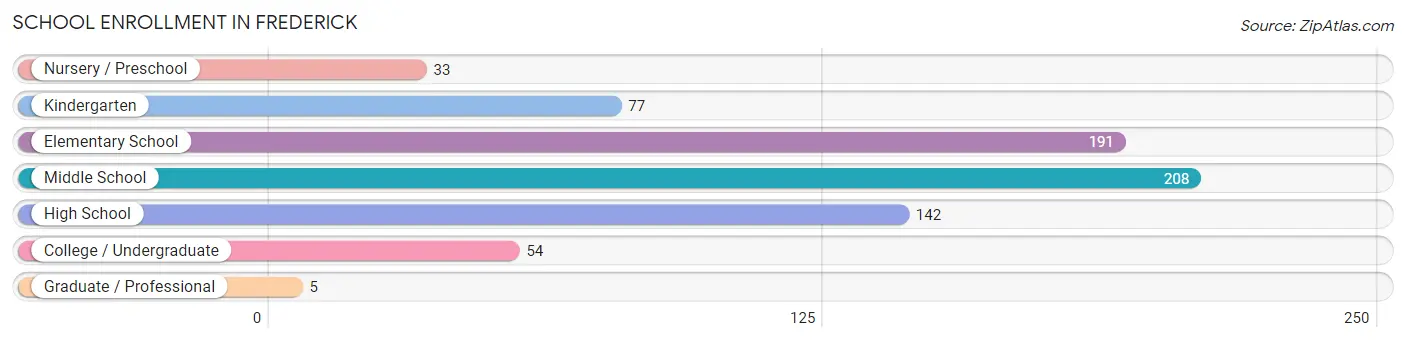
School Enrollment in Frederick
The most common levels of schooling among the 710 students in Frederick are middle school (208 | 29.3%), elementary school (191 | 26.9%), and high school (142 | 20.0%).
| School Level | # Students | % Students |
| Nursery / Preschool | 33 | 4.6% |
| Kindergarten | 77 | 10.8% |
| Elementary School | 191 | 26.9% |
| Middle School | 208 | 29.3% |
| High School | 142 | 20.0% |
| College / Undergraduate | 54 | 7.6% |
| Graduate / Professional | 5 | 0.7% |
| Total | 710 | 100.0% |
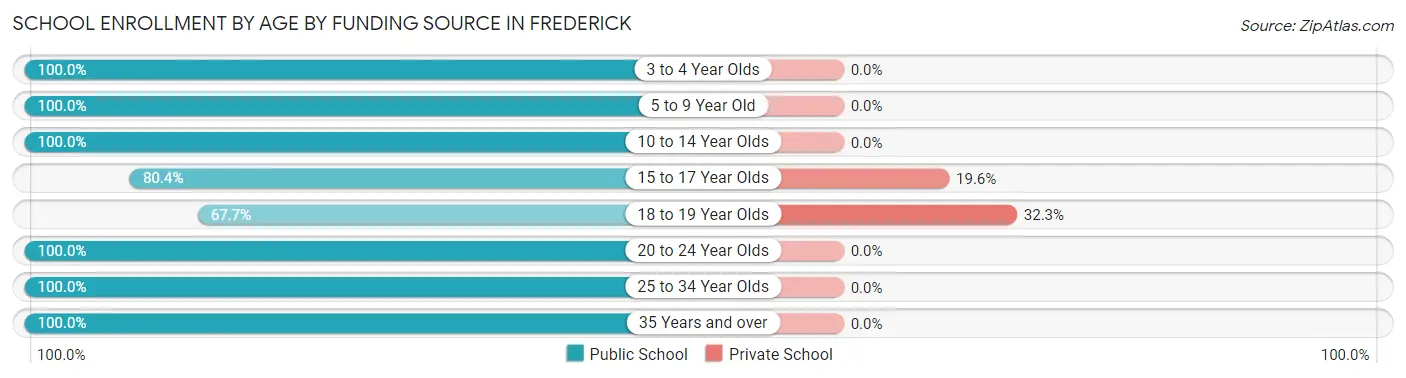
School Enrollment by Age by Funding Source in Frederick
Out of a total of 710 students who are enrolled in schools in Frederick, 32 (4.5%) attend a private institution, while the remaining 678 (95.5%) are enrolled in public schools. The age group of 18 to 19 year olds has the highest likelihood of being enrolled in private schools, with 10 (32.3% in the age bracket) enrolled. Conversely, the age group of 3 to 4 year olds has the lowest likelihood of being enrolled in a private school, with 28 (100.0% in the age bracket) attending a public institution.
| Age Bracket | Public School | Private School |
| 3 to 4 Year Olds | 28 (100.0%) | 0 (0.0%) |
| 5 to 9 Year Old | 229 (100.0%) | 0 (0.0%) |
| 10 to 14 Year Olds | 263 (100.0%) | 0 (0.0%) |
| 15 to 17 Year Olds | 90 (80.4%) | 22 (19.6%) |
| 18 to 19 Year Olds | 21 (67.7%) | 10 (32.3%) |
| 20 to 24 Year Olds | 21 (100.0%) | 0 (0.0%) |
| 25 to 34 Year Olds | 15 (100.0%) | 0 (0.0%) |
| 35 Years and over | 11 (100.0%) | 0 (0.0%) |
| Total | 678 (95.5%) | 32 (4.5%) |
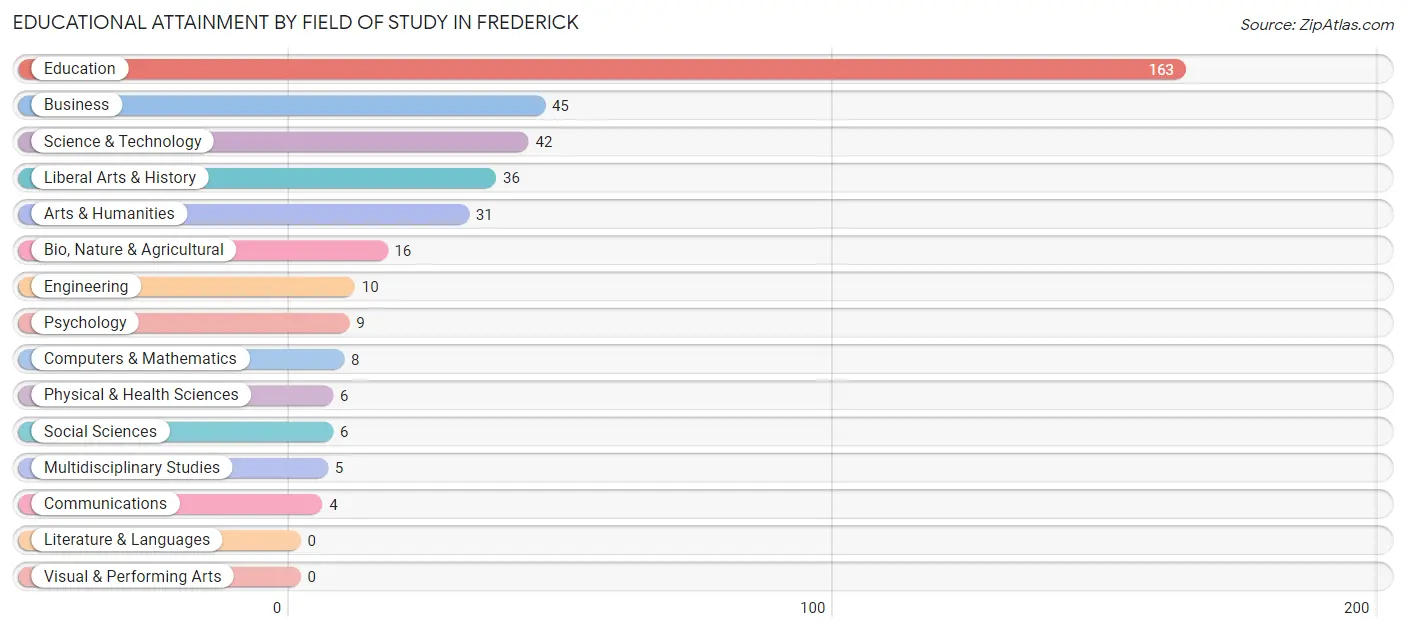
Educational Attainment by Field of Study in Frederick
Education (163 | 42.8%), business (45 | 11.8%), science & technology (42 | 11.0%), liberal arts & history (36 | 9.5%), and arts & humanities (31 | 8.1%) are the most common fields of study among 381 individuals in Frederick who have obtained a bachelor's degree or higher.
| Field of Study | # Graduates | % Graduates |
| Computers & Mathematics | 8 | 2.1% |
| Bio, Nature & Agricultural | 16 | 4.2% |
| Physical & Health Sciences | 6 | 1.6% |
| Psychology | 9 | 2.4% |
| Social Sciences | 6 | 1.6% |
| Engineering | 10 | 2.6% |
| Multidisciplinary Studies | 5 | 1.3% |
| Science & Technology | 42 | 11.0% |
| Business | 45 | 11.8% |
| Education | 163 | 42.8% |
| Literature & Languages | 0 | 0.0% |
| Liberal Arts & History | 36 | 9.5% |
| Visual & Performing Arts | 0 | 0.0% |
| Communications | 4 | 1.1% |
| Arts & Humanities | 31 | 8.1% |
| Total | 381 | 100.0% |
Transportation & Commute in Frederick
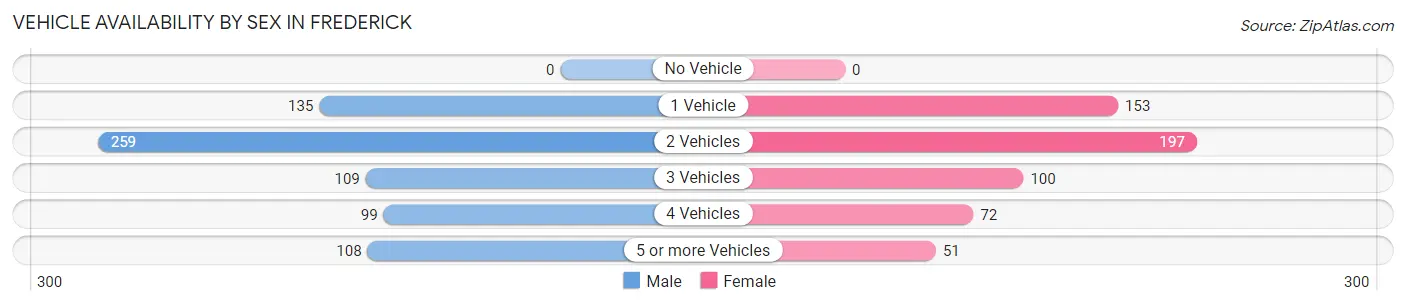
Vehicle Availability by Sex in Frederick
The most prevalent vehicle ownership categories in Frederick are males with 2 vehicles (259, accounting for 36.5%) and females with 2 vehicles (197, making up 45.2%).
| Vehicles Available | Male | Female |
| No Vehicle | 0 (0.0%) | 0 (0.0%) |
| 1 Vehicle | 135 (19.0%) | 153 (26.7%) |
| 2 Vehicles | 259 (36.5%) | 197 (34.4%) |
| 3 Vehicles | 109 (15.3%) | 100 (17.4%) |
| 4 Vehicles | 99 (13.9%) | 72 (12.6%) |
| 5 or more Vehicles | 108 (15.2%) | 51 (8.9%) |
| Total | 710 (100.0%) | 573 (100.0%) |
Commute Time in Frederick
The most frequently occuring commute durations in Frederick are 5 to 9 minutes (464 commuters, 37.1%), 10 to 14 minutes (209 commuters, 16.7%), and less than 5 minutes (151 commuters, 12.1%).
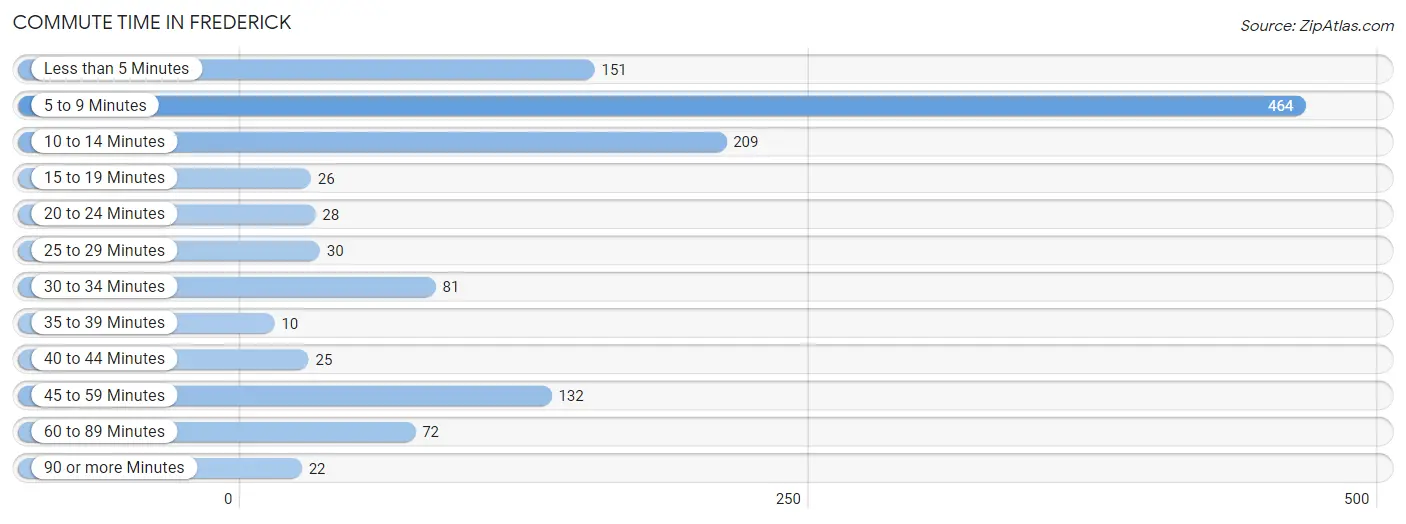
| Commute Time | # Commuters | % Commuters |
| Less than 5 Minutes | 151 | 12.1% |
| 5 to 9 Minutes | 464 | 37.1% |
| 10 to 14 Minutes | 209 | 16.7% |
| 15 to 19 Minutes | 26 | 2.1% |
| 20 to 24 Minutes | 28 | 2.2% |
| 25 to 29 Minutes | 30 | 2.4% |
| 30 to 34 Minutes | 81 | 6.5% |
| 35 to 39 Minutes | 10 | 0.8% |
| 40 to 44 Minutes | 25 | 2.0% |
| 45 to 59 Minutes | 132 | 10.6% |
| 60 to 89 Minutes | 72 | 5.8% |
| 90 or more Minutes | 22 | 1.8% |
Commute Time by Sex in Frederick
The most common commute times in Frederick are 5 to 9 minutes (223 commuters, 32.1%) for males and 5 to 9 minutes (241 commuters, 43.4%) for females.

| Commute Time | Male | Female |
| Less than 5 Minutes | 86 (12.4%) | 65 (11.7%) |
| 5 to 9 Minutes | 223 (32.1%) | 241 (43.4%) |
| 10 to 14 Minutes | 162 (23.3%) | 47 (8.5%) |
| 15 to 19 Minutes | 13 (1.9%) | 13 (2.3%) |
| 20 to 24 Minutes | 0 (0.0%) | 28 (5.1%) |
| 25 to 29 Minutes | 0 (0.0%) | 30 (5.4%) |
| 30 to 34 Minutes | 70 (10.1%) | 11 (2.0%) |
| 35 to 39 Minutes | 0 (0.0%) | 10 (1.8%) |
| 40 to 44 Minutes | 11 (1.6%) | 14 (2.5%) |
| 45 to 59 Minutes | 74 (10.6%) | 58 (10.4%) |
| 60 to 89 Minutes | 47 (6.8%) | 25 (4.5%) |
| 90 or more Minutes | 9 (1.3%) | 13 (2.3%) |
Time of Departure to Work by Sex in Frederick
The most frequent times of departure to work in Frederick are 4:00 PM to 11:59 PM (146, 21.0%) for males and 7:30 AM to 7:59 AM (133, 24.0%) for females.
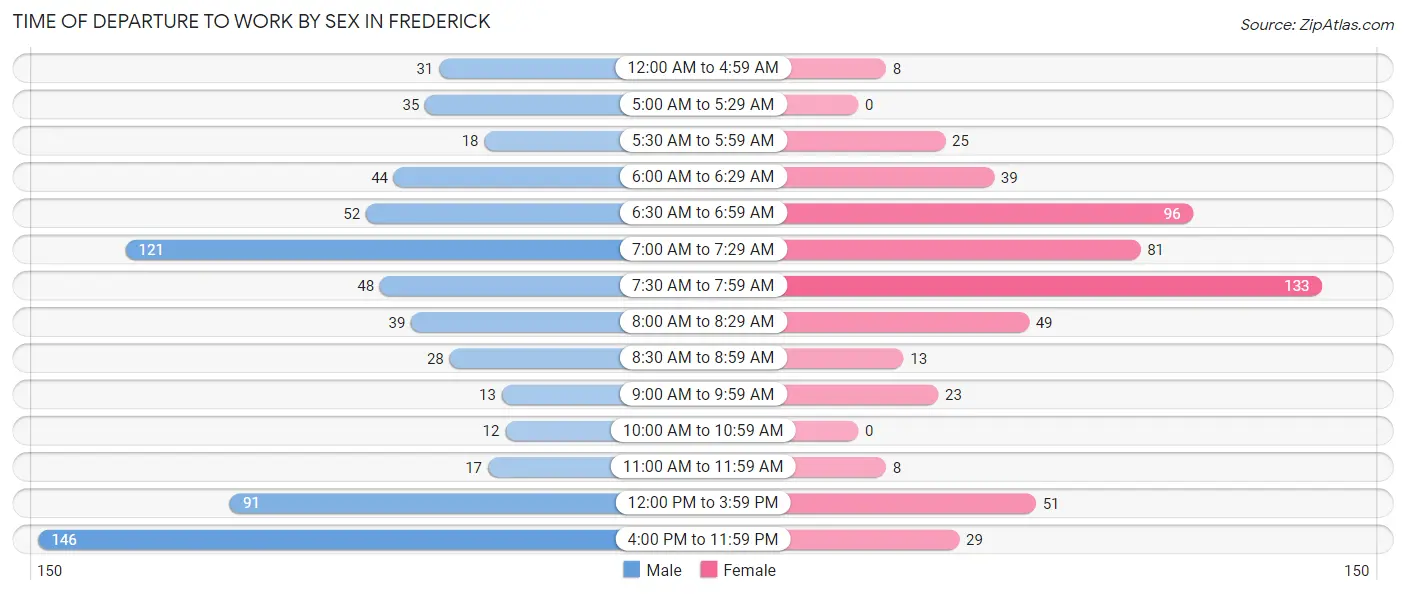
| Time of Departure | Male | Female |
| 12:00 AM to 4:59 AM | 31 (4.5%) | 8 (1.4%) |
| 5:00 AM to 5:29 AM | 35 (5.0%) | 0 (0.0%) |
| 5:30 AM to 5:59 AM | 18 (2.6%) | 25 (4.5%) |
| 6:00 AM to 6:29 AM | 44 (6.3%) | 39 (7.0%) |
| 6:30 AM to 6:59 AM | 52 (7.5%) | 96 (17.3%) |
| 7:00 AM to 7:29 AM | 121 (17.4%) | 81 (14.6%) |
| 7:30 AM to 7:59 AM | 48 (6.9%) | 133 (24.0%) |
| 8:00 AM to 8:29 AM | 39 (5.6%) | 49 (8.8%) |
| 8:30 AM to 8:59 AM | 28 (4.0%) | 13 (2.3%) |
| 9:00 AM to 9:59 AM | 13 (1.9%) | 23 (4.1%) |
| 10:00 AM to 10:59 AM | 12 (1.7%) | 0 (0.0%) |
| 11:00 AM to 11:59 AM | 17 (2.5%) | 8 (1.4%) |
| 12:00 PM to 3:59 PM | 91 (13.1%) | 51 (9.2%) |
| 4:00 PM to 11:59 PM | 146 (21.0%) | 29 (5.2%) |
| Total | 695 (100.0%) | 555 (100.0%) |
Housing Occupancy in Frederick
Occupancy by Ownership in Frederick
Of the total 1,317 dwellings in Frederick, owner-occupied units account for 936 (71.1%), while renter-occupied units make up 381 (28.9%).
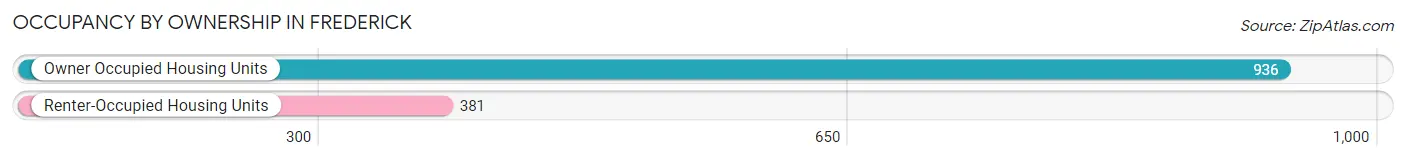
| Occupancy | # Housing Units | % Housing Units |
| Owner Occupied Housing Units | 936 | 71.1% |
| Renter-Occupied Housing Units | 381 | 28.9% |
| Total Occupied Housing Units | 1,317 | 100.0% |
Occupancy by Household Size in Frederick
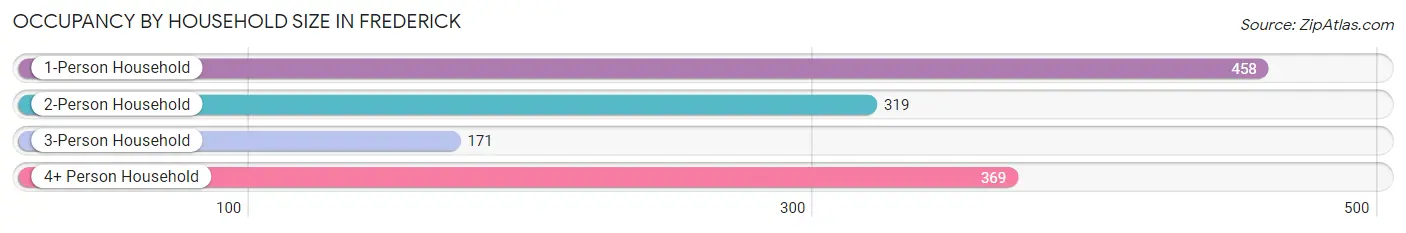
| Household Size | # Housing Units | % Housing Units |
| 1-Person Household | 458 | 34.8% |
| 2-Person Household | 319 | 24.2% |
| 3-Person Household | 171 | 13.0% |
| 4+ Person Household | 369 | 28.0% |
| Total Housing Units | 1,317 | 100.0% |
Occupancy by Ownership by Household Size in Frederick
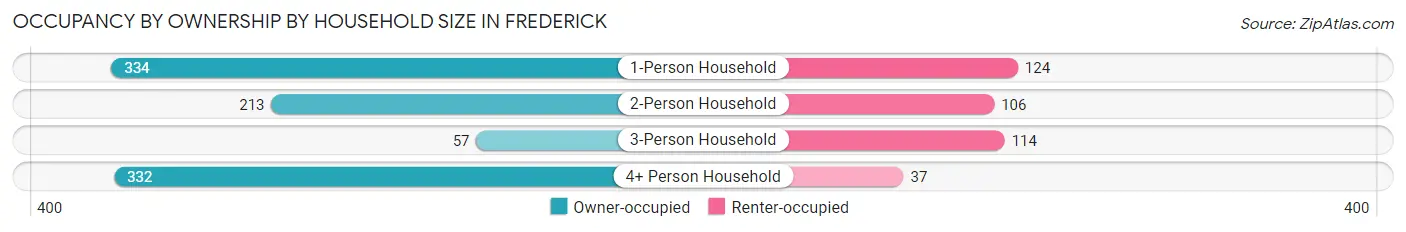
| Household Size | Owner-occupied | Renter-occupied |
| 1-Person Household | 334 (72.9%) | 124 (27.1%) |
| 2-Person Household | 213 (66.8%) | 106 (33.2%) |
| 3-Person Household | 57 (33.3%) | 114 (66.7%) |
| 4+ Person Household | 332 (90.0%) | 37 (10.0%) |
| Total Housing Units | 936 (71.1%) | 381 (28.9%) |
Occupancy by Educational Attainment in Frederick
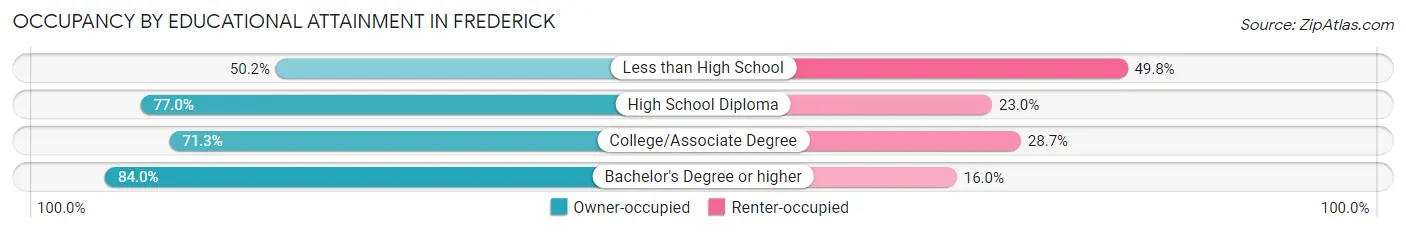
| Household Size | Owner-occupied | Renter-occupied |
| Less than High School | 143 (50.2%) | 142 (49.8%) |
| High School Diploma | 352 (77.0%) | 105 (23.0%) |
| College/Associate Degree | 236 (71.3%) | 95 (28.7%) |
| Bachelor's Degree or higher | 205 (84.0%) | 39 (16.0%) |
Occupancy by Age of Householder in Frederick
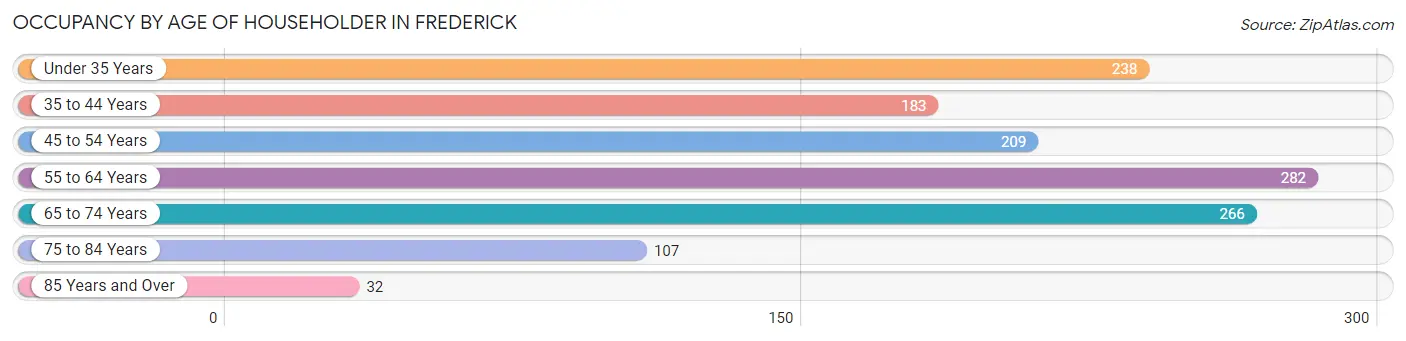
| Age Bracket | # Households | % Households |
| Under 35 Years | 238 | 18.1% |
| 35 to 44 Years | 183 | 13.9% |
| 45 to 54 Years | 209 | 15.9% |
| 55 to 64 Years | 282 | 21.4% |
| 65 to 74 Years | 266 | 20.2% |
| 75 to 84 Years | 107 | 8.1% |
| 85 Years and Over | 32 | 2.4% |
| Total | 1,317 | 100.0% |
Housing Finances in Frederick
Median Income by Occupancy in Frederick
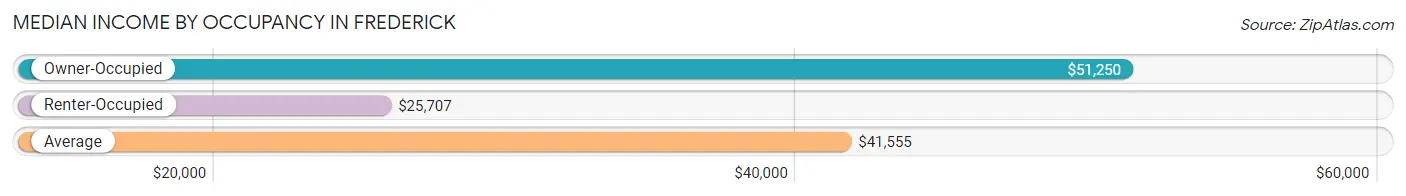
| Occupancy Type | # Households | Median Income |
| Owner-Occupied | 936 (71.1%) | $51,250 |
| Renter-Occupied | 381 (28.9%) | $25,707 |
| Average | 1,317 (100.0%) | $41,555 |
Occupancy by Householder Income Bracket in Frederick
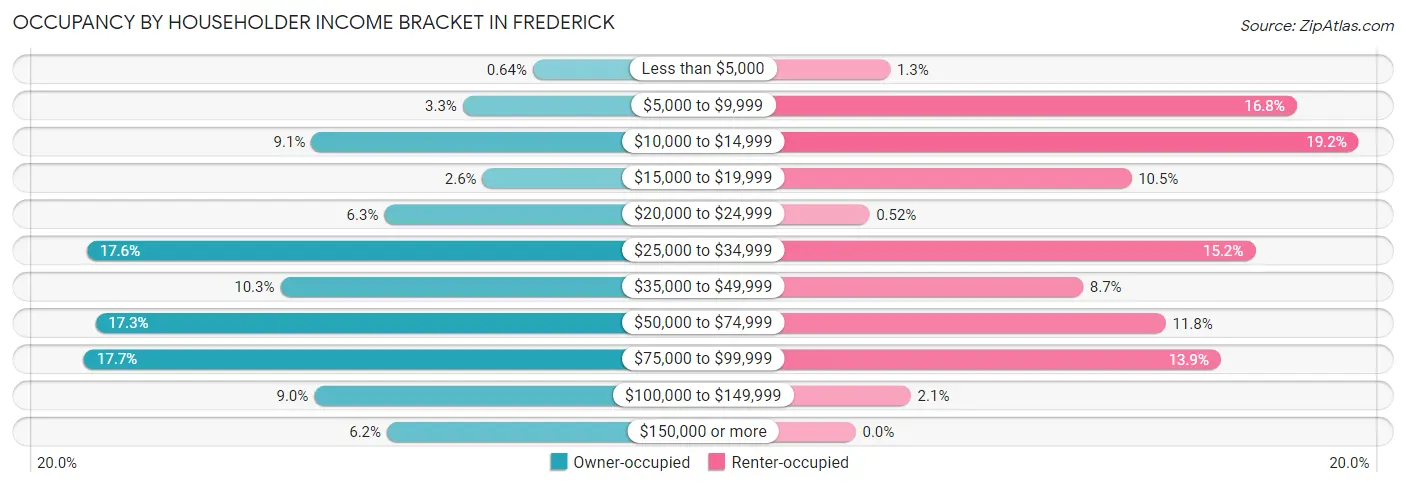
| Income Bracket | Owner-occupied | Renter-occupied |
| Less than $5,000 | 6 (0.6%) | 5 (1.3%) |
| $5,000 to $9,999 | 31 (3.3%) | 64 (16.8%) |
| $10,000 to $14,999 | 85 (9.1%) | 73 (19.2%) |
| $15,000 to $19,999 | 24 (2.6%) | 40 (10.5%) |
| $20,000 to $24,999 | 59 (6.3%) | 2 (0.5%) |
| $25,000 to $34,999 | 165 (17.6%) | 58 (15.2%) |
| $35,000 to $49,999 | 96 (10.3%) | 33 (8.7%) |
| $50,000 to $74,999 | 162 (17.3%) | 45 (11.8%) |
| $75,000 to $99,999 | 166 (17.7%) | 53 (13.9%) |
| $100,000 to $149,999 | 84 (9.0%) | 8 (2.1%) |
| $150,000 or more | 58 (6.2%) | 0 (0.0%) |
| Total | 936 (100.0%) | 381 (100.0%) |
Monthly Housing Cost Tiers in Frederick
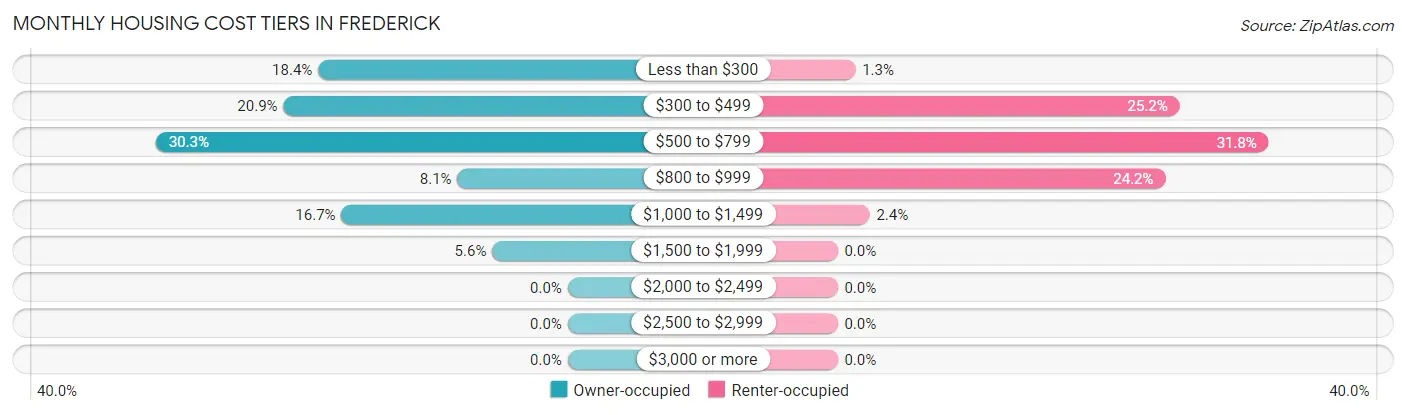
| Monthly Cost | Owner-occupied | Renter-occupied |
| Less than $300 | 172 (18.4%) | 5 (1.3%) |
| $300 to $499 | 196 (20.9%) | 96 (25.2%) |
| $500 to $799 | 284 (30.3%) | 121 (31.8%) |
| $800 to $999 | 76 (8.1%) | 92 (24.1%) |
| $1,000 to $1,499 | 156 (16.7%) | 9 (2.4%) |
| $1,500 to $1,999 | 52 (5.6%) | 0 (0.0%) |
| $2,000 to $2,499 | 0 (0.0%) | 0 (0.0%) |
| $2,500 to $2,999 | 0 (0.0%) | 0 (0.0%) |
| $3,000 or more | 0 (0.0%) | 0 (0.0%) |
| Total | 936 (100.0%) | 381 (100.0%) |
Physical Housing Characteristics in Frederick
Housing Structures in Frederick
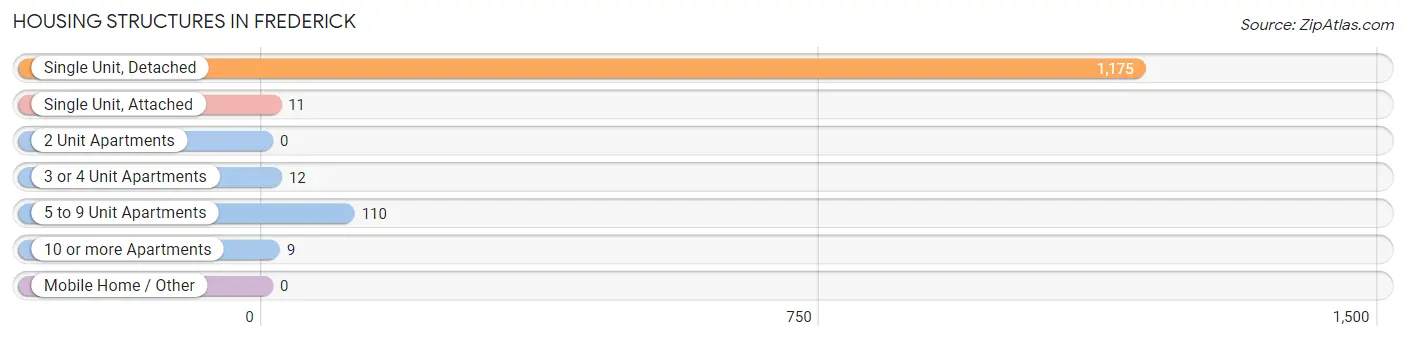
| Structure Type | # Housing Units | % Housing Units |
| Single Unit, Detached | 1,175 | 89.2% |
| Single Unit, Attached | 11 | 0.8% |
| 2 Unit Apartments | 0 | 0.0% |
| 3 or 4 Unit Apartments | 12 | 0.9% |
| 5 to 9 Unit Apartments | 110 | 8.4% |
| 10 or more Apartments | 9 | 0.7% |
| Mobile Home / Other | 0 | 0.0% |
| Total | 1,317 | 100.0% |
Housing Structures by Occupancy in Frederick
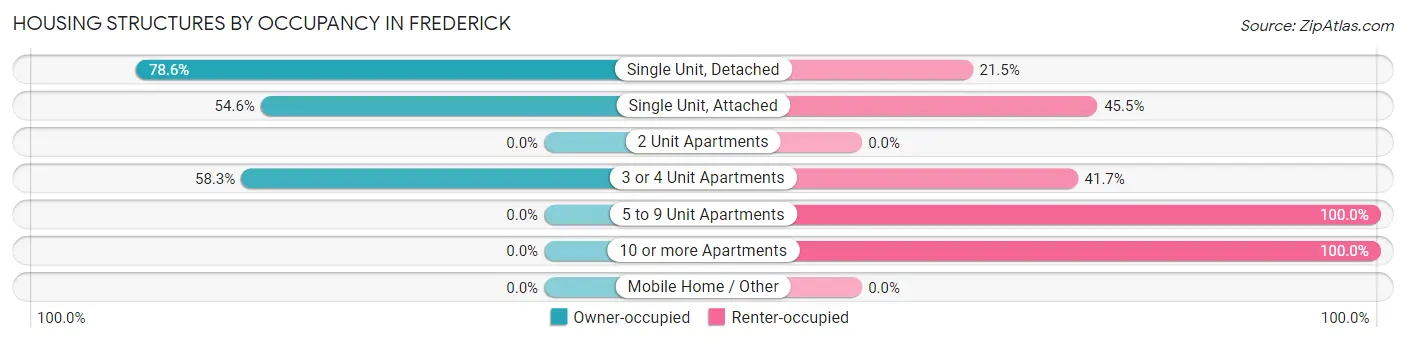
| Structure Type | Owner-occupied | Renter-occupied |
| Single Unit, Detached | 923 (78.5%) | 252 (21.4%) |
| Single Unit, Attached | 6 (54.5%) | 5 (45.5%) |
| 2 Unit Apartments | 0 (0.0%) | 0 (0.0%) |
| 3 or 4 Unit Apartments | 7 (58.3%) | 5 (41.7%) |
| 5 to 9 Unit Apartments | 0 (0.0%) | 110 (100.0%) |
| 10 or more Apartments | 0 (0.0%) | 9 (100.0%) |
| Mobile Home / Other | 0 (0.0%) | 0 (0.0%) |
| Total | 936 (71.1%) | 381 (28.9%) |
Housing Structures by Number of Rooms in Frederick
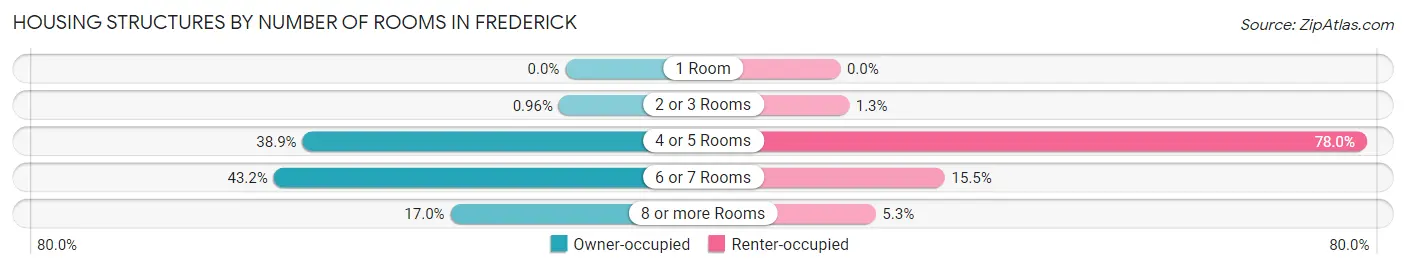
| Number of Rooms | Owner-occupied | Renter-occupied |
| 1 Room | 0 (0.0%) | 0 (0.0%) |
| 2 or 3 Rooms | 9 (1.0%) | 5 (1.3%) |
| 4 or 5 Rooms | 364 (38.9%) | 297 (77.9%) |
| 6 or 7 Rooms | 404 (43.2%) | 59 (15.5%) |
| 8 or more Rooms | 159 (17.0%) | 20 (5.2%) |
| Total | 936 (100.0%) | 381 (100.0%) |
Housing Structure by Heating Type in Frederick
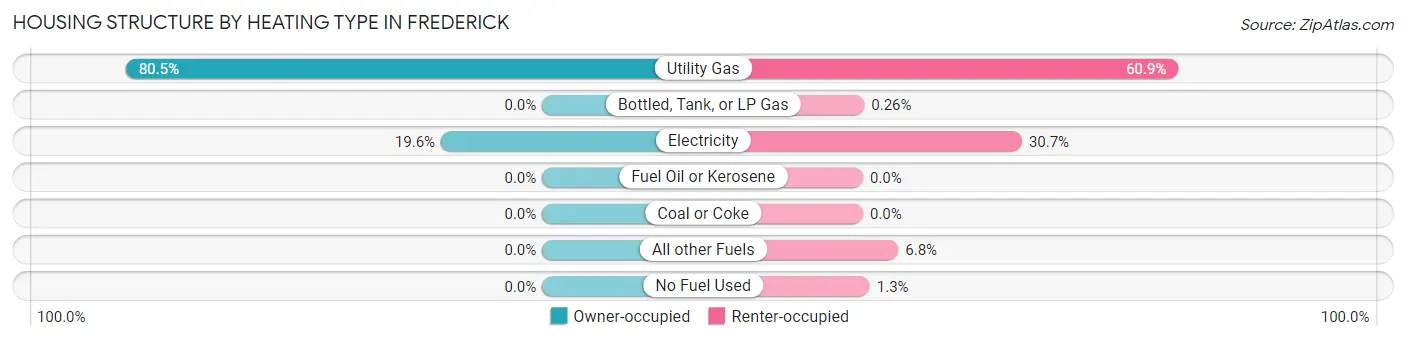
| Heating Type | Owner-occupied | Renter-occupied |
| Utility Gas | 753 (80.4%) | 232 (60.9%) |
| Bottled, Tank, or LP Gas | 0 (0.0%) | 1 (0.3%) |
| Electricity | 183 (19.6%) | 117 (30.7%) |
| Fuel Oil or Kerosene | 0 (0.0%) | 0 (0.0%) |
| Coal or Coke | 0 (0.0%) | 0 (0.0%) |
| All other Fuels | 0 (0.0%) | 26 (6.8%) |
| No Fuel Used | 0 (0.0%) | 5 (1.3%) |
| Total | 936 (100.0%) | 381 (100.0%) |
Household Vehicle Usage in Frederick
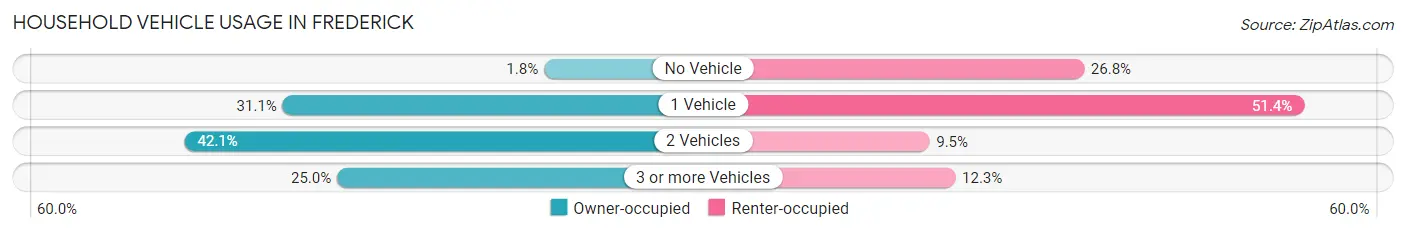
| Vehicles per Household | Owner-occupied | Renter-occupied |
| No Vehicle | 17 (1.8%) | 102 (26.8%) |
| 1 Vehicle | 291 (31.1%) | 196 (51.4%) |
| 2 Vehicles | 394 (42.1%) | 36 (9.5%) |
| 3 or more Vehicles | 234 (25.0%) | 47 (12.3%) |
| Total | 936 (100.0%) | 381 (100.0%) |
Real Estate & Mortgages in Frederick
Real Estate and Mortgage Overview in Frederick
| Characteristic | Without Mortgage | With Mortgage |
| Housing Units | 566 | 370 |
| Median Property Value | $53,500 | $78,900 |
| Median Household Income | $34,706 | $42 |
| Monthly Housing Costs | $442 | $0 |
| Real Estate Taxes | $305 | $0 |
Property Value by Mortgage Status in Frederick
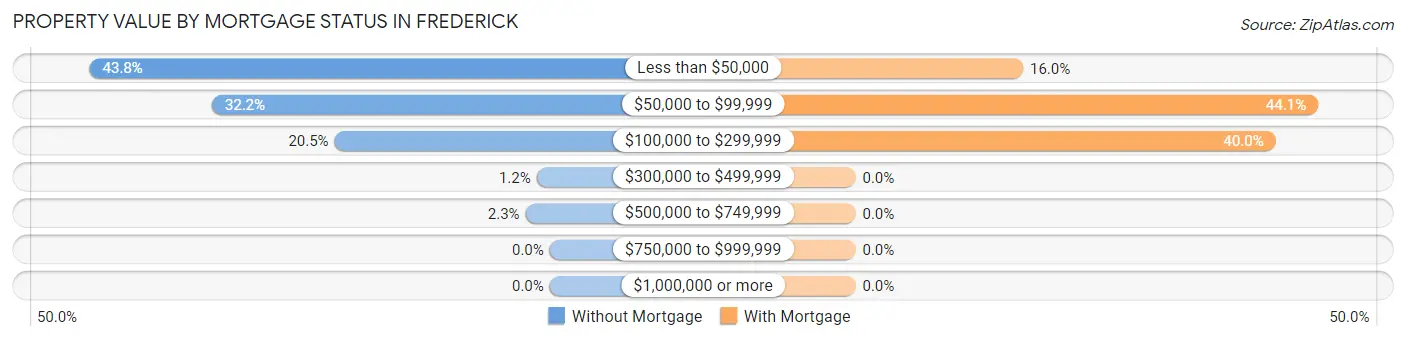
| Property Value | Without Mortgage | With Mortgage |
| Less than $50,000 | 248 (43.8%) | 59 (16.0%) |
| $50,000 to $99,999 | 182 (32.2%) | 163 (44.1%) |
| $100,000 to $299,999 | 116 (20.5%) | 148 (40.0%) |
| $300,000 to $499,999 | 7 (1.2%) | 0 (0.0%) |
| $500,000 to $749,999 | 13 (2.3%) | 0 (0.0%) |
| $750,000 to $999,999 | 0 (0.0%) | 0 (0.0%) |
| $1,000,000 or more | 0 (0.0%) | 0 (0.0%) |
| Total | 566 (100.0%) | 370 (100.0%) |
Household Income by Mortgage Status in Frederick
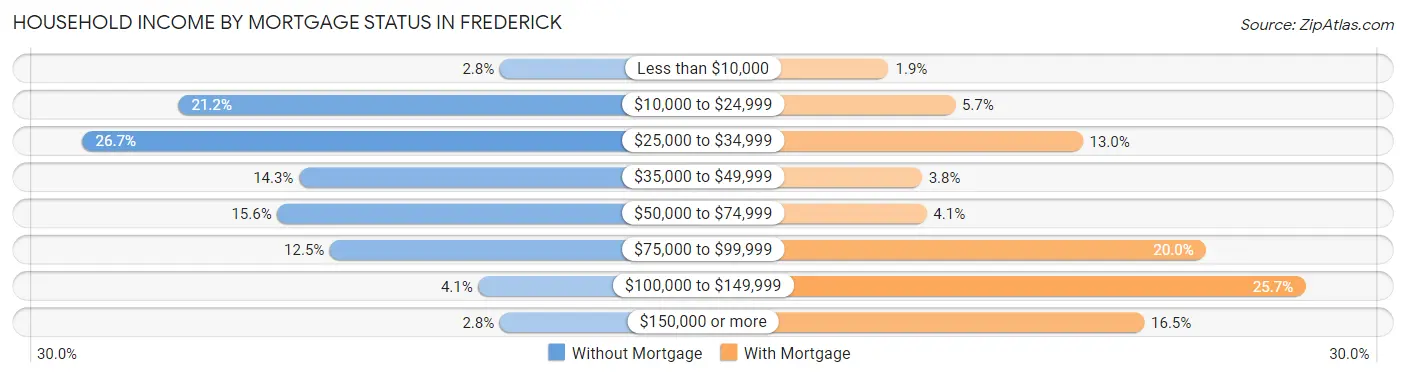
| Household Income | Without Mortgage | With Mortgage |
| Less than $10,000 | 16 (2.8%) | 7 (1.9%) |
| $10,000 to $24,999 | 120 (21.2%) | 21 (5.7%) |
| $25,000 to $34,999 | 151 (26.7%) | 48 (13.0%) |
| $35,000 to $49,999 | 81 (14.3%) | 14 (3.8%) |
| $50,000 to $74,999 | 88 (15.5%) | 15 (4.1%) |
| $75,000 to $99,999 | 71 (12.5%) | 74 (20.0%) |
| $100,000 to $149,999 | 23 (4.1%) | 95 (25.7%) |
| $150,000 or more | 16 (2.8%) | 61 (16.5%) |
| Total | 566 (100.0%) | 370 (100.0%) |
Property Value to Household Income Ratio in Frederick
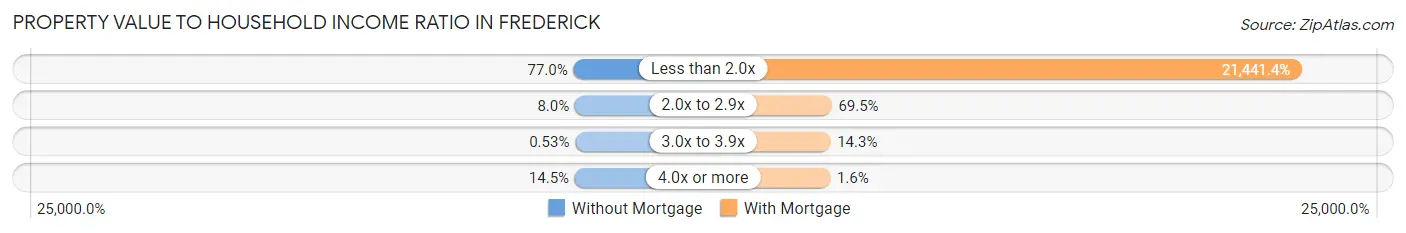
| Value-to-Income Ratio | Without Mortgage | With Mortgage |
| Less than 2.0x | 436 (77.0%) | 79,333 (21,441.3%) |
| 2.0x to 2.9x | 45 (8.0%) | 257 (69.5%) |
| 3.0x to 3.9x | 3 (0.5%) | 53 (14.3%) |
| 4.0x or more | 82 (14.5%) | 6 (1.6%) |
| Total | 566 (100.0%) | 370 (100.0%) |
Real Estate Taxes by Mortgage Status in Frederick
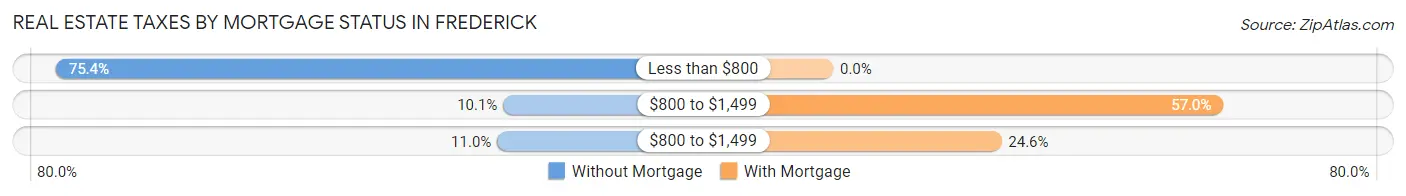
| Property Taxes | Without Mortgage | With Mortgage |
| Less than $800 | 427 (75.4%) | 0 (0.0%) |
| $800 to $1,499 | 57 (10.1%) | 211 (57.0%) |
| $800 to $1,499 | 62 (11.0%) | 91 (24.6%) |
| Total | 566 (100.0%) | 370 (100.0%) |
Health & Disability in Frederick
Health Insurance Coverage by Age in Frederick
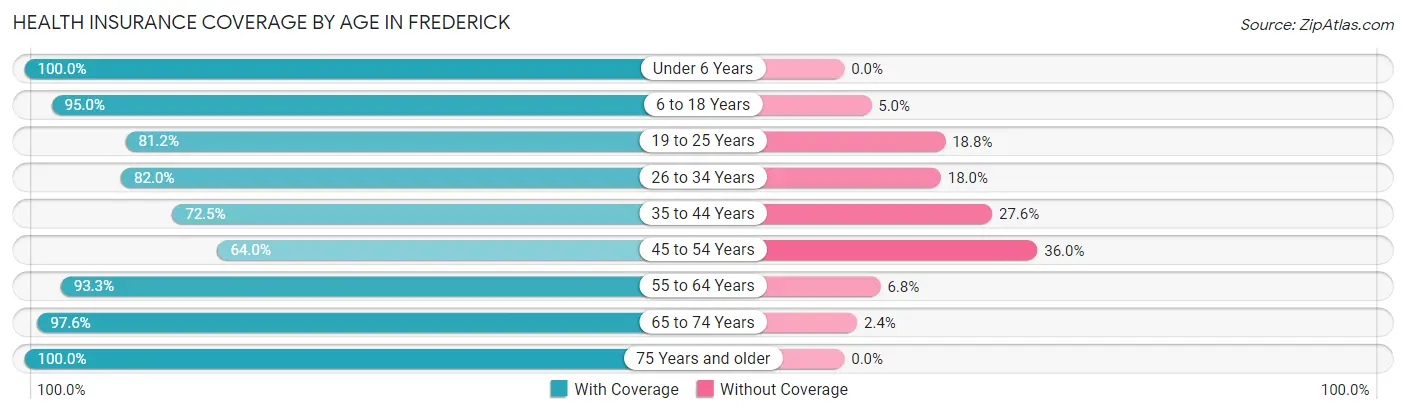
| Age Bracket | With Coverage | Without Coverage |
| Under 6 Years | 286 (100.0%) | 0 (0.0%) |
| 6 to 18 Years | 604 (95.0%) | 32 (5.0%) |
| 19 to 25 Years | 233 (81.2%) | 54 (18.8%) |
| 26 to 34 Years | 278 (82.0%) | 61 (18.0%) |
| 35 to 44 Years | 305 (72.5%) | 116 (27.6%) |
| 45 to 54 Years | 217 (64.0%) | 122 (36.0%) |
| 55 to 64 Years | 428 (93.2%) | 31 (6.8%) |
| 65 to 74 Years | 408 (97.6%) | 10 (2.4%) |
| 75 Years and older | 212 (100.0%) | 0 (0.0%) |
| Total | 2,971 (87.5%) | 426 (12.5%) |
Health Insurance Coverage by Citizenship Status in Frederick
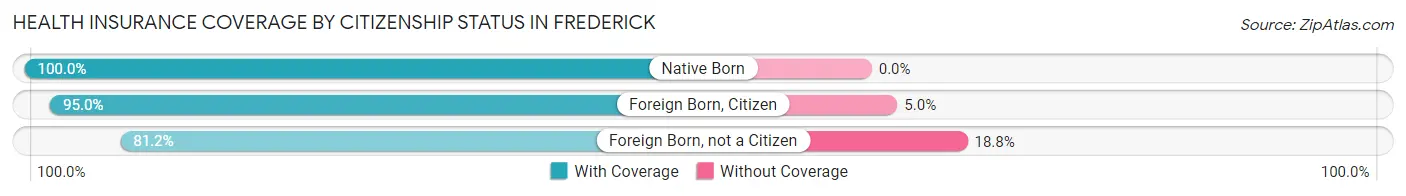
| Citizenship Status | With Coverage | Without Coverage |
| Native Born | 286 (100.0%) | 0 (0.0%) |
| Foreign Born, Citizen | 604 (95.0%) | 32 (5.0%) |
| Foreign Born, not a Citizen | 233 (81.2%) | 54 (18.8%) |
Health Insurance Coverage by Household Income in Frederick
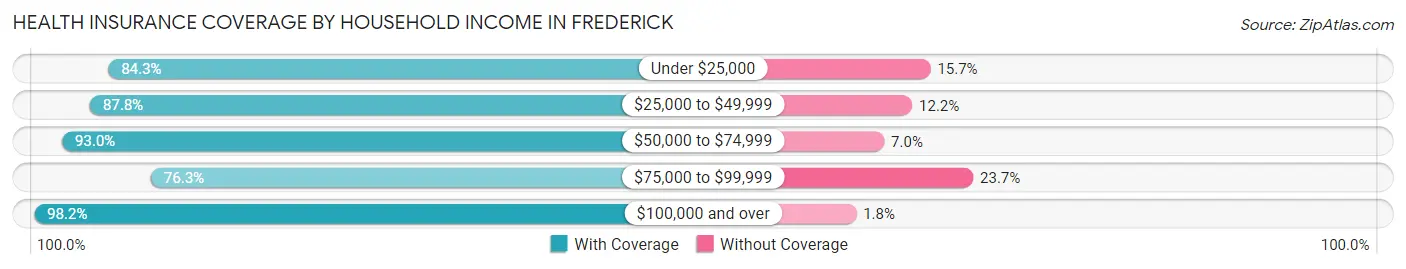
| Household Income | With Coverage | Without Coverage |
| Under $25,000 | 646 (84.3%) | 120 (15.7%) |
| $25,000 to $49,999 | 602 (87.8%) | 84 (12.2%) |
| $50,000 to $74,999 | 638 (93.0%) | 48 (7.0%) |
| $75,000 to $99,999 | 529 (76.3%) | 164 (23.7%) |
| $100,000 and over | 556 (98.2%) | 10 (1.8%) |
Public vs Private Health Insurance Coverage by Age in Frederick
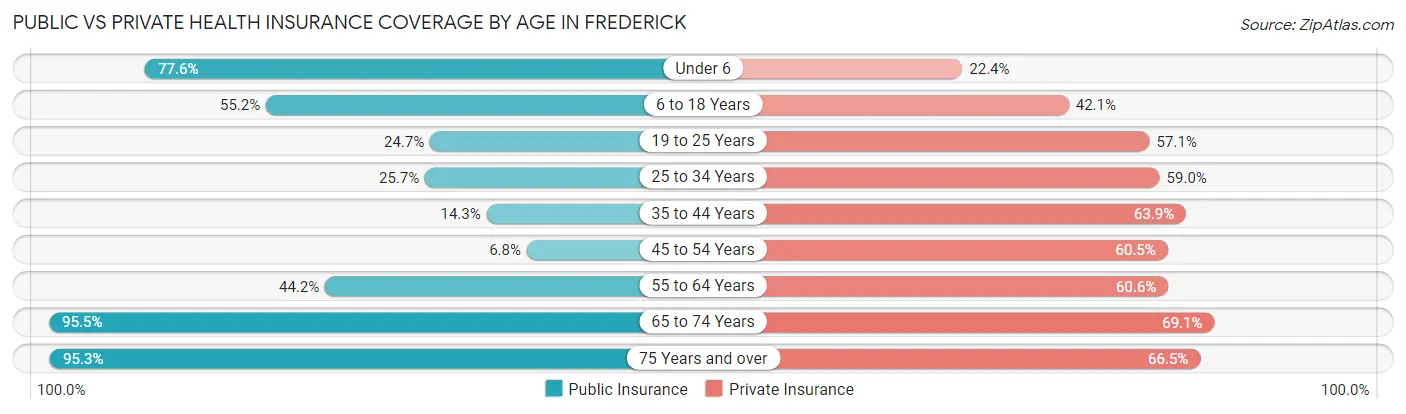
| Age Bracket | Public Insurance | Private Insurance |
| Under 6 | 222 (77.6%) | 64 (22.4%) |
| 6 to 18 Years | 351 (55.2%) | 268 (42.1%) |
| 19 to 25 Years | 71 (24.7%) | 164 (57.1%) |
| 25 to 34 Years | 87 (25.7%) | 200 (59.0%) |
| 35 to 44 Years | 60 (14.2%) | 269 (63.9%) |
| 45 to 54 Years | 23 (6.8%) | 205 (60.5%) |
| 55 to 64 Years | 203 (44.2%) | 278 (60.6%) |
| 65 to 74 Years | 399 (95.5%) | 289 (69.1%) |
| 75 Years and over | 202 (95.3%) | 141 (66.5%) |
| Total | 1,618 (47.6%) | 1,878 (55.3%) |
Disability Status by Sex by Age in Frederick
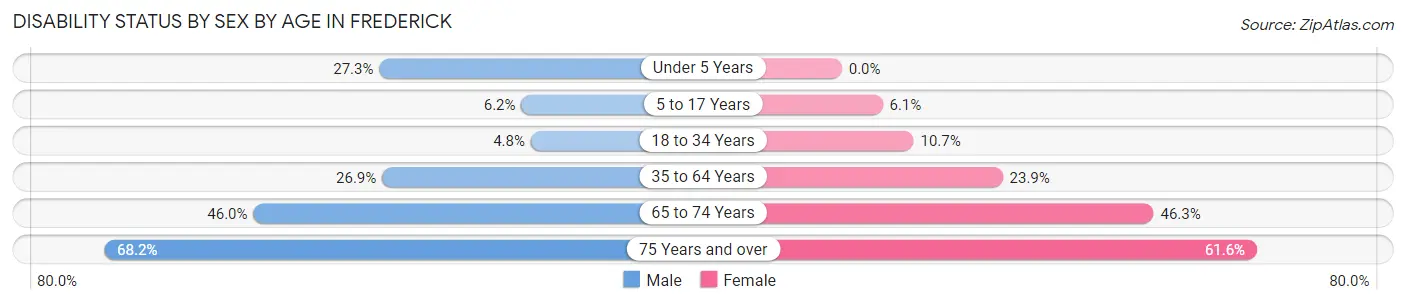
| Age Bracket | Male | Female |
| Under 5 Years | 41 (27.3%) | 0 (0.0%) |
| 5 to 17 Years | 17 (6.2%) | 21 (6.0%) |
| 18 to 34 Years | 17 (4.8%) | 34 (10.7%) |
| 35 to 64 Years | 141 (26.9%) | 166 (23.9%) |
| 65 to 74 Years | 87 (46.0%) | 106 (46.3%) |
| 75 Years and over | 45 (68.2%) | 90 (61.6%) |
Disability Class by Sex by Age in Frederick
Disability Class: Hearing Difficulty
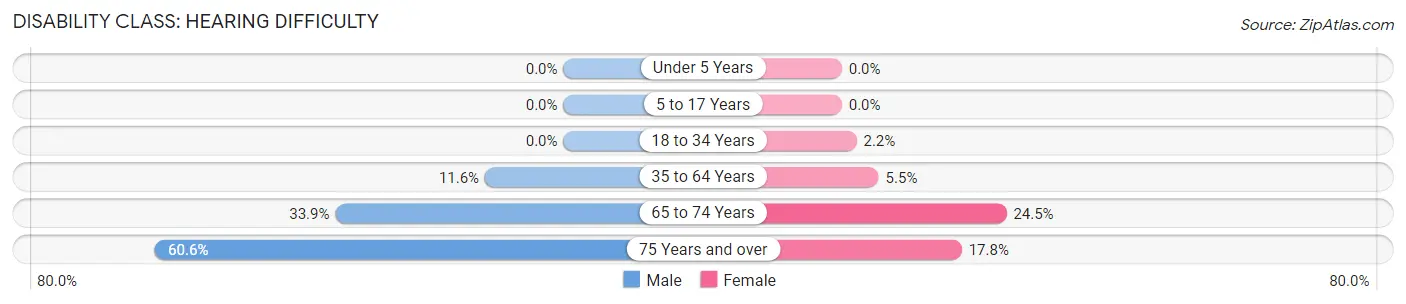
| Age Bracket | Male | Female |
| Under 5 Years | 0 (0.0%) | 0 (0.0%) |
| 5 to 17 Years | 0 (0.0%) | 0 (0.0%) |
| 18 to 34 Years | 0 (0.0%) | 7 (2.2%) |
| 35 to 64 Years | 61 (11.6%) | 38 (5.5%) |
| 65 to 74 Years | 64 (33.9%) | 56 (24.4%) |
| 75 Years and over | 40 (60.6%) | 26 (17.8%) |
Disability Class: Vision Difficulty
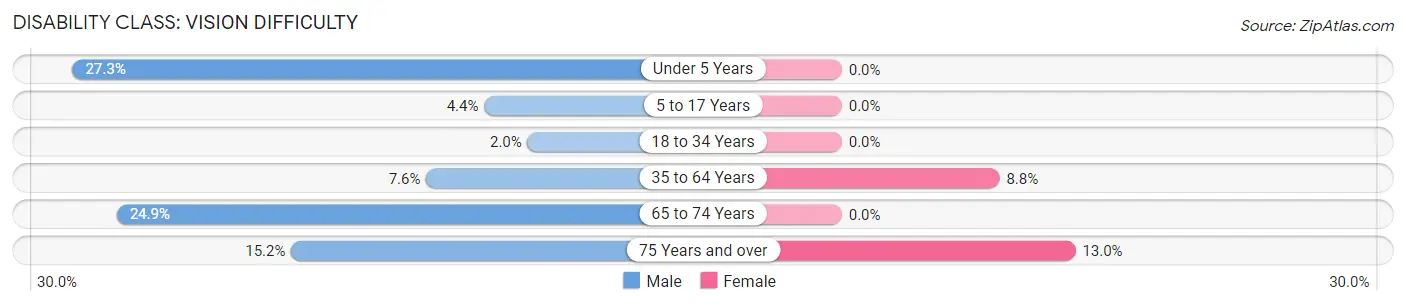
| Age Bracket | Male | Female |
| Under 5 Years | 41 (27.3%) | 0 (0.0%) |
| 5 to 17 Years | 12 (4.4%) | 0 (0.0%) |
| 18 to 34 Years | 7 (2.0%) | 0 (0.0%) |
| 35 to 64 Years | 40 (7.6%) | 61 (8.8%) |
| 65 to 74 Years | 47 (24.9%) | 0 (0.0%) |
| 75 Years and over | 10 (15.1%) | 19 (13.0%) |
Disability Class: Cognitive Difficulty
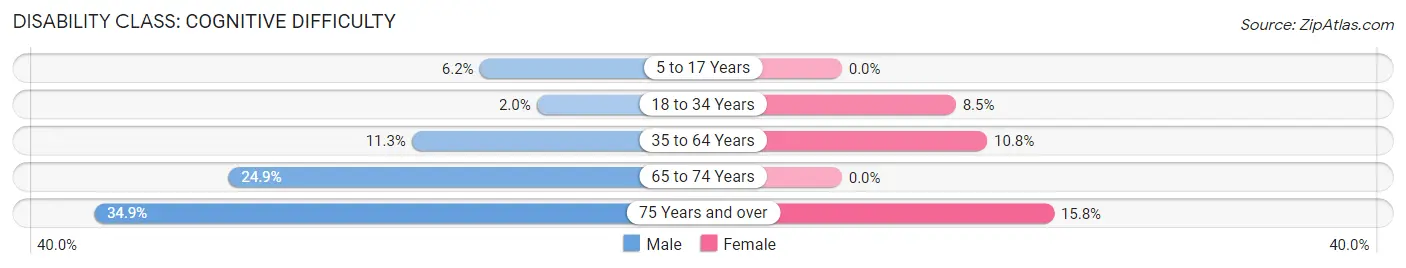
| Age Bracket | Male | Female |
| 5 to 17 Years | 17 (6.2%) | 0 (0.0%) |
| 18 to 34 Years | 7 (2.0%) | 27 (8.5%) |
| 35 to 64 Years | 59 (11.3%) | 75 (10.8%) |
| 65 to 74 Years | 47 (24.9%) | 0 (0.0%) |
| 75 Years and over | 23 (34.8%) | 23 (15.8%) |
Disability Class: Ambulatory Difficulty
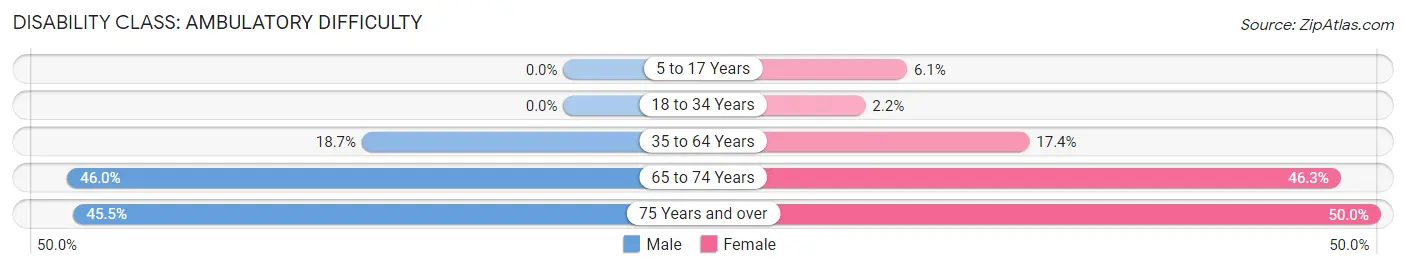
| Age Bracket | Male | Female |
| 5 to 17 Years | 0 (0.0%) | 21 (6.0%) |
| 18 to 34 Years | 0 (0.0%) | 7 (2.2%) |
| 35 to 64 Years | 98 (18.7%) | 121 (17.4%) |
| 65 to 74 Years | 87 (46.0%) | 106 (46.3%) |
| 75 Years and over | 30 (45.5%) | 73 (50.0%) |
Disability Class: Self-Care Difficulty
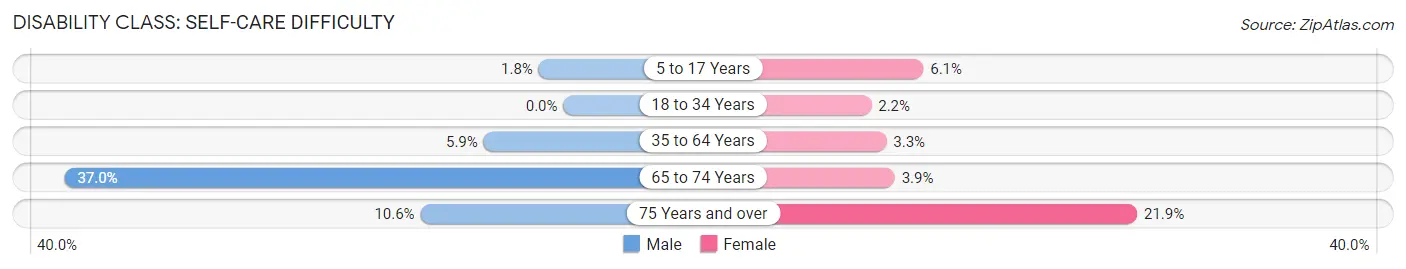
| Age Bracket | Male | Female |
| 5 to 17 Years | 5 (1.8%) | 21 (6.0%) |
| 18 to 34 Years | 0 (0.0%) | 7 (2.2%) |
| 35 to 64 Years | 31 (5.9%) | 23 (3.3%) |
| 65 to 74 Years | 70 (37.0%) | 9 (3.9%) |
| 75 Years and over | 7 (10.6%) | 32 (21.9%) |
Technology Access in Frederick
Computing Device Access in Frederick
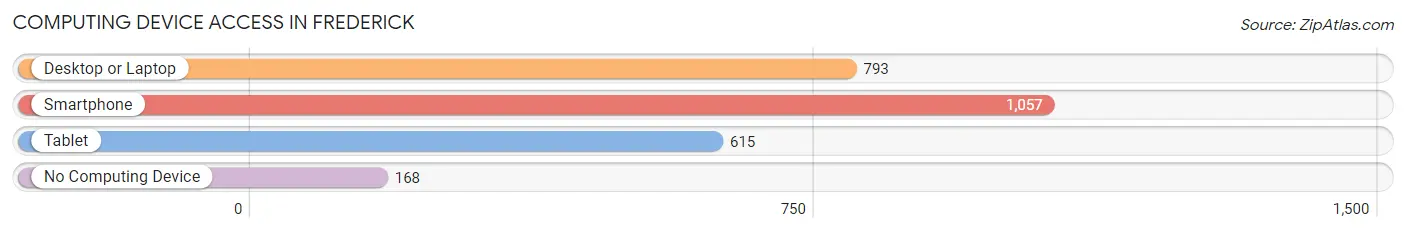
| Device Type | # Households | % Households |
| Desktop or Laptop | 793 | 60.2% |
| Smartphone | 1,057 | 80.3% |
| Tablet | 615 | 46.7% |
| No Computing Device | 168 | 12.8% |
| Total | 1,317 | 100.0% |
Internet Access in Frederick
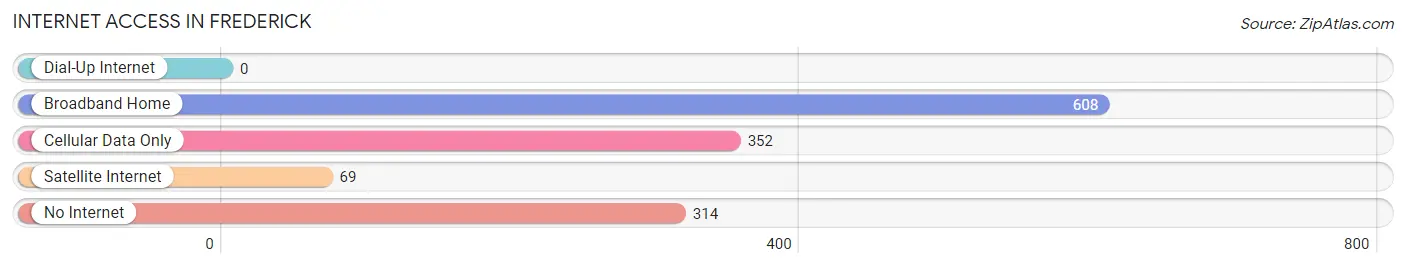
| Internet Type | # Households | % Households |
| Dial-Up Internet | 0 | 0.0% |
| Broadband Home | 608 | 46.2% |
| Cellular Data Only | 352 | 26.7% |
| Satellite Internet | 69 | 5.2% |
| No Internet | 314 | 23.8% |
| Total | 1,317 | 100.0% |
Frederick Summary
Frederick is a city located in Tillman County, Oklahoma. It is situated in the southwestern part of the state, approximately 80 miles northwest of Oklahoma City. The city is located on the Red River, which forms the border between Oklahoma and Texas. As of the 2010 census, the population of Frederick was 2,788.
History
The area that is now Frederick was originally inhabited by the Comanche and Kiowa tribes. In 1834, the area was opened to white settlement by the Treaty of Camp Holmes. The first settlers arrived in the area in 1887, and the town of Frederick was established in 1889. The town was named after a local rancher, Frederick W. Smith.
In 1901, the Choctaw, Oklahoma and Gulf Railroad was built through the town, connecting it to other towns in the area. This allowed for the growth of the town, and by 1910, the population had grown to 1,845.
In the early 20th century, Frederick was a major center for the oil and gas industry. The town was home to several oil refineries, and the population grew to over 3,000 by 1920.
Geography
Frederick is located in southwestern Oklahoma, approximately 80 miles northwest of Oklahoma City. The city is situated on the Red River, which forms the border between Oklahoma and Texas. The city has a total area of 4.2 square miles, all of which is land.
The climate in Frederick is classified as humid subtropical, with hot summers and mild winters. The average annual temperature is 64°F, and the average annual precipitation is 33 inches.
Economy
The economy of Frederick is largely based on agriculture and oil and gas production. The city is home to several oil refineries, and the surrounding area is home to several large farms and ranches.
The city is also home to several manufacturing companies, including a plastics plant and a metal fabrication plant. The city is also home to several retail stores, restaurants, and other businesses.
Demographics
As of the 2010 census, the population of Frederick was 2,788. The racial makeup of the city was 79.2% White, 0.7% African American, 0.9% Native American, 0.2% Asian, 0.1% Pacific Islander, 16.2% from other races, and 2.9% from two or more races. Hispanic or Latino of any race were 24.2% of the population.
The median household income in Frederick was $31,944, and the median family income was $37,917. The per capita income was $15,945. About 17.2% of families and 21.2% of the population were below the poverty line.
Common Questions
What is Per Capita Income in Frederick?
Per Capita income in Frederick is $21,161.
What is the Median Family Income in Frederick?
Median Family Income in Frederick is $52,273.
What is the Median Household income in Frederick?
Median Household Income in Frederick is $41,555.
What is Income or Wage Gap in Frederick?
Income or Wage Gap in Frederick is 28.1%.
Women in Frederick earn 71.9 cents for every dollar earned by a man.
What is Family Income Deficit in Frederick?
Family Income Deficit in Frederick is $12,637.
Families that are below poverty line in Frederick earn $12,637 less on average than the poverty threshold level.
What is Inequality or Gini Index in Frederick?
Inequality or Gini Index in Frederick is 0.43.
What is the Total Population of Frederick?
Total Population of Frederick is 3,486.
What is the Total Male Population of Frederick?
Total Male Population of Frederick is 1,626.
What is the Total Female Population of Frederick?
Total Female Population of Frederick is 1,860.
What is the Ratio of Males per 100 Females in Frederick?
There are 87.42 Males per 100 Females in Frederick.
What is the Ratio of Females per 100 Males in Frederick?
There are 114.39 Females per 100 Males in Frederick.
What is the Median Population Age in Frederick?
Median Population Age in Frederick is 37.8 Years.
What is the Average Family Size in Frederick
Average Family Size in Frederick is 3.4 People.
What is the Average Household Size in Frederick
Average Household Size in Frederick is 2.6 People.
How Large is the Labor Force in Frederick?
There are 1,370 People in the Labor Forcein in Frederick.
What is the Percentage of People in the Labor Force in Frederick?
51.4% of People are in the Labor Force in Frederick.
What is the Unemployment Rate in Frederick?
Unemployment Rate in Frederick is 2.8%.