Fruit Heights, UT Map & Demographics
Fruit Heights Map
Fruit Heights Overview
$67,623
PER CAPITA INCOME
$124,423
AVG FAMILY INCOME
$117,123
AVG HOUSEHOLD INCOME
61.8%
WAGE / INCOME GAP [ % ]
38.2¢/ $1
WAGE / INCOME GAP [ $ ]
0.49
INEQUALITY / GINI INDEX
6,018
TOTAL POPULATION
3,215
MALE POPULATION
2,803
FEMALE POPULATION
114.70
MALES / 100 FEMALES
87.19
FEMALES / 100 MALES
41.5
MEDIAN AGE
3.1
AVG FAMILY SIZE
2.9
AVG HOUSEHOLD SIZE
2,821
LABOR FORCE [ PEOPLE ]
63.9%
PERCENT IN LABOR FORCE
0.8%
UNEMPLOYMENT RATE
Income in Fruit Heights
Income Overview in Fruit Heights
Per Capita Income in Fruit Heights is $67,623, while median incomes of families and households are $124,423 and $117,123 respectively.
| Characteristic | Number | Measure |
| Per Capita Income | 6,018 | $67,623 |
| Median Family Income | 1,890 | $124,423 |
| Mean Family Income | 1,890 | $202,111 |
| Median Household Income | 2,046 | $117,123 |
| Mean Household Income | 2,046 | $192,866 |
| Income Deficit | 1,890 | $0 |
| Wage / Income Gap (%) | 6,018 | 61.80% |
| Wage / Income Gap ($) | 6,018 | 38.20¢ per $1 |
| Gini / Inequality Index | 6,018 | 0.49 |
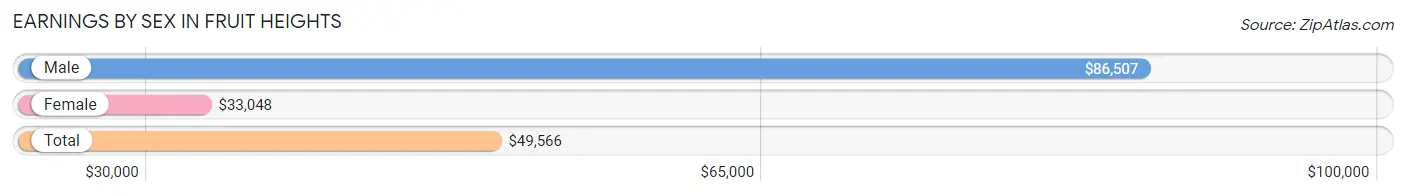
Earnings by Sex in Fruit Heights
Average Earnings in Fruit Heights are $49,566, $86,507 for men and $33,048 for women, a difference of 61.8%.
| Sex | Number | Average Earnings |
| Male | 1,780 (58.5%) | $86,507 |
| Female | 1,263 (41.5%) | $33,048 |
| Total | 3,043 (100.0%) | $49,566 |
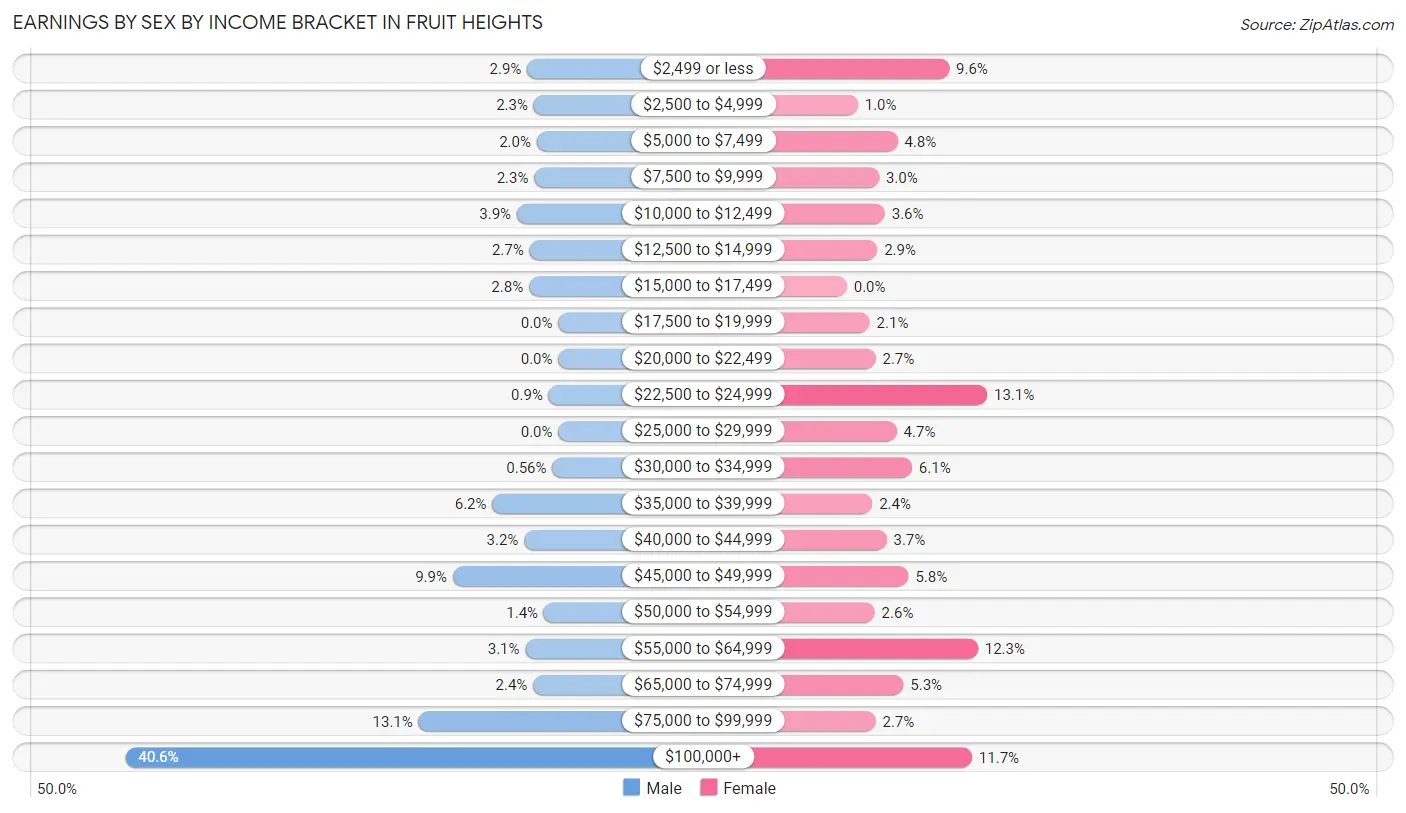
Earnings by Sex by Income Bracket in Fruit Heights
The most common earnings brackets in Fruit Heights are $100,000+ for men (722 | 40.6%) and $22,500 to $24,999 for women (166 | 13.1%).
| Income | Male | Female |
| $2,499 or less | 52 (2.9%) | 121 (9.6%) |
| $2,500 to $4,999 | 41 (2.3%) | 13 (1.0%) |
| $5,000 to $7,499 | 36 (2.0%) | 60 (4.8%) |
| $7,500 to $9,999 | 40 (2.2%) | 38 (3.0%) |
| $10,000 to $12,499 | 69 (3.9%) | 45 (3.6%) |
| $12,500 to $14,999 | 48 (2.7%) | 36 (2.9%) |
| $15,000 to $17,499 | 49 (2.8%) | 0 (0.0%) |
| $17,500 to $19,999 | 0 (0.0%) | 27 (2.1%) |
| $20,000 to $22,499 | 0 (0.0%) | 34 (2.7%) |
| $22,500 to $24,999 | 16 (0.9%) | 166 (13.1%) |
| $25,000 to $29,999 | 0 (0.0%) | 59 (4.7%) |
| $30,000 to $34,999 | 10 (0.6%) | 77 (6.1%) |
| $35,000 to $39,999 | 110 (6.2%) | 30 (2.4%) |
| $40,000 to $44,999 | 57 (3.2%) | 47 (3.7%) |
| $45,000 to $49,999 | 176 (9.9%) | 73 (5.8%) |
| $50,000 to $54,999 | 24 (1.3%) | 33 (2.6%) |
| $55,000 to $64,999 | 55 (3.1%) | 155 (12.3%) |
| $65,000 to $74,999 | 42 (2.4%) | 67 (5.3%) |
| $75,000 to $99,999 | 233 (13.1%) | 34 (2.7%) |
| $100,000+ | 722 (40.6%) | 148 (11.7%) |
| Total | 1,780 (100.0%) | 1,263 (100.0%) |
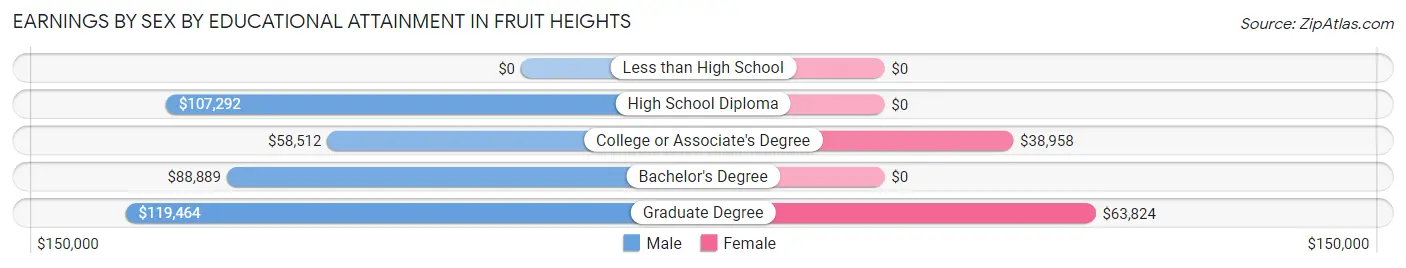
Earnings by Sex by Educational Attainment in Fruit Heights
Average earnings in Fruit Heights are $98,295 for men and $34,627 for women, a difference of 64.8%. Men with an educational attainment of graduate degree enjoy the highest average annual earnings of $119,464, while those with college or associate's degree education earn the least with $58,512. Women with an educational attainment of graduate degree earn the most with the average annual earnings of $63,824, while those with college or associate's degree education have the smallest earnings of $38,958.
| Educational Attainment | Male Income | Female Income |
| Less than High School | - | - |
| High School Diploma | $107,292 | $0 |
| College or Associate's Degree | $58,512 | $38,958 |
| Bachelor's Degree | $88,889 | $0 |
| Graduate Degree | $119,464 | $63,824 |
| Total | $98,295 | $34,627 |
Family Income in Fruit Heights
Family Income Brackets in Fruit Heights
According to the Fruit Heights family income data, there are 501 families falling into the $100,000 to $149,999 income range, which is the most common income bracket and makes up 26.5% of all families.
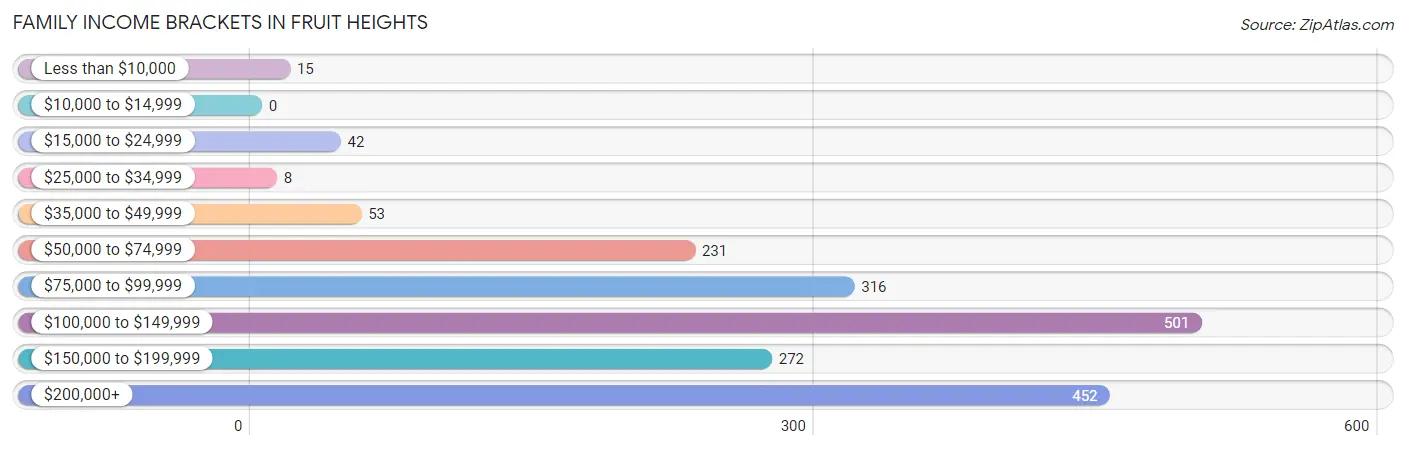
| Income Bracket | # Families | % Families |
| Less than $10,000 | 15 | 0.8% |
| $10,000 to $14,999 | 0 | 0.0% |
| $15,000 to $24,999 | 42 | 2.2% |
| $25,000 to $34,999 | 8 | 0.4% |
| $35,000 to $49,999 | 53 | 2.8% |
| $50,000 to $74,999 | 231 | 12.2% |
| $75,000 to $99,999 | 316 | 16.7% |
| $100,000 to $149,999 | 501 | 26.5% |
| $150,000 to $199,999 | 272 | 14.4% |
| $200,000+ | 452 | 23.9% |
Family Income by Famaliy Size in Fruit Heights
7+ person families (46 | 2.4%) account for the highest median family income in Fruit Heights with $250,001 per family, while 2-person families (967 | 51.2%) have the highest median income of $58,304 per family member.
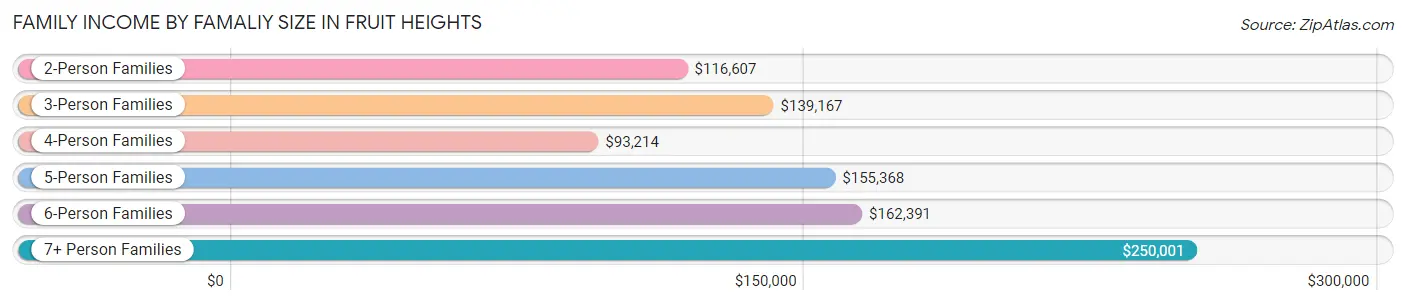
| Income Bracket | # Families | Median Income |
| 2-Person Families | 967 (51.2%) | $116,607 |
| 3-Person Families | 218 (11.5%) | $139,167 |
| 4-Person Families | 462 (24.4%) | $93,214 |
| 5-Person Families | 67 (3.5%) | $155,368 |
| 6-Person Families | 130 (6.9%) | $162,391 |
| 7+ Person Families | 46 (2.4%) | $250,001 |
| Total | 1,890 (100.0%) | $124,423 |
Family Income by Number of Earners in Fruit Heights
The median family income in Fruit Heights is $124,423, with families comprising 3+ earners (151) having the highest median family income of $174,185, while families with no earners (268) have the lowest median family income of $69,337, accounting for 8.0% and 14.2% of families, respectively.
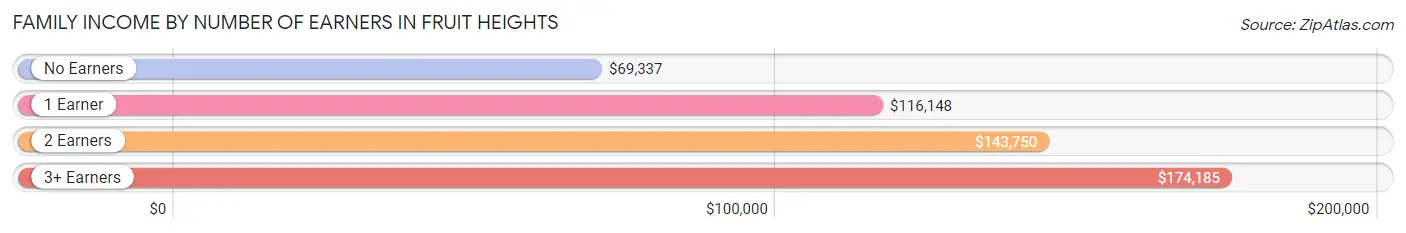
| Number of Earners | # Families | Median Income |
| No Earners | 268 (14.2%) | $69,337 |
| 1 Earner | 497 (26.3%) | $116,148 |
| 2 Earners | 974 (51.5%) | $143,750 |
| 3+ Earners | 151 (8.0%) | $174,185 |
| Total | 1,890 (100.0%) | $124,423 |
Household Income in Fruit Heights
Household Income Brackets in Fruit Heights
With 489 households falling in the category, the $100,000 to $149,999 income range is the most frequent in Fruit Heights, accounting for 23.9% of all households. In contrast, only 6 households (0.3%) fall into the $25,000 to $34,999 income bracket, making it the least populous group.
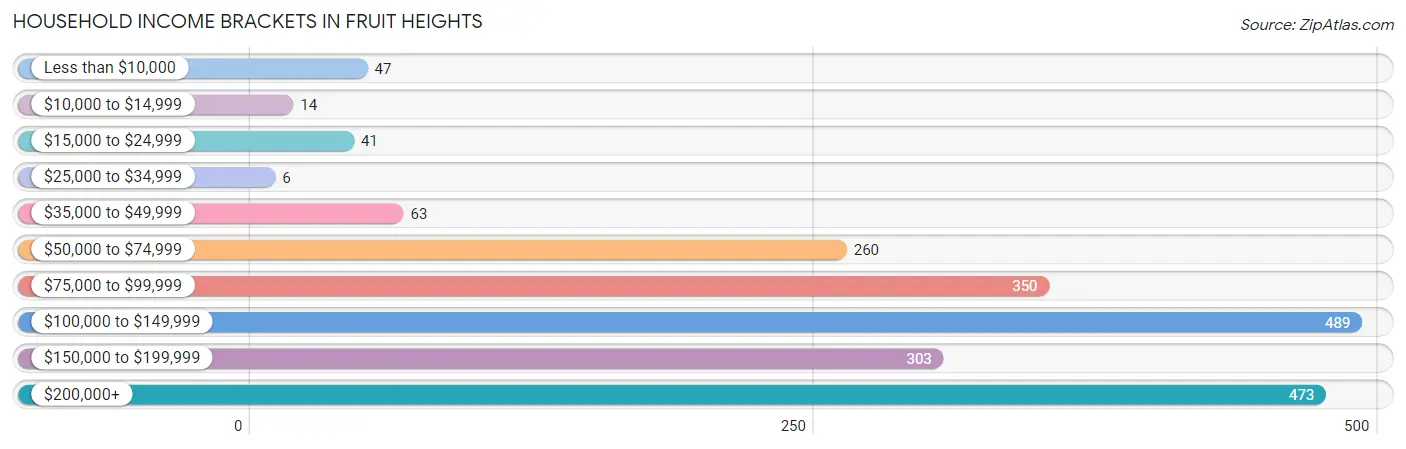
| Income Bracket | # Households | % Households |
| Less than $10,000 | 47 | 2.3% |
| $10,000 to $14,999 | 14 | 0.7% |
| $15,000 to $24,999 | 41 | 2.0% |
| $25,000 to $34,999 | 6 | 0.3% |
| $35,000 to $49,999 | 63 | 3.1% |
| $50,000 to $74,999 | 260 | 12.7% |
| $75,000 to $99,999 | 350 | 17.1% |
| $100,000 to $149,999 | 489 | 23.9% |
| $150,000 to $199,999 | 303 | 14.8% |
| $200,000+ | 473 | 23.1% |
Household Income by Householder Age in Fruit Heights
The median household income in Fruit Heights is $117,123, with the highest median household income of $141,096 found in the 45 to 64 years age bracket for the primary householder. A total of 789 households (38.6%) fall into this category.
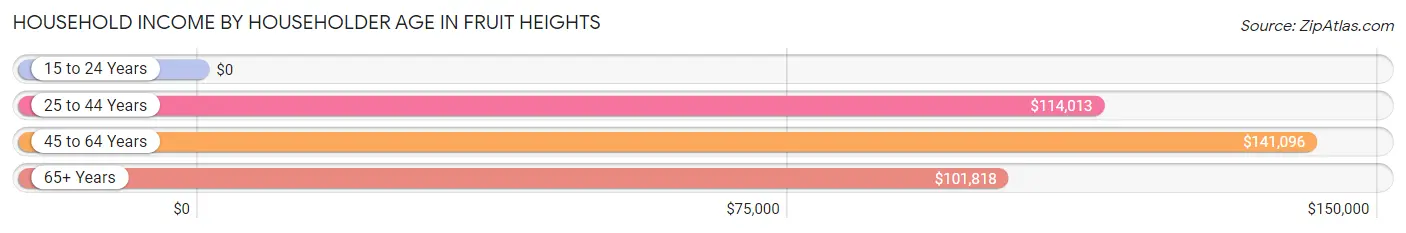
| Income Bracket | # Households | Median Income |
| 15 to 24 Years | 0 (0.0%) | $0 |
| 25 to 44 Years | 637 (31.1%) | $114,013 |
| 45 to 64 Years | 789 (38.6%) | $141,096 |
| 65+ Years | 620 (30.3%) | $101,818 |
| Total | 2,046 (100.0%) | $117,123 |
Poverty in Fruit Heights
Income Below Poverty by Sex and Age in Fruit Heights
With 0.7% poverty level for males and 5.7% for females among the residents of Fruit Heights, 75 year old and over males and 15 year old females are the most vulnerable to poverty, with 17 males (9.8%) and 30 females (47.6%) in their respective age groups living below the poverty level.
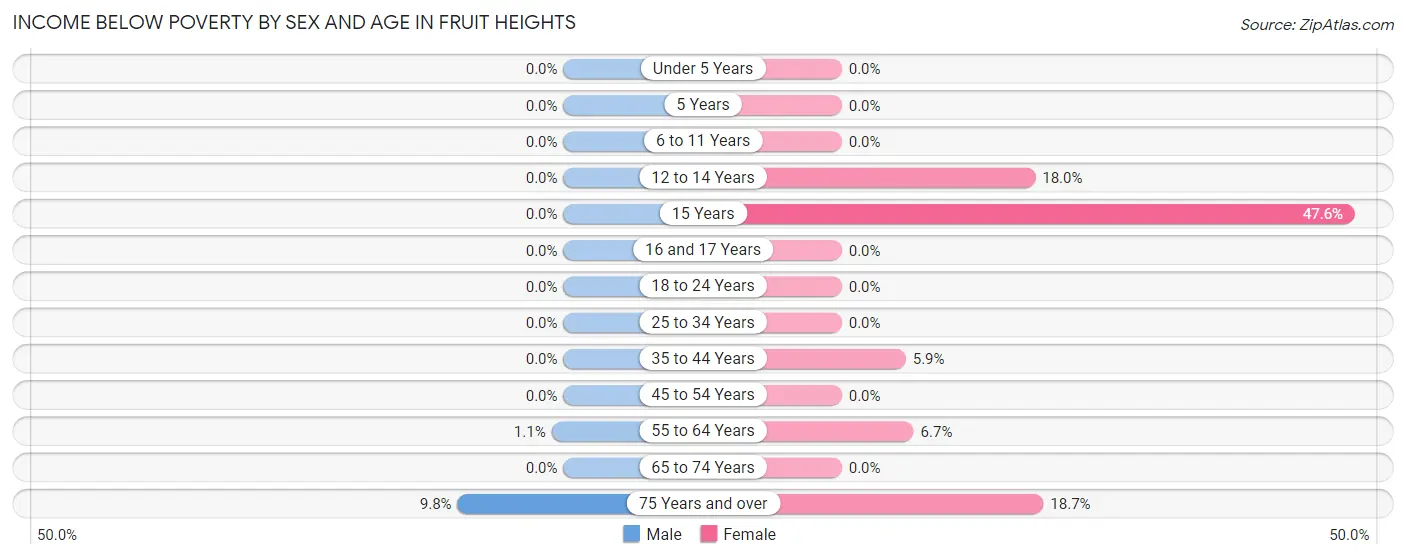
| Age Bracket | Male | Female |
| Under 5 Years | 0 (0.0%) | 0 (0.0%) |
| 5 Years | 0 (0.0%) | 0 (0.0%) |
| 6 to 11 Years | 0 (0.0%) | 0 (0.0%) |
| 12 to 14 Years | 0 (0.0%) | 37 (18.0%) |
| 15 Years | 0 (0.0%) | 30 (47.6%) |
| 16 and 17 Years | 0 (0.0%) | 0 (0.0%) |
| 18 to 24 Years | 0 (0.0%) | 0 (0.0%) |
| 25 to 34 Years | 0 (0.0%) | 0 (0.0%) |
| 35 to 44 Years | 0 (0.0%) | 34 (5.9%) |
| 45 to 54 Years | 0 (0.0%) | 0 (0.0%) |
| 55 to 64 Years | 5 (1.1%) | 31 (6.7%) |
| 65 to 74 Years | 0 (0.0%) | 0 (0.0%) |
| 75 Years and over | 17 (9.8%) | 26 (18.7%) |
| Total | 22 (0.7%) | 158 (5.7%) |
Income Above Poverty by Sex and Age in Fruit Heights
According to the poverty statistics in Fruit Heights, males aged under 5 years and females aged under 5 years are the age groups that are most secure financially, with 100.0% of males and 100.0% of females in these age groups living above the poverty line.
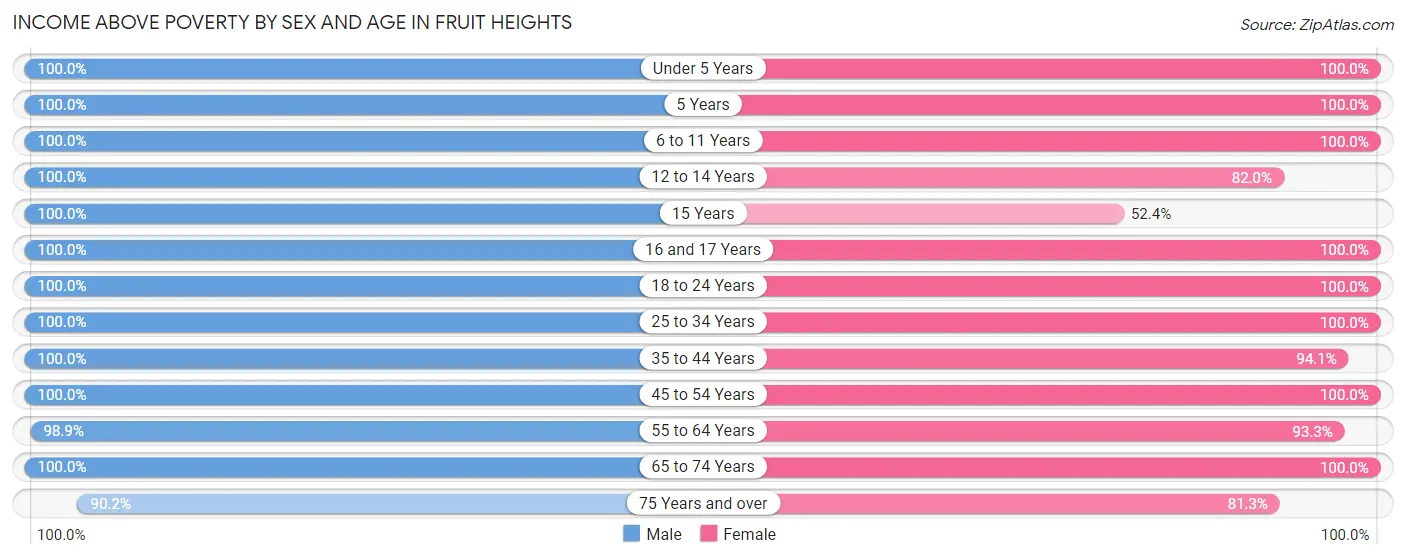
| Age Bracket | Male | Female |
| Under 5 Years | 156 (100.0%) | 93 (100.0%) |
| 5 Years | 37 (100.0%) | 22 (100.0%) |
| 6 to 11 Years | 545 (100.0%) | 274 (100.0%) |
| 12 to 14 Years | 82 (100.0%) | 169 (82.0%) |
| 15 Years | 93 (100.0%) | 33 (52.4%) |
| 16 and 17 Years | 166 (100.0%) | 58 (100.0%) |
| 18 to 24 Years | 232 (100.0%) | 79 (100.0%) |
| 25 to 34 Years | 126 (100.0%) | 119 (100.0%) |
| 35 to 44 Years | 482 (100.0%) | 538 (94.1%) |
| 45 to 54 Years | 249 (100.0%) | 290 (100.0%) |
| 55 to 64 Years | 450 (98.9%) | 434 (93.3%) |
| 65 to 74 Years | 404 (100.0%) | 405 (100.0%) |
| 75 Years and over | 156 (90.2%) | 113 (81.3%) |
| Total | 3,178 (99.3%) | 2,627 (94.3%) |
Income Below Poverty Among Married-Couple Families in Fruit Heights
The poverty statistics for married-couple families in Fruit Heights show that 1.0% or 16 of the total 1,674 families live below the poverty line. Families with no children have the highest poverty rate of 1.7%, comprising of 16 families. On the other hand, families with 1 or 2 children have the lowest poverty rate of 0.0%, which includes 0 families.
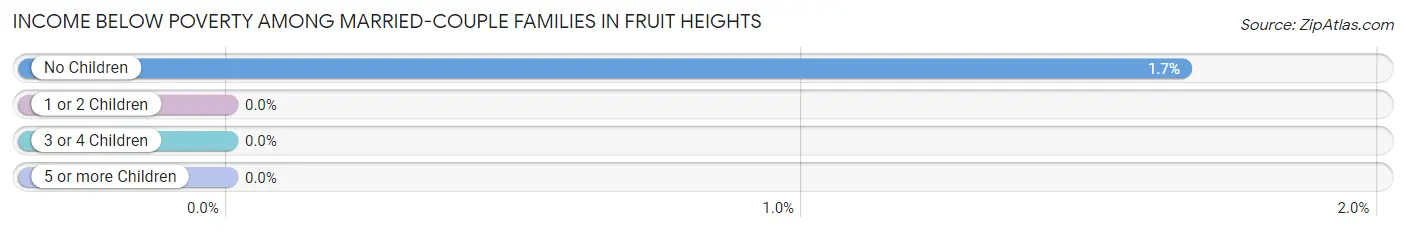
| Children | Above Poverty | Below Poverty |
| No Children | 950 (98.3%) | 16 (1.7%) |
| 1 or 2 Children | 511 (100.0%) | 0 (0.0%) |
| 3 or 4 Children | 151 (100.0%) | 0 (0.0%) |
| 5 or more Children | 46 (100.0%) | 0 (0.0%) |
| Total | 1,658 (99.0%) | 16 (1.0%) |
Income Below Poverty Among Single-Parent Households in Fruit Heights
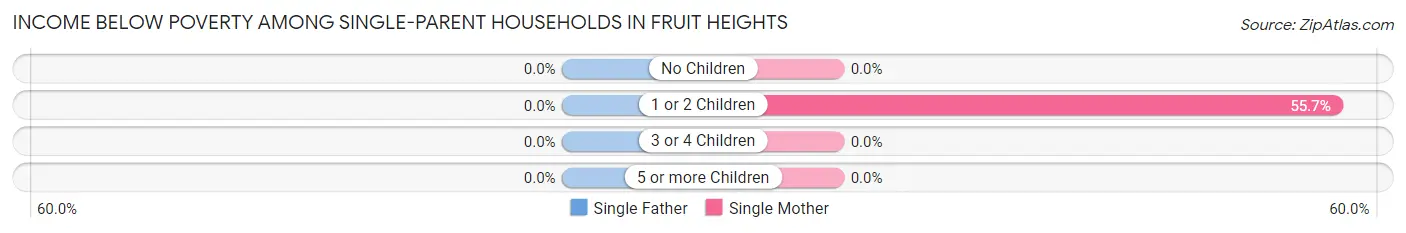
| Children | Single Father | Single Mother |
| No Children | 0 (0.0%) | 0 (0.0%) |
| 1 or 2 Children | 0 (0.0%) | 34 (55.7%) |
| 3 or 4 Children | 0 (0.0%) | 0 (0.0%) |
| 5 or more Children | 0 (0.0%) | 0 (0.0%) |
| Total | 0 (0.0%) | 34 (26.6%) |
Income Below Poverty Among Married-Couple vs Single-Parent Households in Fruit Heights
The poverty data for Fruit Heights shows that 16 of the married-couple family households (1.0%) and 34 of the single-parent households (15.7%) are living below the poverty level. Within the married-couple family households, those with no children have the highest poverty rate, with 16 households (1.7%) falling below the poverty line. Among the single-parent households, those with 1 or 2 children have the highest poverty rate, with 34 household (24.5%) living below poverty.
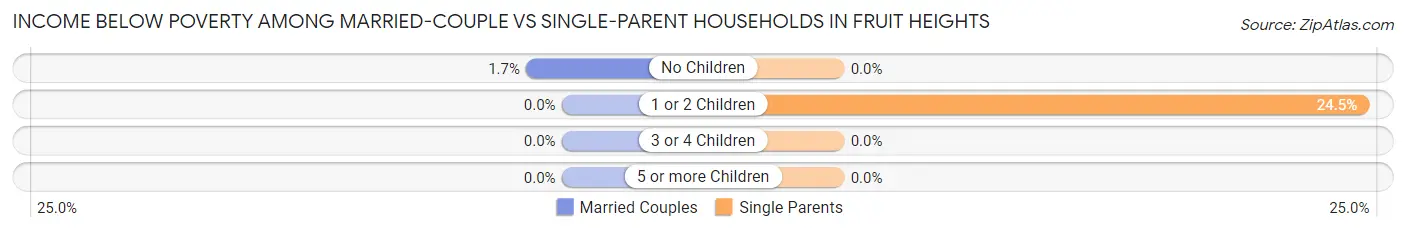
| Children | Married-Couple Families | Single-Parent Households |
| No Children | 16 (1.7%) | 0 (0.0%) |
| 1 or 2 Children | 0 (0.0%) | 34 (24.5%) |
| 3 or 4 Children | 0 (0.0%) | 0 (0.0%) |
| 5 or more Children | 0 (0.0%) | 0 (0.0%) |
| Total | 16 (1.0%) | 34 (15.7%) |
Race in Fruit Heights
The most populous races in Fruit Heights are White / Caucasian (5,706 | 94.8%), Hispanic or Latino (240 | 4.0%), and Two or more Races (235 | 3.9%).
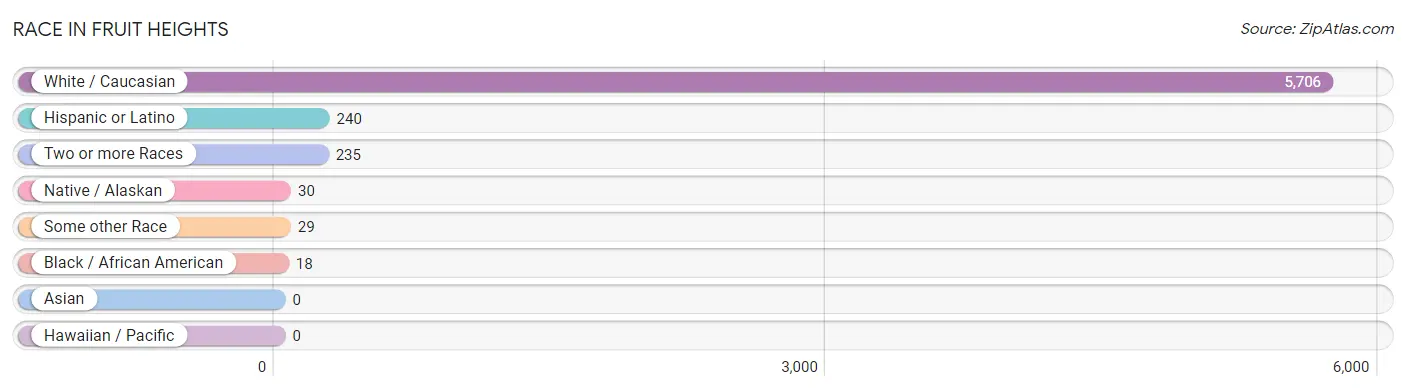
| Race | # Population | % Population |
| Asian | 0 | 0.0% |
| Black / African American | 18 | 0.3% |
| Hawaiian / Pacific | 0 | 0.0% |
| Hispanic or Latino | 240 | 4.0% |
| Native / Alaskan | 30 | 0.5% |
| White / Caucasian | 5,706 | 94.8% |
| Two or more Races | 235 | 3.9% |
| Some other Race | 29 | 0.5% |
| Total | 6,018 | 100.0% |
Ancestry in Fruit Heights
The most populous ancestries reported in Fruit Heights are English (2,054 | 34.1%), Irish (537 | 8.9%), German (440 | 7.3%), Scottish (363 | 6.0%), and Danish (362 | 6.0%), together accounting for 62.4% of all Fruit Heights residents.
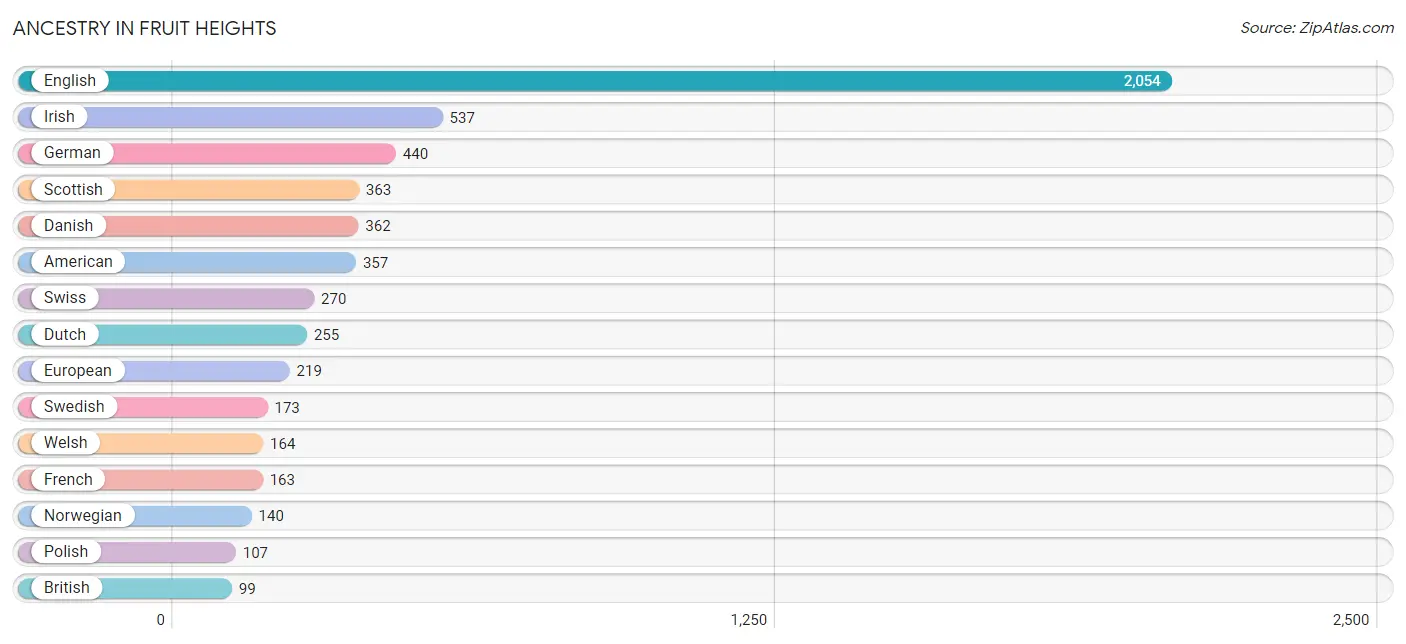
| Ancestry | # Population | % Population |
| American | 357 | 5.9% |
| Armenian | 6 | 0.1% |
| Australian | 6 | 0.1% |
| Basque | 19 | 0.3% |
| Belgian | 6 | 0.1% |
| British | 99 | 1.7% |
| Canadian | 14 | 0.2% |
| Chickasaw | 13 | 0.2% |
| Colombian | 17 | 0.3% |
| Danish | 362 | 6.0% |
| Dutch | 255 | 4.2% |
| Ecuadorian | 62 | 1.0% |
| English | 2,054 | 34.1% |
| European | 219 | 3.6% |
| French | 163 | 2.7% |
| French Canadian | 15 | 0.3% |
| German | 440 | 7.3% |
| Indian (Asian) | 79 | 1.3% |
| Irish | 537 | 8.9% |
| Mexican | 71 | 1.2% |
| Native Hawaiian | 79 | 1.3% |
| Norwegian | 140 | 2.3% |
| Polish | 107 | 1.8% |
| Romanian | 7 | 0.1% |
| Scandinavian | 70 | 1.2% |
| Scotch-Irish | 38 | 0.6% |
| Scottish | 363 | 6.0% |
| Sioux | 30 | 0.5% |
| South American | 79 | 1.3% |
| Spaniard | 23 | 0.4% |
| Spanish American Indian | 17 | 0.3% |
| Subsaharan African | 28 | 0.5% |
| Swedish | 173 | 2.9% |
| Swiss | 270 | 4.5% |
| Tongan | 30 | 0.5% |
| Welsh | 164 | 2.7% | View All 36 Rows |
Immigrants in Fruit Heights
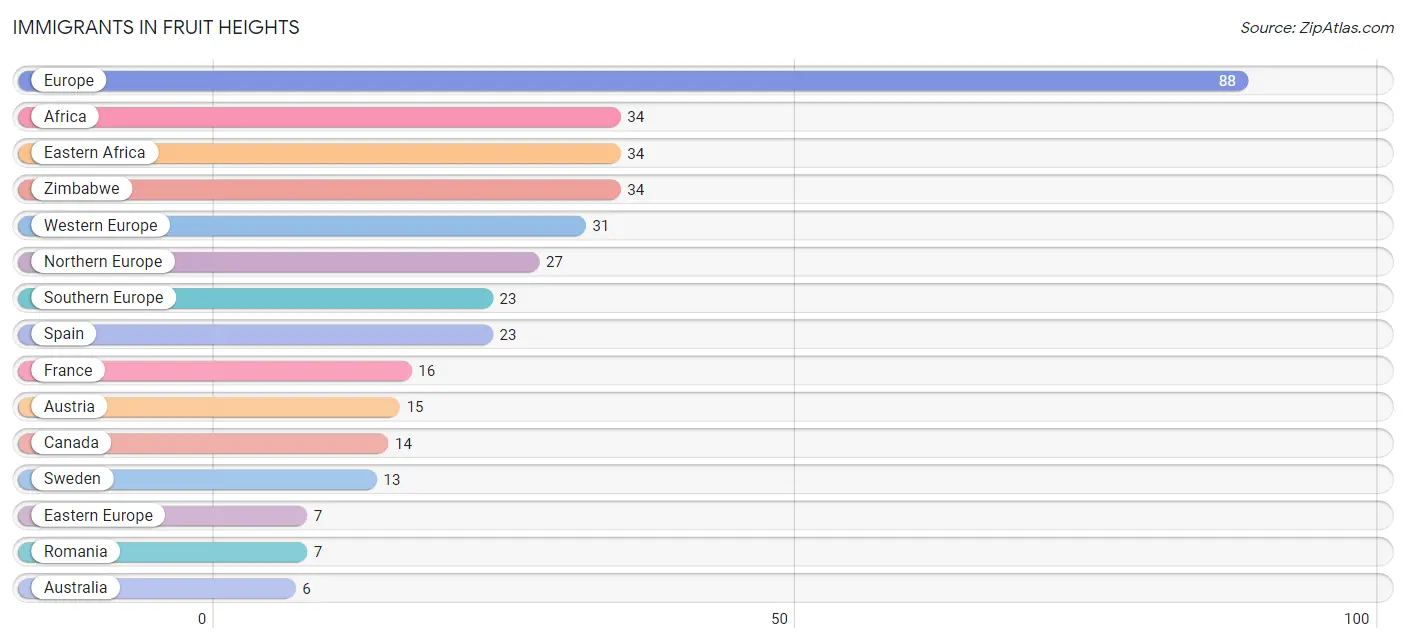
The most numerous immigrant groups reported in Fruit Heights came from Europe (88 | 1.5%), Africa (34 | 0.6%), Eastern Africa (34 | 0.6%), Zimbabwe (34 | 0.6%), and Western Europe (31 | 0.5%), together accounting for 3.7% of all Fruit Heights residents.
| Immigration Origin | # Population | % Population |
| Africa | 34 | 0.6% |
| Australia | 6 | 0.1% |
| Austria | 15 | 0.3% |
| Canada | 14 | 0.2% |
| Eastern Africa | 34 | 0.6% |
| Eastern Europe | 7 | 0.1% |
| England | 3 | 0.1% |
| Europe | 88 | 1.5% |
| France | 16 | 0.3% |
| Northern Europe | 27 | 0.4% |
| Oceania | 6 | 0.1% |
| Romania | 7 | 0.1% |
| Southern Europe | 23 | 0.4% |
| Spain | 23 | 0.4% |
| Sweden | 13 | 0.2% |
| Western Europe | 31 | 0.5% |
| Zimbabwe | 34 | 0.6% | View All 17 Rows |
Sex and Age in Fruit Heights
Sex and Age in Fruit Heights
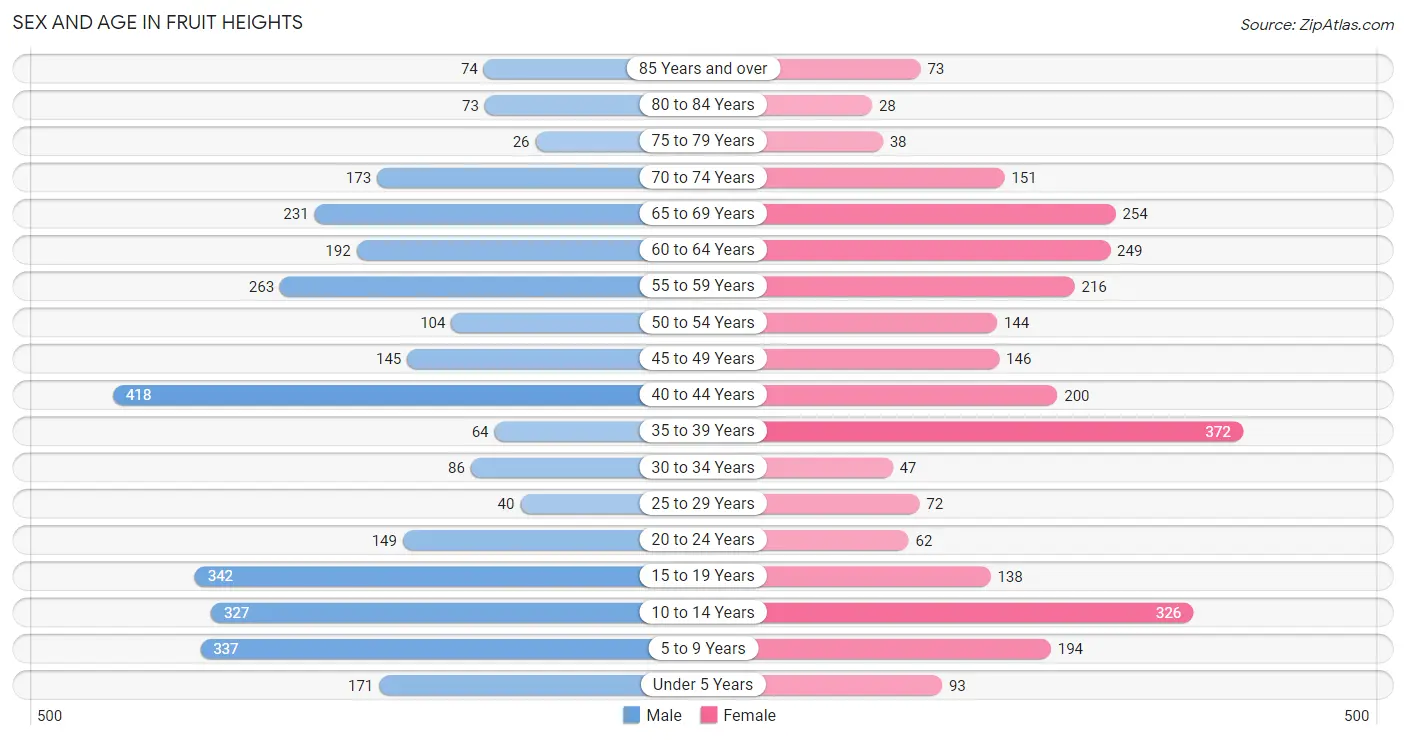
The most populous age groups in Fruit Heights are 40 to 44 Years (418 | 13.0%) for men and 35 to 39 Years (372 | 13.3%) for women.
| Age Bracket | Male | Female |
| Under 5 Years | 171 (5.3%) | 93 (3.3%) |
| 5 to 9 Years | 337 (10.5%) | 194 (6.9%) |
| 10 to 14 Years | 327 (10.2%) | 326 (11.6%) |
| 15 to 19 Years | 342 (10.6%) | 138 (4.9%) |
| 20 to 24 Years | 149 (4.6%) | 62 (2.2%) |
| 25 to 29 Years | 40 (1.2%) | 72 (2.6%) |
| 30 to 34 Years | 86 (2.7%) | 47 (1.7%) |
| 35 to 39 Years | 64 (2.0%) | 372 (13.3%) |
| 40 to 44 Years | 418 (13.0%) | 200 (7.1%) |
| 45 to 49 Years | 145 (4.5%) | 146 (5.2%) |
| 50 to 54 Years | 104 (3.2%) | 144 (5.1%) |
| 55 to 59 Years | 263 (8.2%) | 216 (7.7%) |
| 60 to 64 Years | 192 (6.0%) | 249 (8.9%) |
| 65 to 69 Years | 231 (7.2%) | 254 (9.1%) |
| 70 to 74 Years | 173 (5.4%) | 151 (5.4%) |
| 75 to 79 Years | 26 (0.8%) | 38 (1.4%) |
| 80 to 84 Years | 73 (2.3%) | 28 (1.0%) |
| 85 Years and over | 74 (2.3%) | 73 (2.6%) |
| Total | 3,215 (100.0%) | 2,803 (100.0%) |
Families and Households in Fruit Heights
Median Family Size in Fruit Heights
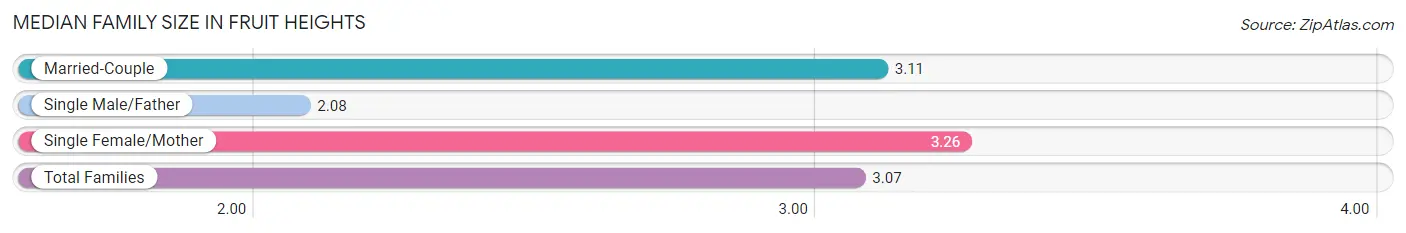
The median family size in Fruit Heights is 3.07 persons per family, with single female/mother families (128 | 6.8%) accounting for the largest median family size of 3.26 persons per family. On the other hand, single male/father families (88 | 4.7%) represent the smallest median family size with 2.08 persons per family.
| Family Type | # Families | Family Size |
| Married-Couple | 1,674 (88.6%) | 3.11 |
| Single Male/Father | 88 (4.7%) | 2.08 |
| Single Female/Mother | 128 (6.8%) | 3.26 |
| Total Families | 1,890 (100.0%) | 3.07 |
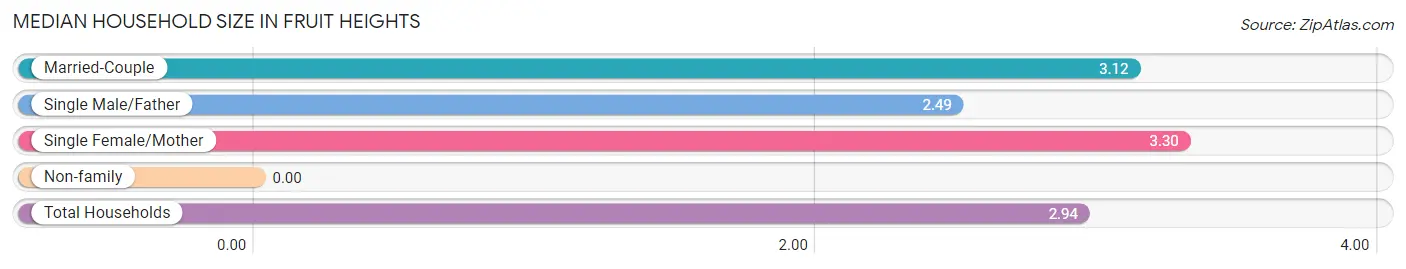
Median Household Size in Fruit Heights
| Household Type | # Households | Household Size |
| Married-Couple | 1,674 (81.8%) | 3.12 |
| Single Male/Father | 88 (4.3%) | 2.49 |
| Single Female/Mother | 128 (6.3%) | 3.30 |
| Non-family | 156 (7.6%) | - |
| Total Households | 2,046 (100.0%) | 2.94 |
Household Size by Marriage Status in Fruit Heights
Out of a total of 2,046 households in Fruit Heights, 1,890 (92.4%) are family households, while 156 (7.6%) are nonfamily households. The most numerous type of family households are 2-person households, comprising 941, and the most common type of nonfamily households are 1-person households, comprising 156.
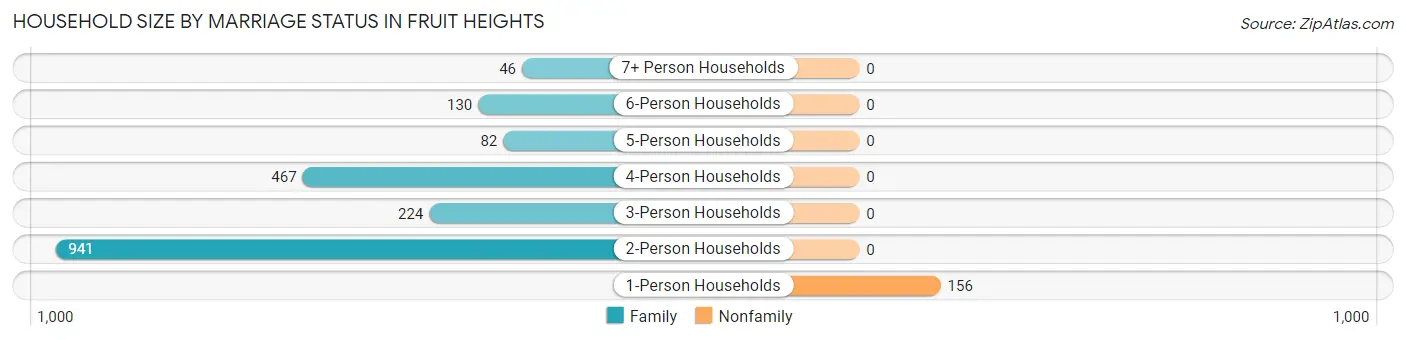
| Household Size | Family Households | Nonfamily Households |
| 1-Person Households | - | 156 (7.6%) |
| 2-Person Households | 941 (46.0%) | 0 (0.0%) |
| 3-Person Households | 224 (11.0%) | 0 (0.0%) |
| 4-Person Households | 467 (22.8%) | 0 (0.0%) |
| 5-Person Households | 82 (4.0%) | 0 (0.0%) |
| 6-Person Households | 130 (6.4%) | 0 (0.0%) |
| 7+ Person Households | 46 (2.2%) | 0 (0.0%) |
| Total | 1,890 (92.4%) | 156 (7.6%) |
Female Fertility in Fruit Heights
Fertility by Age in Fruit Heights
Average fertility rate in Fruit Heights is 47.0 births per 1,000 women. Women in the age bracket of 20 to 34 years have the highest fertility rate with 166.0 births per 1,000 women. Women in the age bracket of 20 to 34 years acount for 60.0% of all women with births.
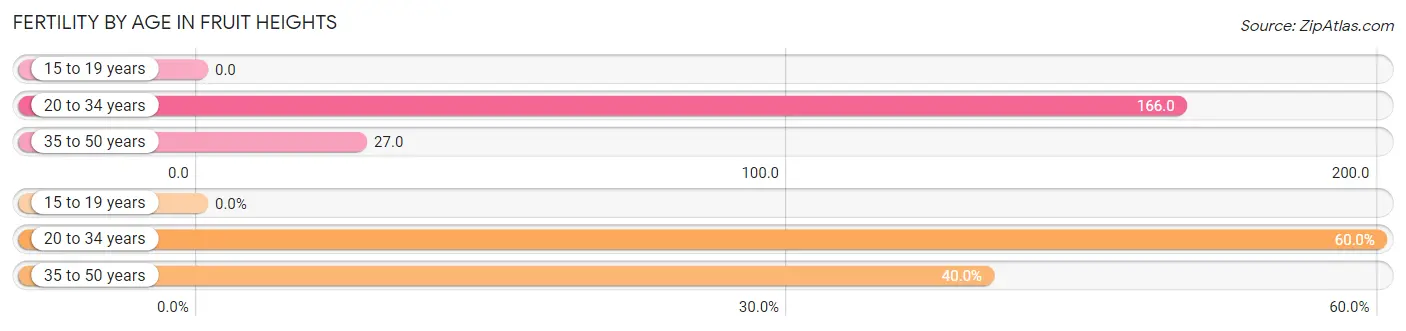
| Age Bracket | Women with Births | Births / 1,000 Women |
| 15 to 19 years | 0 (0.0%) | 0.0 |
| 20 to 34 years | 30 (60.0%) | 166.0 |
| 35 to 50 years | 20 (40.0%) | 27.0 |
| Total | 50 (100.0%) | 47.0 |
Fertility by Age by Marriage Status in Fruit Heights
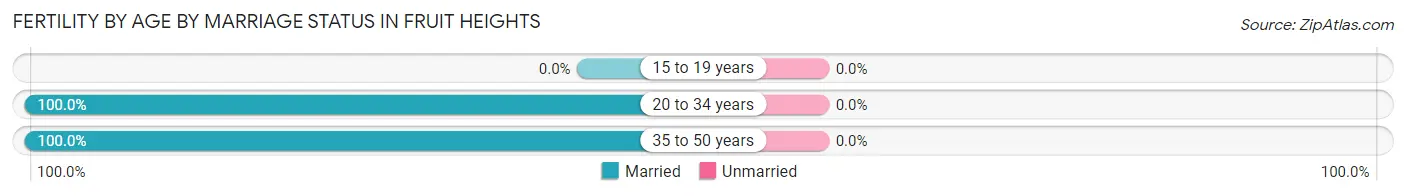
| Age Bracket | Married | Unmarried |
| 15 to 19 years | 0 (0.0%) | 0 (0.0%) |
| 20 to 34 years | 30 (100.0%) | 0 (0.0%) |
| 35 to 50 years | 20 (100.0%) | 0 (0.0%) |
| Total | 50 (100.0%) | 0 (0.0%) |
Fertility by Education in Fruit Heights
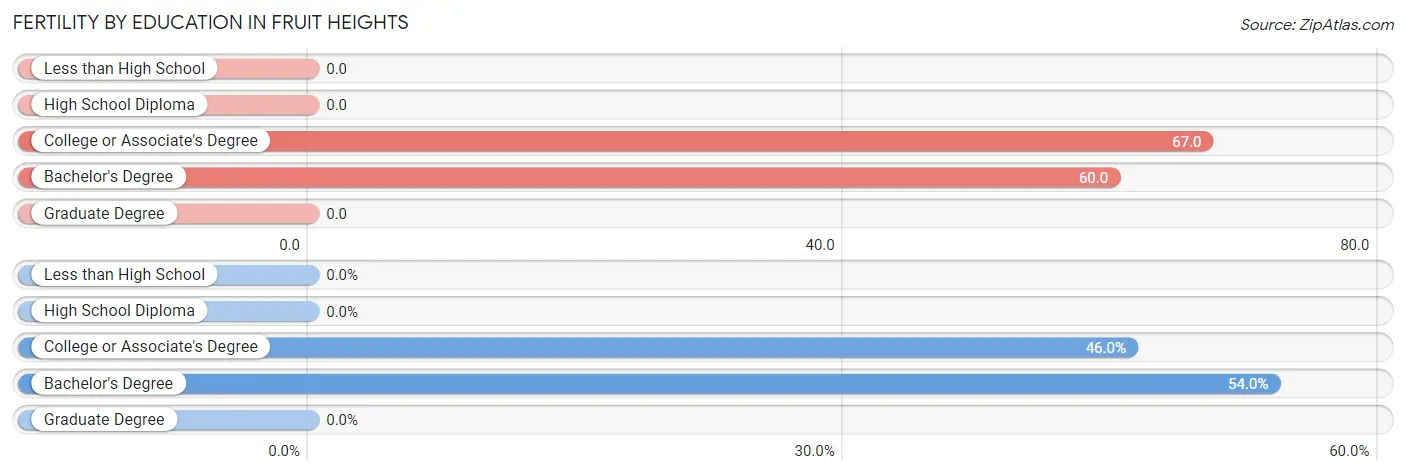
| Educational Attainment | Women with Births | Births / 1,000 Women |
| Less than High School | 0 (0.0%) | 0.0 |
| High School Diploma | 0 (0.0%) | 0.0 |
| College or Associate's Degree | 23 (46.0%) | 67.0 |
| Bachelor's Degree | 27 (54.0%) | 60.0 |
| Graduate Degree | 0 (0.0%) | 0.0 |
| Total | 50 (100.0%) | 47.0 |
Fertility by Education by Marriage Status in Fruit Heights
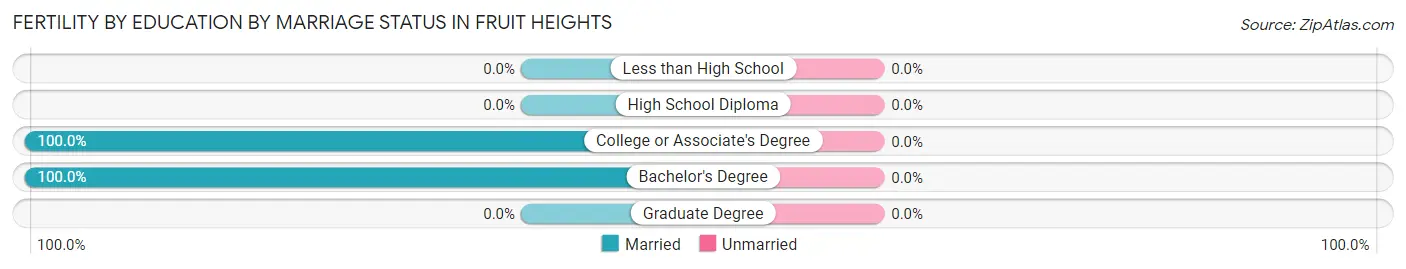
| Educational Attainment | Married | Unmarried |
| Less than High School | 0 (0.0%) | 0 (0.0%) |
| High School Diploma | 0 (0.0%) | 0 (0.0%) |
| College or Associate's Degree | 23 (100.0%) | 0 (0.0%) |
| Bachelor's Degree | 27 (100.0%) | 0 (0.0%) |
| Graduate Degree | 0 (0.0%) | 0 (0.0%) |
| Total | 50 (100.0%) | 0 (0.0%) |
Employment Characteristics in Fruit Heights
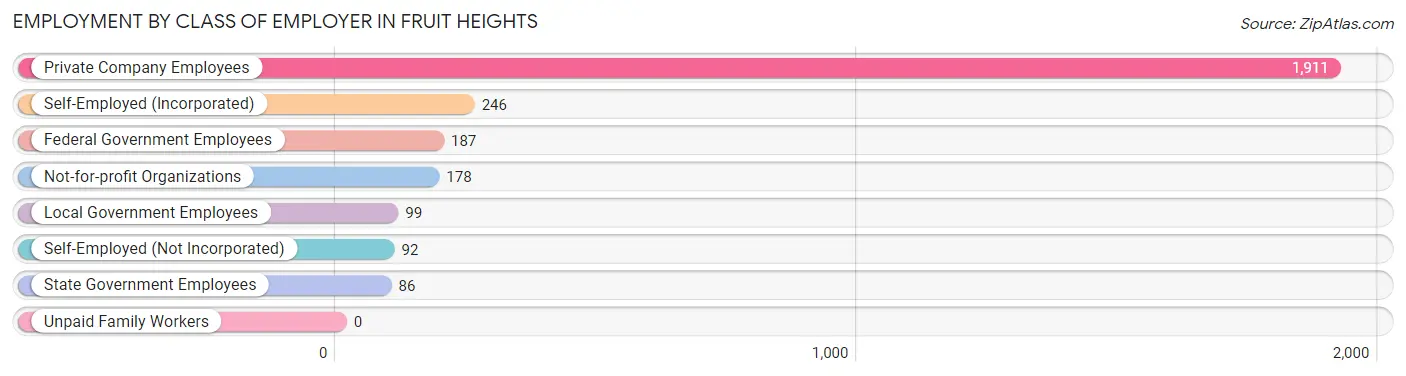
Employment by Class of Employer in Fruit Heights
Among the 2,799 employed individuals in Fruit Heights, private company employees (1,911 | 68.3%), self-employed (incorporated) (246 | 8.8%), and federal government employees (187 | 6.7%) make up the most common classes of employment.
| Employer Class | # Employees | % Employees |
| Private Company Employees | 1,911 | 68.3% |
| Self-Employed (Incorporated) | 246 | 8.8% |
| Self-Employed (Not Incorporated) | 92 | 3.3% |
| Not-for-profit Organizations | 178 | 6.4% |
| Local Government Employees | 99 | 3.5% |
| State Government Employees | 86 | 3.1% |
| Federal Government Employees | 187 | 6.7% |
| Unpaid Family Workers | 0 | 0.0% |
| Total | 2,799 | 100.0% |
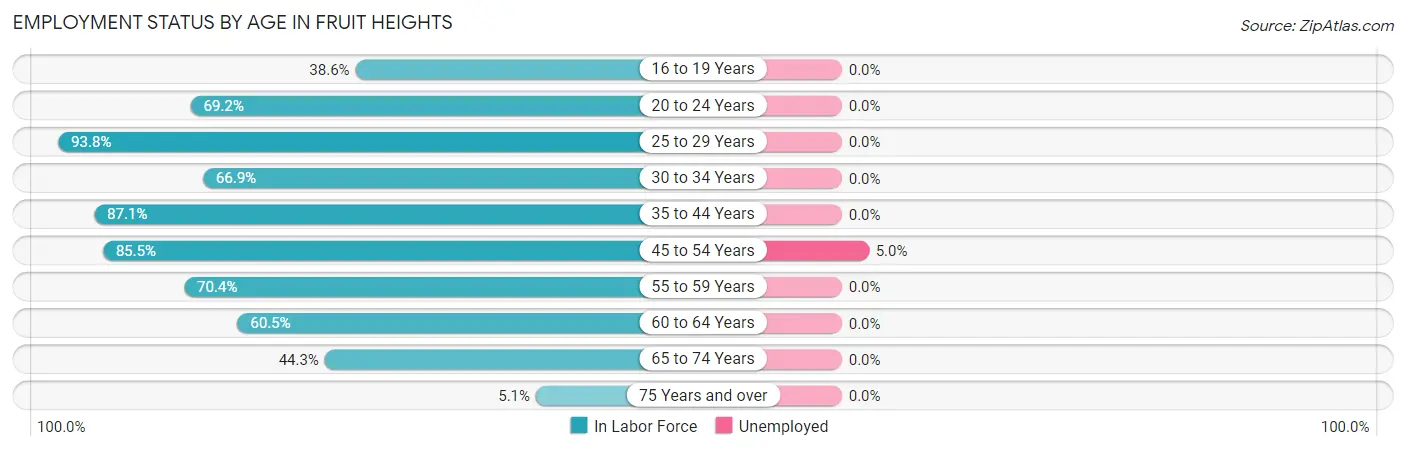
Employment Status by Age in Fruit Heights
According to the labor force statistics for Fruit Heights, out of the total population over 16 years of age (4,414), 63.9% or 2,821 individuals are in the labor force, with 0.8% or 23 of them unemployed. The age group with the highest labor force participation rate is 25 to 29 years, with 93.8% or 105 individuals in the labor force. Within the labor force, the 45 to 54 years age range has the highest percentage of unemployed individuals, with 5.0% or 23 of them being unemployed.
| Age Bracket | In Labor Force | Unemployed |
| 16 to 19 Years | 125 (38.6%) | 0 (0.0%) |
| 20 to 24 Years | 146 (69.2%) | 0 (0.0%) |
| 25 to 29 Years | 105 (93.8%) | 0 (0.0%) |
| 30 to 34 Years | 89 (66.9%) | 0 (0.0%) |
| 35 to 44 Years | 918 (87.1%) | 0 (0.0%) |
| 45 to 54 Years | 461 (85.5%) | 23 (5.0%) |
| 55 to 59 Years | 337 (70.4%) | 0 (0.0%) |
| 60 to 64 Years | 267 (60.5%) | 0 (0.0%) |
| 65 to 74 Years | 358 (44.3%) | 0 (0.0%) |
| 75 Years and over | 16 (5.1%) | 0 (0.0%) |
| Total | 2,821 (63.9%) | 23 (0.8%) |
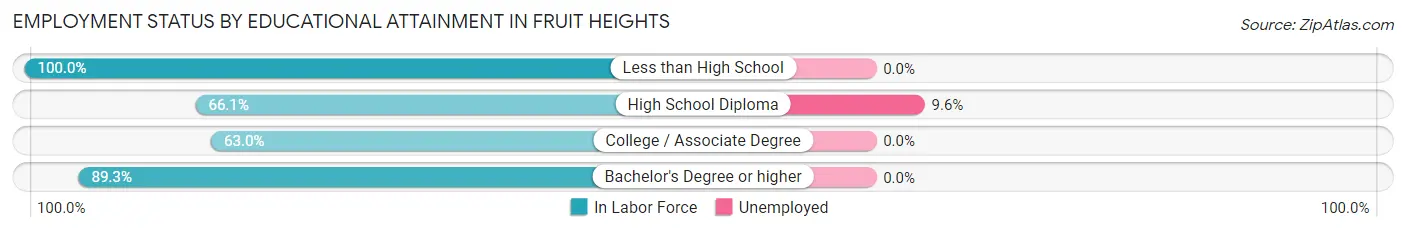
Employment Status by Educational Attainment in Fruit Heights
According to labor force statistics for Fruit Heights, 78.9% of individuals (2,176) out of the total population between 25 and 64 years of age (2,758) are in the labor force, with 1.1% or 24 of them being unemployed. The group with the highest labor force participation rate are those with the educational attainment of less than high school, with 100.0% or 43 individuals in the labor force. Within the labor force, individuals with high school diploma education have the highest percentage of unemployment, with 9.6% or 23 of them being unemployed.
| Educational Attainment | In Labor Force | Unemployed |
| Less than High School | 43 (100.0%) | 0 (0.0%) |
| High School Diploma | 240 (66.1%) | 35 (9.6%) |
| College / Associate Degree | 496 (63.0%) | 0 (0.0%) |
| Bachelor's Degree or higher | 1,398 (89.3%) | 0 (0.0%) |
| Total | 2,176 (78.9%) | 30 (1.1%) |
Employment Occupations by Sex in Fruit Heights
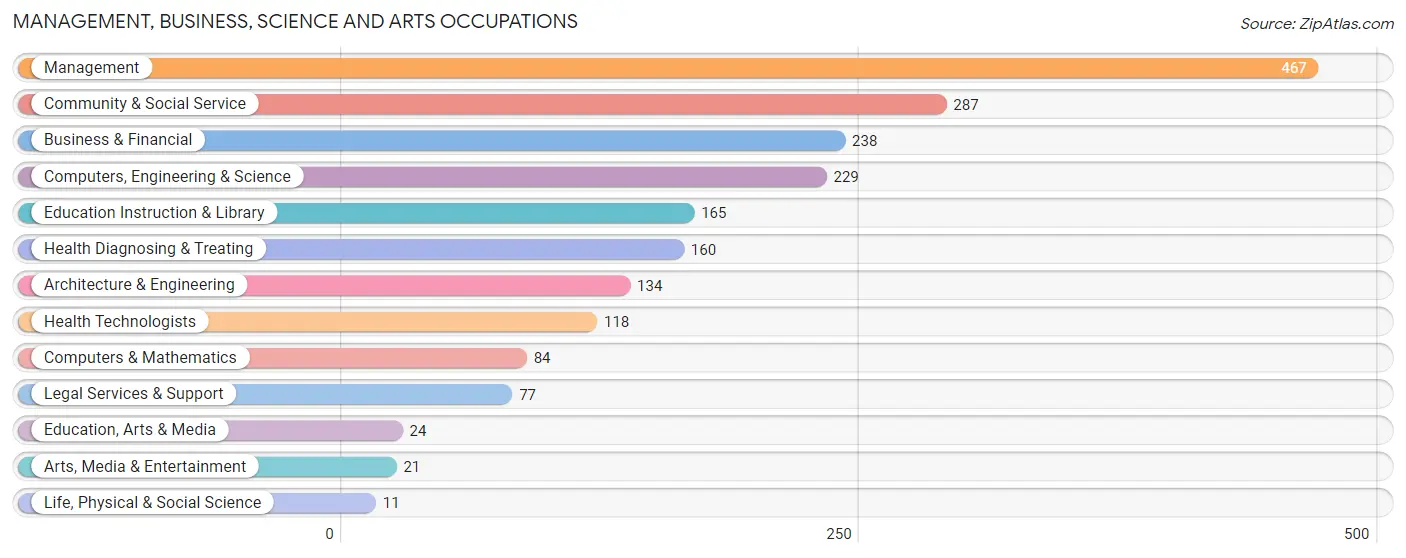
Management, Business, Science and Arts Occupations
The most common Management, Business, Science and Arts occupations in Fruit Heights are Management (467 | 16.7%), Community & Social Service (287 | 10.2%), Business & Financial (238 | 8.5%), Computers, Engineering & Science (229 | 8.2%), and Education Instruction & Library (165 | 5.9%).
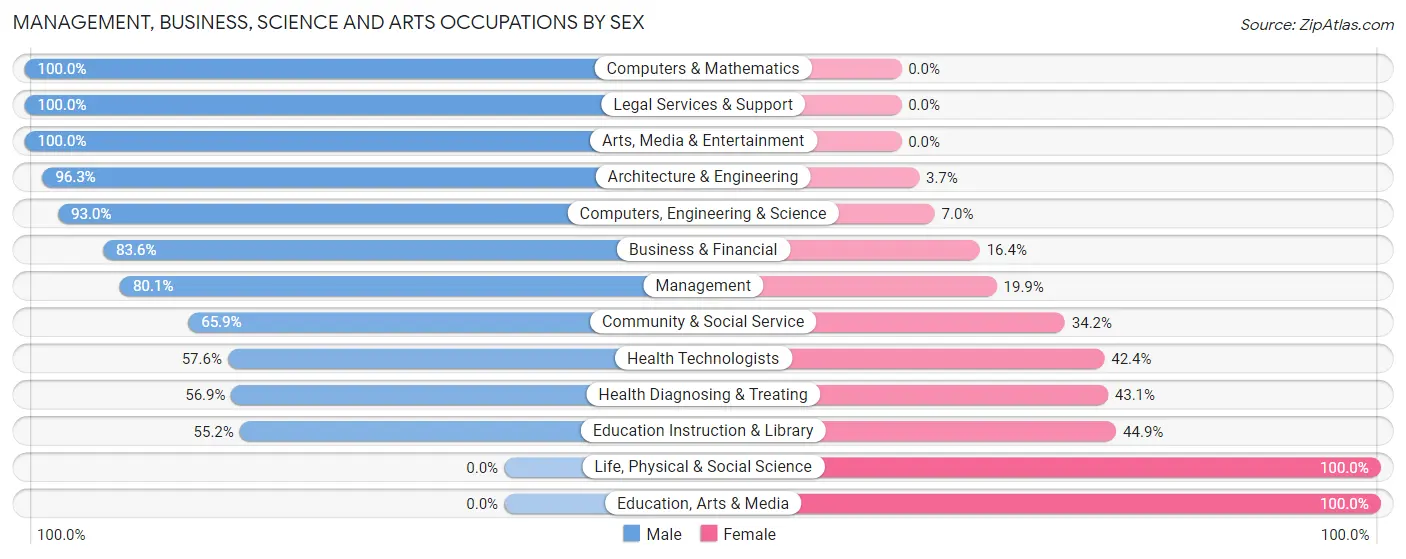
Management, Business, Science and Arts Occupations by Sex
Within the Management, Business, Science and Arts occupations in Fruit Heights, the most male-oriented occupations are Computers & Mathematics (100.0%), Legal Services & Support (100.0%), and Arts, Media & Entertainment (100.0%), while the most female-oriented occupations are Life, Physical & Social Science (100.0%), Education, Arts & Media (100.0%), and Education Instruction & Library (44.9%).
| Occupation | Male | Female |
| Management | 374 (80.1%) | 93 (19.9%) |
| Business & Financial | 199 (83.6%) | 39 (16.4%) |
| Computers, Engineering & Science | 213 (93.0%) | 16 (7.0%) |
| Computers & Mathematics | 84 (100.0%) | 0 (0.0%) |
| Architecture & Engineering | 129 (96.3%) | 5 (3.7%) |
| Life, Physical & Social Science | 0 (0.0%) | 11 (100.0%) |
| Community & Social Service | 189 (65.8%) | 98 (34.2%) |
| Education, Arts & Media | 0 (0.0%) | 24 (100.0%) |
| Legal Services & Support | 77 (100.0%) | 0 (0.0%) |
| Education Instruction & Library | 91 (55.1%) | 74 (44.9%) |
| Arts, Media & Entertainment | 21 (100.0%) | 0 (0.0%) |
| Health Diagnosing & Treating | 91 (56.9%) | 69 (43.1%) |
| Health Technologists | 68 (57.6%) | 50 (42.4%) |
| Total (Category) | 1,066 (77.2%) | 315 (22.8%) |
| Total (Overall) | 1,676 (59.9%) | 1,123 (40.1%) |
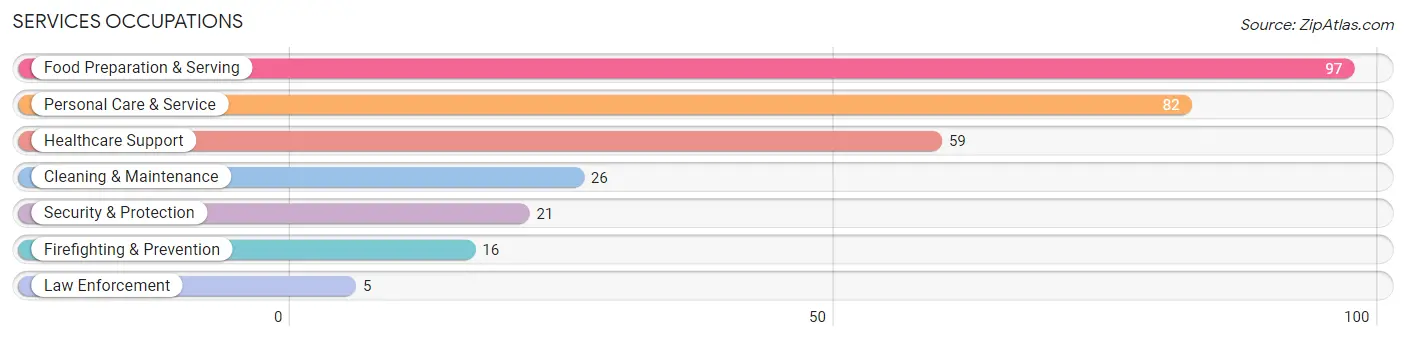
Services Occupations
The most common Services occupations in Fruit Heights are Food Preparation & Serving (97 | 3.5%), Personal Care & Service (82 | 2.9%), Healthcare Support (59 | 2.1%), Cleaning & Maintenance (26 | 0.9%), and Security & Protection (21 | 0.7%).
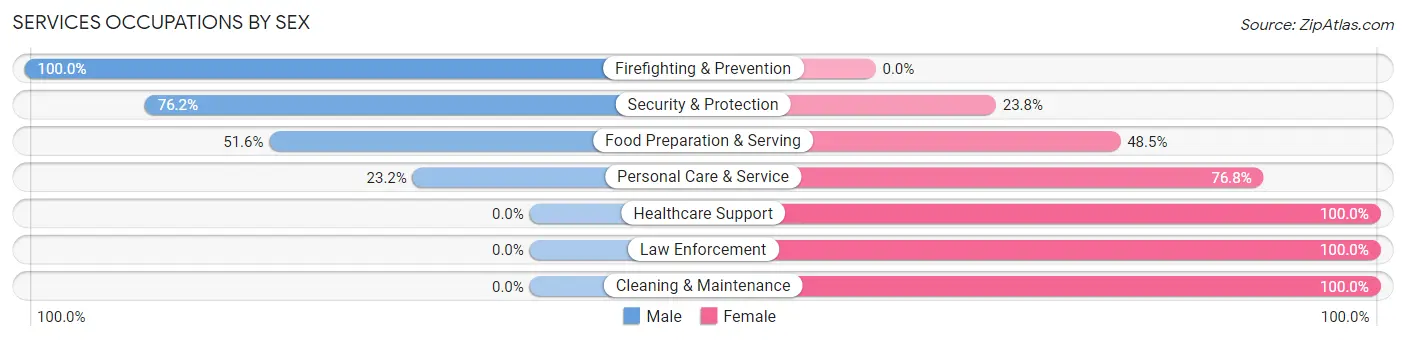
Services Occupations by Sex
Within the Services occupations in Fruit Heights, the most male-oriented occupations are Firefighting & Prevention (100.0%), Security & Protection (76.2%), and Food Preparation & Serving (51.5%), while the most female-oriented occupations are Healthcare Support (100.0%), Law Enforcement (100.0%), and Cleaning & Maintenance (100.0%).
| Occupation | Male | Female |
| Healthcare Support | 0 (0.0%) | 59 (100.0%) |
| Security & Protection | 16 (76.2%) | 5 (23.8%) |
| Firefighting & Prevention | 16 (100.0%) | 0 (0.0%) |
| Law Enforcement | 0 (0.0%) | 5 (100.0%) |
| Food Preparation & Serving | 50 (51.5%) | 47 (48.4%) |
| Cleaning & Maintenance | 0 (0.0%) | 26 (100.0%) |
| Personal Care & Service | 19 (23.2%) | 63 (76.8%) |
| Total (Category) | 85 (29.8%) | 200 (70.2%) |
| Total (Overall) | 1,676 (59.9%) | 1,123 (40.1%) |
Sales and Office Occupations
The most common Sales and Office occupations in Fruit Heights are Office & Administration (542 | 19.4%), and Sales & Related (227 | 8.1%).
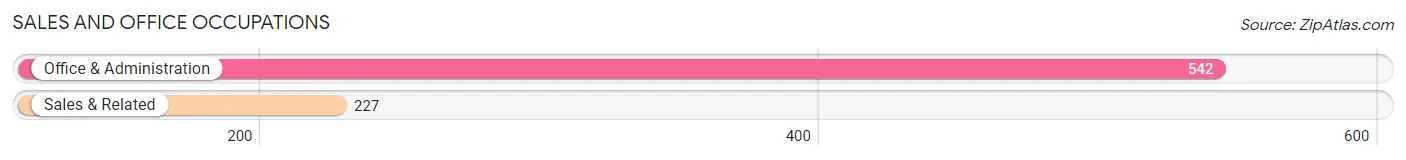
Sales and Office Occupations by Sex

| Occupation | Male | Female |
| Sales & Related | 122 (53.7%) | 105 (46.3%) |
| Office & Administration | 39 (7.2%) | 503 (92.8%) |
| Total (Category) | 161 (20.9%) | 608 (79.1%) |
| Total (Overall) | 1,676 (59.9%) | 1,123 (40.1%) |
Natural Resources, Construction and Maintenance Occupations
The most common Natural Resources, Construction and Maintenance occupations in Fruit Heights are Construction & Extraction (22 | 0.8%), and Installation, Maintenance & Repair (22 | 0.8%).
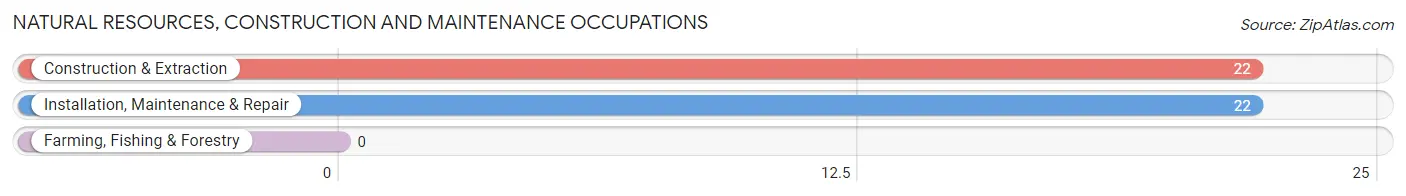
Natural Resources, Construction and Maintenance Occupations by Sex
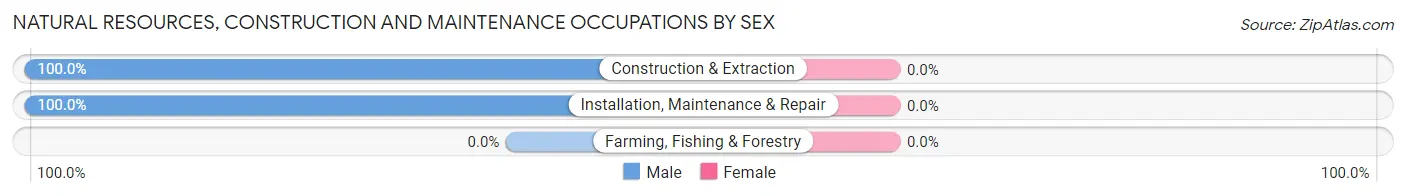
| Occupation | Male | Female |
| Farming, Fishing & Forestry | 0 (0.0%) | 0 (0.0%) |
| Construction & Extraction | 22 (100.0%) | 0 (0.0%) |
| Installation, Maintenance & Repair | 22 (100.0%) | 0 (0.0%) |
| Total (Category) | 44 (100.0%) | 0 (0.0%) |
| Total (Overall) | 1,676 (59.9%) | 1,123 (40.1%) |
Production, Transportation and Moving Occupations
The most common Production, Transportation and Moving occupations in Fruit Heights are Production (203 | 7.2%), Transportation (69 | 2.5%), and Material Moving (48 | 1.7%).
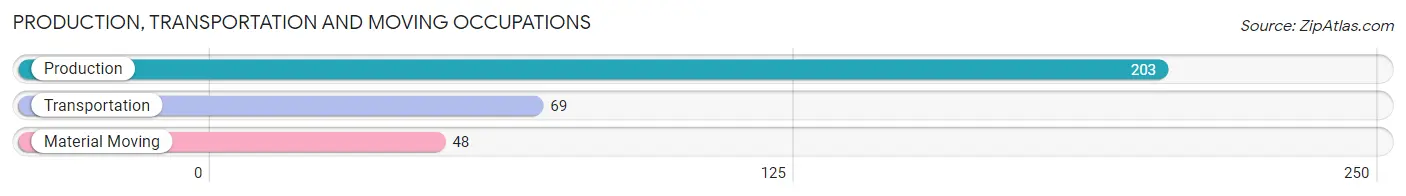
Production, Transportation and Moving Occupations by Sex
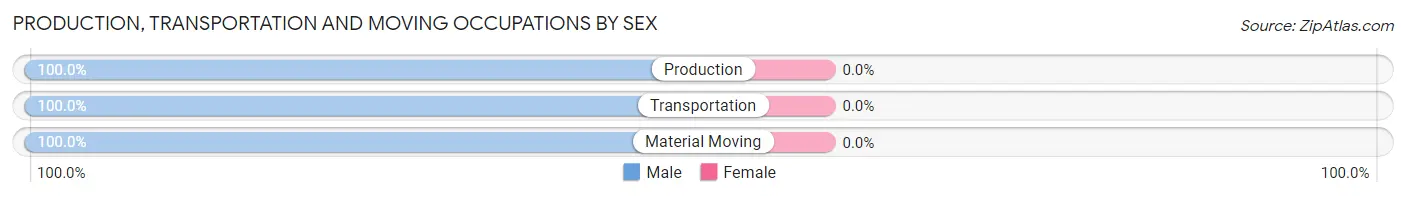
| Occupation | Male | Female |
| Production | 203 (100.0%) | 0 (0.0%) |
| Transportation | 69 (100.0%) | 0 (0.0%) |
| Material Moving | 48 (100.0%) | 0 (0.0%) |
| Total (Category) | 320 (100.0%) | 0 (0.0%) |
| Total (Overall) | 1,676 (59.9%) | 1,123 (40.1%) |
Employment Industries by Sex in Fruit Heights
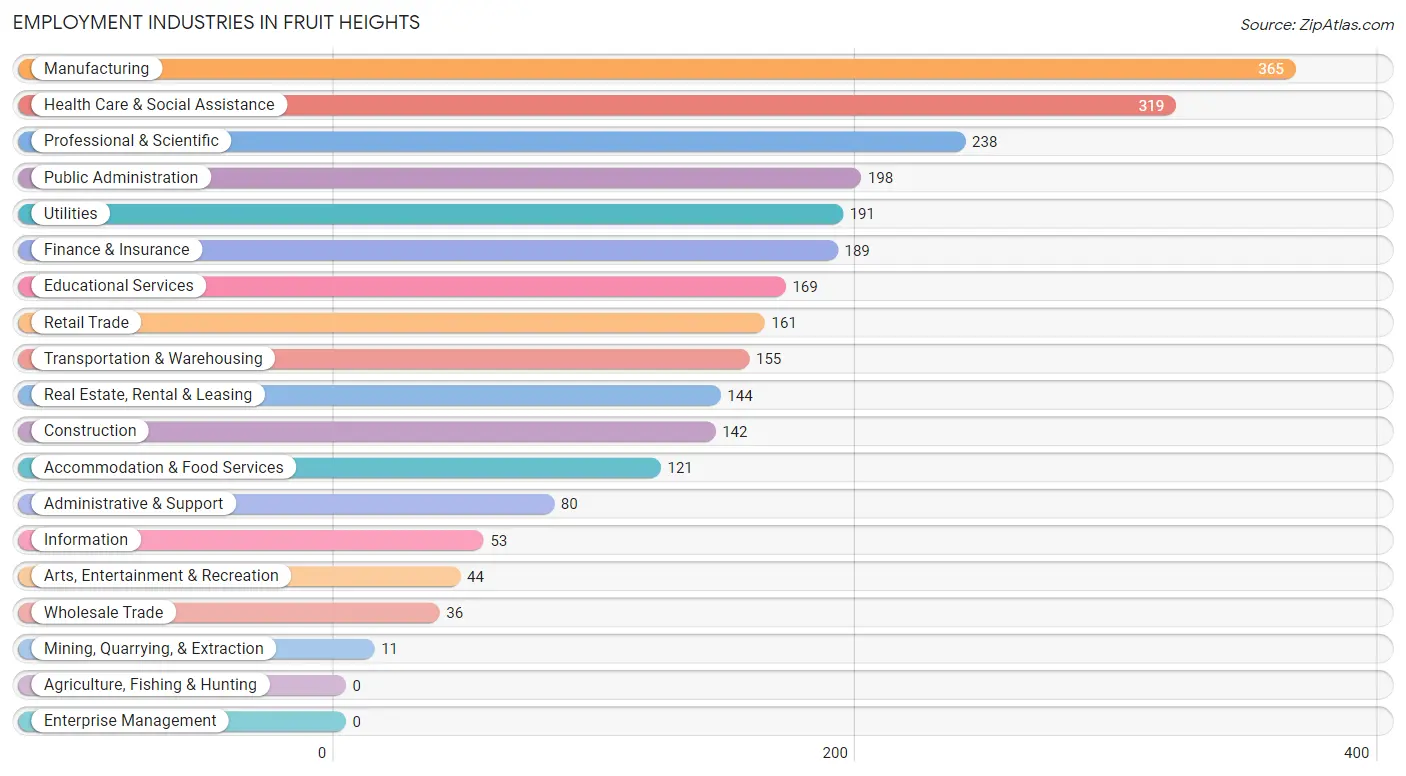
Employment Industries in Fruit Heights
The major employment industries in Fruit Heights include Manufacturing (365 | 13.0%), Health Care & Social Assistance (319 | 11.4%), Professional & Scientific (238 | 8.5%), Public Administration (198 | 7.1%), and Utilities (191 | 6.8%).
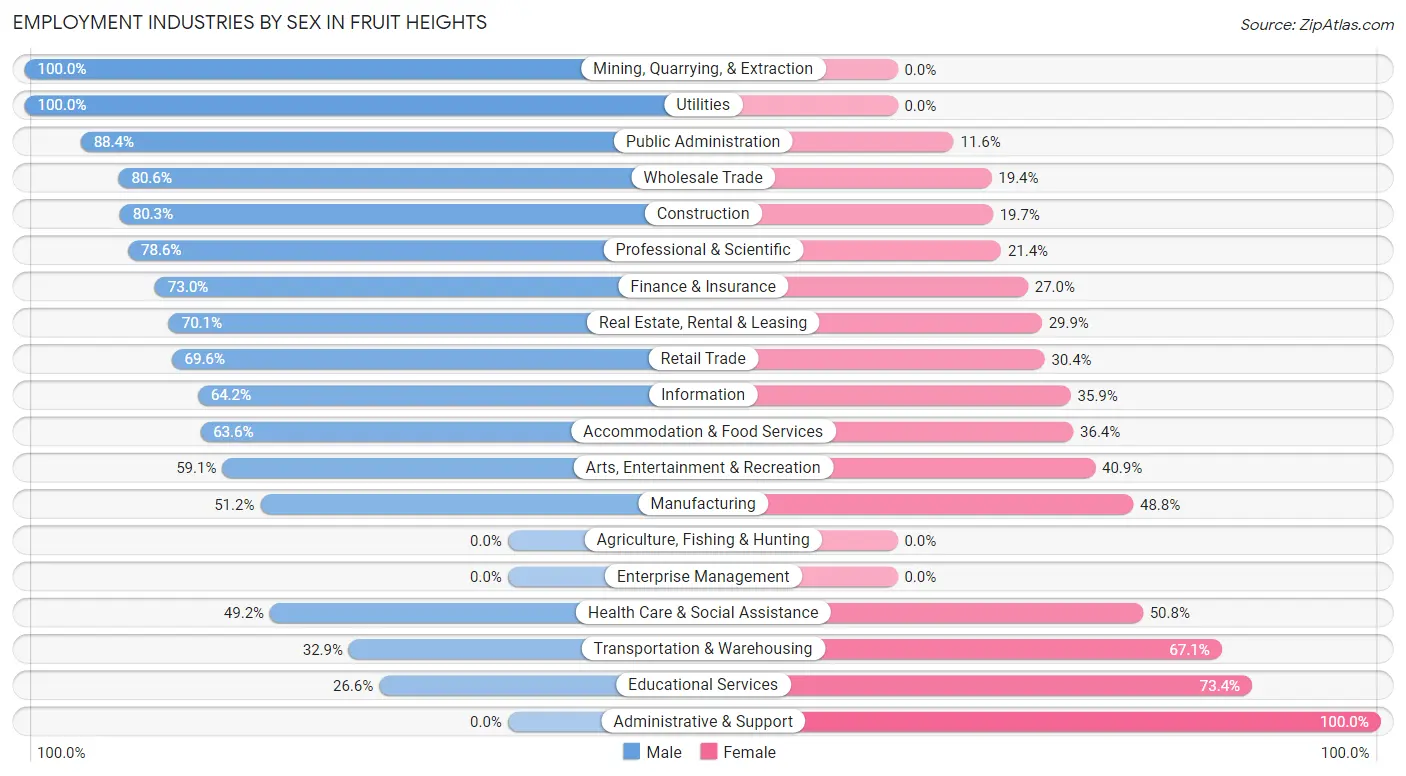
Employment Industries by Sex in Fruit Heights
The Fruit Heights industries that see more men than women are Mining, Quarrying, & Extraction (100.0%), Utilities (100.0%), and Public Administration (88.4%), whereas the industries that tend to have a higher number of women are Administrative & Support (100.0%), Educational Services (73.4%), and Transportation & Warehousing (67.1%).
| Industry | Male | Female |
| Agriculture, Fishing & Hunting | 0 (0.0%) | 0 (0.0%) |
| Mining, Quarrying, & Extraction | 11 (100.0%) | 0 (0.0%) |
| Construction | 114 (80.3%) | 28 (19.7%) |
| Manufacturing | 187 (51.2%) | 178 (48.8%) |
| Wholesale Trade | 29 (80.6%) | 7 (19.4%) |
| Retail Trade | 112 (69.6%) | 49 (30.4%) |
| Transportation & Warehousing | 51 (32.9%) | 104 (67.1%) |
| Utilities | 191 (100.0%) | 0 (0.0%) |
| Information | 34 (64.1%) | 19 (35.8%) |
| Finance & Insurance | 138 (73.0%) | 51 (27.0%) |
| Real Estate, Rental & Leasing | 101 (70.1%) | 43 (29.9%) |
| Professional & Scientific | 187 (78.6%) | 51 (21.4%) |
| Enterprise Management | 0 (0.0%) | 0 (0.0%) |
| Administrative & Support | 0 (0.0%) | 80 (100.0%) |
| Educational Services | 45 (26.6%) | 124 (73.4%) |
| Health Care & Social Assistance | 157 (49.2%) | 162 (50.8%) |
| Arts, Entertainment & Recreation | 26 (59.1%) | 18 (40.9%) |
| Accommodation & Food Services | 77 (63.6%) | 44 (36.4%) |
| Public Administration | 175 (88.4%) | 23 (11.6%) |
| Total | 1,676 (59.9%) | 1,123 (40.1%) |
Education in Fruit Heights
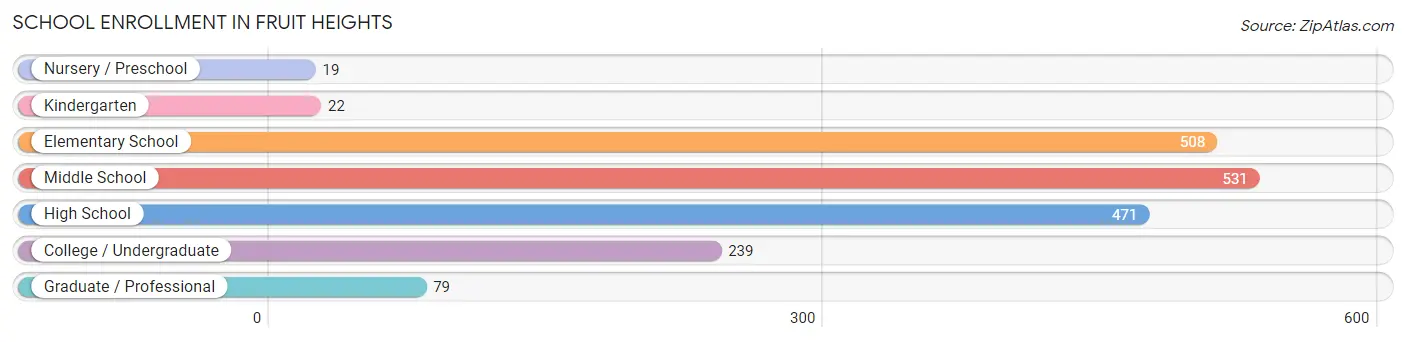
School Enrollment in Fruit Heights
The most common levels of schooling among the 1,869 students in Fruit Heights are middle school (531 | 28.4%), elementary school (508 | 27.2%), and high school (471 | 25.2%).
| School Level | # Students | % Students |
| Nursery / Preschool | 19 | 1.0% |
| Kindergarten | 22 | 1.2% |
| Elementary School | 508 | 27.2% |
| Middle School | 531 | 28.4% |
| High School | 471 | 25.2% |
| College / Undergraduate | 239 | 12.8% |
| Graduate / Professional | 79 | 4.2% |
| Total | 1,869 | 100.0% |
School Enrollment by Age by Funding Source in Fruit Heights
Out of a total of 1,869 students who are enrolled in schools in Fruit Heights, 153 (8.2%) attend a private institution, while the remaining 1,716 (91.8%) are enrolled in public schools. The age group of 35 years and over has the highest likelihood of being enrolled in private schools, with 62 (48.8% in the age bracket) enrolled. Conversely, the age group of 3 to 4 year olds has the lowest likelihood of being enrolled in a private school, with 19 (100.0% in the age bracket) attending a public institution.
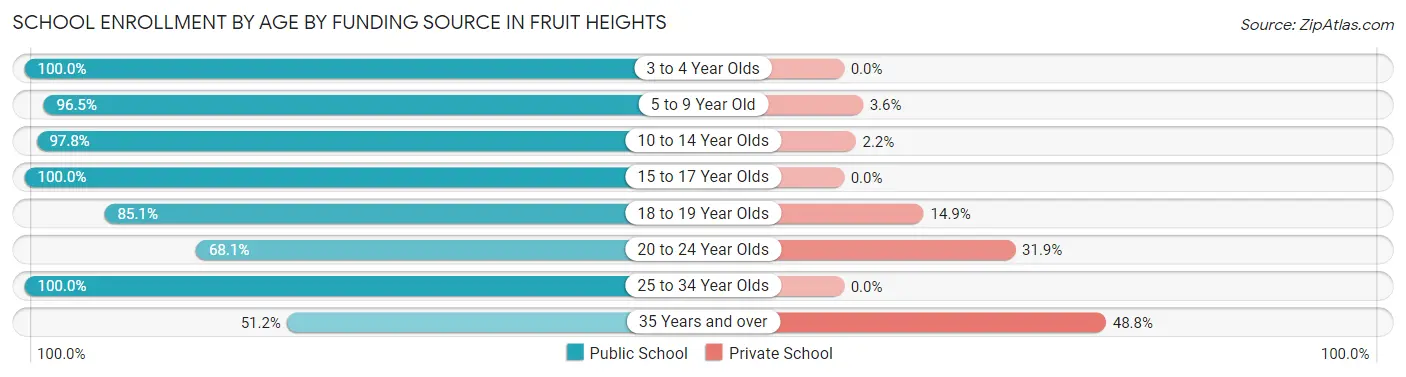
| Age Bracket | Public School | Private School |
| 3 to 4 Year Olds | 19 (100.0%) | 0 (0.0%) |
| 5 to 9 Year Old | 462 (96.5%) | 17 (3.5%) |
| 10 to 14 Year Olds | 619 (97.8%) | 14 (2.2%) |
| 15 to 17 Year Olds | 380 (100.0%) | 0 (0.0%) |
| 18 to 19 Year Olds | 40 (85.1%) | 7 (14.9%) |
| 20 to 24 Year Olds | 113 (68.1%) | 53 (31.9%) |
| 25 to 34 Year Olds | 18 (100.0%) | 0 (0.0%) |
| 35 Years and over | 65 (51.2%) | 62 (48.8%) |
| Total | 1,716 (91.8%) | 153 (8.2%) |
Educational Attainment by Field of Study in Fruit Heights
Business (663 | 26.5%), education (449 | 17.9%), bio, nature & agricultural (257 | 10.3%), science & technology (175 | 7.0%), and physical & health sciences (113 | 4.5%) are the most common fields of study among 2,506 individuals in Fruit Heights who have obtained a bachelor's degree or higher.
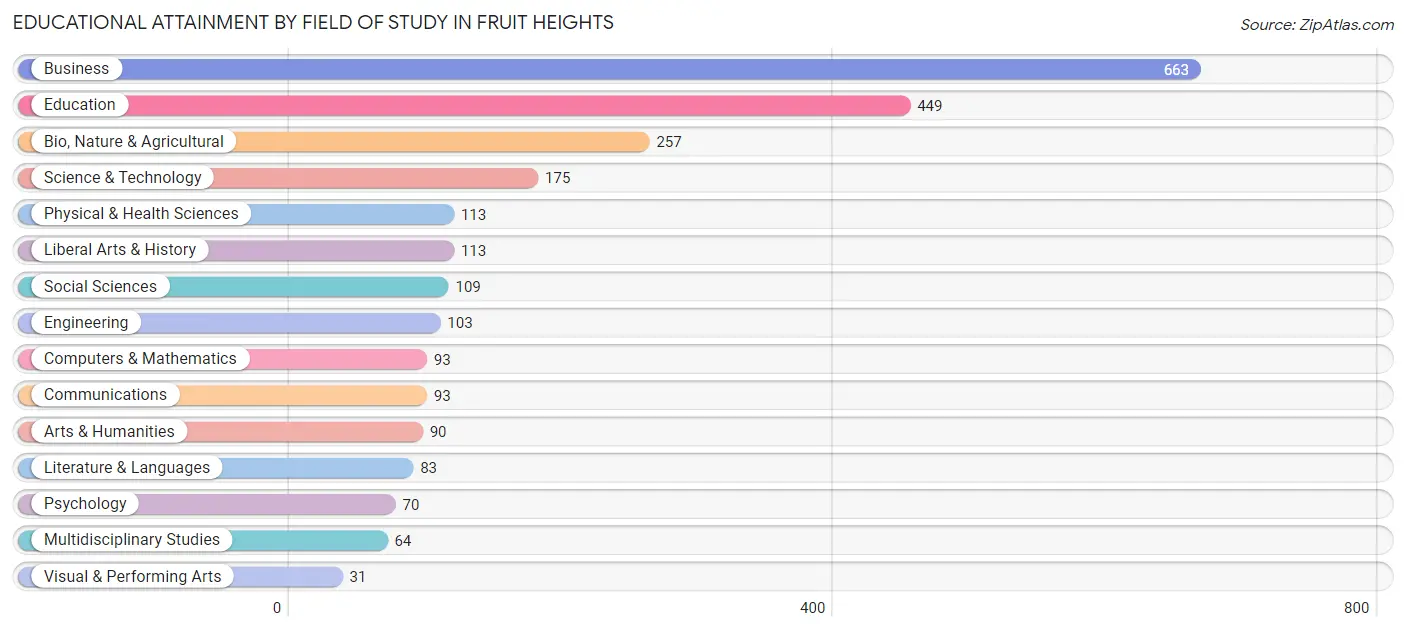
| Field of Study | # Graduates | % Graduates |
| Computers & Mathematics | 93 | 3.7% |
| Bio, Nature & Agricultural | 257 | 10.3% |
| Physical & Health Sciences | 113 | 4.5% |
| Psychology | 70 | 2.8% |
| Social Sciences | 109 | 4.3% |
| Engineering | 103 | 4.1% |
| Multidisciplinary Studies | 64 | 2.5% |
| Science & Technology | 175 | 7.0% |
| Business | 663 | 26.5% |
| Education | 449 | 17.9% |
| Literature & Languages | 83 | 3.3% |
| Liberal Arts & History | 113 | 4.5% |
| Visual & Performing Arts | 31 | 1.2% |
| Communications | 93 | 3.7% |
| Arts & Humanities | 90 | 3.6% |
| Total | 2,506 | 100.0% |
Transportation & Commute in Fruit Heights
Vehicle Availability by Sex in Fruit Heights
The most prevalent vehicle ownership categories in Fruit Heights are males with 2 vehicles (813, accounting for 48.5%) and females with 2 vehicles (584, making up 72.4%).
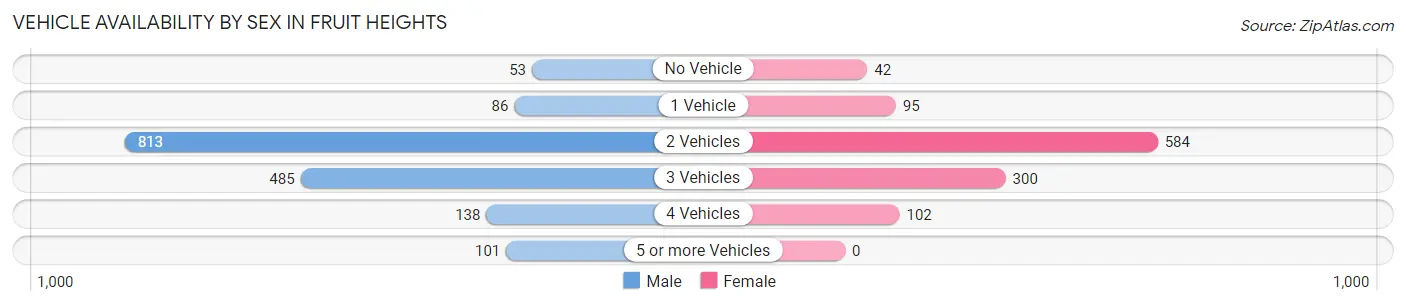
| Vehicles Available | Male | Female |
| No Vehicle | 53 (3.2%) | 42 (3.7%) |
| 1 Vehicle | 86 (5.1%) | 95 (8.5%) |
| 2 Vehicles | 813 (48.5%) | 584 (52.0%) |
| 3 Vehicles | 485 (28.9%) | 300 (26.7%) |
| 4 Vehicles | 138 (8.2%) | 102 (9.1%) |
| 5 or more Vehicles | 101 (6.0%) | 0 (0.0%) |
| Total | 1,676 (100.0%) | 1,123 (100.0%) |
Commute Time in Fruit Heights
The most frequently occuring commute durations in Fruit Heights are 15 to 19 minutes (484 commuters, 22.2%), 20 to 24 minutes (345 commuters, 15.9%), and 45 to 59 minutes (314 commuters, 14.4%).
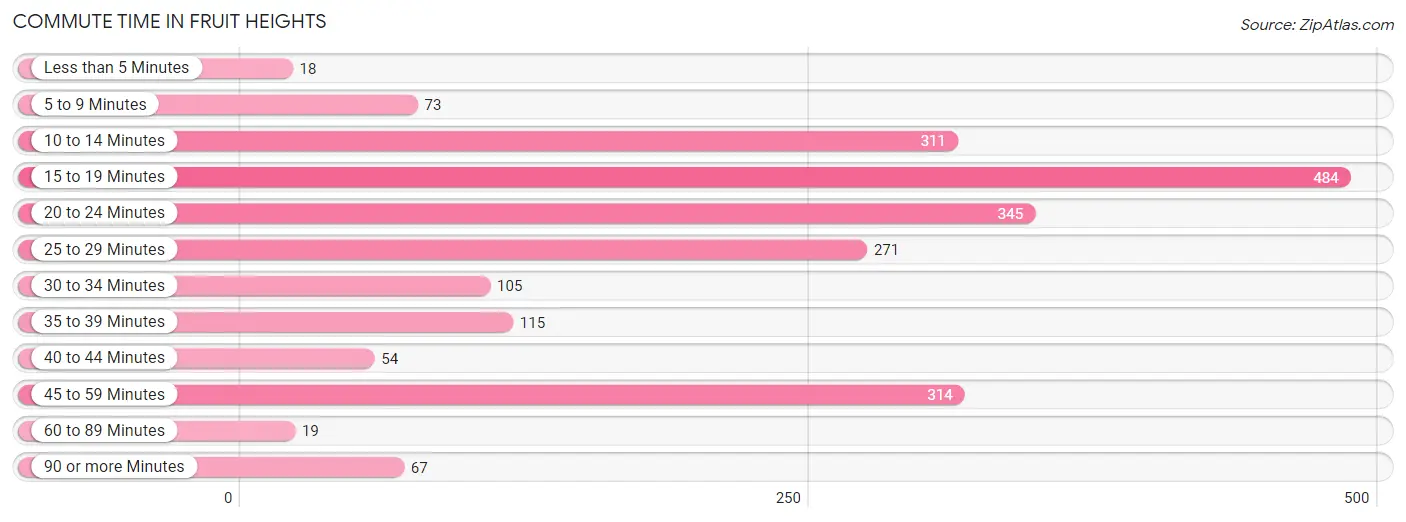
| Commute Time | # Commuters | % Commuters |
| Less than 5 Minutes | 18 | 0.8% |
| 5 to 9 Minutes | 73 | 3.4% |
| 10 to 14 Minutes | 311 | 14.3% |
| 15 to 19 Minutes | 484 | 22.2% |
| 20 to 24 Minutes | 345 | 15.9% |
| 25 to 29 Minutes | 271 | 12.4% |
| 30 to 34 Minutes | 105 | 4.8% |
| 35 to 39 Minutes | 115 | 5.3% |
| 40 to 44 Minutes | 54 | 2.5% |
| 45 to 59 Minutes | 314 | 14.4% |
| 60 to 89 Minutes | 19 | 0.9% |
| 90 or more Minutes | 67 | 3.1% |
Commute Time by Sex in Fruit Heights
The most common commute times in Fruit Heights are 45 to 59 minutes (264 commuters, 19.6%) for males and 15 to 19 minutes (235 commuters, 28.4%) for females.
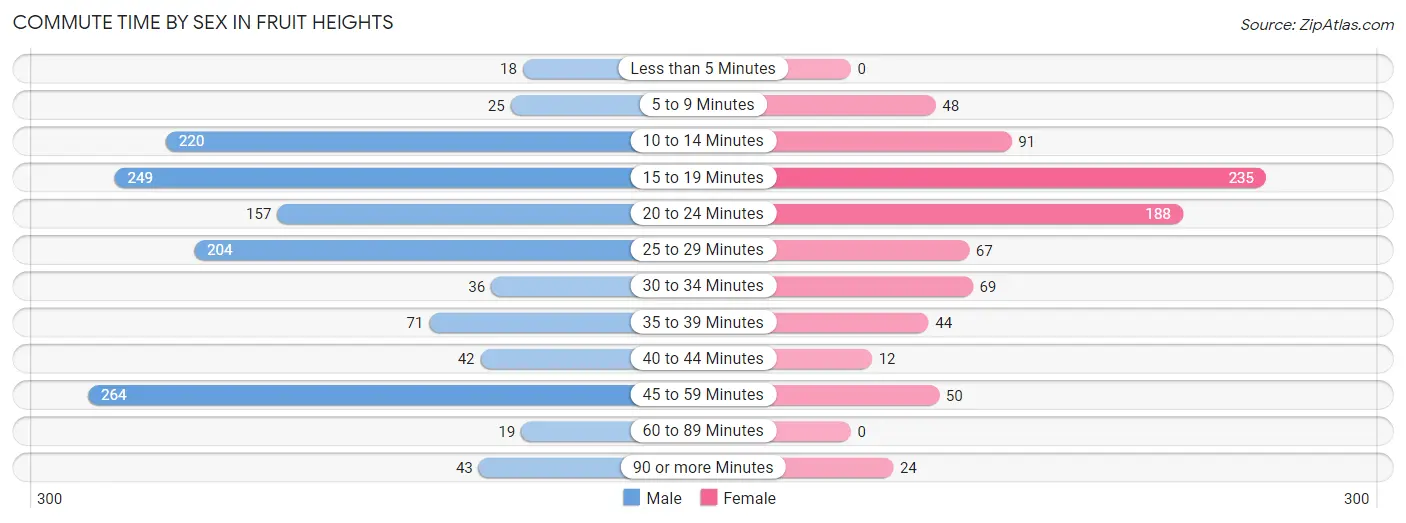
| Commute Time | Male | Female |
| Less than 5 Minutes | 18 (1.3%) | 0 (0.0%) |
| 5 to 9 Minutes | 25 (1.8%) | 48 (5.8%) |
| 10 to 14 Minutes | 220 (16.3%) | 91 (11.0%) |
| 15 to 19 Minutes | 249 (18.5%) | 235 (28.4%) |
| 20 to 24 Minutes | 157 (11.7%) | 188 (22.7%) |
| 25 to 29 Minutes | 204 (15.1%) | 67 (8.1%) |
| 30 to 34 Minutes | 36 (2.7%) | 69 (8.3%) |
| 35 to 39 Minutes | 71 (5.3%) | 44 (5.3%) |
| 40 to 44 Minutes | 42 (3.1%) | 12 (1.5%) |
| 45 to 59 Minutes | 264 (19.6%) | 50 (6.0%) |
| 60 to 89 Minutes | 19 (1.4%) | 0 (0.0%) |
| 90 or more Minutes | 43 (3.2%) | 24 (2.9%) |
Time of Departure to Work by Sex in Fruit Heights
The most frequent times of departure to work in Fruit Heights are 7:00 AM to 7:29 AM (192, 14.2%) for males and 8:30 AM to 8:59 AM (265, 32.0%) for females.
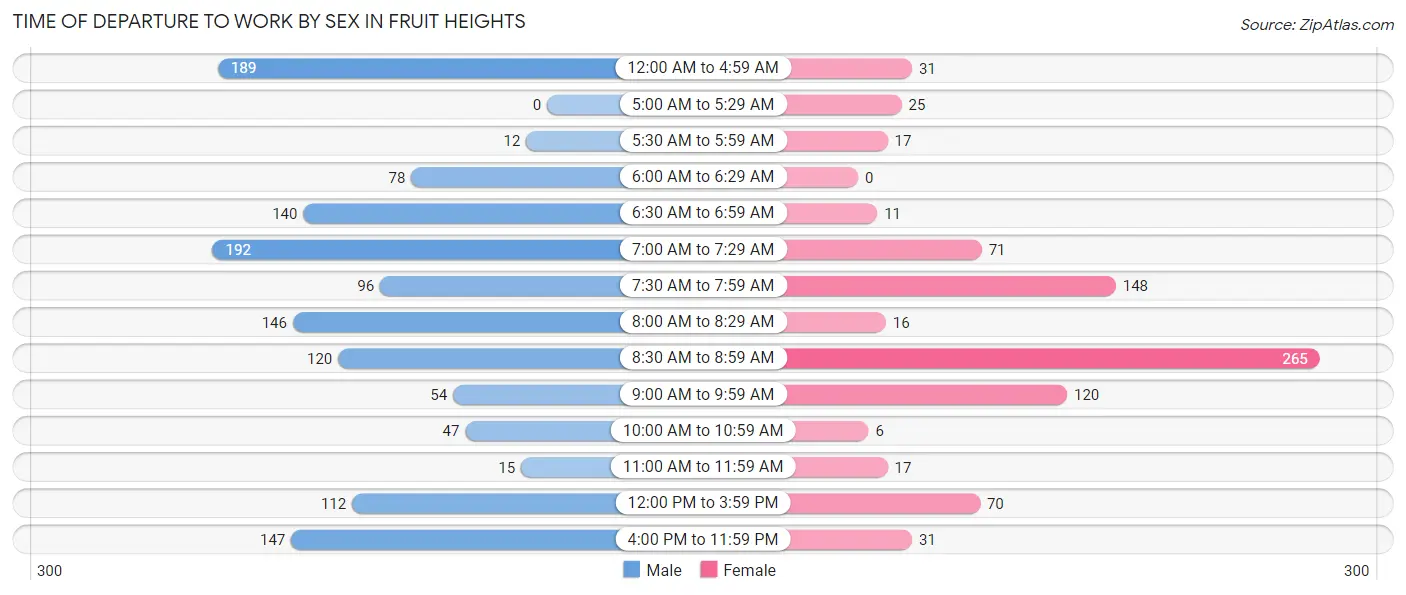
| Time of Departure | Male | Female |
| 12:00 AM to 4:59 AM | 189 (14.0%) | 31 (3.7%) |
| 5:00 AM to 5:29 AM | 0 (0.0%) | 25 (3.0%) |
| 5:30 AM to 5:59 AM | 12 (0.9%) | 17 (2.1%) |
| 6:00 AM to 6:29 AM | 78 (5.8%) | 0 (0.0%) |
| 6:30 AM to 6:59 AM | 140 (10.4%) | 11 (1.3%) |
| 7:00 AM to 7:29 AM | 192 (14.2%) | 71 (8.6%) |
| 7:30 AM to 7:59 AM | 96 (7.1%) | 148 (17.9%) |
| 8:00 AM to 8:29 AM | 146 (10.8%) | 16 (1.9%) |
| 8:30 AM to 8:59 AM | 120 (8.9%) | 265 (32.0%) |
| 9:00 AM to 9:59 AM | 54 (4.0%) | 120 (14.5%) |
| 10:00 AM to 10:59 AM | 47 (3.5%) | 6 (0.7%) |
| 11:00 AM to 11:59 AM | 15 (1.1%) | 17 (2.1%) |
| 12:00 PM to 3:59 PM | 112 (8.3%) | 70 (8.5%) |
| 4:00 PM to 11:59 PM | 147 (10.9%) | 31 (3.7%) |
| Total | 1,348 (100.0%) | 828 (100.0%) |
Housing Occupancy in Fruit Heights
Occupancy by Ownership in Fruit Heights
Of the total 2,046 dwellings in Fruit Heights, owner-occupied units account for 1,859 (90.9%), while renter-occupied units make up 187 (9.1%).
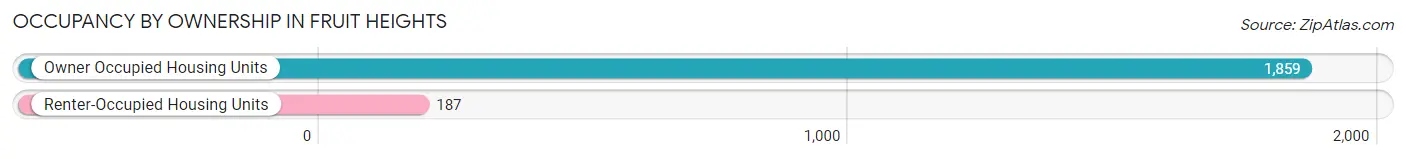
| Occupancy | # Housing Units | % Housing Units |
| Owner Occupied Housing Units | 1,859 | 90.9% |
| Renter-Occupied Housing Units | 187 | 9.1% |
| Total Occupied Housing Units | 2,046 | 100.0% |
Occupancy by Household Size in Fruit Heights
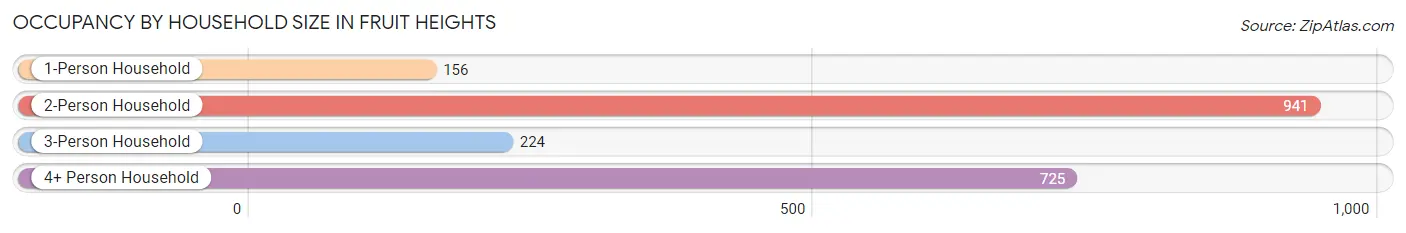
| Household Size | # Housing Units | % Housing Units |
| 1-Person Household | 156 | 7.6% |
| 2-Person Household | 941 | 46.0% |
| 3-Person Household | 224 | 11.0% |
| 4+ Person Household | 725 | 35.4% |
| Total Housing Units | 2,046 | 100.0% |
Occupancy by Ownership by Household Size in Fruit Heights
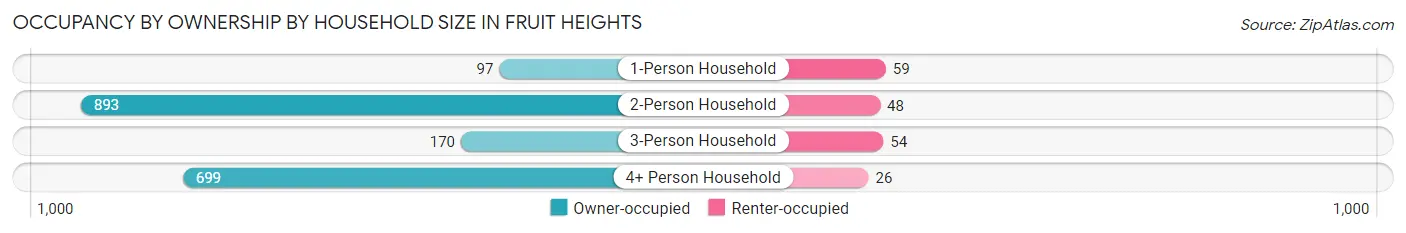
| Household Size | Owner-occupied | Renter-occupied |
| 1-Person Household | 97 (62.2%) | 59 (37.8%) |
| 2-Person Household | 893 (94.9%) | 48 (5.1%) |
| 3-Person Household | 170 (75.9%) | 54 (24.1%) |
| 4+ Person Household | 699 (96.4%) | 26 (3.6%) |
| Total Housing Units | 1,859 (90.9%) | 187 (9.1%) |
Occupancy by Educational Attainment in Fruit Heights
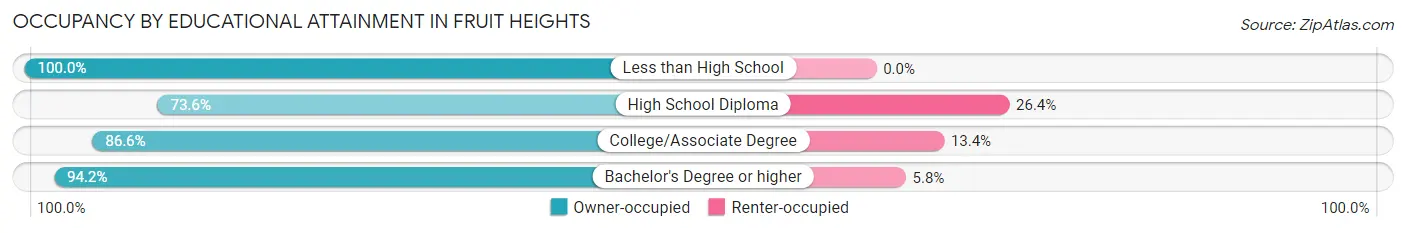
| Household Size | Owner-occupied | Renter-occupied |
| Less than High School | 23 (100.0%) | 0 (0.0%) |
| High School Diploma | 95 (73.6%) | 34 (26.4%) |
| College/Associate Degree | 483 (86.6%) | 75 (13.4%) |
| Bachelor's Degree or higher | 1,258 (94.2%) | 78 (5.8%) |
Occupancy by Age of Householder in Fruit Heights
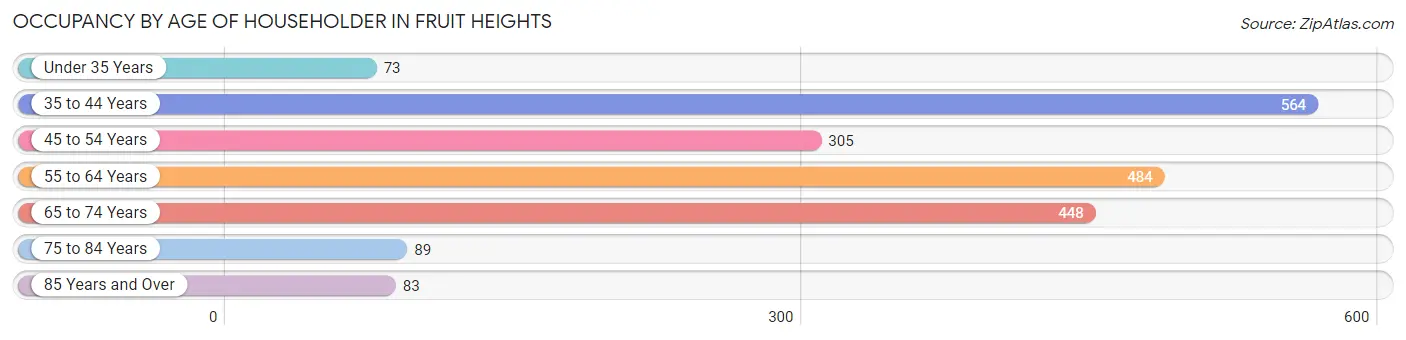
| Age Bracket | # Households | % Households |
| Under 35 Years | 73 | 3.6% |
| 35 to 44 Years | 564 | 27.6% |
| 45 to 54 Years | 305 | 14.9% |
| 55 to 64 Years | 484 | 23.7% |
| 65 to 74 Years | 448 | 21.9% |
| 75 to 84 Years | 89 | 4.3% |
| 85 Years and Over | 83 | 4.1% |
| Total | 2,046 | 100.0% |
Housing Finances in Fruit Heights
Median Income by Occupancy in Fruit Heights
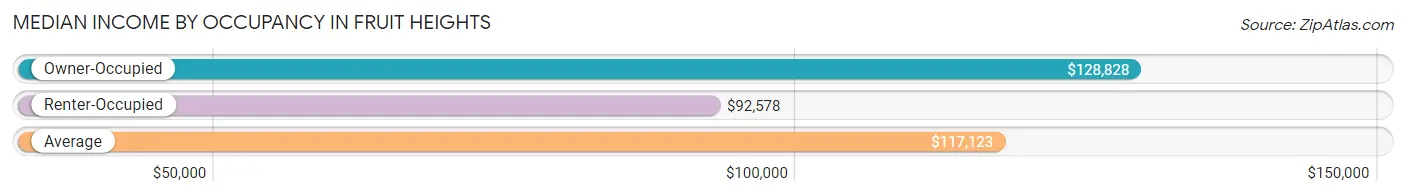
| Occupancy Type | # Households | Median Income |
| Owner-Occupied | 1,859 (90.9%) | $128,828 |
| Renter-Occupied | 187 (9.1%) | $92,578 |
| Average | 2,046 (100.0%) | $117,123 |
Occupancy by Householder Income Bracket in Fruit Heights
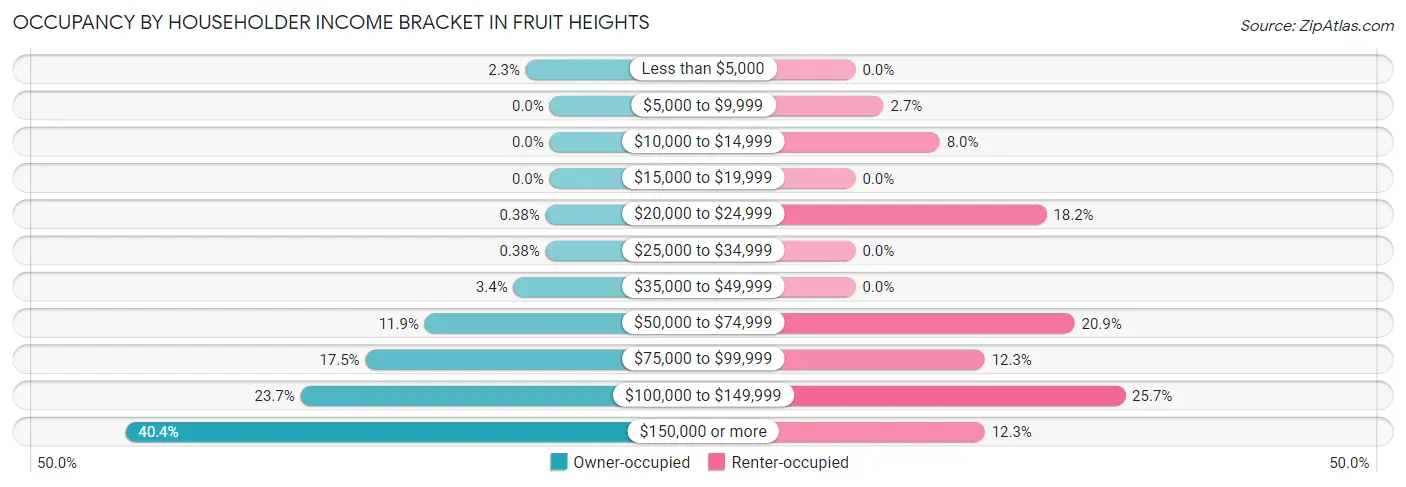
| Income Bracket | Owner-occupied | Renter-occupied |
| Less than $5,000 | 42 (2.3%) | 0 (0.0%) |
| $5,000 to $9,999 | 0 (0.0%) | 5 (2.7%) |
| $10,000 to $14,999 | 0 (0.0%) | 15 (8.0%) |
| $15,000 to $19,999 | 0 (0.0%) | 0 (0.0%) |
| $20,000 to $24,999 | 7 (0.4%) | 34 (18.2%) |
| $25,000 to $34,999 | 7 (0.4%) | 0 (0.0%) |
| $35,000 to $49,999 | 64 (3.4%) | 0 (0.0%) |
| $50,000 to $74,999 | 221 (11.9%) | 39 (20.9%) |
| $75,000 to $99,999 | 326 (17.5%) | 23 (12.3%) |
| $100,000 to $149,999 | 441 (23.7%) | 48 (25.7%) |
| $150,000 or more | 751 (40.4%) | 23 (12.3%) |
| Total | 1,859 (100.0%) | 187 (100.0%) |
Monthly Housing Cost Tiers in Fruit Heights
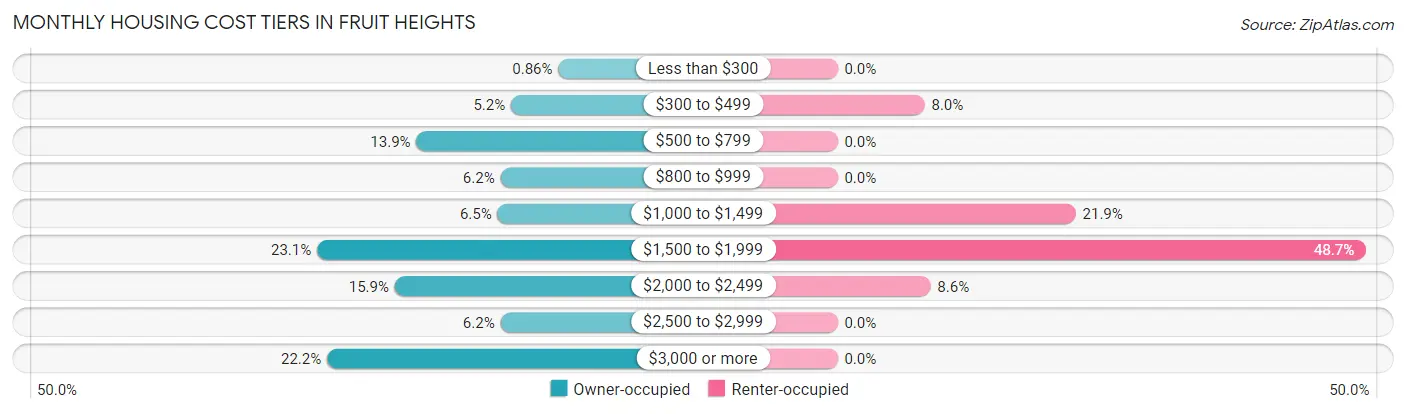
| Monthly Cost | Owner-occupied | Renter-occupied |
| Less than $300 | 16 (0.9%) | 0 (0.0%) |
| $300 to $499 | 97 (5.2%) | 15 (8.0%) |
| $500 to $799 | 259 (13.9%) | 0 (0.0%) |
| $800 to $999 | 115 (6.2%) | 0 (0.0%) |
| $1,000 to $1,499 | 120 (6.5%) | 41 (21.9%) |
| $1,500 to $1,999 | 429 (23.1%) | 91 (48.7%) |
| $2,000 to $2,499 | 296 (15.9%) | 16 (8.6%) |
| $2,500 to $2,999 | 115 (6.2%) | 0 (0.0%) |
| $3,000 or more | 412 (22.2%) | 0 (0.0%) |
| Total | 1,859 (100.0%) | 187 (100.0%) |
Physical Housing Characteristics in Fruit Heights
Housing Structures in Fruit Heights
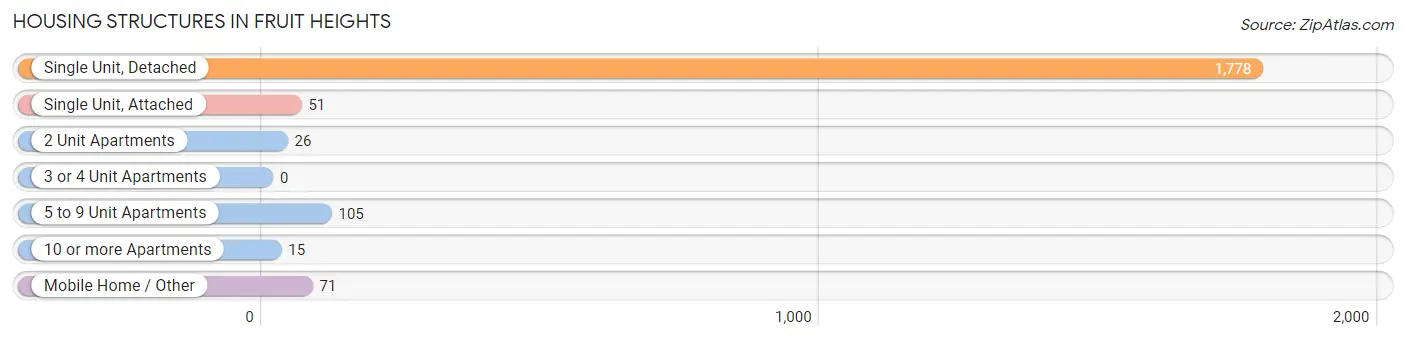
| Structure Type | # Housing Units | % Housing Units |
| Single Unit, Detached | 1,778 | 86.9% |
| Single Unit, Attached | 51 | 2.5% |
| 2 Unit Apartments | 26 | 1.3% |
| 3 or 4 Unit Apartments | 0 | 0.0% |
| 5 to 9 Unit Apartments | 105 | 5.1% |
| 10 or more Apartments | 15 | 0.7% |
| Mobile Home / Other | 71 | 3.5% |
| Total | 2,046 | 100.0% |
Housing Structures by Occupancy in Fruit Heights
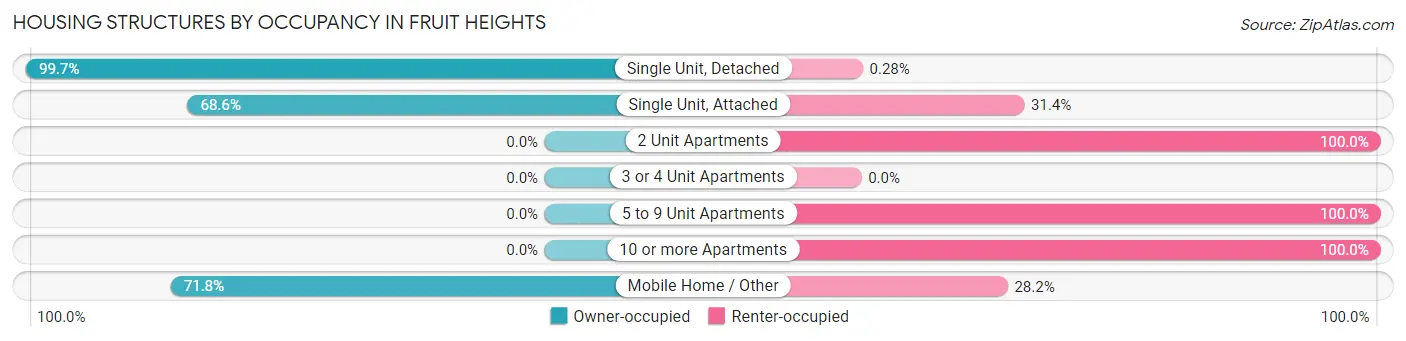
| Structure Type | Owner-occupied | Renter-occupied |
| Single Unit, Detached | 1,773 (99.7%) | 5 (0.3%) |
| Single Unit, Attached | 35 (68.6%) | 16 (31.4%) |
| 2 Unit Apartments | 0 (0.0%) | 26 (100.0%) |
| 3 or 4 Unit Apartments | 0 (0.0%) | 0 (0.0%) |
| 5 to 9 Unit Apartments | 0 (0.0%) | 105 (100.0%) |
| 10 or more Apartments | 0 (0.0%) | 15 (100.0%) |
| Mobile Home / Other | 51 (71.8%) | 20 (28.2%) |
| Total | 1,859 (90.9%) | 187 (9.1%) |
Housing Structures by Number of Rooms in Fruit Heights
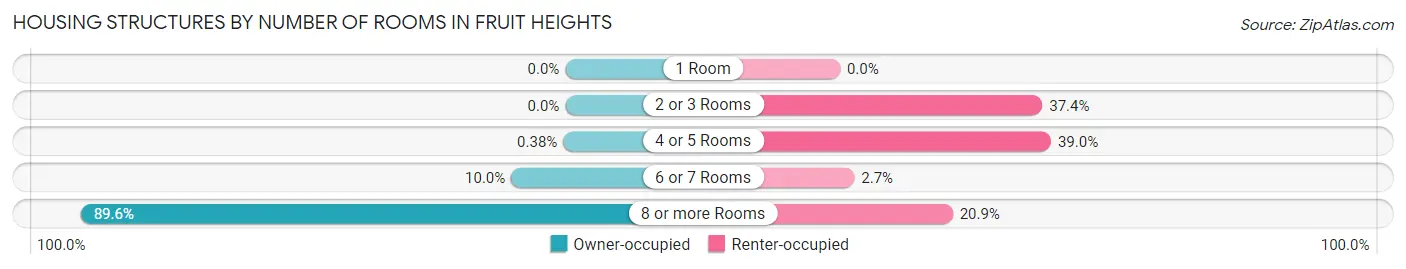
| Number of Rooms | Owner-occupied | Renter-occupied |
| 1 Room | 0 (0.0%) | 0 (0.0%) |
| 2 or 3 Rooms | 0 (0.0%) | 70 (37.4%) |
| 4 or 5 Rooms | 7 (0.4%) | 73 (39.0%) |
| 6 or 7 Rooms | 186 (10.0%) | 5 (2.7%) |
| 8 or more Rooms | 1,666 (89.6%) | 39 (20.9%) |
| Total | 1,859 (100.0%) | 187 (100.0%) |
Housing Structure by Heating Type in Fruit Heights
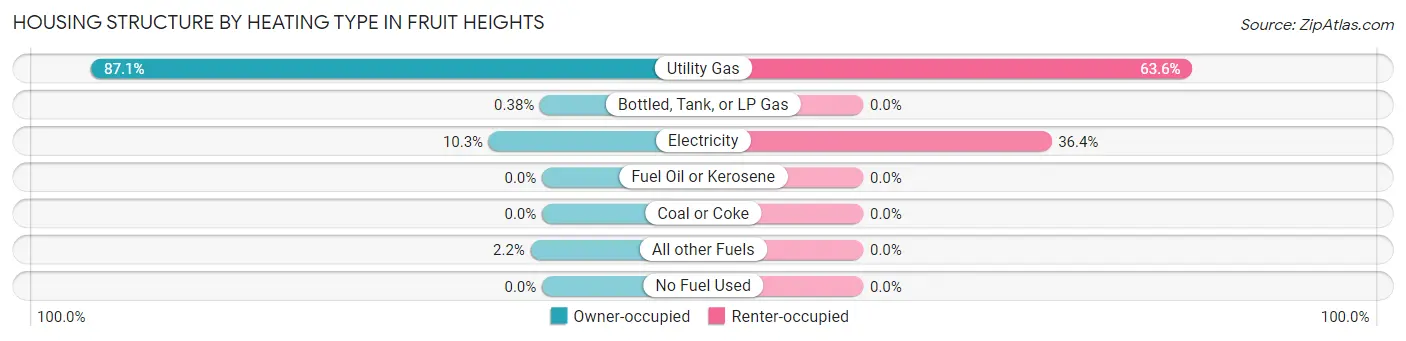
| Heating Type | Owner-occupied | Renter-occupied |
| Utility Gas | 1,620 (87.1%) | 119 (63.6%) |
| Bottled, Tank, or LP Gas | 7 (0.4%) | 0 (0.0%) |
| Electricity | 191 (10.3%) | 68 (36.4%) |
| Fuel Oil or Kerosene | 0 (0.0%) | 0 (0.0%) |
| Coal or Coke | 0 (0.0%) | 0 (0.0%) |
| All other Fuels | 41 (2.2%) | 0 (0.0%) |
| No Fuel Used | 0 (0.0%) | 0 (0.0%) |
| Total | 1,859 (100.0%) | 187 (100.0%) |
Household Vehicle Usage in Fruit Heights
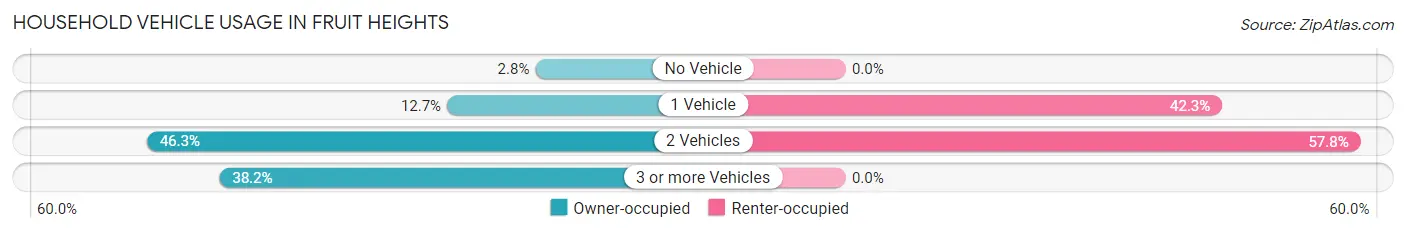
| Vehicles per Household | Owner-occupied | Renter-occupied |
| No Vehicle | 52 (2.8%) | 0 (0.0%) |
| 1 Vehicle | 236 (12.7%) | 79 (42.2%) |
| 2 Vehicles | 861 (46.3%) | 108 (57.8%) |
| 3 or more Vehicles | 710 (38.2%) | 0 (0.0%) |
| Total | 1,859 (100.0%) | 187 (100.0%) |
Real Estate & Mortgages in Fruit Heights
Real Estate and Mortgage Overview in Fruit Heights
| Characteristic | Without Mortgage | With Mortgage |
| Housing Units | 565 | 1,294 |
| Median Property Value | $576,300 | $648,400 |
| Median Household Income | $97,625 | $552 |
| Monthly Housing Costs | $622 | $412 |
| Real Estate Taxes | $3,437 | $27 |
Property Value by Mortgage Status in Fruit Heights
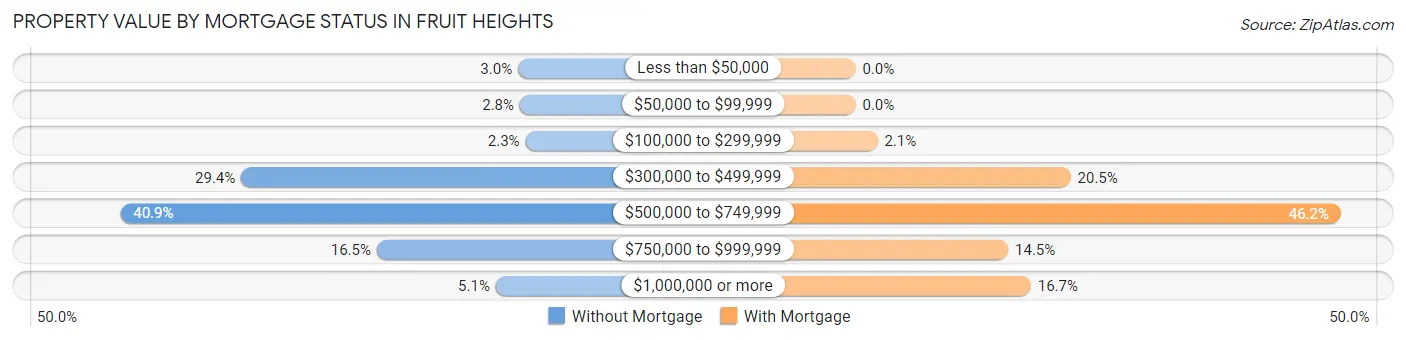
| Property Value | Without Mortgage | With Mortgage |
| Less than $50,000 | 17 (3.0%) | 0 (0.0%) |
| $50,000 to $99,999 | 16 (2.8%) | 0 (0.0%) |
| $100,000 to $299,999 | 13 (2.3%) | 27 (2.1%) |
| $300,000 to $499,999 | 166 (29.4%) | 265 (20.5%) |
| $500,000 to $749,999 | 231 (40.9%) | 598 (46.2%) |
| $750,000 to $999,999 | 93 (16.5%) | 188 (14.5%) |
| $1,000,000 or more | 29 (5.1%) | 216 (16.7%) |
| Total | 565 (100.0%) | 1,294 (100.0%) |
Household Income by Mortgage Status in Fruit Heights
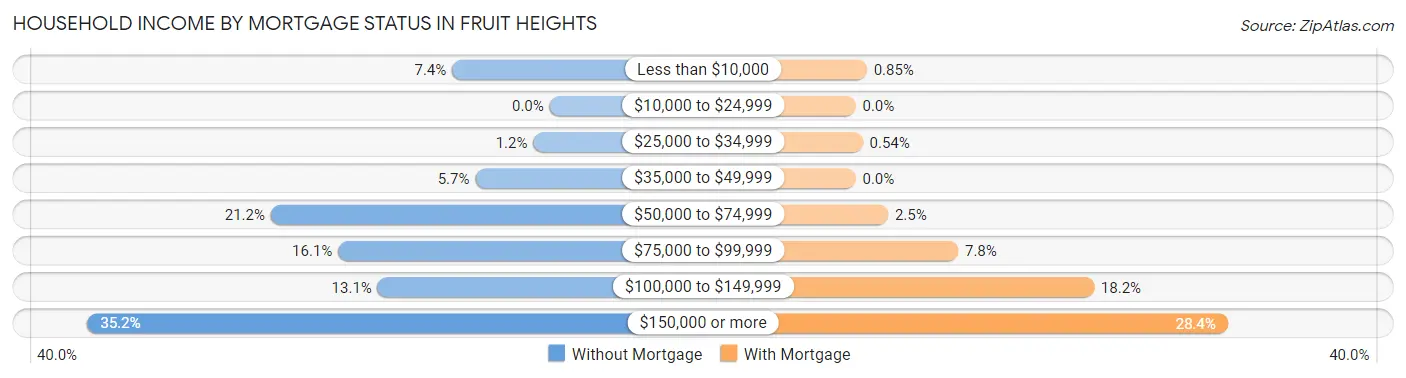
| Household Income | Without Mortgage | With Mortgage |
| Less than $10,000 | 42 (7.4%) | 11 (0.9%) |
| $10,000 to $24,999 | 0 (0.0%) | 0 (0.0%) |
| $25,000 to $34,999 | 7 (1.2%) | 7 (0.5%) |
| $35,000 to $49,999 | 32 (5.7%) | 0 (0.0%) |
| $50,000 to $74,999 | 120 (21.2%) | 32 (2.5%) |
| $75,000 to $99,999 | 91 (16.1%) | 101 (7.8%) |
| $100,000 to $149,999 | 74 (13.1%) | 235 (18.2%) |
| $150,000 or more | 199 (35.2%) | 367 (28.4%) |
| Total | 565 (100.0%) | 1,294 (100.0%) |
Property Value to Household Income Ratio in Fruit Heights
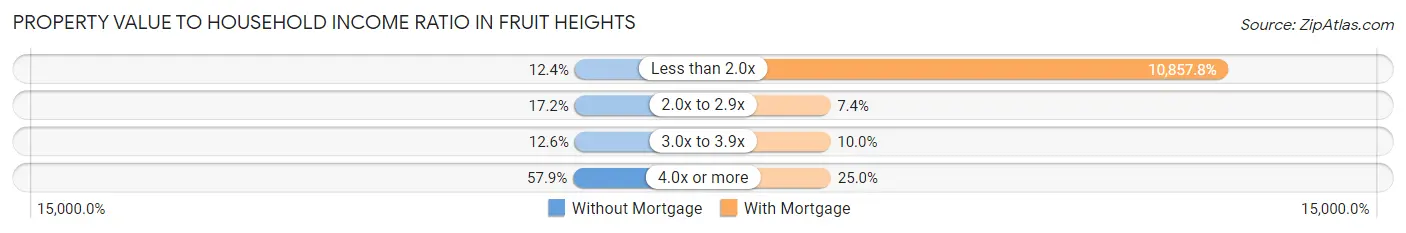
| Value-to-Income Ratio | Without Mortgage | With Mortgage |
| Less than 2.0x | 70 (12.4%) | 140,500 (10,857.8%) |
| 2.0x to 2.9x | 97 (17.2%) | 96 (7.4%) |
| 3.0x to 3.9x | 71 (12.6%) | 129 (10.0%) |
| 4.0x or more | 327 (57.9%) | 324 (25.0%) |
| Total | 565 (100.0%) | 1,294 (100.0%) |
Real Estate Taxes by Mortgage Status in Fruit Heights
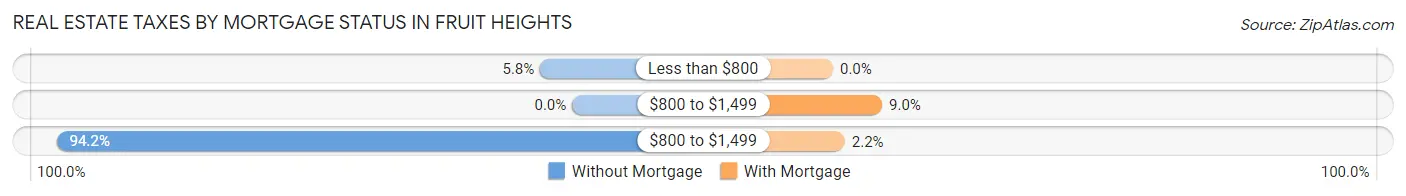
| Property Taxes | Without Mortgage | With Mortgage |
| Less than $800 | 33 (5.8%) | 0 (0.0%) |
| $800 to $1,499 | 0 (0.0%) | 116 (9.0%) |
| $800 to $1,499 | 532 (94.2%) | 28 (2.2%) |
| Total | 565 (100.0%) | 1,294 (100.0%) |
Health & Disability in Fruit Heights
Health Insurance Coverage by Age in Fruit Heights
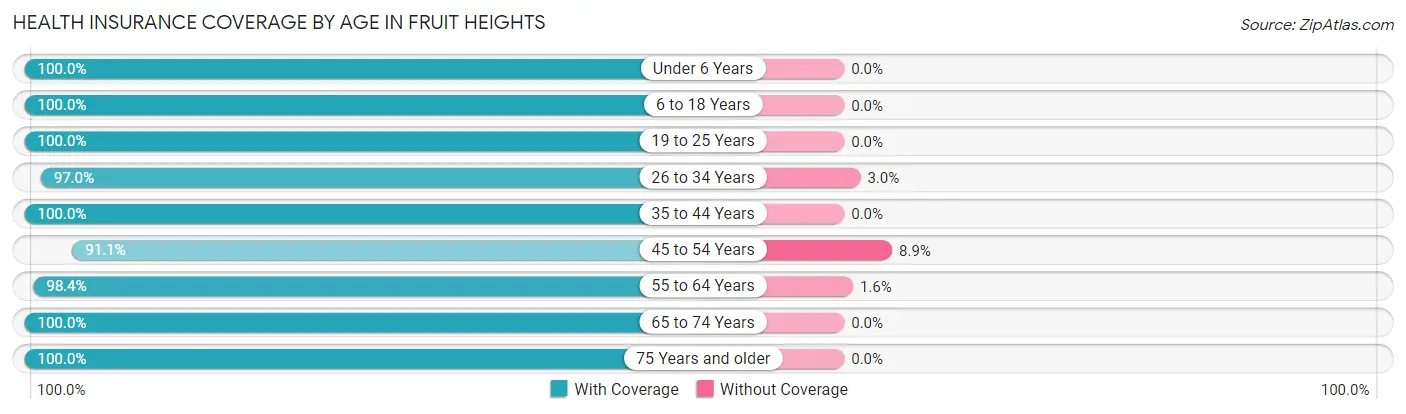
| Age Bracket | With Coverage | Without Coverage |
| Under 6 Years | 323 (100.0%) | 0 (0.0%) |
| 6 to 18 Years | 1,545 (100.0%) | 0 (0.0%) |
| 19 to 25 Years | 284 (100.0%) | 0 (0.0%) |
| 26 to 34 Years | 225 (97.0%) | 7 (3.0%) |
| 35 to 44 Years | 1,054 (100.0%) | 0 (0.0%) |
| 45 to 54 Years | 491 (91.1%) | 48 (8.9%) |
| 55 to 64 Years | 905 (98.4%) | 15 (1.6%) |
| 65 to 74 Years | 809 (100.0%) | 0 (0.0%) |
| 75 Years and older | 312 (100.0%) | 0 (0.0%) |
| Total | 5,948 (98.8%) | 70 (1.2%) |
Health Insurance Coverage by Citizenship Status in Fruit Heights
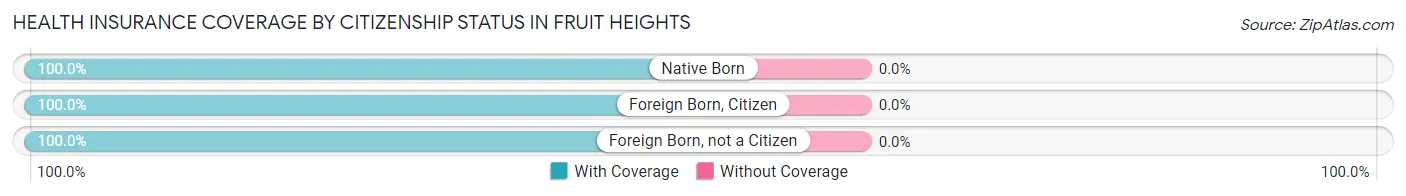
| Citizenship Status | With Coverage | Without Coverage |
| Native Born | 323 (100.0%) | 0 (0.0%) |
| Foreign Born, Citizen | 1,545 (100.0%) | 0 (0.0%) |
| Foreign Born, not a Citizen | 284 (100.0%) | 0 (0.0%) |
Health Insurance Coverage by Household Income in Fruit Heights
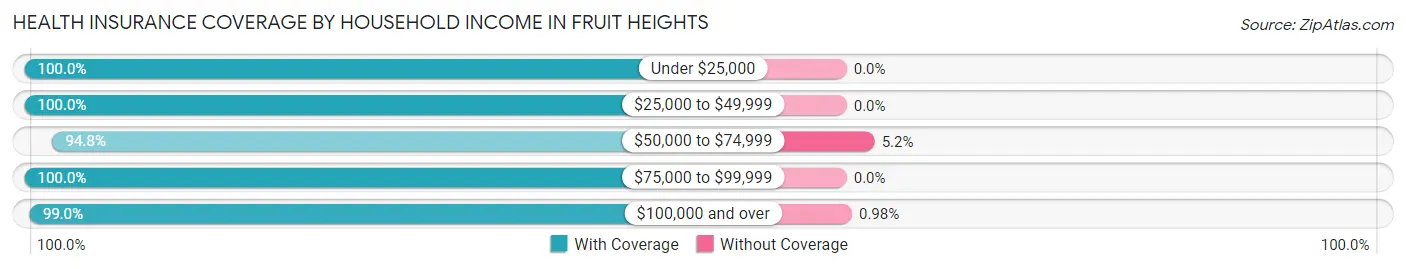
| Household Income | With Coverage | Without Coverage |
| Under $25,000 | 194 (100.0%) | 0 (0.0%) |
| $25,000 to $49,999 | 233 (100.0%) | 0 (0.0%) |
| $50,000 to $74,999 | 579 (94.8%) | 32 (5.2%) |
| $75,000 to $99,999 | 1,098 (100.0%) | 0 (0.0%) |
| $100,000 and over | 3,844 (99.0%) | 38 (1.0%) |
Public vs Private Health Insurance Coverage by Age in Fruit Heights
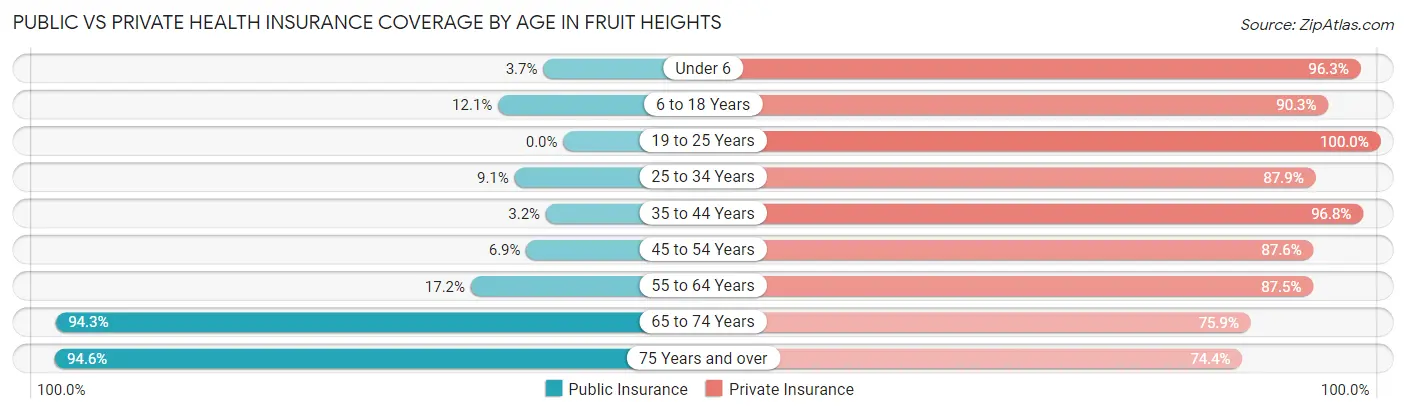
| Age Bracket | Public Insurance | Private Insurance |
| Under 6 | 12 (3.7%) | 311 (96.3%) |
| 6 to 18 Years | 187 (12.1%) | 1,395 (90.3%) |
| 19 to 25 Years | 0 (0.0%) | 284 (100.0%) |
| 25 to 34 Years | 21 (9.0%) | 204 (87.9%) |
| 35 to 44 Years | 34 (3.2%) | 1,020 (96.8%) |
| 45 to 54 Years | 37 (6.9%) | 472 (87.6%) |
| 55 to 64 Years | 158 (17.2%) | 805 (87.5%) |
| 65 to 74 Years | 763 (94.3%) | 614 (75.9%) |
| 75 Years and over | 295 (94.6%) | 232 (74.4%) |
| Total | 1,507 (25.0%) | 5,337 (88.7%) |
Disability Status by Sex by Age in Fruit Heights
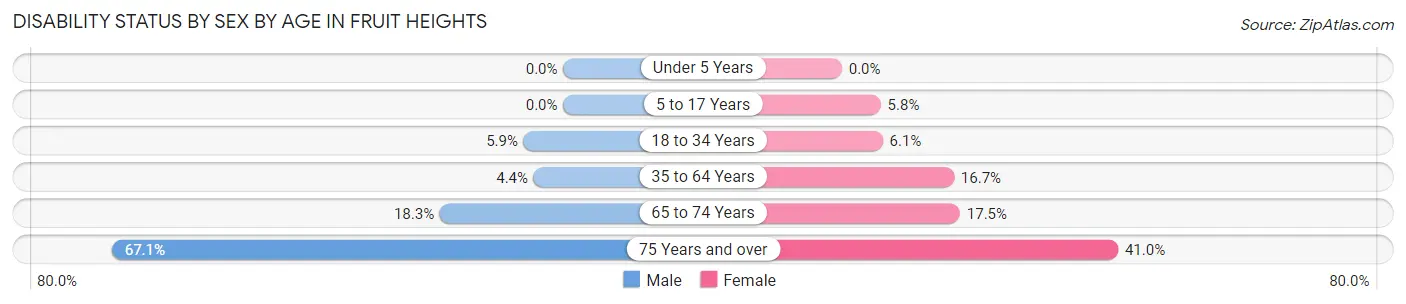
| Age Bracket | Male | Female |
| Under 5 Years | 0 (0.0%) | 0 (0.0%) |
| 5 to 17 Years | 0 (0.0%) | 37 (5.8%) |
| 18 to 34 Years | 21 (5.9%) | 12 (6.1%) |
| 35 to 64 Years | 52 (4.4%) | 221 (16.7%) |
| 65 to 74 Years | 74 (18.3%) | 71 (17.5%) |
| 75 Years and over | 116 (67.0%) | 57 (41.0%) |
Disability Class by Sex by Age in Fruit Heights
Disability Class: Hearing Difficulty
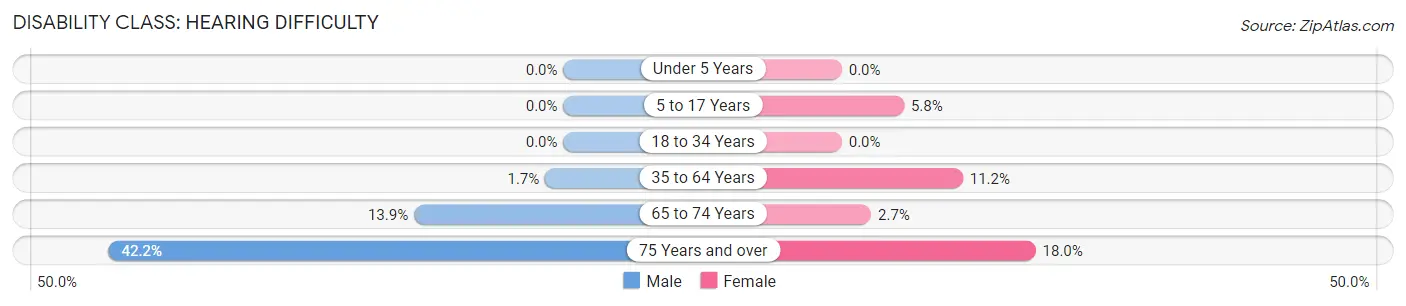
| Age Bracket | Male | Female |
| Under 5 Years | 0 (0.0%) | 0 (0.0%) |
| 5 to 17 Years | 0 (0.0%) | 37 (5.8%) |
| 18 to 34 Years | 0 (0.0%) | 0 (0.0%) |
| 35 to 64 Years | 20 (1.7%) | 149 (11.2%) |
| 65 to 74 Years | 56 (13.9%) | 11 (2.7%) |
| 75 Years and over | 73 (42.2%) | 25 (18.0%) |
Disability Class: Vision Difficulty
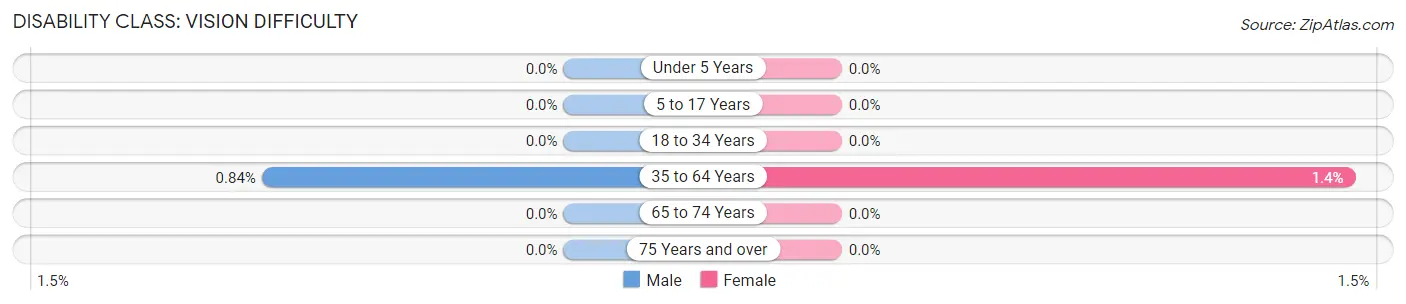
| Age Bracket | Male | Female |
| Under 5 Years | 0 (0.0%) | 0 (0.0%) |
| 5 to 17 Years | 0 (0.0%) | 0 (0.0%) |
| 18 to 34 Years | 0 (0.0%) | 0 (0.0%) |
| 35 to 64 Years | 10 (0.8%) | 19 (1.4%) |
| 65 to 74 Years | 0 (0.0%) | 0 (0.0%) |
| 75 Years and over | 0 (0.0%) | 0 (0.0%) |
Disability Class: Cognitive Difficulty
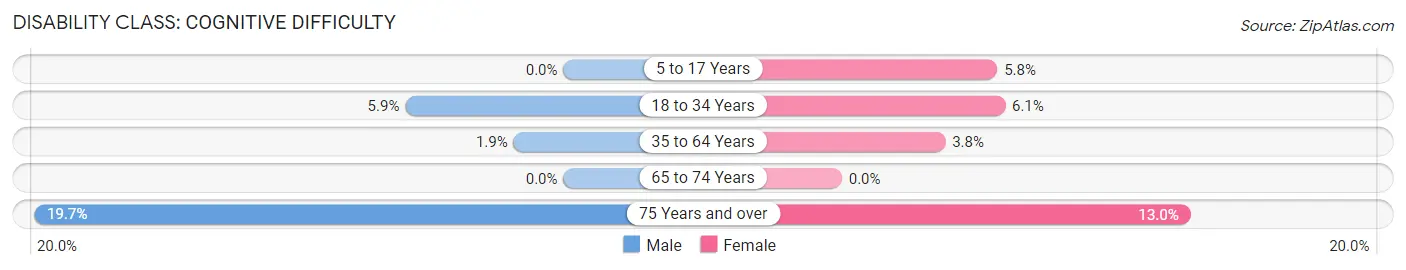
| Age Bracket | Male | Female |
| 5 to 17 Years | 0 (0.0%) | 37 (5.8%) |
| 18 to 34 Years | 21 (5.9%) | 12 (6.1%) |
| 35 to 64 Years | 22 (1.8%) | 51 (3.8%) |
| 65 to 74 Years | 0 (0.0%) | 0 (0.0%) |
| 75 Years and over | 34 (19.7%) | 18 (13.0%) |
Disability Class: Ambulatory Difficulty
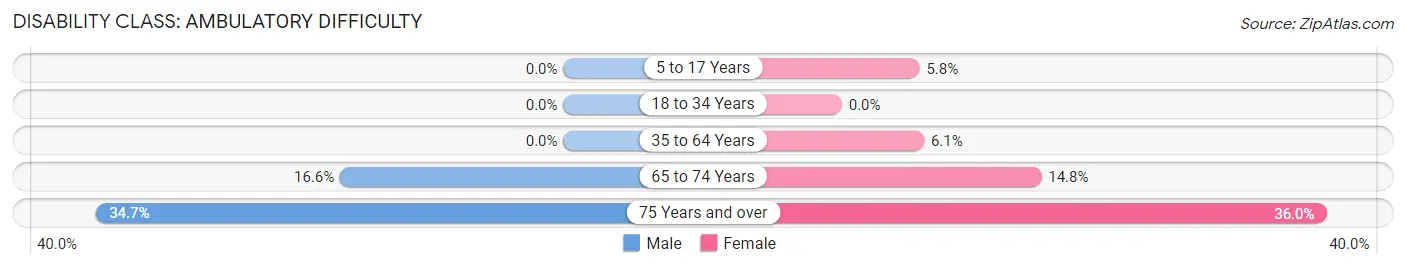
| Age Bracket | Male | Female |
| 5 to 17 Years | 0 (0.0%) | 37 (5.8%) |
| 18 to 34 Years | 0 (0.0%) | 0 (0.0%) |
| 35 to 64 Years | 0 (0.0%) | 81 (6.1%) |
| 65 to 74 Years | 67 (16.6%) | 60 (14.8%) |
| 75 Years and over | 60 (34.7%) | 50 (36.0%) |
Disability Class: Self-Care Difficulty
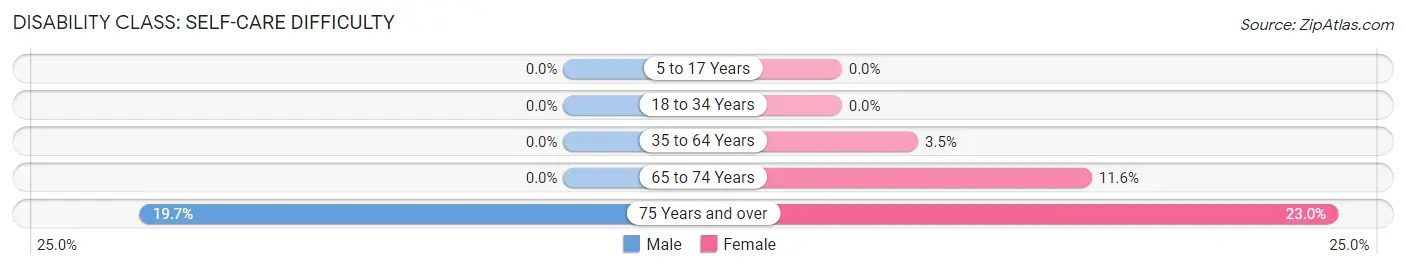
| Age Bracket | Male | Female |
| 5 to 17 Years | 0 (0.0%) | 0 (0.0%) |
| 18 to 34 Years | 0 (0.0%) | 0 (0.0%) |
| 35 to 64 Years | 0 (0.0%) | 47 (3.5%) |
| 65 to 74 Years | 0 (0.0%) | 47 (11.6%) |
| 75 Years and over | 34 (19.7%) | 32 (23.0%) |
Technology Access in Fruit Heights
Computing Device Access in Fruit Heights
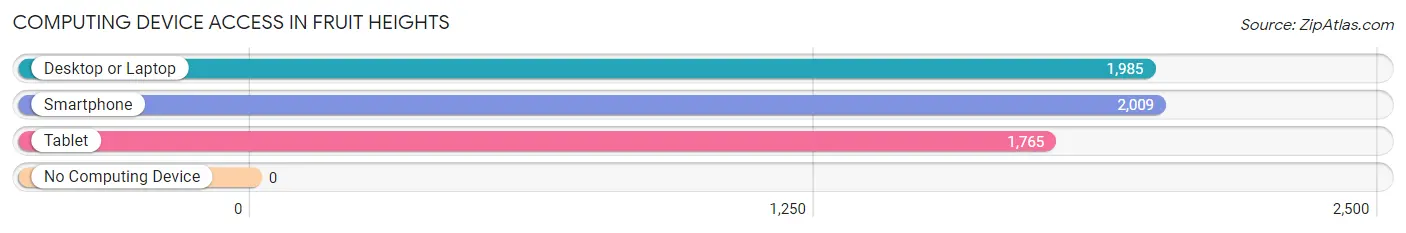
| Device Type | # Households | % Households |
| Desktop or Laptop | 1,985 | 97.0% |
| Smartphone | 2,009 | 98.2% |
| Tablet | 1,765 | 86.3% |
| No Computing Device | 0 | 0.0% |
| Total | 2,046 | 100.0% |
Internet Access in Fruit Heights
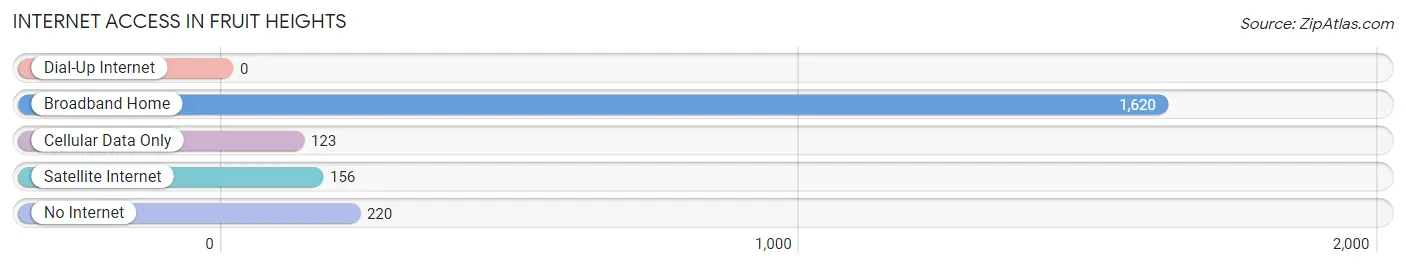
| Internet Type | # Households | % Households |
| Dial-Up Internet | 0 | 0.0% |
| Broadband Home | 1,620 | 79.2% |
| Cellular Data Only | 123 | 6.0% |
| Satellite Internet | 156 | 7.6% |
| No Internet | 220 | 10.7% |
| Total | 2,046 | 100.0% |
Fruit Heights Summary
Fruit Heights is a city located in Davis County, Utah, United States. It is part of the Ogden-Clearfield Metropolitan Statistical Area. The population was 7,785 at the 2010 census, up from 5,902 at the 2000 census.
History
Fruit Heights was first settled in 1848 by a group of Mormon pioneers led by John S. Fullmer. The area was originally known as Fullmer's Settlement, but was later renamed Fruit Heights in 1877. The name was chosen to reflect the abundance of fruit trees in the area.
In the early 1900s, Fruit Heights was a small farming community. The area was known for its orchards and fruit production. In the 1950s, the area began to experience rapid growth as the population of the Ogden-Clearfield area increased.
Geography
Fruit Heights is located in northern Davis County at 41°06'45" North, 111°58'45" West (41.1127, -111.9793). It is bordered to the north by Kaysville, to the east by Layton, to the south by South Weber, and to the west by Farmington.
According to the United States Census Bureau, the city has a total area of 5.2 square miles (13.4 km2), all of it land.
Economy
Fruit Heights is home to several businesses, including a number of retail stores, restaurants, and professional services. The city is also home to several industrial and manufacturing companies.
The city is served by the Davis County School District, which operates several elementary, middle, and high schools in the area.
Demographics
As of the census of 2000, there were 5,902 people, 1,945 households, and 1,619 families residing in the city. The population density was 1,139.3 people per square mile (439.3/km2). There were 2,039 housing units at an average density of 393.3 per square mile (151.7/km2). The racial makeup of the city was 94.2% White, 0.3% African American, 0.3% Native American, 1.2% Asian, 0.1% Pacific Islander, 2.2% from other races, and 1.7% from two or more races. Hispanic or Latino of any race were 4.2% of the population.
There were 1,945 households, out of which 44.2% had children under the age of 18 living with them, 71.2% were married couples living together, 7.2% had a female householder with no husband present, and 18.7% were non-families. 14.7% of all households were made up of individuals, and 5.2% had someone living alone who was 65 years of age or older. The average household size was 3.03 and the average family size was 3.37.
In the city, the population was spread out, with 32.2% under the age of 18, 6.2% from 18 to 24, 28.2% from 25 to 44, 25.2% from 45 to 64, and 8.2% who were 65 years of age or older. The median age was 36 years. For every 100 females, there were 97.2 males. For every 100 females age 18 and over, there were 94.2 males.
The median income for a household in the city was $63,917, and the median income for a family was $68,917. Males had a median income of $50,000 versus $30,000 for females. The per capita income for the city was $24,917. About 2.2% of families and 3.2% of the population were below the poverty line, including 3.7% of those under age 18 and 4.2% of those age 65 or over.
Common Questions
What is Per Capita Income in Fruit Heights?
Per Capita income in Fruit Heights is $67,623.
What is the Median Family Income in Fruit Heights?
Median Family Income in Fruit Heights is $124,423.
What is the Median Household income in Fruit Heights?
Median Household Income in Fruit Heights is $117,123.
What is Income or Wage Gap in Fruit Heights?
Income or Wage Gap in Fruit Heights is 61.8%.
Women in Fruit Heights earn 38.2 cents for every dollar earned by a man.
What is Inequality or Gini Index in Fruit Heights?
Inequality or Gini Index in Fruit Heights is 0.49.
What is the Total Population of Fruit Heights?
Total Population of Fruit Heights is 6,018.
What is the Total Male Population of Fruit Heights?
Total Male Population of Fruit Heights is 3,215.
What is the Total Female Population of Fruit Heights?
Total Female Population of Fruit Heights is 2,803.
What is the Ratio of Males per 100 Females in Fruit Heights?
There are 114.70 Males per 100 Females in Fruit Heights.
What is the Ratio of Females per 100 Males in Fruit Heights?
There are 87.19 Females per 100 Males in Fruit Heights.
What is the Median Population Age in Fruit Heights?
Median Population Age in Fruit Heights is 41.5 Years.
What is the Average Family Size in Fruit Heights
Average Family Size in Fruit Heights is 3.1 People.
What is the Average Household Size in Fruit Heights
Average Household Size in Fruit Heights is 2.9 People.
How Large is the Labor Force in Fruit Heights?
There are 2,821 People in the Labor Forcein in Fruit Heights.
What is the Percentage of People in the Labor Force in Fruit Heights?
63.9% of People are in the Labor Force in Fruit Heights.
What is the Unemployment Rate in Fruit Heights?
Unemployment Rate in Fruit Heights is 0.8%.