Hapeville, GA Map & Demographics
Hapeville Map
Hapeville Overview
$33,724
PER CAPITA INCOME
$62,266
AVG FAMILY INCOME
$62,117
AVG HOUSEHOLD INCOME
29.4%
WAGE / INCOME GAP [ % ]
70.6¢/ $1
WAGE / INCOME GAP [ $ ]
0.39
INEQUALITY / GINI INDEX
6,566
TOTAL POPULATION
3,938
MALE POPULATION
2,628
FEMALE POPULATION
149.85
MALES / 100 FEMALES
66.73
FEMALES / 100 MALES
36.6
MEDIAN AGE
3.2
AVG FAMILY SIZE
2.3
AVG HOUSEHOLD SIZE
4,019
LABOR FORCE [ PEOPLE ]
77.7%
PERCENT IN LABOR FORCE
6.2%
UNEMPLOYMENT RATE
Income in Hapeville
Income Overview in Hapeville
Per Capita Income in Hapeville is $33,724, while median incomes of families and households are $62,266 and $62,117 respectively.
| Characteristic | Number | Measure |
| Per Capita Income | 6,566 | $33,724 |
| Median Family Income | 1,461 | $62,266 |
| Mean Family Income | 1,461 | $82,282 |
| Median Household Income | 2,908 | $62,117 |
| Mean Household Income | 2,908 | $77,268 |
| Income Deficit | 1,461 | $0 |
| Wage / Income Gap (%) | 6,566 | 29.43% |
| Wage / Income Gap ($) | 6,566 | 70.57¢ per $1 |
| Gini / Inequality Index | 6,566 | 0.39 |
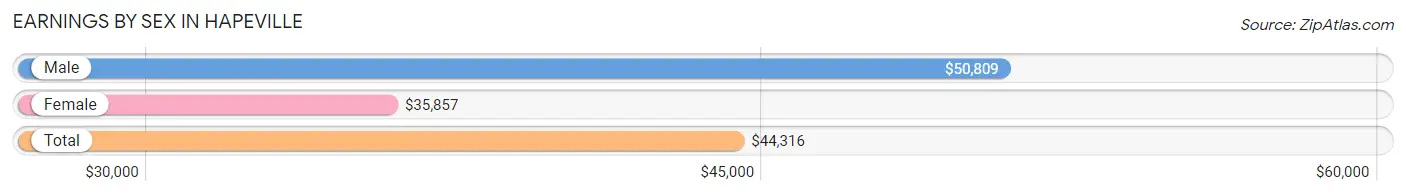
Earnings by Sex in Hapeville
Average Earnings in Hapeville are $44,316, $50,809 for men and $35,857 for women, a difference of 29.4%.
| Sex | Number | Average Earnings |
| Male | 2,457 (60.3%) | $50,809 |
| Female | 1,617 (39.7%) | $35,857 |
| Total | 4,074 (100.0%) | $44,316 |
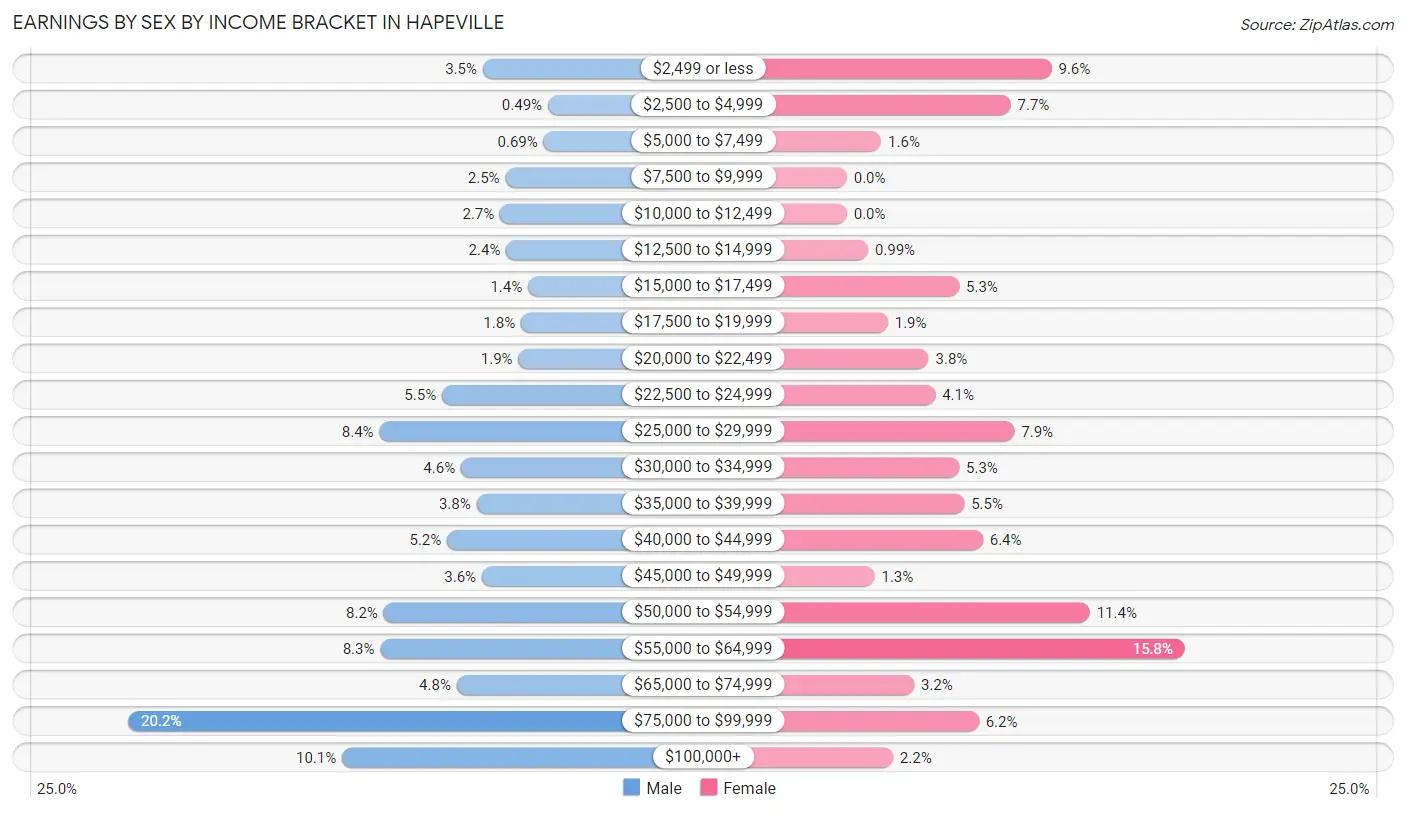
Earnings by Sex by Income Bracket in Hapeville
The most common earnings brackets in Hapeville are $75,000 to $99,999 for men (495 | 20.2%) and $55,000 to $64,999 for women (256 | 15.8%).
| Income | Male | Female |
| $2,499 or less | 87 (3.5%) | 155 (9.6%) |
| $2,500 to $4,999 | 12 (0.5%) | 124 (7.7%) |
| $5,000 to $7,499 | 17 (0.7%) | 26 (1.6%) |
| $7,500 to $9,999 | 61 (2.5%) | 0 (0.0%) |
| $10,000 to $12,499 | 67 (2.7%) | 0 (0.0%) |
| $12,500 to $14,999 | 60 (2.4%) | 16 (1.0%) |
| $15,000 to $17,499 | 35 (1.4%) | 85 (5.3%) |
| $17,500 to $19,999 | 43 (1.8%) | 31 (1.9%) |
| $20,000 to $22,499 | 46 (1.9%) | 62 (3.8%) |
| $22,500 to $24,999 | 134 (5.4%) | 67 (4.1%) |
| $25,000 to $29,999 | 206 (8.4%) | 127 (7.9%) |
| $30,000 to $34,999 | 112 (4.6%) | 85 (5.3%) |
| $35,000 to $39,999 | 94 (3.8%) | 89 (5.5%) |
| $40,000 to $44,999 | 128 (5.2%) | 103 (6.4%) |
| $45,000 to $49,999 | 88 (3.6%) | 21 (1.3%) |
| $50,000 to $54,999 | 201 (8.2%) | 184 (11.4%) |
| $55,000 to $64,999 | 205 (8.3%) | 256 (15.8%) |
| $65,000 to $74,999 | 117 (4.8%) | 51 (3.2%) |
| $75,000 to $99,999 | 495 (20.2%) | 100 (6.2%) |
| $100,000+ | 249 (10.1%) | 35 (2.2%) |
| Total | 2,457 (100.0%) | 1,617 (100.0%) |
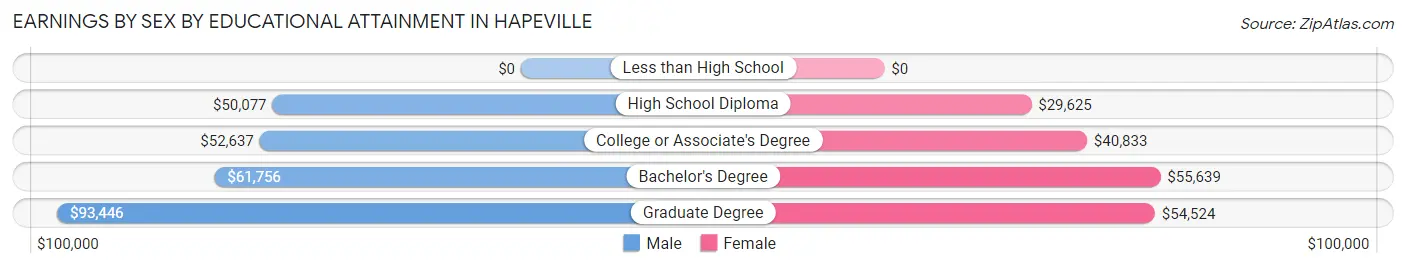
Earnings by Sex by Educational Attainment in Hapeville
Average earnings in Hapeville are $54,405 for men and $41,942 for women, a difference of 22.9%. Men with an educational attainment of graduate degree enjoy the highest average annual earnings of $93,446, while those with high school diploma education earn the least with $50,077. Women with an educational attainment of bachelor's degree earn the most with the average annual earnings of $55,639, while those with high school diploma education have the smallest earnings of $29,625.
| Educational Attainment | Male Income | Female Income |
| Less than High School | - | - |
| High School Diploma | $50,077 | $29,625 |
| College or Associate's Degree | $52,637 | $40,833 |
| Bachelor's Degree | $61,756 | $55,639 |
| Graduate Degree | $93,446 | $54,524 |
| Total | $54,405 | $41,942 |
Family Income in Hapeville
Family Income Brackets in Hapeville
According to the Hapeville family income data, there are 386 families falling into the $50,000 to $74,999 income range, which is the most common income bracket and makes up 26.4% of all families. Conversely, the $15,000 to $24,999 income bracket is the least frequent group with only 31 families (2.1%) belonging to this category.
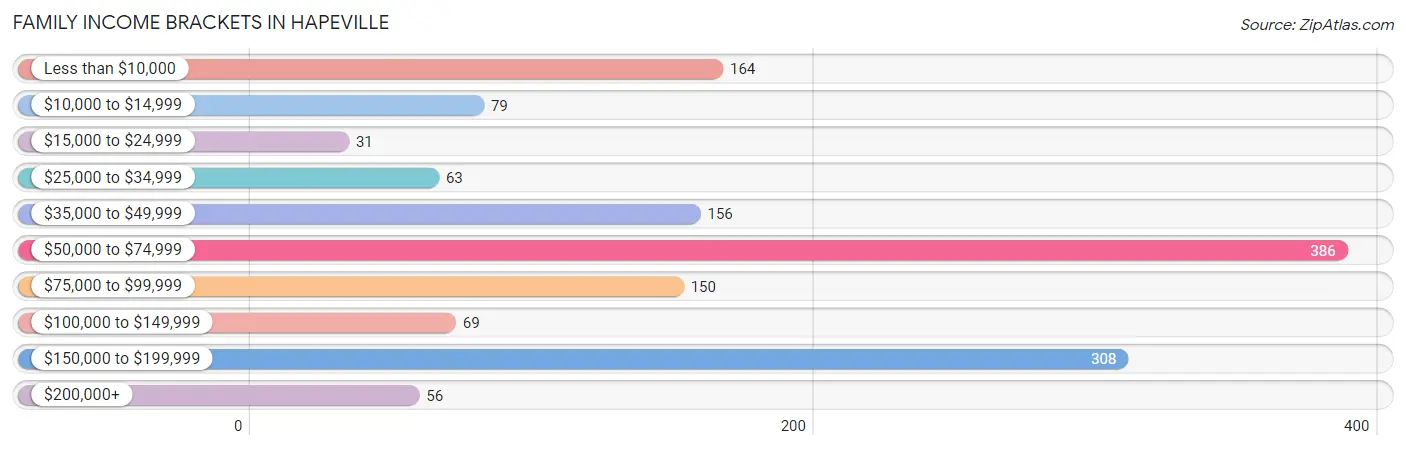
| Income Bracket | # Families | % Families |
| Less than $10,000 | 164 | 11.2% |
| $10,000 to $14,999 | 79 | 5.4% |
| $15,000 to $24,999 | 31 | 2.1% |
| $25,000 to $34,999 | 63 | 4.3% |
| $35,000 to $49,999 | 156 | 10.7% |
| $50,000 to $74,999 | 386 | 26.4% |
| $75,000 to $99,999 | 150 | 10.3% |
| $100,000 to $149,999 | 69 | 4.7% |
| $150,000 to $199,999 | 308 | 21.1% |
| $200,000+ | 56 | 3.8% |
Family Income by Famaliy Size in Hapeville
2-person families (595 | 40.7%) account for the highest median family income in Hapeville with $70,083 per family, while 2-person families (595 | 40.7%) have the highest median income of $35,042 per family member.
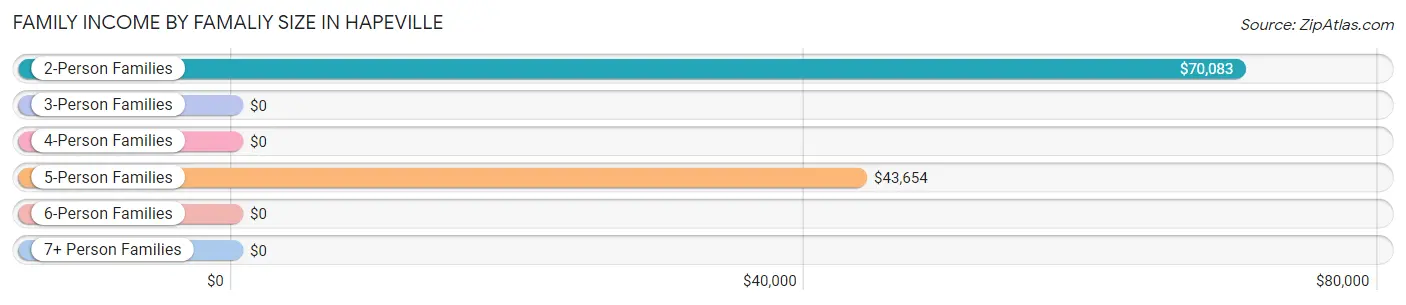
| Income Bracket | # Families | Median Income |
| 2-Person Families | 595 (40.7%) | $70,083 |
| 3-Person Families | 557 (38.1%) | $0 |
| 4-Person Families | 59 (4.0%) | $0 |
| 5-Person Families | 158 (10.8%) | $43,654 |
| 6-Person Families | 44 (3.0%) | $0 |
| 7+ Person Families | 48 (3.3%) | $0 |
| Total | 1,461 (100.0%) | $62,266 |
Family Income by Number of Earners in Hapeville
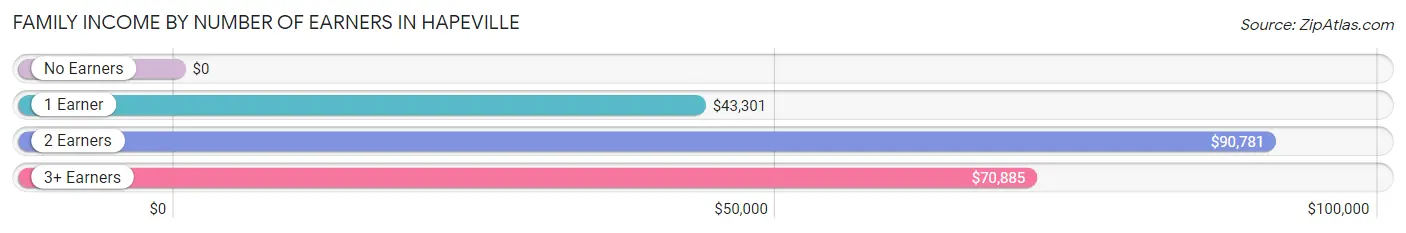
| Number of Earners | # Families | Median Income |
| No Earners | 139 (9.5%) | $0 |
| 1 Earner | 330 (22.6%) | $43,301 |
| 2 Earners | 770 (52.7%) | $90,781 |
| 3+ Earners | 222 (15.2%) | $70,885 |
| Total | 1,461 (100.0%) | $62,266 |
Household Income in Hapeville
Household Income Brackets in Hapeville
With 579 households falling in the category, the $50,000 to $74,999 income range is the most frequent in Hapeville, accounting for 19.9% of all households. In contrast, only 64 households (2.2%) fall into the $15,000 to $24,999 income bracket, making it the least populous group.
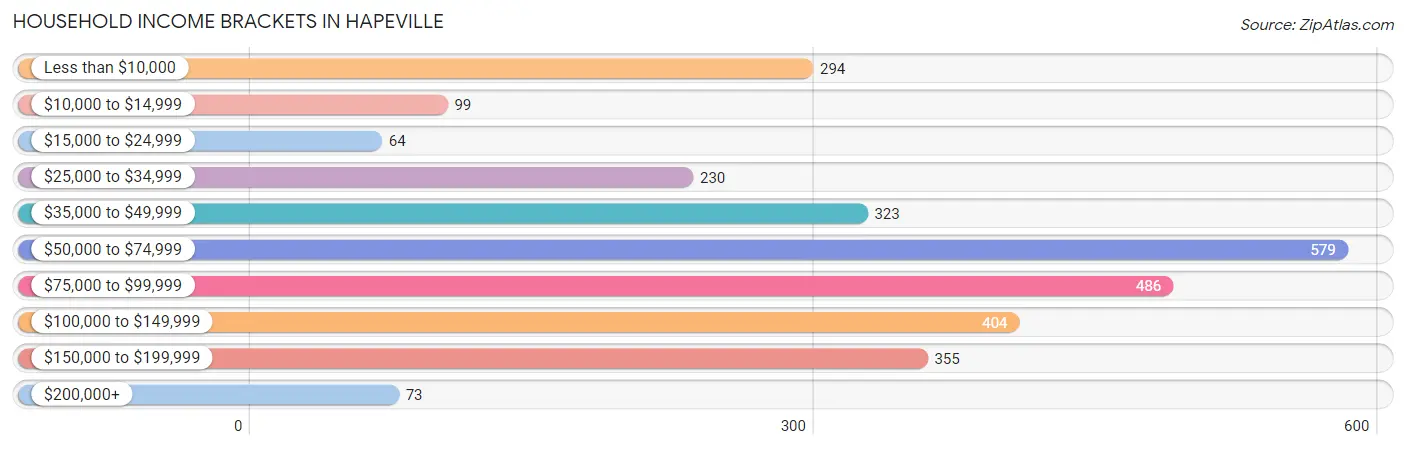
| Income Bracket | # Households | % Households |
| Less than $10,000 | 294 | 10.1% |
| $10,000 to $14,999 | 99 | 3.4% |
| $15,000 to $24,999 | 64 | 2.2% |
| $25,000 to $34,999 | 230 | 7.9% |
| $35,000 to $49,999 | 323 | 11.1% |
| $50,000 to $74,999 | 579 | 19.9% |
| $75,000 to $99,999 | 486 | 16.7% |
| $100,000 to $149,999 | 404 | 13.9% |
| $150,000 to $199,999 | 355 | 12.2% |
| $200,000+ | 73 | 2.5% |
Household Income by Householder Age in Hapeville
The median household income in Hapeville is $62,117, with the highest median household income of $79,135 found in the 45 to 64 years age bracket for the primary householder. A total of 1,235 households (42.5%) fall into this category. Meanwhile, the 15 to 24 years age bracket for the primary householder has the lowest median household income of $0, with 91 households (3.1%) in this group.
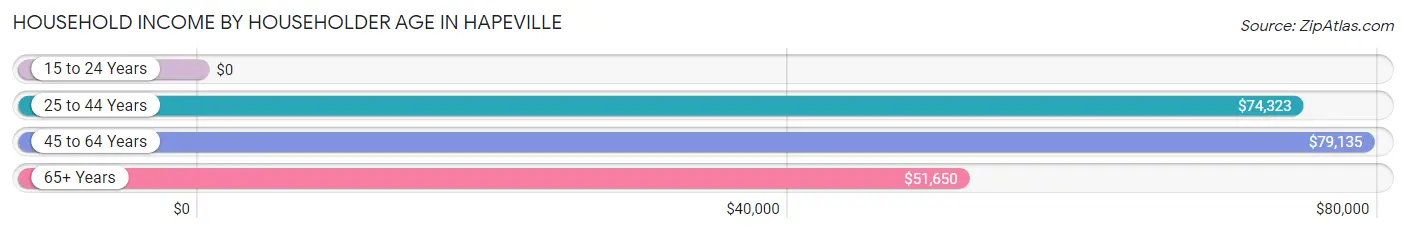
| Income Bracket | # Households | Median Income |
| 15 to 24 Years | 91 (3.1%) | $0 |
| 25 to 44 Years | 1,115 (38.3%) | $74,323 |
| 45 to 64 Years | 1,235 (42.5%) | $79,135 |
| 65+ Years | 467 (16.1%) | $51,650 |
| Total | 2,908 (100.0%) | $62,117 |
Poverty in Hapeville
Income Below Poverty by Sex and Age in Hapeville
With 18.1% poverty level for males and 17.8% for females among the residents of Hapeville, 5 year old males and 6 to 11 year old females are the most vulnerable to poverty, with 106 males (100.0%) and 72 females (42.6%) in their respective age groups living below the poverty level.
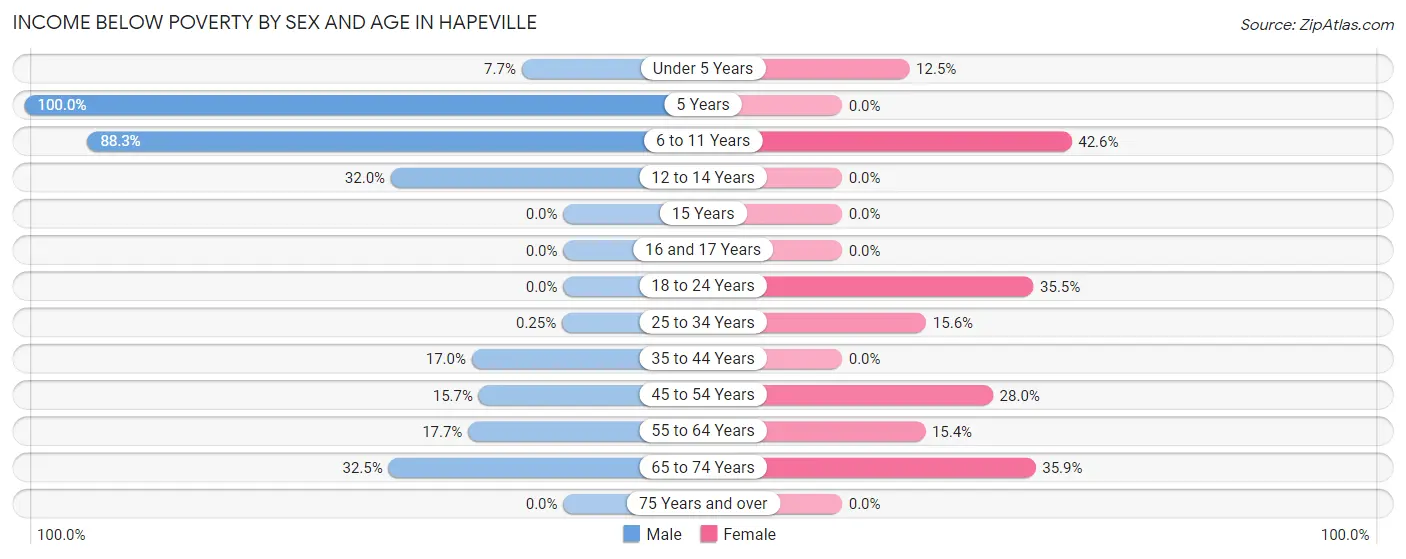
| Age Bracket | Male | Female |
| Under 5 Years | 21 (7.7%) | 23 (12.5%) |
| 5 Years | 106 (100.0%) | 0 (0.0%) |
| 6 to 11 Years | 53 (88.3%) | 72 (42.6%) |
| 12 to 14 Years | 121 (32.0%) | 0 (0.0%) |
| 15 Years | 0 (0.0%) | 0 (0.0%) |
| 16 and 17 Years | 0 (0.0%) | 0 (0.0%) |
| 18 to 24 Years | 0 (0.0%) | 76 (35.5%) |
| 25 to 34 Years | 1 (0.3%) | 69 (15.6%) |
| 35 to 44 Years | 140 (17.0%) | 0 (0.0%) |
| 45 to 54 Years | 64 (15.7%) | 77 (28.0%) |
| 55 to 64 Years | 121 (17.7%) | 73 (15.4%) |
| 65 to 74 Years | 86 (32.5%) | 79 (35.9%) |
| 75 Years and over | 0 (0.0%) | 0 (0.0%) |
| Total | 713 (18.1%) | 469 (17.8%) |
Income Above Poverty by Sex and Age in Hapeville
According to the poverty statistics in Hapeville, males aged 15 years and females aged 5 years are the age groups that are most secure financially, with 100.0% of males and 100.0% of females in these age groups living above the poverty line.
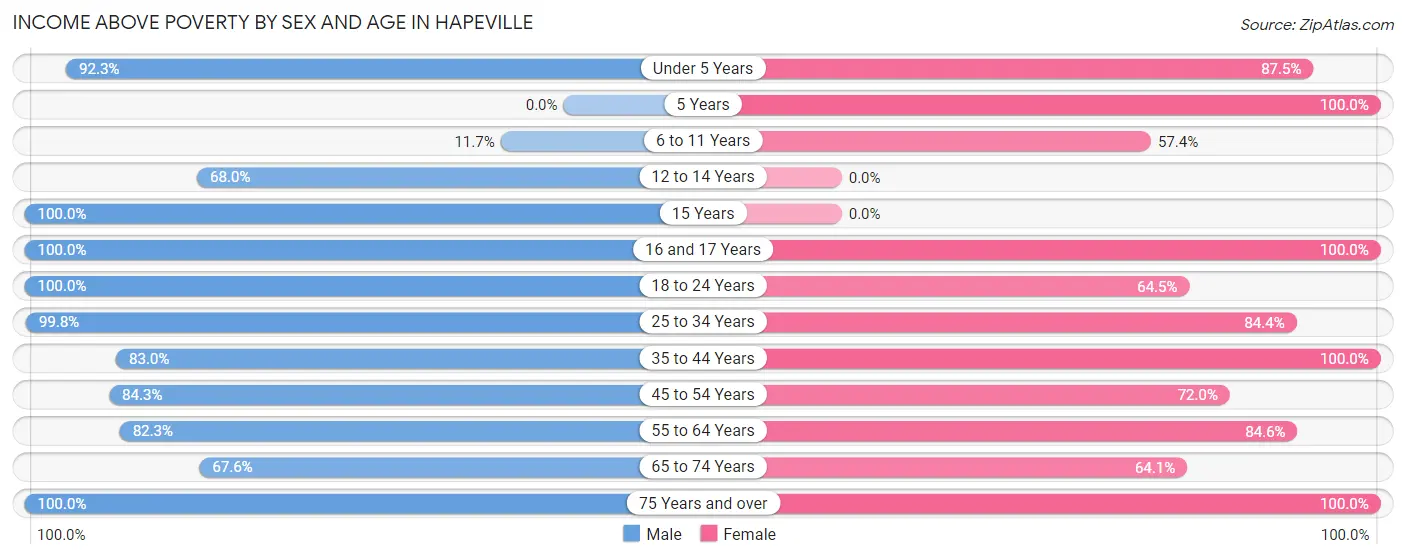
| Age Bracket | Male | Female |
| Under 5 Years | 251 (92.3%) | 161 (87.5%) |
| 5 Years | 0 (0.0%) | 135 (100.0%) |
| 6 to 11 Years | 7 (11.7%) | 97 (57.4%) |
| 12 to 14 Years | 257 (68.0%) | 0 (0.0%) |
| 15 Years | 90 (100.0%) | 0 (0.0%) |
| 16 and 17 Years | 111 (100.0%) | 123 (100.0%) |
| 18 to 24 Years | 307 (100.0%) | 138 (64.5%) |
| 25 to 34 Years | 400 (99.8%) | 373 (84.4%) |
| 35 to 44 Years | 684 (83.0%) | 278 (100.0%) |
| 45 to 54 Years | 344 (84.3%) | 198 (72.0%) |
| 55 to 64 Years | 564 (82.3%) | 400 (84.6%) |
| 65 to 74 Years | 179 (67.5%) | 141 (64.1%) |
| 75 Years and over | 31 (100.0%) | 115 (100.0%) |
| Total | 3,225 (81.9%) | 2,159 (82.2%) |
Income Below Poverty Among Married-Couple Families in Hapeville
The poverty statistics for married-couple families in Hapeville show that 11.2% or 107 of the total 959 families live below the poverty line. Families with 1 or 2 children have the highest poverty rate of 15.7%, comprising of 60 families. On the other hand, families with 3 or 4 children have the lowest poverty rate of 0.0%, which includes 0 families.
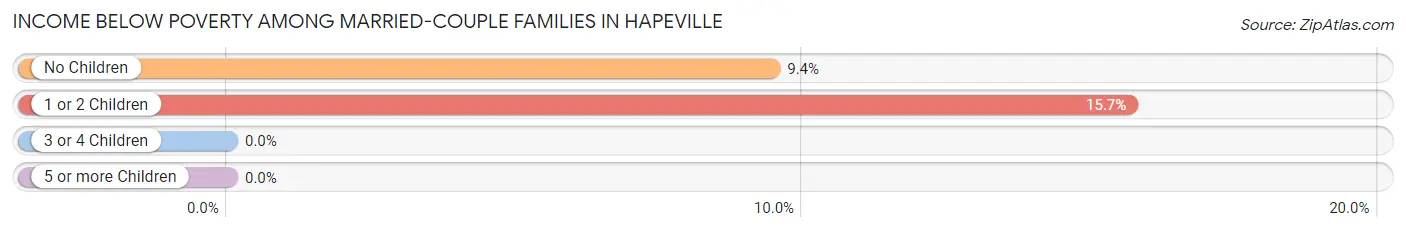
| Children | Above Poverty | Below Poverty |
| No Children | 451 (90.6%) | 47 (9.4%) |
| 1 or 2 Children | 323 (84.3%) | 60 (15.7%) |
| 3 or 4 Children | 78 (100.0%) | 0 (0.0%) |
| 5 or more Children | 0 (0.0%) | 0 (0.0%) |
| Total | 852 (88.8%) | 107 (11.2%) |
Income Below Poverty Among Single-Parent Households in Hapeville
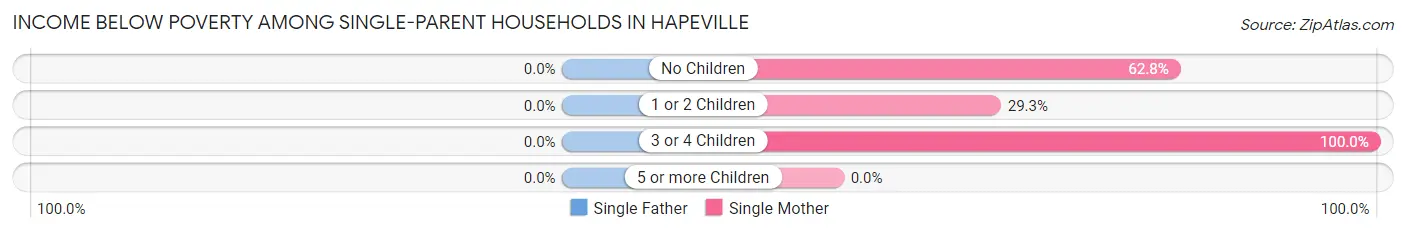
| Children | Single Father | Single Mother |
| No Children | 0 (0.0%) | 32 (62.7%) |
| 1 or 2 Children | 0 (0.0%) | 60 (29.3%) |
| 3 or 4 Children | 0 (0.0%) | 58 (100.0%) |
| 5 or more Children | 0 (0.0%) | 0 (0.0%) |
| Total | 0 (0.0%) | 150 (41.4%) |
Income Below Poverty Among Married-Couple vs Single-Parent Households in Hapeville
The poverty data for Hapeville shows that 107 of the married-couple family households (11.2%) and 150 of the single-parent households (29.9%) are living below the poverty level. Within the married-couple family households, those with 1 or 2 children have the highest poverty rate, with 60 households (15.7%) falling below the poverty line. Among the single-parent households, those with 3 or 4 children have the highest poverty rate, with 58 household (100.0%) living below poverty.
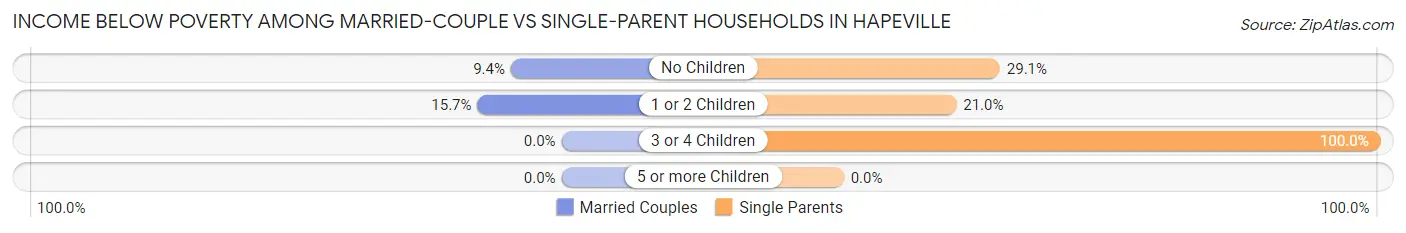
| Children | Married-Couple Families | Single-Parent Households |
| No Children | 47 (9.4%) | 32 (29.1%) |
| 1 or 2 Children | 60 (15.7%) | 60 (21.0%) |
| 3 or 4 Children | 0 (0.0%) | 58 (100.0%) |
| 5 or more Children | 0 (0.0%) | 0 (0.0%) |
| Total | 107 (11.2%) | 150 (29.9%) |
Race in Hapeville
The most populous races in Hapeville are Hispanic or Latino (2,285 | 34.8%), Black / African American (2,236 | 34.1%), and White / Caucasian (2,076 | 31.6%).
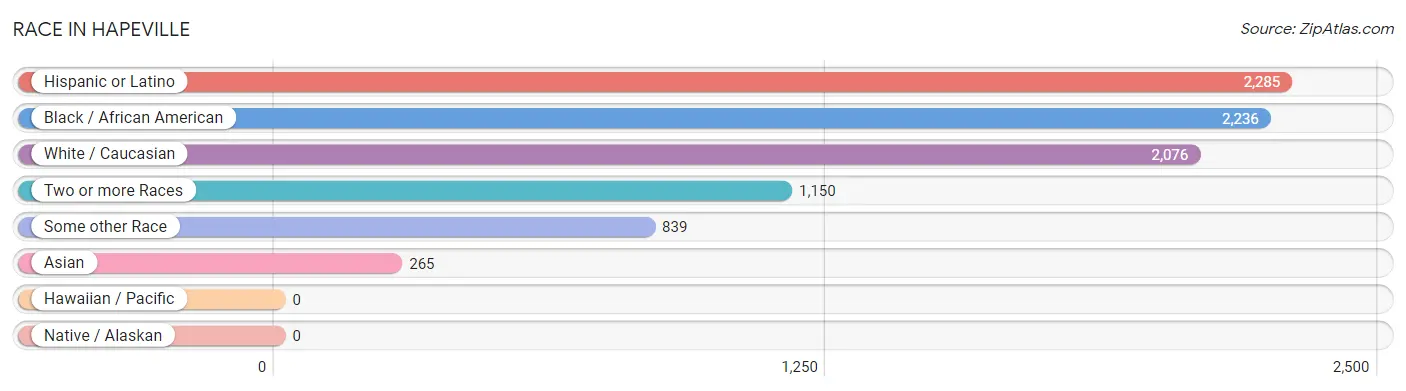
| Race | # Population | % Population |
| Asian | 265 | 4.0% |
| Black / African American | 2,236 | 34.1% |
| Hawaiian / Pacific | 0 | 0.0% |
| Hispanic or Latino | 2,285 | 34.8% |
| Native / Alaskan | 0 | 0.0% |
| White / Caucasian | 2,076 | 31.6% |
| Two or more Races | 1,150 | 17.5% |
| Some other Race | 839 | 12.8% |
| Total | 6,566 | 100.0% |
Ancestry in Hapeville
The most populous ancestries reported in Hapeville are Mexican (1,722 | 26.2%), Irish (483 | 7.4%), English (418 | 6.4%), Central American (286 | 4.4%), and American (226 | 3.4%), together accounting for 47.8% of all Hapeville residents.
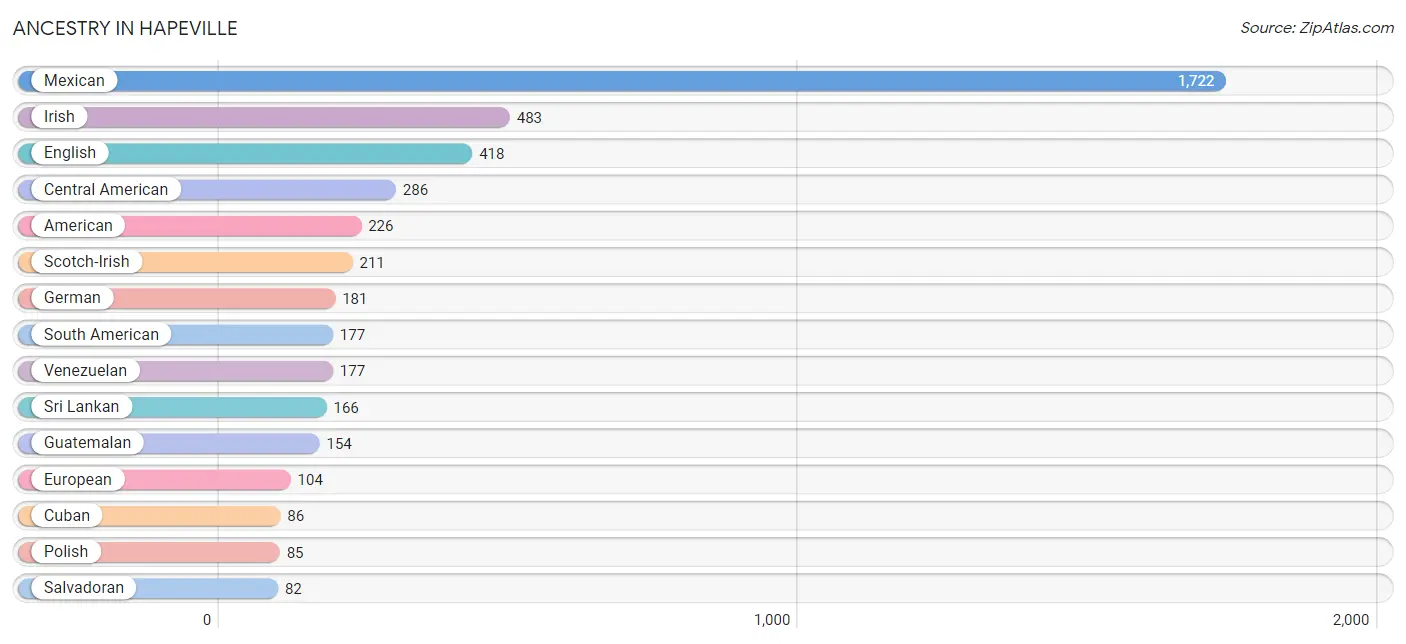
| Ancestry | # Population | % Population |
| African | 65 | 1.0% |
| American | 226 | 3.4% |
| British | 50 | 0.8% |
| Central American | 286 | 4.4% |
| Costa Rican | 50 | 0.8% |
| Croatian | 19 | 0.3% |
| Cuban | 86 | 1.3% |
| English | 418 | 6.4% |
| European | 104 | 1.6% |
| French | 35 | 0.5% |
| German | 181 | 2.8% |
| Guatemalan | 154 | 2.4% |
| Hungarian | 9 | 0.1% |
| Irish | 483 | 7.4% |
| Italian | 53 | 0.8% |
| Jamaican | 11 | 0.2% |
| Korean | 36 | 0.5% |
| Mexican | 1,722 | 26.2% |
| Polish | 85 | 1.3% |
| Russian | 15 | 0.2% |
| Salvadoran | 82 | 1.3% |
| Scotch-Irish | 211 | 3.2% |
| Scottish | 27 | 0.4% |
| South American | 177 | 2.7% |
| Spaniard | 14 | 0.2% |
| Spanish American Indian | 52 | 0.8% |
| Sri Lankan | 166 | 2.5% |
| Subsaharan African | 65 | 1.0% |
| Swedish | 11 | 0.2% |
| Thai | 63 | 1.0% |
| Venezuelan | 177 | 2.7% |
| Welsh | 12 | 0.2% | View All 32 Rows |
Immigrants in Hapeville
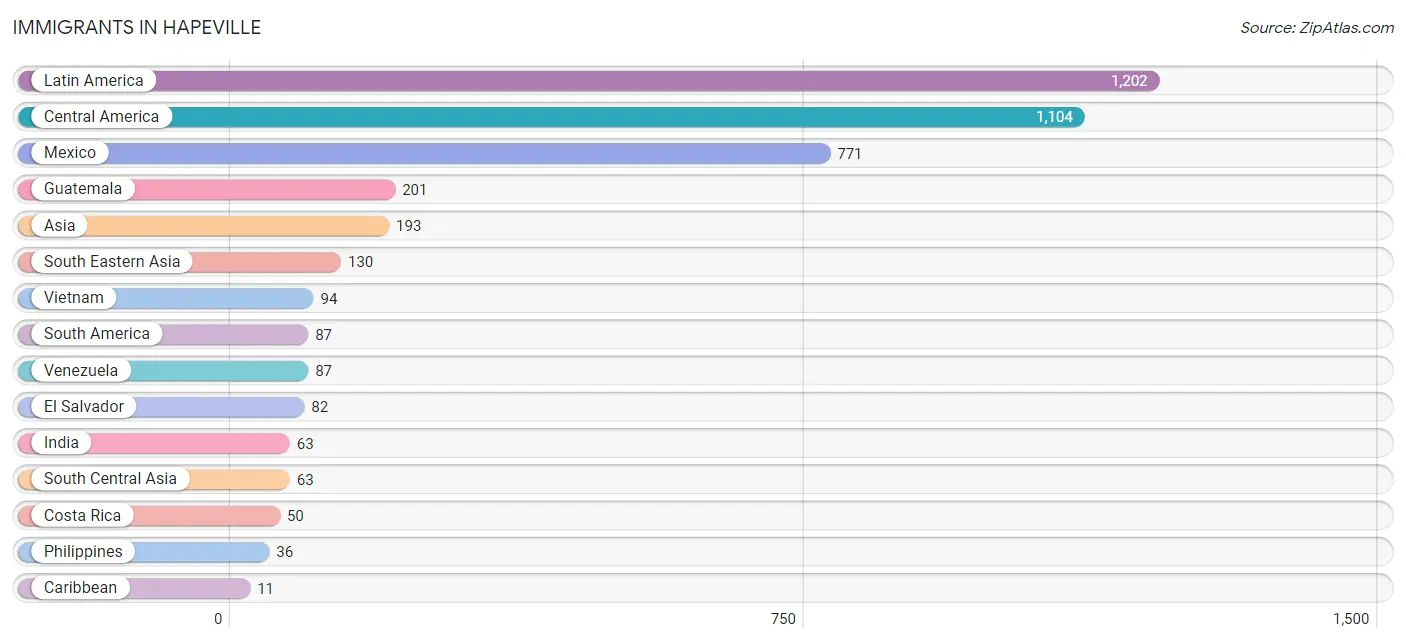
The most numerous immigrant groups reported in Hapeville came from Latin America (1,202 | 18.3%), Central America (1,104 | 16.8%), Mexico (771 | 11.7%), Guatemala (201 | 3.1%), and Asia (193 | 2.9%), together accounting for 52.9% of all Hapeville residents.
| Immigration Origin | # Population | % Population |
| Asia | 193 | 2.9% |
| Caribbean | 11 | 0.2% |
| Central America | 1,104 | 16.8% |
| Costa Rica | 50 | 0.8% |
| El Salvador | 82 | 1.3% |
| Guatemala | 201 | 3.1% |
| India | 63 | 1.0% |
| Jamaica | 11 | 0.2% |
| Latin America | 1,202 | 18.3% |
| Mexico | 771 | 11.7% |
| Philippines | 36 | 0.5% |
| South America | 87 | 1.3% |
| South Central Asia | 63 | 1.0% |
| South Eastern Asia | 130 | 2.0% |
| Venezuela | 87 | 1.3% |
| Vietnam | 94 | 1.4% | View All 16 Rows |
Sex and Age in Hapeville
Sex and Age in Hapeville
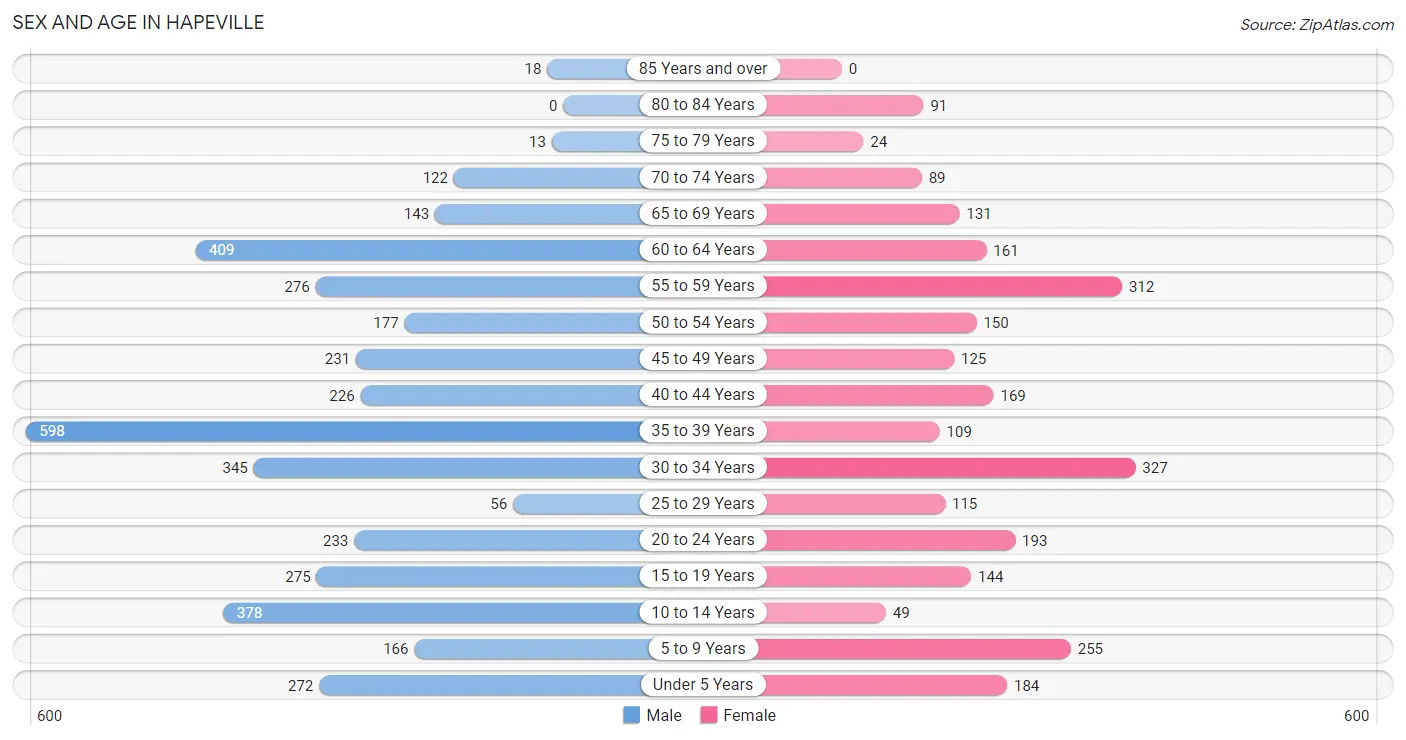
The most populous age groups in Hapeville are 35 to 39 Years (598 | 15.2%) for men and 30 to 34 Years (327 | 12.4%) for women.
| Age Bracket | Male | Female |
| Under 5 Years | 272 (6.9%) | 184 (7.0%) |
| 5 to 9 Years | 166 (4.2%) | 255 (9.7%) |
| 10 to 14 Years | 378 (9.6%) | 49 (1.9%) |
| 15 to 19 Years | 275 (7.0%) | 144 (5.5%) |
| 20 to 24 Years | 233 (5.9%) | 193 (7.3%) |
| 25 to 29 Years | 56 (1.4%) | 115 (4.4%) |
| 30 to 34 Years | 345 (8.8%) | 327 (12.4%) |
| 35 to 39 Years | 598 (15.2%) | 109 (4.2%) |
| 40 to 44 Years | 226 (5.7%) | 169 (6.4%) |
| 45 to 49 Years | 231 (5.9%) | 125 (4.8%) |
| 50 to 54 Years | 177 (4.5%) | 150 (5.7%) |
| 55 to 59 Years | 276 (7.0%) | 312 (11.9%) |
| 60 to 64 Years | 409 (10.4%) | 161 (6.1%) |
| 65 to 69 Years | 143 (3.6%) | 131 (5.0%) |
| 70 to 74 Years | 122 (3.1%) | 89 (3.4%) |
| 75 to 79 Years | 13 (0.3%) | 24 (0.9%) |
| 80 to 84 Years | 0 (0.0%) | 91 (3.5%) |
| 85 Years and over | 18 (0.5%) | 0 (0.0%) |
| Total | 3,938 (100.0%) | 2,628 (100.0%) |
Families and Households in Hapeville
Median Family Size in Hapeville
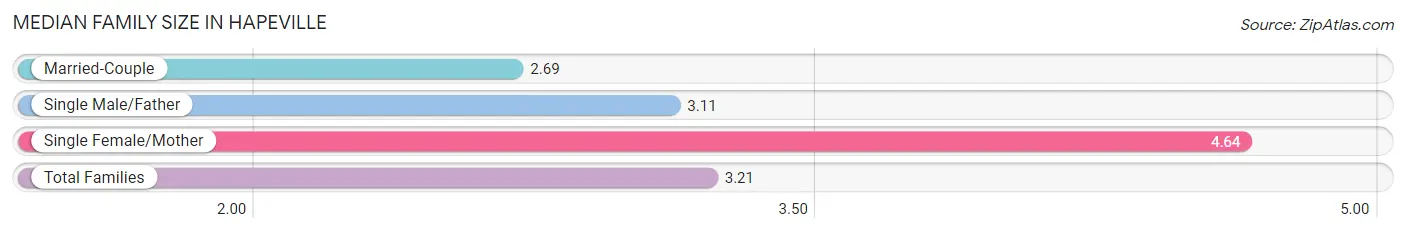
The median family size in Hapeville is 3.21 persons per family, with single female/mother families (362 | 24.8%) accounting for the largest median family size of 4.64 persons per family. On the other hand, married-couple families (959 | 65.6%) represent the smallest median family size with 2.69 persons per family.
| Family Type | # Families | Family Size |
| Married-Couple | 959 (65.6%) | 2.69 |
| Single Male/Father | 140 (9.6%) | 3.11 |
| Single Female/Mother | 362 (24.8%) | 4.64 |
| Total Families | 1,461 (100.0%) | 3.21 |
Median Household Size in Hapeville
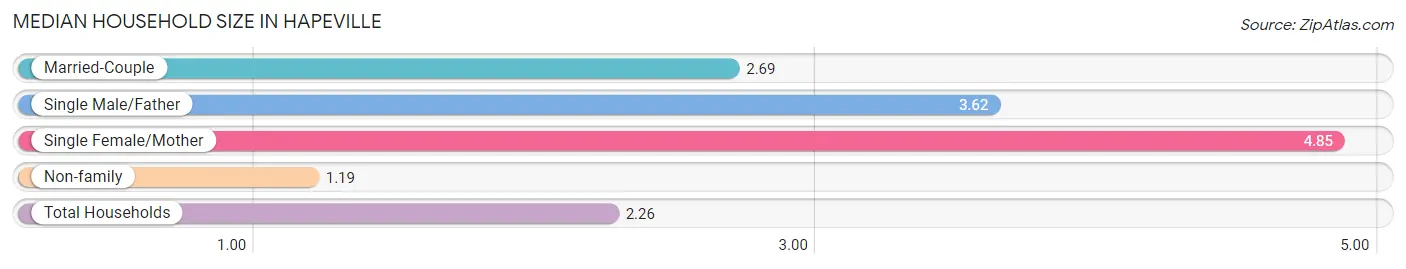
The median household size in Hapeville is 2.26 persons per household, with single female/mother households (362 | 12.4%) accounting for the largest median household size of 4.85 persons per household. non-family households (1,447 | 49.8%) represent the smallest median household size with 1.19 persons per household.
| Household Type | # Households | Household Size |
| Married-Couple | 959 (33.0%) | 2.69 |
| Single Male/Father | 140 (4.8%) | 3.62 |
| Single Female/Mother | 362 (12.4%) | 4.85 |
| Non-family | 1,447 (49.8%) | 1.19 |
| Total Households | 2,908 (100.0%) | 2.26 |
Household Size by Marriage Status in Hapeville
Out of a total of 2,908 households in Hapeville, 1,461 (50.2%) are family households, while 1,447 (49.8%) are nonfamily households. The most numerous type of family households are 3-person households, comprising 645, and the most common type of nonfamily households are 1-person households, comprising 1,237.
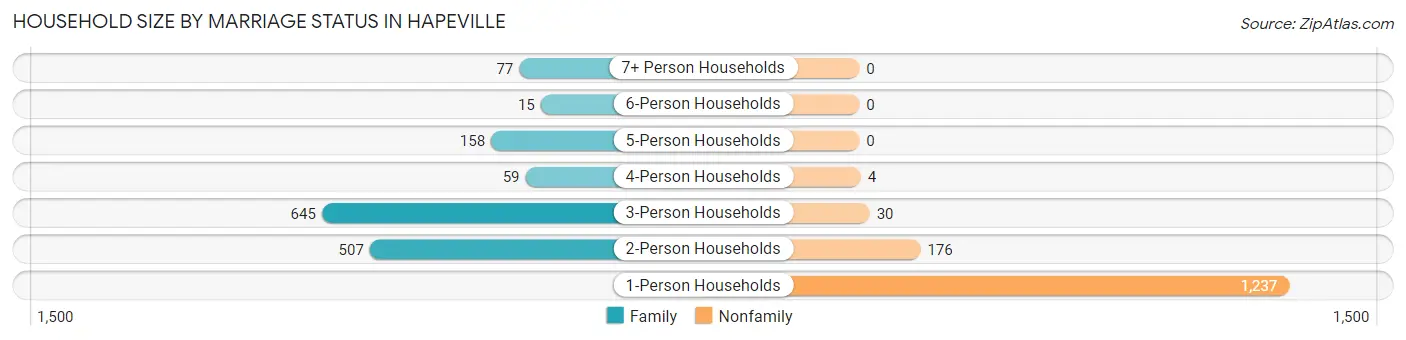
| Household Size | Family Households | Nonfamily Households |
| 1-Person Households | - | 1,237 (42.5%) |
| 2-Person Households | 507 (17.4%) | 176 (6.0%) |
| 3-Person Households | 645 (22.2%) | 30 (1.0%) |
| 4-Person Households | 59 (2.0%) | 4 (0.1%) |
| 5-Person Households | 158 (5.4%) | 0 (0.0%) |
| 6-Person Households | 15 (0.5%) | 0 (0.0%) |
| 7+ Person Households | 77 (2.6%) | 0 (0.0%) |
| Total | 1,461 (50.2%) | 1,447 (49.8%) |
Female Fertility in Hapeville
Fertility by Age in Hapeville
Average fertility rate in Hapeville is 20.0 births per 1,000 women. Women in the age bracket of 35 to 50 years have the highest fertility rate with 60.0 births per 1,000 women. Women in the age bracket of 35 to 50 years acount for 100.0% of all women with births.
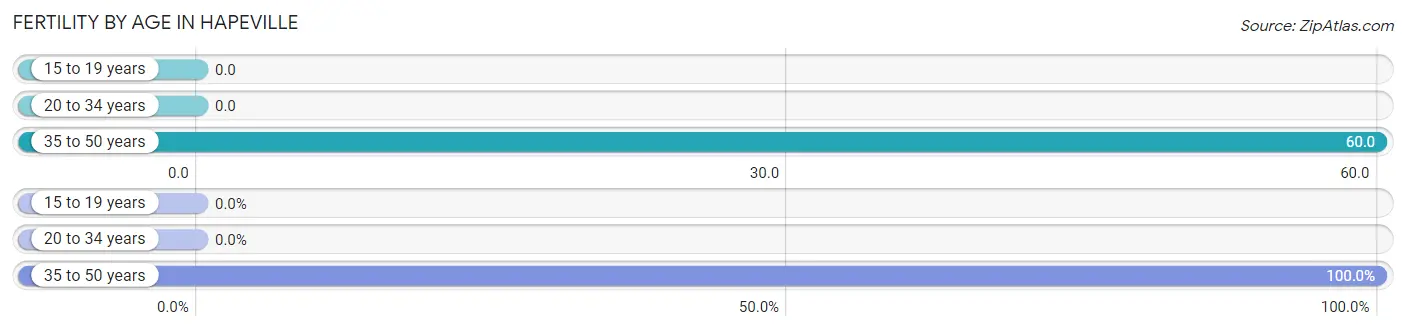
| Age Bracket | Women with Births | Births / 1,000 Women |
| 15 to 19 years | 0 (0.0%) | 0.0 |
| 20 to 34 years | 0 (0.0%) | 0.0 |
| 35 to 50 years | 24 (100.0%) | 60.0 |
| Total | 24 (100.0%) | 20.0 |
Fertility by Age by Marriage Status in Hapeville
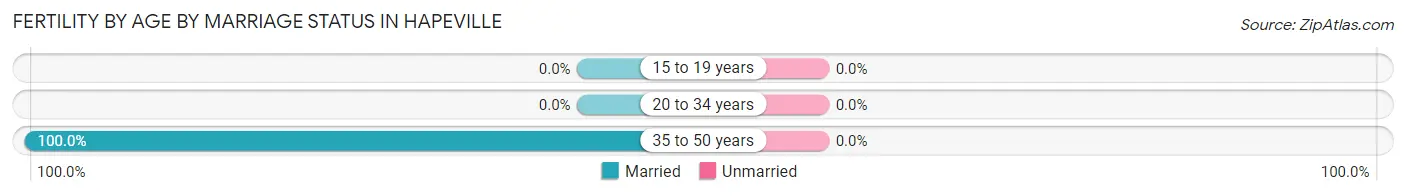
| Age Bracket | Married | Unmarried |
| 15 to 19 years | 0 (0.0%) | 0 (0.0%) |
| 20 to 34 years | 0 (0.0%) | 0 (0.0%) |
| 35 to 50 years | 24 (100.0%) | 0 (0.0%) |
| Total | 24 (100.0%) | 0 (0.0%) |
Fertility by Education in Hapeville
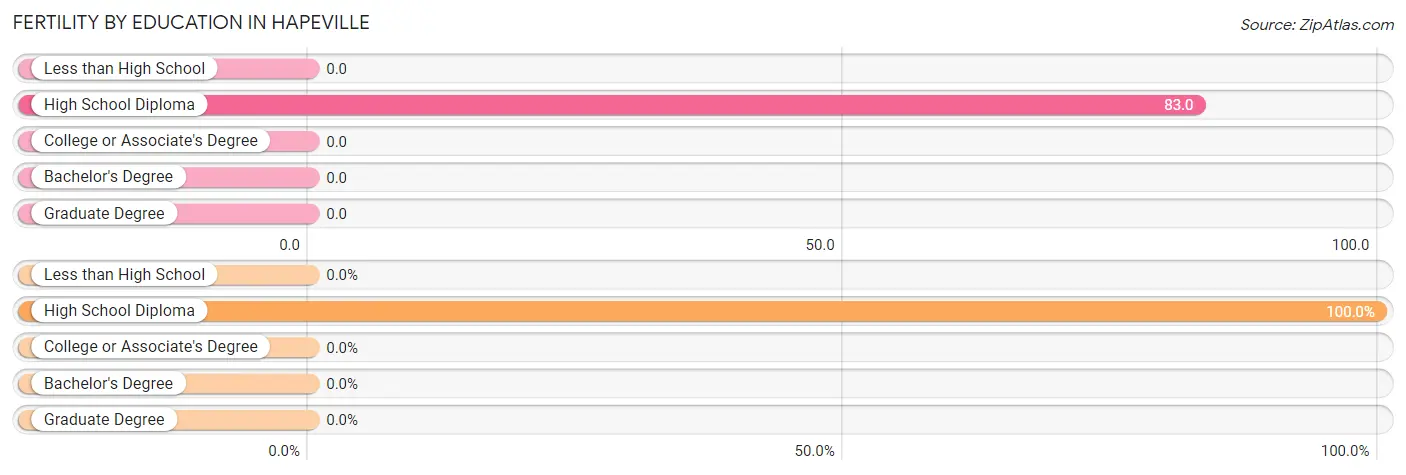
| Educational Attainment | Women with Births | Births / 1,000 Women |
| Less than High School | 0 (0.0%) | 0.0 |
| High School Diploma | 24 (100.0%) | 83.0 |
| College or Associate's Degree | 0 (0.0%) | 0.0 |
| Bachelor's Degree | 0 (0.0%) | 0.0 |
| Graduate Degree | 0 (0.0%) | 0.0 |
| Total | 24 (100.0%) | 20.0 |
Fertility by Education by Marriage Status in Hapeville
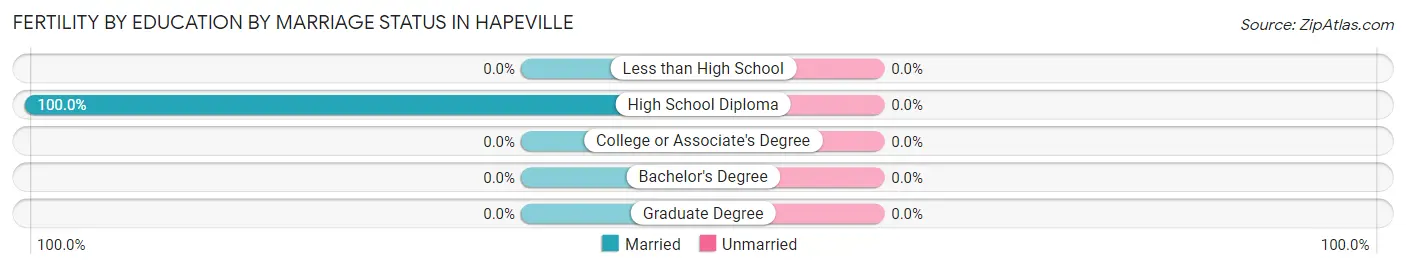
| Educational Attainment | Married | Unmarried |
| Less than High School | 0 (0.0%) | 0 (0.0%) |
| High School Diploma | 24 (100.0%) | 0 (0.0%) |
| College or Associate's Degree | 0 (0.0%) | 0 (0.0%) |
| Bachelor's Degree | 0 (0.0%) | 0 (0.0%) |
| Graduate Degree | 0 (0.0%) | 0 (0.0%) |
| Total | 24 (100.0%) | 0 (0.0%) |
Employment Characteristics in Hapeville
Employment by Class of Employer in Hapeville
Among the 3,644 employed individuals in Hapeville, private company employees (2,818 | 77.3%), self-employed (incorporated) (232 | 6.4%), and local government employees (172 | 4.7%) make up the most common classes of employment.
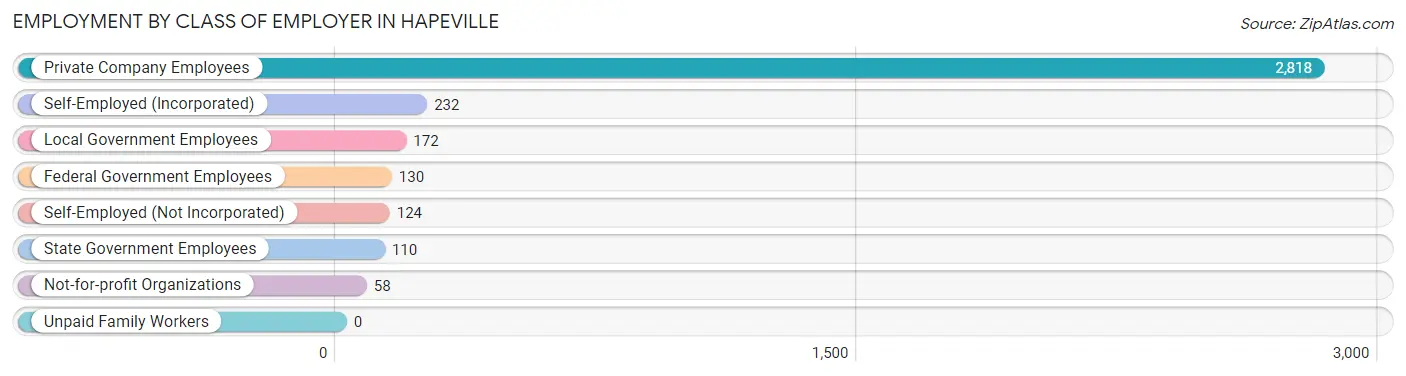
| Employer Class | # Employees | % Employees |
| Private Company Employees | 2,818 | 77.3% |
| Self-Employed (Incorporated) | 232 | 6.4% |
| Self-Employed (Not Incorporated) | 124 | 3.4% |
| Not-for-profit Organizations | 58 | 1.6% |
| Local Government Employees | 172 | 4.7% |
| State Government Employees | 110 | 3.0% |
| Federal Government Employees | 130 | 3.6% |
| Unpaid Family Workers | 0 | 0.0% |
| Total | 3,644 | 100.0% |
Employment Status by Age in Hapeville
According to the labor force statistics for Hapeville, out of the total population over 16 years of age (5,172), 77.7% or 4,019 individuals are in the labor force, with 6.2% or 249 of them unemployed. The age group with the highest labor force participation rate is 30 to 34 years, with 95.8% or 644 individuals in the labor force. Within the labor force, the 55 to 59 years age range has the highest percentage of unemployed individuals, with 26.7% or 117 of them being unemployed.
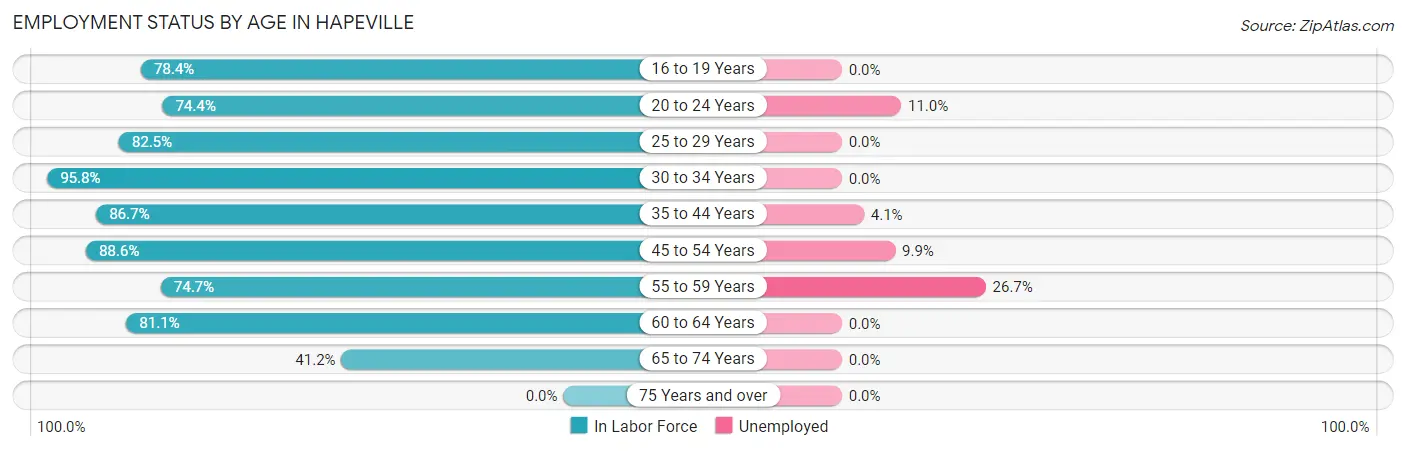
| Age Bracket | In Labor Force | Unemployed |
| 16 to 19 Years | 258 (78.4%) | 0 (0.0%) |
| 20 to 24 Years | 317 (74.4%) | 35 (11.0%) |
| 25 to 29 Years | 141 (82.5%) | 0 (0.0%) |
| 30 to 34 Years | 644 (95.8%) | 0 (0.0%) |
| 35 to 44 Years | 955 (86.7%) | 39 (4.1%) |
| 45 to 54 Years | 605 (88.6%) | 60 (9.9%) |
| 55 to 59 Years | 439 (74.7%) | 117 (26.7%) |
| 60 to 64 Years | 462 (81.1%) | 0 (0.0%) |
| 65 to 74 Years | 200 (41.2%) | 0 (0.0%) |
| 75 Years and over | 0 (0.0%) | 0 (0.0%) |
| Total | 4,019 (77.7%) | 249 (6.2%) |
Employment Status by Educational Attainment in Hapeville
According to labor force statistics for Hapeville, 85.7% of individuals (3,245) out of the total population between 25 and 64 years of age (3,786) are in the labor force, with 6.7% or 217 of them being unemployed. The group with the highest labor force participation rate are those with the educational attainment of college / associate degree, with 96.4% or 1,074 individuals in the labor force. Within the labor force, individuals with college / associate degree education have the highest percentage of unemployment, with 10.6% or 114 of them being unemployed.
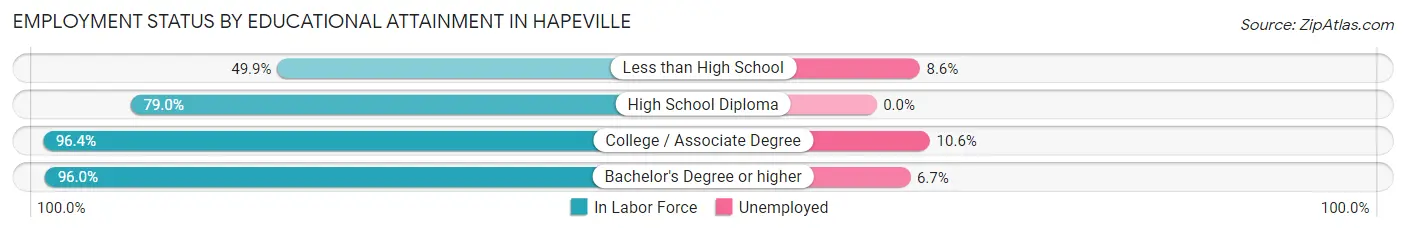
| Educational Attainment | In Labor Force | Unemployed |
| Less than High School | 256 (49.9%) | 44 (8.6%) |
| High School Diploma | 728 (79.0%) | 0 (0.0%) |
| College / Associate Degree | 1,074 (96.4%) | 118 (10.6%) |
| Bachelor's Degree or higher | 1,188 (96.0%) | 83 (6.7%) |
| Total | 3,245 (85.7%) | 254 (6.7%) |
Employment Occupations by Sex in Hapeville
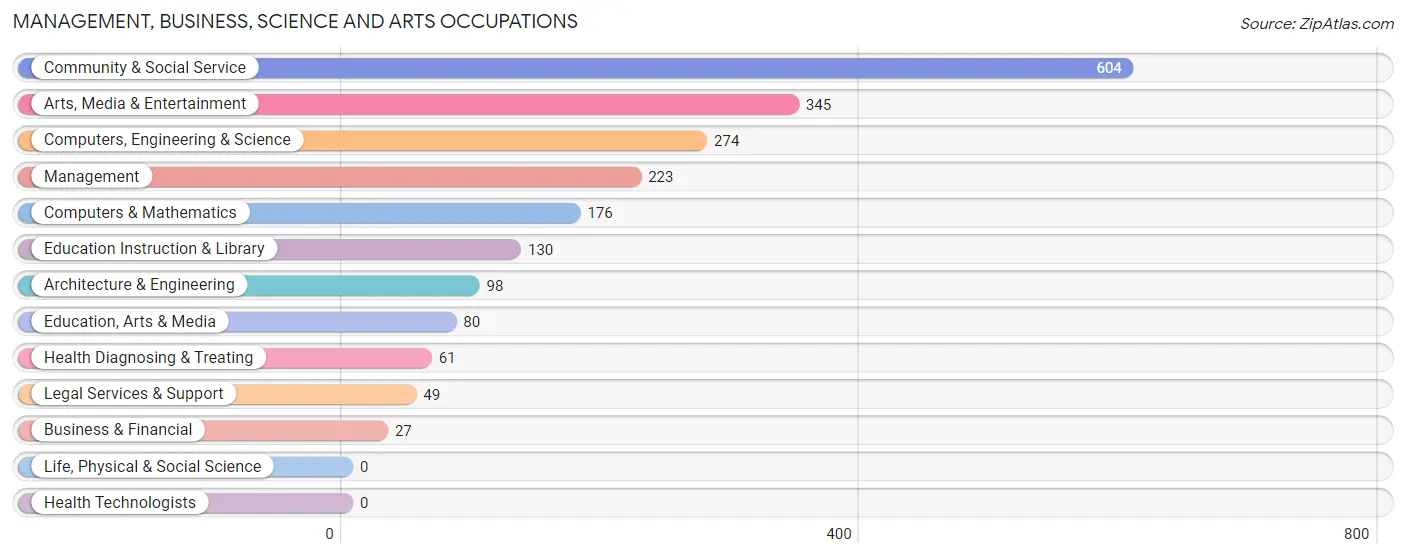
Management, Business, Science and Arts Occupations
The most common Management, Business, Science and Arts occupations in Hapeville are Community & Social Service (604 | 16.0%), Arts, Media & Entertainment (345 | 9.1%), Computers, Engineering & Science (274 | 7.3%), Management (223 | 5.9%), and Computers & Mathematics (176 | 4.7%).
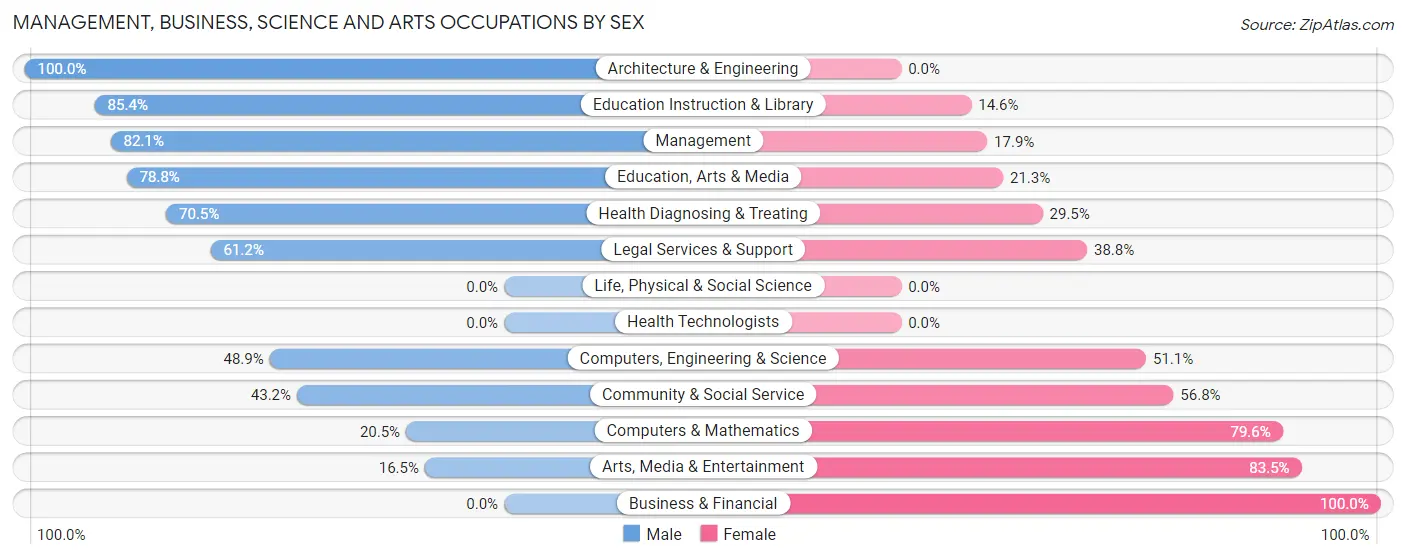
Management, Business, Science and Arts Occupations by Sex
Within the Management, Business, Science and Arts occupations in Hapeville, the most male-oriented occupations are Architecture & Engineering (100.0%), Education Instruction & Library (85.4%), and Management (82.1%), while the most female-oriented occupations are Business & Financial (100.0%), Arts, Media & Entertainment (83.5%), and Computers & Mathematics (79.5%).
| Occupation | Male | Female |
| Management | 183 (82.1%) | 40 (17.9%) |
| Business & Financial | 0 (0.0%) | 27 (100.0%) |
| Computers, Engineering & Science | 134 (48.9%) | 140 (51.1%) |
| Computers & Mathematics | 36 (20.4%) | 140 (79.5%) |
| Architecture & Engineering | 98 (100.0%) | 0 (0.0%) |
| Life, Physical & Social Science | 0 (0.0%) | 0 (0.0%) |
| Community & Social Service | 261 (43.2%) | 343 (56.8%) |
| Education, Arts & Media | 63 (78.7%) | 17 (21.2%) |
| Legal Services & Support | 30 (61.2%) | 19 (38.8%) |
| Education Instruction & Library | 111 (85.4%) | 19 (14.6%) |
| Arts, Media & Entertainment | 57 (16.5%) | 288 (83.5%) |
| Health Diagnosing & Treating | 43 (70.5%) | 18 (29.5%) |
| Health Technologists | 0 (0.0%) | 0 (0.0%) |
| Total (Category) | 621 (52.2%) | 568 (47.8%) |
| Total (Overall) | 2,319 (61.5%) | 1,451 (38.5%) |
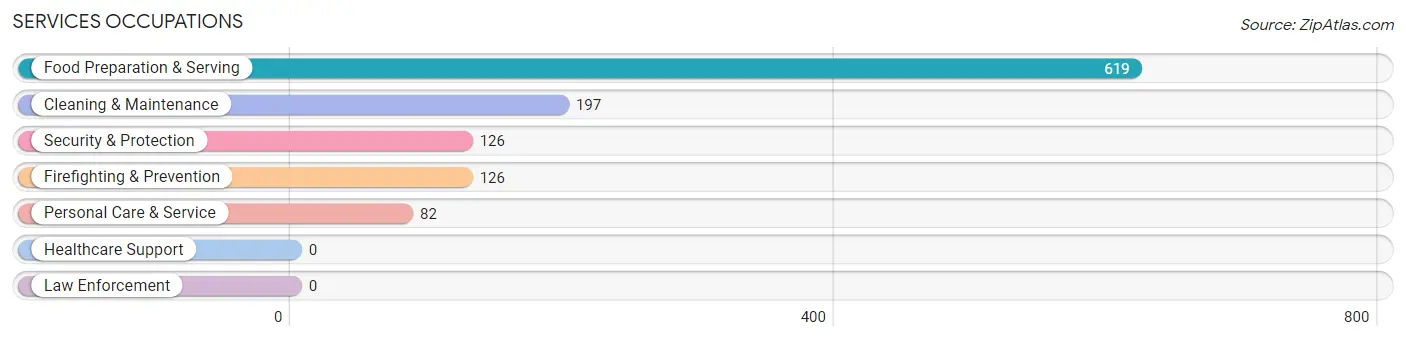
Services Occupations
The most common Services occupations in Hapeville are Food Preparation & Serving (619 | 16.4%), Cleaning & Maintenance (197 | 5.2%), Security & Protection (126 | 3.3%), Firefighting & Prevention (126 | 3.3%), and Personal Care & Service (82 | 2.2%).
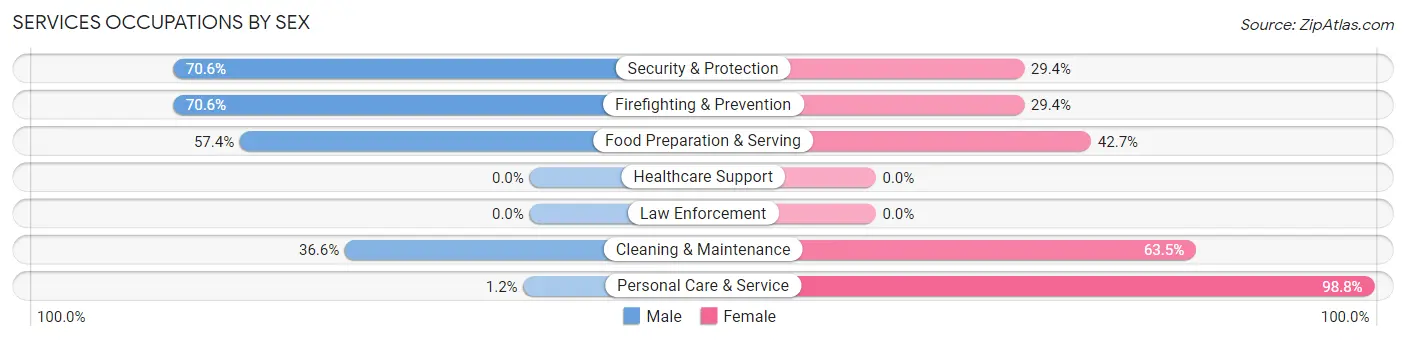
Services Occupations by Sex
Within the Services occupations in Hapeville, the most male-oriented occupations are Security & Protection (70.6%), Firefighting & Prevention (70.6%), and Food Preparation & Serving (57.4%), while the most female-oriented occupations are Personal Care & Service (98.8%), Cleaning & Maintenance (63.4%), and Food Preparation & Serving (42.6%).
| Occupation | Male | Female |
| Healthcare Support | 0 (0.0%) | 0 (0.0%) |
| Security & Protection | 89 (70.6%) | 37 (29.4%) |
| Firefighting & Prevention | 89 (70.6%) | 37 (29.4%) |
| Law Enforcement | 0 (0.0%) | 0 (0.0%) |
| Food Preparation & Serving | 355 (57.4%) | 264 (42.6%) |
| Cleaning & Maintenance | 72 (36.5%) | 125 (63.4%) |
| Personal Care & Service | 1 (1.2%) | 81 (98.8%) |
| Total (Category) | 517 (50.5%) | 507 (49.5%) |
| Total (Overall) | 2,319 (61.5%) | 1,451 (38.5%) |
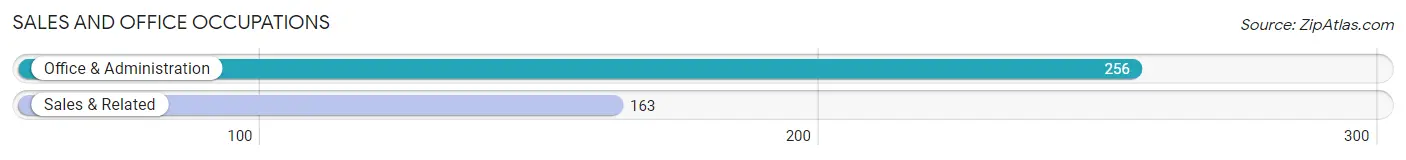
Sales and Office Occupations
The most common Sales and Office occupations in Hapeville are Office & Administration (256 | 6.8%), and Sales & Related (163 | 4.3%).
Sales and Office Occupations by Sex
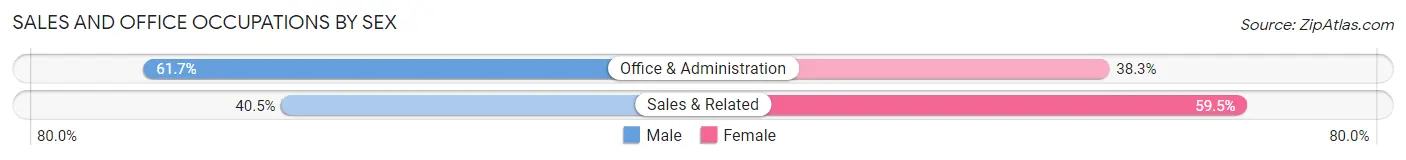
| Occupation | Male | Female |
| Sales & Related | 66 (40.5%) | 97 (59.5%) |
| Office & Administration | 158 (61.7%) | 98 (38.3%) |
| Total (Category) | 224 (53.5%) | 195 (46.5%) |
| Total (Overall) | 2,319 (61.5%) | 1,451 (38.5%) |
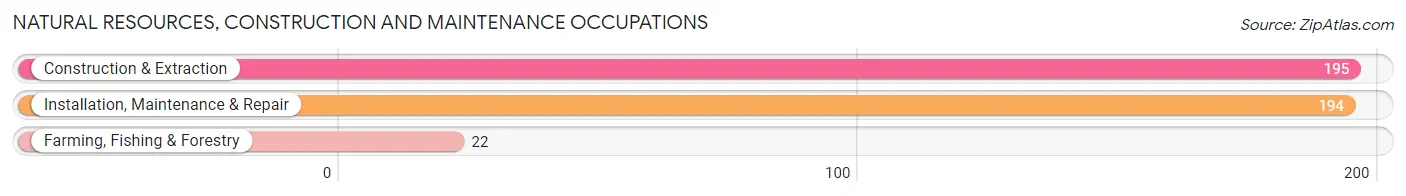
Natural Resources, Construction and Maintenance Occupations
The most common Natural Resources, Construction and Maintenance occupations in Hapeville are Construction & Extraction (195 | 5.2%), Installation, Maintenance & Repair (194 | 5.1%), and Farming, Fishing & Forestry (22 | 0.6%).
Natural Resources, Construction and Maintenance Occupations by Sex
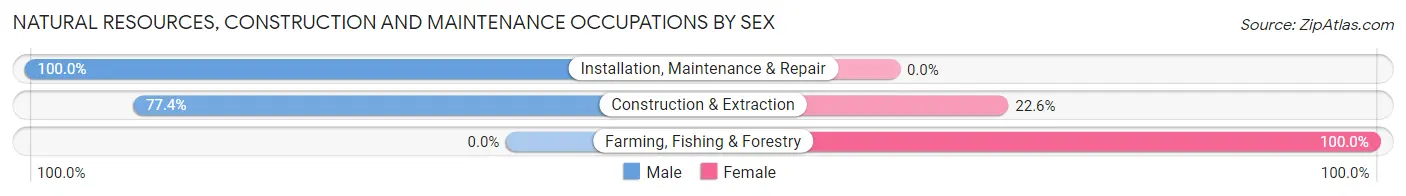
| Occupation | Male | Female |
| Farming, Fishing & Forestry | 0 (0.0%) | 22 (100.0%) |
| Construction & Extraction | 151 (77.4%) | 44 (22.6%) |
| Installation, Maintenance & Repair | 194 (100.0%) | 0 (0.0%) |
| Total (Category) | 345 (83.9%) | 66 (16.1%) |
| Total (Overall) | 2,319 (61.5%) | 1,451 (38.5%) |
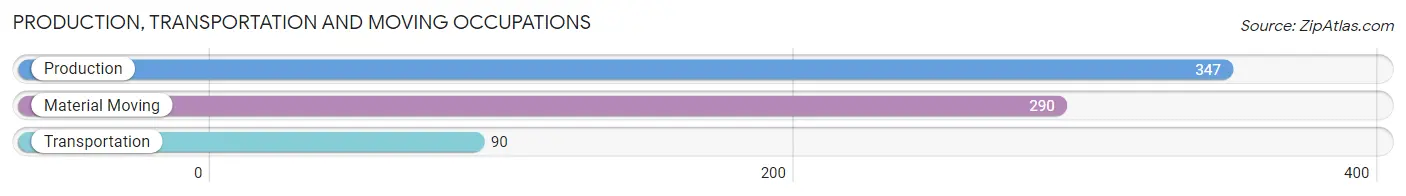
Production, Transportation and Moving Occupations
The most common Production, Transportation and Moving occupations in Hapeville are Production (347 | 9.2%), Material Moving (290 | 7.7%), and Transportation (90 | 2.4%).
Production, Transportation and Moving Occupations by Sex
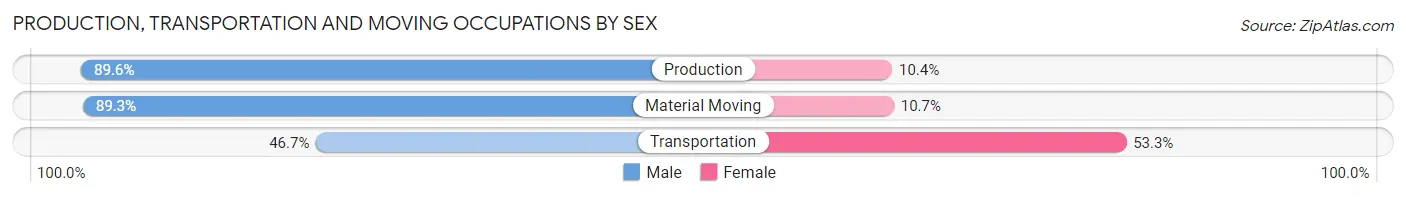
| Occupation | Male | Female |
| Production | 311 (89.6%) | 36 (10.4%) |
| Transportation | 42 (46.7%) | 48 (53.3%) |
| Material Moving | 259 (89.3%) | 31 (10.7%) |
| Total (Category) | 612 (84.2%) | 115 (15.8%) |
| Total (Overall) | 2,319 (61.5%) | 1,451 (38.5%) |
Employment Industries by Sex in Hapeville
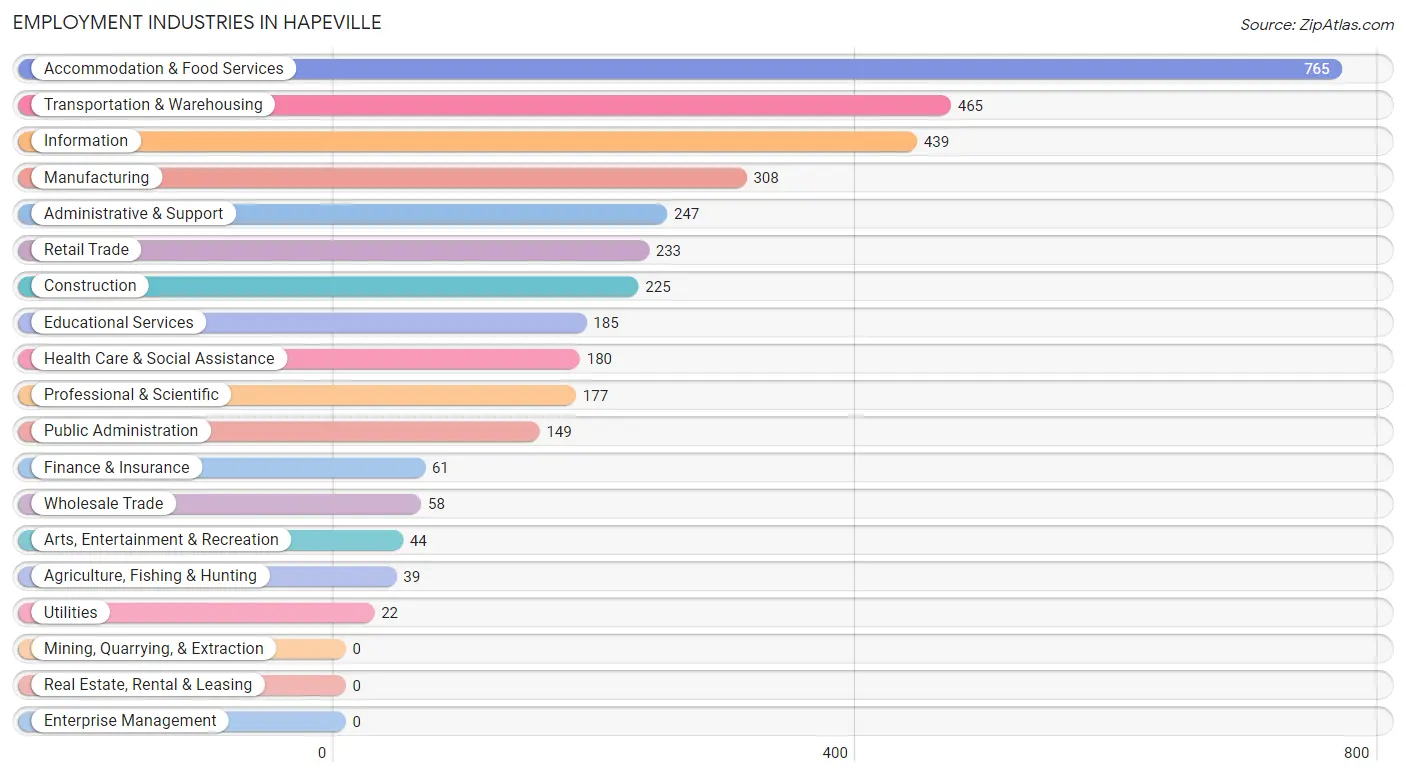
Employment Industries in Hapeville
The major employment industries in Hapeville include Accommodation & Food Services (765 | 20.3%), Transportation & Warehousing (465 | 12.3%), Information (439 | 11.6%), Manufacturing (308 | 8.2%), and Administrative & Support (247 | 6.6%).
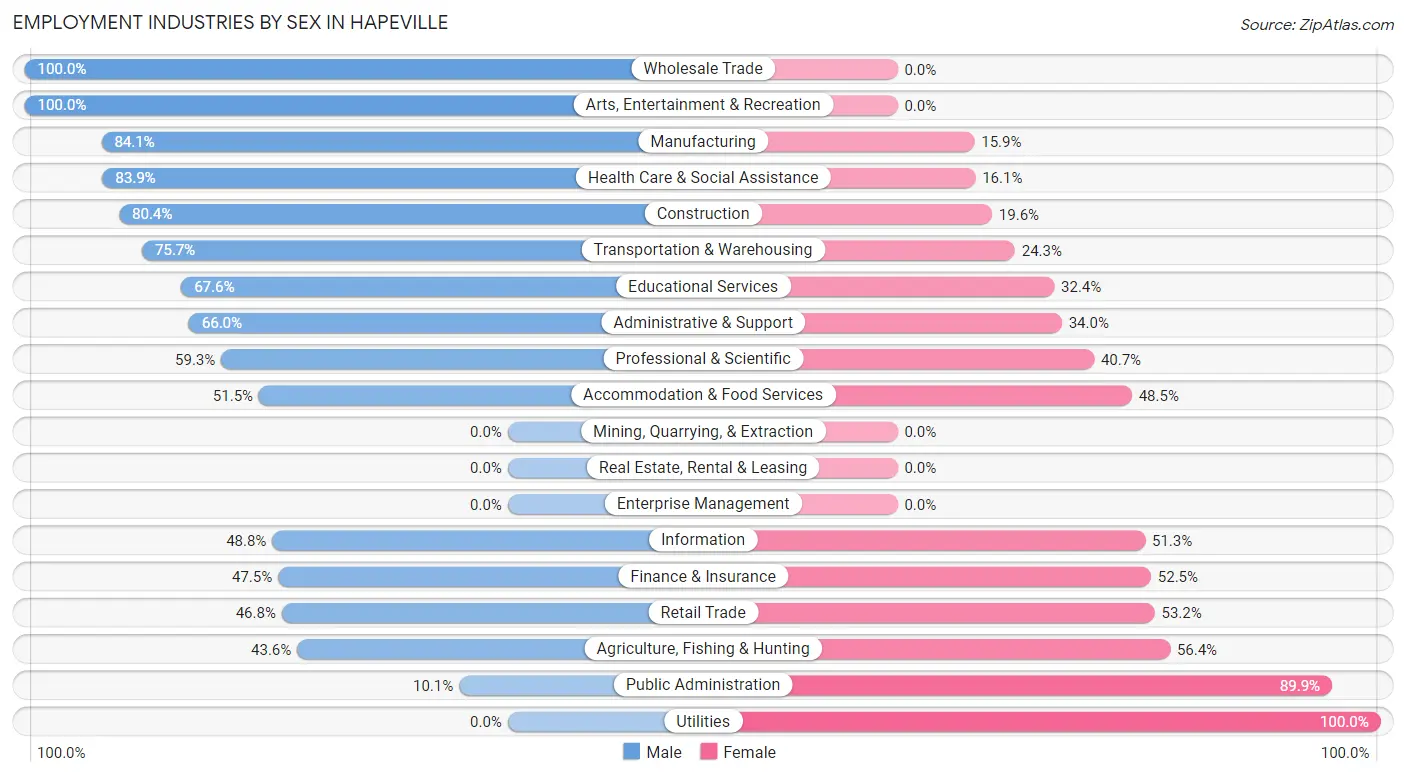
Employment Industries by Sex in Hapeville
The Hapeville industries that see more men than women are Wholesale Trade (100.0%), Arts, Entertainment & Recreation (100.0%), and Manufacturing (84.1%), whereas the industries that tend to have a higher number of women are Utilities (100.0%), Public Administration (89.9%), and Agriculture, Fishing & Hunting (56.4%).
| Industry | Male | Female |
| Agriculture, Fishing & Hunting | 17 (43.6%) | 22 (56.4%) |
| Mining, Quarrying, & Extraction | 0 (0.0%) | 0 (0.0%) |
| Construction | 181 (80.4%) | 44 (19.6%) |
| Manufacturing | 259 (84.1%) | 49 (15.9%) |
| Wholesale Trade | 58 (100.0%) | 0 (0.0%) |
| Retail Trade | 109 (46.8%) | 124 (53.2%) |
| Transportation & Warehousing | 352 (75.7%) | 113 (24.3%) |
| Utilities | 0 (0.0%) | 22 (100.0%) |
| Information | 214 (48.7%) | 225 (51.2%) |
| Finance & Insurance | 29 (47.5%) | 32 (52.5%) |
| Real Estate, Rental & Leasing | 0 (0.0%) | 0 (0.0%) |
| Professional & Scientific | 105 (59.3%) | 72 (40.7%) |
| Enterprise Management | 0 (0.0%) | 0 (0.0%) |
| Administrative & Support | 163 (66.0%) | 84 (34.0%) |
| Educational Services | 125 (67.6%) | 60 (32.4%) |
| Health Care & Social Assistance | 151 (83.9%) | 29 (16.1%) |
| Arts, Entertainment & Recreation | 44 (100.0%) | 0 (0.0%) |
| Accommodation & Food Services | 394 (51.5%) | 371 (48.5%) |
| Public Administration | 15 (10.1%) | 134 (89.9%) |
| Total | 2,319 (61.5%) | 1,451 (38.5%) |
Education in Hapeville
School Enrollment in Hapeville
The most common levels of schooling among the 1,493 students in Hapeville are middle school (401 | 26.9%), high school (324 | 21.7%), and college / undergraduate (319 | 21.4%).
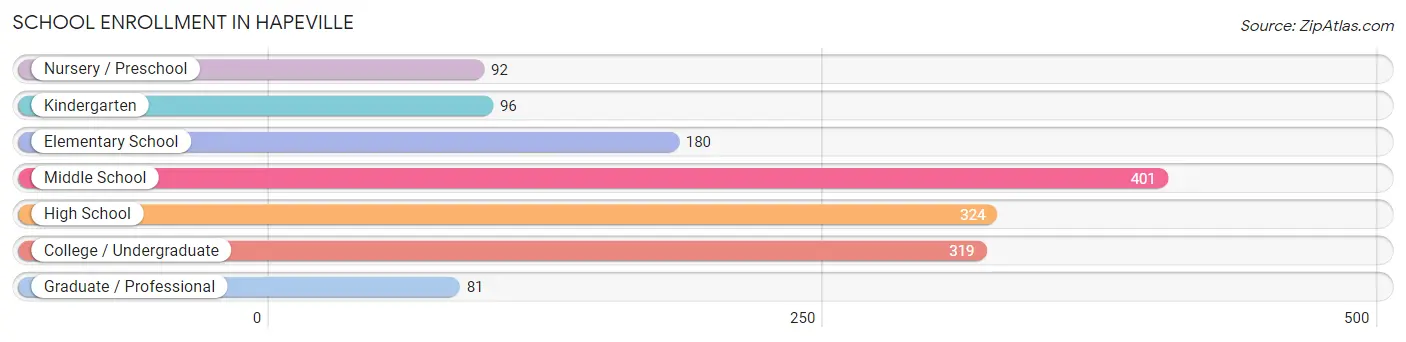
| School Level | # Students | % Students |
| Nursery / Preschool | 92 | 6.2% |
| Kindergarten | 96 | 6.4% |
| Elementary School | 180 | 12.1% |
| Middle School | 401 | 26.9% |
| High School | 324 | 21.7% |
| College / Undergraduate | 319 | 21.4% |
| Graduate / Professional | 81 | 5.4% |
| Total | 1,493 | 100.0% |
School Enrollment by Age by Funding Source in Hapeville
Out of a total of 1,493 students who are enrolled in schools in Hapeville, 105 (7.0%) attend a private institution, while the remaining 1,388 (93.0%) are enrolled in public schools. The age group of 20 to 24 year olds has the highest likelihood of being enrolled in private schools, with 31 (27.4% in the age bracket) enrolled. Conversely, the age group of 10 to 14 year olds has the lowest likelihood of being enrolled in a private school, with 427 (100.0% in the age bracket) attending a public institution.
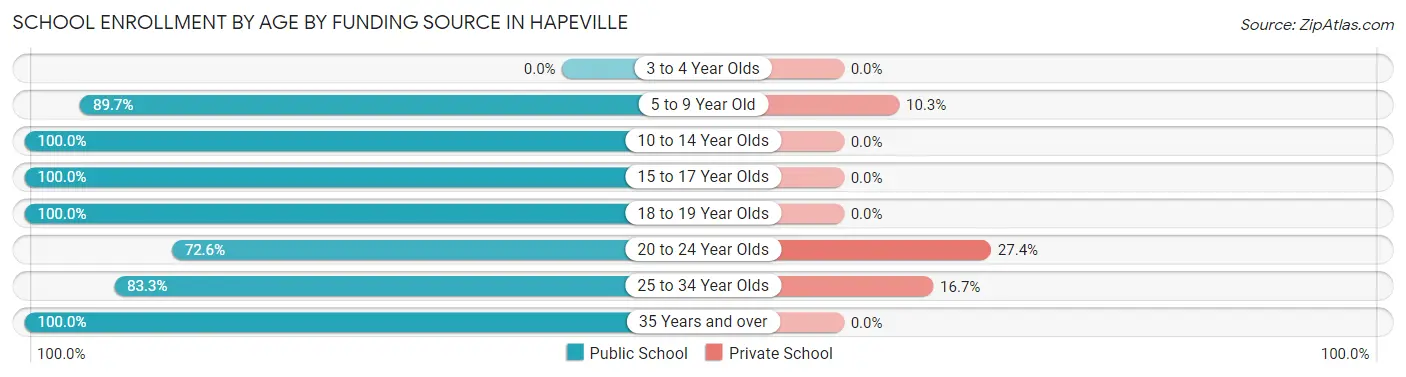
| Age Bracket | Public School | Private School |
| 3 to 4 Year Olds | 0 (0.0%) | 0 (0.0%) |
| 5 to 9 Year Old | 330 (89.7%) | 38 (10.3%) |
| 10 to 14 Year Olds | 427 (100.0%) | 0 (0.0%) |
| 15 to 17 Year Olds | 263 (100.0%) | 0 (0.0%) |
| 18 to 19 Year Olds | 95 (100.0%) | 0 (0.0%) |
| 20 to 24 Year Olds | 82 (72.6%) | 31 (27.4%) |
| 25 to 34 Year Olds | 175 (83.3%) | 35 (16.7%) |
| 35 Years and over | 17 (100.0%) | 0 (0.0%) |
| Total | 1,388 (93.0%) | 105 (7.0%) |
Educational Attainment by Field of Study in Hapeville
Communications (369 | 23.8%), business (211 | 13.6%), education (151 | 9.7%), bio, nature & agricultural (138 | 8.9%), and science & technology (131 | 8.4%) are the most common fields of study among 1,552 individuals in Hapeville who have obtained a bachelor's degree or higher.
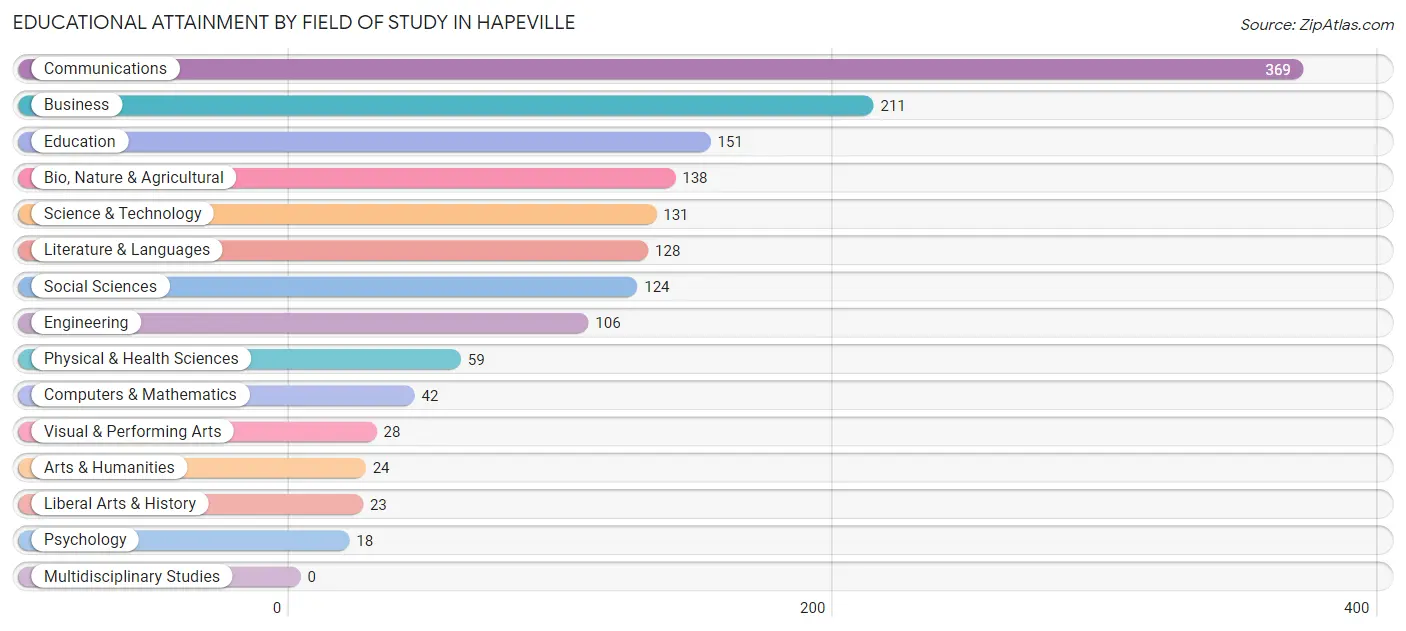
| Field of Study | # Graduates | % Graduates |
| Computers & Mathematics | 42 | 2.7% |
| Bio, Nature & Agricultural | 138 | 8.9% |
| Physical & Health Sciences | 59 | 3.8% |
| Psychology | 18 | 1.2% |
| Social Sciences | 124 | 8.0% |
| Engineering | 106 | 6.8% |
| Multidisciplinary Studies | 0 | 0.0% |
| Science & Technology | 131 | 8.4% |
| Business | 211 | 13.6% |
| Education | 151 | 9.7% |
| Literature & Languages | 128 | 8.3% |
| Liberal Arts & History | 23 | 1.5% |
| Visual & Performing Arts | 28 | 1.8% |
| Communications | 369 | 23.8% |
| Arts & Humanities | 24 | 1.5% |
| Total | 1,552 | 100.0% |
Transportation & Commute in Hapeville
Vehicle Availability by Sex in Hapeville
The most prevalent vehicle ownership categories in Hapeville are males with 2 vehicles (1,129, accounting for 51.0%) and females with 2 vehicles (593, making up 79.0%).
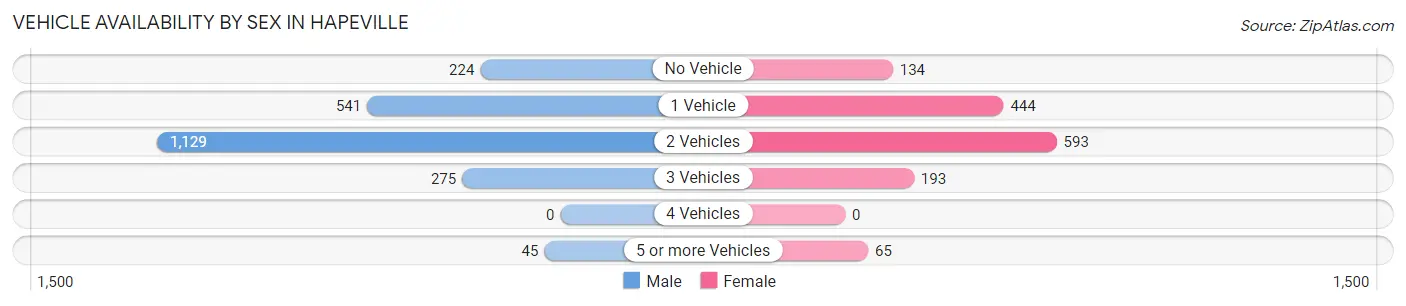
| Vehicles Available | Male | Female |
| No Vehicle | 224 (10.1%) | 134 (9.4%) |
| 1 Vehicle | 541 (24.4%) | 444 (31.1%) |
| 2 Vehicles | 1,129 (51.0%) | 593 (41.5%) |
| 3 Vehicles | 275 (12.4%) | 193 (13.5%) |
| 4 Vehicles | 0 (0.0%) | 0 (0.0%) |
| 5 or more Vehicles | 45 (2.0%) | 65 (4.5%) |
| Total | 2,214 (100.0%) | 1,429 (100.0%) |
Commute Time in Hapeville
The most frequently occuring commute durations in Hapeville are 10 to 14 minutes (737 commuters, 23.5%), 20 to 24 minutes (616 commuters, 19.7%), and 30 to 34 minutes (450 commuters, 14.4%).
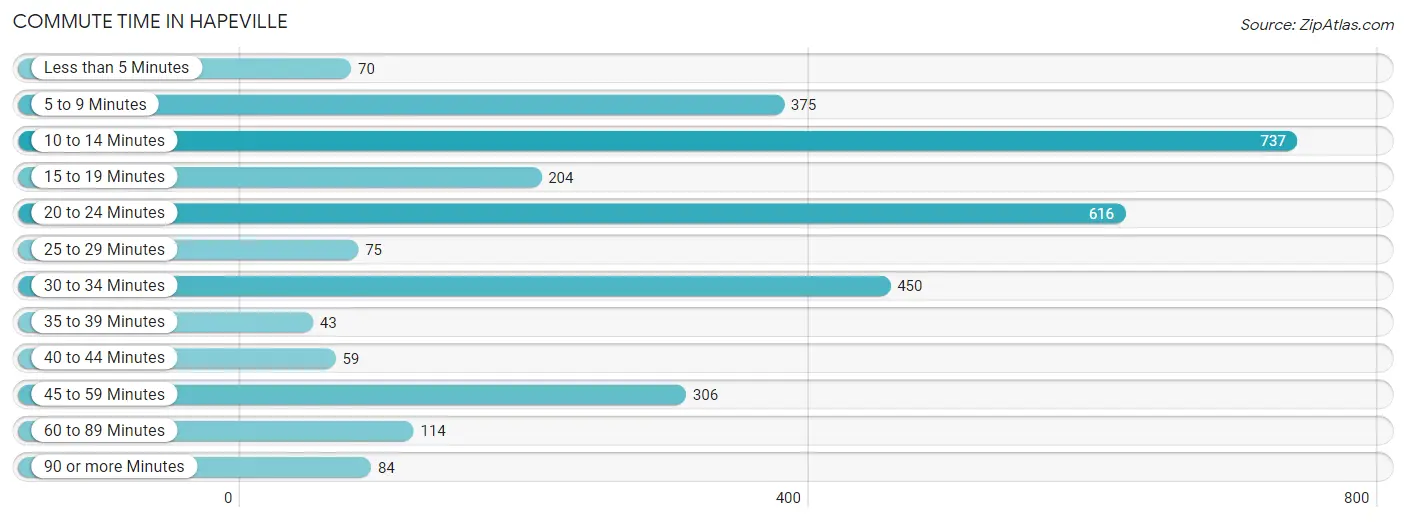
| Commute Time | # Commuters | % Commuters |
| Less than 5 Minutes | 70 | 2.2% |
| 5 to 9 Minutes | 375 | 12.0% |
| 10 to 14 Minutes | 737 | 23.5% |
| 15 to 19 Minutes | 204 | 6.5% |
| 20 to 24 Minutes | 616 | 19.7% |
| 25 to 29 Minutes | 75 | 2.4% |
| 30 to 34 Minutes | 450 | 14.4% |
| 35 to 39 Minutes | 43 | 1.4% |
| 40 to 44 Minutes | 59 | 1.9% |
| 45 to 59 Minutes | 306 | 9.8% |
| 60 to 89 Minutes | 114 | 3.6% |
| 90 or more Minutes | 84 | 2.7% |
Commute Time by Sex in Hapeville
The most common commute times in Hapeville are 10 to 14 minutes (601 commuters, 30.9%) for males and 5 to 9 minutes (338 commuters, 28.4%) for females.
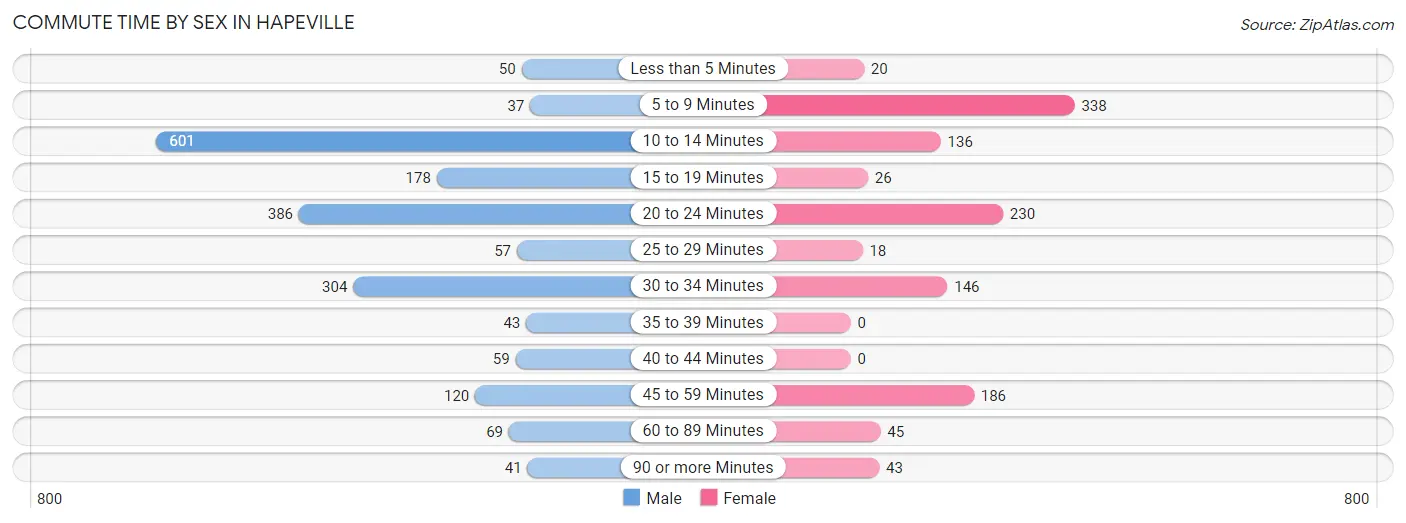
| Commute Time | Male | Female |
| Less than 5 Minutes | 50 (2.6%) | 20 (1.7%) |
| 5 to 9 Minutes | 37 (1.9%) | 338 (28.4%) |
| 10 to 14 Minutes | 601 (30.9%) | 136 (11.5%) |
| 15 to 19 Minutes | 178 (9.1%) | 26 (2.2%) |
| 20 to 24 Minutes | 386 (19.9%) | 230 (19.4%) |
| 25 to 29 Minutes | 57 (2.9%) | 18 (1.5%) |
| 30 to 34 Minutes | 304 (15.6%) | 146 (12.3%) |
| 35 to 39 Minutes | 43 (2.2%) | 0 (0.0%) |
| 40 to 44 Minutes | 59 (3.0%) | 0 (0.0%) |
| 45 to 59 Minutes | 120 (6.2%) | 186 (15.7%) |
| 60 to 89 Minutes | 69 (3.5%) | 45 (3.8%) |
| 90 or more Minutes | 41 (2.1%) | 43 (3.6%) |
Time of Departure to Work by Sex in Hapeville
The most frequent times of departure to work in Hapeville are 9:00 AM to 9:59 AM (404, 20.8%) for males and 7:30 AM to 7:59 AM (288, 24.2%) for females.
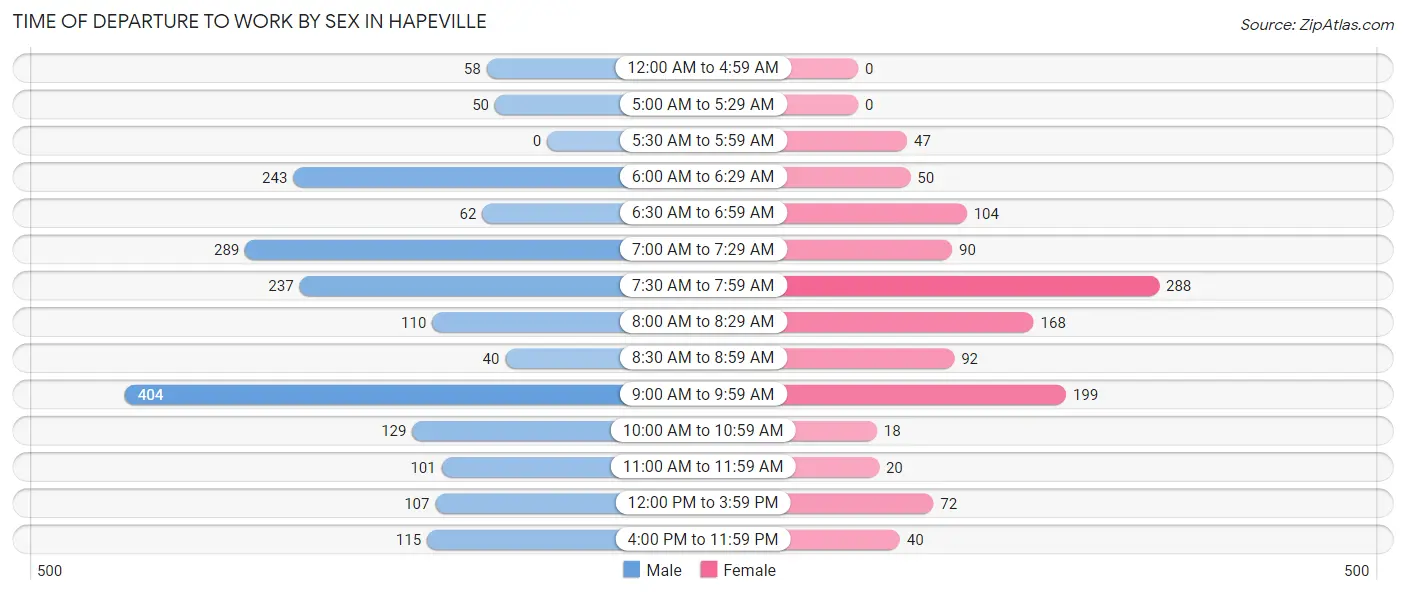
| Time of Departure | Male | Female |
| 12:00 AM to 4:59 AM | 58 (3.0%) | 0 (0.0%) |
| 5:00 AM to 5:29 AM | 50 (2.6%) | 0 (0.0%) |
| 5:30 AM to 5:59 AM | 0 (0.0%) | 47 (4.0%) |
| 6:00 AM to 6:29 AM | 243 (12.5%) | 50 (4.2%) |
| 6:30 AM to 6:59 AM | 62 (3.2%) | 104 (8.7%) |
| 7:00 AM to 7:29 AM | 289 (14.9%) | 90 (7.6%) |
| 7:30 AM to 7:59 AM | 237 (12.2%) | 288 (24.2%) |
| 8:00 AM to 8:29 AM | 110 (5.7%) | 168 (14.1%) |
| 8:30 AM to 8:59 AM | 40 (2.1%) | 92 (7.7%) |
| 9:00 AM to 9:59 AM | 404 (20.8%) | 199 (16.8%) |
| 10:00 AM to 10:59 AM | 129 (6.6%) | 18 (1.5%) |
| 11:00 AM to 11:59 AM | 101 (5.2%) | 20 (1.7%) |
| 12:00 PM to 3:59 PM | 107 (5.5%) | 72 (6.1%) |
| 4:00 PM to 11:59 PM | 115 (5.9%) | 40 (3.4%) |
| Total | 1,945 (100.0%) | 1,188 (100.0%) |
Housing Occupancy in Hapeville
Occupancy by Ownership in Hapeville
Of the total 2,908 dwellings in Hapeville, owner-occupied units account for 1,554 (53.4%), while renter-occupied units make up 1,354 (46.6%).
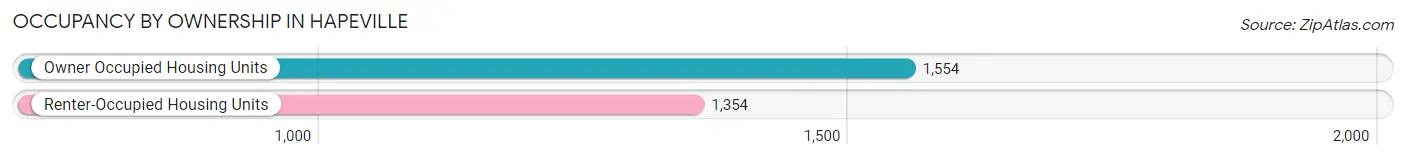
| Occupancy | # Housing Units | % Housing Units |
| Owner Occupied Housing Units | 1,554 | 53.4% |
| Renter-Occupied Housing Units | 1,354 | 46.6% |
| Total Occupied Housing Units | 2,908 | 100.0% |
Occupancy by Household Size in Hapeville
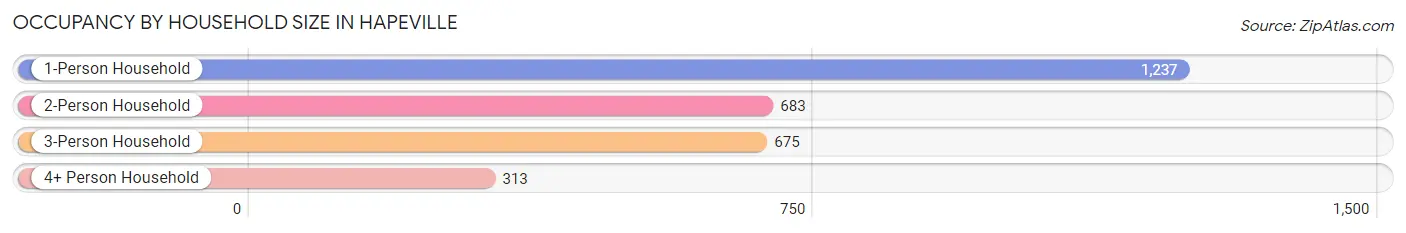
| Household Size | # Housing Units | % Housing Units |
| 1-Person Household | 1,237 | 42.5% |
| 2-Person Household | 683 | 23.5% |
| 3-Person Household | 675 | 23.2% |
| 4+ Person Household | 313 | 10.8% |
| Total Housing Units | 2,908 | 100.0% |
Occupancy by Ownership by Household Size in Hapeville
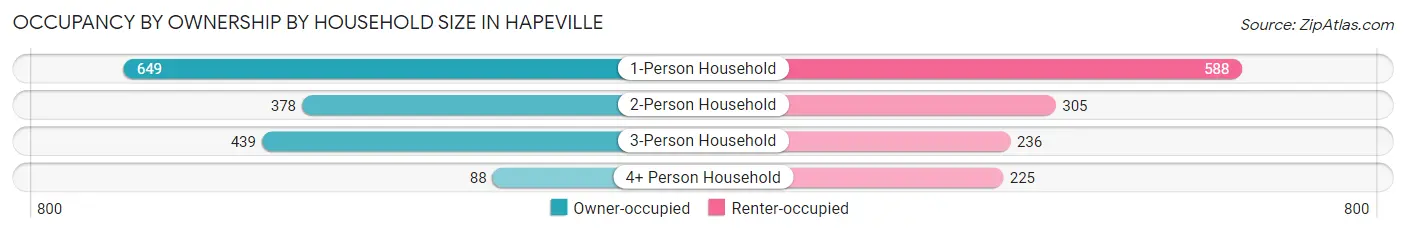
| Household Size | Owner-occupied | Renter-occupied |
| 1-Person Household | 649 (52.5%) | 588 (47.5%) |
| 2-Person Household | 378 (55.3%) | 305 (44.7%) |
| 3-Person Household | 439 (65.0%) | 236 (35.0%) |
| 4+ Person Household | 88 (28.1%) | 225 (71.9%) |
| Total Housing Units | 1,554 (53.4%) | 1,354 (46.6%) |
Occupancy by Educational Attainment in Hapeville
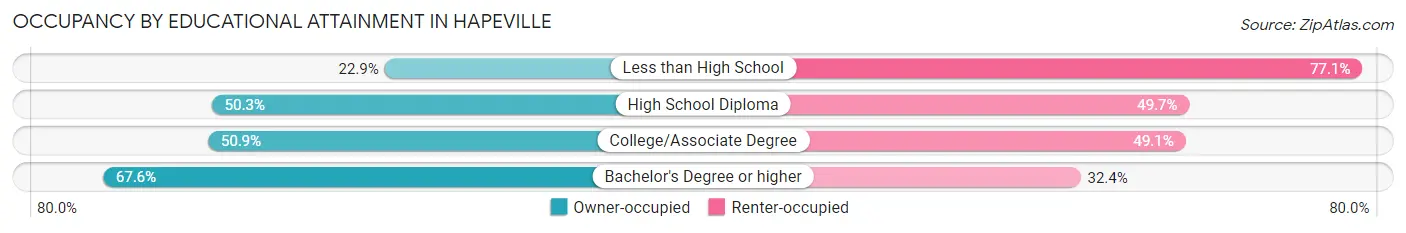
| Household Size | Owner-occupied | Renter-occupied |
| Less than High School | 85 (22.9%) | 286 (77.1%) |
| High School Diploma | 377 (50.3%) | 372 (49.7%) |
| College/Associate Degree | 356 (50.9%) | 343 (49.1%) |
| Bachelor's Degree or higher | 736 (67.6%) | 353 (32.4%) |
Occupancy by Age of Householder in Hapeville
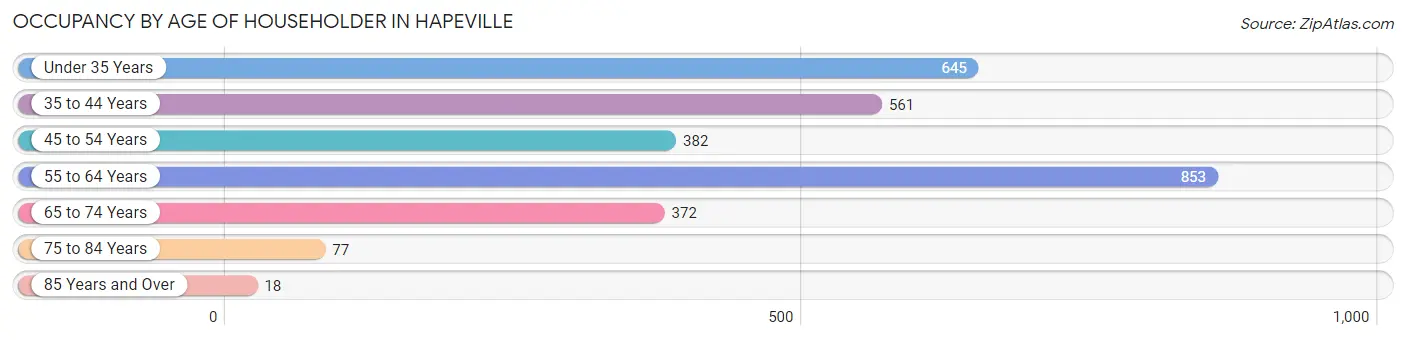
| Age Bracket | # Households | % Households |
| Under 35 Years | 645 | 22.2% |
| 35 to 44 Years | 561 | 19.3% |
| 45 to 54 Years | 382 | 13.1% |
| 55 to 64 Years | 853 | 29.3% |
| 65 to 74 Years | 372 | 12.8% |
| 75 to 84 Years | 77 | 2.6% |
| 85 Years and Over | 18 | 0.6% |
| Total | 2,908 | 100.0% |
Housing Finances in Hapeville
Median Income by Occupancy in Hapeville
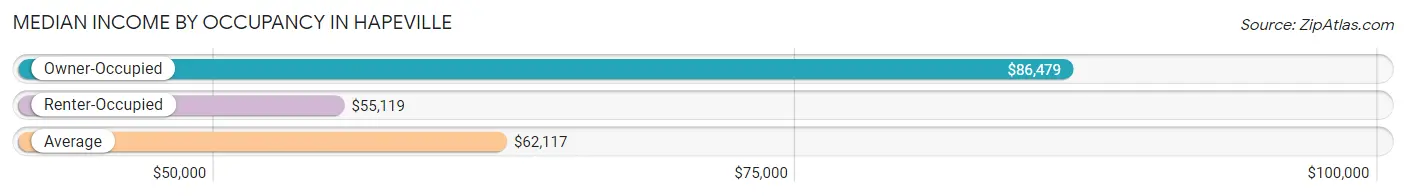
| Occupancy Type | # Households | Median Income |
| Owner-Occupied | 1,554 (53.4%) | $86,479 |
| Renter-Occupied | 1,354 (46.6%) | $55,119 |
| Average | 2,908 (100.0%) | $62,117 |
Occupancy by Householder Income Bracket in Hapeville
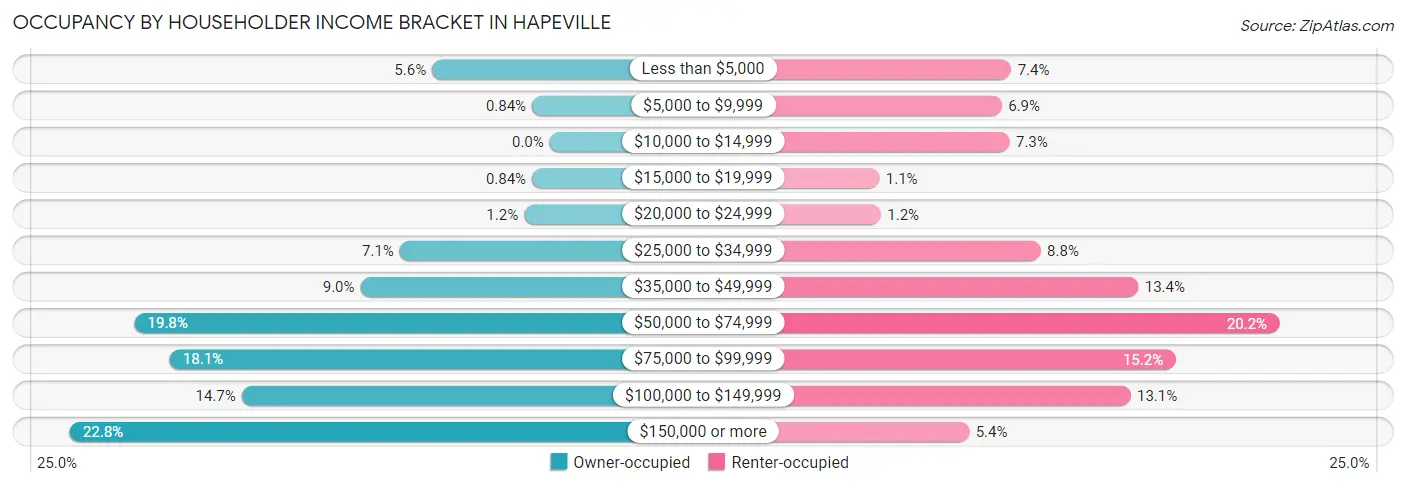
| Income Bracket | Owner-occupied | Renter-occupied |
| Less than $5,000 | 87 (5.6%) | 100 (7.4%) |
| $5,000 to $9,999 | 13 (0.8%) | 94 (6.9%) |
| $10,000 to $14,999 | 0 (0.0%) | 99 (7.3%) |
| $15,000 to $19,999 | 13 (0.8%) | 15 (1.1%) |
| $20,000 to $24,999 | 19 (1.2%) | 16 (1.2%) |
| $25,000 to $34,999 | 111 (7.1%) | 119 (8.8%) |
| $35,000 to $49,999 | 140 (9.0%) | 182 (13.4%) |
| $50,000 to $74,999 | 307 (19.8%) | 273 (20.2%) |
| $75,000 to $99,999 | 281 (18.1%) | 206 (15.2%) |
| $100,000 to $149,999 | 228 (14.7%) | 177 (13.1%) |
| $150,000 or more | 355 (22.8%) | 73 (5.4%) |
| Total | 1,554 (100.0%) | 1,354 (100.0%) |
Monthly Housing Cost Tiers in Hapeville
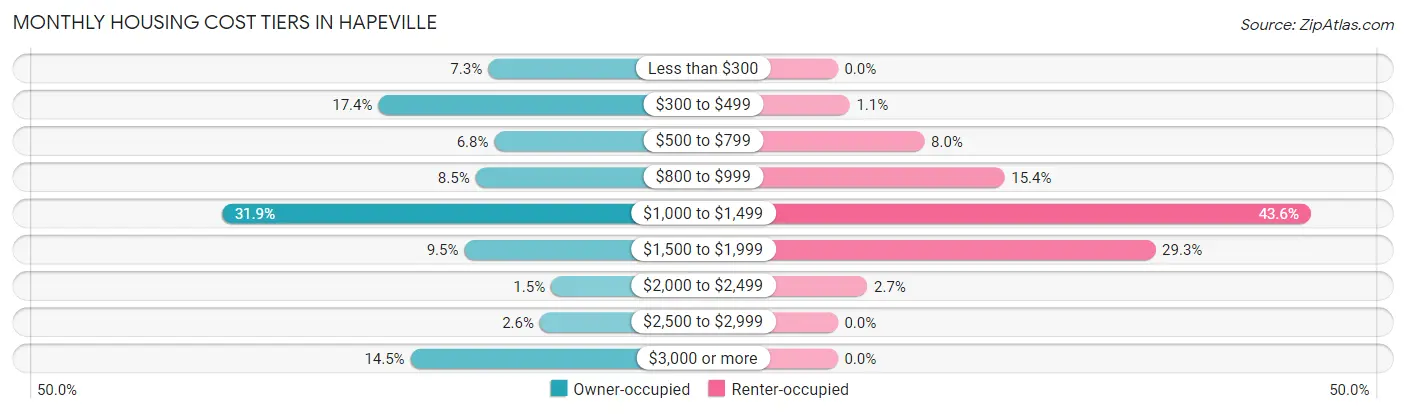
| Monthly Cost | Owner-occupied | Renter-occupied |
| Less than $300 | 114 (7.3%) | 0 (0.0%) |
| $300 to $499 | 271 (17.4%) | 15 (1.1%) |
| $500 to $799 | 105 (6.8%) | 108 (8.0%) |
| $800 to $999 | 132 (8.5%) | 208 (15.4%) |
| $1,000 to $1,499 | 495 (31.9%) | 590 (43.6%) |
| $1,500 to $1,999 | 148 (9.5%) | 396 (29.2%) |
| $2,000 to $2,499 | 24 (1.5%) | 37 (2.7%) |
| $2,500 to $2,999 | 40 (2.6%) | 0 (0.0%) |
| $3,000 or more | 225 (14.5%) | 0 (0.0%) |
| Total | 1,554 (100.0%) | 1,354 (100.0%) |
Physical Housing Characteristics in Hapeville
Housing Structures in Hapeville
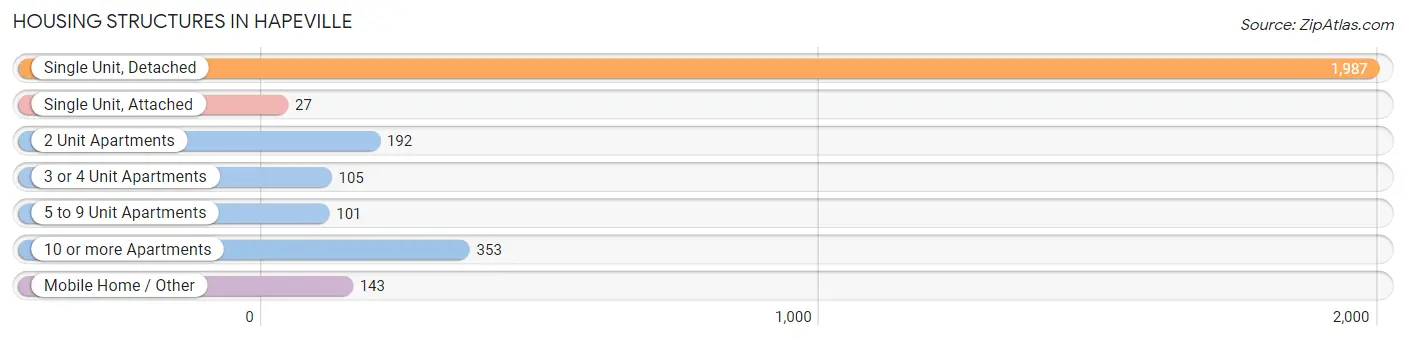
| Structure Type | # Housing Units | % Housing Units |
| Single Unit, Detached | 1,987 | 68.3% |
| Single Unit, Attached | 27 | 0.9% |
| 2 Unit Apartments | 192 | 6.6% |
| 3 or 4 Unit Apartments | 105 | 3.6% |
| 5 to 9 Unit Apartments | 101 | 3.5% |
| 10 or more Apartments | 353 | 12.1% |
| Mobile Home / Other | 143 | 4.9% |
| Total | 2,908 | 100.0% |
Housing Structures by Occupancy in Hapeville
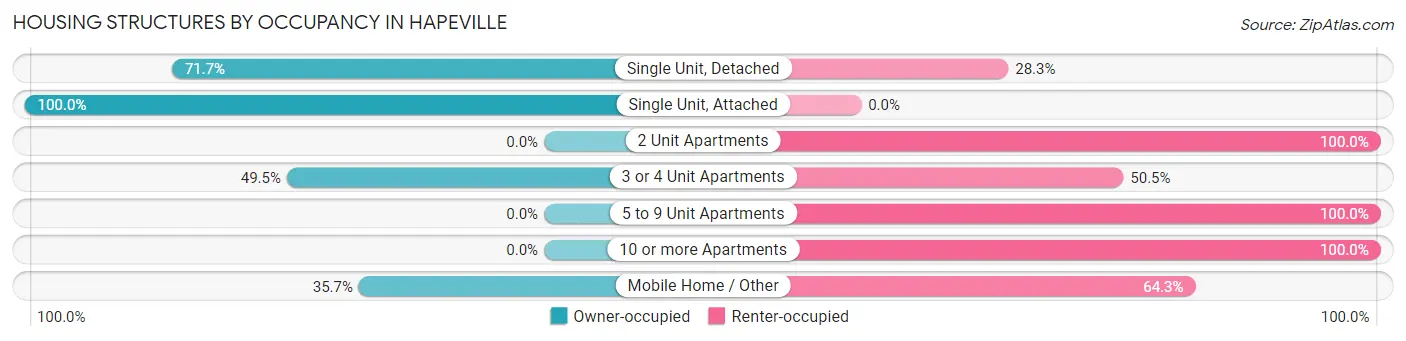
| Structure Type | Owner-occupied | Renter-occupied |
| Single Unit, Detached | 1,424 (71.7%) | 563 (28.3%) |
| Single Unit, Attached | 27 (100.0%) | 0 (0.0%) |
| 2 Unit Apartments | 0 (0.0%) | 192 (100.0%) |
| 3 or 4 Unit Apartments | 52 (49.5%) | 53 (50.5%) |
| 5 to 9 Unit Apartments | 0 (0.0%) | 101 (100.0%) |
| 10 or more Apartments | 0 (0.0%) | 353 (100.0%) |
| Mobile Home / Other | 51 (35.7%) | 92 (64.3%) |
| Total | 1,554 (53.4%) | 1,354 (46.6%) |
Housing Structures by Number of Rooms in Hapeville
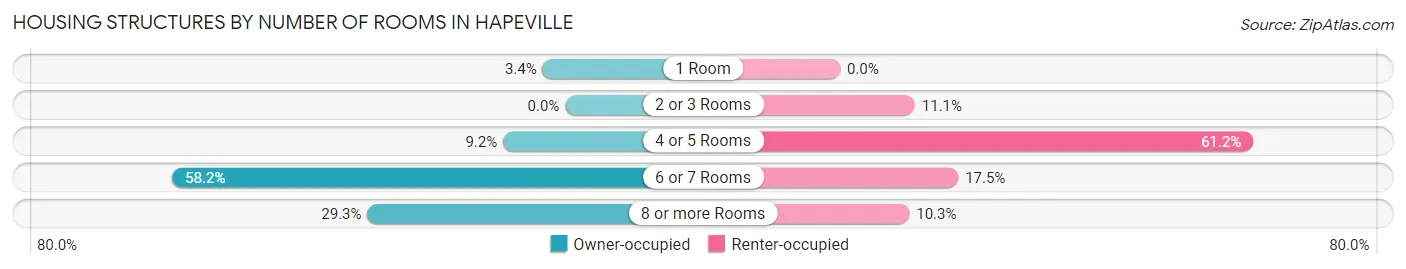
| Number of Rooms | Owner-occupied | Renter-occupied |
| 1 Room | 52 (3.4%) | 0 (0.0%) |
| 2 or 3 Rooms | 0 (0.0%) | 150 (11.1%) |
| 4 or 5 Rooms | 143 (9.2%) | 828 (61.2%) |
| 6 or 7 Rooms | 904 (58.2%) | 237 (17.5%) |
| 8 or more Rooms | 455 (29.3%) | 139 (10.3%) |
| Total | 1,554 (100.0%) | 1,354 (100.0%) |
Housing Structure by Heating Type in Hapeville
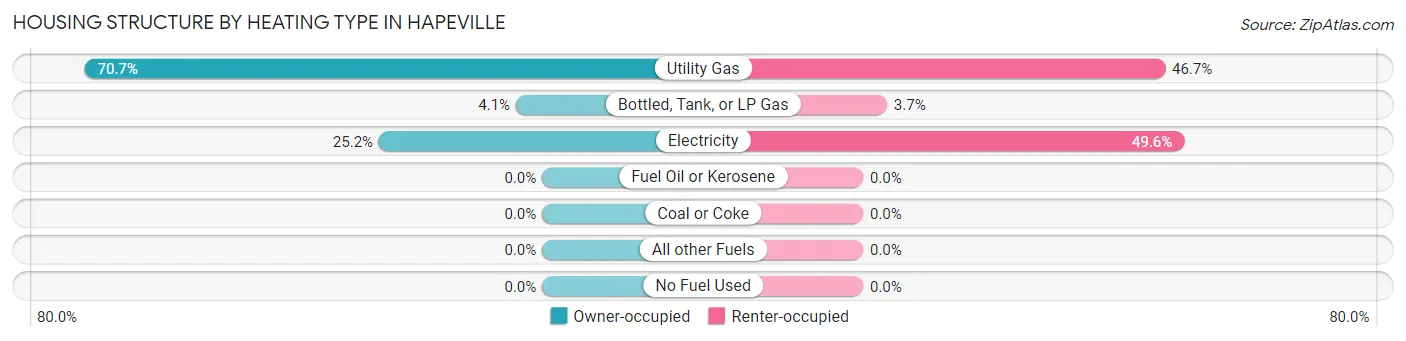
| Heating Type | Owner-occupied | Renter-occupied |
| Utility Gas | 1,099 (70.7%) | 632 (46.7%) |
| Bottled, Tank, or LP Gas | 63 (4.1%) | 50 (3.7%) |
| Electricity | 392 (25.2%) | 672 (49.6%) |
| Fuel Oil or Kerosene | 0 (0.0%) | 0 (0.0%) |
| Coal or Coke | 0 (0.0%) | 0 (0.0%) |
| All other Fuels | 0 (0.0%) | 0 (0.0%) |
| No Fuel Used | 0 (0.0%) | 0 (0.0%) |
| Total | 1,554 (100.0%) | 1,354 (100.0%) |
Household Vehicle Usage in Hapeville
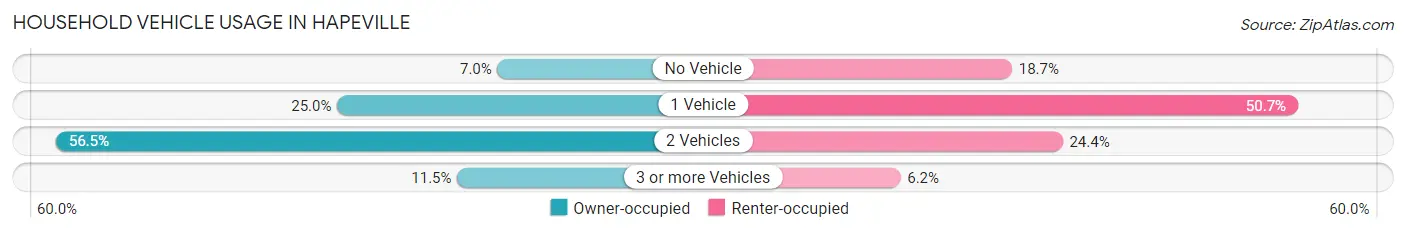
| Vehicles per Household | Owner-occupied | Renter-occupied |
| No Vehicle | 109 (7.0%) | 253 (18.7%) |
| 1 Vehicle | 388 (25.0%) | 687 (50.7%) |
| 2 Vehicles | 878 (56.5%) | 330 (24.4%) |
| 3 or more Vehicles | 179 (11.5%) | 84 (6.2%) |
| Total | 1,554 (100.0%) | 1,354 (100.0%) |
Real Estate & Mortgages in Hapeville
Real Estate and Mortgage Overview in Hapeville
| Characteristic | Without Mortgage | With Mortgage |
| Housing Units | 641 | 913 |
| Median Property Value | $149,200 | $264,000 |
| Median Household Income | $51,589 | $329 |
| Monthly Housing Costs | $410 | $225 |
| Real Estate Taxes | $1,295 | $25 |
Property Value by Mortgage Status in Hapeville
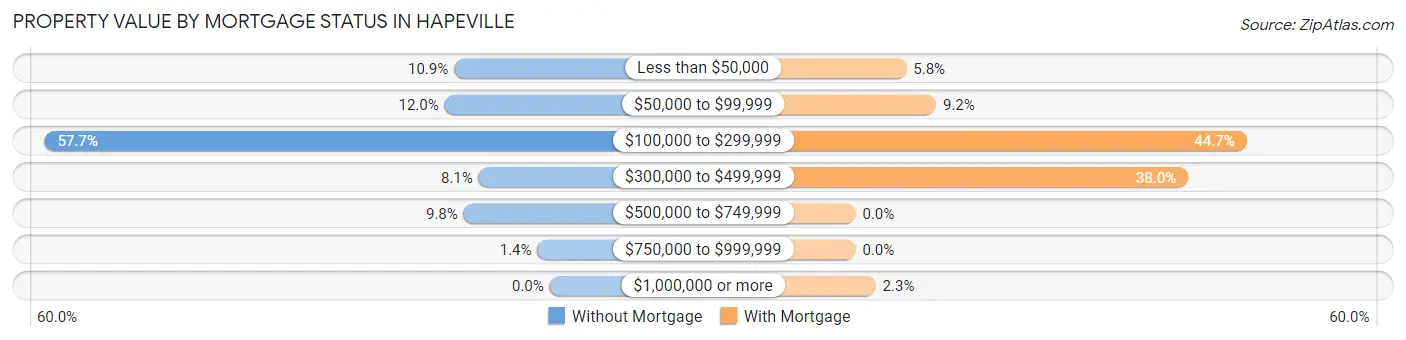
| Property Value | Without Mortgage | With Mortgage |
| Less than $50,000 | 70 (10.9%) | 53 (5.8%) |
| $50,000 to $99,999 | 77 (12.0%) | 84 (9.2%) |
| $100,000 to $299,999 | 370 (57.7%) | 408 (44.7%) |
| $300,000 to $499,999 | 52 (8.1%) | 347 (38.0%) |
| $500,000 to $749,999 | 63 (9.8%) | 0 (0.0%) |
| $750,000 to $999,999 | 9 (1.4%) | 0 (0.0%) |
| $1,000,000 or more | 0 (0.0%) | 21 (2.3%) |
| Total | 641 (100.0%) | 913 (100.0%) |
Household Income by Mortgage Status in Hapeville
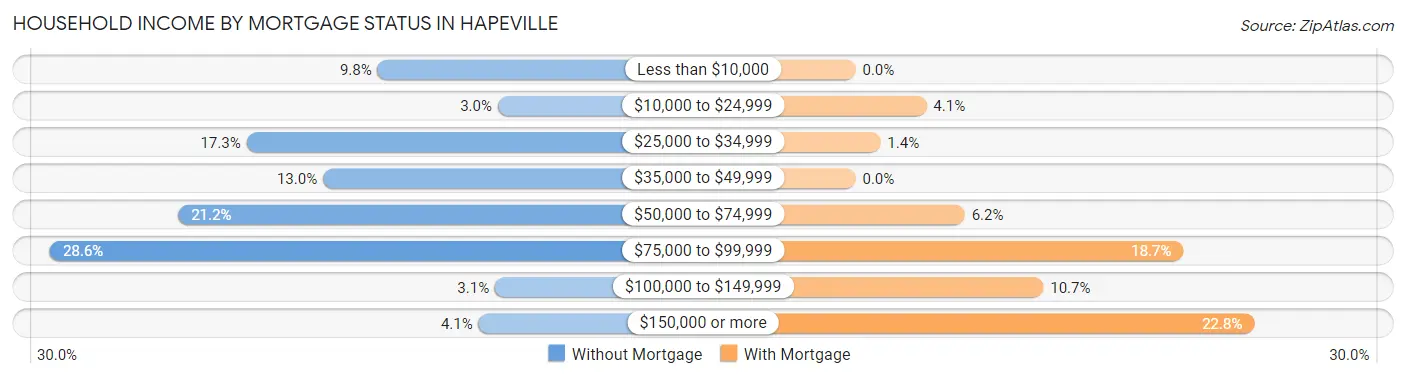
| Household Income | Without Mortgage | With Mortgage |
| Less than $10,000 | 63 (9.8%) | 0 (0.0%) |
| $10,000 to $24,999 | 19 (3.0%) | 37 (4.1%) |
| $25,000 to $34,999 | 111 (17.3%) | 13 (1.4%) |
| $35,000 to $49,999 | 83 (13.0%) | 0 (0.0%) |
| $50,000 to $74,999 | 136 (21.2%) | 57 (6.2%) |
| $75,000 to $99,999 | 183 (28.5%) | 171 (18.7%) |
| $100,000 to $149,999 | 20 (3.1%) | 98 (10.7%) |
| $150,000 or more | 26 (4.1%) | 208 (22.8%) |
| Total | 641 (100.0%) | 913 (100.0%) |
Property Value to Household Income Ratio in Hapeville
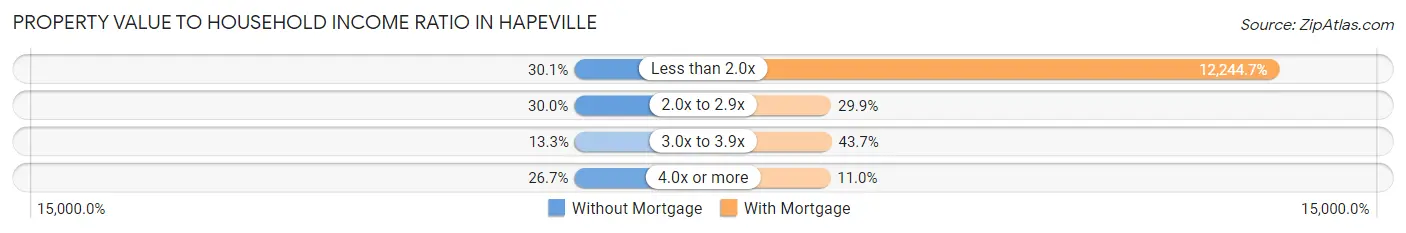
| Value-to-Income Ratio | Without Mortgage | With Mortgage |
| Less than 2.0x | 193 (30.1%) | 111,794 (12,244.7%) |
| 2.0x to 2.9x | 192 (29.9%) | 273 (29.9%) |
| 3.0x to 3.9x | 85 (13.3%) | 399 (43.7%) |
| 4.0x or more | 171 (26.7%) | 100 (11.0%) |
| Total | 641 (100.0%) | 913 (100.0%) |
Real Estate Taxes by Mortgage Status in Hapeville
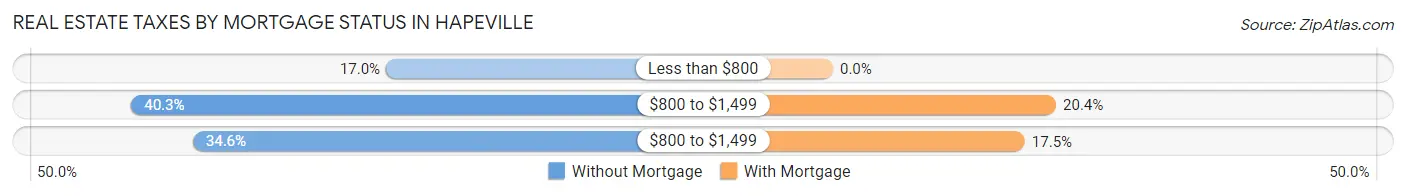
| Property Taxes | Without Mortgage | With Mortgage |
| Less than $800 | 109 (17.0%) | 0 (0.0%) |
| $800 to $1,499 | 258 (40.3%) | 186 (20.4%) |
| $800 to $1,499 | 222 (34.6%) | 160 (17.5%) |
| Total | 641 (100.0%) | 913 (100.0%) |
Health & Disability in Hapeville
Health Insurance Coverage by Age in Hapeville
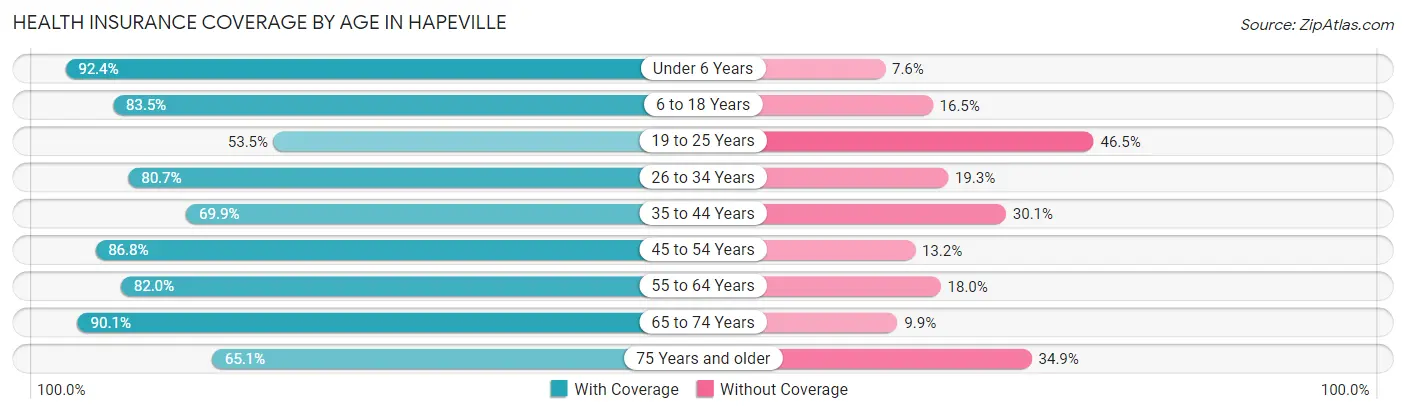
| Age Bracket | With Coverage | Without Coverage |
| Under 6 Years | 644 (92.4%) | 53 (7.6%) |
| 6 to 18 Years | 857 (83.5%) | 169 (16.5%) |
| 19 to 25 Years | 228 (53.5%) | 198 (46.5%) |
| 26 to 34 Years | 680 (80.7%) | 163 (19.3%) |
| 35 to 44 Years | 770 (69.9%) | 332 (30.1%) |
| 45 to 54 Years | 593 (86.8%) | 90 (13.2%) |
| 55 to 64 Years | 950 (82.0%) | 208 (18.0%) |
| 65 to 74 Years | 437 (90.1%) | 48 (9.9%) |
| 75 Years and older | 95 (65.1%) | 51 (34.9%) |
| Total | 5,254 (80.0%) | 1,312 (20.0%) |
Health Insurance Coverage by Citizenship Status in Hapeville
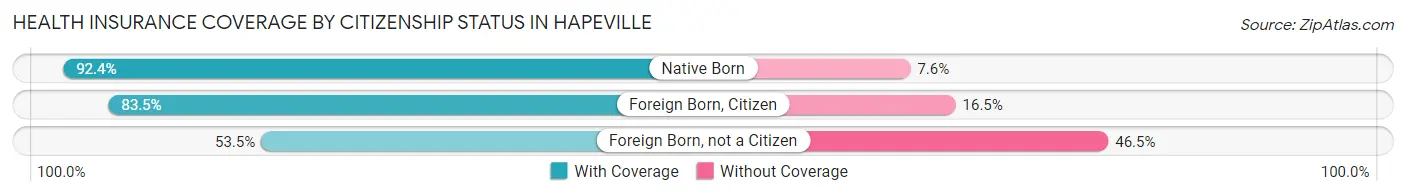
| Citizenship Status | With Coverage | Without Coverage |
| Native Born | 644 (92.4%) | 53 (7.6%) |
| Foreign Born, Citizen | 857 (83.5%) | 169 (16.5%) |
| Foreign Born, not a Citizen | 228 (53.5%) | 198 (46.5%) |
Health Insurance Coverage by Household Income in Hapeville
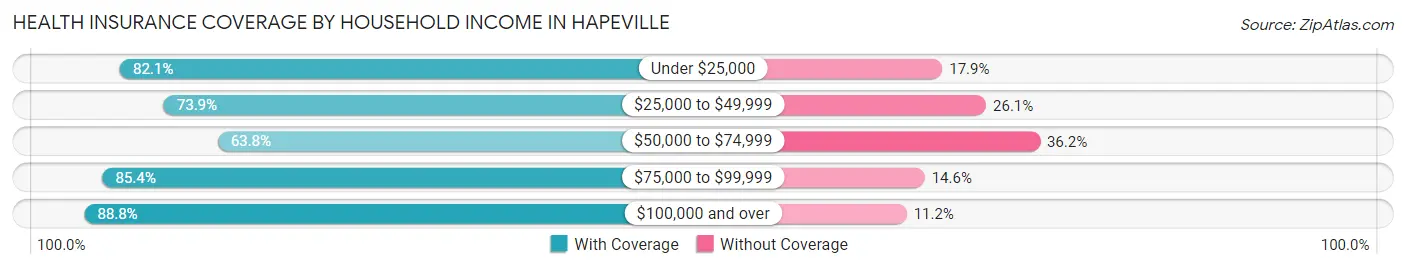
| Household Income | With Coverage | Without Coverage |
| Under $25,000 | 849 (82.1%) | 185 (17.9%) |
| $25,000 to $49,999 | 841 (73.9%) | 297 (26.1%) |
| $50,000 to $74,999 | 790 (63.8%) | 448 (36.2%) |
| $75,000 to $99,999 | 690 (85.4%) | 118 (14.6%) |
| $100,000 and over | 2,081 (88.8%) | 263 (11.2%) |
Public vs Private Health Insurance Coverage by Age in Hapeville
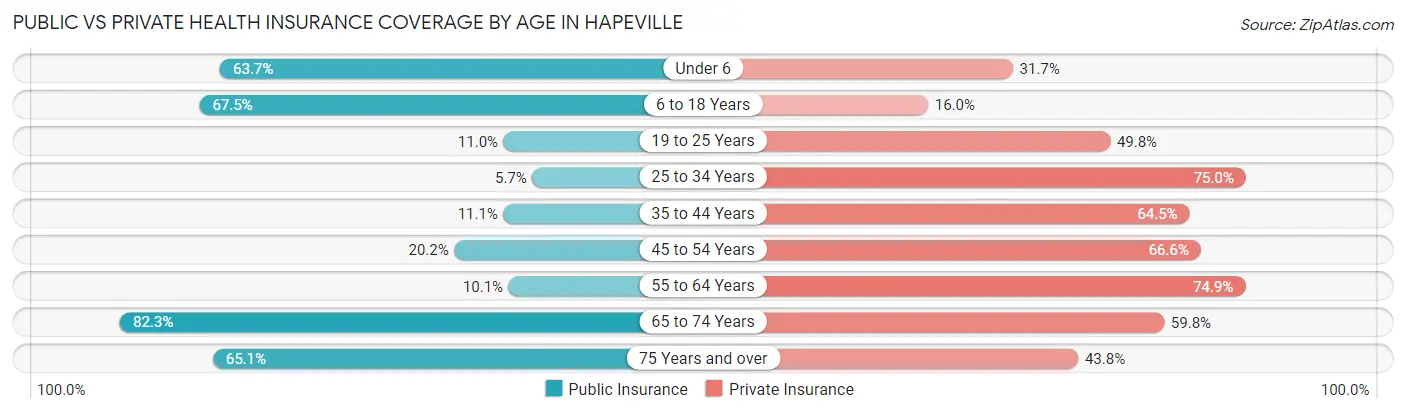
| Age Bracket | Public Insurance | Private Insurance |
| Under 6 | 444 (63.7%) | 221 (31.7%) |
| 6 to 18 Years | 693 (67.5%) | 164 (16.0%) |
| 19 to 25 Years | 47 (11.0%) | 212 (49.8%) |
| 25 to 34 Years | 48 (5.7%) | 632 (75.0%) |
| 35 to 44 Years | 122 (11.1%) | 711 (64.5%) |
| 45 to 54 Years | 138 (20.2%) | 455 (66.6%) |
| 55 to 64 Years | 117 (10.1%) | 867 (74.9%) |
| 65 to 74 Years | 399 (82.3%) | 290 (59.8%) |
| 75 Years and over | 95 (65.1%) | 64 (43.8%) |
| Total | 2,103 (32.0%) | 3,616 (55.1%) |
Disability Status by Sex by Age in Hapeville
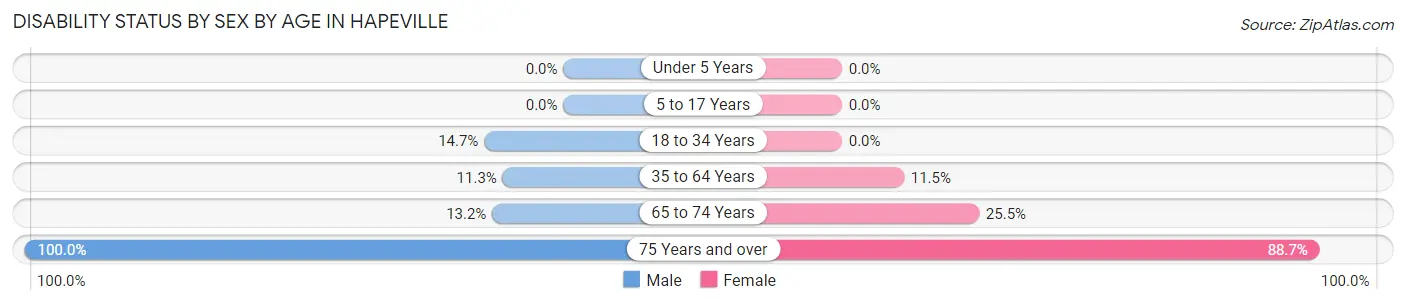
| Age Bracket | Male | Female |
| Under 5 Years | 0 (0.0%) | 0 (0.0%) |
| 5 to 17 Years | 0 (0.0%) | 0 (0.0%) |
| 18 to 34 Years | 104 (14.7%) | 0 (0.0%) |
| 35 to 64 Years | 216 (11.3%) | 118 (11.5%) |
| 65 to 74 Years | 35 (13.2%) | 56 (25.5%) |
| 75 Years and over | 31 (100.0%) | 102 (88.7%) |
Disability Class by Sex by Age in Hapeville
Disability Class: Hearing Difficulty
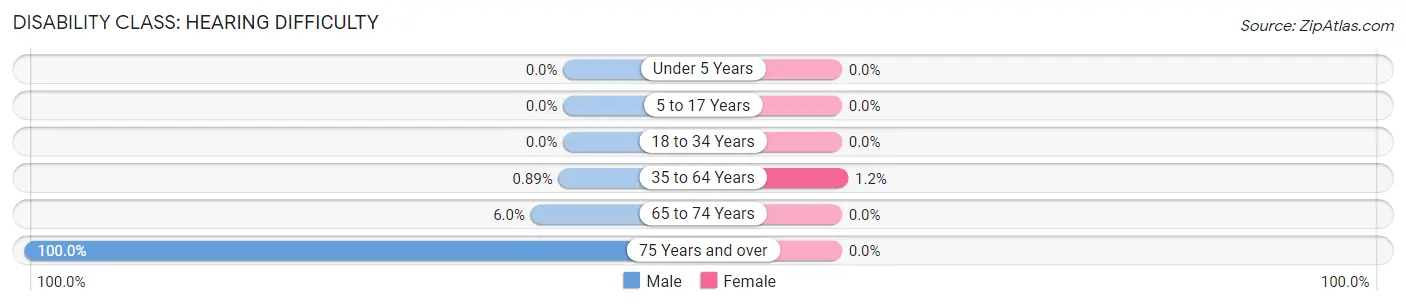
| Age Bracket | Male | Female |
| Under 5 Years | 0 (0.0%) | 0 (0.0%) |
| 5 to 17 Years | 0 (0.0%) | 0 (0.0%) |
| 18 to 34 Years | 0 (0.0%) | 0 (0.0%) |
| 35 to 64 Years | 17 (0.9%) | 12 (1.2%) |
| 65 to 74 Years | 16 (6.0%) | 0 (0.0%) |
| 75 Years and over | 31 (100.0%) | 0 (0.0%) |
Disability Class: Vision Difficulty
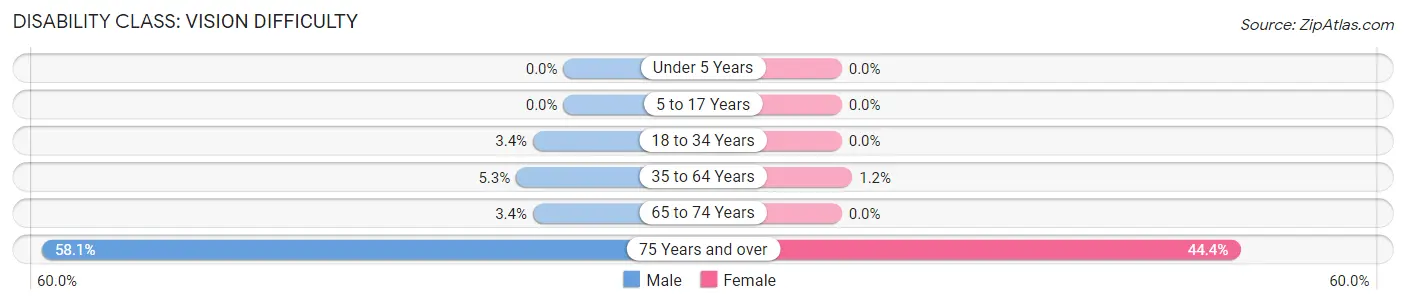
| Age Bracket | Male | Female |
| Under 5 Years | 0 (0.0%) | 0 (0.0%) |
| 5 to 17 Years | 0 (0.0%) | 0 (0.0%) |
| 18 to 34 Years | 24 (3.4%) | 0 (0.0%) |
| 35 to 64 Years | 101 (5.3%) | 12 (1.2%) |
| 65 to 74 Years | 9 (3.4%) | 0 (0.0%) |
| 75 Years and over | 18 (58.1%) | 51 (44.4%) |
Disability Class: Cognitive Difficulty
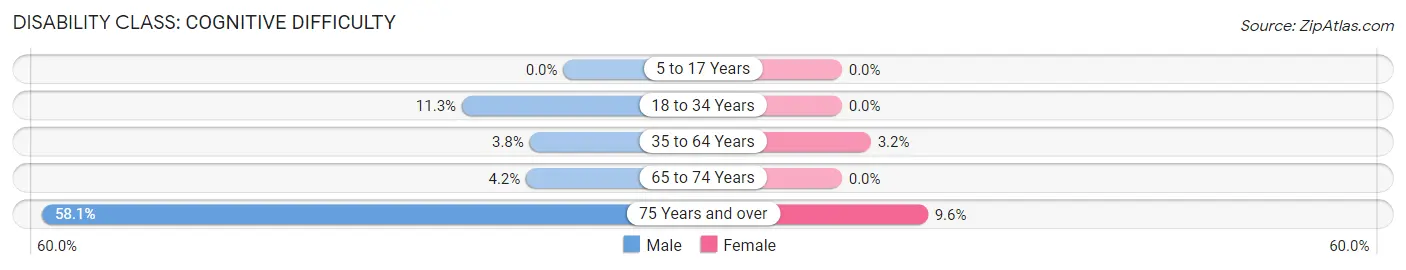
| Age Bracket | Male | Female |
| 5 to 17 Years | 0 (0.0%) | 0 (0.0%) |
| 18 to 34 Years | 80 (11.3%) | 0 (0.0%) |
| 35 to 64 Years | 72 (3.8%) | 33 (3.2%) |
| 65 to 74 Years | 11 (4.2%) | 0 (0.0%) |
| 75 Years and over | 18 (58.1%) | 11 (9.6%) |
Disability Class: Ambulatory Difficulty
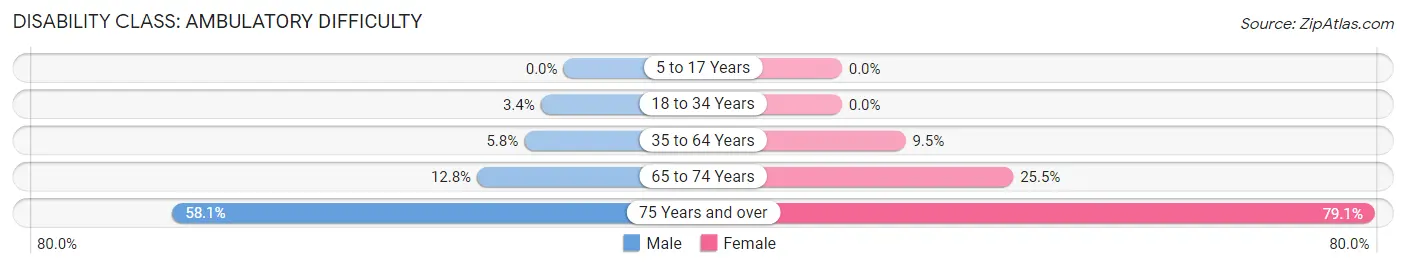
| Age Bracket | Male | Female |
| 5 to 17 Years | 0 (0.0%) | 0 (0.0%) |
| 18 to 34 Years | 24 (3.4%) | 0 (0.0%) |
| 35 to 64 Years | 112 (5.8%) | 97 (9.5%) |
| 65 to 74 Years | 34 (12.8%) | 56 (25.5%) |
| 75 Years and over | 18 (58.1%) | 91 (79.1%) |
Disability Class: Self-Care Difficulty
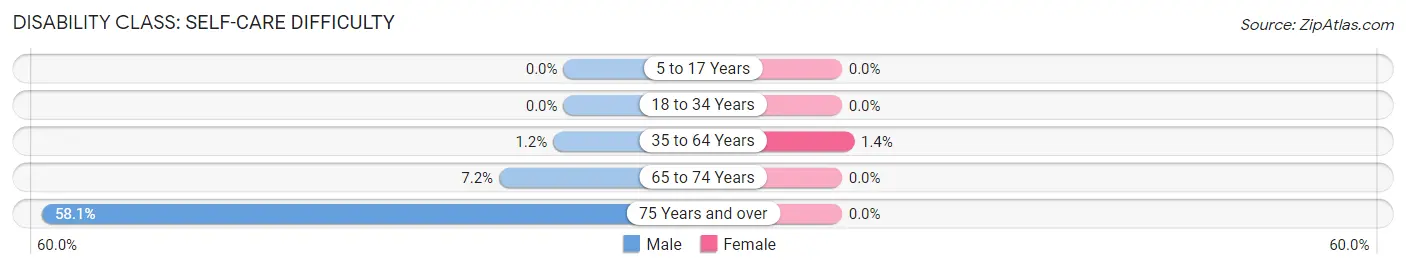
| Age Bracket | Male | Female |
| 5 to 17 Years | 0 (0.0%) | 0 (0.0%) |
| 18 to 34 Years | 0 (0.0%) | 0 (0.0%) |
| 35 to 64 Years | 22 (1.1%) | 14 (1.4%) |
| 65 to 74 Years | 19 (7.2%) | 0 (0.0%) |
| 75 Years and over | 18 (58.1%) | 0 (0.0%) |
Technology Access in Hapeville
Computing Device Access in Hapeville
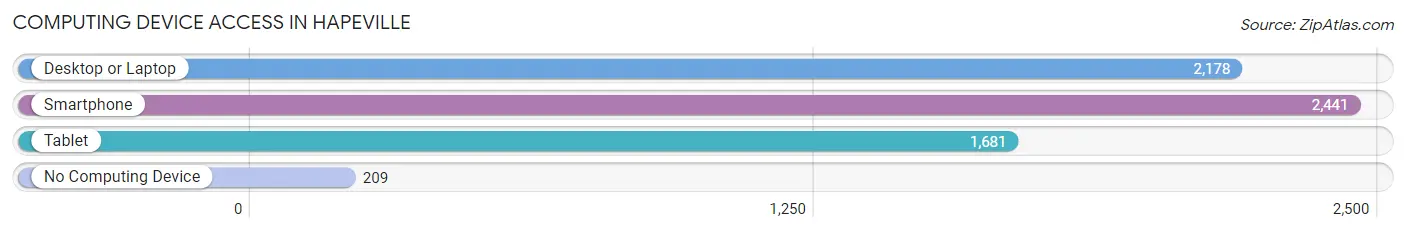
| Device Type | # Households | % Households |
| Desktop or Laptop | 2,178 | 74.9% |
| Smartphone | 2,441 | 83.9% |
| Tablet | 1,681 | 57.8% |
| No Computing Device | 209 | 7.2% |
| Total | 2,908 | 100.0% |
Internet Access in Hapeville
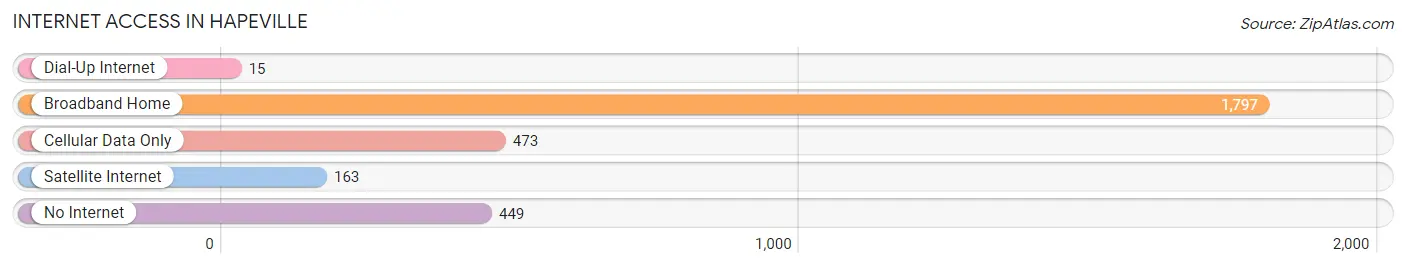
| Internet Type | # Households | % Households |
| Dial-Up Internet | 15 | 0.5% |
| Broadband Home | 1,797 | 61.8% |
| Cellular Data Only | 473 | 16.3% |
| Satellite Internet | 163 | 5.6% |
| No Internet | 449 | 15.4% |
| Total | 2,908 | 100.0% |
Hapeville Summary
Hapeville is a city located in Fulton County, Georgia, United States. It is part of the Atlanta metropolitan area and is located just south of the city of Atlanta. The population was 6,373 at the 2010 census.
History
Hapeville was founded in 1854 by Dr. Samuel Hape, a prominent physician and landowner. The city was named after him and incorporated in 1891. The city was originally a farming community, but it began to grow rapidly after the completion of the Atlanta and West Point Railroad in 1871. The railroad connected Hapeville to Atlanta and other cities in the region, making it an important transportation hub.
In the early 20th century, Hapeville became a major industrial center. The Ford Motor Company opened a plant in the city in 1925, and the city's population grew rapidly as workers moved to the area to take advantage of the new jobs. The city continued to grow throughout the 20th century, and by the 2000 census, the population had reached 6,373.
Geography
Hapeville is located in Fulton County, Georgia, at 33°41'N 84°25'W (33.68, -84.41). The city is located just south of the city of Atlanta and is part of the Atlanta metropolitan area. The city has a total area of 4.2 square miles, all of which is land.
Economy
Hapeville is a major industrial center, with the Ford Motor Company's Atlanta Assembly Plant located in the city. The plant has been in operation since 1925 and is one of the largest employers in the city. Other major employers in the city include Delta Air Lines, which has its headquarters in Hapeville, and the Georgia International Convention Center.
The city also has a vibrant retail sector, with several shopping centers and restaurants located in the city. The city is also home to the Hapeville Historic District, which is listed on the National Register of Historic Places.
Demographics
As of the 2010 census, there were 6,373 people, 2,717 households, and 1,619 families residing in the city. The population density was 1,521.3 people per square mile. The racial makeup of the city was 54.2% White, 33.3% African American, 0.3% Native American, 5.2% Asian, 0.1% Pacific Islander, 4.7% from other races, and 2.2% from two or more races. Hispanic or Latino of any race were 11.2% of the population.
The median income for a household in the city was $37,917, and the median income for a family was $45,938. The per capita income for the city was $20,945. About 14.2% of families and 17.3% of the population were below the poverty line, including 25.2% of those under age 18 and 8.2% of those age 65 or over.
Common Questions
What is Per Capita Income in Hapeville?
Per Capita income in Hapeville is $33,724.
What is the Median Family Income in Hapeville?
Median Family Income in Hapeville is $62,266.
What is the Median Household income in Hapeville?
Median Household Income in Hapeville is $62,117.
What is Income or Wage Gap in Hapeville?
Income or Wage Gap in Hapeville is 29.4%.
Women in Hapeville earn 70.6 cents for every dollar earned by a man.
What is Inequality or Gini Index in Hapeville?
Inequality or Gini Index in Hapeville is 0.39.
What is the Total Population of Hapeville?
Total Population of Hapeville is 6,566.
What is the Total Male Population of Hapeville?
Total Male Population of Hapeville is 3,938.
What is the Total Female Population of Hapeville?
Total Female Population of Hapeville is 2,628.
What is the Ratio of Males per 100 Females in Hapeville?
There are 149.85 Males per 100 Females in Hapeville.
What is the Ratio of Females per 100 Males in Hapeville?
There are 66.73 Females per 100 Males in Hapeville.
What is the Median Population Age in Hapeville?
Median Population Age in Hapeville is 36.6 Years.
What is the Average Family Size in Hapeville
Average Family Size in Hapeville is 3.2 People.
What is the Average Household Size in Hapeville
Average Household Size in Hapeville is 2.3 People.
How Large is the Labor Force in Hapeville?
There are 4,019 People in the Labor Forcein in Hapeville.
What is the Percentage of People in the Labor Force in Hapeville?
77.7% of People are in the Labor Force in Hapeville.
What is the Unemployment Rate in Hapeville?
Unemployment Rate in Hapeville is 6.2%.