Hempstead, TX Map & Demographics
Hempstead Map
Hempstead Overview
$20,021
PER CAPITA INCOME
$55,581
AVG FAMILY INCOME
$54,066
AVG HOUSEHOLD INCOME
20.1%
WAGE / INCOME GAP [ % ]
79.9¢/ $1
WAGE / INCOME GAP [ $ ]
0.34
INEQUALITY / GINI INDEX
5,686
TOTAL POPULATION
2,546
MALE POPULATION
3,140
FEMALE POPULATION
81.08
MALES / 100 FEMALES
123.33
FEMALES / 100 MALES
25.4
MEDIAN AGE
3.5
AVG FAMILY SIZE
2.8
AVG HOUSEHOLD SIZE
2,494
LABOR FORCE [ PEOPLE ]
60.5%
PERCENT IN LABOR FORCE
0.8%
UNEMPLOYMENT RATE
Hempstead Zip Codes
Income in Hempstead
Income Overview in Hempstead
Per Capita Income in Hempstead is $20,021, while median incomes of families and households are $55,581 and $54,066 respectively.
| Characteristic | Number | Measure |
| Per Capita Income | 5,686 | $20,021 |
| Median Family Income | 1,294 | $55,581 |
| Mean Family Income | 1,294 | $59,566 |
| Median Household Income | 2,010 | $54,066 |
| Mean Household Income | 2,010 | $55,640 |
| Income Deficit | 1,294 | $0 |
| Wage / Income Gap (%) | 5,686 | 20.07% |
| Wage / Income Gap ($) | 5,686 | 79.93¢ per $1 |
| Gini / Inequality Index | 5,686 | 0.34 |
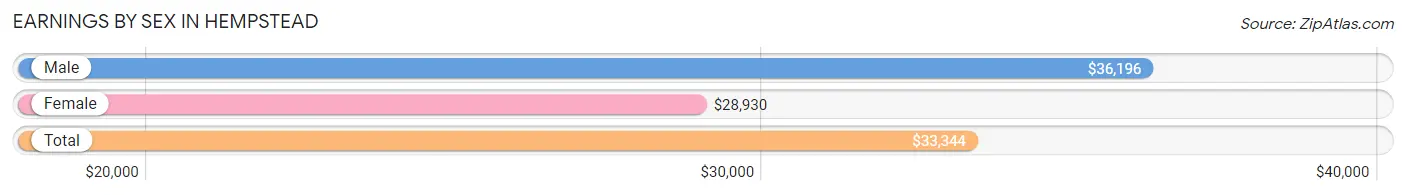
Earnings by Sex in Hempstead
Average Earnings in Hempstead are $33,344, $36,196 for men and $28,930 for women, a difference of 20.1%.
| Sex | Number | Average Earnings |
| Male | 1,035 (38.5%) | $36,196 |
| Female | 1,655 (61.5%) | $28,930 |
| Total | 2,690 (100.0%) | $33,344 |
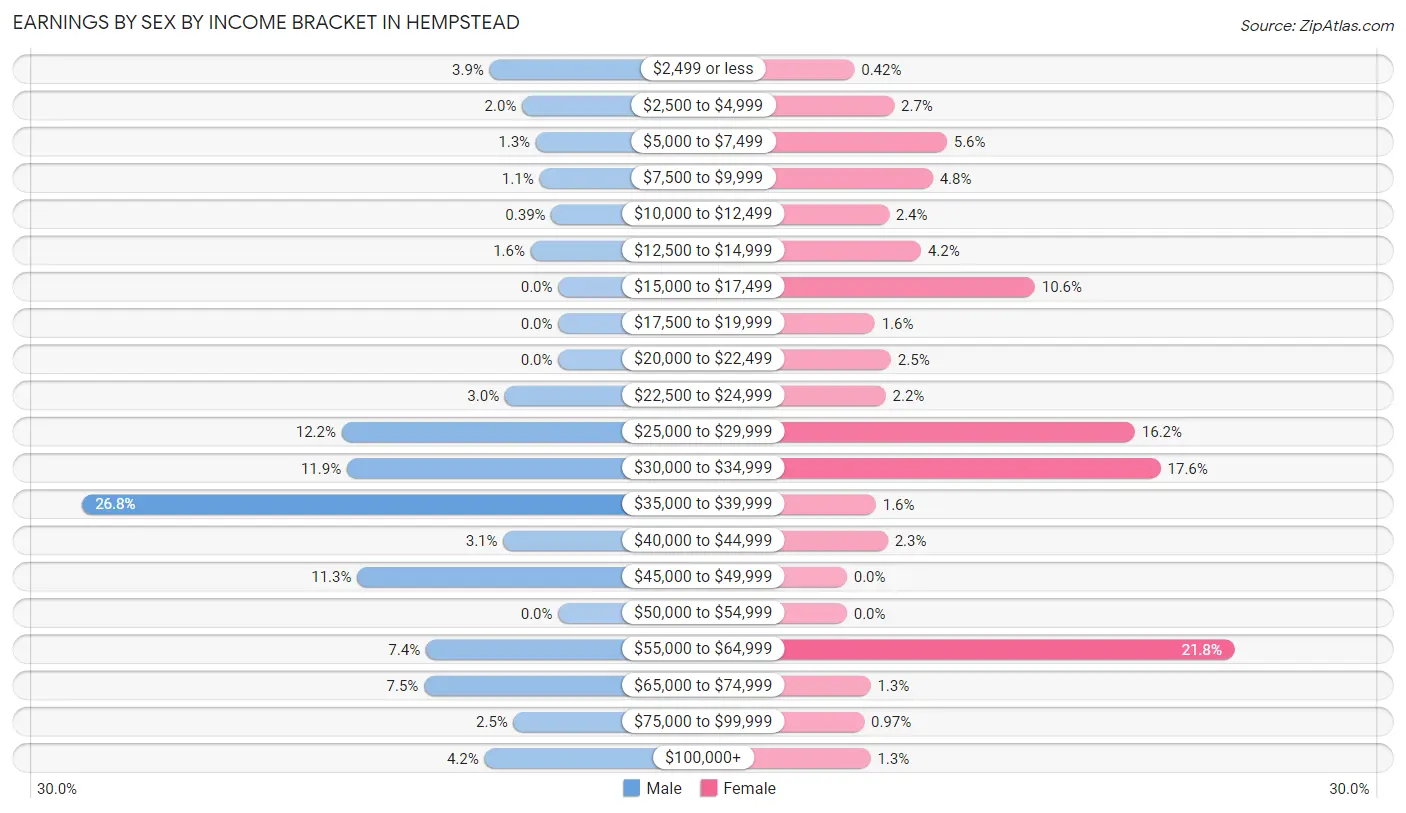
Earnings by Sex by Income Bracket in Hempstead
The most common earnings brackets in Hempstead are $35,000 to $39,999 for men (277 | 26.8%) and $55,000 to $64,999 for women (360 | 21.7%).
| Income | Male | Female |
| $2,499 or less | 40 (3.9%) | 7 (0.4%) |
| $2,500 to $4,999 | 21 (2.0%) | 44 (2.7%) |
| $5,000 to $7,499 | 13 (1.3%) | 93 (5.6%) |
| $7,500 to $9,999 | 11 (1.1%) | 80 (4.8%) |
| $10,000 to $12,499 | 4 (0.4%) | 39 (2.4%) |
| $12,500 to $14,999 | 16 (1.5%) | 69 (4.2%) |
| $15,000 to $17,499 | 0 (0.0%) | 175 (10.6%) |
| $17,500 to $19,999 | 0 (0.0%) | 26 (1.6%) |
| $20,000 to $22,499 | 0 (0.0%) | 41 (2.5%) |
| $22,500 to $24,999 | 31 (3.0%) | 36 (2.2%) |
| $25,000 to $29,999 | 126 (12.2%) | 268 (16.2%) |
| $30,000 to $34,999 | 123 (11.9%) | 292 (17.6%) |
| $35,000 to $39,999 | 277 (26.8%) | 27 (1.6%) |
| $40,000 to $44,999 | 32 (3.1%) | 38 (2.3%) |
| $45,000 to $49,999 | 117 (11.3%) | 0 (0.0%) |
| $50,000 to $54,999 | 0 (0.0%) | 0 (0.0%) |
| $55,000 to $64,999 | 77 (7.4%) | 360 (21.7%) |
| $65,000 to $74,999 | 78 (7.5%) | 22 (1.3%) |
| $75,000 to $99,999 | 26 (2.5%) | 16 (1.0%) |
| $100,000+ | 43 (4.2%) | 22 (1.3%) |
| Total | 1,035 (100.0%) | 1,655 (100.0%) |
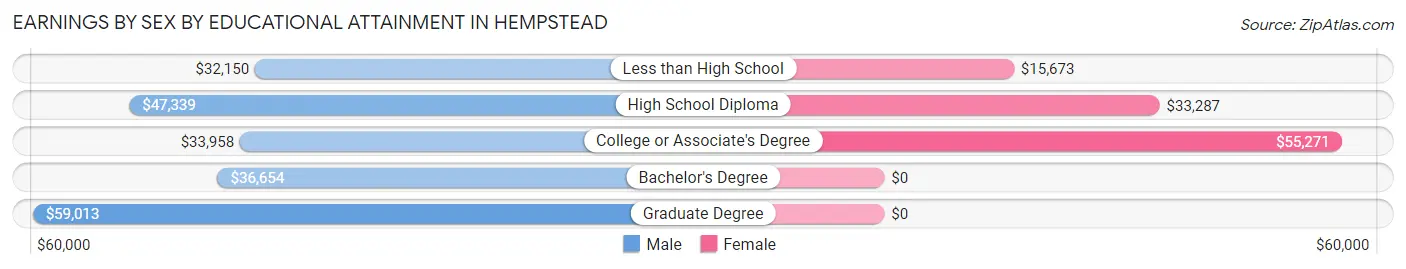
Earnings by Sex by Educational Attainment in Hempstead
Average earnings in Hempstead are $36,665 for men and $32,846 for women, a difference of 10.4%. Men with an educational attainment of graduate degree enjoy the highest average annual earnings of $59,013, while those with less than high school education earn the least with $32,150. Women with an educational attainment of college or associate's degree earn the most with the average annual earnings of $55,271, while those with less than high school education have the smallest earnings of $15,673.
| Educational Attainment | Male Income | Female Income |
| Less than High School | $32,150 | $15,673 |
| High School Diploma | $47,339 | $33,287 |
| College or Associate's Degree | $33,958 | $55,271 |
| Bachelor's Degree | $36,654 | $0 |
| Graduate Degree | $59,013 | $0 |
| Total | $36,665 | $32,846 |
Family Income in Hempstead
Family Income Brackets in Hempstead
According to the Hempstead family income data, there are 609 families falling into the $50,000 to $74,999 income range, which is the most common income bracket and makes up 47.1% of all families. Conversely, the $200,000+ income bracket is the least frequent group with only 8 families (0.6%) belonging to this category.
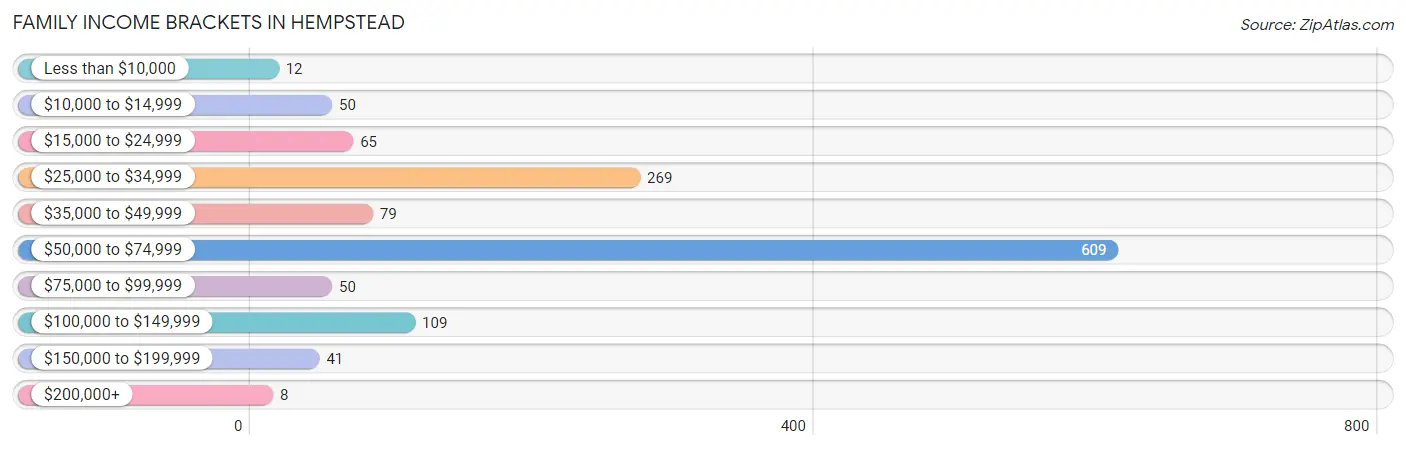
| Income Bracket | # Families | % Families |
| Less than $10,000 | 12 | 0.9% |
| $10,000 to $14,999 | 50 | 3.9% |
| $15,000 to $24,999 | 65 | 5.0% |
| $25,000 to $34,999 | 269 | 20.8% |
| $35,000 to $49,999 | 79 | 6.1% |
| $50,000 to $74,999 | 609 | 47.1% |
| $75,000 to $99,999 | 50 | 3.9% |
| $100,000 to $149,999 | 109 | 8.4% |
| $150,000 to $199,999 | 41 | 3.2% |
| $200,000+ | 8 | 0.6% |
Family Income by Famaliy Size in Hempstead
4-person families (140 | 10.8%) account for the highest median family income in Hempstead with $118,402 per family, while 4-person families (140 | 10.8%) have the highest median income of $29,600 per family member.
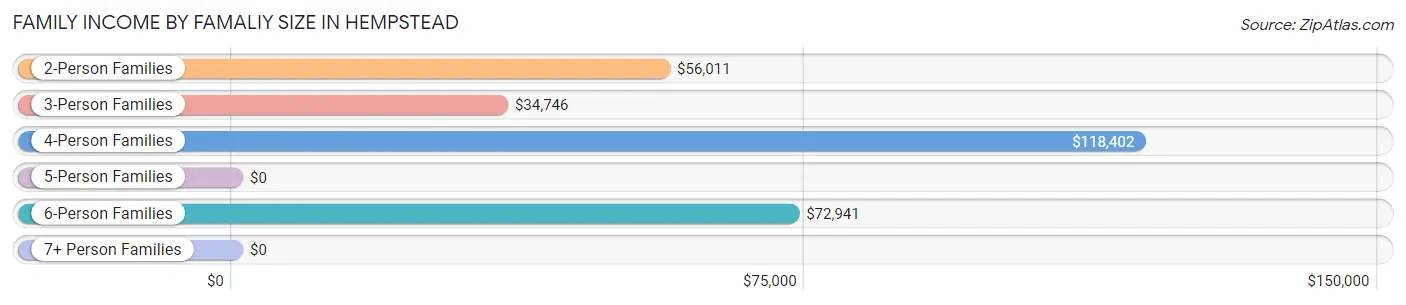
| Income Bracket | # Families | Median Income |
| 2-Person Families | 664 (51.3%) | $56,011 |
| 3-Person Families | 360 (27.8%) | $34,746 |
| 4-Person Families | 140 (10.8%) | $118,402 |
| 5-Person Families | 74 (5.7%) | $0 |
| 6-Person Families | 56 (4.3%) | $72,941 |
| 7+ Person Families | 0 (0.0%) | $0 |
| Total | 1,294 (100.0%) | $55,581 |
Family Income by Number of Earners in Hempstead
The median family income in Hempstead is $55,581, with families comprising 3+ earners (101) having the highest median family income of $119,570, while families with no earners (53) have the lowest median family income of $35,583, accounting for 7.8% and 4.1% of families, respectively.
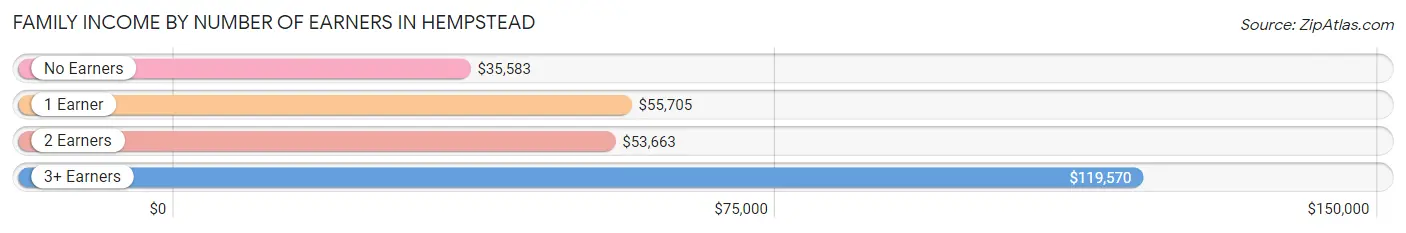
| Number of Earners | # Families | Median Income |
| No Earners | 53 (4.1%) | $35,583 |
| 1 Earner | 852 (65.8%) | $55,705 |
| 2 Earners | 288 (22.3%) | $53,663 |
| 3+ Earners | 101 (7.8%) | $119,570 |
| Total | 1,294 (100.0%) | $55,581 |
Household Income in Hempstead
Household Income Brackets in Hempstead
With 716 households falling in the category, the $50,000 to $74,999 income range is the most frequent in Hempstead, accounting for 35.6% of all households. In contrast, only 8 households (0.4%) fall into the $200,000+ income bracket, making it the least populous group.
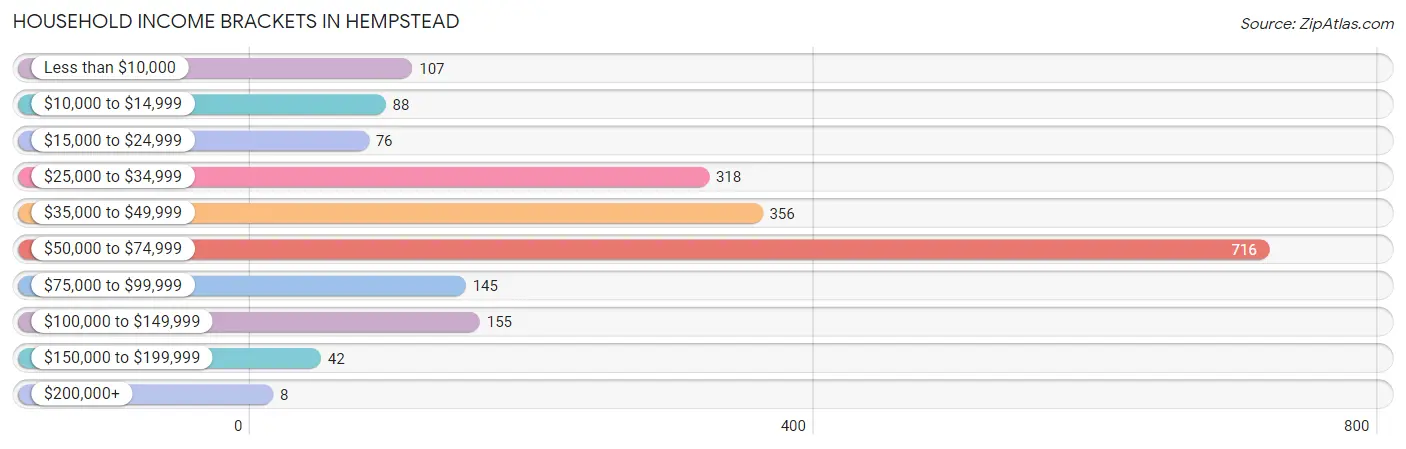
| Income Bracket | # Households | % Households |
| Less than $10,000 | 107 | 5.3% |
| $10,000 to $14,999 | 88 | 4.4% |
| $15,000 to $24,999 | 76 | 3.8% |
| $25,000 to $34,999 | 318 | 15.8% |
| $35,000 to $49,999 | 356 | 17.7% |
| $50,000 to $74,999 | 716 | 35.6% |
| $75,000 to $99,999 | 145 | 7.2% |
| $100,000 to $149,999 | 155 | 7.7% |
| $150,000 to $199,999 | 42 | 2.1% |
| $200,000+ | 8 | 0.4% |
Household Income by Householder Age in Hempstead
The median household income in Hempstead is $54,066, with the highest median household income of $61,265 found in the 45 to 64 years age bracket for the primary householder. A total of 523 households (26.0%) fall into this category. Meanwhile, the 15 to 24 years age bracket for the primary householder has the lowest median household income of $0, with 93 households (4.6%) in this group.
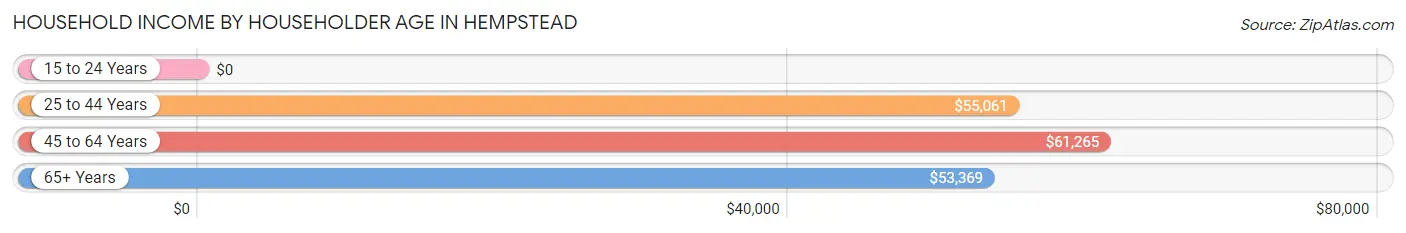
| Income Bracket | # Households | Median Income |
| 15 to 24 Years | 93 (4.6%) | $0 |
| 25 to 44 Years | 1,189 (59.2%) | $55,061 |
| 45 to 64 Years | 523 (26.0%) | $61,265 |
| 65+ Years | 205 (10.2%) | $53,369 |
| Total | 2,010 (100.0%) | $54,066 |
Poverty in Hempstead
Income Below Poverty by Sex and Age in Hempstead
With 2.9% poverty level for males and 13.7% for females among the residents of Hempstead, 12 to 14 year old males and under 5 year old females are the most vulnerable to poverty, with 6 males (13.3%) and 67 females (36.2%) in their respective age groups living below the poverty level.
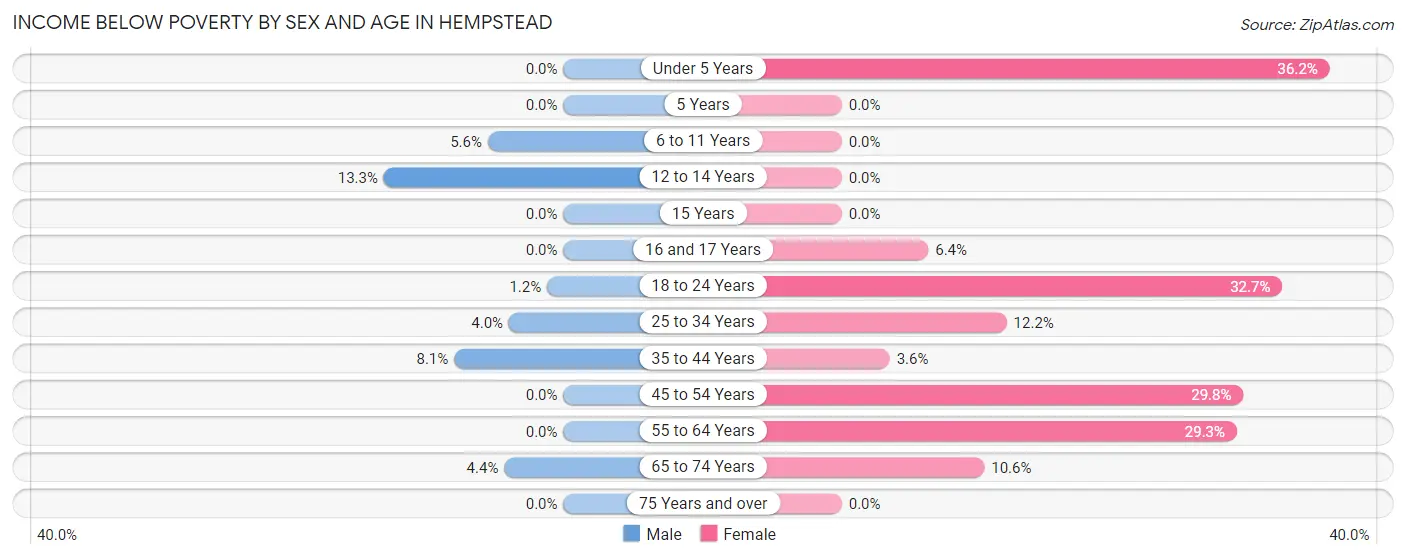
| Age Bracket | Male | Female |
| Under 5 Years | 0 (0.0%) | 67 (36.2%) |
| 5 Years | 0 (0.0%) | 0 (0.0%) |
| 6 to 11 Years | 12 (5.6%) | 0 (0.0%) |
| 12 to 14 Years | 6 (13.3%) | 0 (0.0%) |
| 15 Years | 0 (0.0%) | 0 (0.0%) |
| 16 and 17 Years | 0 (0.0%) | 7 (6.4%) |
| 18 to 24 Years | 10 (1.2%) | 69 (32.7%) |
| 25 to 34 Years | 16 (4.0%) | 94 (12.2%) |
| 35 to 44 Years | 24 (8.1%) | 9 (3.6%) |
| 45 to 54 Years | 0 (0.0%) | 93 (29.8%) |
| 55 to 64 Years | 0 (0.0%) | 66 (29.3%) |
| 65 to 74 Years | 5 (4.4%) | 20 (10.6%) |
| 75 Years and over | 0 (0.0%) | 0 (0.0%) |
| Total | 73 (2.9%) | 425 (13.7%) |
Income Above Poverty by Sex and Age in Hempstead
According to the poverty statistics in Hempstead, males aged under 5 years and females aged 6 to 11 years are the age groups that are most secure financially, with 100.0% of males and 100.0% of females in these age groups living above the poverty line.
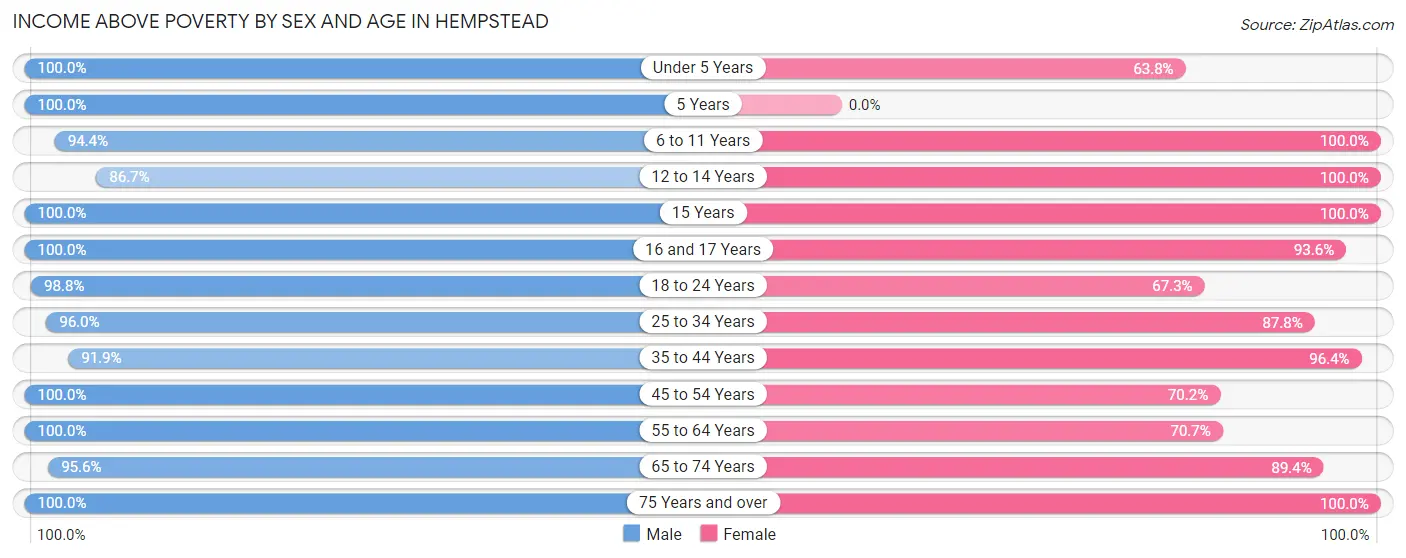
| Age Bracket | Male | Female |
| Under 5 Years | 257 (100.0%) | 118 (63.8%) |
| 5 Years | 22 (100.0%) | 0 (0.0%) |
| 6 to 11 Years | 202 (94.4%) | 654 (100.0%) |
| 12 to 14 Years | 39 (86.7%) | 46 (100.0%) |
| 15 Years | 26 (100.0%) | 86 (100.0%) |
| 16 and 17 Years | 61 (100.0%) | 102 (93.6%) |
| 18 to 24 Years | 814 (98.8%) | 142 (67.3%) |
| 25 to 34 Years | 380 (96.0%) | 674 (87.8%) |
| 35 to 44 Years | 272 (91.9%) | 244 (96.4%) |
| 45 to 54 Years | 25 (100.0%) | 219 (70.2%) |
| 55 to 64 Years | 198 (100.0%) | 159 (70.7%) |
| 65 to 74 Years | 109 (95.6%) | 169 (89.4%) |
| 75 Years and over | 7 (100.0%) | 73 (100.0%) |
| Total | 2,412 (97.1%) | 2,686 (86.3%) |
Income Below Poverty Among Married-Couple Families in Hempstead
The poverty statistics for married-couple families in Hempstead show that 2.5% or 10 of the total 408 families live below the poverty line. Families with 3 or 4 children have the highest poverty rate of 7.7%, comprising of 7 families. On the other hand, families with no children have the lowest poverty rate of 0.0%, which includes 0 families.
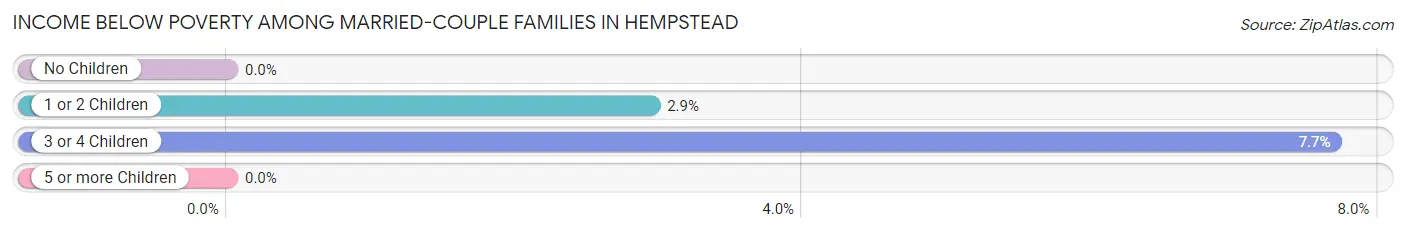
| Children | Above Poverty | Below Poverty |
| No Children | 215 (100.0%) | 0 (0.0%) |
| 1 or 2 Children | 99 (97.1%) | 3 (2.9%) |
| 3 or 4 Children | 84 (92.3%) | 7 (7.7%) |
| 5 or more Children | 0 (0.0%) | 0 (0.0%) |
| Total | 398 (97.6%) | 10 (2.5%) |
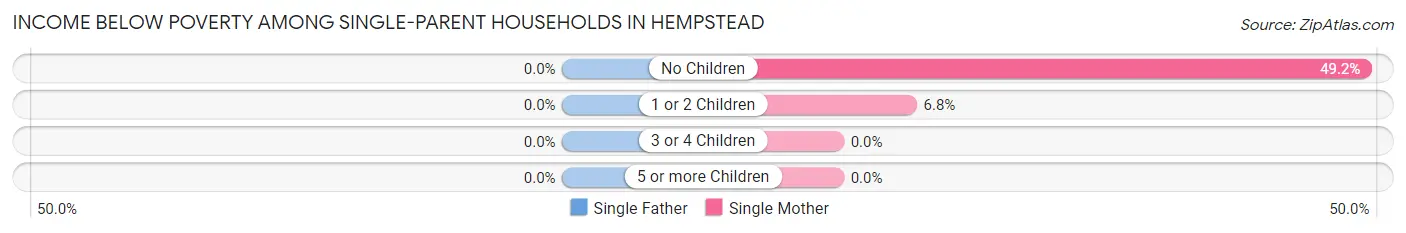
Income Below Poverty Among Single-Parent Households in Hempstead
| Children | Single Father | Single Mother |
| No Children | 0 (0.0%) | 63 (49.2%) |
| 1 or 2 Children | 0 (0.0%) | 44 (6.8%) |
| 3 or 4 Children | 0 (0.0%) | 0 (0.0%) |
| 5 or more Children | 0 (0.0%) | 0 (0.0%) |
| Total | 0 (0.0%) | 107 (13.1%) |
Income Below Poverty Among Married-Couple vs Single-Parent Households in Hempstead
The poverty data for Hempstead shows that 10 of the married-couple family households (2.5%) and 107 of the single-parent households (12.1%) are living below the poverty level. Within the married-couple family households, those with 3 or 4 children have the highest poverty rate, with 7 households (7.7%) falling below the poverty line. Among the single-parent households, those with no children have the highest poverty rate, with 63 household (49.2%) living below poverty.
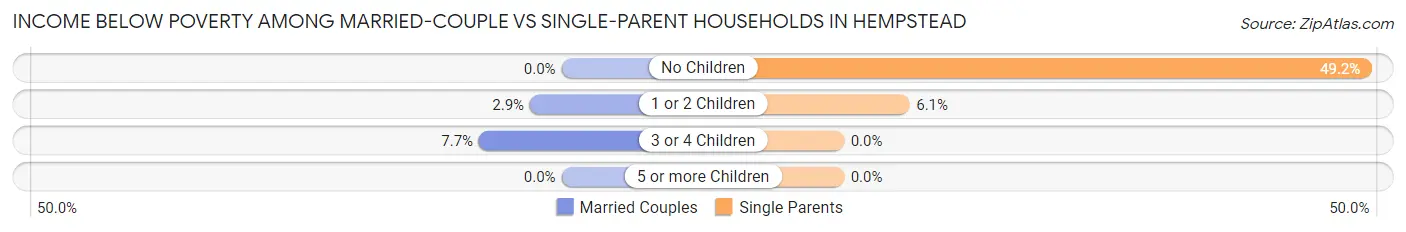
| Children | Married-Couple Families | Single-Parent Households |
| No Children | 0 (0.0%) | 63 (49.2%) |
| 1 or 2 Children | 3 (2.9%) | 44 (6.1%) |
| 3 or 4 Children | 7 (7.7%) | 0 (0.0%) |
| 5 or more Children | 0 (0.0%) | 0 (0.0%) |
| Total | 10 (2.5%) | 107 (12.1%) |
Race in Hempstead
The most populous races in Hempstead are Black / African American (2,845 | 50.0%), Hispanic or Latino (2,027 | 35.6%), and Some other Race (1,375 | 24.2%).
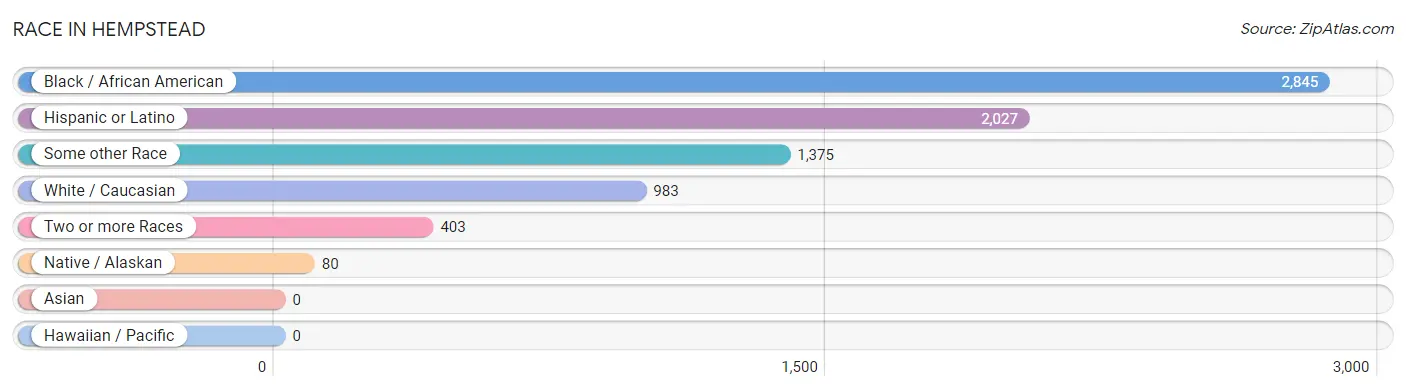
| Race | # Population | % Population |
| Asian | 0 | 0.0% |
| Black / African American | 2,845 | 50.0% |
| Hawaiian / Pacific | 0 | 0.0% |
| Hispanic or Latino | 2,027 | 35.6% |
| Native / Alaskan | 80 | 1.4% |
| White / Caucasian | 983 | 17.3% |
| Two or more Races | 403 | 7.1% |
| Some other Race | 1,375 | 24.2% |
| Total | 5,686 | 100.0% |
Ancestry in Hempstead
The most populous ancestries reported in Hempstead are Mexican (1,785 | 31.4%), German (215 | 3.8%), American (145 | 2.5%), Central American (132 | 2.3%), and Irish (96 | 1.7%), together accounting for 41.7% of all Hempstead residents.
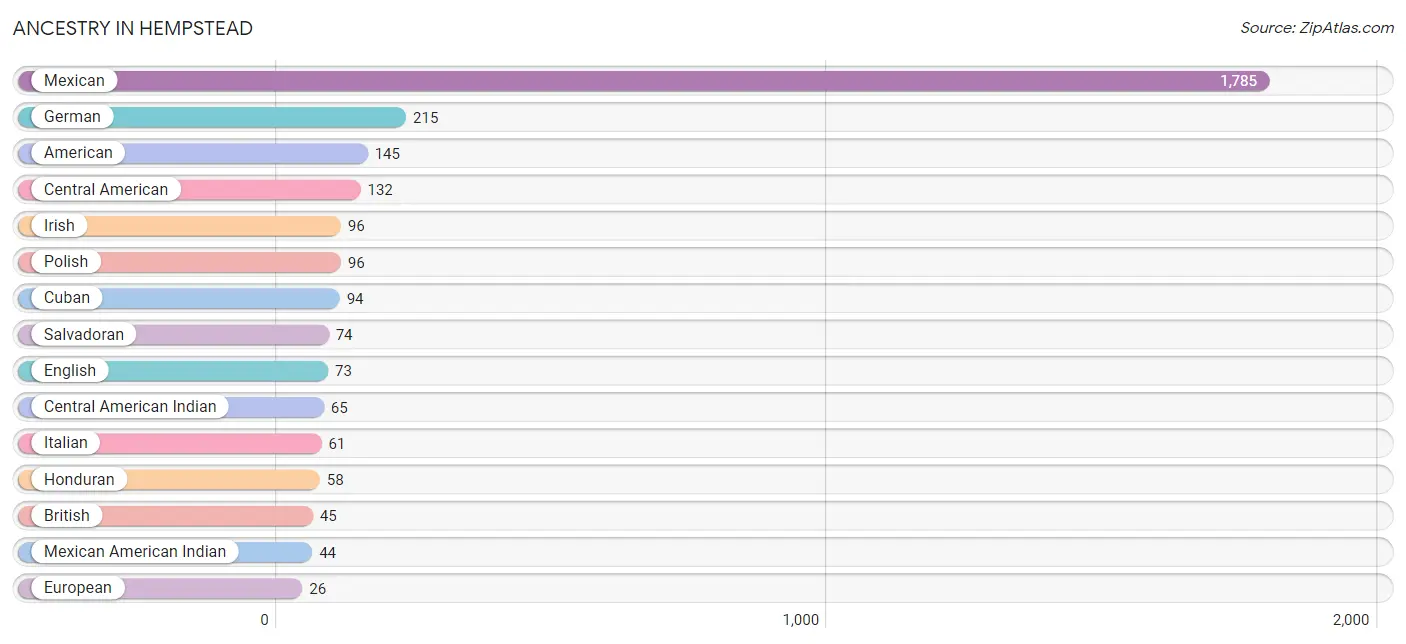
| Ancestry | # Population | % Population |
| African | 7 | 0.1% |
| American | 145 | 2.5% |
| Belgian | 11 | 0.2% |
| British | 45 | 0.8% |
| Central American | 132 | 2.3% |
| Central American Indian | 65 | 1.1% |
| Cuban | 94 | 1.7% |
| Czech | 15 | 0.3% |
| Dutch | 10 | 0.2% |
| English | 73 | 1.3% |
| European | 26 | 0.5% |
| German | 215 | 3.8% |
| Honduran | 58 | 1.0% |
| Irish | 96 | 1.7% |
| Italian | 61 | 1.1% |
| Mexican | 1,785 | 31.4% |
| Mexican American Indian | 44 | 0.8% |
| Polish | 96 | 1.7% |
| Russian | 13 | 0.2% |
| Salvadoran | 74 | 1.3% |
| Spanish | 16 | 0.3% |
| Spanish American Indian | 13 | 0.2% |
| Subsaharan African | 7 | 0.1% |
| Swedish | 19 | 0.3% |
| Swiss | 19 | 0.3% | View All 25 Rows |
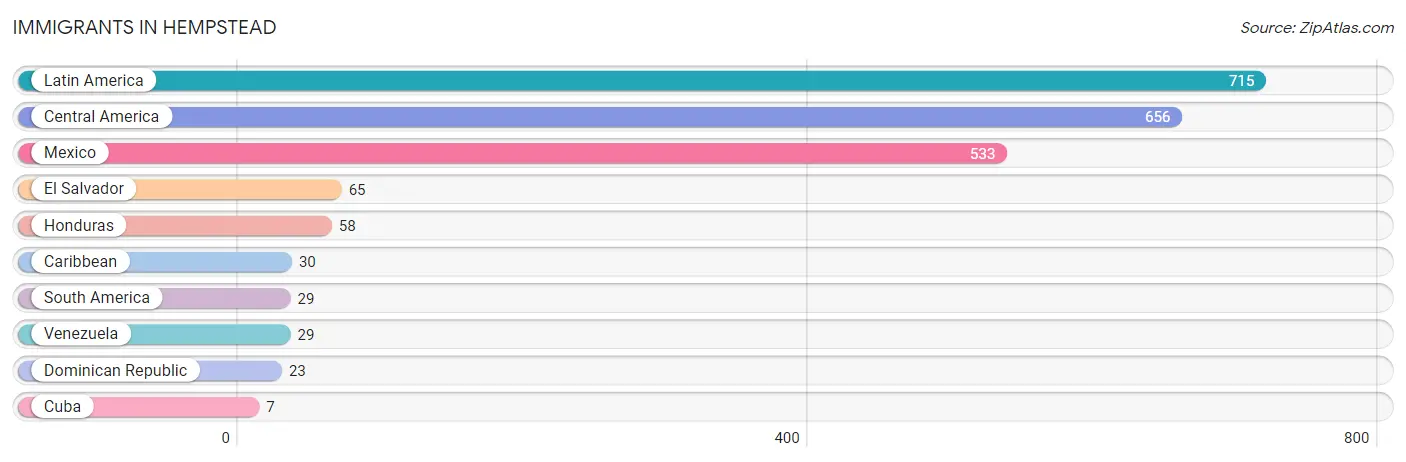
Immigrants in Hempstead
The most numerous immigrant groups reported in Hempstead came from Latin America (715 | 12.6%), Central America (656 | 11.5%), Mexico (533 | 9.4%), El Salvador (65 | 1.1%), and Honduras (58 | 1.0%), together accounting for 35.6% of all Hempstead residents.
| Immigration Origin | # Population | % Population |
| Caribbean | 30 | 0.5% |
| Central America | 656 | 11.5% |
| Cuba | 7 | 0.1% |
| Dominican Republic | 23 | 0.4% |
| El Salvador | 65 | 1.1% |
| Honduras | 58 | 1.0% |
| Latin America | 715 | 12.6% |
| Mexico | 533 | 9.4% |
| South America | 29 | 0.5% |
| Venezuela | 29 | 0.5% | View All 10 Rows |
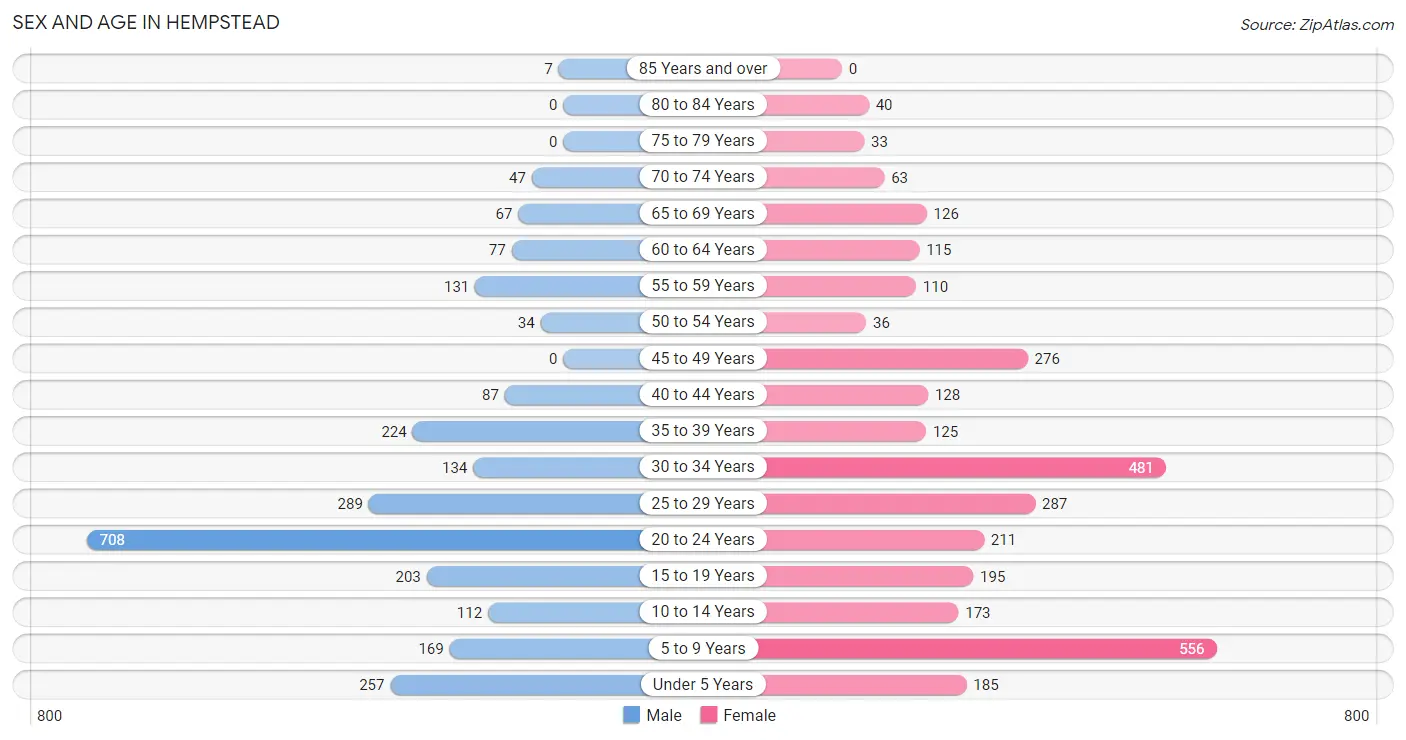
Sex and Age in Hempstead
Sex and Age in Hempstead
The most populous age groups in Hempstead are 20 to 24 Years (708 | 27.8%) for men and 5 to 9 Years (556 | 17.7%) for women.
| Age Bracket | Male | Female |
| Under 5 Years | 257 (10.1%) | 185 (5.9%) |
| 5 to 9 Years | 169 (6.6%) | 556 (17.7%) |
| 10 to 14 Years | 112 (4.4%) | 173 (5.5%) |
| 15 to 19 Years | 203 (8.0%) | 195 (6.2%) |
| 20 to 24 Years | 708 (27.8%) | 211 (6.7%) |
| 25 to 29 Years | 289 (11.4%) | 287 (9.1%) |
| 30 to 34 Years | 134 (5.3%) | 481 (15.3%) |
| 35 to 39 Years | 224 (8.8%) | 125 (4.0%) |
| 40 to 44 Years | 87 (3.4%) | 128 (4.1%) |
| 45 to 49 Years | 0 (0.0%) | 276 (8.8%) |
| 50 to 54 Years | 34 (1.3%) | 36 (1.1%) |
| 55 to 59 Years | 131 (5.1%) | 110 (3.5%) |
| 60 to 64 Years | 77 (3.0%) | 115 (3.7%) |
| 65 to 69 Years | 67 (2.6%) | 126 (4.0%) |
| 70 to 74 Years | 47 (1.8%) | 63 (2.0%) |
| 75 to 79 Years | 0 (0.0%) | 33 (1.1%) |
| 80 to 84 Years | 0 (0.0%) | 40 (1.3%) |
| 85 Years and over | 7 (0.3%) | 0 (0.0%) |
| Total | 2,546 (100.0%) | 3,140 (100.0%) |
Families and Households in Hempstead
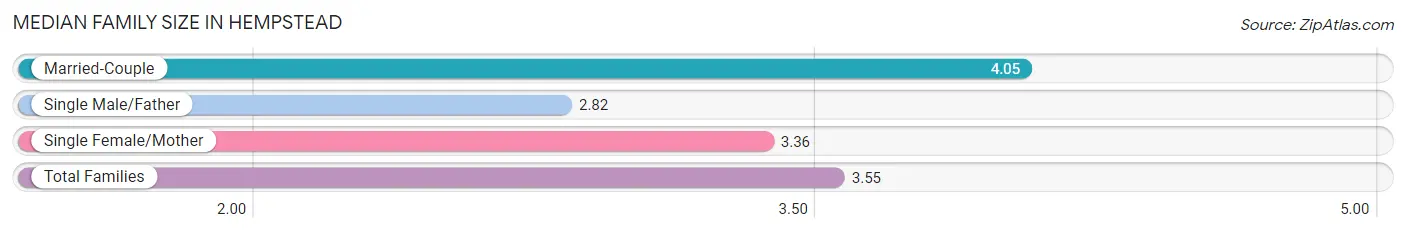
Median Family Size in Hempstead
The median family size in Hempstead is 3.55 persons per family, with married-couple families (408 | 31.5%) accounting for the largest median family size of 4.05 persons per family. On the other hand, single male/father families (72 | 5.6%) represent the smallest median family size with 2.82 persons per family.
| Family Type | # Families | Family Size |
| Married-Couple | 408 (31.5%) | 4.05 |
| Single Male/Father | 72 (5.6%) | 2.82 |
| Single Female/Mother | 814 (62.9%) | 3.36 |
| Total Families | 1,294 (100.0%) | 3.55 |
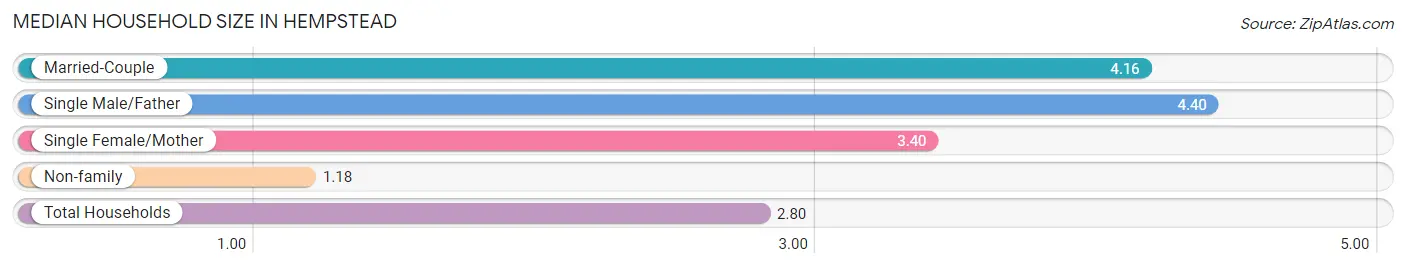
Median Household Size in Hempstead
The median household size in Hempstead is 2.80 persons per household, with single male/father households (72 | 3.6%) accounting for the largest median household size of 4.4 persons per household. non-family households (716 | 35.6%) represent the smallest median household size with 1.18 persons per household.
| Household Type | # Households | Household Size |
| Married-Couple | 408 (20.3%) | 4.16 |
| Single Male/Father | 72 (3.6%) | 4.40 |
| Single Female/Mother | 814 (40.5%) | 3.40 |
| Non-family | 716 (35.6%) | 1.18 |
| Total Households | 2,010 (100.0%) | 2.80 |
Household Size by Marriage Status in Hempstead
Out of a total of 2,010 households in Hempstead, 1,294 (64.4%) are family households, while 716 (35.6%) are nonfamily households. The most numerous type of family households are 2-person households, comprising 582, and the most common type of nonfamily households are 1-person households, comprising 540.
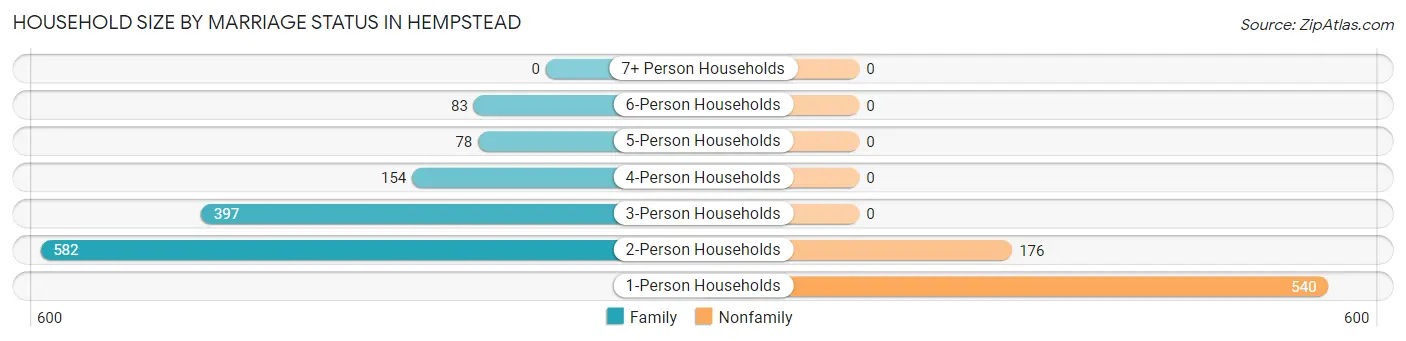
| Household Size | Family Households | Nonfamily Households |
| 1-Person Households | - | 540 (26.9%) |
| 2-Person Households | 582 (29.0%) | 176 (8.8%) |
| 3-Person Households | 397 (19.8%) | 0 (0.0%) |
| 4-Person Households | 154 (7.7%) | 0 (0.0%) |
| 5-Person Households | 78 (3.9%) | 0 (0.0%) |
| 6-Person Households | 83 (4.1%) | 0 (0.0%) |
| 7+ Person Households | 0 (0.0%) | 0 (0.0%) |
| Total | 1,294 (64.4%) | 716 (35.6%) |
Female Fertility in Hempstead
Fertility by Age in Hempstead
Average fertility rate in Hempstead is 116.0 births per 1,000 women. Women in the age bracket of 20 to 34 years have the highest fertility rate with 201.0 births per 1,000 women. Women in the age bracket of 20 to 34 years acount for 100.0% of all women with births.
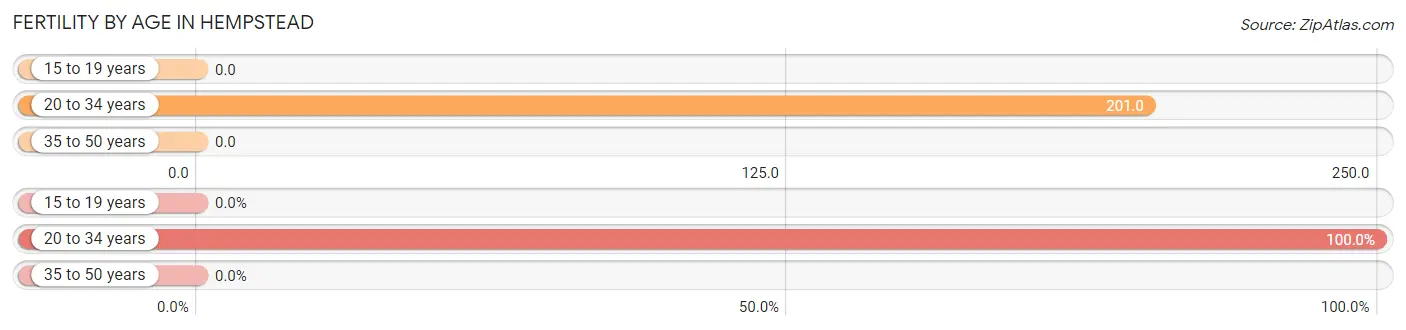
| Age Bracket | Women with Births | Births / 1,000 Women |
| 15 to 19 years | 0 (0.0%) | 0.0 |
| 20 to 34 years | 197 (100.0%) | 201.0 |
| 35 to 50 years | 0 (0.0%) | 0.0 |
| Total | 197 (100.0%) | 116.0 |
Fertility by Age by Marriage Status in Hempstead
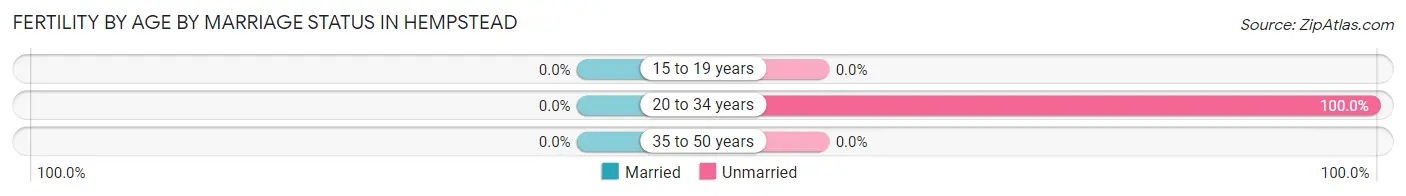
| Age Bracket | Married | Unmarried |
| 15 to 19 years | 0 (0.0%) | 0 (0.0%) |
| 20 to 34 years | 0 (0.0%) | 197 (100.0%) |
| 35 to 50 years | 0 (0.0%) | 0 (0.0%) |
| Total | 0 (0.0%) | 197 (100.0%) |
Fertility by Education in Hempstead
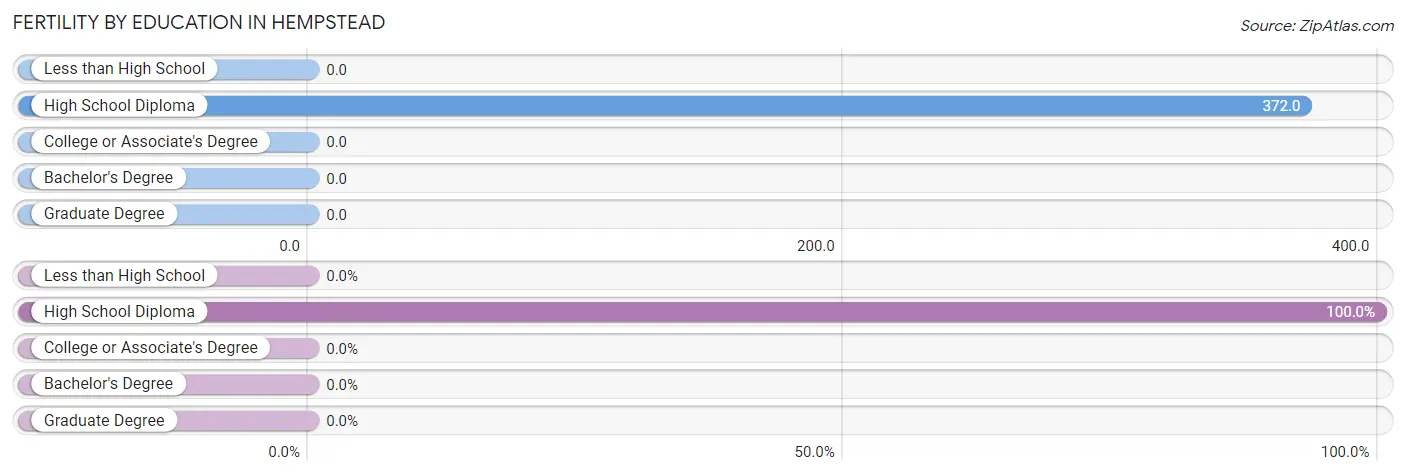
| Educational Attainment | Women with Births | Births / 1,000 Women |
| Less than High School | 0 (0.0%) | 0.0 |
| High School Diploma | 197 (100.0%) | 372.0 |
| College or Associate's Degree | 0 (0.0%) | 0.0 |
| Bachelor's Degree | 0 (0.0%) | 0.0 |
| Graduate Degree | 0 (0.0%) | 0.0 |
| Total | 197 (100.0%) | 116.0 |
Fertility by Education by Marriage Status in Hempstead
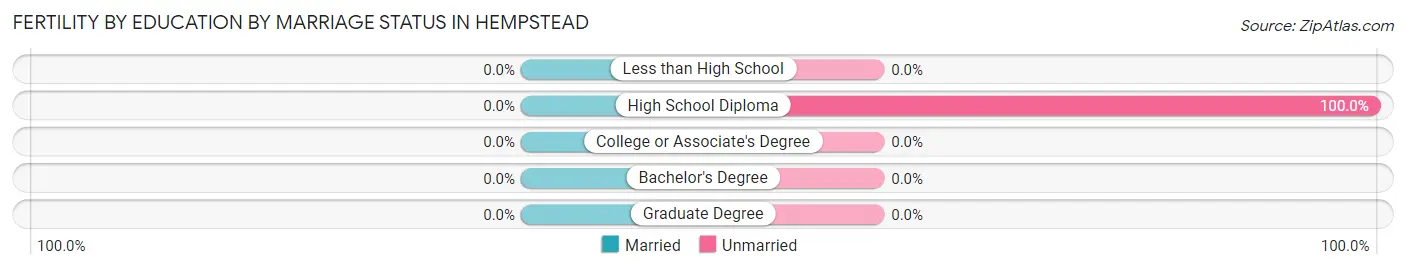
| Educational Attainment | Married | Unmarried |
| Less than High School | 0 (0.0%) | 0 (0.0%) |
| High School Diploma | 0 (0.0%) | 197 (100.0%) |
| College or Associate's Degree | 0 (0.0%) | 0 (0.0%) |
| Bachelor's Degree | 0 (0.0%) | 0 (0.0%) |
| Graduate Degree | 0 (0.0%) | 0 (0.0%) |
| Total | 0 (0.0%) | 197 (100.0%) |
Employment Characteristics in Hempstead
Employment by Class of Employer in Hempstead
Among the 2,473 employed individuals in Hempstead, private company employees (1,740 | 70.4%), local government employees (261 | 10.5%), and state government employees (232 | 9.4%) make up the most common classes of employment.
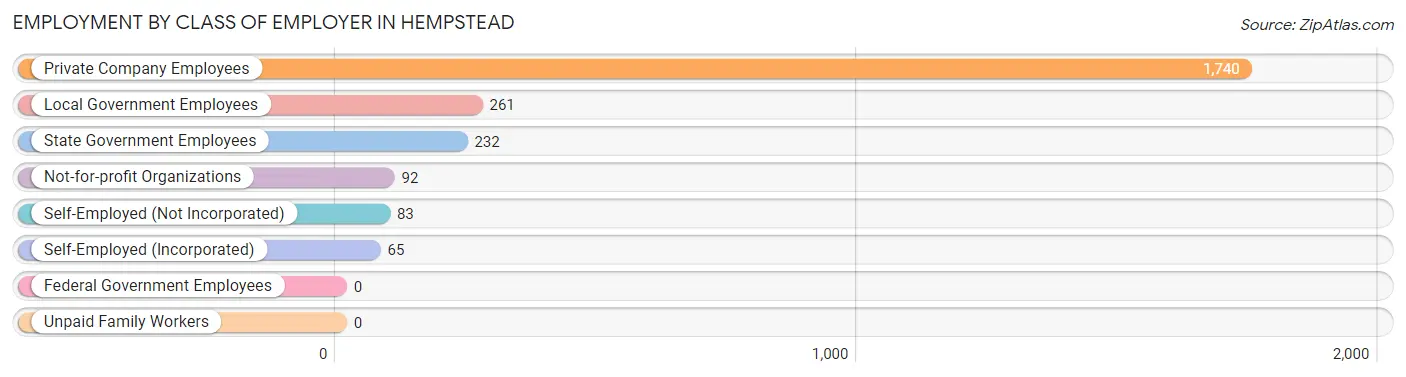
| Employer Class | # Employees | % Employees |
| Private Company Employees | 1,740 | 70.4% |
| Self-Employed (Incorporated) | 65 | 2.6% |
| Self-Employed (Not Incorporated) | 83 | 3.4% |
| Not-for-profit Organizations | 92 | 3.7% |
| Local Government Employees | 261 | 10.5% |
| State Government Employees | 232 | 9.4% |
| Federal Government Employees | 0 | 0.0% |
| Unpaid Family Workers | 0 | 0.0% |
| Total | 2,473 | 100.0% |
Employment Status by Age in Hempstead
According to the labor force statistics for Hempstead, out of the total population over 16 years of age (4,122), 60.5% or 2,494 individuals are in the labor force, with 0.8% or 20 of them unemployed. The age group with the highest labor force participation rate is 30 to 34 years, with 94.8% or 583 individuals in the labor force. Within the labor force, the 16 to 19 years age range has the highest percentage of unemployed individuals, with 11.8% or 20 of them being unemployed.
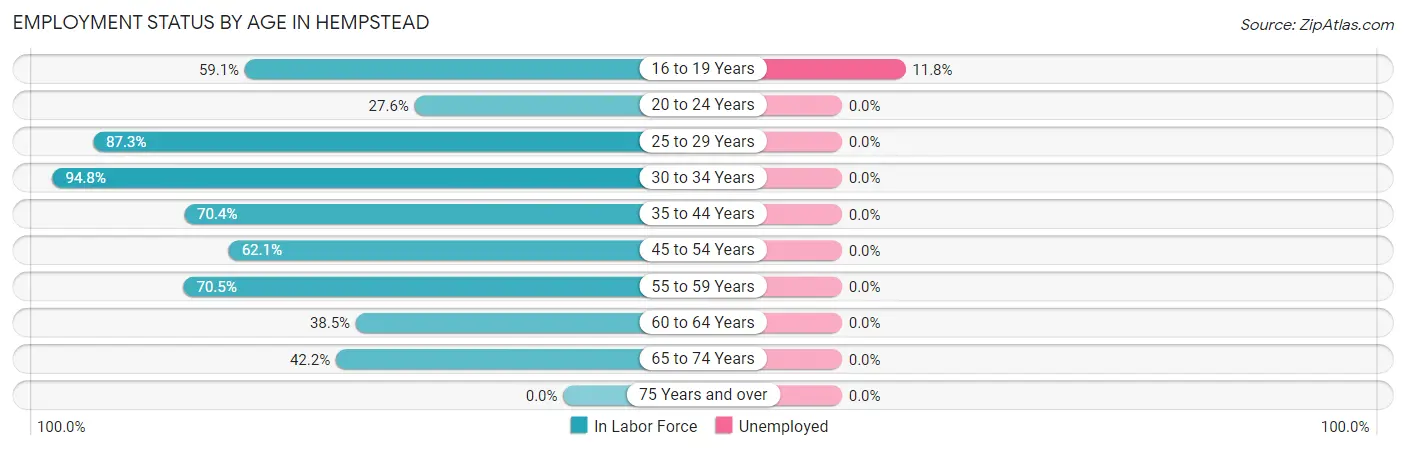
| Age Bracket | In Labor Force | Unemployed |
| 16 to 19 Years | 169 (59.1%) | 20 (11.8%) |
| 20 to 24 Years | 254 (27.6%) | 0 (0.0%) |
| 25 to 29 Years | 503 (87.3%) | 0 (0.0%) |
| 30 to 34 Years | 583 (94.8%) | 0 (0.0%) |
| 35 to 44 Years | 397 (70.4%) | 0 (0.0%) |
| 45 to 54 Years | 215 (62.1%) | 0 (0.0%) |
| 55 to 59 Years | 170 (70.5%) | 0 (0.0%) |
| 60 to 64 Years | 74 (38.5%) | 0 (0.0%) |
| 65 to 74 Years | 128 (42.2%) | 0 (0.0%) |
| 75 Years and over | 0 (0.0%) | 0 (0.0%) |
| Total | 2,494 (60.5%) | 20 (0.8%) |
Employment Status by Educational Attainment in Hempstead
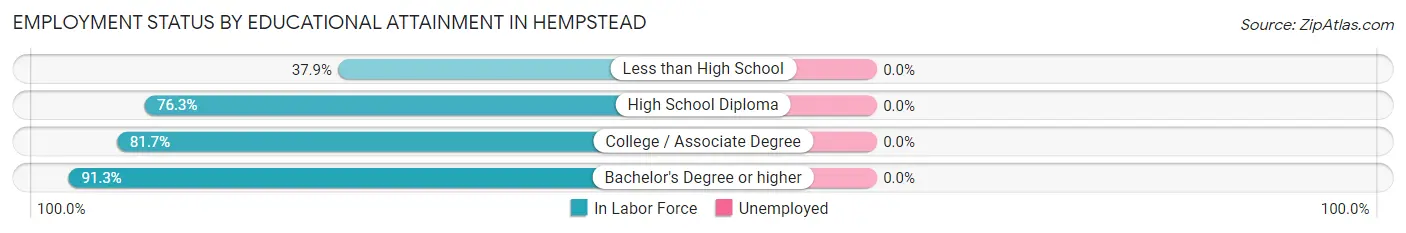
| Educational Attainment | In Labor Force | Unemployed |
| Less than High School | 116 (37.9%) | 0 (0.0%) |
| High School Diploma | 594 (76.3%) | 0 (0.0%) |
| College / Associate Degree | 779 (81.7%) | 0 (0.0%) |
| Bachelor's Degree or higher | 453 (91.3%) | 0 (0.0%) |
| Total | 1,941 (76.6%) | 0 (0.0%) |
Employment Occupations by Sex in Hempstead
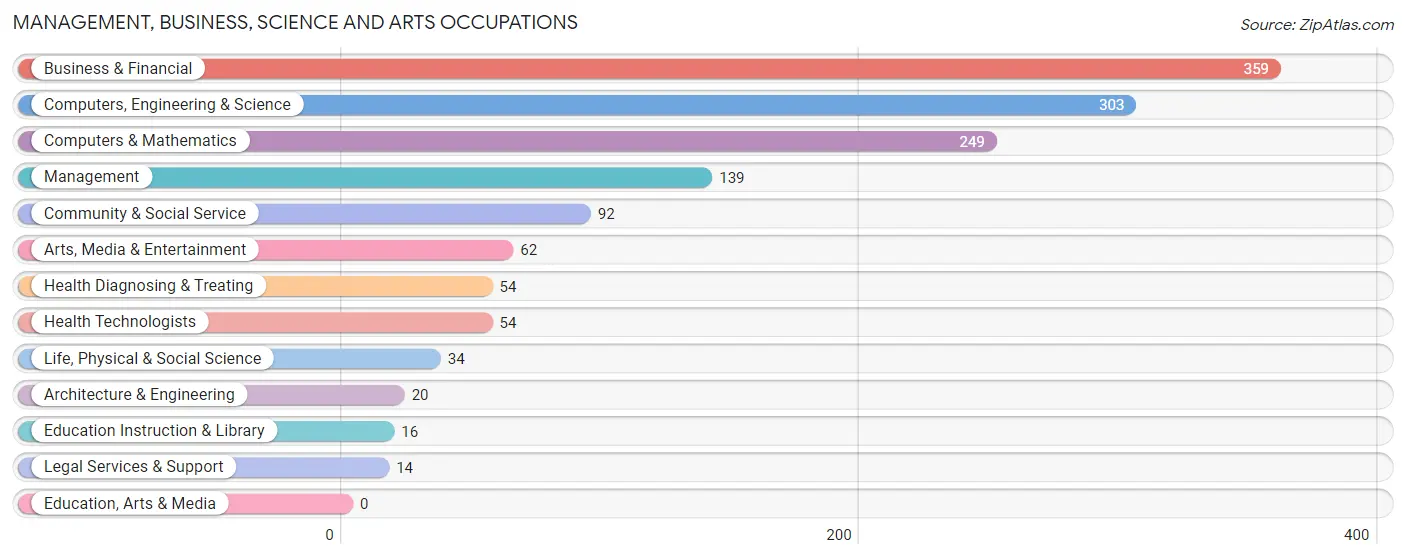
Management, Business, Science and Arts Occupations
The most common Management, Business, Science and Arts occupations in Hempstead are Business & Financial (359 | 14.5%), Computers, Engineering & Science (303 | 12.2%), Computers & Mathematics (249 | 10.1%), Management (139 | 5.6%), and Community & Social Service (92 | 3.7%).
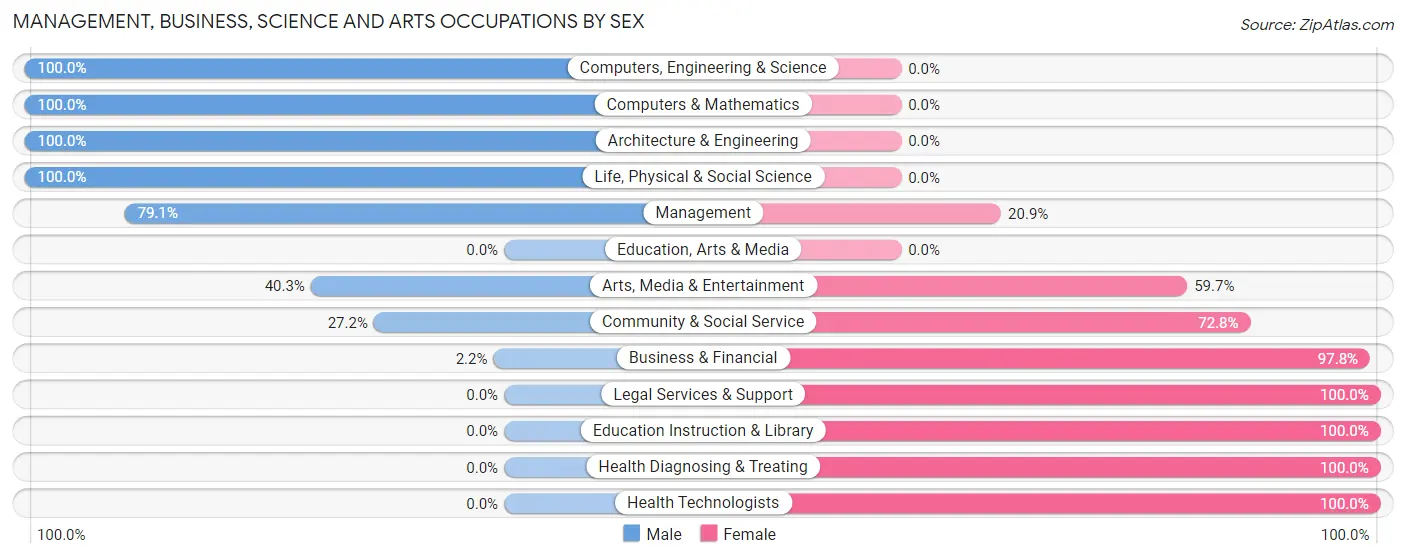
Management, Business, Science and Arts Occupations by Sex
Within the Management, Business, Science and Arts occupations in Hempstead, the most male-oriented occupations are Computers, Engineering & Science (100.0%), Computers & Mathematics (100.0%), and Architecture & Engineering (100.0%), while the most female-oriented occupations are Legal Services & Support (100.0%), Education Instruction & Library (100.0%), and Health Diagnosing & Treating (100.0%).
| Occupation | Male | Female |
| Management | 110 (79.1%) | 29 (20.9%) |
| Business & Financial | 8 (2.2%) | 351 (97.8%) |
| Computers, Engineering & Science | 303 (100.0%) | 0 (0.0%) |
| Computers & Mathematics | 249 (100.0%) | 0 (0.0%) |
| Architecture & Engineering | 20 (100.0%) | 0 (0.0%) |
| Life, Physical & Social Science | 34 (100.0%) | 0 (0.0%) |
| Community & Social Service | 25 (27.2%) | 67 (72.8%) |
| Education, Arts & Media | 0 (0.0%) | 0 (0.0%) |
| Legal Services & Support | 0 (0.0%) | 14 (100.0%) |
| Education Instruction & Library | 0 (0.0%) | 16 (100.0%) |
| Arts, Media & Entertainment | 25 (40.3%) | 37 (59.7%) |
| Health Diagnosing & Treating | 0 (0.0%) | 54 (100.0%) |
| Health Technologists | 0 (0.0%) | 54 (100.0%) |
| Total (Category) | 446 (47.1%) | 501 (52.9%) |
| Total (Overall) | 929 (37.6%) | 1,544 (62.4%) |
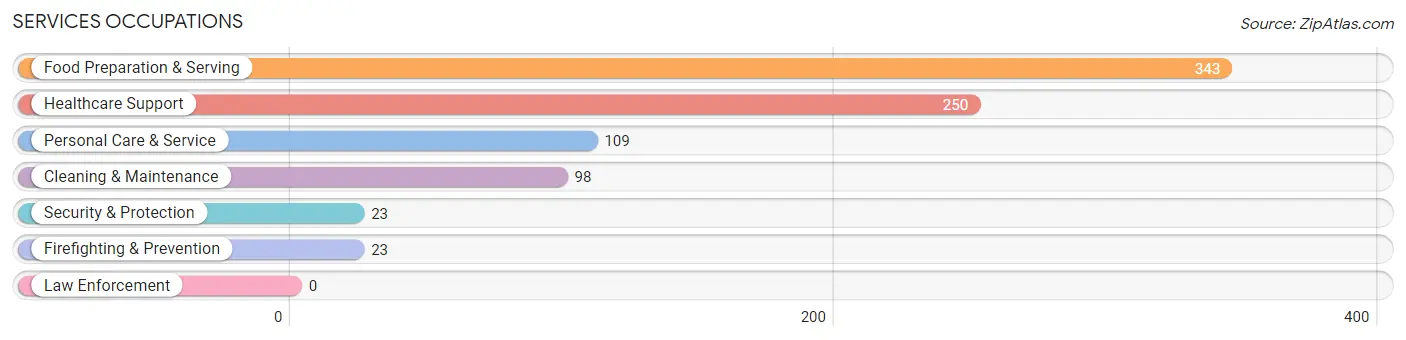
Services Occupations
The most common Services occupations in Hempstead are Food Preparation & Serving (343 | 13.9%), Healthcare Support (250 | 10.1%), Personal Care & Service (109 | 4.4%), Cleaning & Maintenance (98 | 4.0%), and Security & Protection (23 | 0.9%).
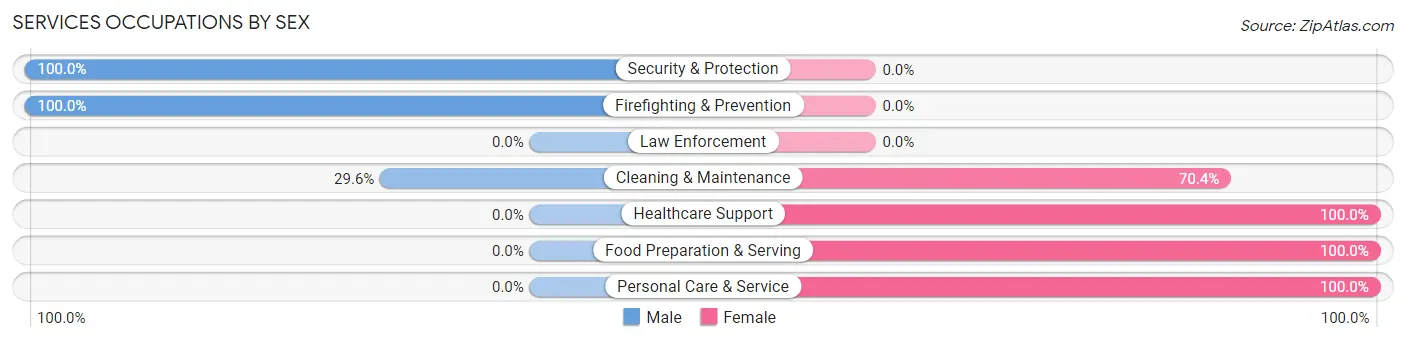
Services Occupations by Sex
Within the Services occupations in Hempstead, the most male-oriented occupations are Security & Protection (100.0%), Firefighting & Prevention (100.0%), and Cleaning & Maintenance (29.6%), while the most female-oriented occupations are Healthcare Support (100.0%), Food Preparation & Serving (100.0%), and Personal Care & Service (100.0%).
| Occupation | Male | Female |
| Healthcare Support | 0 (0.0%) | 250 (100.0%) |
| Security & Protection | 23 (100.0%) | 0 (0.0%) |
| Firefighting & Prevention | 23 (100.0%) | 0 (0.0%) |
| Law Enforcement | 0 (0.0%) | 0 (0.0%) |
| Food Preparation & Serving | 0 (0.0%) | 343 (100.0%) |
| Cleaning & Maintenance | 29 (29.6%) | 69 (70.4%) |
| Personal Care & Service | 0 (0.0%) | 109 (100.0%) |
| Total (Category) | 52 (6.3%) | 771 (93.7%) |
| Total (Overall) | 929 (37.6%) | 1,544 (62.4%) |
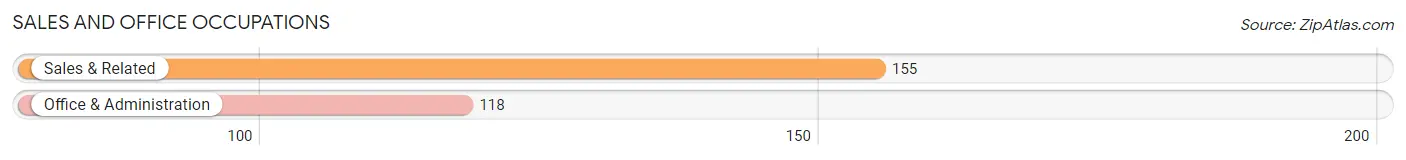
Sales and Office Occupations
The most common Sales and Office occupations in Hempstead are Sales & Related (155 | 6.3%), and Office & Administration (118 | 4.8%).
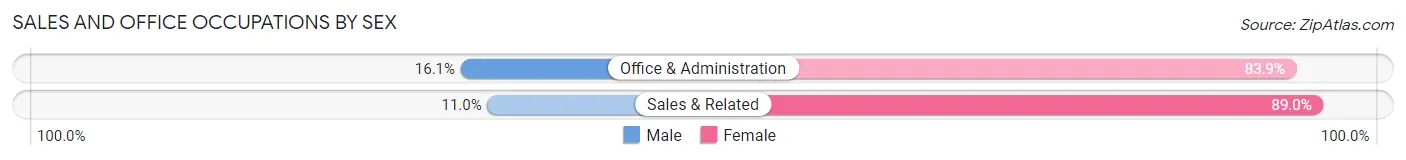
Sales and Office Occupations by Sex
| Occupation | Male | Female |
| Sales & Related | 17 (11.0%) | 138 (89.0%) |
| Office & Administration | 19 (16.1%) | 99 (83.9%) |
| Total (Category) | 36 (13.2%) | 237 (86.8%) |
| Total (Overall) | 929 (37.6%) | 1,544 (62.4%) |
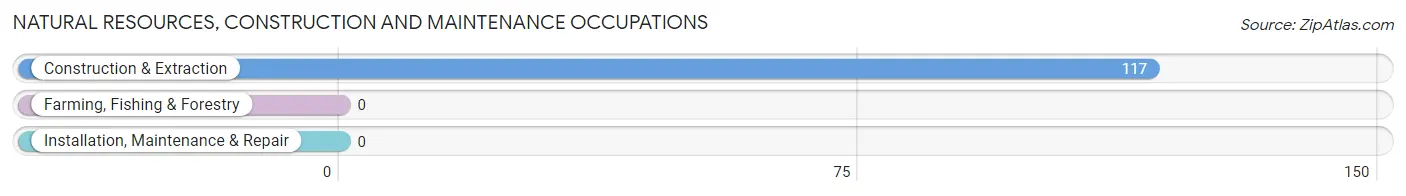
Natural Resources, Construction and Maintenance Occupations
The most common Natural Resources, Construction and Maintenance occupations in Hempstead are , and Construction & Extraction (117 | 4.7%).
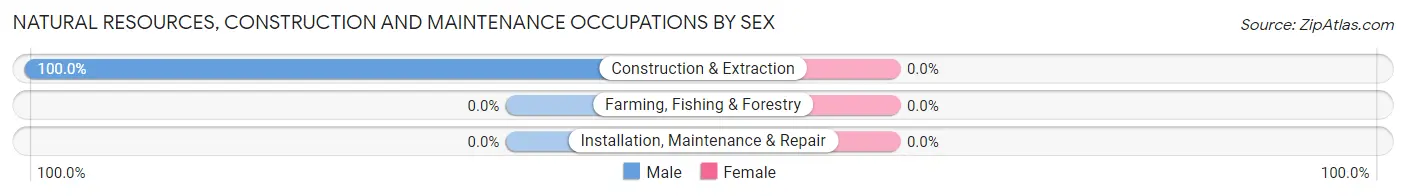
Natural Resources, Construction and Maintenance Occupations by Sex
| Occupation | Male | Female |
| Farming, Fishing & Forestry | 0 (0.0%) | 0 (0.0%) |
| Construction & Extraction | 117 (100.0%) | 0 (0.0%) |
| Installation, Maintenance & Repair | 0 (0.0%) | 0 (0.0%) |
| Total (Category) | 117 (100.0%) | 0 (0.0%) |
| Total (Overall) | 929 (37.6%) | 1,544 (62.4%) |
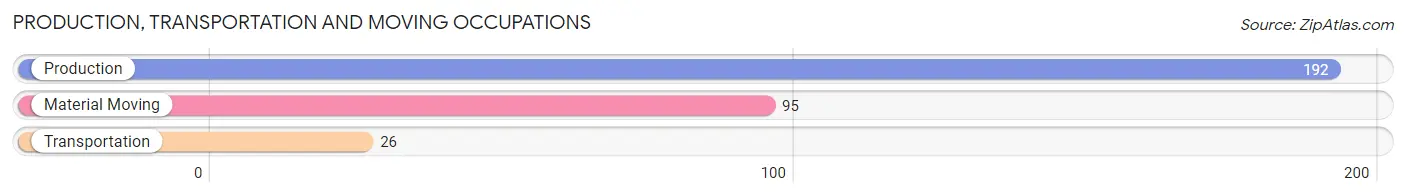
Production, Transportation and Moving Occupations
The most common Production, Transportation and Moving occupations in Hempstead are Production (192 | 7.8%), Material Moving (95 | 3.8%), and Transportation (26 | 1.1%).
Production, Transportation and Moving Occupations by Sex
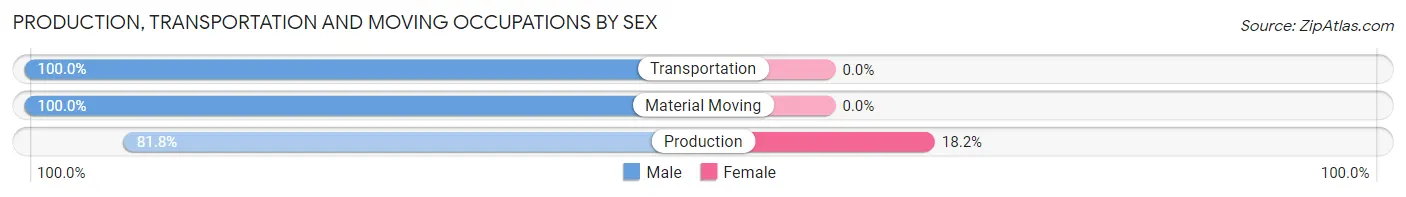
| Occupation | Male | Female |
| Production | 157 (81.8%) | 35 (18.2%) |
| Transportation | 26 (100.0%) | 0 (0.0%) |
| Material Moving | 95 (100.0%) | 0 (0.0%) |
| Total (Category) | 278 (88.8%) | 35 (11.2%) |
| Total (Overall) | 929 (37.6%) | 1,544 (62.4%) |
Employment Industries by Sex in Hempstead
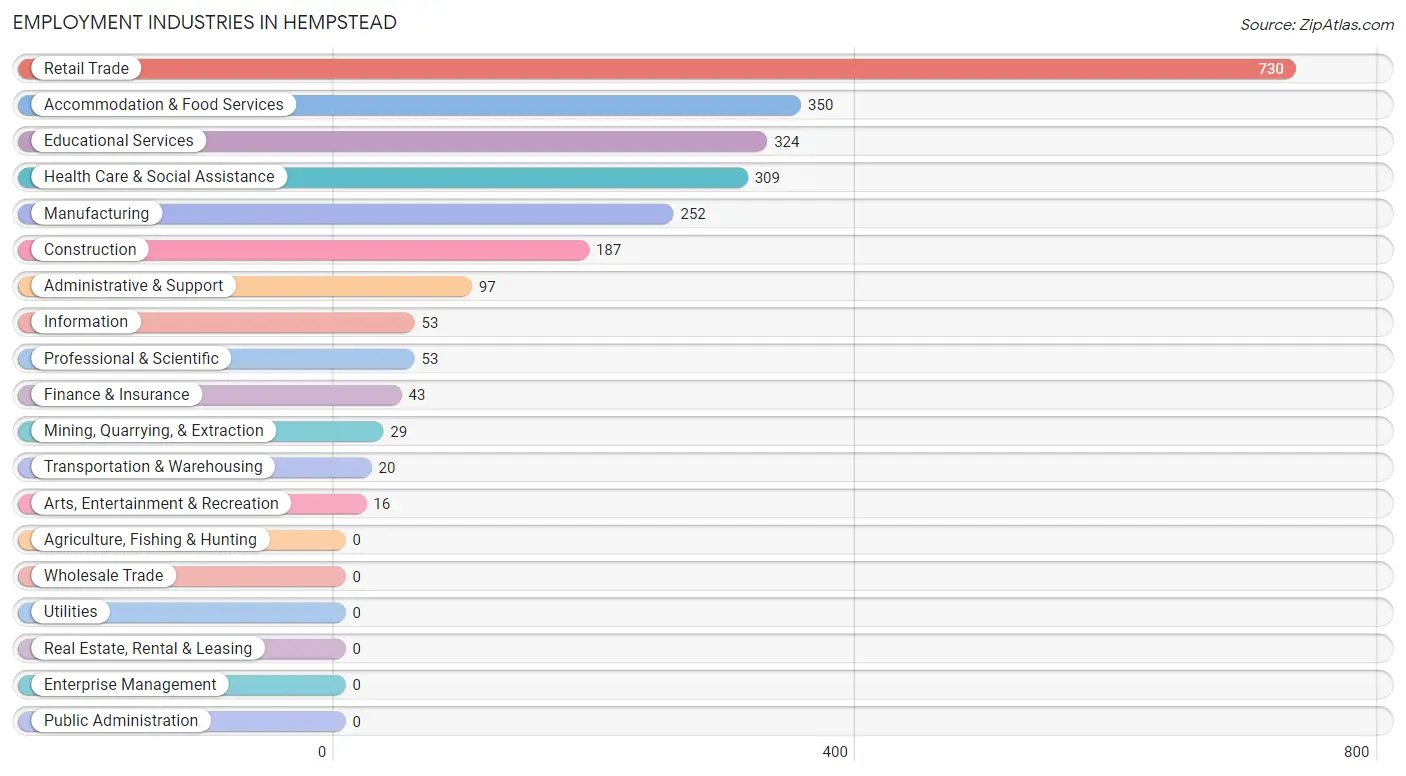
Employment Industries in Hempstead
The major employment industries in Hempstead include Retail Trade (730 | 29.5%), Accommodation & Food Services (350 | 14.1%), Educational Services (324 | 13.1%), Health Care & Social Assistance (309 | 12.5%), and Manufacturing (252 | 10.2%).
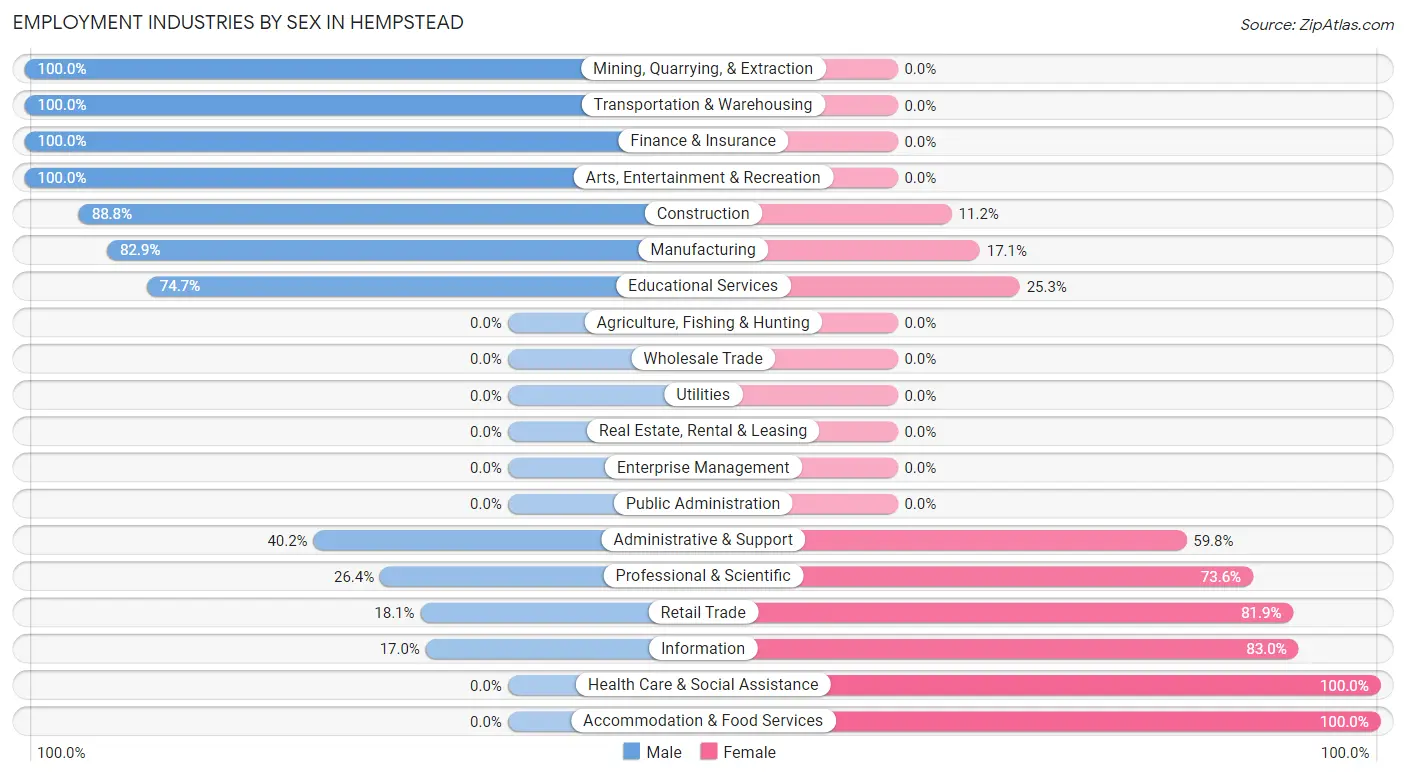
Employment Industries by Sex in Hempstead
The Hempstead industries that see more men than women are Mining, Quarrying, & Extraction (100.0%), Transportation & Warehousing (100.0%), and Finance & Insurance (100.0%), whereas the industries that tend to have a higher number of women are Health Care & Social Assistance (100.0%), Accommodation & Food Services (100.0%), and Information (83.0%).
| Industry | Male | Female |
| Agriculture, Fishing & Hunting | 0 (0.0%) | 0 (0.0%) |
| Mining, Quarrying, & Extraction | 29 (100.0%) | 0 (0.0%) |
| Construction | 166 (88.8%) | 21 (11.2%) |
| Manufacturing | 209 (82.9%) | 43 (17.1%) |
| Wholesale Trade | 0 (0.0%) | 0 (0.0%) |
| Retail Trade | 132 (18.1%) | 598 (81.9%) |
| Transportation & Warehousing | 20 (100.0%) | 0 (0.0%) |
| Utilities | 0 (0.0%) | 0 (0.0%) |
| Information | 9 (17.0%) | 44 (83.0%) |
| Finance & Insurance | 43 (100.0%) | 0 (0.0%) |
| Real Estate, Rental & Leasing | 0 (0.0%) | 0 (0.0%) |
| Professional & Scientific | 14 (26.4%) | 39 (73.6%) |
| Enterprise Management | 0 (0.0%) | 0 (0.0%) |
| Administrative & Support | 39 (40.2%) | 58 (59.8%) |
| Educational Services | 242 (74.7%) | 82 (25.3%) |
| Health Care & Social Assistance | 0 (0.0%) | 309 (100.0%) |
| Arts, Entertainment & Recreation | 16 (100.0%) | 0 (0.0%) |
| Accommodation & Food Services | 0 (0.0%) | 350 (100.0%) |
| Public Administration | 0 (0.0%) | 0 (0.0%) |
| Total | 929 (37.6%) | 1,544 (62.4%) |
Education in Hempstead
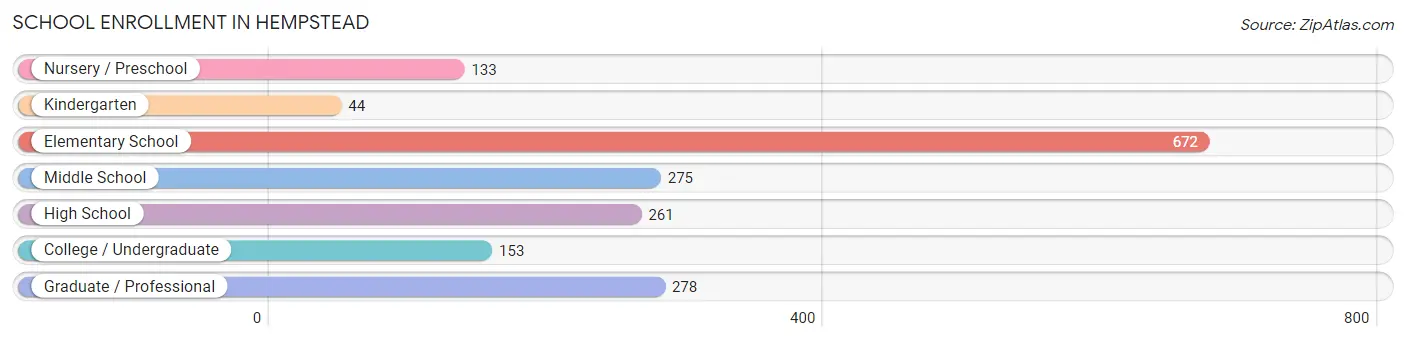
School Enrollment in Hempstead
The most common levels of schooling among the 1,816 students in Hempstead are elementary school (672 | 37.0%), graduate / professional (278 | 15.3%), and middle school (275 | 15.1%).
| School Level | # Students | % Students |
| Nursery / Preschool | 133 | 7.3% |
| Kindergarten | 44 | 2.4% |
| Elementary School | 672 | 37.0% |
| Middle School | 275 | 15.1% |
| High School | 261 | 14.4% |
| College / Undergraduate | 153 | 8.4% |
| Graduate / Professional | 278 | 15.3% |
| Total | 1,816 | 100.0% |
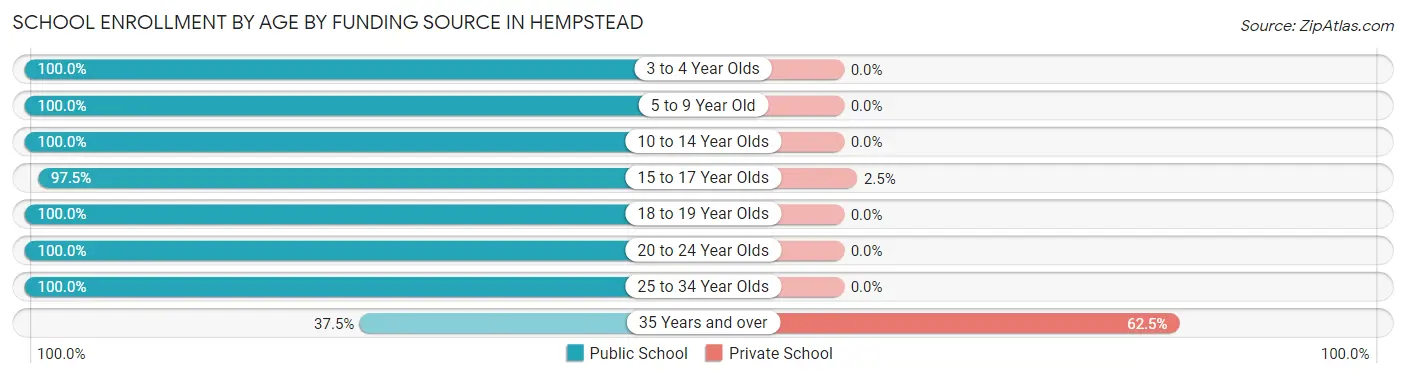
School Enrollment by Age by Funding Source in Hempstead
Out of a total of 1,816 students who are enrolled in schools in Hempstead, 22 (1.2%) attend a private institution, while the remaining 1,794 (98.8%) are enrolled in public schools. The age group of 35 years and over has the highest likelihood of being enrolled in private schools, with 15 (62.5% in the age bracket) enrolled. Conversely, the age group of 3 to 4 year olds has the lowest likelihood of being enrolled in a private school, with 111 (100.0% in the age bracket) attending a public institution.
| Age Bracket | Public School | Private School |
| 3 to 4 Year Olds | 111 (100.0%) | 0 (0.0%) |
| 5 to 9 Year Old | 679 (100.0%) | 0 (0.0%) |
| 10 to 14 Year Olds | 285 (100.0%) | 0 (0.0%) |
| 15 to 17 Year Olds | 275 (97.5%) | 7 (2.5%) |
| 18 to 19 Year Olds | 20 (100.0%) | 0 (0.0%) |
| 20 to 24 Year Olds | 108 (100.0%) | 0 (0.0%) |
| 25 to 34 Year Olds | 307 (100.0%) | 0 (0.0%) |
| 35 Years and over | 9 (37.5%) | 15 (62.5%) |
| Total | 1,794 (98.8%) | 22 (1.2%) |
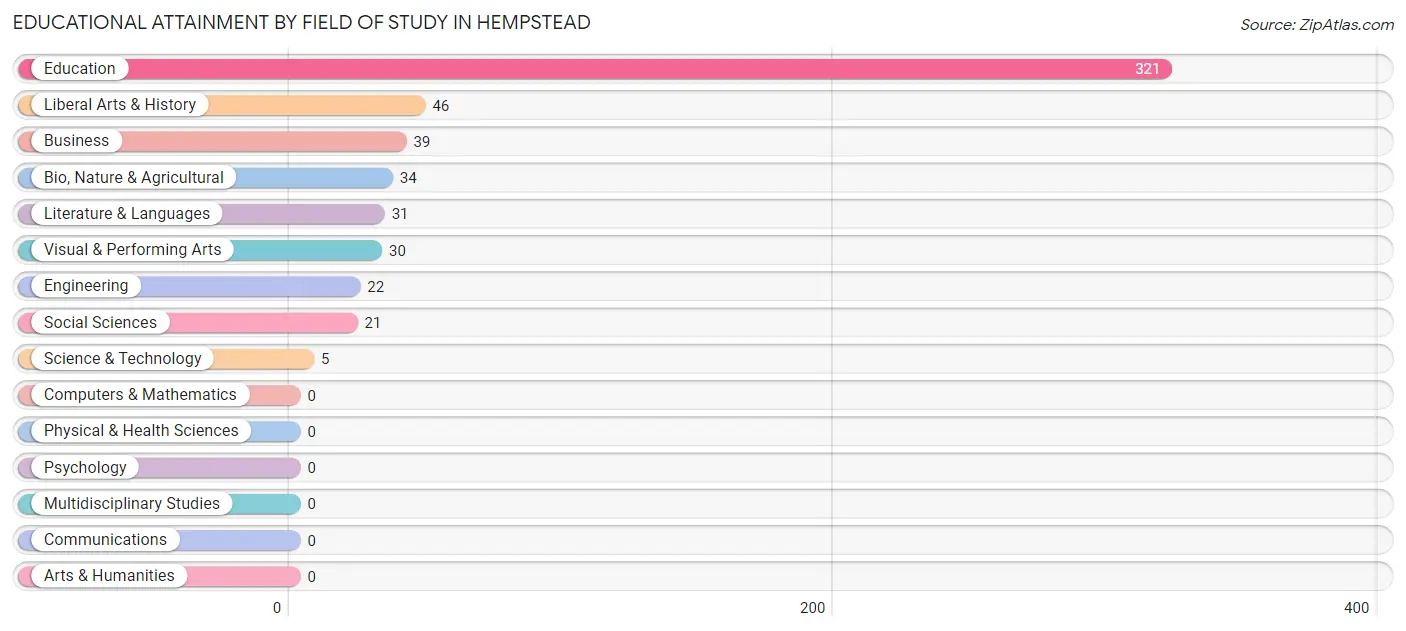
Educational Attainment by Field of Study in Hempstead
Education (321 | 58.5%), liberal arts & history (46 | 8.4%), business (39 | 7.1%), bio, nature & agricultural (34 | 6.2%), and literature & languages (31 | 5.7%) are the most common fields of study among 549 individuals in Hempstead who have obtained a bachelor's degree or higher.
| Field of Study | # Graduates | % Graduates |
| Computers & Mathematics | 0 | 0.0% |
| Bio, Nature & Agricultural | 34 | 6.2% |
| Physical & Health Sciences | 0 | 0.0% |
| Psychology | 0 | 0.0% |
| Social Sciences | 21 | 3.8% |
| Engineering | 22 | 4.0% |
| Multidisciplinary Studies | 0 | 0.0% |
| Science & Technology | 5 | 0.9% |
| Business | 39 | 7.1% |
| Education | 321 | 58.5% |
| Literature & Languages | 31 | 5.7% |
| Liberal Arts & History | 46 | 8.4% |
| Visual & Performing Arts | 30 | 5.5% |
| Communications | 0 | 0.0% |
| Arts & Humanities | 0 | 0.0% |
| Total | 549 | 100.0% |
Transportation & Commute in Hempstead
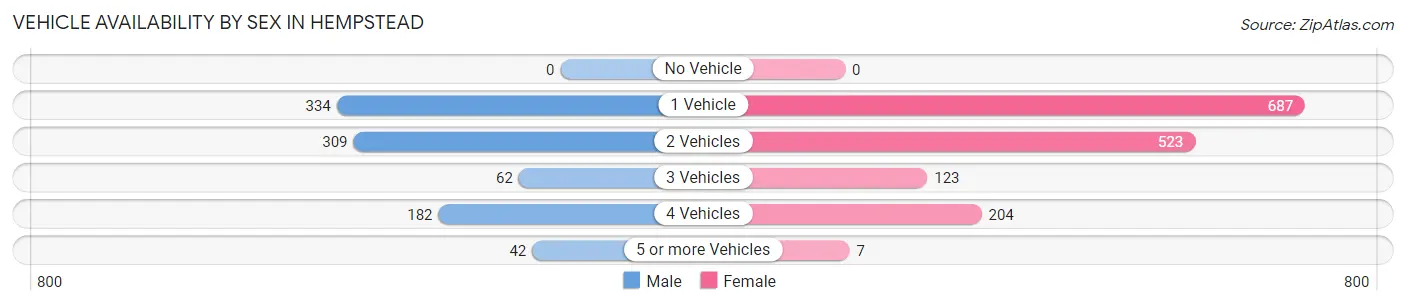
Vehicle Availability by Sex in Hempstead
The most prevalent vehicle ownership categories in Hempstead are males with 1 vehicle (334, accounting for 35.9%) and females with 1 vehicle (687, making up 21.6%).
| Vehicles Available | Male | Female |
| No Vehicle | 0 (0.0%) | 0 (0.0%) |
| 1 Vehicle | 334 (35.9%) | 687 (44.5%) |
| 2 Vehicles | 309 (33.3%) | 523 (33.9%) |
| 3 Vehicles | 62 (6.7%) | 123 (8.0%) |
| 4 Vehicles | 182 (19.6%) | 204 (13.2%) |
| 5 or more Vehicles | 42 (4.5%) | 7 (0.4%) |
| Total | 929 (100.0%) | 1,544 (100.0%) |
Commute Time in Hempstead
The most frequently occuring commute durations in Hempstead are 45 to 59 minutes (657 commuters, 26.8%), 10 to 14 minutes (644 commuters, 26.3%), and 20 to 24 minutes (238 commuters, 9.7%).
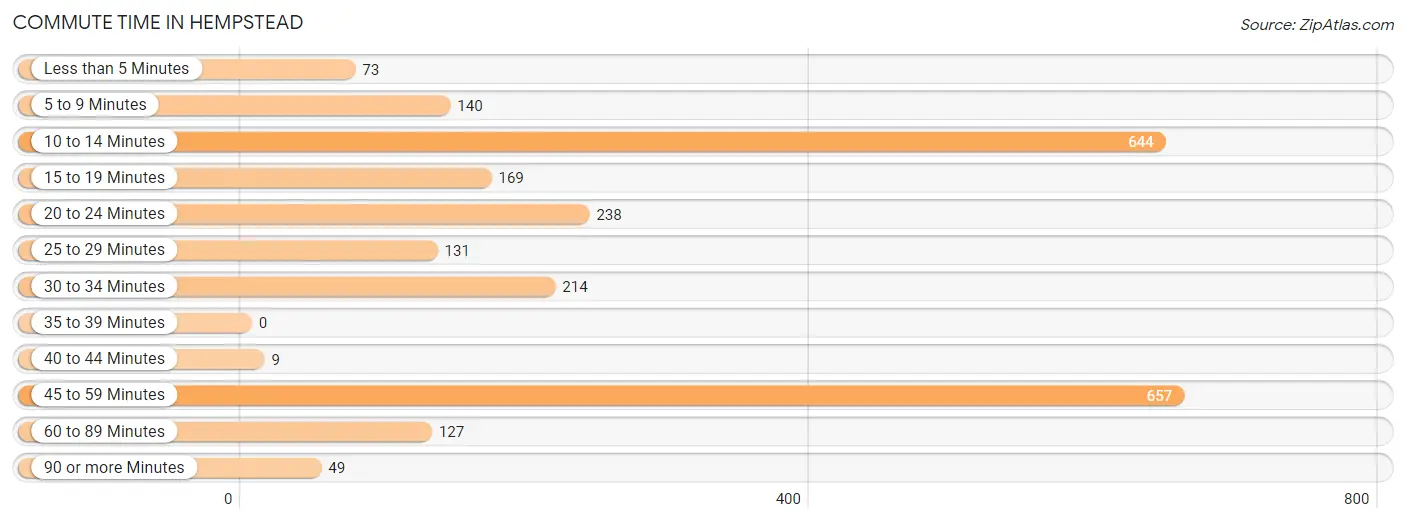
| Commute Time | # Commuters | % Commuters |
| Less than 5 Minutes | 73 | 3.0% |
| 5 to 9 Minutes | 140 | 5.7% |
| 10 to 14 Minutes | 644 | 26.3% |
| 15 to 19 Minutes | 169 | 6.9% |
| 20 to 24 Minutes | 238 | 9.7% |
| 25 to 29 Minutes | 131 | 5.3% |
| 30 to 34 Minutes | 214 | 8.7% |
| 35 to 39 Minutes | 0 | 0.0% |
| 40 to 44 Minutes | 9 | 0.4% |
| 45 to 59 Minutes | 657 | 26.8% |
| 60 to 89 Minutes | 127 | 5.2% |
| 90 or more Minutes | 49 | 2.0% |
Commute Time by Sex in Hempstead
The most common commute times in Hempstead are 10 to 14 minutes (274 commuters, 29.9%) for males and 45 to 59 minutes (446 commuters, 29.1%) for females.
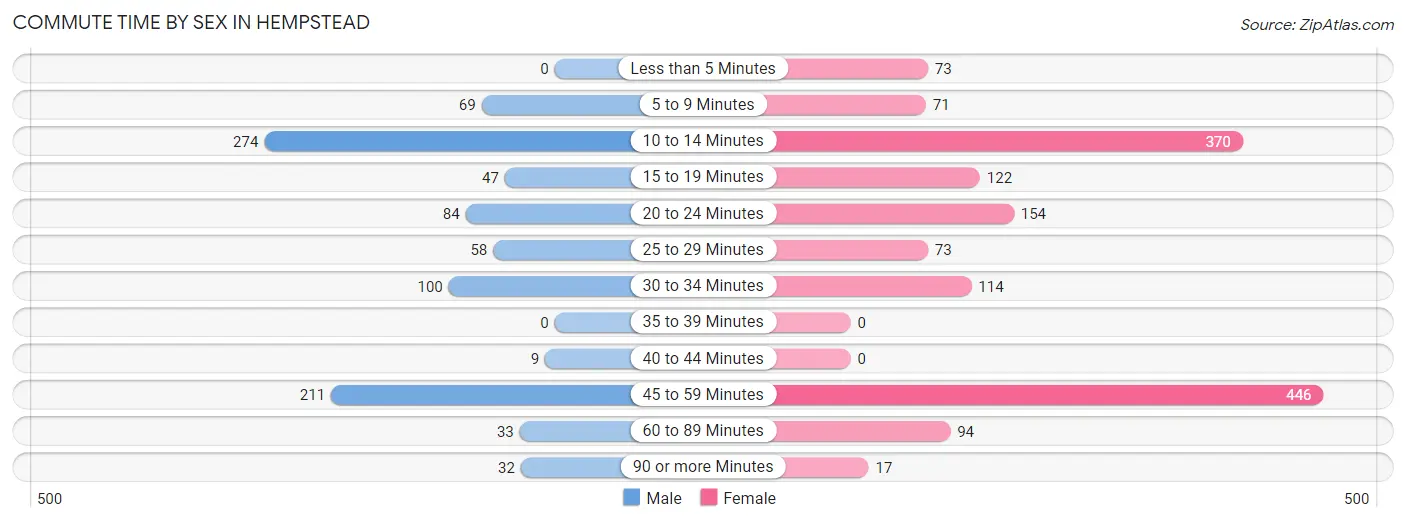
| Commute Time | Male | Female |
| Less than 5 Minutes | 0 (0.0%) | 73 (4.8%) |
| 5 to 9 Minutes | 69 (7.5%) | 71 (4.6%) |
| 10 to 14 Minutes | 274 (29.9%) | 370 (24.1%) |
| 15 to 19 Minutes | 47 (5.1%) | 122 (8.0%) |
| 20 to 24 Minutes | 84 (9.2%) | 154 (10.0%) |
| 25 to 29 Minutes | 58 (6.3%) | 73 (4.8%) |
| 30 to 34 Minutes | 100 (10.9%) | 114 (7.4%) |
| 35 to 39 Minutes | 0 (0.0%) | 0 (0.0%) |
| 40 to 44 Minutes | 9 (1.0%) | 0 (0.0%) |
| 45 to 59 Minutes | 211 (23.0%) | 446 (29.1%) |
| 60 to 89 Minutes | 33 (3.6%) | 94 (6.1%) |
| 90 or more Minutes | 32 (3.5%) | 17 (1.1%) |
Time of Departure to Work by Sex in Hempstead
The most frequent times of departure to work in Hempstead are 6:30 AM to 6:59 AM (286, 31.2%) for males and 8:00 AM to 8:29 AM (421, 27.4%) for females.
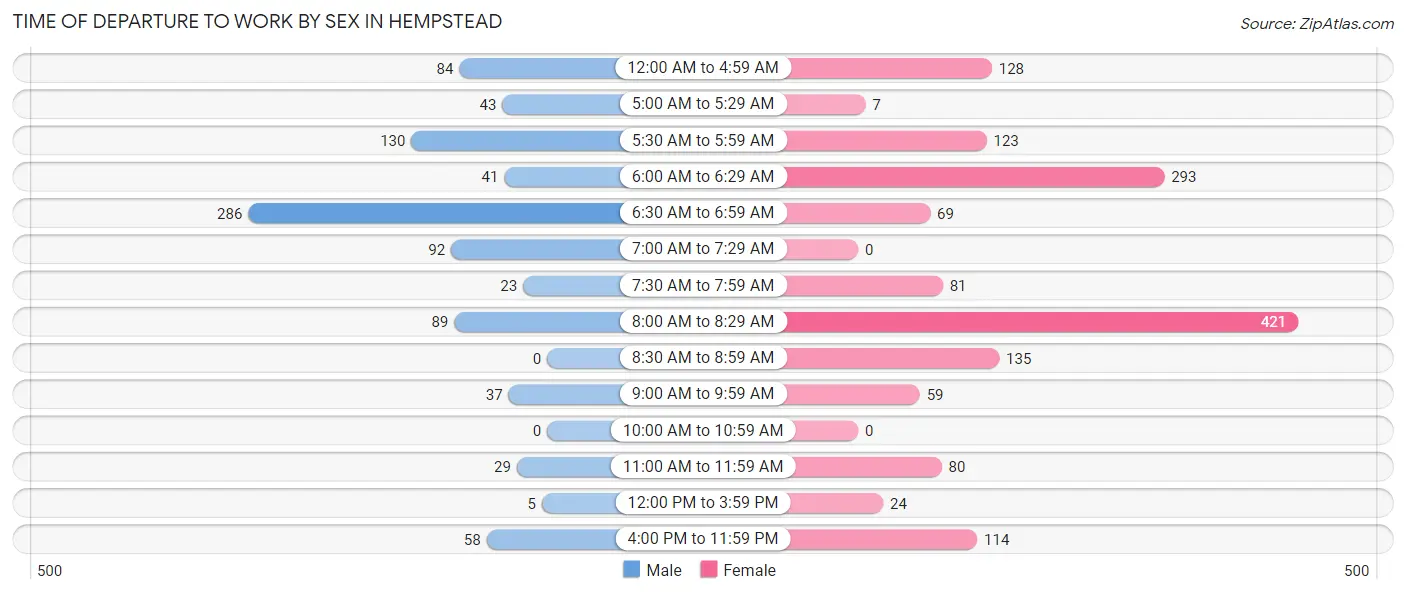
| Time of Departure | Male | Female |
| 12:00 AM to 4:59 AM | 84 (9.2%) | 128 (8.3%) |
| 5:00 AM to 5:29 AM | 43 (4.7%) | 7 (0.5%) |
| 5:30 AM to 5:59 AM | 130 (14.2%) | 123 (8.0%) |
| 6:00 AM to 6:29 AM | 41 (4.5%) | 293 (19.1%) |
| 6:30 AM to 6:59 AM | 286 (31.2%) | 69 (4.5%) |
| 7:00 AM to 7:29 AM | 92 (10.0%) | 0 (0.0%) |
| 7:30 AM to 7:59 AM | 23 (2.5%) | 81 (5.3%) |
| 8:00 AM to 8:29 AM | 89 (9.7%) | 421 (27.4%) |
| 8:30 AM to 8:59 AM | 0 (0.0%) | 135 (8.8%) |
| 9:00 AM to 9:59 AM | 37 (4.0%) | 59 (3.8%) |
| 10:00 AM to 10:59 AM | 0 (0.0%) | 0 (0.0%) |
| 11:00 AM to 11:59 AM | 29 (3.2%) | 80 (5.2%) |
| 12:00 PM to 3:59 PM | 5 (0.5%) | 24 (1.6%) |
| 4:00 PM to 11:59 PM | 58 (6.3%) | 114 (7.4%) |
| Total | 917 (100.0%) | 1,534 (100.0%) |
Housing Occupancy in Hempstead
Occupancy by Ownership in Hempstead
Of the total 2,010 dwellings in Hempstead, owner-occupied units account for 542 (27.0%), while renter-occupied units make up 1,468 (73.0%).
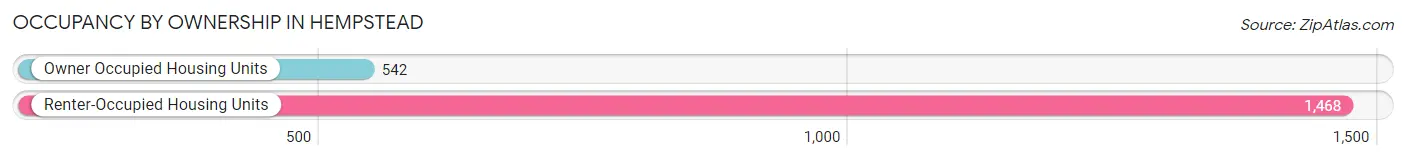
| Occupancy | # Housing Units | % Housing Units |
| Owner Occupied Housing Units | 542 | 27.0% |
| Renter-Occupied Housing Units | 1,468 | 73.0% |
| Total Occupied Housing Units | 2,010 | 100.0% |
Occupancy by Household Size in Hempstead
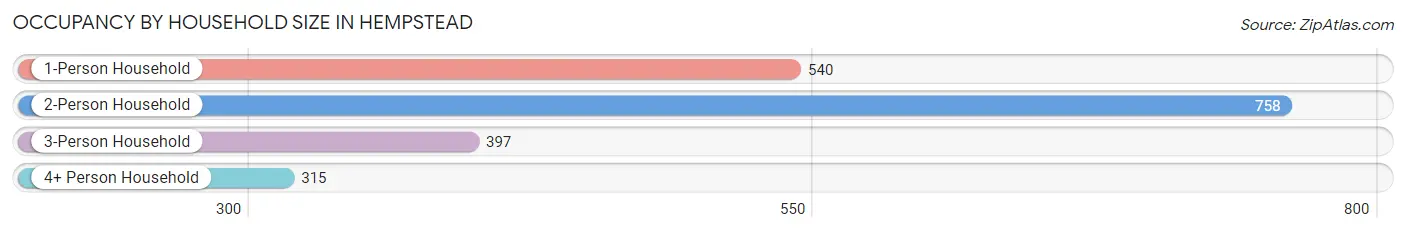
| Household Size | # Housing Units | % Housing Units |
| 1-Person Household | 540 | 26.9% |
| 2-Person Household | 758 | 37.7% |
| 3-Person Household | 397 | 19.8% |
| 4+ Person Household | 315 | 15.7% |
| Total Housing Units | 2,010 | 100.0% |
Occupancy by Ownership by Household Size in Hempstead
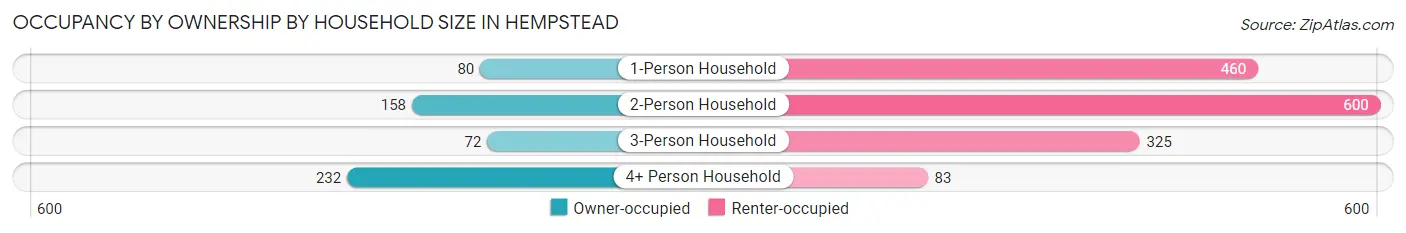
| Household Size | Owner-occupied | Renter-occupied |
| 1-Person Household | 80 (14.8%) | 460 (85.2%) |
| 2-Person Household | 158 (20.8%) | 600 (79.2%) |
| 3-Person Household | 72 (18.1%) | 325 (81.9%) |
| 4+ Person Household | 232 (73.7%) | 83 (26.4%) |
| Total Housing Units | 542 (27.0%) | 1,468 (73.0%) |
Occupancy by Educational Attainment in Hempstead
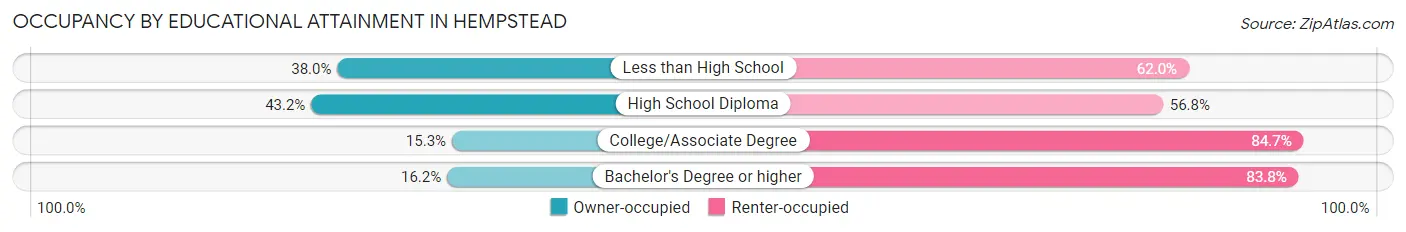
| Household Size | Owner-occupied | Renter-occupied |
| Less than High School | 76 (38.0%) | 124 (62.0%) |
| High School Diploma | 288 (43.2%) | 379 (56.8%) |
| College/Associate Degree | 121 (15.3%) | 671 (84.7%) |
| Bachelor's Degree or higher | 57 (16.2%) | 294 (83.8%) |
Occupancy by Age of Householder in Hempstead
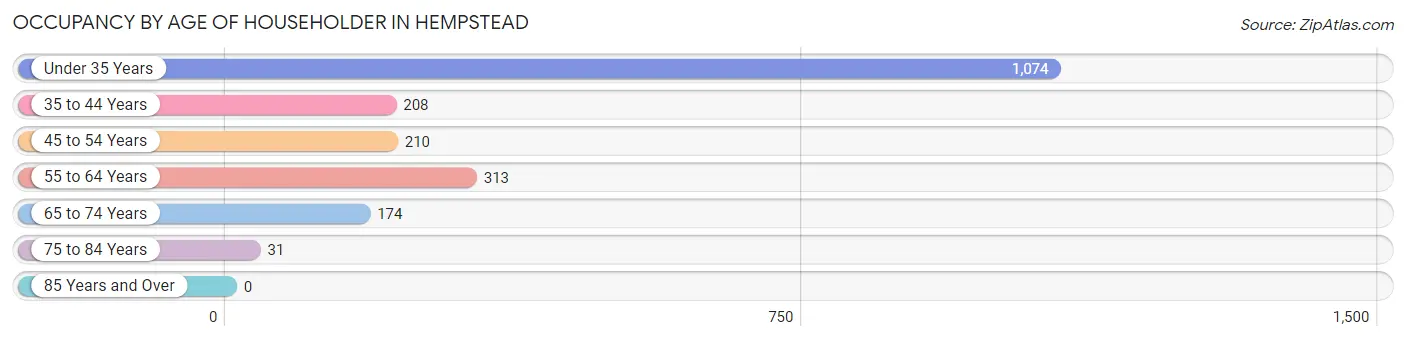
| Age Bracket | # Households | % Households |
| Under 35 Years | 1,074 | 53.4% |
| 35 to 44 Years | 208 | 10.3% |
| 45 to 54 Years | 210 | 10.4% |
| 55 to 64 Years | 313 | 15.6% |
| 65 to 74 Years | 174 | 8.7% |
| 75 to 84 Years | 31 | 1.5% |
| 85 Years and Over | 0 | 0.0% |
| Total | 2,010 | 100.0% |
Housing Finances in Hempstead
Median Income by Occupancy in Hempstead
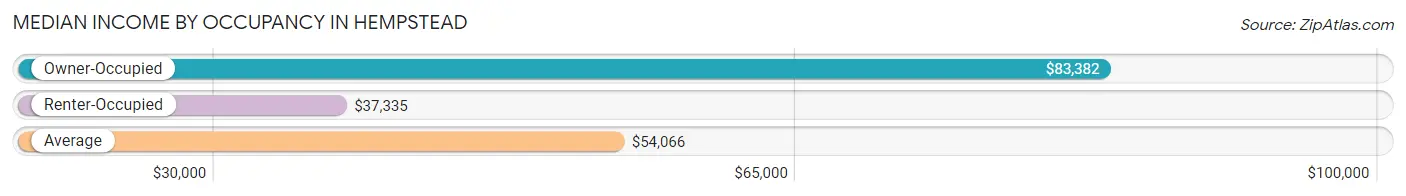
| Occupancy Type | # Households | Median Income |
| Owner-Occupied | 542 (27.0%) | $83,382 |
| Renter-Occupied | 1,468 (73.0%) | $37,335 |
| Average | 2,010 (100.0%) | $54,066 |
Occupancy by Householder Income Bracket in Hempstead
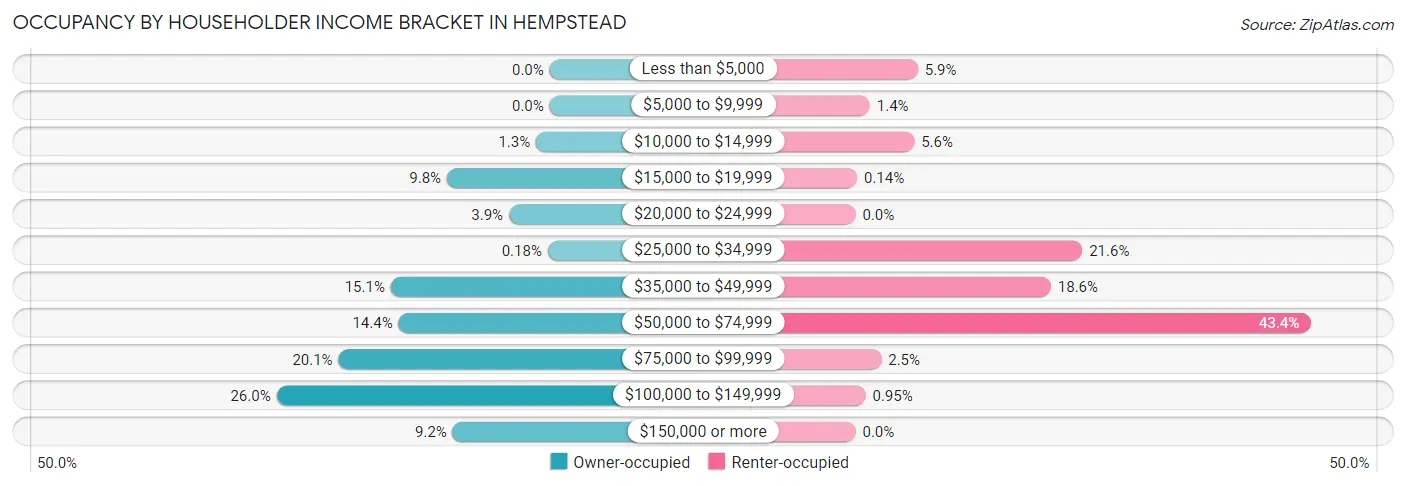
| Income Bracket | Owner-occupied | Renter-occupied |
| Less than $5,000 | 0 (0.0%) | 87 (5.9%) |
| $5,000 to $9,999 | 0 (0.0%) | 20 (1.4%) |
| $10,000 to $14,999 | 7 (1.3%) | 82 (5.6%) |
| $15,000 to $19,999 | 53 (9.8%) | 2 (0.1%) |
| $20,000 to $24,999 | 21 (3.9%) | 0 (0.0%) |
| $25,000 to $34,999 | 1 (0.2%) | 317 (21.6%) |
| $35,000 to $49,999 | 82 (15.1%) | 273 (18.6%) |
| $50,000 to $74,999 | 78 (14.4%) | 637 (43.4%) |
| $75,000 to $99,999 | 109 (20.1%) | 36 (2.5%) |
| $100,000 to $149,999 | 141 (26.0%) | 14 (0.9%) |
| $150,000 or more | 50 (9.2%) | 0 (0.0%) |
| Total | 542 (100.0%) | 1,468 (100.0%) |
Monthly Housing Cost Tiers in Hempstead
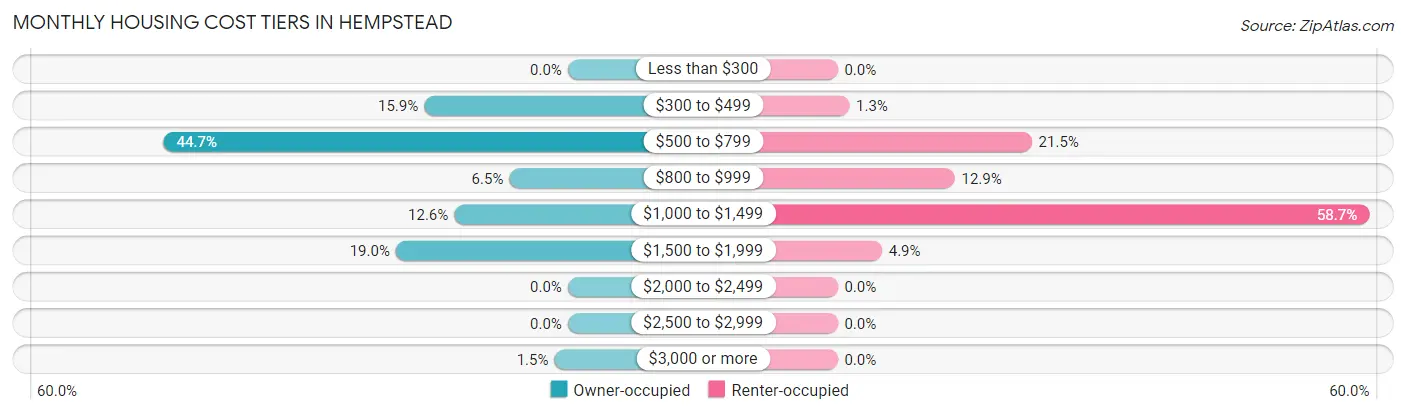
| Monthly Cost | Owner-occupied | Renter-occupied |
| Less than $300 | 0 (0.0%) | 0 (0.0%) |
| $300 to $499 | 86 (15.9%) | 19 (1.3%) |
| $500 to $799 | 242 (44.7%) | 315 (21.5%) |
| $800 to $999 | 35 (6.5%) | 190 (12.9%) |
| $1,000 to $1,499 | 68 (12.6%) | 862 (58.7%) |
| $1,500 to $1,999 | 103 (19.0%) | 72 (4.9%) |
| $2,000 to $2,499 | 0 (0.0%) | 0 (0.0%) |
| $2,500 to $2,999 | 0 (0.0%) | 0 (0.0%) |
| $3,000 or more | 8 (1.5%) | 0 (0.0%) |
| Total | 542 (100.0%) | 1,468 (100.0%) |
Physical Housing Characteristics in Hempstead
Housing Structures in Hempstead
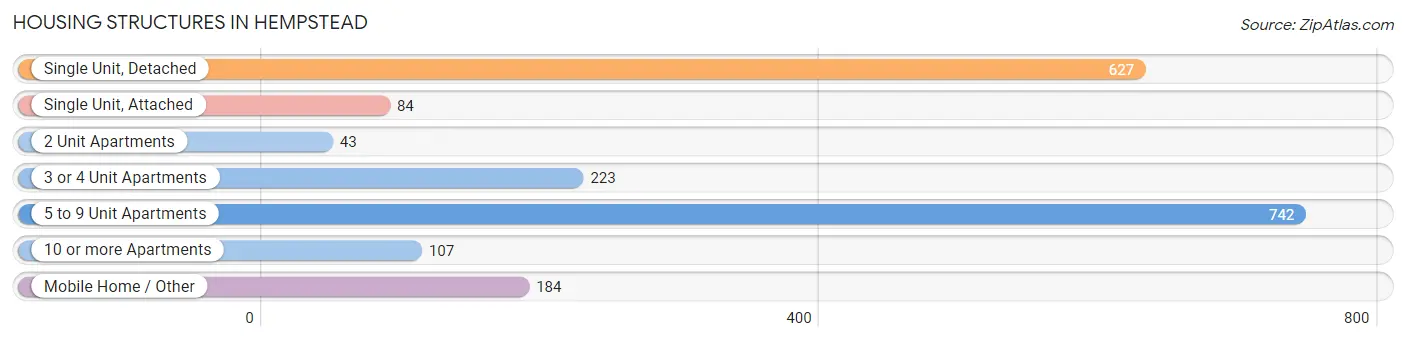
| Structure Type | # Housing Units | % Housing Units |
| Single Unit, Detached | 627 | 31.2% |
| Single Unit, Attached | 84 | 4.2% |
| 2 Unit Apartments | 43 | 2.1% |
| 3 or 4 Unit Apartments | 223 | 11.1% |
| 5 to 9 Unit Apartments | 742 | 36.9% |
| 10 or more Apartments | 107 | 5.3% |
| Mobile Home / Other | 184 | 9.1% |
| Total | 2,010 | 100.0% |
Housing Structures by Occupancy in Hempstead
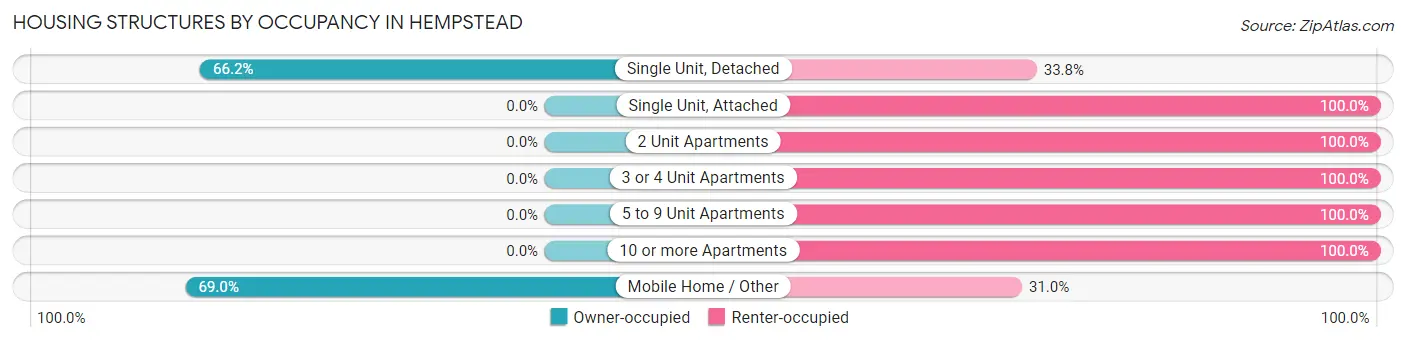
| Structure Type | Owner-occupied | Renter-occupied |
| Single Unit, Detached | 415 (66.2%) | 212 (33.8%) |
| Single Unit, Attached | 0 (0.0%) | 84 (100.0%) |
| 2 Unit Apartments | 0 (0.0%) | 43 (100.0%) |
| 3 or 4 Unit Apartments | 0 (0.0%) | 223 (100.0%) |
| 5 to 9 Unit Apartments | 0 (0.0%) | 742 (100.0%) |
| 10 or more Apartments | 0 (0.0%) | 107 (100.0%) |
| Mobile Home / Other | 127 (69.0%) | 57 (31.0%) |
| Total | 542 (27.0%) | 1,468 (73.0%) |
Housing Structures by Number of Rooms in Hempstead
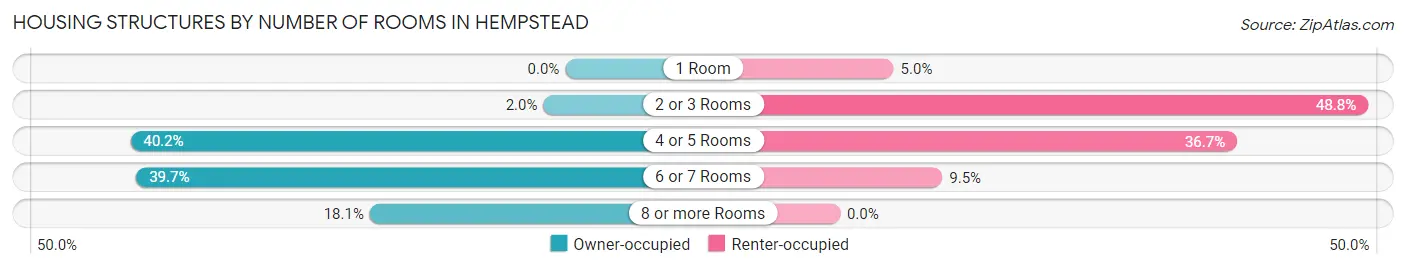
| Number of Rooms | Owner-occupied | Renter-occupied |
| 1 Room | 0 (0.0%) | 73 (5.0%) |
| 2 or 3 Rooms | 11 (2.0%) | 717 (48.8%) |
| 4 or 5 Rooms | 218 (40.2%) | 539 (36.7%) |
| 6 or 7 Rooms | 215 (39.7%) | 139 (9.5%) |
| 8 or more Rooms | 98 (18.1%) | 0 (0.0%) |
| Total | 542 (100.0%) | 1,468 (100.0%) |
Housing Structure by Heating Type in Hempstead
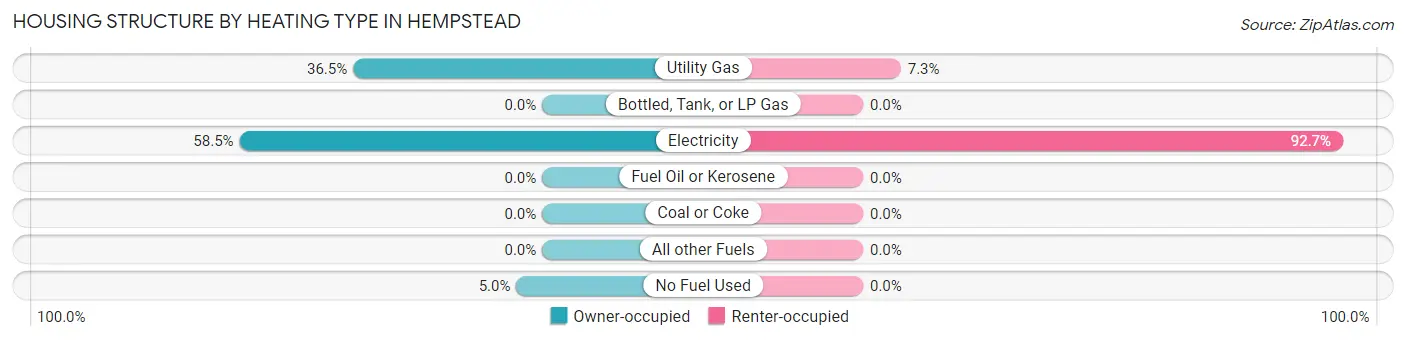
| Heating Type | Owner-occupied | Renter-occupied |
| Utility Gas | 198 (36.5%) | 107 (7.3%) |
| Bottled, Tank, or LP Gas | 0 (0.0%) | 0 (0.0%) |
| Electricity | 317 (58.5%) | 1,361 (92.7%) |
| Fuel Oil or Kerosene | 0 (0.0%) | 0 (0.0%) |
| Coal or Coke | 0 (0.0%) | 0 (0.0%) |
| All other Fuels | 0 (0.0%) | 0 (0.0%) |
| No Fuel Used | 27 (5.0%) | 0 (0.0%) |
| Total | 542 (100.0%) | 1,468 (100.0%) |
Household Vehicle Usage in Hempstead
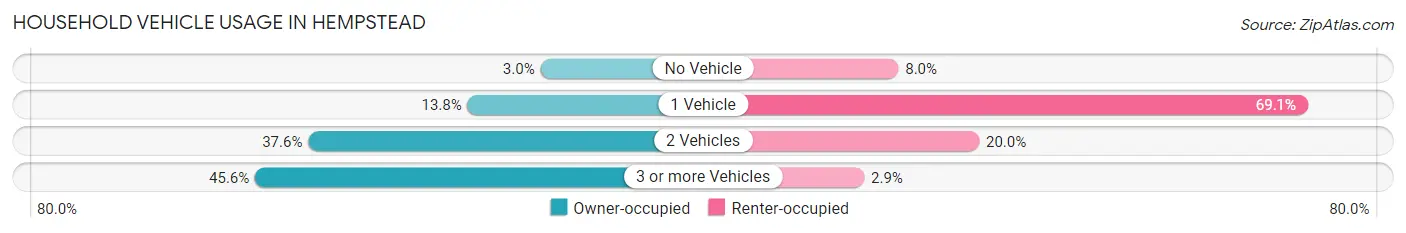
| Vehicles per Household | Owner-occupied | Renter-occupied |
| No Vehicle | 16 (2.9%) | 117 (8.0%) |
| 1 Vehicle | 75 (13.8%) | 1,015 (69.1%) |
| 2 Vehicles | 204 (37.6%) | 294 (20.0%) |
| 3 or more Vehicles | 247 (45.6%) | 42 (2.9%) |
| Total | 542 (100.0%) | 1,468 (100.0%) |
Real Estate & Mortgages in Hempstead
Real Estate and Mortgage Overview in Hempstead
| Characteristic | Without Mortgage | With Mortgage |
| Housing Units | 364 | 178 |
| Median Property Value | $175,300 | $0 |
| Median Household Income | $69,833 | $18 |
| Monthly Housing Costs | $661 | $8 |
| Real Estate Taxes | $2,845 | $0 |
Property Value by Mortgage Status in Hempstead
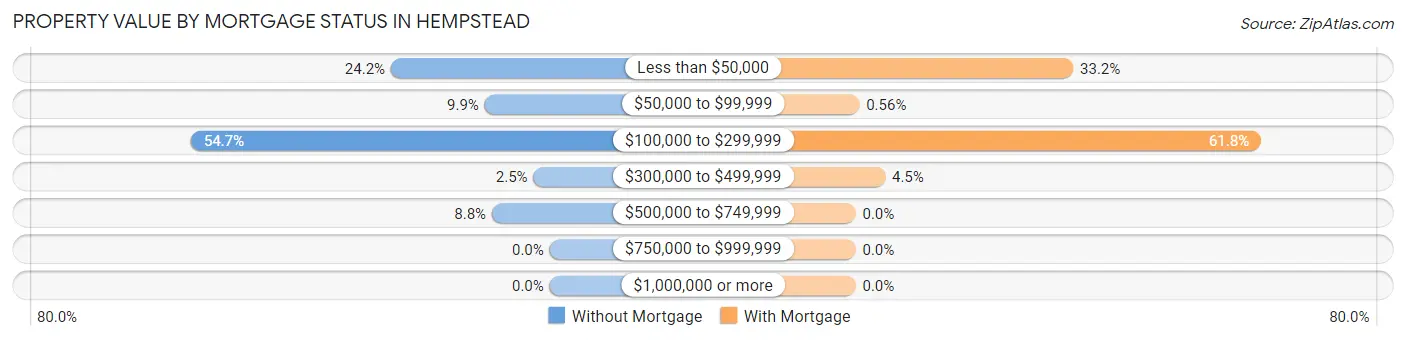
| Property Value | Without Mortgage | With Mortgage |
| Less than $50,000 | 88 (24.2%) | 59 (33.2%) |
| $50,000 to $99,999 | 36 (9.9%) | 1 (0.6%) |
| $100,000 to $299,999 | 199 (54.7%) | 110 (61.8%) |
| $300,000 to $499,999 | 9 (2.5%) | 8 (4.5%) |
| $500,000 to $749,999 | 32 (8.8%) | 0 (0.0%) |
| $750,000 to $999,999 | 0 (0.0%) | 0 (0.0%) |
| $1,000,000 or more | 0 (0.0%) | 0 (0.0%) |
| Total | 364 (100.0%) | 178 (100.0%) |
Household Income by Mortgage Status in Hempstead
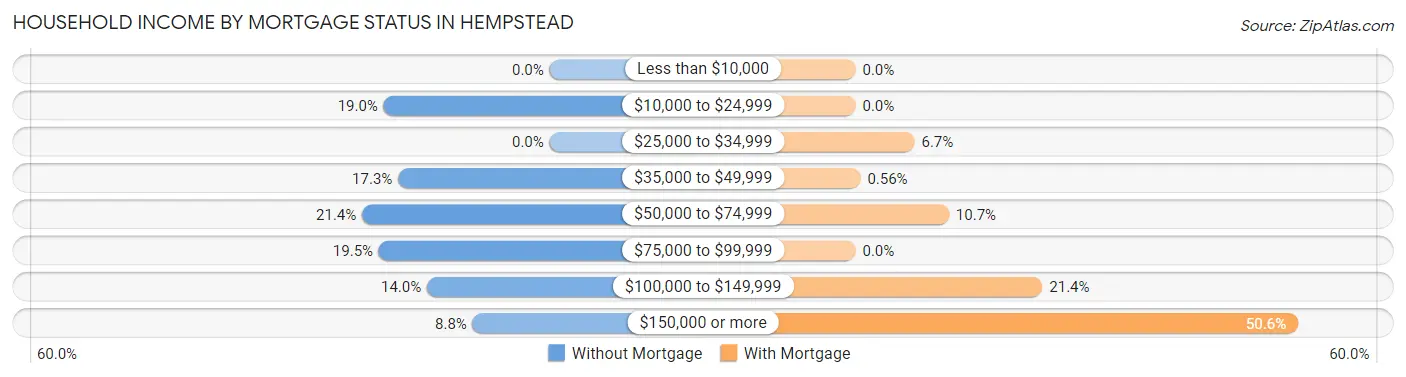
| Household Income | Without Mortgage | With Mortgage |
| Less than $10,000 | 0 (0.0%) | 0 (0.0%) |
| $10,000 to $24,999 | 69 (19.0%) | 0 (0.0%) |
| $25,000 to $34,999 | 0 (0.0%) | 12 (6.7%) |
| $35,000 to $49,999 | 63 (17.3%) | 1 (0.6%) |
| $50,000 to $74,999 | 78 (21.4%) | 19 (10.7%) |
| $75,000 to $99,999 | 71 (19.5%) | 0 (0.0%) |
| $100,000 to $149,999 | 51 (14.0%) | 38 (21.3%) |
| $150,000 or more | 32 (8.8%) | 90 (50.6%) |
| Total | 364 (100.0%) | 178 (100.0%) |
Property Value to Household Income Ratio in Hempstead
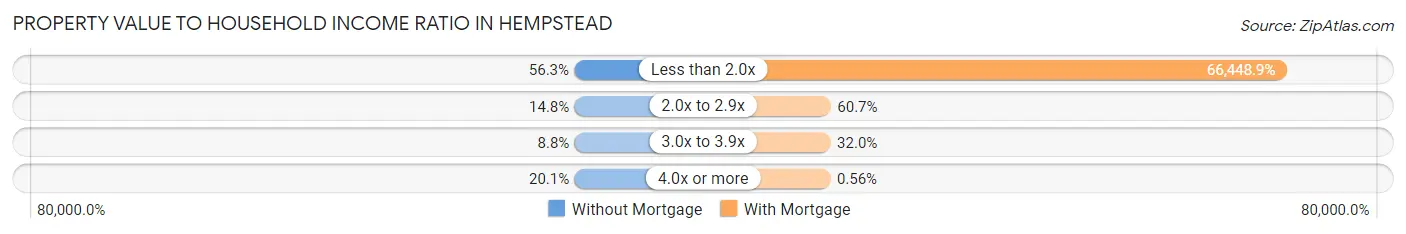
| Value-to-Income Ratio | Without Mortgage | With Mortgage |
| Less than 2.0x | 205 (56.3%) | 118,279 (66,448.9%) |
| 2.0x to 2.9x | 54 (14.8%) | 108 (60.7%) |
| 3.0x to 3.9x | 32 (8.8%) | 57 (32.0%) |
| 4.0x or more | 73 (20.1%) | 1 (0.6%) |
| Total | 364 (100.0%) | 178 (100.0%) |
Real Estate Taxes by Mortgage Status in Hempstead
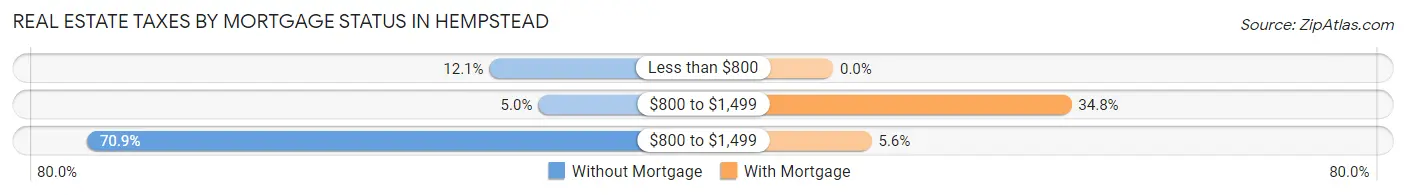
| Property Taxes | Without Mortgage | With Mortgage |
| Less than $800 | 44 (12.1%) | 0 (0.0%) |
| $800 to $1,499 | 18 (5.0%) | 62 (34.8%) |
| $800 to $1,499 | 258 (70.9%) | 10 (5.6%) |
| Total | 364 (100.0%) | 178 (100.0%) |
Health & Disability in Hempstead
Health Insurance Coverage by Age in Hempstead
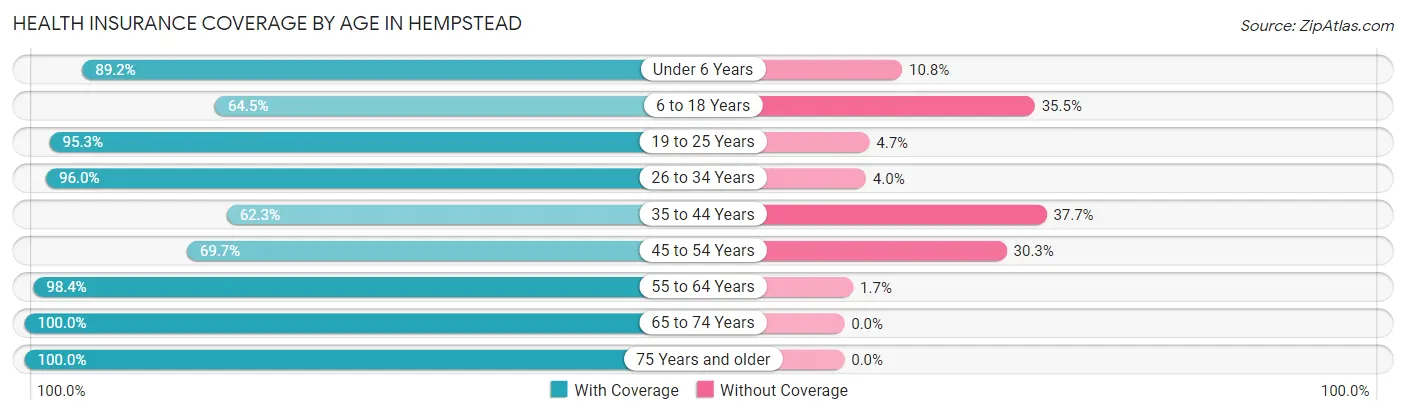
| Age Bracket | With Coverage | Without Coverage |
| Under 6 Years | 414 (89.2%) | 50 (10.8%) |
| 6 to 18 Years | 881 (64.5%) | 485 (35.5%) |
| 19 to 25 Years | 1,083 (95.3%) | 53 (4.7%) |
| 26 to 34 Years | 928 (96.0%) | 39 (4.0%) |
| 35 to 44 Years | 342 (62.3%) | 207 (37.7%) |
| 45 to 54 Years | 235 (69.7%) | 102 (30.3%) |
| 55 to 64 Years | 416 (98.4%) | 7 (1.7%) |
| 65 to 74 Years | 303 (100.0%) | 0 (0.0%) |
| 75 Years and older | 80 (100.0%) | 0 (0.0%) |
| Total | 4,682 (83.2%) | 943 (16.8%) |
Health Insurance Coverage by Citizenship Status in Hempstead
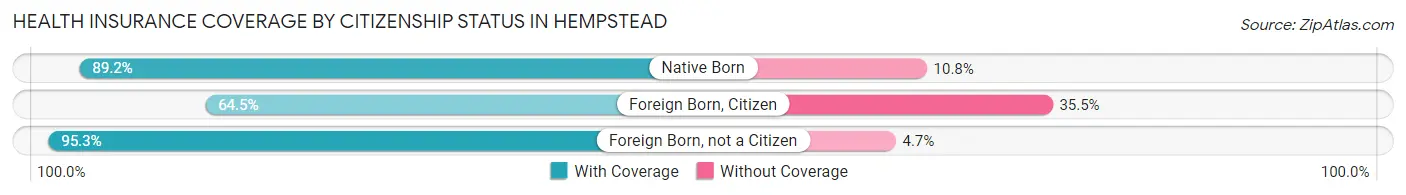
| Citizenship Status | With Coverage | Without Coverage |
| Native Born | 414 (89.2%) | 50 (10.8%) |
| Foreign Born, Citizen | 881 (64.5%) | 485 (35.5%) |
| Foreign Born, not a Citizen | 1,083 (95.3%) | 53 (4.7%) |
Health Insurance Coverage by Household Income in Hempstead
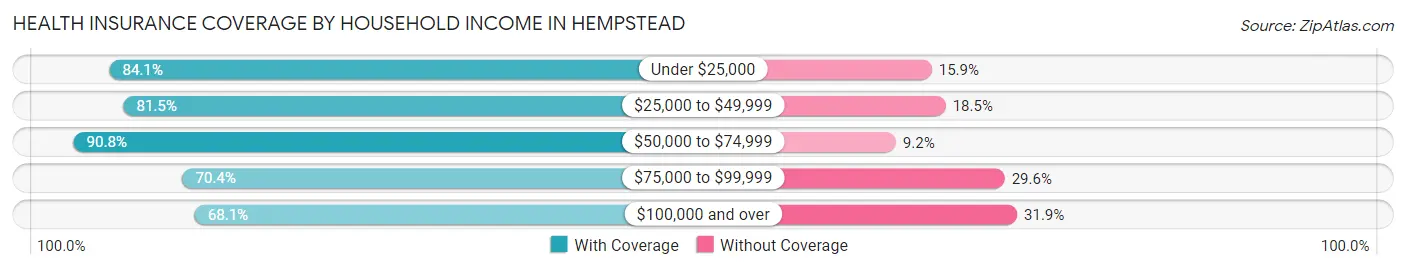
| Household Income | With Coverage | Without Coverage |
| Under $25,000 | 338 (84.1%) | 64 (15.9%) |
| $25,000 to $49,999 | 1,041 (81.5%) | 237 (18.5%) |
| $50,000 to $74,999 | 2,419 (90.8%) | 245 (9.2%) |
| $75,000 to $99,999 | 357 (70.4%) | 150 (29.6%) |
| $100,000 and over | 527 (68.1%) | 247 (31.9%) |
Public vs Private Health Insurance Coverage by Age in Hempstead
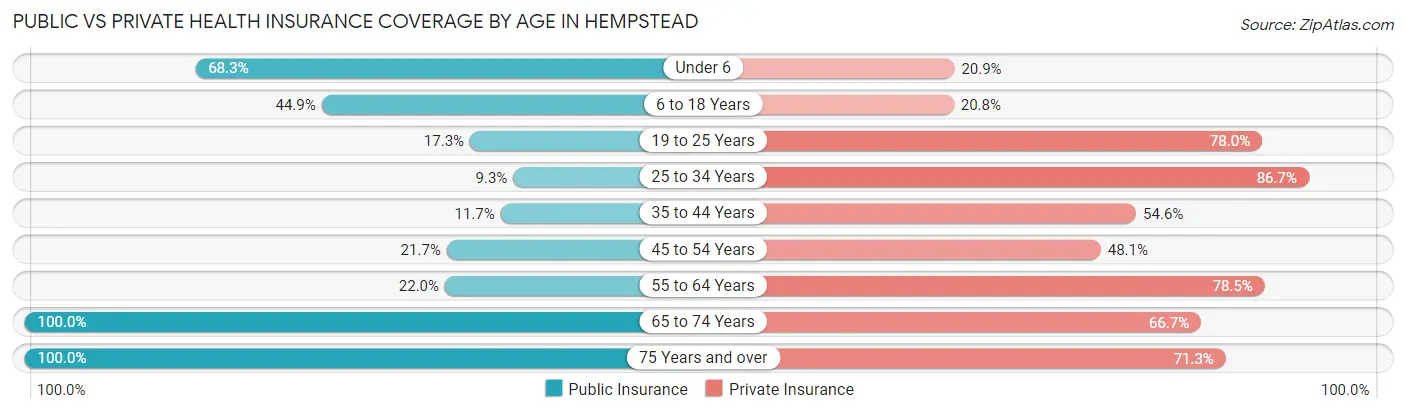
| Age Bracket | Public Insurance | Private Insurance |
| Under 6 | 317 (68.3%) | 97 (20.9%) |
| 6 to 18 Years | 613 (44.9%) | 284 (20.8%) |
| 19 to 25 Years | 197 (17.3%) | 886 (78.0%) |
| 25 to 34 Years | 90 (9.3%) | 838 (86.7%) |
| 35 to 44 Years | 64 (11.7%) | 300 (54.6%) |
| 45 to 54 Years | 73 (21.7%) | 162 (48.1%) |
| 55 to 64 Years | 93 (22.0%) | 332 (78.5%) |
| 65 to 74 Years | 303 (100.0%) | 202 (66.7%) |
| 75 Years and over | 80 (100.0%) | 57 (71.3%) |
| Total | 1,830 (32.5%) | 3,158 (56.1%) |
Disability Status by Sex by Age in Hempstead
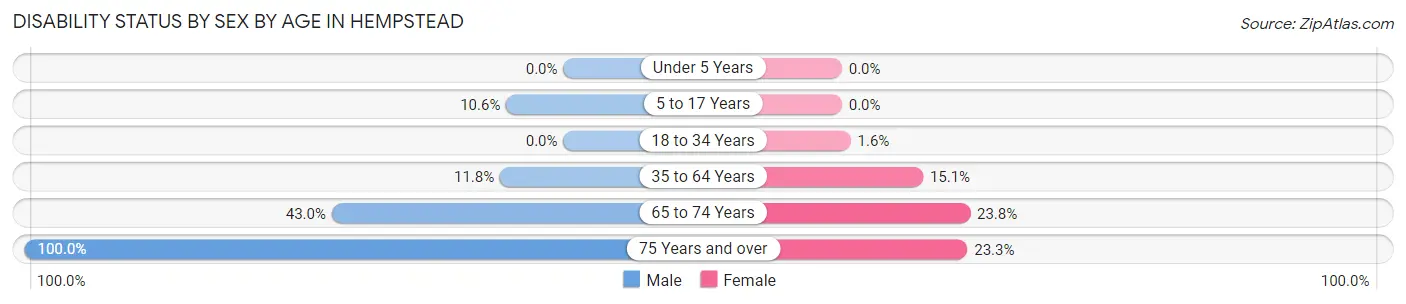
| Age Bracket | Male | Female |
| Under 5 Years | 0 (0.0%) | 0 (0.0%) |
| 5 to 17 Years | 39 (10.6%) | 0 (0.0%) |
| 18 to 34 Years | 0 (0.0%) | 16 (1.6%) |
| 35 to 64 Years | 61 (11.7%) | 119 (15.1%) |
| 65 to 74 Years | 49 (43.0%) | 45 (23.8%) |
| 75 Years and over | 7 (100.0%) | 17 (23.3%) |
Disability Class by Sex by Age in Hempstead
Disability Class: Hearing Difficulty
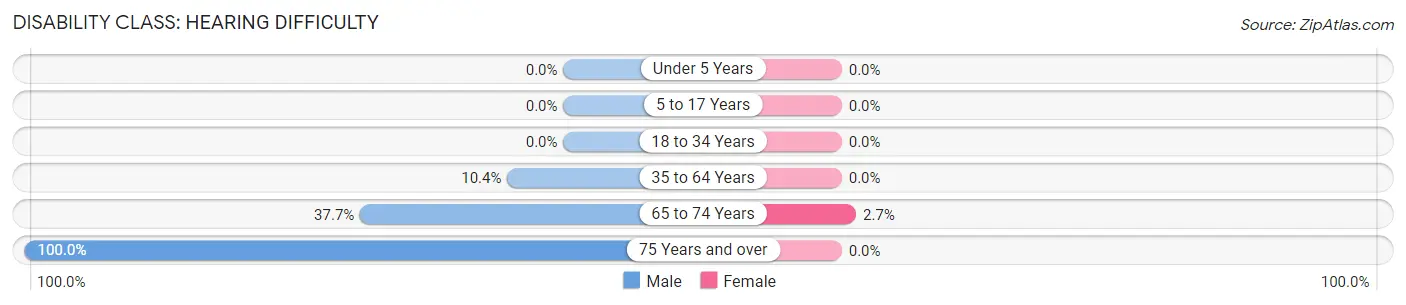
| Age Bracket | Male | Female |
| Under 5 Years | 0 (0.0%) | 0 (0.0%) |
| 5 to 17 Years | 0 (0.0%) | 0 (0.0%) |
| 18 to 34 Years | 0 (0.0%) | 0 (0.0%) |
| 35 to 64 Years | 54 (10.4%) | 0 (0.0%) |
| 65 to 74 Years | 43 (37.7%) | 5 (2.6%) |
| 75 Years and over | 7 (100.0%) | 0 (0.0%) |
Disability Class: Vision Difficulty
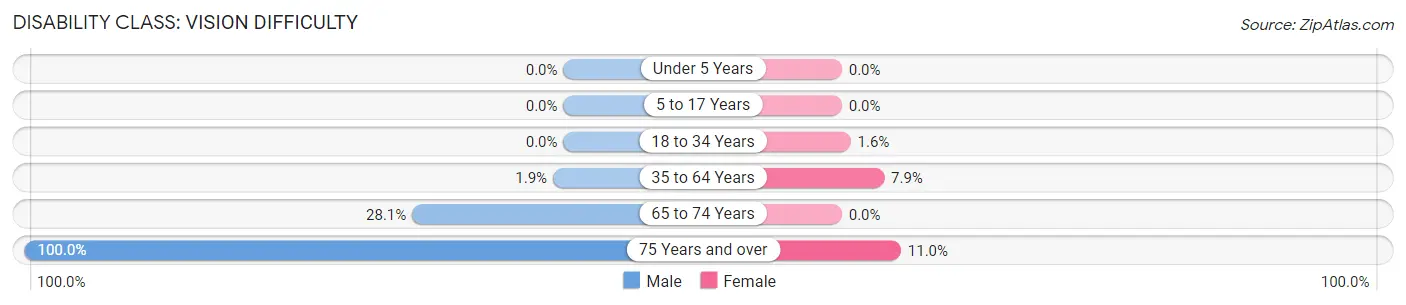
| Age Bracket | Male | Female |
| Under 5 Years | 0 (0.0%) | 0 (0.0%) |
| 5 to 17 Years | 0 (0.0%) | 0 (0.0%) |
| 18 to 34 Years | 0 (0.0%) | 16 (1.6%) |
| 35 to 64 Years | 10 (1.9%) | 62 (7.9%) |
| 65 to 74 Years | 32 (28.1%) | 0 (0.0%) |
| 75 Years and over | 7 (100.0%) | 8 (11.0%) |
Disability Class: Cognitive Difficulty
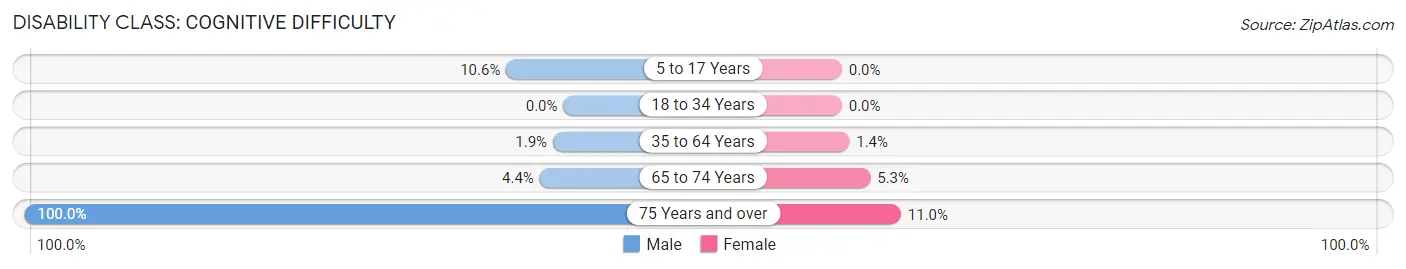
| Age Bracket | Male | Female |
| 5 to 17 Years | 39 (10.6%) | 0 (0.0%) |
| 18 to 34 Years | 0 (0.0%) | 0 (0.0%) |
| 35 to 64 Years | 10 (1.9%) | 11 (1.4%) |
| 65 to 74 Years | 5 (4.4%) | 10 (5.3%) |
| 75 Years and over | 7 (100.0%) | 8 (11.0%) |
Disability Class: Ambulatory Difficulty
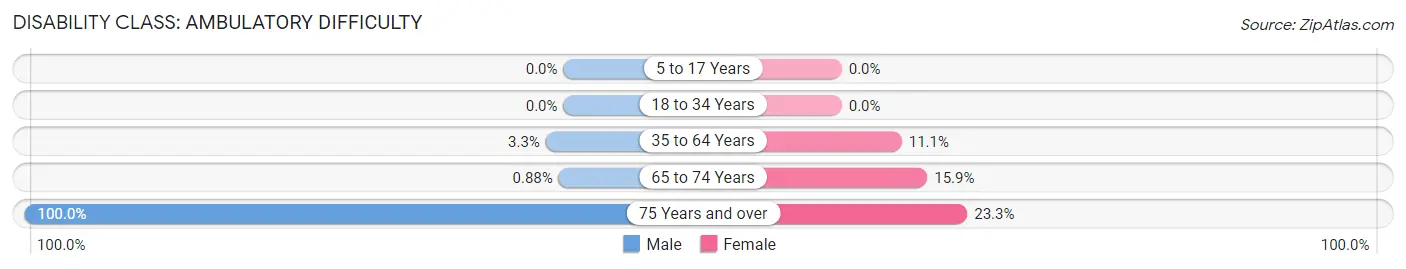
| Age Bracket | Male | Female |
| 5 to 17 Years | 0 (0.0%) | 0 (0.0%) |
| 18 to 34 Years | 0 (0.0%) | 0 (0.0%) |
| 35 to 64 Years | 17 (3.3%) | 88 (11.1%) |
| 65 to 74 Years | 1 (0.9%) | 30 (15.9%) |
| 75 Years and over | 7 (100.0%) | 17 (23.3%) |
Disability Class: Self-Care Difficulty
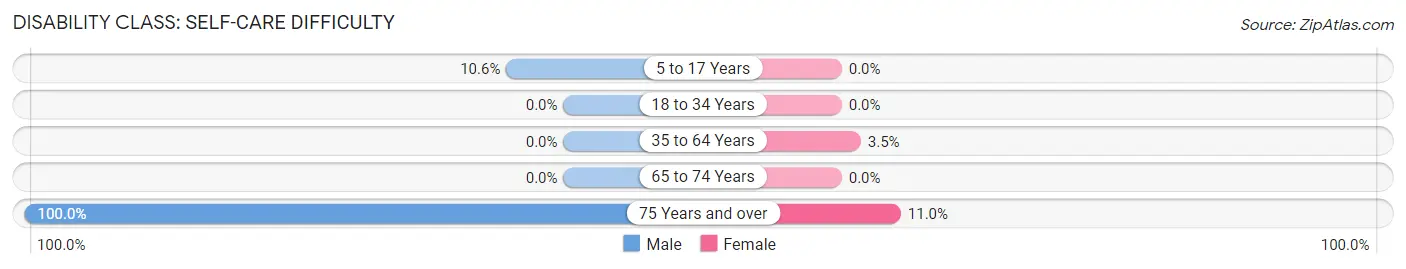
| Age Bracket | Male | Female |
| 5 to 17 Years | 39 (10.6%) | 0 (0.0%) |
| 18 to 34 Years | 0 (0.0%) | 0 (0.0%) |
| 35 to 64 Years | 0 (0.0%) | 28 (3.5%) |
| 65 to 74 Years | 0 (0.0%) | 0 (0.0%) |
| 75 Years and over | 7 (100.0%) | 8 (11.0%) |
Technology Access in Hempstead
Computing Device Access in Hempstead
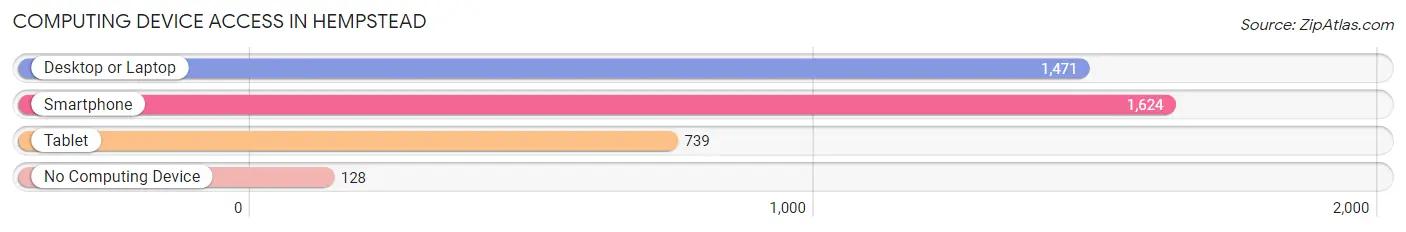
| Device Type | # Households | % Households |
| Desktop or Laptop | 1,471 | 73.2% |
| Smartphone | 1,624 | 80.8% |
| Tablet | 739 | 36.8% |
| No Computing Device | 128 | 6.4% |
| Total | 2,010 | 100.0% |
Internet Access in Hempstead
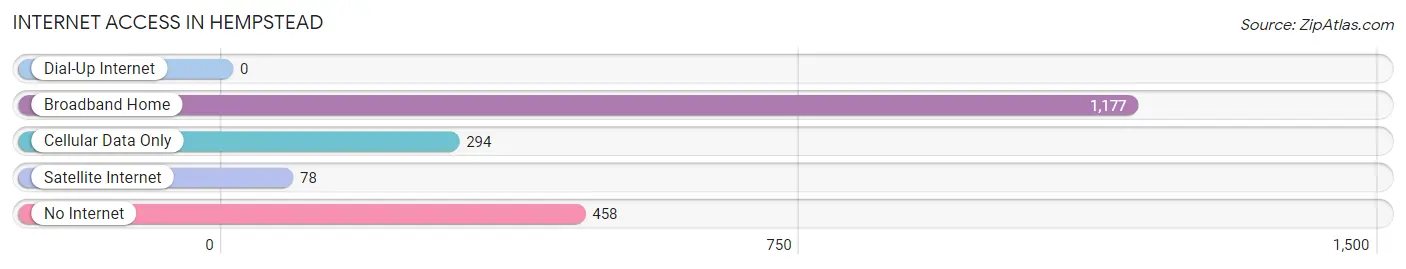
| Internet Type | # Households | % Households |
| Dial-Up Internet | 0 | 0.0% |
| Broadband Home | 1,177 | 58.6% |
| Cellular Data Only | 294 | 14.6% |
| Satellite Internet | 78 | 3.9% |
| No Internet | 458 | 22.8% |
| Total | 2,010 | 100.0% |
Hempstead Summary
Hempstead, Texas is a small city located in Waller County, Texas, United States. It is the county seat of Waller County and is located about 40 miles northwest of Houston. The population of Hempstead was 6,087 at the 2010 census.
Hempstead is located in the Houston–The Woodlands–Sugar Land metropolitan area. The city is situated on the Brazos River and is the oldest town in the county. It was founded in 1856 and was named after Dr. G.S. Hempstead, a prominent early settler.
Hempstead has a rich history and has been the site of many important events in Texas history. It was the site of the Battle of San Jacinto, the decisive battle of the Texas Revolution, and the site of the signing of the Texas Declaration of Independence. It was also the site of the first Texas State Fair in 1856.
The economy of Hempstead is largely based on agriculture and oil and gas production. The city is home to several large agricultural operations, including the largest cotton gin in the world. The city is also home to several oil and gas production companies.
The demographics of Hempstead are largely white, with a population that is approximately 75% white. The median household income is $41,000, and the median age is 37. The city has a poverty rate of 17.3%, which is higher than the national average.
Hempstead is served by the Hempstead Independent School District, which includes four elementary schools, one middle school, and one high school. The city is also home to several private schools, including the Hempstead Christian Academy and the Hempstead Preparatory School.
Hempstead is a small city with a rich history and a vibrant economy. It is home to many agricultural operations and oil and gas production companies, and is a great place to live and work. The city has a diverse population and is a great place to raise a family.
Common Questions
What is Per Capita Income in Hempstead?
Per Capita income in Hempstead is $20,021.
What is the Median Family Income in Hempstead?
Median Family Income in Hempstead is $55,581.
What is the Median Household income in Hempstead?
Median Household Income in Hempstead is $54,066.
What is Income or Wage Gap in Hempstead?
Income or Wage Gap in Hempstead is 20.1%.
Women in Hempstead earn 79.9 cents for every dollar earned by a man.
What is Inequality or Gini Index in Hempstead?
Inequality or Gini Index in Hempstead is 0.34.
What is the Total Population of Hempstead?
Total Population of Hempstead is 5,686.
What is the Total Male Population of Hempstead?
Total Male Population of Hempstead is 2,546.
What is the Total Female Population of Hempstead?
Total Female Population of Hempstead is 3,140.
What is the Ratio of Males per 100 Females in Hempstead?
There are 81.08 Males per 100 Females in Hempstead.
What is the Ratio of Females per 100 Males in Hempstead?
There are 123.33 Females per 100 Males in Hempstead.
What is the Median Population Age in Hempstead?
Median Population Age in Hempstead is 25.4 Years.
What is the Average Family Size in Hempstead
Average Family Size in Hempstead is 3.5 People.
What is the Average Household Size in Hempstead
Average Household Size in Hempstead is 2.8 People.
How Large is the Labor Force in Hempstead?
There are 2,494 People in the Labor Forcein in Hempstead.
What is the Percentage of People in the Labor Force in Hempstead?
60.5% of People are in the Labor Force in Hempstead.
What is the Unemployment Rate in Hempstead?
Unemployment Rate in Hempstead is 0.8%.