El Cenizo, TX Map & Demographics
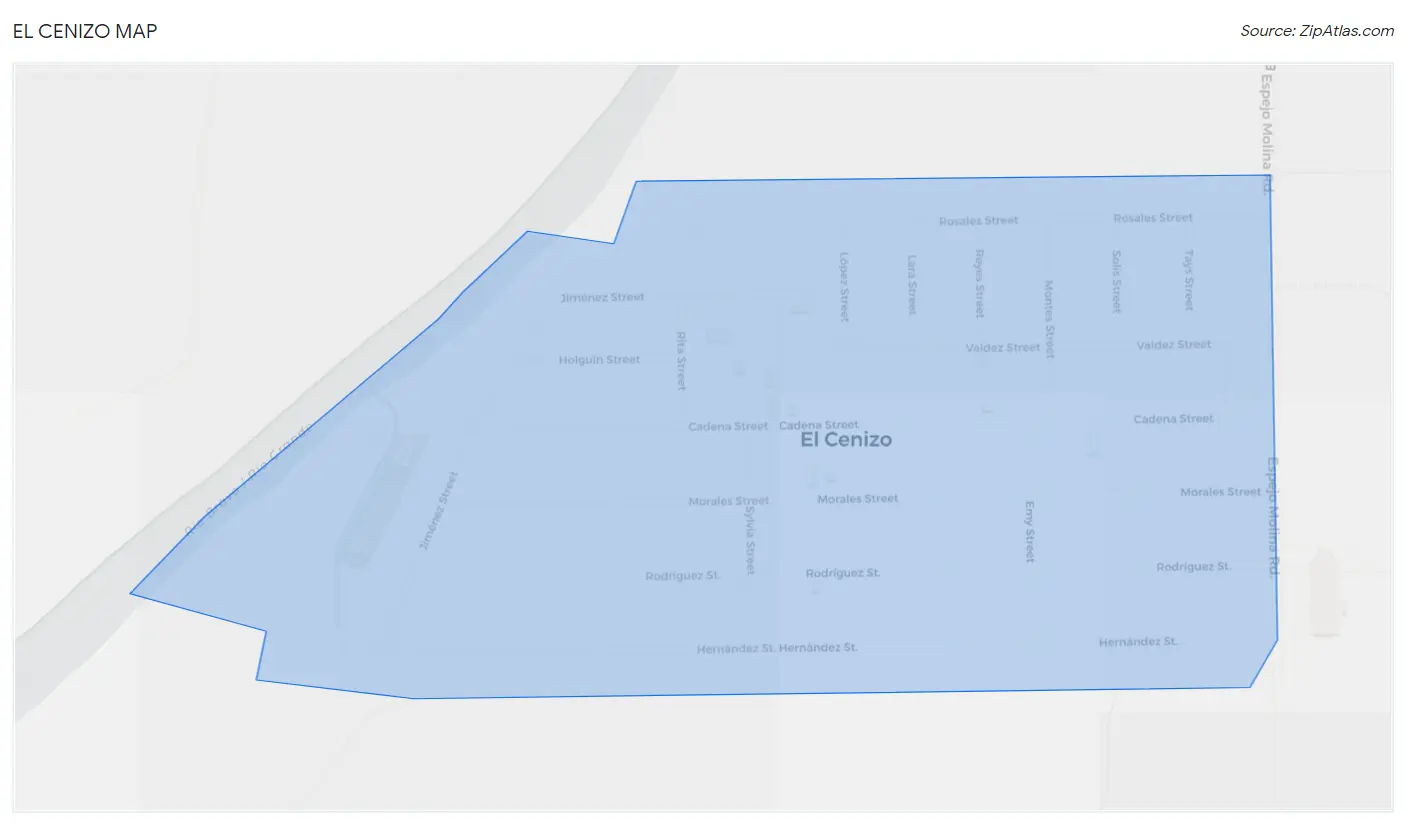
El Cenizo Map
El Cenizo Overview
$13,558
PER CAPITA INCOME
$42,143
AVG FAMILY INCOME
$36,389
AVG HOUSEHOLD INCOME
36.4%
WAGE / INCOME GAP [ % ]
63.6¢/ $1
WAGE / INCOME GAP [ $ ]
0.51
INEQUALITY / GINI INDEX
2,226
TOTAL POPULATION
1,207
MALE POPULATION
1,019
FEMALE POPULATION
118.45
MALES / 100 FEMALES
84.42
FEMALES / 100 MALES
28.7
MEDIAN AGE
4.5
AVG FAMILY SIZE
3.6
AVG HOUSEHOLD SIZE
799
LABOR FORCE [ PEOPLE ]
52.4%
PERCENT IN LABOR FORCE
6.3%
UNEMPLOYMENT RATE
El Cenizo Area Codes
Income in El Cenizo
Income Overview in El Cenizo
Per Capita Income in El Cenizo is $13,558, while median incomes of families and households are $42,143 and $36,389 respectively.
| Characteristic | Number | Measure |
| Per Capita Income | 2,226 | $13,558 |
| Median Family Income | 456 | $42,143 |
| Mean Family Income | 456 | $55,717 |
| Median Household Income | 610 | $36,389 |
| Mean Household Income | 610 | $46,266 |
| Income Deficit | 456 | $0 |
| Wage / Income Gap (%) | 2,226 | 36.37% |
| Wage / Income Gap ($) | 2,226 | 63.63¢ per $1 |
| Gini / Inequality Index | 2,226 | 0.51 |
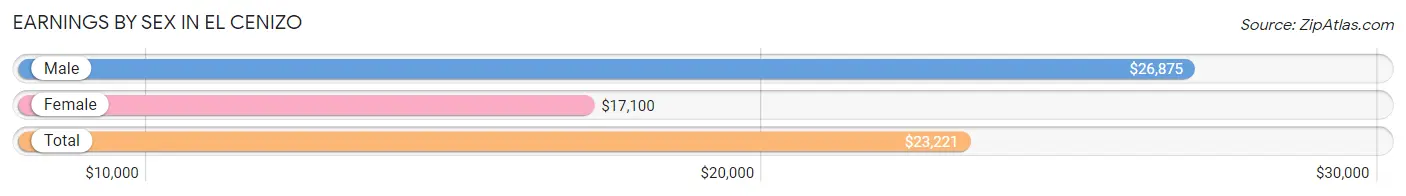
Earnings by Sex in El Cenizo
Average Earnings in El Cenizo are $23,221, $26,875 for men and $17,100 for women, a difference of 36.4%.
| Sex | Number | Average Earnings |
| Male | 479 (60.7%) | $26,875 |
| Female | 310 (39.3%) | $17,100 |
| Total | 789 (100.0%) | $23,221 |
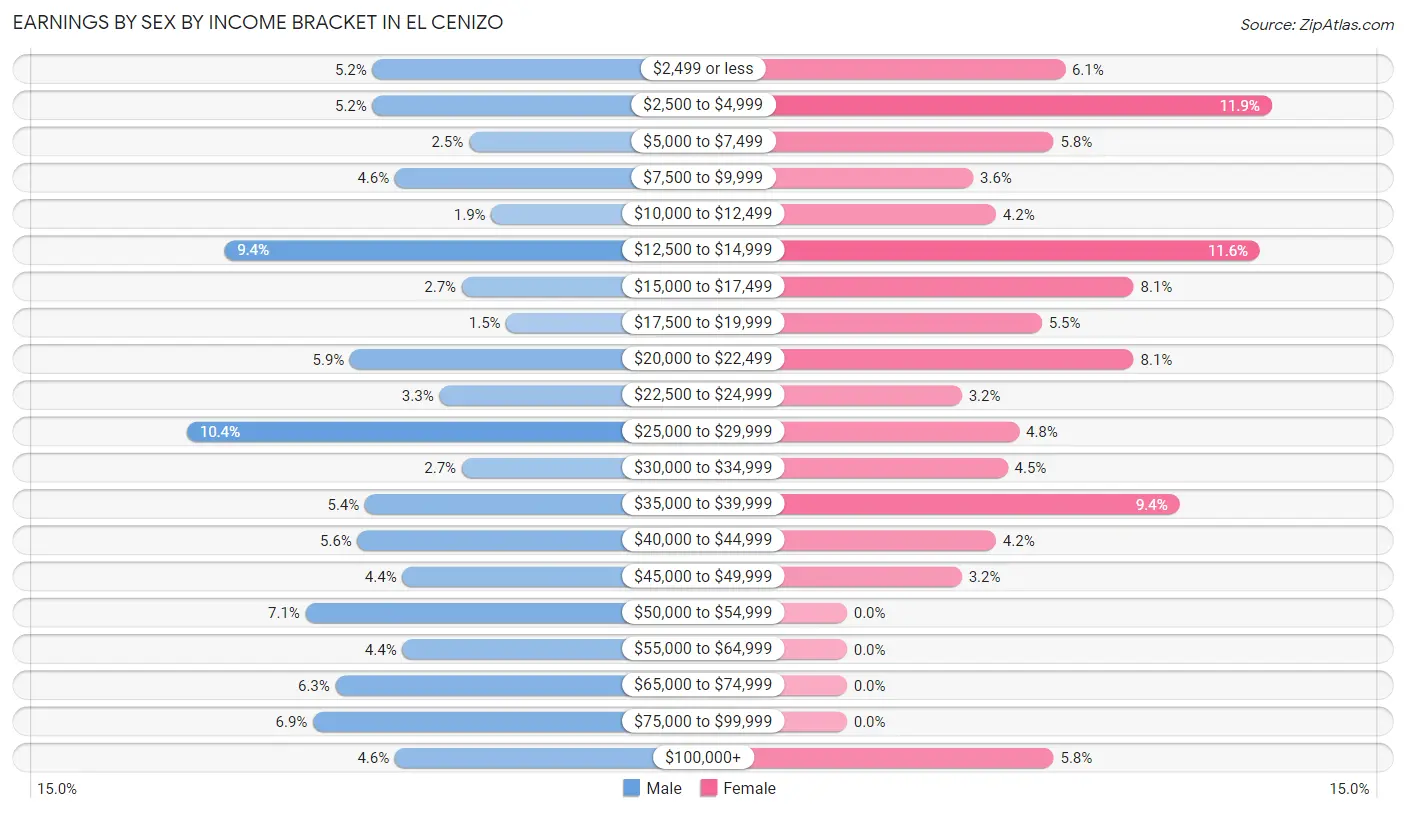
Earnings by Sex by Income Bracket in El Cenizo
The most common earnings brackets in El Cenizo are $25,000 to $29,999 for men (50 | 10.4%) and $2,500 to $4,999 for women (37 | 11.9%).
| Income | Male | Female |
| $2,499 or less | 25 (5.2%) | 19 (6.1%) |
| $2,500 to $4,999 | 25 (5.2%) | 37 (11.9%) |
| $5,000 to $7,499 | 12 (2.5%) | 18 (5.8%) |
| $7,500 to $9,999 | 22 (4.6%) | 11 (3.5%) |
| $10,000 to $12,499 | 9 (1.9%) | 13 (4.2%) |
| $12,500 to $14,999 | 45 (9.4%) | 36 (11.6%) |
| $15,000 to $17,499 | 13 (2.7%) | 25 (8.1%) |
| $17,500 to $19,999 | 7 (1.5%) | 17 (5.5%) |
| $20,000 to $22,499 | 28 (5.9%) | 25 (8.1%) |
| $22,500 to $24,999 | 16 (3.3%) | 10 (3.2%) |
| $25,000 to $29,999 | 50 (10.4%) | 15 (4.8%) |
| $30,000 to $34,999 | 13 (2.7%) | 14 (4.5%) |
| $35,000 to $39,999 | 26 (5.4%) | 29 (9.3%) |
| $40,000 to $44,999 | 27 (5.6%) | 13 (4.2%) |
| $45,000 to $49,999 | 21 (4.4%) | 10 (3.2%) |
| $50,000 to $54,999 | 34 (7.1%) | 0 (0.0%) |
| $55,000 to $64,999 | 21 (4.4%) | 0 (0.0%) |
| $65,000 to $74,999 | 30 (6.3%) | 0 (0.0%) |
| $75,000 to $99,999 | 33 (6.9%) | 0 (0.0%) |
| $100,000+ | 22 (4.6%) | 18 (5.8%) |
| Total | 479 (100.0%) | 310 (100.0%) |
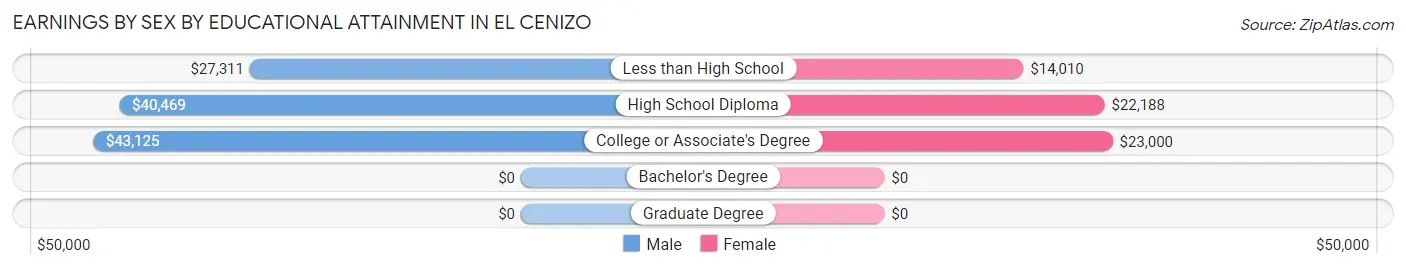
Earnings by Sex by Educational Attainment in El Cenizo
Average earnings in El Cenizo are $39,087 for men and $19,044 for women, a difference of 51.3%. Men with an educational attainment of college or associate's degree enjoy the highest average annual earnings of $43,125, while those with less than high school education earn the least with $27,311. Women with an educational attainment of college or associate's degree earn the most with the average annual earnings of $23,000, while those with less than high school education have the smallest earnings of $14,010.
| Educational Attainment | Male Income | Female Income |
| Less than High School | $27,311 | $14,010 |
| High School Diploma | $40,469 | $22,188 |
| College or Associate's Degree | $43,125 | $23,000 |
| Bachelor's Degree | - | - |
| Graduate Degree | - | - |
| Total | $39,087 | $19,044 |
Family Income in El Cenizo
Family Income Brackets in El Cenizo
According to the El Cenizo family income data, there are 109 families falling into the $35,000 to $49,999 income range, which is the most common income bracket and makes up 23.9% of all families.
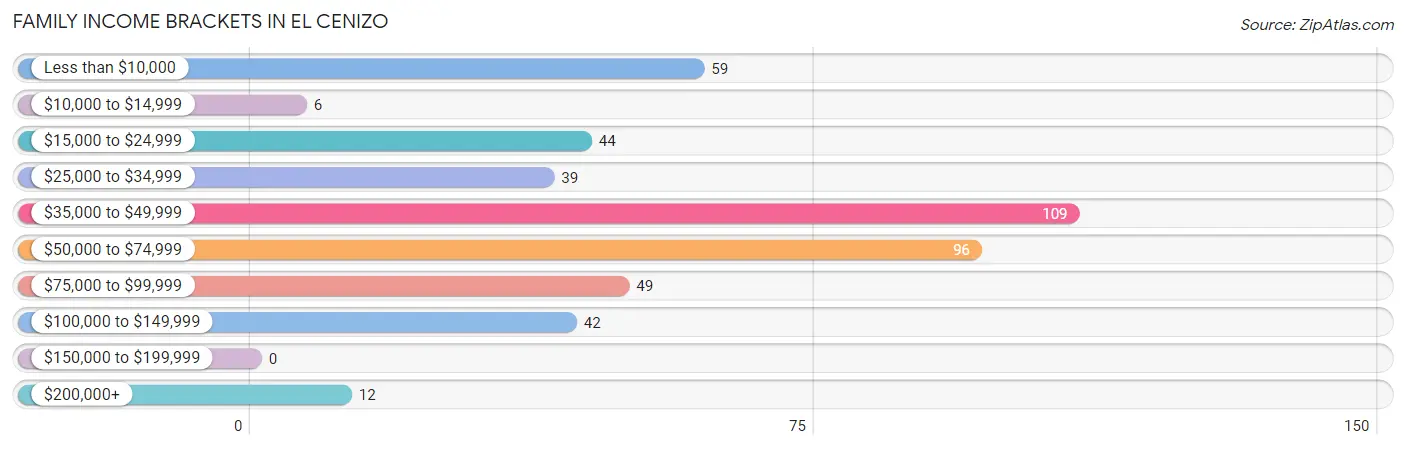
| Income Bracket | # Families | % Families |
| Less than $10,000 | 59 | 12.9% |
| $10,000 to $14,999 | 6 | 1.3% |
| $15,000 to $24,999 | 44 | 9.6% |
| $25,000 to $34,999 | 39 | 8.6% |
| $35,000 to $49,999 | 109 | 23.9% |
| $50,000 to $74,999 | 96 | 21.1% |
| $75,000 to $99,999 | 49 | 10.7% |
| $100,000 to $149,999 | 42 | 9.2% |
| $150,000 to $199,999 | 0 | 0.0% |
| $200,000+ | 12 | 2.6% |
Family Income by Famaliy Size in El Cenizo
3-person families (70 | 15.3%) account for the highest median family income in El Cenizo with $53,382 per family, while 2-person families (105 | 23.0%) have the highest median income of $20,992 per family member.
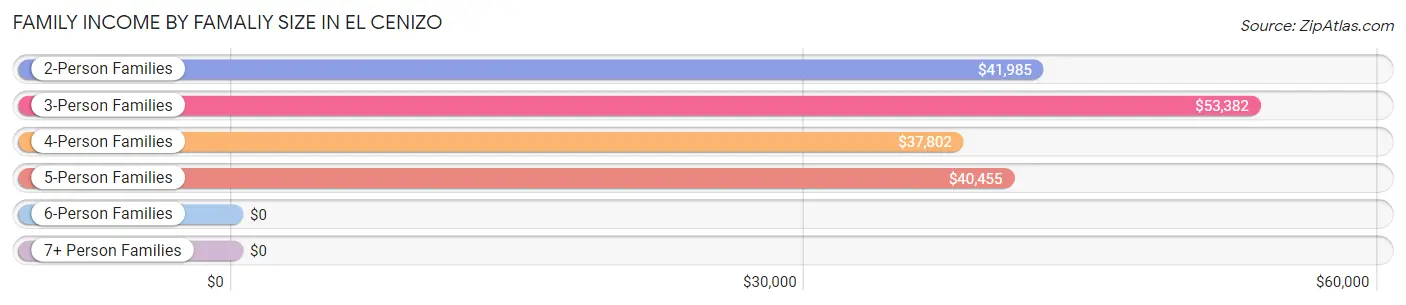
| Income Bracket | # Families | Median Income |
| 2-Person Families | 105 (23.0%) | $41,985 |
| 3-Person Families | 70 (15.3%) | $53,382 |
| 4-Person Families | 115 (25.2%) | $37,802 |
| 5-Person Families | 82 (18.0%) | $40,455 |
| 6-Person Families | 36 (7.9%) | $0 |
| 7+ Person Families | 48 (10.5%) | $0 |
| Total | 456 (100.0%) | $42,143 |
Family Income by Number of Earners in El Cenizo
The median family income in El Cenizo is $42,143, with families comprising 3+ earners (75) having the highest median family income of $112,614, while families with no earners (52) have the lowest median family income of $2,499, accounting for 16.5% and 11.4% of families, respectively.
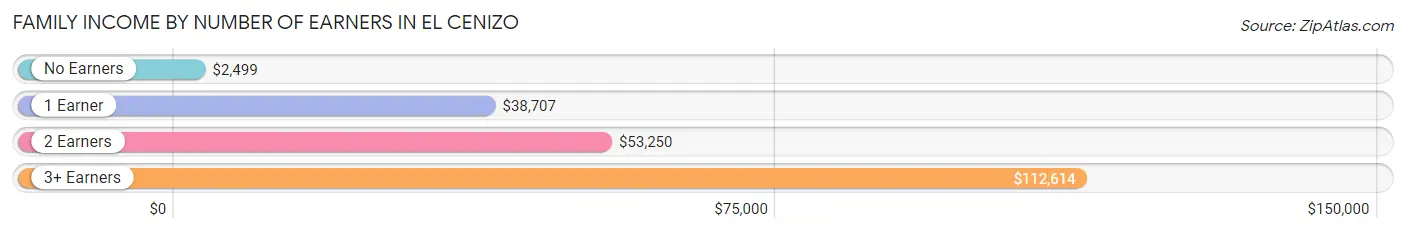
| Number of Earners | # Families | Median Income |
| No Earners | 52 (11.4%) | $2,499 |
| 1 Earner | 196 (43.0%) | $38,707 |
| 2 Earners | 133 (29.2%) | $53,250 |
| 3+ Earners | 75 (16.5%) | $112,614 |
| Total | 456 (100.0%) | $42,143 |
Household Income in El Cenizo
Household Income Brackets in El Cenizo
With 134 households falling in the category, the less than $10,000 income range is the most frequent in El Cenizo, accounting for 22.0% of all households. In contrast, only 3 households (0.5%) fall into the $150,000 to $199,999 income bracket, making it the least populous group.
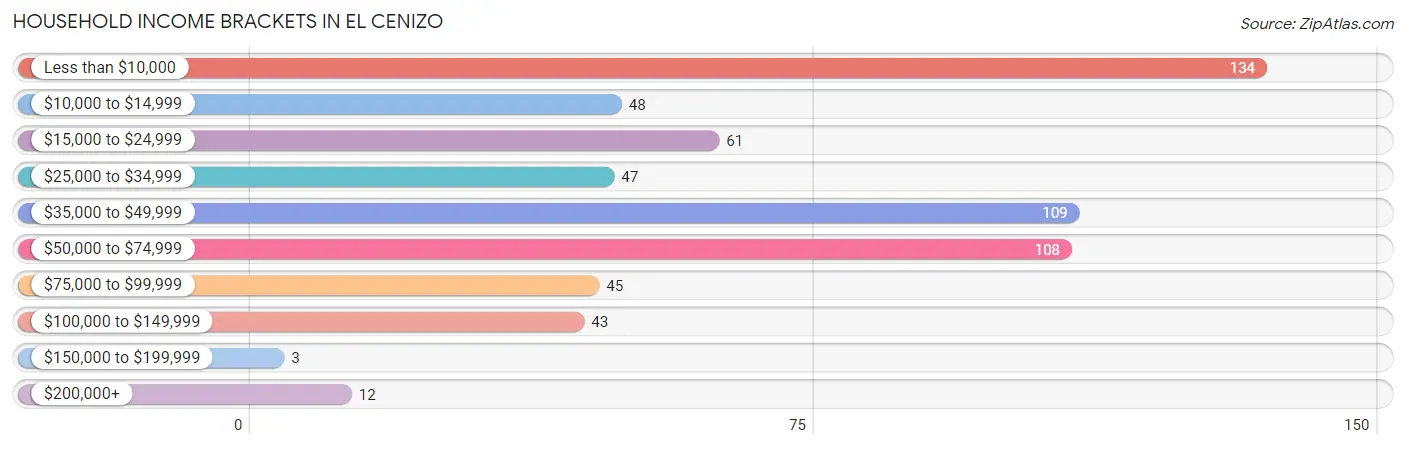
| Income Bracket | # Households | % Households |
| Less than $10,000 | 134 | 22.0% |
| $10,000 to $14,999 | 48 | 7.9% |
| $15,000 to $24,999 | 61 | 10.0% |
| $25,000 to $34,999 | 47 | 7.7% |
| $35,000 to $49,999 | 109 | 17.9% |
| $50,000 to $74,999 | 108 | 17.7% |
| $75,000 to $99,999 | 45 | 7.4% |
| $100,000 to $149,999 | 43 | 7.0% |
| $150,000 to $199,999 | 3 | 0.5% |
| $200,000+ | 12 | 2.0% |
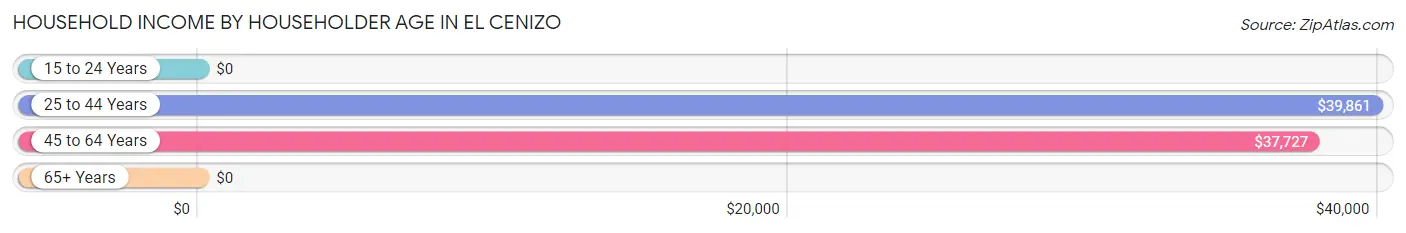
Household Income by Householder Age in El Cenizo
The median household income in El Cenizo is $36,389, with the highest median household income of $39,861 found in the 25 to 44 years age bracket for the primary householder. A total of 216 households (35.4%) fall into this category. Meanwhile, the 15 to 24 years age bracket for the primary householder has the lowest median household income of $0, with 7 households (1.1%) in this group.
| Income Bracket | # Households | Median Income |
| 15 to 24 Years | 7 (1.1%) | $0 |
| 25 to 44 Years | 216 (35.4%) | $39,861 |
| 45 to 64 Years | 232 (38.0%) | $37,727 |
| 65+ Years | 155 (25.4%) | $0 |
| Total | 610 (100.0%) | $36,389 |
Poverty in El Cenizo
Income Below Poverty by Sex and Age in El Cenizo
With 33.6% poverty level for males and 42.0% for females among the residents of El Cenizo, 15 year old males and 75 year old and over females are the most vulnerable to poverty, with 3 males (100.0%) and 27 females (100.0%) in their respective age groups living below the poverty level.
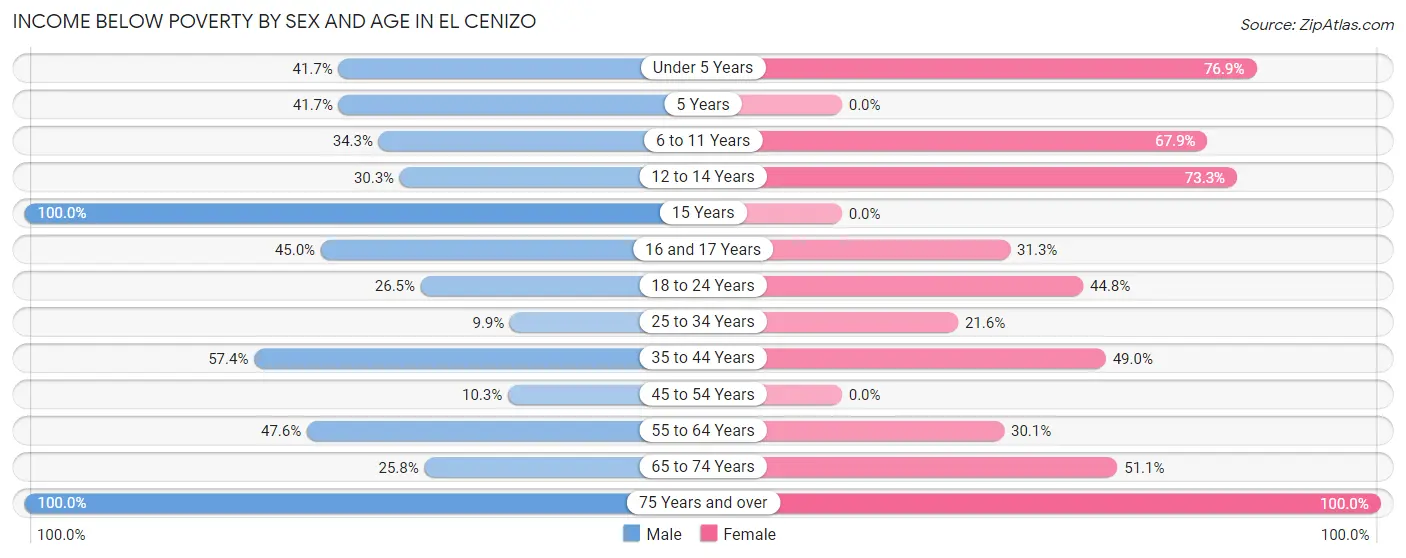
| Age Bracket | Male | Female |
| Under 5 Years | 68 (41.7%) | 30 (76.9%) |
| 5 Years | 10 (41.7%) | 0 (0.0%) |
| 6 to 11 Years | 37 (34.3%) | 76 (67.9%) |
| 12 to 14 Years | 37 (30.3%) | 66 (73.3%) |
| 15 Years | 3 (100.0%) | 0 (0.0%) |
| 16 and 17 Years | 27 (45.0%) | 5 (31.2%) |
| 18 to 24 Years | 32 (26.5%) | 43 (44.8%) |
| 25 to 34 Years | 17 (9.9%) | 33 (21.6%) |
| 35 to 44 Years | 70 (57.4%) | 73 (49.0%) |
| 45 to 54 Years | 12 (10.3%) | 0 (0.0%) |
| 55 to 64 Years | 49 (47.6%) | 25 (30.1%) |
| 65 to 74 Years | 17 (25.8%) | 45 (51.1%) |
| 75 Years and over | 26 (100.0%) | 27 (100.0%) |
| Total | 405 (33.6%) | 423 (42.0%) |
Income Above Poverty by Sex and Age in El Cenizo
According to the poverty statistics in El Cenizo, males aged 25 to 34 years and females aged 15 years are the age groups that are most secure financially, with 90.1% of males and 100.0% of females in these age groups living above the poverty line.
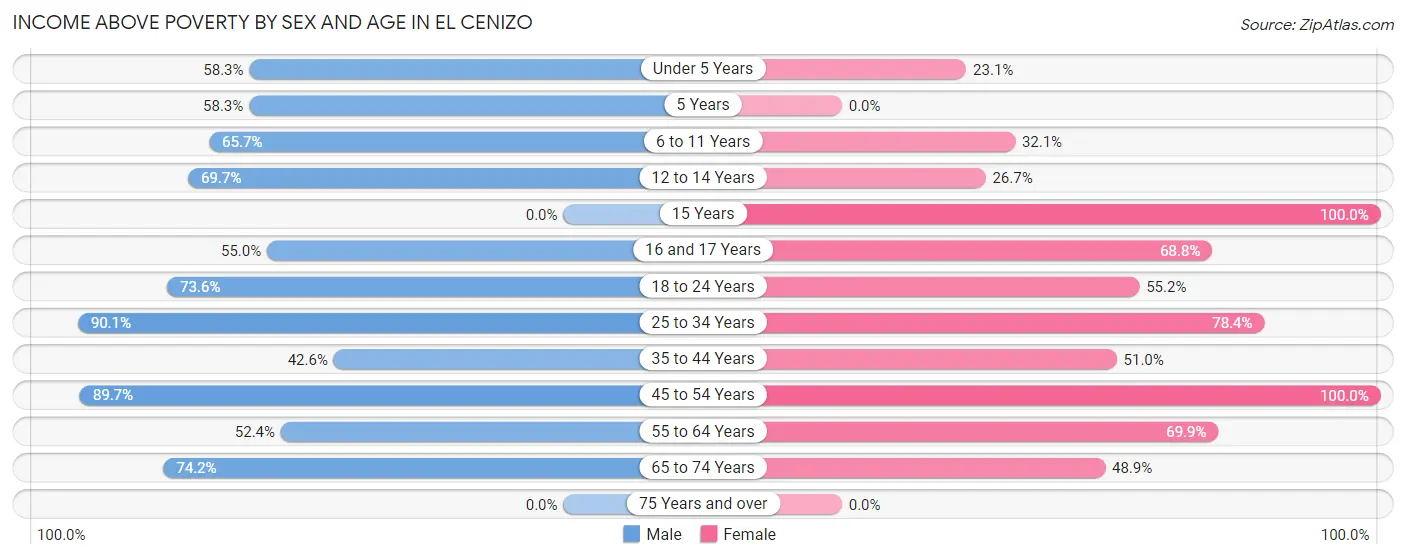
| Age Bracket | Male | Female |
| Under 5 Years | 95 (58.3%) | 9 (23.1%) |
| 5 Years | 14 (58.3%) | 0 (0.0%) |
| 6 to 11 Years | 71 (65.7%) | 36 (32.1%) |
| 12 to 14 Years | 85 (69.7%) | 24 (26.7%) |
| 15 Years | 0 (0.0%) | 28 (100.0%) |
| 16 and 17 Years | 33 (55.0%) | 11 (68.8%) |
| 18 to 24 Years | 89 (73.6%) | 53 (55.2%) |
| 25 to 34 Years | 155 (90.1%) | 120 (78.4%) |
| 35 to 44 Years | 52 (42.6%) | 76 (51.0%) |
| 45 to 54 Years | 105 (89.7%) | 126 (100.0%) |
| 55 to 64 Years | 54 (52.4%) | 58 (69.9%) |
| 65 to 74 Years | 49 (74.2%) | 43 (48.9%) |
| 75 Years and over | 0 (0.0%) | 0 (0.0%) |
| Total | 802 (66.4%) | 584 (58.0%) |
Income Below Poverty Among Married-Couple Families in El Cenizo
The poverty statistics for married-couple families in El Cenizo show that 23.9% or 67 of the total 280 families live below the poverty line. Families with 5 or more children have the highest poverty rate of 100.0%, comprising of 10 families. On the other hand, families with 1 or 2 children have the lowest poverty rate of 16.0%, which includes 23 families.
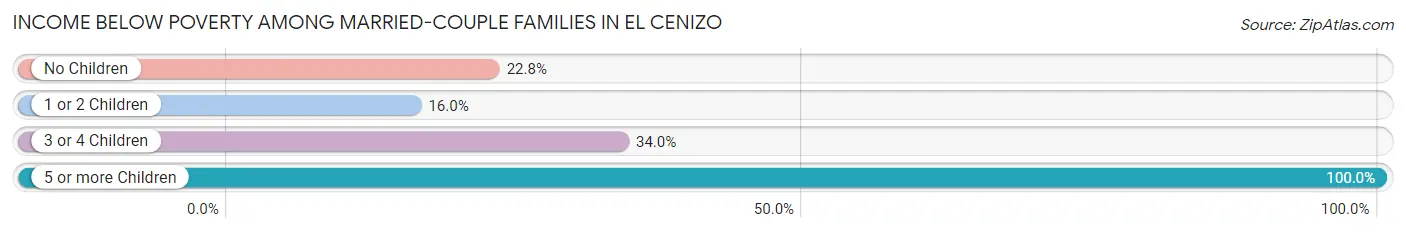
| Children | Above Poverty | Below Poverty |
| No Children | 61 (77.2%) | 18 (22.8%) |
| 1 or 2 Children | 121 (84.0%) | 23 (16.0%) |
| 3 or 4 Children | 31 (66.0%) | 16 (34.0%) |
| 5 or more Children | 0 (0.0%) | 10 (100.0%) |
| Total | 213 (76.1%) | 67 (23.9%) |
Income Below Poverty Among Single-Parent Households in El Cenizo
According to the poverty data in El Cenizo, 11.1% or 4 single-father households and 37.1% or 52 single-mother households are living below the poverty line. Among single-father households, those with 3 or 4 children have the highest poverty rate, with 4 households (100.0%) experiencing poverty. Likewise, among single-mother households, those with 3 or 4 children have the highest poverty rate, with 19 households (100.0%) falling below the poverty line.
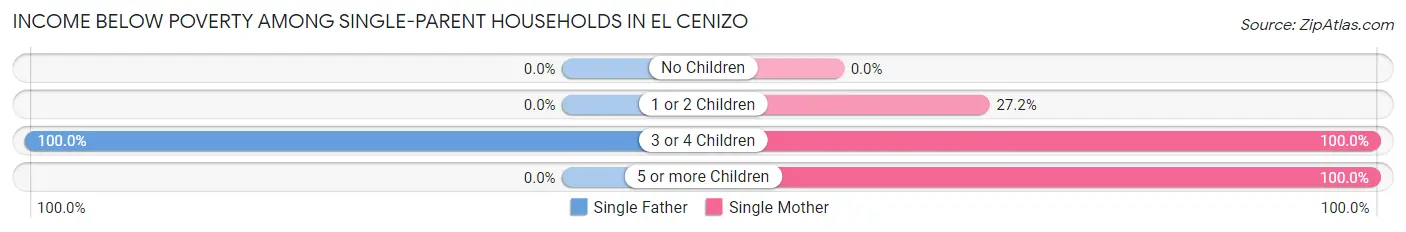
| Children | Single Father | Single Mother |
| No Children | 0 (0.0%) | 0 (0.0%) |
| 1 or 2 Children | 0 (0.0%) | 22 (27.2%) |
| 3 or 4 Children | 4 (100.0%) | 19 (100.0%) |
| 5 or more Children | 0 (0.0%) | 11 (100.0%) |
| Total | 4 (11.1%) | 52 (37.1%) |
Income Below Poverty Among Married-Couple vs Single-Parent Households in El Cenizo
The poverty data for El Cenizo shows that 67 of the married-couple family households (23.9%) and 56 of the single-parent households (31.8%) are living below the poverty level. Within the married-couple family households, those with 5 or more children have the highest poverty rate, with 10 households (100.0%) falling below the poverty line. Among the single-parent households, those with 3 or 4 children have the highest poverty rate, with 23 household (100.0%) living below poverty.
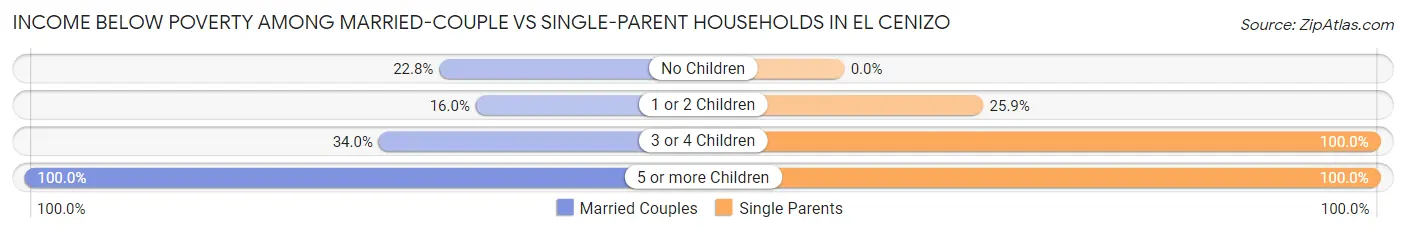
| Children | Married-Couple Families | Single-Parent Households |
| No Children | 18 (22.8%) | 0 (0.0%) |
| 1 or 2 Children | 23 (16.0%) | 22 (25.9%) |
| 3 or 4 Children | 16 (34.0%) | 23 (100.0%) |
| 5 or more Children | 10 (100.0%) | 11 (100.0%) |
| Total | 67 (23.9%) | 56 (31.8%) |
Race in El Cenizo
The most populous races in El Cenizo are Hispanic or Latino (2,157 | 96.9%), White / Caucasian (1,448 | 65.0%), and Two or more Races (685 | 30.8%).
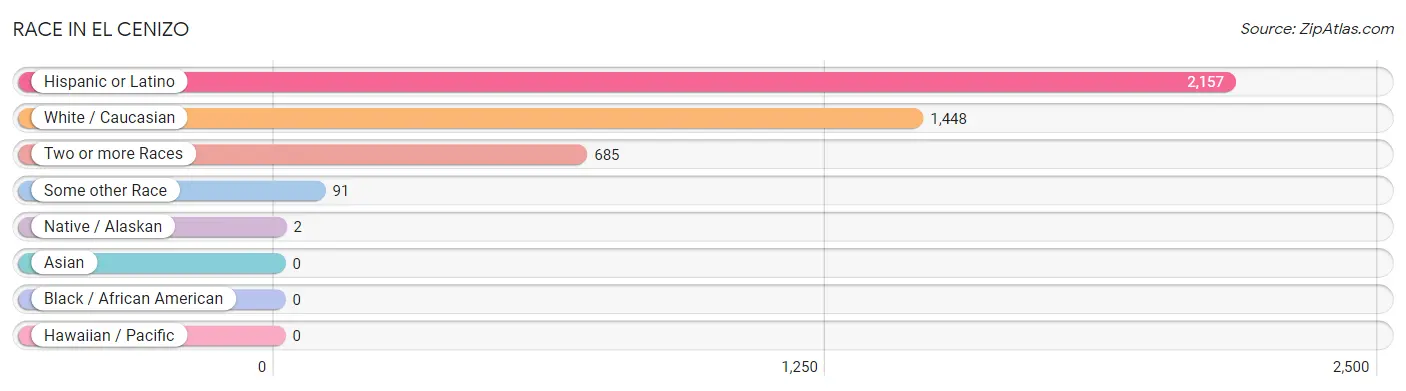
| Race | # Population | % Population |
| Asian | 0 | 0.0% |
| Black / African American | 0 | 0.0% |
| Hawaiian / Pacific | 0 | 0.0% |
| Hispanic or Latino | 2,157 | 96.9% |
| Native / Alaskan | 2 | 0.1% |
| White / Caucasian | 1,448 | 65.0% |
| Two or more Races | 685 | 30.8% |
| Some other Race | 91 | 4.1% |
| Total | 2,226 | 100.0% |
Ancestry in El Cenizo
The most populous ancestries reported in El Cenizo are Mexican (2,122 | 95.3%), American (70 | 3.1%), Spanish American Indian (27 | 1.2%), Spanish (21 | 0.9%), and French (17 | 0.8%), together accounting for 101.4% of all El Cenizo residents.
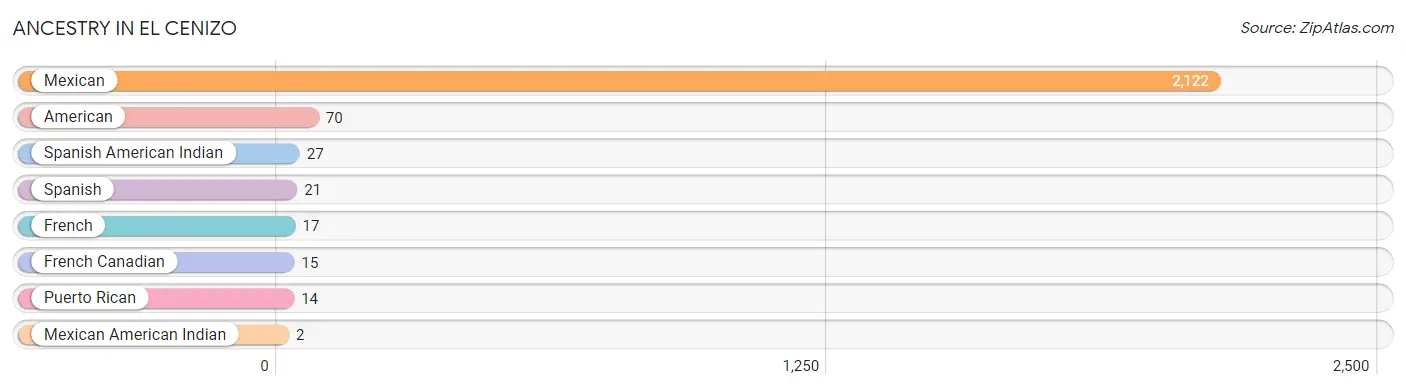
| Ancestry | # Population | % Population |
| American | 70 | 3.1% |
| French | 17 | 0.8% |
| French Canadian | 15 | 0.7% |
| Mexican | 2,122 | 95.3% |
| Mexican American Indian | 2 | 0.1% |
| Puerto Rican | 14 | 0.6% |
| Spanish | 21 | 0.9% |
| Spanish American Indian | 27 | 1.2% | View All 8 Rows |
Immigrants in El Cenizo
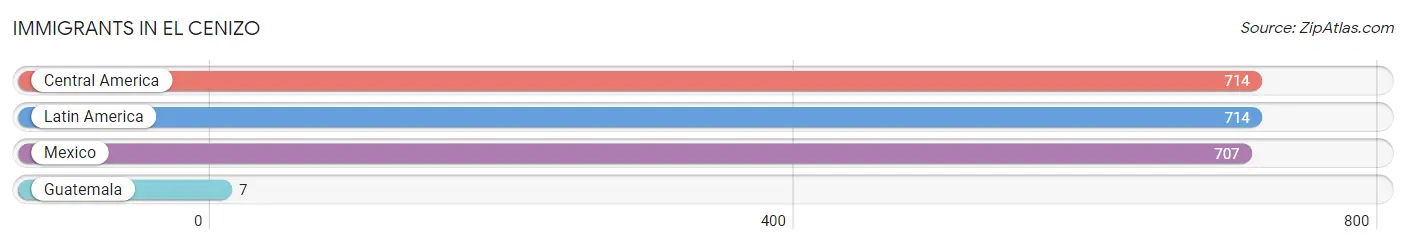
The most numerous immigrant groups reported in El Cenizo came from Central America (714 | 32.1%), Latin America (714 | 32.1%), Mexico (707 | 31.8%), and Guatemala (7 | 0.3%), together accounting for 96.2% of all El Cenizo residents.
| Immigration Origin | # Population | % Population |
| Central America | 714 | 32.1% |
| Guatemala | 7 | 0.3% |
| Latin America | 714 | 32.1% |
| Mexico | 707 | 31.8% | View All 4 Rows |
Sex and Age in El Cenizo
Sex and Age in El Cenizo
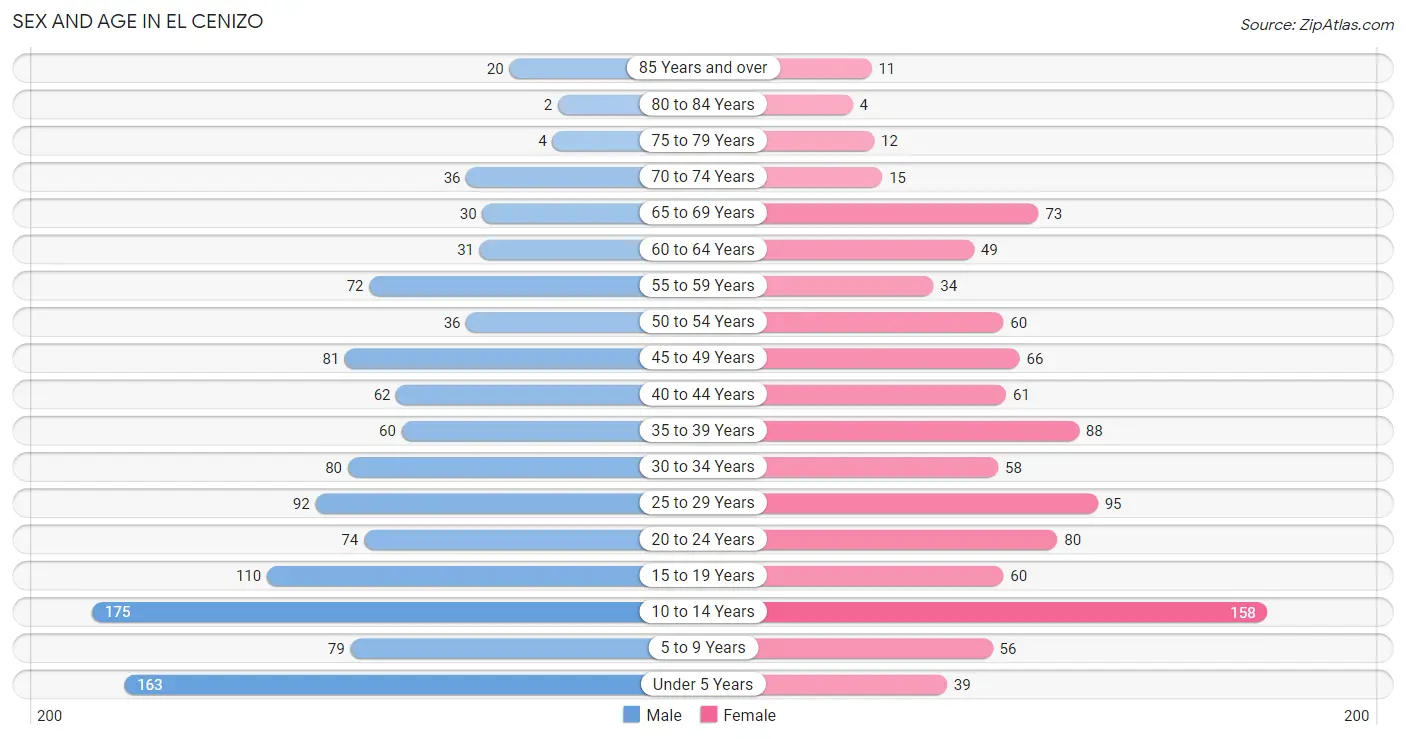
The most populous age groups in El Cenizo are 10 to 14 Years (175 | 14.5%) for men and 10 to 14 Years (158 | 15.5%) for women.
| Age Bracket | Male | Female |
| Under 5 Years | 163 (13.5%) | 39 (3.8%) |
| 5 to 9 Years | 79 (6.6%) | 56 (5.5%) |
| 10 to 14 Years | 175 (14.5%) | 158 (15.5%) |
| 15 to 19 Years | 110 (9.1%) | 60 (5.9%) |
| 20 to 24 Years | 74 (6.1%) | 80 (7.9%) |
| 25 to 29 Years | 92 (7.6%) | 95 (9.3%) |
| 30 to 34 Years | 80 (6.6%) | 58 (5.7%) |
| 35 to 39 Years | 60 (5.0%) | 88 (8.6%) |
| 40 to 44 Years | 62 (5.1%) | 61 (6.0%) |
| 45 to 49 Years | 81 (6.7%) | 66 (6.5%) |
| 50 to 54 Years | 36 (3.0%) | 60 (5.9%) |
| 55 to 59 Years | 72 (6.0%) | 34 (3.3%) |
| 60 to 64 Years | 31 (2.6%) | 49 (4.8%) |
| 65 to 69 Years | 30 (2.5%) | 73 (7.2%) |
| 70 to 74 Years | 36 (3.0%) | 15 (1.5%) |
| 75 to 79 Years | 4 (0.3%) | 12 (1.2%) |
| 80 to 84 Years | 2 (0.2%) | 4 (0.4%) |
| 85 Years and over | 20 (1.7%) | 11 (1.1%) |
| Total | 1,207 (100.0%) | 1,019 (100.0%) |
Families and Households in El Cenizo
Median Family Size in El Cenizo
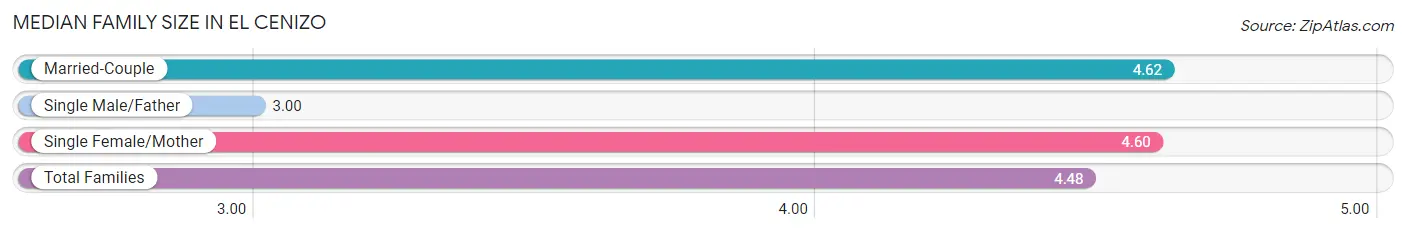
The median family size in El Cenizo is 4.48 persons per family, with married-couple families (280 | 61.4%) accounting for the largest median family size of 4.62 persons per family. On the other hand, single male/father families (36 | 7.9%) represent the smallest median family size with 3.00 persons per family.
| Family Type | # Families | Family Size |
| Married-Couple | 280 (61.4%) | 4.62 |
| Single Male/Father | 36 (7.9%) | 3.00 |
| Single Female/Mother | 140 (30.7%) | 4.60 |
| Total Families | 456 (100.0%) | 4.48 |
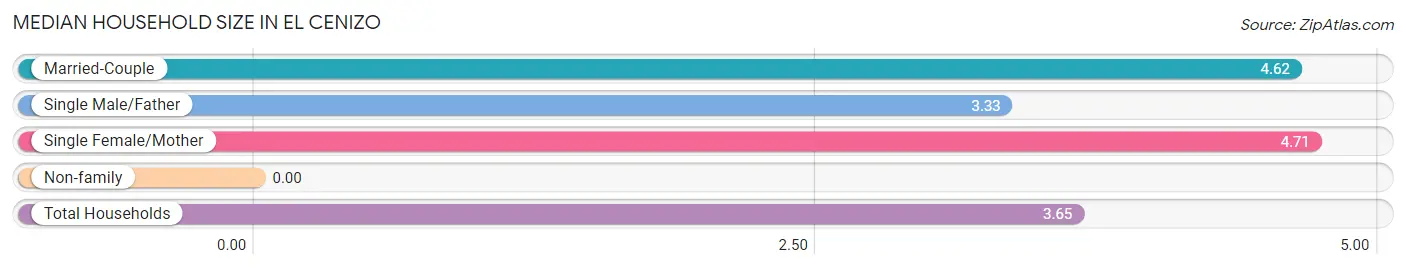
Median Household Size in El Cenizo
| Household Type | # Households | Household Size |
| Married-Couple | 280 (45.9%) | 4.62 |
| Single Male/Father | 36 (5.9%) | 3.33 |
| Single Female/Mother | 140 (23.0%) | 4.71 |
| Non-family | 154 (25.3%) | - |
| Total Households | 610 (100.0%) | 3.65 |
Household Size by Marriage Status in El Cenizo
Out of a total of 610 households in El Cenizo, 456 (74.8%) are family households, while 154 (25.3%) are nonfamily households. The most numerous type of family households are 4-person households, comprising 139, and the most common type of nonfamily households are 1-person households, comprising 154.
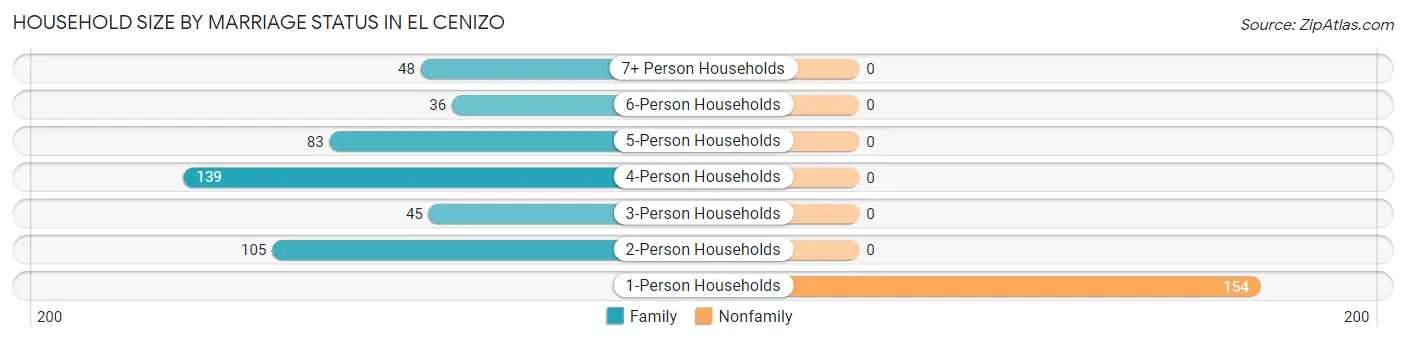
| Household Size | Family Households | Nonfamily Households |
| 1-Person Households | - | 154 (25.3%) |
| 2-Person Households | 105 (17.2%) | 0 (0.0%) |
| 3-Person Households | 45 (7.4%) | 0 (0.0%) |
| 4-Person Households | 139 (22.8%) | 0 (0.0%) |
| 5-Person Households | 83 (13.6%) | 0 (0.0%) |
| 6-Person Households | 36 (5.9%) | 0 (0.0%) |
| 7+ Person Households | 48 (7.9%) | 0 (0.0%) |
| Total | 456 (74.8%) | 154 (25.3%) |
Female Fertility in El Cenizo
Fertility by Age in El Cenizo
Average fertility rate in El Cenizo is 94.0 births per 1,000 women. Women in the age bracket of 15 to 19 years have the highest fertility rate with 150.0 births per 1,000 women. Women in the age bracket of 20 to 34 years acount for 72.9% of all women with births.
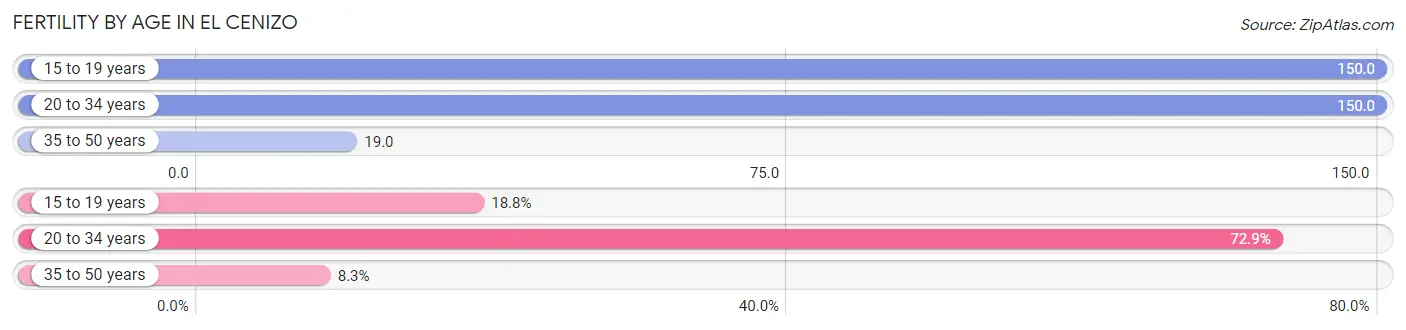
| Age Bracket | Women with Births | Births / 1,000 Women |
| 15 to 19 years | 9 (18.8%) | 150.0 |
| 20 to 34 years | 35 (72.9%) | 150.0 |
| 35 to 50 years | 4 (8.3%) | 19.0 |
| Total | 48 (100.0%) | 94.0 |
Fertility by Age by Marriage Status in El Cenizo
41.7% of women with births (48) in El Cenizo are married. The highest percentage of unmarried women with births falls into 15 to 19 years age bracket with 100.0% of them unmarried at the time of birth, while the lowest percentage of unmarried women with births belong to 35 to 50 years age bracket with 0.0% of them unmarried.
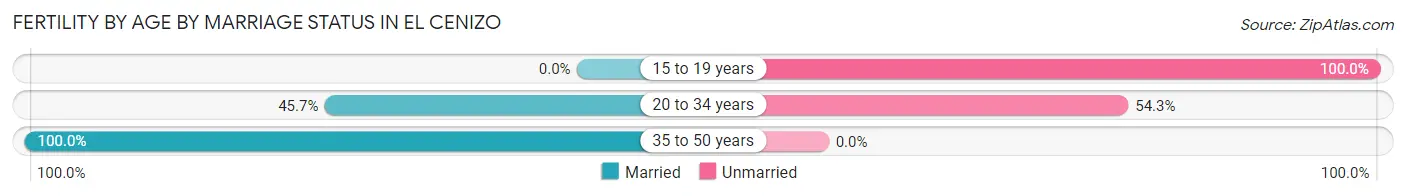
| Age Bracket | Married | Unmarried |
| 15 to 19 years | 0 (0.0%) | 9 (100.0%) |
| 20 to 34 years | 16 (45.7%) | 19 (54.3%) |
| 35 to 50 years | 4 (100.0%) | 0 (0.0%) |
| Total | 20 (41.7%) | 28 (58.3%) |
Fertility by Education in El Cenizo
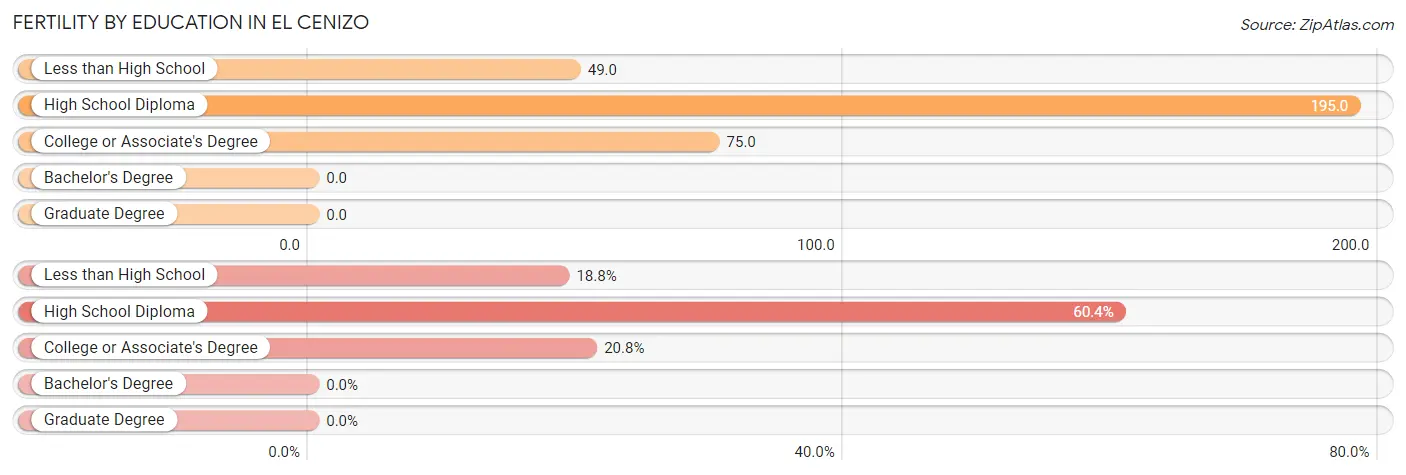
| Educational Attainment | Women with Births | Births / 1,000 Women |
| Less than High School | 9 (18.8%) | 49.0 |
| High School Diploma | 29 (60.4%) | 195.0 |
| College or Associate's Degree | 10 (20.8%) | 75.0 |
| Bachelor's Degree | 0 (0.0%) | 0.0 |
| Graduate Degree | 0 (0.0%) | 0.0 |
| Total | 48 (100.0%) | 94.0 |
Fertility by Education by Marriage Status in El Cenizo
58.3% of women with births in El Cenizo are unmarried. Women with the educational attainment of college or associate's degree are most likely to be married with 60.0% of them married at childbirth, while women with the educational attainment of less than high school are least likely to be married with 100.0% of them unmarried at childbirth.
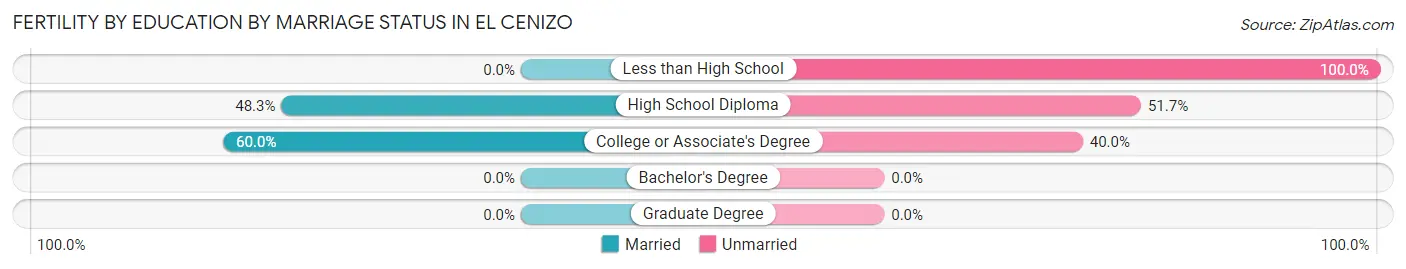
| Educational Attainment | Married | Unmarried |
| Less than High School | 0 (0.0%) | 9 (100.0%) |
| High School Diploma | 14 (48.3%) | 15 (51.7%) |
| College or Associate's Degree | 6 (60.0%) | 4 (40.0%) |
| Bachelor's Degree | 0 (0.0%) | 0 (0.0%) |
| Graduate Degree | 0 (0.0%) | 0 (0.0%) |
| Total | 20 (41.7%) | 28 (58.3%) |
Employment Characteristics in El Cenizo
Employment by Class of Employer in El Cenizo
Among the 749 employed individuals in El Cenizo, private company employees (608 | 81.2%), local government employees (51 | 6.8%), and self-employed (not incorporated) (45 | 6.0%) make up the most common classes of employment.
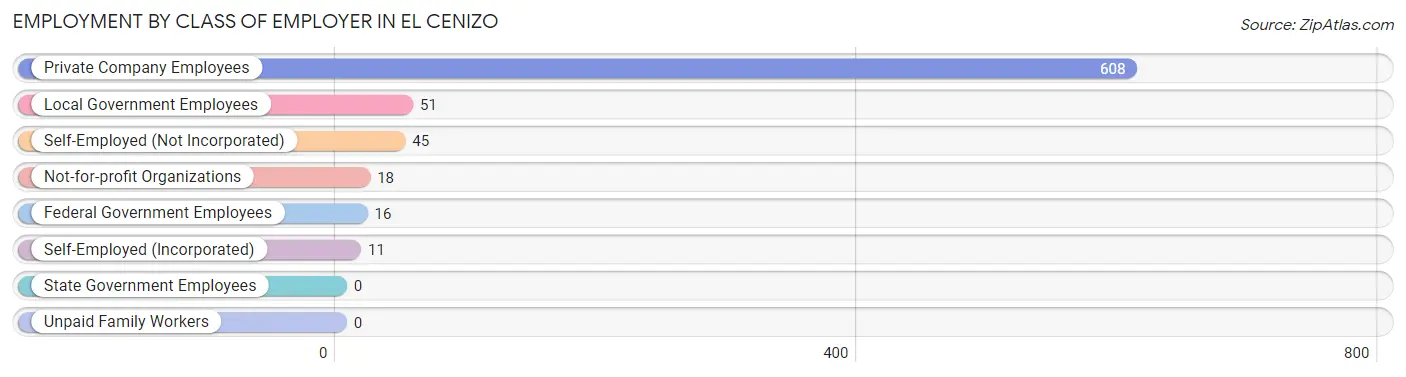
| Employer Class | # Employees | % Employees |
| Private Company Employees | 608 | 81.2% |
| Self-Employed (Incorporated) | 11 | 1.5% |
| Self-Employed (Not Incorporated) | 45 | 6.0% |
| Not-for-profit Organizations | 18 | 2.4% |
| Local Government Employees | 51 | 6.8% |
| State Government Employees | 0 | 0.0% |
| Federal Government Employees | 16 | 2.1% |
| Unpaid Family Workers | 0 | 0.0% |
| Total | 749 | 100.0% |
Employment Status by Age in El Cenizo
According to the labor force statistics for El Cenizo, out of the total population over 16 years of age (1,525), 52.4% or 799 individuals are in the labor force, with 6.3% or 50 of them unemployed. The age group with the highest labor force participation rate is 30 to 34 years, with 87.0% or 120 individuals in the labor force. Within the labor force, the 16 to 19 years age range has the highest percentage of unemployed individuals, with 60.0% or 21 of them being unemployed.
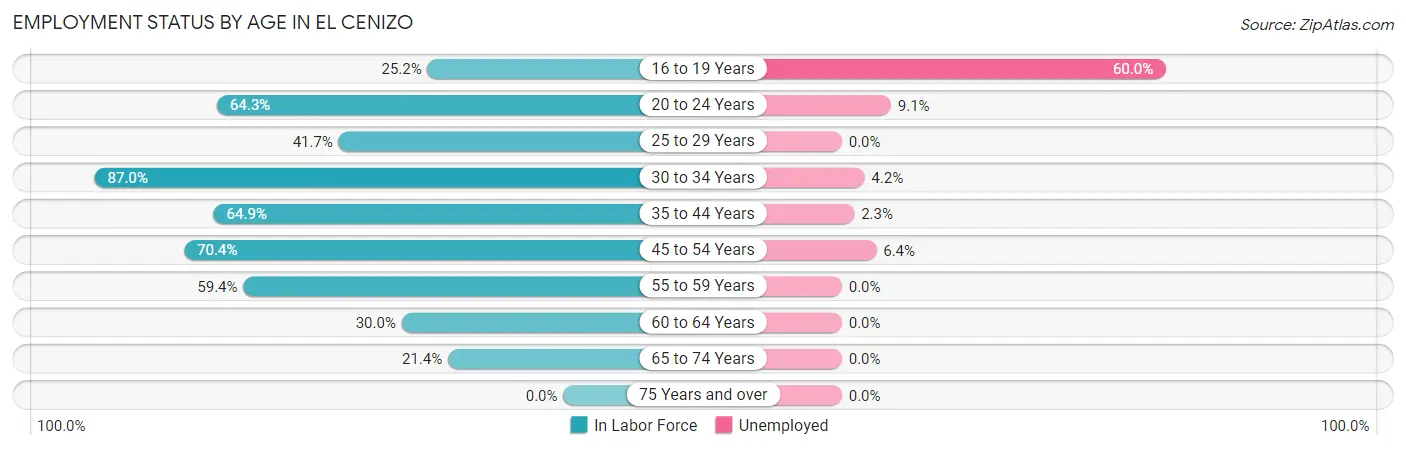
| Age Bracket | In Labor Force | Unemployed |
| 16 to 19 Years | 35 (25.2%) | 21 (60.0%) |
| 20 to 24 Years | 99 (64.3%) | 9 (9.1%) |
| 25 to 29 Years | 78 (41.7%) | 0 (0.0%) |
| 30 to 34 Years | 120 (87.0%) | 5 (4.2%) |
| 35 to 44 Years | 176 (64.9%) | 4 (2.3%) |
| 45 to 54 Years | 171 (70.4%) | 11 (6.4%) |
| 55 to 59 Years | 63 (59.4%) | 0 (0.0%) |
| 60 to 64 Years | 24 (30.0%) | 0 (0.0%) |
| 65 to 74 Years | 33 (21.4%) | 0 (0.0%) |
| 75 Years and over | 0 (0.0%) | 0 (0.0%) |
| Total | 799 (52.4%) | 50 (6.3%) |
Employment Status by Educational Attainment in El Cenizo
According to labor force statistics for El Cenizo, 61.7% of individuals (632) out of the total population between 25 and 64 years of age (1,025) are in the labor force, with 3.2% or 20 of them being unemployed. The group with the highest labor force participation rate are those with the educational attainment of bachelor's degree or higher, with 81.9% or 59 individuals in the labor force. Within the labor force, individuals with bachelor's degree or higher education have the highest percentage of unemployment, with 8.5% or 5 of them being unemployed.
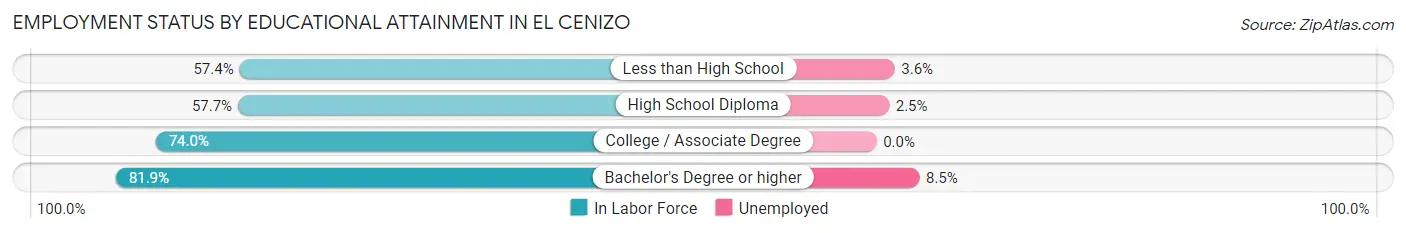
| Educational Attainment | In Labor Force | Unemployed |
| Less than High School | 305 (57.4%) | 19 (3.6%) |
| High School Diploma | 157 (57.7%) | 7 (2.5%) |
| College / Associate Degree | 111 (74.0%) | 0 (0.0%) |
| Bachelor's Degree or higher | 59 (81.9%) | 6 (8.5%) |
| Total | 632 (61.7%) | 33 (3.2%) |
Employment Occupations by Sex in El Cenizo
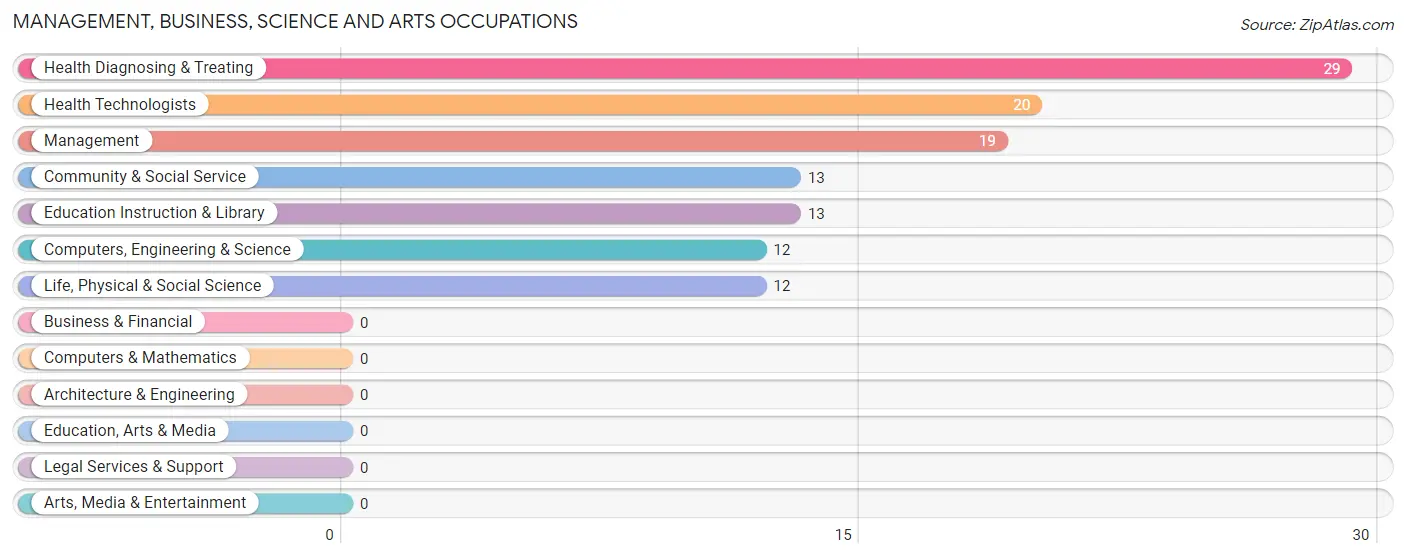
Management, Business, Science and Arts Occupations
The most common Management, Business, Science and Arts occupations in El Cenizo are Health Diagnosing & Treating (29 | 3.9%), Health Technologists (20 | 2.7%), Management (19 | 2.5%), Community & Social Service (13 | 1.7%), and Education Instruction & Library (13 | 1.7%).
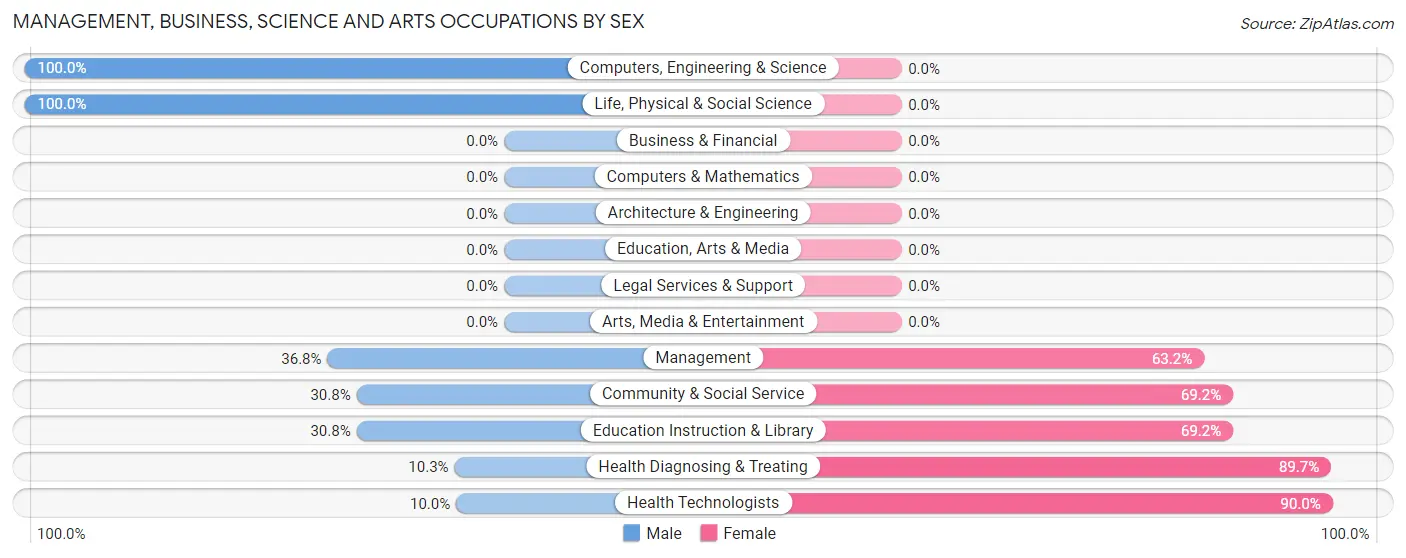
Management, Business, Science and Arts Occupations by Sex
Within the Management, Business, Science and Arts occupations in El Cenizo, the most male-oriented occupations are Computers, Engineering & Science (100.0%), Life, Physical & Social Science (100.0%), and Management (36.8%), while the most female-oriented occupations are Health Technologists (90.0%), Health Diagnosing & Treating (89.7%), and Community & Social Service (69.2%).
| Occupation | Male | Female |
| Management | 7 (36.8%) | 12 (63.2%) |
| Business & Financial | 0 (0.0%) | 0 (0.0%) |
| Computers, Engineering & Science | 12 (100.0%) | 0 (0.0%) |
| Computers & Mathematics | 0 (0.0%) | 0 (0.0%) |
| Architecture & Engineering | 0 (0.0%) | 0 (0.0%) |
| Life, Physical & Social Science | 12 (100.0%) | 0 (0.0%) |
| Community & Social Service | 4 (30.8%) | 9 (69.2%) |
| Education, Arts & Media | 0 (0.0%) | 0 (0.0%) |
| Legal Services & Support | 0 (0.0%) | 0 (0.0%) |
| Education Instruction & Library | 4 (30.8%) | 9 (69.2%) |
| Arts, Media & Entertainment | 0 (0.0%) | 0 (0.0%) |
| Health Diagnosing & Treating | 3 (10.3%) | 26 (89.7%) |
| Health Technologists | 2 (10.0%) | 18 (90.0%) |
| Total (Category) | 26 (35.6%) | 47 (64.4%) |
| Total (Overall) | 467 (62.4%) | 282 (37.7%) |
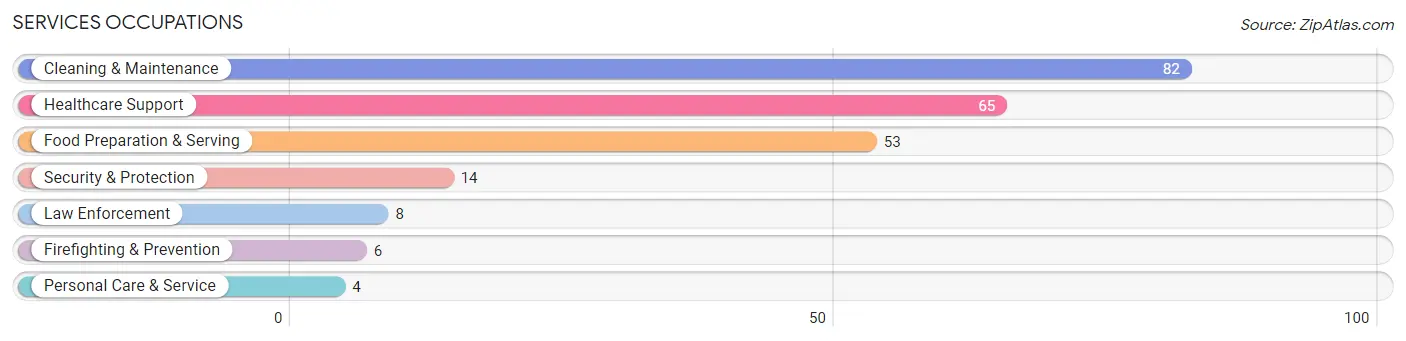
Services Occupations
The most common Services occupations in El Cenizo are Cleaning & Maintenance (82 | 11.0%), Healthcare Support (65 | 8.7%), Food Preparation & Serving (53 | 7.1%), Security & Protection (14 | 1.9%), and Law Enforcement (8 | 1.1%).
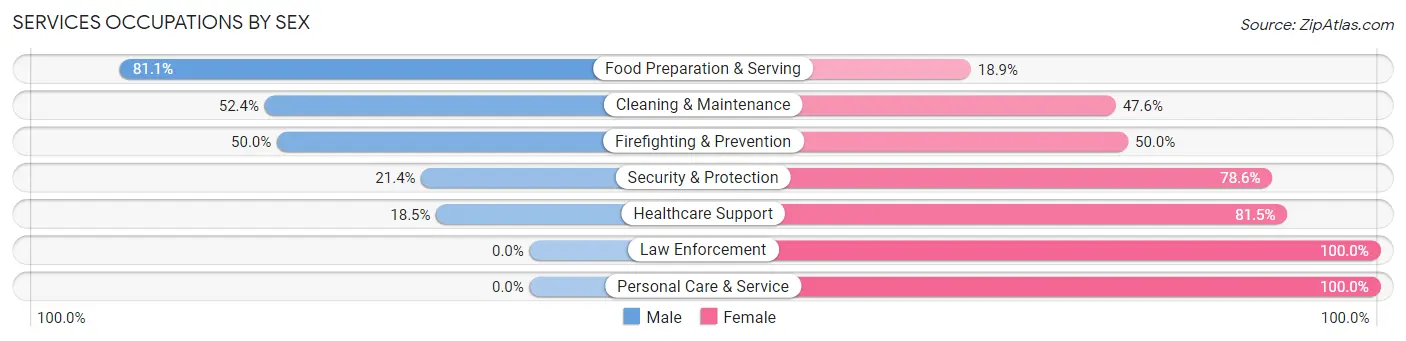
Services Occupations by Sex
Within the Services occupations in El Cenizo, the most male-oriented occupations are Food Preparation & Serving (81.1%), Cleaning & Maintenance (52.4%), and Firefighting & Prevention (50.0%), while the most female-oriented occupations are Law Enforcement (100.0%), Personal Care & Service (100.0%), and Healthcare Support (81.5%).
| Occupation | Male | Female |
| Healthcare Support | 12 (18.5%) | 53 (81.5%) |
| Security & Protection | 3 (21.4%) | 11 (78.6%) |
| Firefighting & Prevention | 3 (50.0%) | 3 (50.0%) |
| Law Enforcement | 0 (0.0%) | 8 (100.0%) |
| Food Preparation & Serving | 43 (81.1%) | 10 (18.9%) |
| Cleaning & Maintenance | 43 (52.4%) | 39 (47.6%) |
| Personal Care & Service | 0 (0.0%) | 4 (100.0%) |
| Total (Category) | 101 (46.3%) | 117 (53.7%) |
| Total (Overall) | 467 (62.4%) | 282 (37.7%) |
Sales and Office Occupations
The most common Sales and Office occupations in El Cenizo are Office & Administration (112 | 14.9%), and Sales & Related (44 | 5.9%).

Sales and Office Occupations by Sex
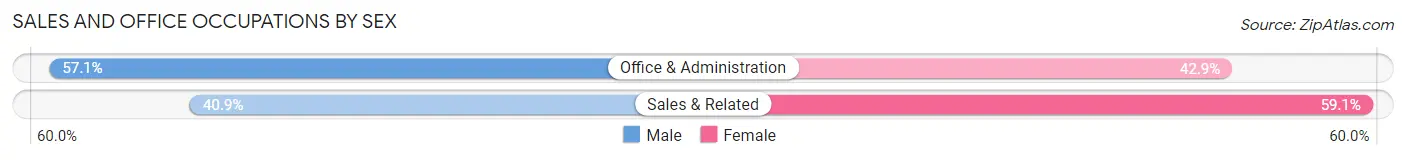
| Occupation | Male | Female |
| Sales & Related | 18 (40.9%) | 26 (59.1%) |
| Office & Administration | 64 (57.1%) | 48 (42.9%) |
| Total (Category) | 82 (52.6%) | 74 (47.4%) |
| Total (Overall) | 467 (62.4%) | 282 (37.7%) |
Natural Resources, Construction and Maintenance Occupations
The most common Natural Resources, Construction and Maintenance occupations in El Cenizo are Construction & Extraction (64 | 8.5%), Installation, Maintenance & Repair (60 | 8.0%), and Farming, Fishing & Forestry (7 | 0.9%).

Natural Resources, Construction and Maintenance Occupations by Sex
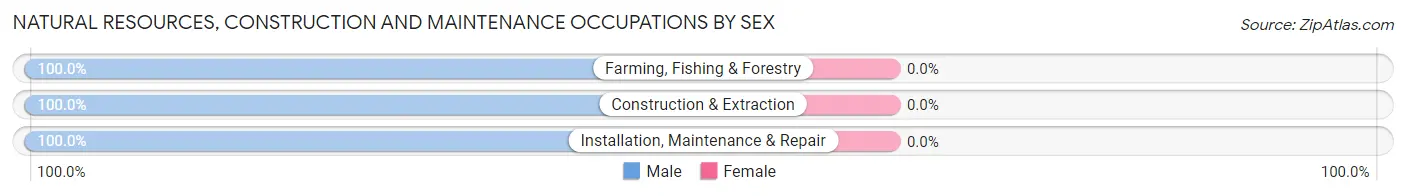
| Occupation | Male | Female |
| Farming, Fishing & Forestry | 7 (100.0%) | 0 (0.0%) |
| Construction & Extraction | 64 (100.0%) | 0 (0.0%) |
| Installation, Maintenance & Repair | 60 (100.0%) | 0 (0.0%) |
| Total (Category) | 131 (100.0%) | 0 (0.0%) |
| Total (Overall) | 467 (62.4%) | 282 (37.7%) |
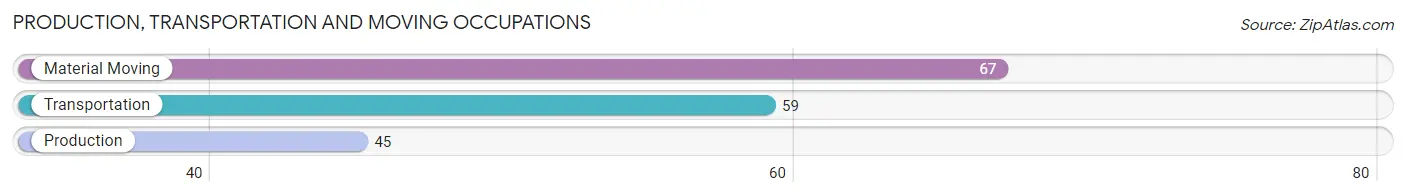
Production, Transportation and Moving Occupations
The most common Production, Transportation and Moving occupations in El Cenizo are Material Moving (67 | 8.9%), Transportation (59 | 7.9%), and Production (45 | 6.0%).
Production, Transportation and Moving Occupations by Sex
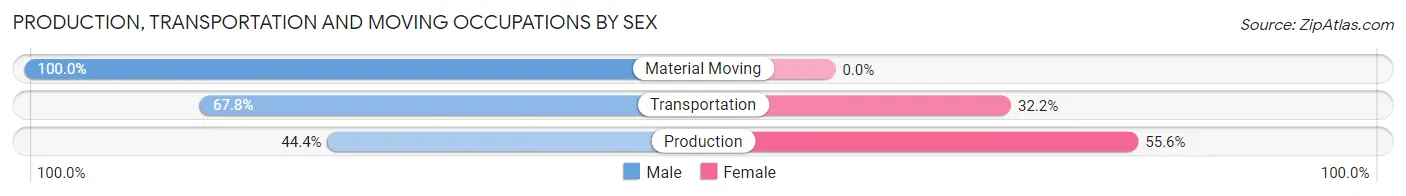
| Occupation | Male | Female |
| Production | 20 (44.4%) | 25 (55.6%) |
| Transportation | 40 (67.8%) | 19 (32.2%) |
| Material Moving | 67 (100.0%) | 0 (0.0%) |
| Total (Category) | 127 (74.3%) | 44 (25.7%) |
| Total (Overall) | 467 (62.4%) | 282 (37.7%) |
Employment Industries by Sex in El Cenizo
Employment Industries in El Cenizo
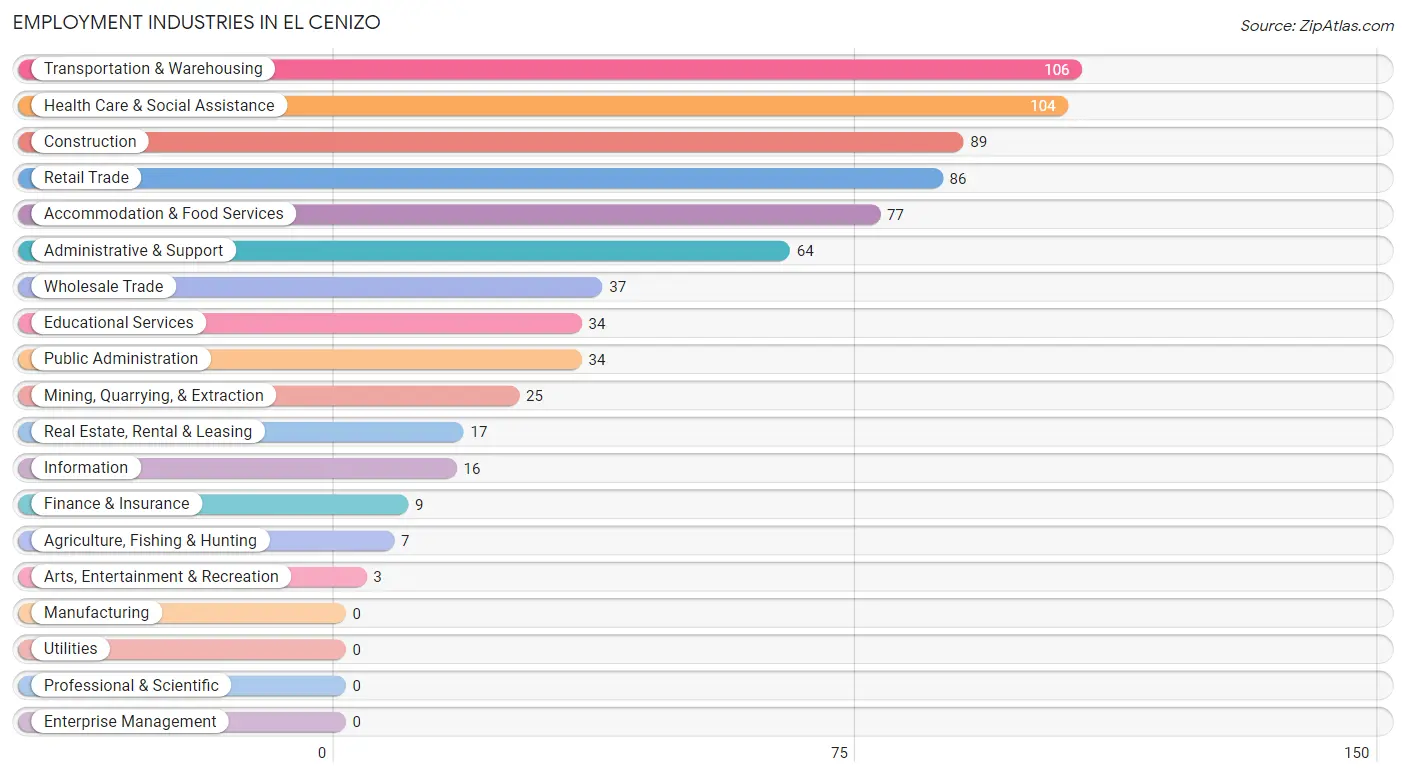
The major employment industries in El Cenizo include Transportation & Warehousing (106 | 14.1%), Health Care & Social Assistance (104 | 13.9%), Construction (89 | 11.9%), Retail Trade (86 | 11.5%), and Accommodation & Food Services (77 | 10.3%).
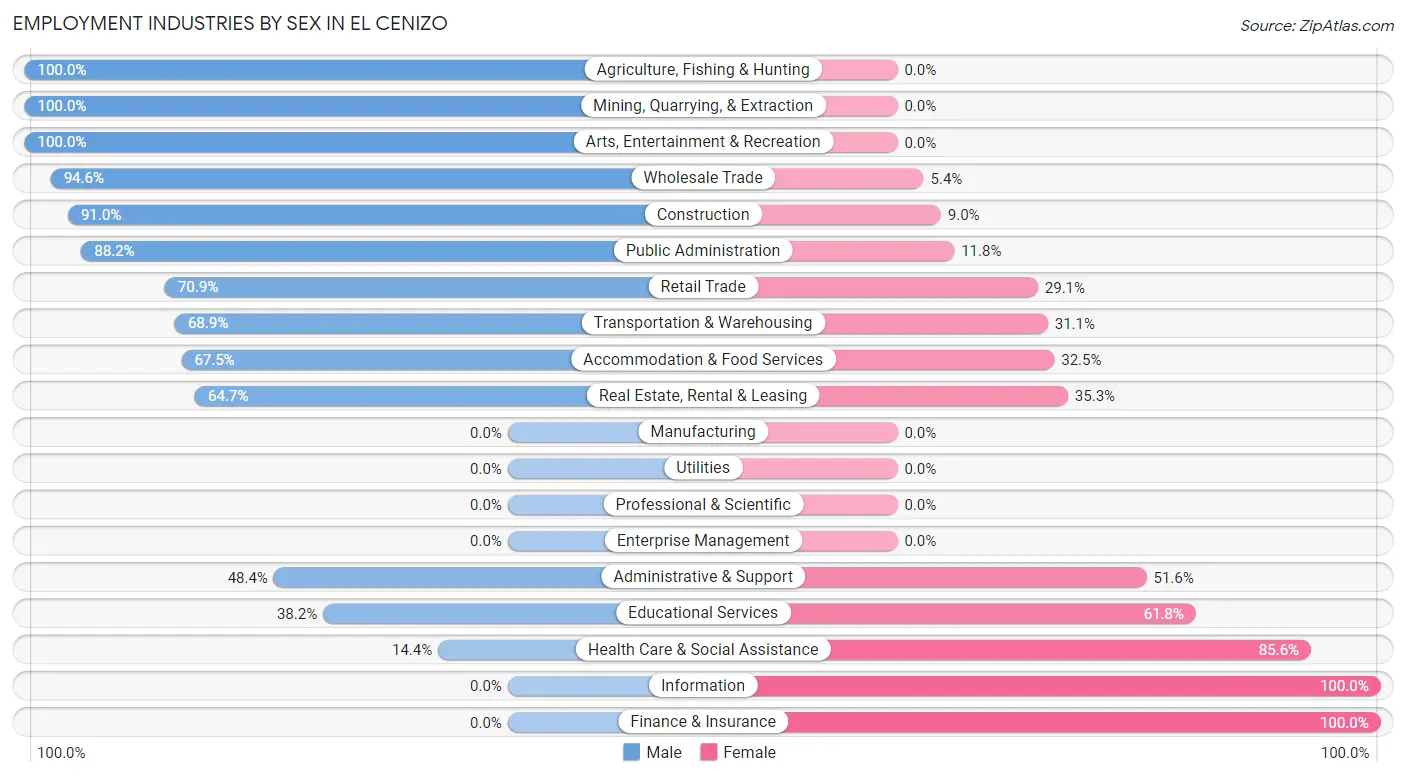
Employment Industries by Sex in El Cenizo
The El Cenizo industries that see more men than women are Agriculture, Fishing & Hunting (100.0%), Mining, Quarrying, & Extraction (100.0%), and Arts, Entertainment & Recreation (100.0%), whereas the industries that tend to have a higher number of women are Information (100.0%), Finance & Insurance (100.0%), and Health Care & Social Assistance (85.6%).
| Industry | Male | Female |
| Agriculture, Fishing & Hunting | 7 (100.0%) | 0 (0.0%) |
| Mining, Quarrying, & Extraction | 25 (100.0%) | 0 (0.0%) |
| Construction | 81 (91.0%) | 8 (9.0%) |
| Manufacturing | 0 (0.0%) | 0 (0.0%) |
| Wholesale Trade | 35 (94.6%) | 2 (5.4%) |
| Retail Trade | 61 (70.9%) | 25 (29.1%) |
| Transportation & Warehousing | 73 (68.9%) | 33 (31.1%) |
| Utilities | 0 (0.0%) | 0 (0.0%) |
| Information | 0 (0.0%) | 16 (100.0%) |
| Finance & Insurance | 0 (0.0%) | 9 (100.0%) |
| Real Estate, Rental & Leasing | 11 (64.7%) | 6 (35.3%) |
| Professional & Scientific | 0 (0.0%) | 0 (0.0%) |
| Enterprise Management | 0 (0.0%) | 0 (0.0%) |
| Administrative & Support | 31 (48.4%) | 33 (51.6%) |
| Educational Services | 13 (38.2%) | 21 (61.8%) |
| Health Care & Social Assistance | 15 (14.4%) | 89 (85.6%) |
| Arts, Entertainment & Recreation | 3 (100.0%) | 0 (0.0%) |
| Accommodation & Food Services | 52 (67.5%) | 25 (32.5%) |
| Public Administration | 30 (88.2%) | 4 (11.8%) |
| Total | 467 (62.4%) | 282 (37.7%) |
Education in El Cenizo
School Enrollment in El Cenizo
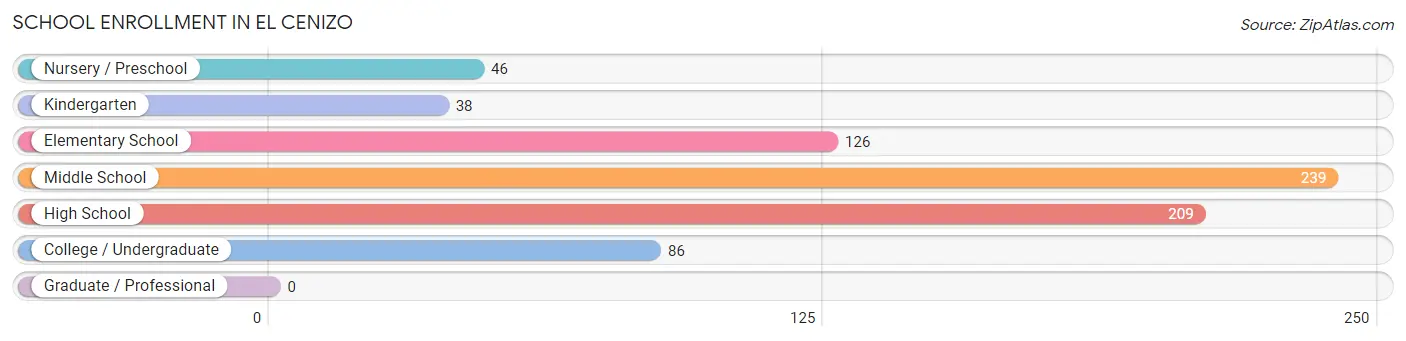
The most common levels of schooling among the 744 students in El Cenizo are middle school (239 | 32.1%), high school (209 | 28.1%), and elementary school (126 | 16.9%).
| School Level | # Students | % Students |
| Nursery / Preschool | 46 | 6.2% |
| Kindergarten | 38 | 5.1% |
| Elementary School | 126 | 16.9% |
| Middle School | 239 | 32.1% |
| High School | 209 | 28.1% |
| College / Undergraduate | 86 | 11.6% |
| Graduate / Professional | 0 | 0.0% |
| Total | 744 | 100.0% |
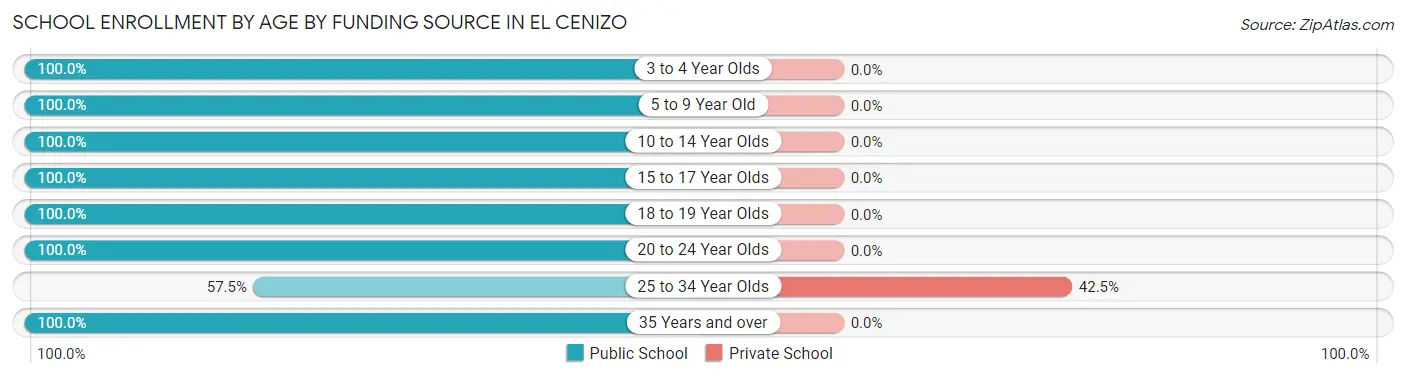
School Enrollment by Age by Funding Source in El Cenizo
Out of a total of 744 students who are enrolled in schools in El Cenizo, 17 (2.3%) attend a private institution, while the remaining 727 (97.7%) are enrolled in public schools. The age group of 25 to 34 year olds has the highest likelihood of being enrolled in private schools, with 17 (42.5% in the age bracket) enrolled. Conversely, the age group of 3 to 4 year olds has the lowest likelihood of being enrolled in a private school, with 48 (100.0% in the age bracket) attending a public institution.
| Age Bracket | Public School | Private School |
| 3 to 4 Year Olds | 48 (100.0%) | 0 (0.0%) |
| 5 to 9 Year Old | 119 (100.0%) | 0 (0.0%) |
| 10 to 14 Year Olds | 332 (100.0%) | 0 (0.0%) |
| 15 to 17 Year Olds | 107 (100.0%) | 0 (0.0%) |
| 18 to 19 Year Olds | 50 (100.0%) | 0 (0.0%) |
| 20 to 24 Year Olds | 33 (100.0%) | 0 (0.0%) |
| 25 to 34 Year Olds | 23 (57.5%) | 17 (42.5%) |
| 35 Years and over | 15 (100.0%) | 0 (0.0%) |
| Total | 727 (97.7%) | 17 (2.3%) |
Educational Attainment by Field of Study in El Cenizo
Science & technology (25 | 27.2%), bio, nature & agricultural (16 | 17.4%), liberal arts & history (16 | 17.4%), business (10 | 10.9%), and education (9 | 9.8%) are the most common fields of study among 92 individuals in El Cenizo who have obtained a bachelor's degree or higher.
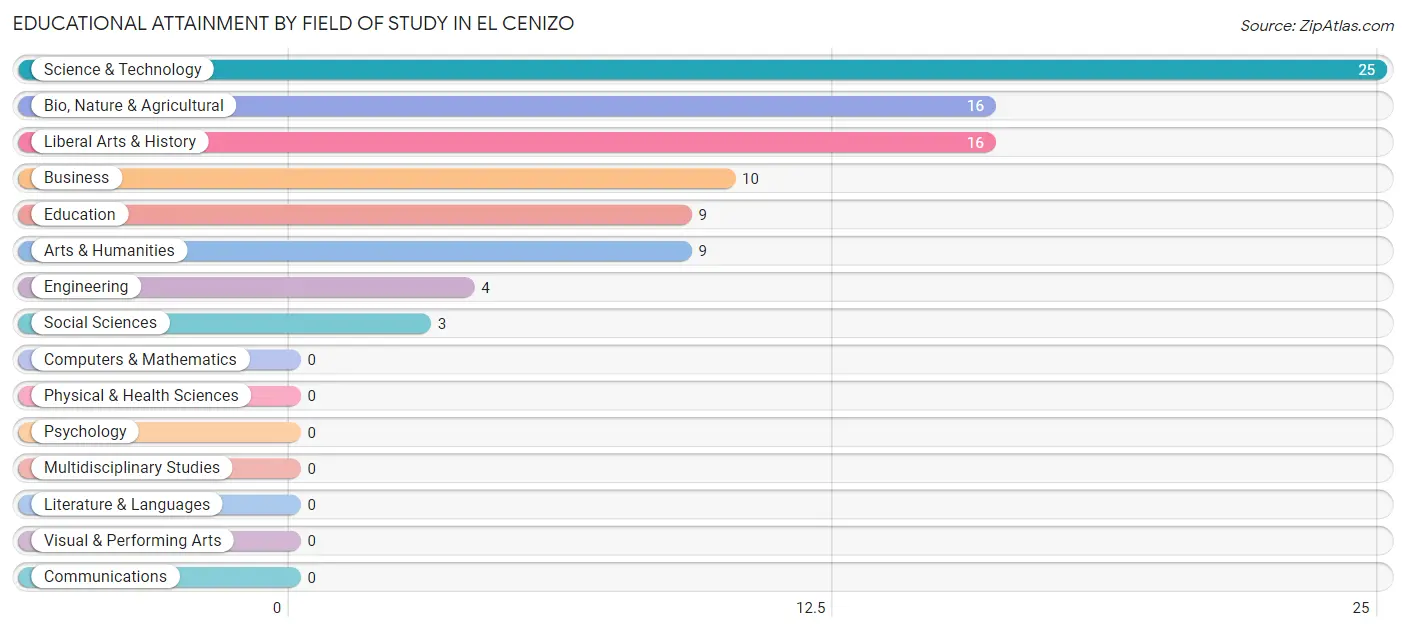
| Field of Study | # Graduates | % Graduates |
| Computers & Mathematics | 0 | 0.0% |
| Bio, Nature & Agricultural | 16 | 17.4% |
| Physical & Health Sciences | 0 | 0.0% |
| Psychology | 0 | 0.0% |
| Social Sciences | 3 | 3.3% |
| Engineering | 4 | 4.3% |
| Multidisciplinary Studies | 0 | 0.0% |
| Science & Technology | 25 | 27.2% |
| Business | 10 | 10.9% |
| Education | 9 | 9.8% |
| Literature & Languages | 0 | 0.0% |
| Liberal Arts & History | 16 | 17.4% |
| Visual & Performing Arts | 0 | 0.0% |
| Communications | 0 | 0.0% |
| Arts & Humanities | 9 | 9.8% |
| Total | 92 | 100.0% |
Transportation & Commute in El Cenizo
Vehicle Availability by Sex in El Cenizo
The most prevalent vehicle ownership categories in El Cenizo are males with 2 vehicles (157, accounting for 33.6%) and females with 2 vehicles (53, making up 55.7%).
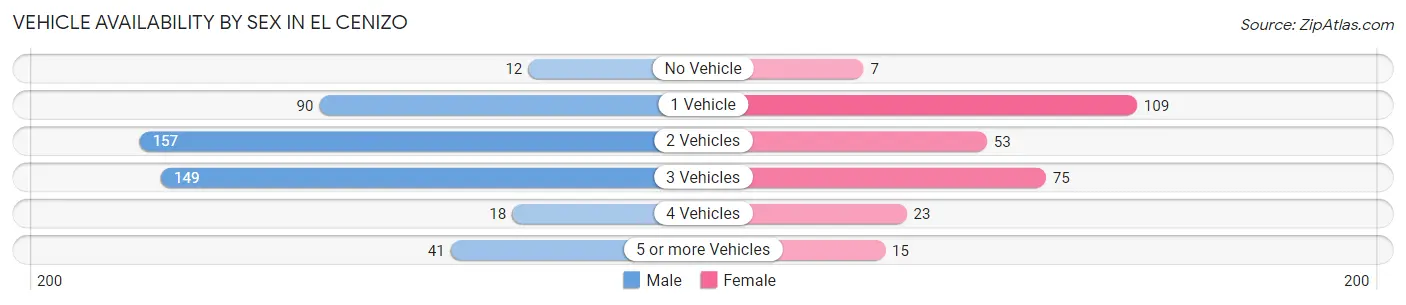
| Vehicles Available | Male | Female |
| No Vehicle | 12 (2.6%) | 7 (2.5%) |
| 1 Vehicle | 90 (19.3%) | 109 (38.7%) |
| 2 Vehicles | 157 (33.6%) | 53 (18.8%) |
| 3 Vehicles | 149 (31.9%) | 75 (26.6%) |
| 4 Vehicles | 18 (3.8%) | 23 (8.2%) |
| 5 or more Vehicles | 41 (8.8%) | 15 (5.3%) |
| Total | 467 (100.0%) | 282 (100.0%) |
Commute Time in El Cenizo
The most frequently occuring commute durations in El Cenizo are 30 to 34 minutes (247 commuters, 34.0%), 40 to 44 minutes (137 commuters, 18.8%), and 45 to 59 minutes (94 commuters, 12.9%).
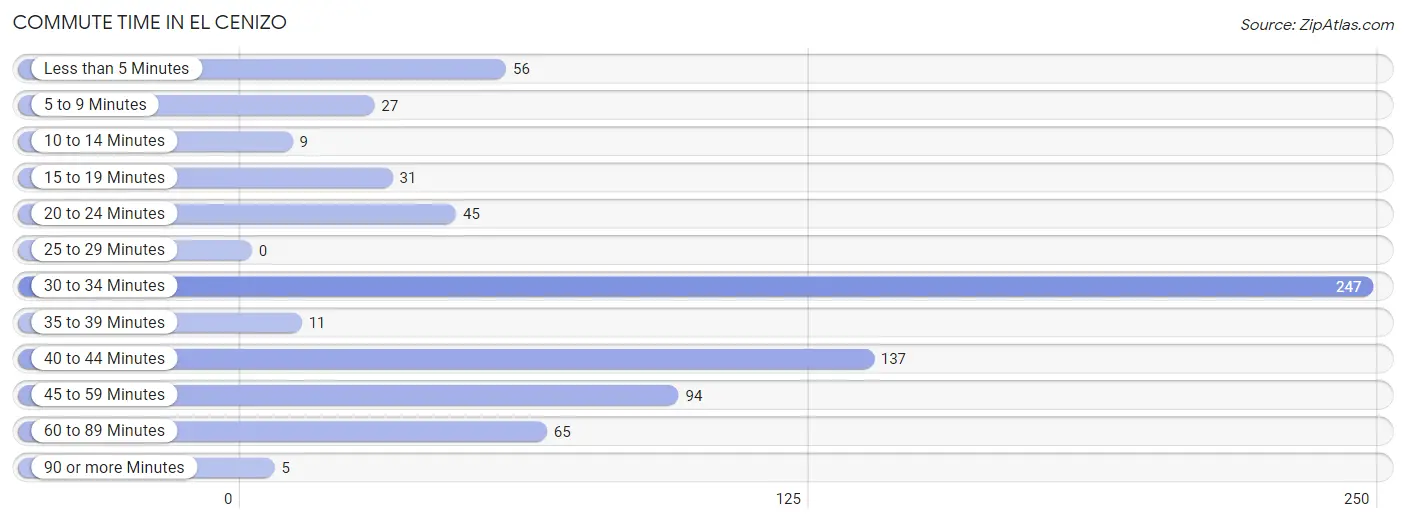
| Commute Time | # Commuters | % Commuters |
| Less than 5 Minutes | 56 | 7.7% |
| 5 to 9 Minutes | 27 | 3.7% |
| 10 to 14 Minutes | 9 | 1.2% |
| 15 to 19 Minutes | 31 | 4.3% |
| 20 to 24 Minutes | 45 | 6.2% |
| 25 to 29 Minutes | 0 | 0.0% |
| 30 to 34 Minutes | 247 | 34.0% |
| 35 to 39 Minutes | 11 | 1.5% |
| 40 to 44 Minutes | 137 | 18.8% |
| 45 to 59 Minutes | 94 | 12.9% |
| 60 to 89 Minutes | 65 | 8.9% |
| 90 or more Minutes | 5 | 0.7% |
Commute Time by Sex in El Cenizo
The most common commute times in El Cenizo are 30 to 34 minutes (194 commuters, 42.5%) for males and 40 to 44 minutes (59 commuters, 21.8%) for females.
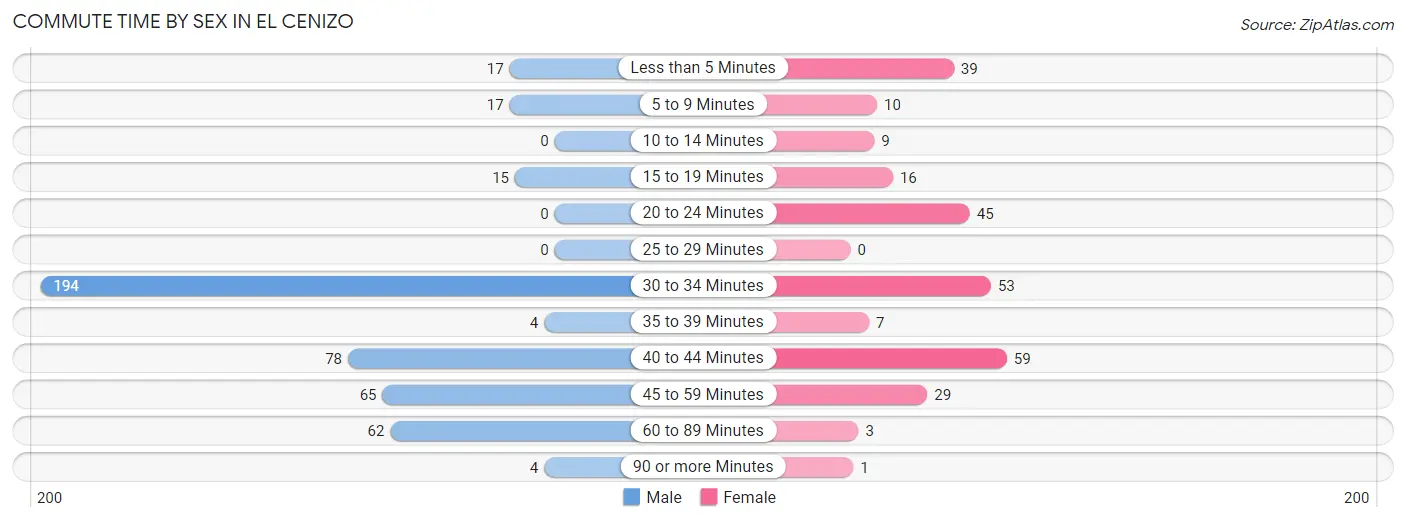
| Commute Time | Male | Female |
| Less than 5 Minutes | 17 (3.7%) | 39 (14.4%) |
| 5 to 9 Minutes | 17 (3.7%) | 10 (3.7%) |
| 10 to 14 Minutes | 0 (0.0%) | 9 (3.3%) |
| 15 to 19 Minutes | 15 (3.3%) | 16 (5.9%) |
| 20 to 24 Minutes | 0 (0.0%) | 45 (16.6%) |
| 25 to 29 Minutes | 0 (0.0%) | 0 (0.0%) |
| 30 to 34 Minutes | 194 (42.5%) | 53 (19.6%) |
| 35 to 39 Minutes | 4 (0.9%) | 7 (2.6%) |
| 40 to 44 Minutes | 78 (17.1%) | 59 (21.8%) |
| 45 to 59 Minutes | 65 (14.2%) | 29 (10.7%) |
| 60 to 89 Minutes | 62 (13.6%) | 3 (1.1%) |
| 90 or more Minutes | 4 (0.9%) | 1 (0.4%) |
Time of Departure to Work by Sex in El Cenizo
The most frequent times of departure to work in El Cenizo are 8:00 AM to 8:29 AM (90, 19.7%) for males and 12:00 PM to 3:59 PM (40, 14.8%) for females.
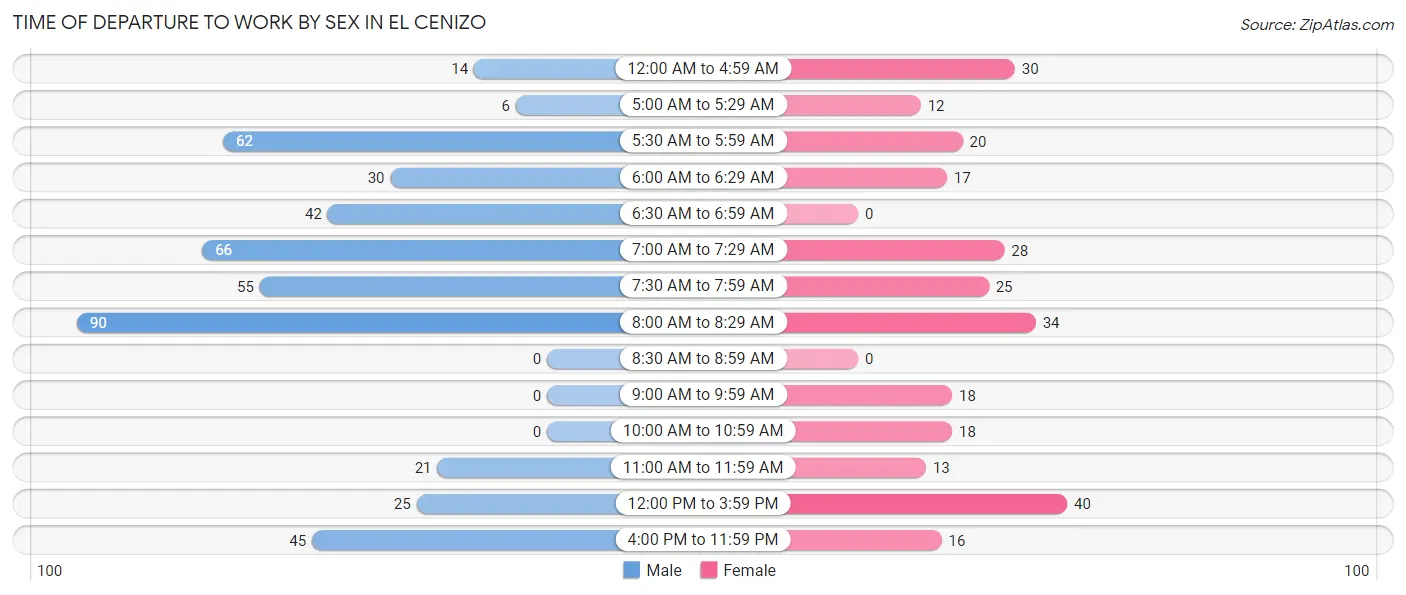
| Time of Departure | Male | Female |
| 12:00 AM to 4:59 AM | 14 (3.1%) | 30 (11.1%) |
| 5:00 AM to 5:29 AM | 6 (1.3%) | 12 (4.4%) |
| 5:30 AM to 5:59 AM | 62 (13.6%) | 20 (7.4%) |
| 6:00 AM to 6:29 AM | 30 (6.6%) | 17 (6.3%) |
| 6:30 AM to 6:59 AM | 42 (9.2%) | 0 (0.0%) |
| 7:00 AM to 7:29 AM | 66 (14.5%) | 28 (10.3%) |
| 7:30 AM to 7:59 AM | 55 (12.1%) | 25 (9.2%) |
| 8:00 AM to 8:29 AM | 90 (19.7%) | 34 (12.6%) |
| 8:30 AM to 8:59 AM | 0 (0.0%) | 0 (0.0%) |
| 9:00 AM to 9:59 AM | 0 (0.0%) | 18 (6.6%) |
| 10:00 AM to 10:59 AM | 0 (0.0%) | 18 (6.6%) |
| 11:00 AM to 11:59 AM | 21 (4.6%) | 13 (4.8%) |
| 12:00 PM to 3:59 PM | 25 (5.5%) | 40 (14.8%) |
| 4:00 PM to 11:59 PM | 45 (9.9%) | 16 (5.9%) |
| Total | 456 (100.0%) | 271 (100.0%) |
Housing Occupancy in El Cenizo
Occupancy by Ownership in El Cenizo
Of the total 610 dwellings in El Cenizo, owner-occupied units account for 457 (74.9%), while renter-occupied units make up 153 (25.1%).
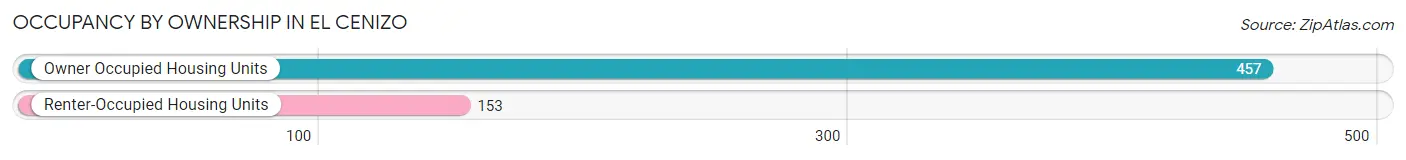
| Occupancy | # Housing Units | % Housing Units |
| Owner Occupied Housing Units | 457 | 74.9% |
| Renter-Occupied Housing Units | 153 | 25.1% |
| Total Occupied Housing Units | 610 | 100.0% |
Occupancy by Household Size in El Cenizo
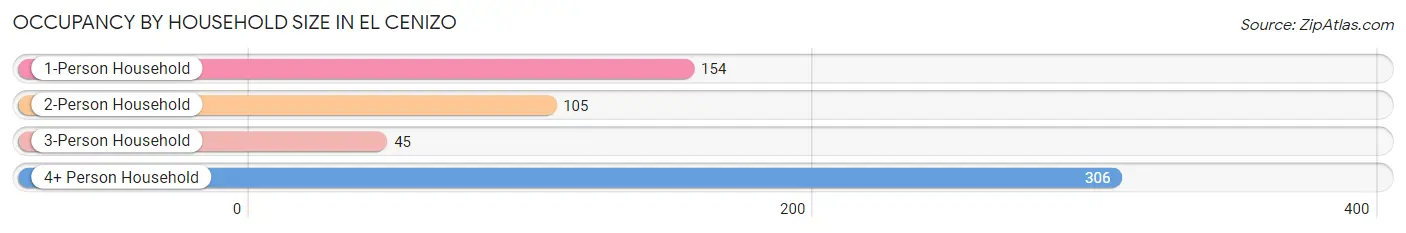
| Household Size | # Housing Units | % Housing Units |
| 1-Person Household | 154 | 25.3% |
| 2-Person Household | 105 | 17.2% |
| 3-Person Household | 45 | 7.4% |
| 4+ Person Household | 306 | 50.2% |
| Total Housing Units | 610 | 100.0% |
Occupancy by Ownership by Household Size in El Cenizo
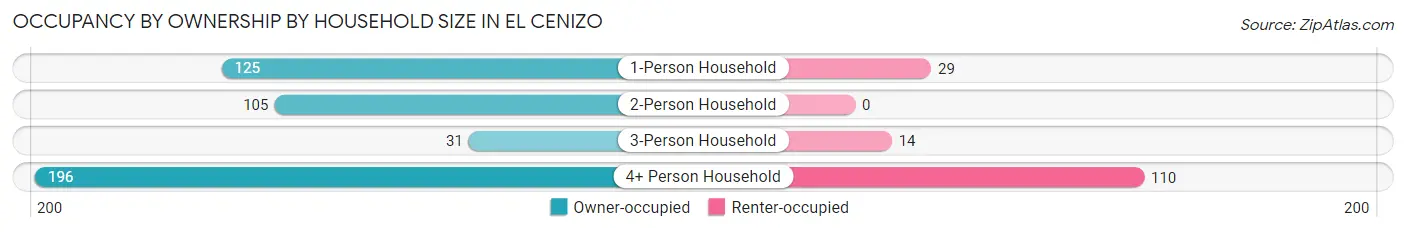
| Household Size | Owner-occupied | Renter-occupied |
| 1-Person Household | 125 (81.2%) | 29 (18.8%) |
| 2-Person Household | 105 (100.0%) | 0 (0.0%) |
| 3-Person Household | 31 (68.9%) | 14 (31.1%) |
| 4+ Person Household | 196 (64.0%) | 110 (35.9%) |
| Total Housing Units | 457 (74.9%) | 153 (25.1%) |
Occupancy by Educational Attainment in El Cenizo
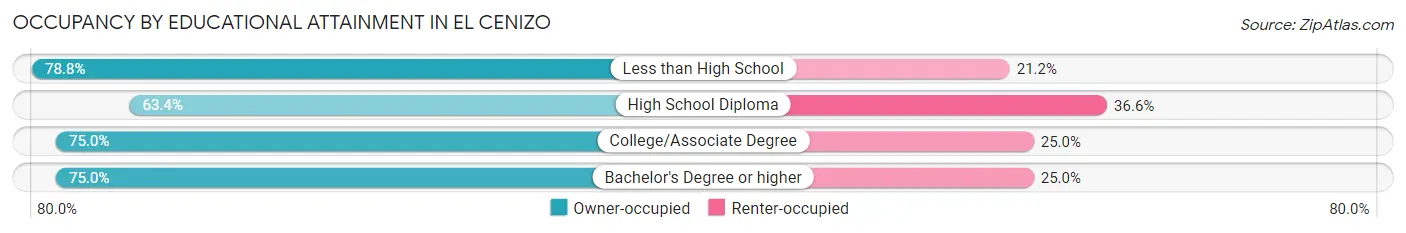
| Household Size | Owner-occupied | Renter-occupied |
| Less than High School | 305 (78.8%) | 82 (21.2%) |
| High School Diploma | 83 (63.4%) | 48 (36.6%) |
| College/Associate Degree | 42 (75.0%) | 14 (25.0%) |
| Bachelor's Degree or higher | 27 (75.0%) | 9 (25.0%) |
Occupancy by Age of Householder in El Cenizo
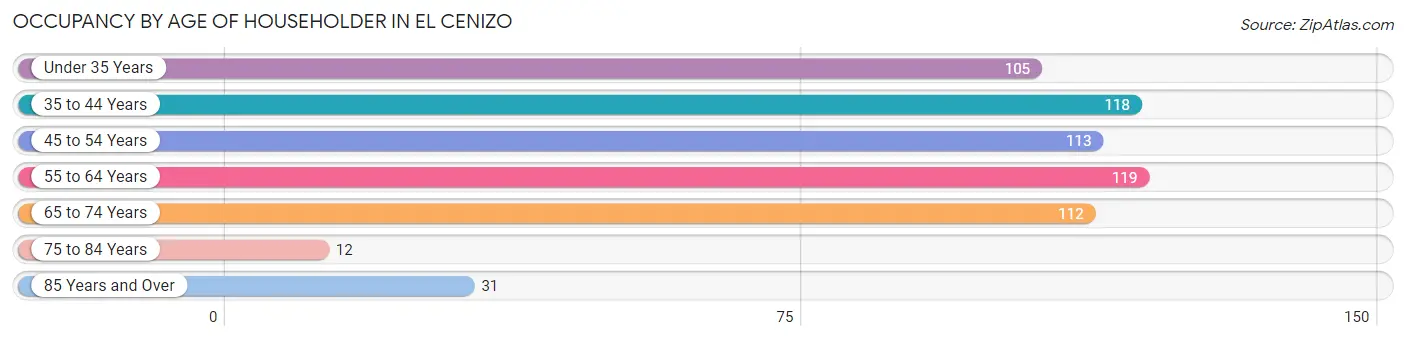
| Age Bracket | # Households | % Households |
| Under 35 Years | 105 | 17.2% |
| 35 to 44 Years | 118 | 19.3% |
| 45 to 54 Years | 113 | 18.5% |
| 55 to 64 Years | 119 | 19.5% |
| 65 to 74 Years | 112 | 18.4% |
| 75 to 84 Years | 12 | 2.0% |
| 85 Years and Over | 31 | 5.1% |
| Total | 610 | 100.0% |
Housing Finances in El Cenizo
Median Income by Occupancy in El Cenizo
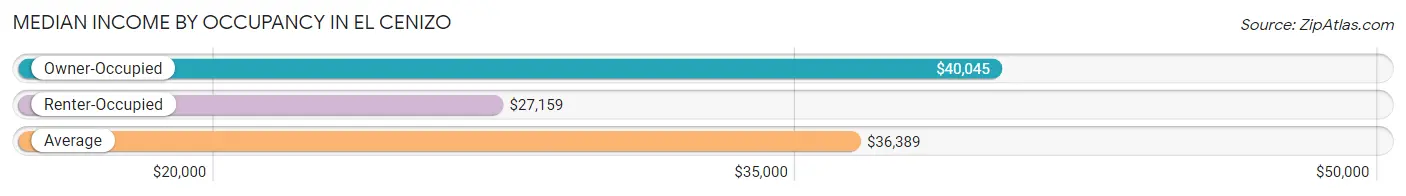
| Occupancy Type | # Households | Median Income |
| Owner-Occupied | 457 (74.9%) | $40,045 |
| Renter-Occupied | 153 (25.1%) | $27,159 |
| Average | 610 (100.0%) | $36,389 |
Occupancy by Householder Income Bracket in El Cenizo
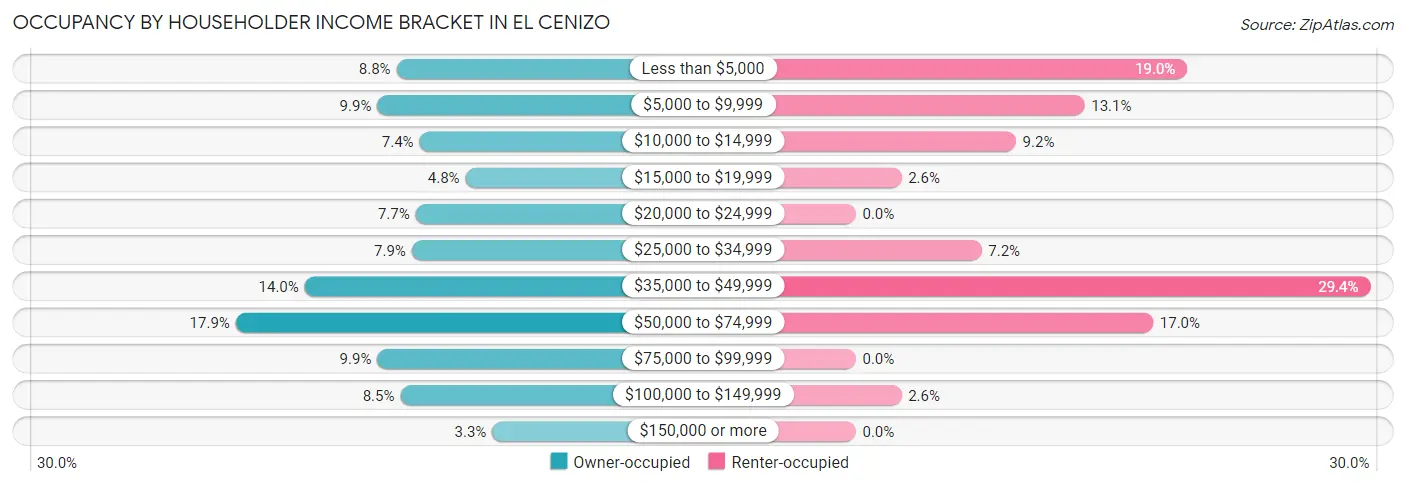
| Income Bracket | Owner-occupied | Renter-occupied |
| Less than $5,000 | 40 (8.7%) | 29 (19.0%) |
| $5,000 to $9,999 | 45 (9.9%) | 20 (13.1%) |
| $10,000 to $14,999 | 34 (7.4%) | 14 (9.1%) |
| $15,000 to $19,999 | 22 (4.8%) | 4 (2.6%) |
| $20,000 to $24,999 | 35 (7.7%) | 0 (0.0%) |
| $25,000 to $34,999 | 36 (7.9%) | 11 (7.2%) |
| $35,000 to $49,999 | 64 (14.0%) | 45 (29.4%) |
| $50,000 to $74,999 | 82 (17.9%) | 26 (17.0%) |
| $75,000 to $99,999 | 45 (9.9%) | 0 (0.0%) |
| $100,000 to $149,999 | 39 (8.5%) | 4 (2.6%) |
| $150,000 or more | 15 (3.3%) | 0 (0.0%) |
| Total | 457 (100.0%) | 153 (100.0%) |
Monthly Housing Cost Tiers in El Cenizo
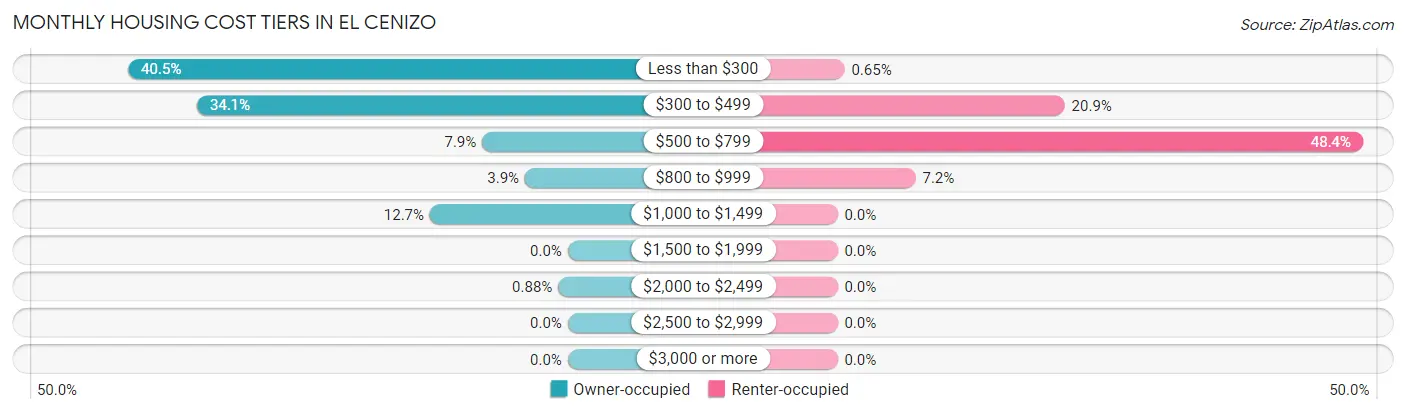
| Monthly Cost | Owner-occupied | Renter-occupied |
| Less than $300 | 185 (40.5%) | 1 (0.6%) |
| $300 to $499 | 156 (34.1%) | 32 (20.9%) |
| $500 to $799 | 36 (7.9%) | 74 (48.4%) |
| $800 to $999 | 18 (3.9%) | 11 (7.2%) |
| $1,000 to $1,499 | 58 (12.7%) | 0 (0.0%) |
| $1,500 to $1,999 | 0 (0.0%) | 0 (0.0%) |
| $2,000 to $2,499 | 4 (0.9%) | 0 (0.0%) |
| $2,500 to $2,999 | 0 (0.0%) | 0 (0.0%) |
| $3,000 or more | 0 (0.0%) | 0 (0.0%) |
| Total | 457 (100.0%) | 153 (100.0%) |
Physical Housing Characteristics in El Cenizo
Housing Structures in El Cenizo
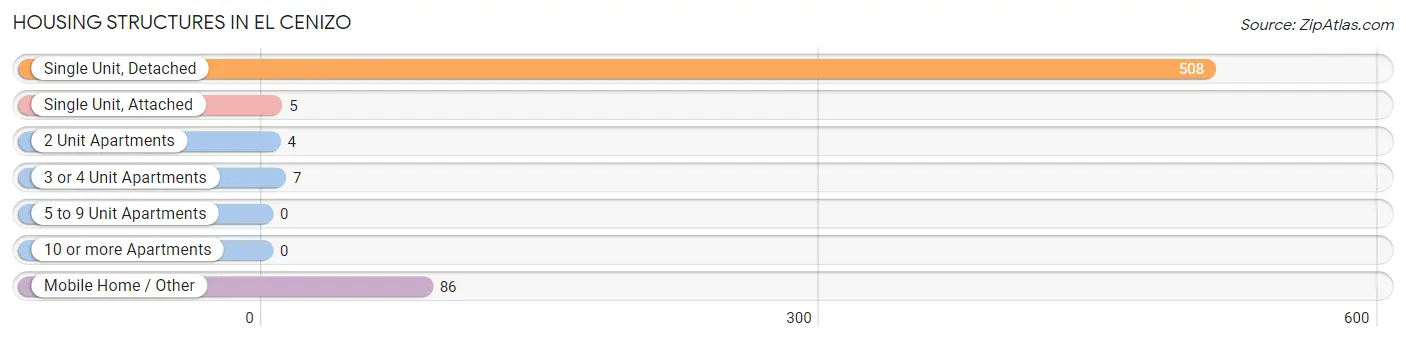
| Structure Type | # Housing Units | % Housing Units |
| Single Unit, Detached | 508 | 83.3% |
| Single Unit, Attached | 5 | 0.8% |
| 2 Unit Apartments | 4 | 0.7% |
| 3 or 4 Unit Apartments | 7 | 1.1% |
| 5 to 9 Unit Apartments | 0 | 0.0% |
| 10 or more Apartments | 0 | 0.0% |
| Mobile Home / Other | 86 | 14.1% |
| Total | 610 | 100.0% |
Housing Structures by Occupancy in El Cenizo
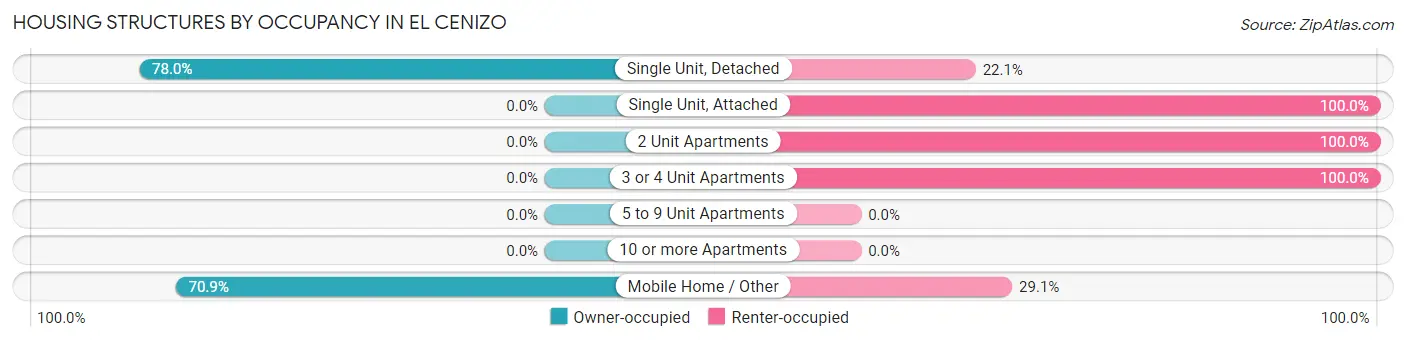
| Structure Type | Owner-occupied | Renter-occupied |
| Single Unit, Detached | 396 (77.9%) | 112 (22.1%) |
| Single Unit, Attached | 0 (0.0%) | 5 (100.0%) |
| 2 Unit Apartments | 0 (0.0%) | 4 (100.0%) |
| 3 or 4 Unit Apartments | 0 (0.0%) | 7 (100.0%) |
| 5 to 9 Unit Apartments | 0 (0.0%) | 0 (0.0%) |
| 10 or more Apartments | 0 (0.0%) | 0 (0.0%) |
| Mobile Home / Other | 61 (70.9%) | 25 (29.1%) |
| Total | 457 (74.9%) | 153 (25.1%) |
Housing Structures by Number of Rooms in El Cenizo
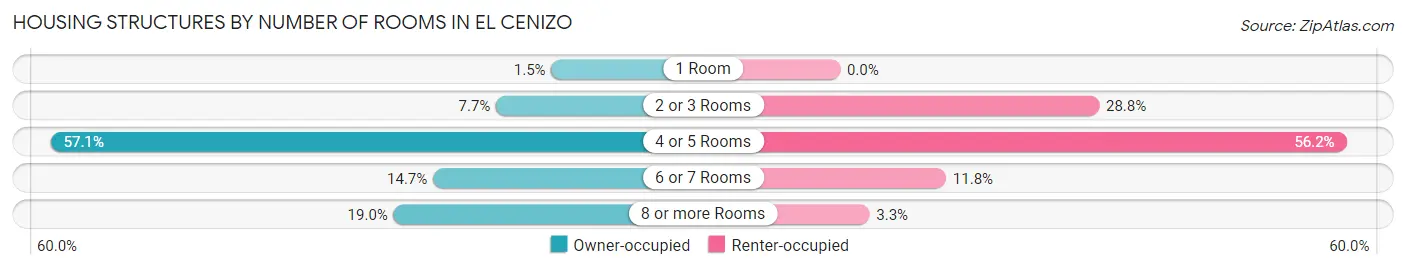
| Number of Rooms | Owner-occupied | Renter-occupied |
| 1 Room | 7 (1.5%) | 0 (0.0%) |
| 2 or 3 Rooms | 35 (7.7%) | 44 (28.8%) |
| 4 or 5 Rooms | 261 (57.1%) | 86 (56.2%) |
| 6 or 7 Rooms | 67 (14.7%) | 18 (11.8%) |
| 8 or more Rooms | 87 (19.0%) | 5 (3.3%) |
| Total | 457 (100.0%) | 153 (100.0%) |
Housing Structure by Heating Type in El Cenizo
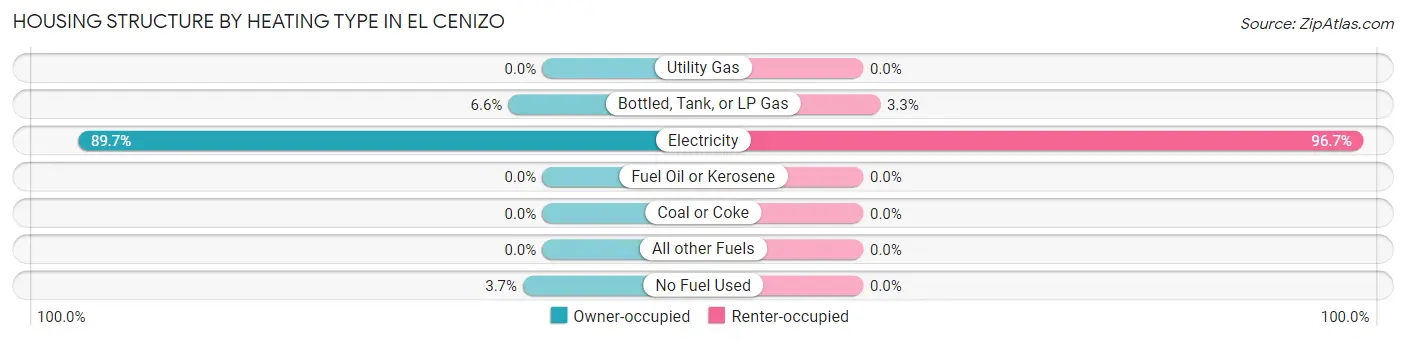
| Heating Type | Owner-occupied | Renter-occupied |
| Utility Gas | 0 (0.0%) | 0 (0.0%) |
| Bottled, Tank, or LP Gas | 30 (6.6%) | 5 (3.3%) |
| Electricity | 410 (89.7%) | 148 (96.7%) |
| Fuel Oil or Kerosene | 0 (0.0%) | 0 (0.0%) |
| Coal or Coke | 0 (0.0%) | 0 (0.0%) |
| All other Fuels | 0 (0.0%) | 0 (0.0%) |
| No Fuel Used | 17 (3.7%) | 0 (0.0%) |
| Total | 457 (100.0%) | 153 (100.0%) |
Household Vehicle Usage in El Cenizo
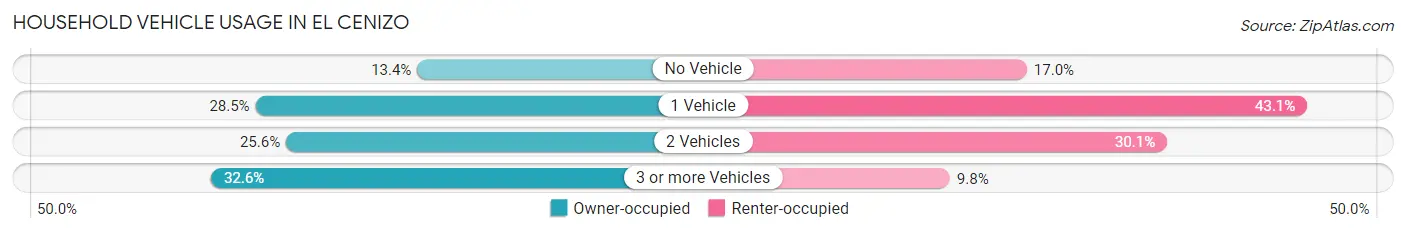
| Vehicles per Household | Owner-occupied | Renter-occupied |
| No Vehicle | 61 (13.4%) | 26 (17.0%) |
| 1 Vehicle | 130 (28.4%) | 66 (43.1%) |
| 2 Vehicles | 117 (25.6%) | 46 (30.1%) |
| 3 or more Vehicles | 149 (32.6%) | 15 (9.8%) |
| Total | 457 (100.0%) | 153 (100.0%) |
Real Estate & Mortgages in El Cenizo
Real Estate and Mortgage Overview in El Cenizo
| Characteristic | Without Mortgage | With Mortgage |
| Housing Units | 356 | 101 |
| Median Property Value | $52,400 | $67,600 |
| Median Household Income | $34,861 | $0 |
| Monthly Housing Costs | $296 | $0 |
| Real Estate Taxes | $491 | $0 |
Property Value by Mortgage Status in El Cenizo
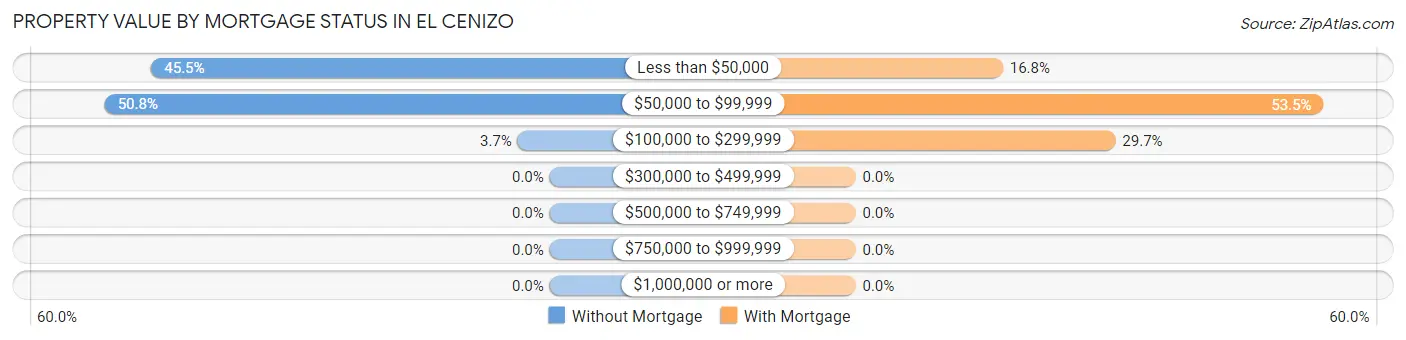
| Property Value | Without Mortgage | With Mortgage |
| Less than $50,000 | 162 (45.5%) | 17 (16.8%) |
| $50,000 to $99,999 | 181 (50.8%) | 54 (53.5%) |
| $100,000 to $299,999 | 13 (3.6%) | 30 (29.7%) |
| $300,000 to $499,999 | 0 (0.0%) | 0 (0.0%) |
| $500,000 to $749,999 | 0 (0.0%) | 0 (0.0%) |
| $750,000 to $999,999 | 0 (0.0%) | 0 (0.0%) |
| $1,000,000 or more | 0 (0.0%) | 0 (0.0%) |
| Total | 356 (100.0%) | 101 (100.0%) |
Household Income by Mortgage Status in El Cenizo
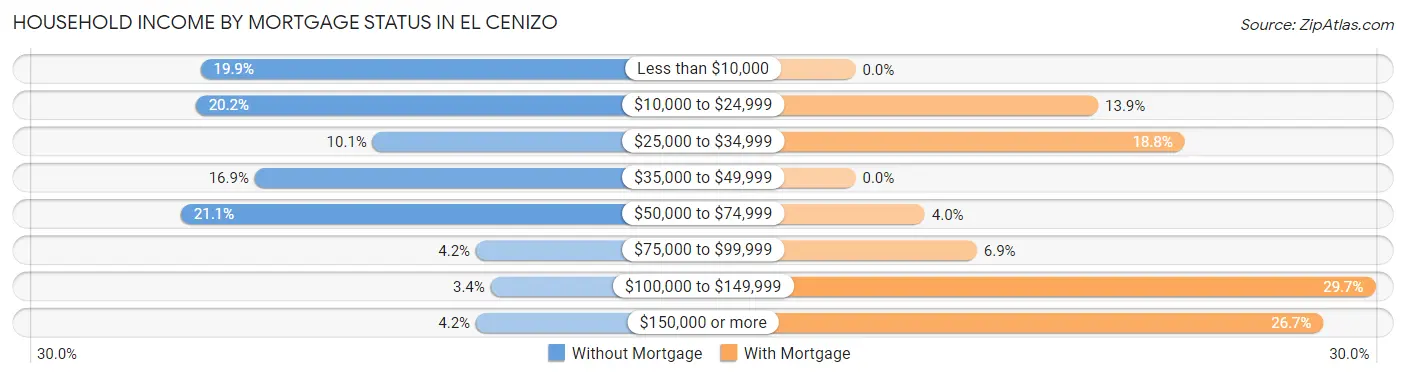
| Household Income | Without Mortgage | With Mortgage |
| Less than $10,000 | 71 (19.9%) | 0 (0.0%) |
| $10,000 to $24,999 | 72 (20.2%) | 14 (13.9%) |
| $25,000 to $34,999 | 36 (10.1%) | 19 (18.8%) |
| $35,000 to $49,999 | 60 (16.9%) | 0 (0.0%) |
| $50,000 to $74,999 | 75 (21.1%) | 4 (4.0%) |
| $75,000 to $99,999 | 15 (4.2%) | 7 (6.9%) |
| $100,000 to $149,999 | 12 (3.4%) | 30 (29.7%) |
| $150,000 or more | 15 (4.2%) | 27 (26.7%) |
| Total | 356 (100.0%) | 101 (100.0%) |
Property Value to Household Income Ratio in El Cenizo
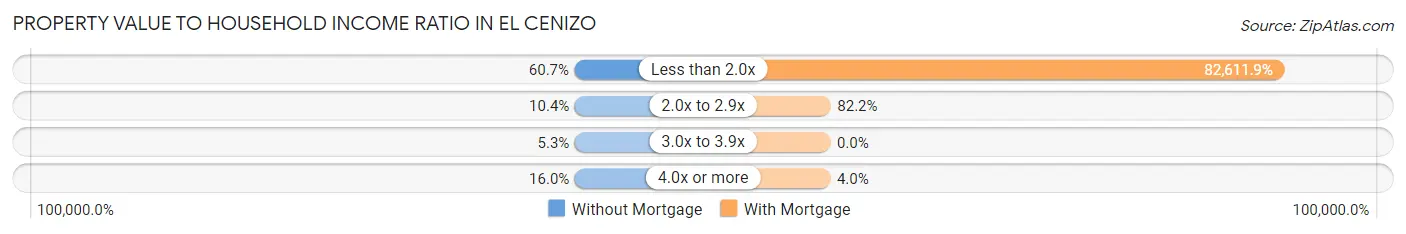
| Value-to-Income Ratio | Without Mortgage | With Mortgage |
| Less than 2.0x | 216 (60.7%) | 83,438 (82,611.9%) |
| 2.0x to 2.9x | 37 (10.4%) | 83 (82.2%) |
| 3.0x to 3.9x | 19 (5.3%) | 0 (0.0%) |
| 4.0x or more | 57 (16.0%) | 4 (4.0%) |
| Total | 356 (100.0%) | 101 (100.0%) |
Real Estate Taxes by Mortgage Status in El Cenizo
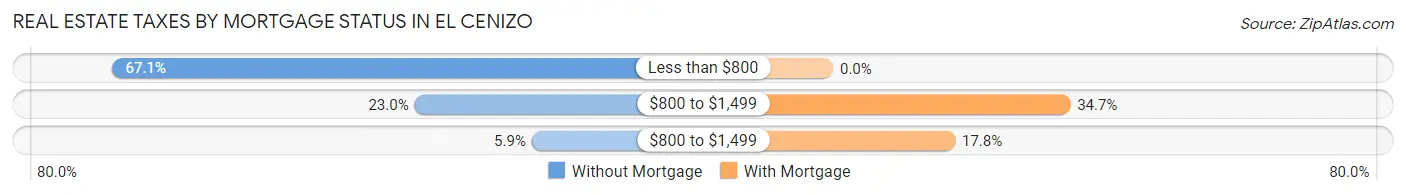
| Property Taxes | Without Mortgage | With Mortgage |
| Less than $800 | 239 (67.1%) | 0 (0.0%) |
| $800 to $1,499 | 82 (23.0%) | 35 (34.6%) |
| $800 to $1,499 | 21 (5.9%) | 18 (17.8%) |
| Total | 356 (100.0%) | 101 (100.0%) |
Health & Disability in El Cenizo
Health Insurance Coverage by Age in El Cenizo
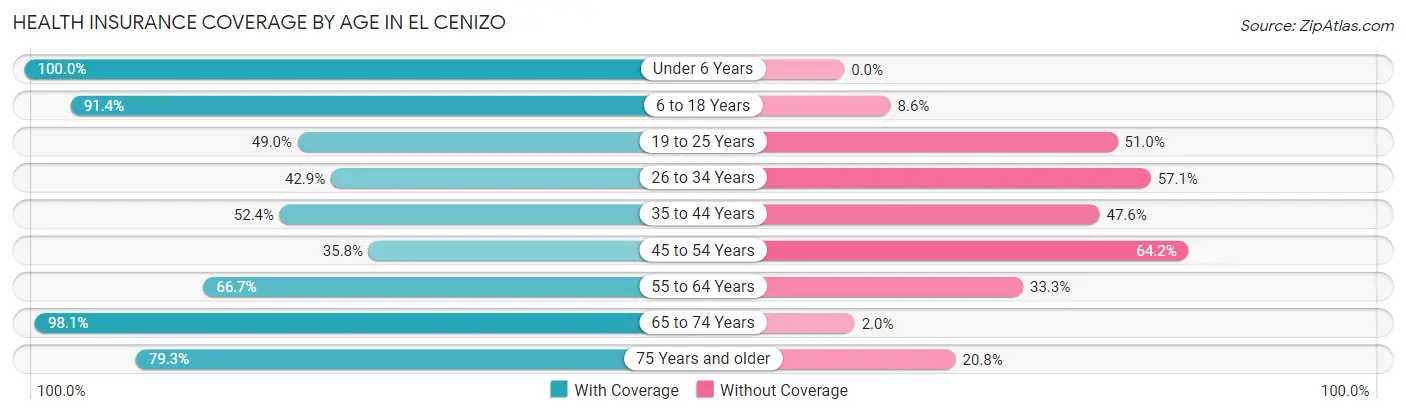
| Age Bracket | With Coverage | Without Coverage |
| Under 6 Years | 226 (100.0%) | 0 (0.0%) |
| 6 to 18 Years | 540 (91.4%) | 51 (8.6%) |
| 19 to 25 Years | 102 (49.0%) | 106 (51.0%) |
| 26 to 34 Years | 126 (42.9%) | 168 (57.1%) |
| 35 to 44 Years | 142 (52.4%) | 129 (47.6%) |
| 45 to 54 Years | 87 (35.8%) | 156 (64.2%) |
| 55 to 64 Years | 124 (66.7%) | 62 (33.3%) |
| 65 to 74 Years | 151 (98.1%) | 3 (1.9%) |
| 75 Years and older | 42 (79.2%) | 11 (20.7%) |
| Total | 1,540 (69.2%) | 686 (30.8%) |
Health Insurance Coverage by Citizenship Status in El Cenizo
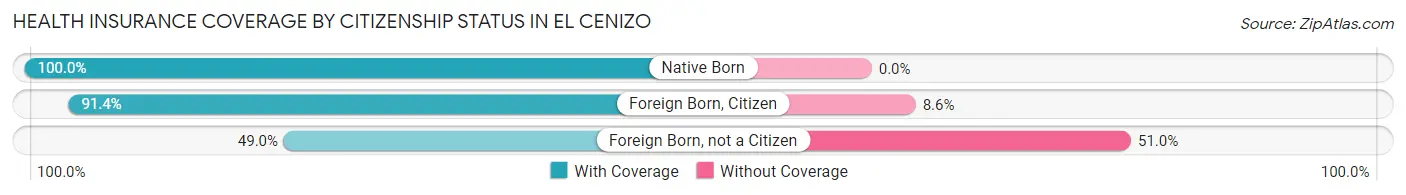
| Citizenship Status | With Coverage | Without Coverage |
| Native Born | 226 (100.0%) | 0 (0.0%) |
| Foreign Born, Citizen | 540 (91.4%) | 51 (8.6%) |
| Foreign Born, not a Citizen | 102 (49.0%) | 106 (51.0%) |
Health Insurance Coverage by Household Income in El Cenizo
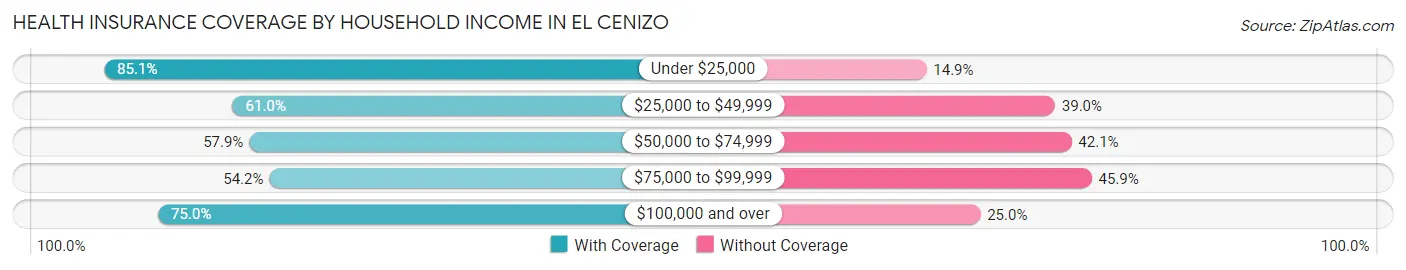
| Household Income | With Coverage | Without Coverage |
| Under $25,000 | 582 (85.1%) | 102 (14.9%) |
| $25,000 to $49,999 | 393 (61.0%) | 251 (39.0%) |
| $50,000 to $74,999 | 223 (57.9%) | 162 (42.1%) |
| $75,000 to $99,999 | 111 (54.1%) | 94 (45.9%) |
| $100,000 and over | 231 (75.0%) | 77 (25.0%) |
Public vs Private Health Insurance Coverage by Age in El Cenizo
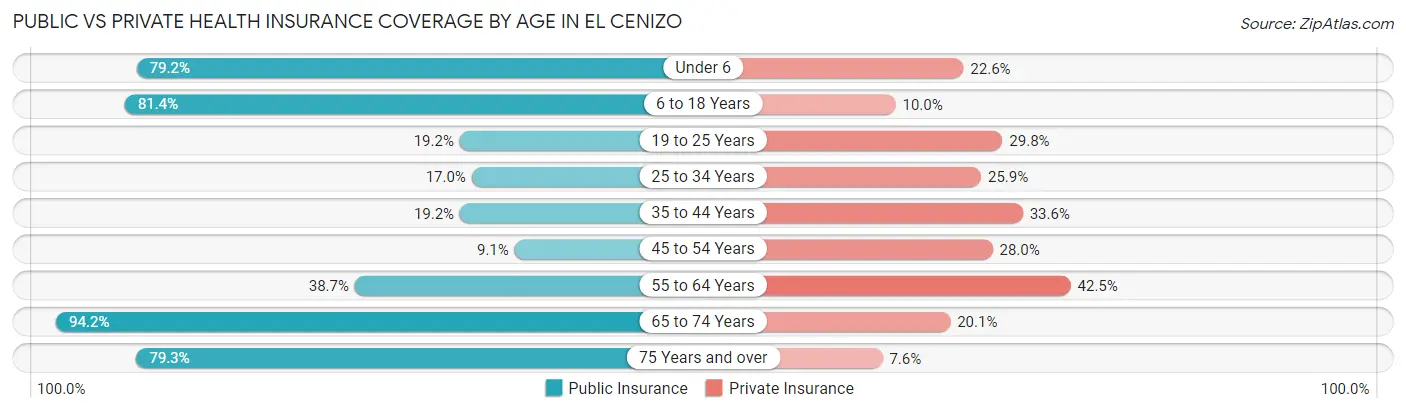
| Age Bracket | Public Insurance | Private Insurance |
| Under 6 | 179 (79.2%) | 51 (22.6%) |
| 6 to 18 Years | 481 (81.4%) | 59 (10.0%) |
| 19 to 25 Years | 40 (19.2%) | 62 (29.8%) |
| 25 to 34 Years | 50 (17.0%) | 76 (25.9%) |
| 35 to 44 Years | 52 (19.2%) | 91 (33.6%) |
| 45 to 54 Years | 22 (9.0%) | 68 (28.0%) |
| 55 to 64 Years | 72 (38.7%) | 79 (42.5%) |
| 65 to 74 Years | 145 (94.2%) | 31 (20.1%) |
| 75 Years and over | 42 (79.2%) | 4 (7.5%) |
| Total | 1,083 (48.6%) | 521 (23.4%) |
Disability Status by Sex by Age in El Cenizo
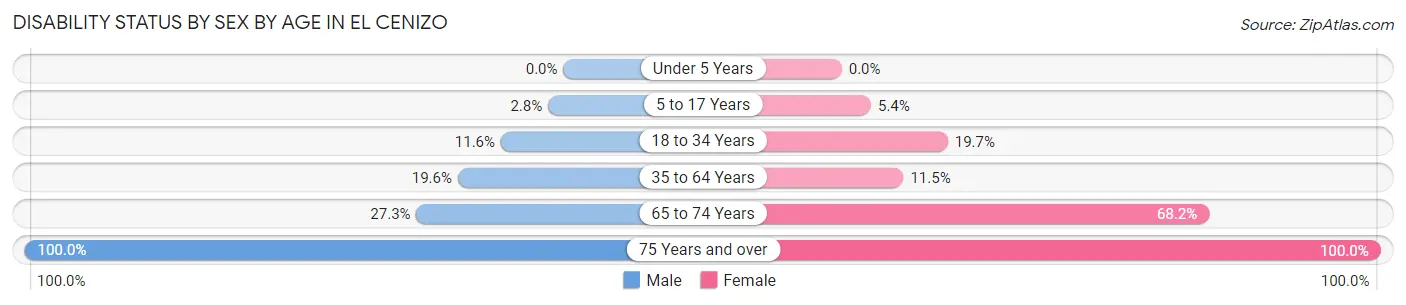
| Age Bracket | Male | Female |
| Under 5 Years | 0 (0.0%) | 0 (0.0%) |
| 5 to 17 Years | 9 (2.8%) | 14 (5.4%) |
| 18 to 34 Years | 34 (11.6%) | 49 (19.7%) |
| 35 to 64 Years | 67 (19.6%) | 41 (11.5%) |
| 65 to 74 Years | 18 (27.3%) | 60 (68.2%) |
| 75 Years and over | 26 (100.0%) | 27 (100.0%) |
Disability Class by Sex by Age in El Cenizo
Disability Class: Hearing Difficulty
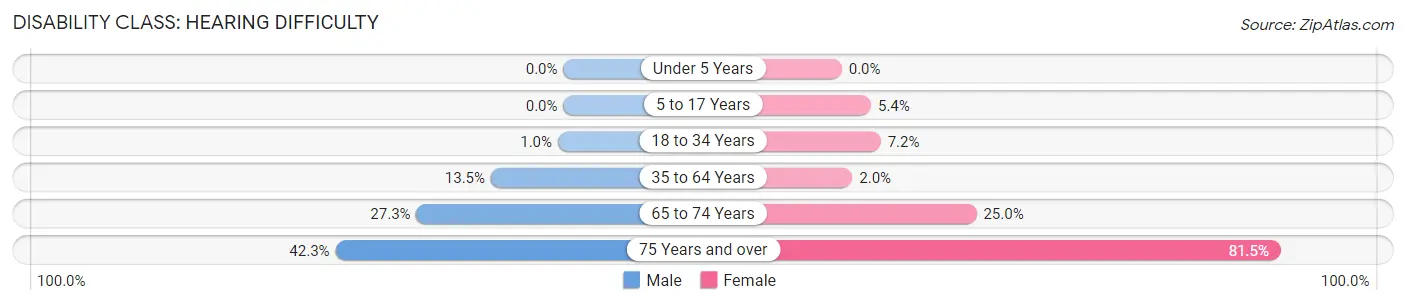
| Age Bracket | Male | Female |
| Under 5 Years | 0 (0.0%) | 0 (0.0%) |
| 5 to 17 Years | 0 (0.0%) | 14 (5.4%) |
| 18 to 34 Years | 3 (1.0%) | 18 (7.2%) |
| 35 to 64 Years | 46 (13.5%) | 7 (2.0%) |
| 65 to 74 Years | 18 (27.3%) | 22 (25.0%) |
| 75 Years and over | 11 (42.3%) | 22 (81.5%) |
Disability Class: Vision Difficulty
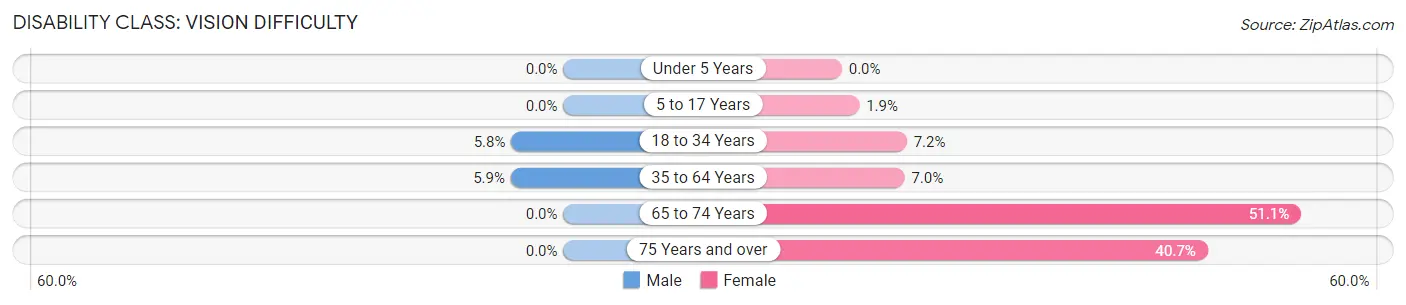
| Age Bracket | Male | Female |
| Under 5 Years | 0 (0.0%) | 0 (0.0%) |
| 5 to 17 Years | 0 (0.0%) | 5 (1.9%) |
| 18 to 34 Years | 17 (5.8%) | 18 (7.2%) |
| 35 to 64 Years | 20 (5.9%) | 25 (7.0%) |
| 65 to 74 Years | 0 (0.0%) | 45 (51.1%) |
| 75 Years and over | 0 (0.0%) | 11 (40.7%) |
Disability Class: Cognitive Difficulty
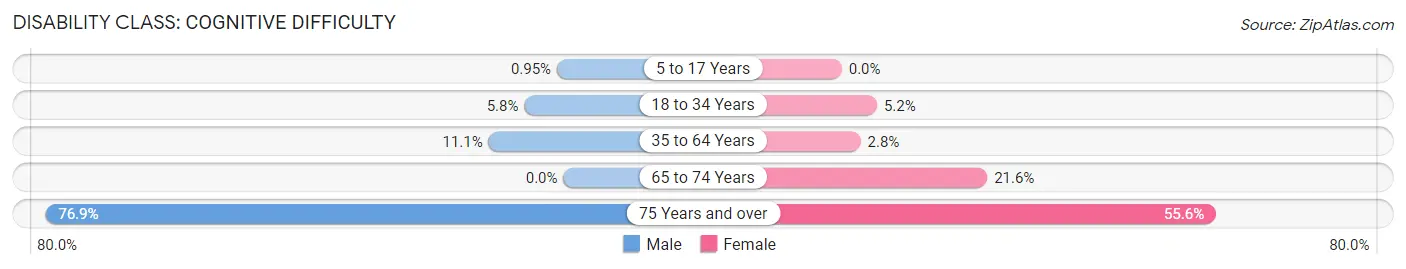
| Age Bracket | Male | Female |
| 5 to 17 Years | 3 (0.9%) | 0 (0.0%) |
| 18 to 34 Years | 17 (5.8%) | 13 (5.2%) |
| 35 to 64 Years | 38 (11.1%) | 10 (2.8%) |
| 65 to 74 Years | 0 (0.0%) | 19 (21.6%) |
| 75 Years and over | 20 (76.9%) | 15 (55.6%) |
Disability Class: Ambulatory Difficulty
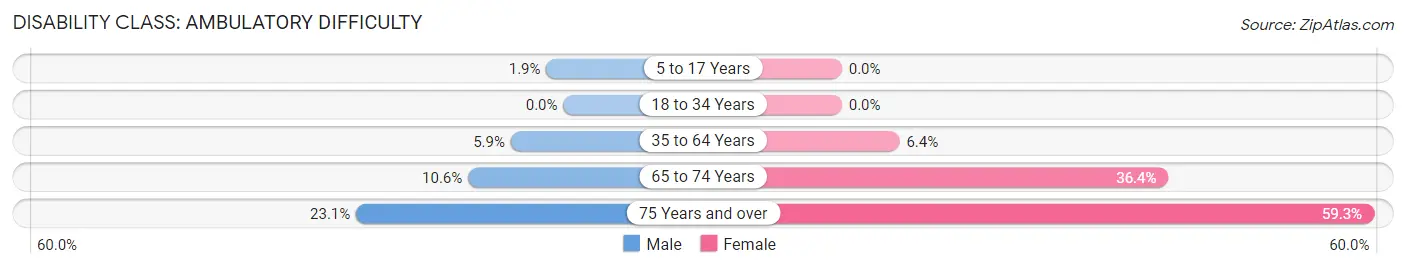
| Age Bracket | Male | Female |
| 5 to 17 Years | 6 (1.9%) | 0 (0.0%) |
| 18 to 34 Years | 0 (0.0%) | 0 (0.0%) |
| 35 to 64 Years | 20 (5.9%) | 23 (6.4%) |
| 65 to 74 Years | 7 (10.6%) | 32 (36.4%) |
| 75 Years and over | 6 (23.1%) | 16 (59.3%) |
Disability Class: Self-Care Difficulty
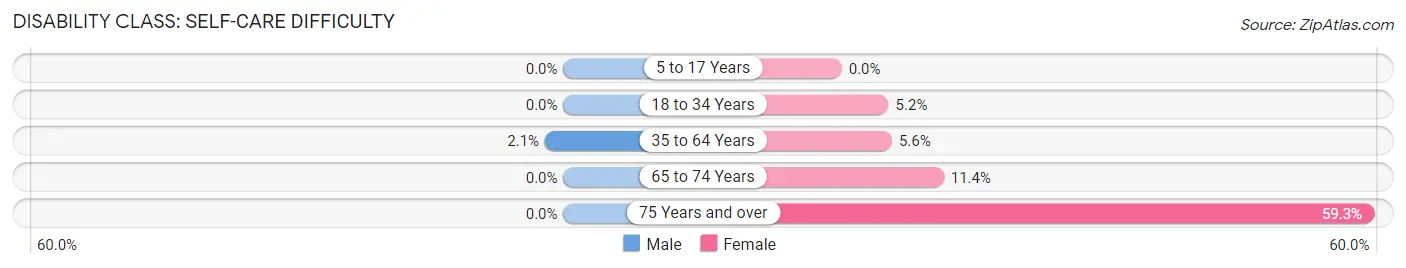
| Age Bracket | Male | Female |
| 5 to 17 Years | 0 (0.0%) | 0 (0.0%) |
| 18 to 34 Years | 0 (0.0%) | 13 (5.2%) |
| 35 to 64 Years | 7 (2.1%) | 20 (5.6%) |
| 65 to 74 Years | 0 (0.0%) | 10 (11.4%) |
| 75 Years and over | 0 (0.0%) | 16 (59.3%) |
Technology Access in El Cenizo
Computing Device Access in El Cenizo
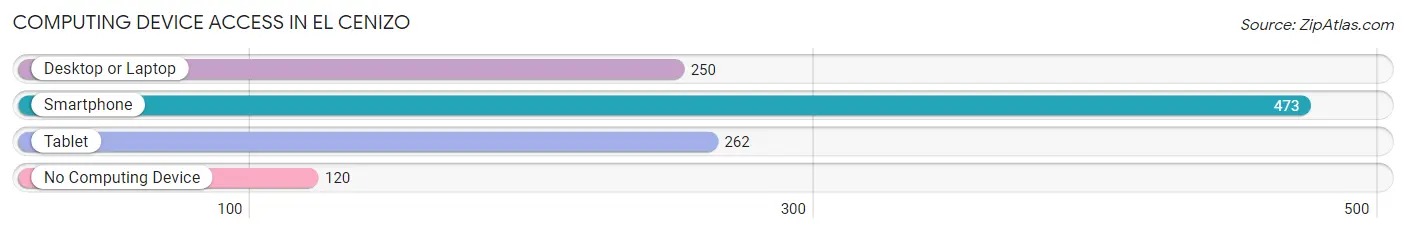
| Device Type | # Households | % Households |
| Desktop or Laptop | 250 | 41.0% |
| Smartphone | 473 | 77.5% |
| Tablet | 262 | 42.9% |
| No Computing Device | 120 | 19.7% |
| Total | 610 | 100.0% |
Internet Access in El Cenizo
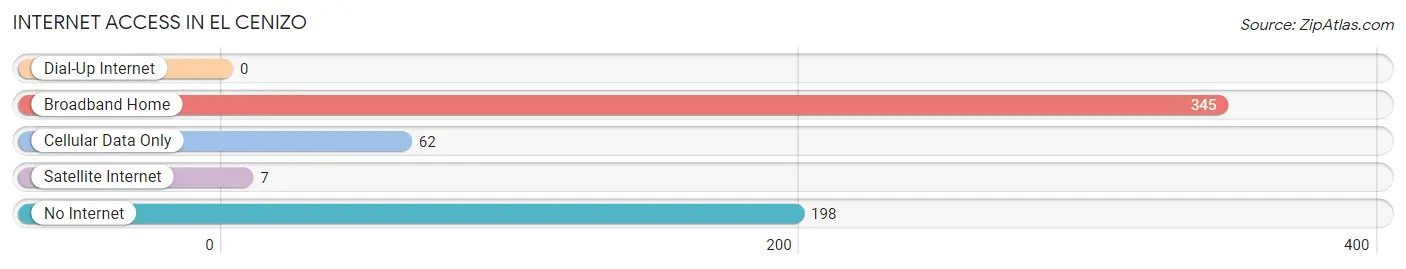
| Internet Type | # Households | % Households |
| Dial-Up Internet | 0 | 0.0% |
| Broadband Home | 345 | 56.6% |
| Cellular Data Only | 62 | 10.2% |
| Satellite Internet | 7 | 1.1% |
| No Internet | 198 | 32.5% |
| Total | 610 | 100.0% |
El Cenizo Summary
El Cenizo, Texas is a small town located in Webb County, Texas, United States. It is situated on the Rio Grande, just south of Laredo, Texas. The town was founded in the late 19th century by Mexican immigrants who were looking for a place to settle and start a new life.
Geography
El Cenizo is located in the Rio Grande Valley, which is a region of south Texas that is bordered by the Rio Grande River to the south and the Gulf of Mexico to the east. The town is situated on the banks of the Rio Grande, just south of Laredo, Texas. The town is located in a semi-arid climate, with hot summers and mild winters. The average annual temperature is around 70 degrees Fahrenheit. The average annual precipitation is around 20 inches.
Economy
El Cenizo’s economy is largely based on agriculture and tourism. The town is home to several farms and ranches, which produce a variety of crops, including cotton, corn, sorghum, and wheat. The town is also home to several tourist attractions, such as the El Cenizo Nature Center, which offers guided tours of the area’s wildlife and natural beauty.
Demographics
As of the 2010 census, El Cenizo had a population of 1,976. The population is predominantly Hispanic, with 97.3% of the population identifying as such. The median household income is $25,972, and the median age is 28. The town is also home to a large number of immigrants, with over half of the population being foreign-born.
History
El Cenizo was founded in the late 19th century by Mexican immigrants who were looking for a place to settle and start a new life. The town was originally called “El Cenizo de los Rios”, which translates to “The Cenizo of the Rivers”. The town was officially incorporated in the early 20th century, and has since grown to become a thriving community.
In the late 1990s, El Cenizo became the first city in Texas to declare itself a “sanctuary city” for undocumented immigrants. This declaration was met with both praise and criticism from the local and national community. In recent years, the town has become a popular destination for immigrants from all over the world, and has become a symbol of hope and acceptance for many.
Conclusion
El Cenizo, Texas is a small town located in Webb County, Texas, United States. It is situated on the Rio Grande, just south of Laredo, Texas. The town was founded in the late 19th century by Mexican immigrants who were looking for a place to settle and start a new life. El Cenizo’s economy is largely based on agriculture and tourism, and the town is home to a predominantly Hispanic population. In recent years, the town has become a popular destination for immigrants from all over the world, and has become a symbol of hope and acceptance for many.
Common Questions
What is Per Capita Income in El Cenizo?
Per Capita income in El Cenizo is $13,558.
What is the Median Family Income in El Cenizo?
Median Family Income in El Cenizo is $42,143.
What is the Median Household income in El Cenizo?
Median Household Income in El Cenizo is $36,389.
What is Income or Wage Gap in El Cenizo?
Income or Wage Gap in El Cenizo is 36.4%.
Women in El Cenizo earn 63.6 cents for every dollar earned by a man.
What is Inequality or Gini Index in El Cenizo?
Inequality or Gini Index in El Cenizo is 0.51.
What is the Total Population of El Cenizo?
Total Population of El Cenizo is 2,226.
What is the Total Male Population of El Cenizo?
Total Male Population of El Cenizo is 1,207.
What is the Total Female Population of El Cenizo?
Total Female Population of El Cenizo is 1,019.
What is the Ratio of Males per 100 Females in El Cenizo?
There are 118.45 Males per 100 Females in El Cenizo.
What is the Ratio of Females per 100 Males in El Cenizo?
There are 84.42 Females per 100 Males in El Cenizo.
What is the Median Population Age in El Cenizo?
Median Population Age in El Cenizo is 28.7 Years.
What is the Average Family Size in El Cenizo
Average Family Size in El Cenizo is 4.5 People.
What is the Average Household Size in El Cenizo
Average Household Size in El Cenizo is 3.6 People.
How Large is the Labor Force in El Cenizo?
There are 799 People in the Labor Forcein in El Cenizo.
What is the Percentage of People in the Labor Force in El Cenizo?
52.4% of People are in the Labor Force in El Cenizo.
What is the Unemployment Rate in El Cenizo?
Unemployment Rate in El Cenizo is 6.3%.