Daingerfield, TX Map & Demographics
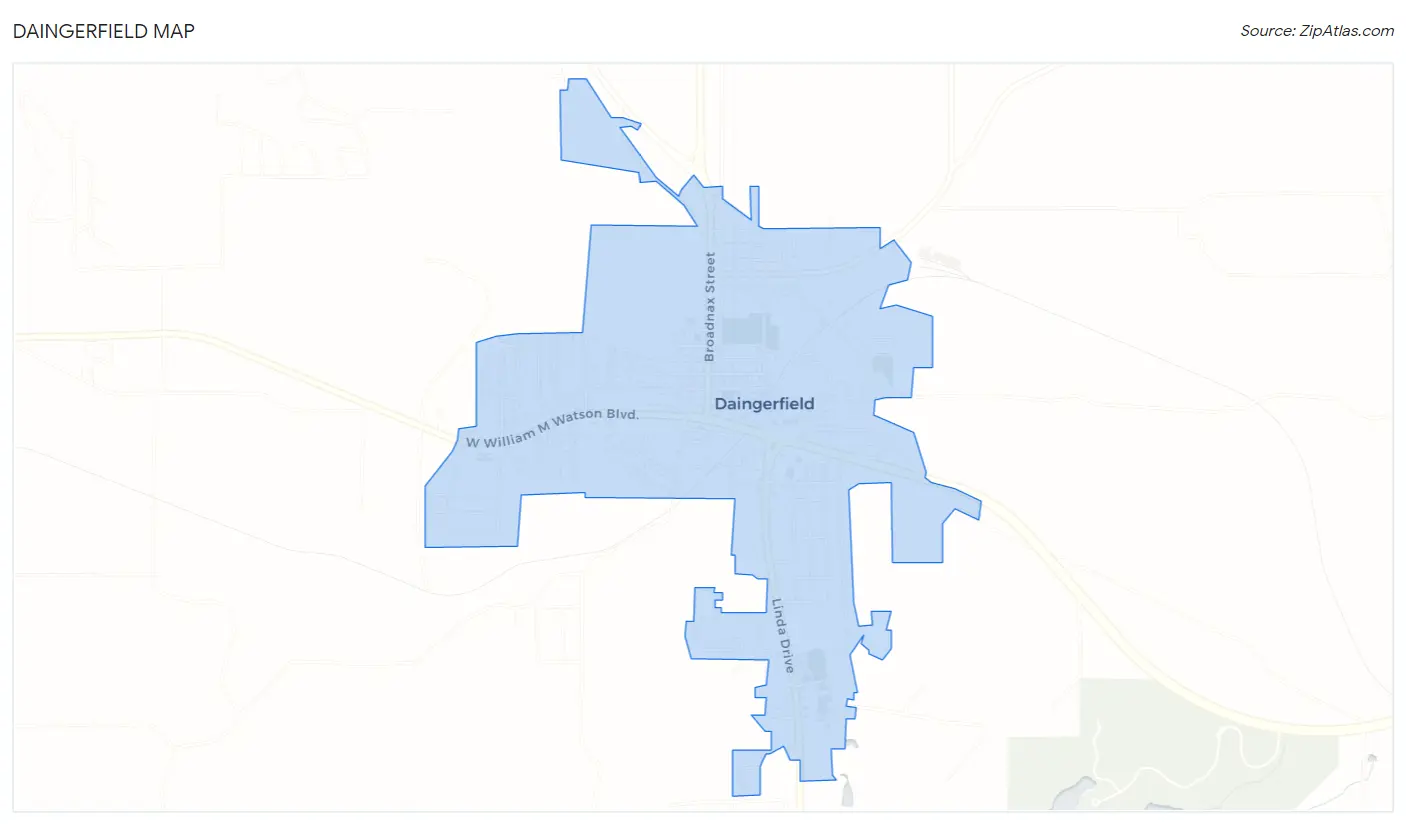
Daingerfield Map
Daingerfield Overview
$21,374
PER CAPITA INCOME
$52,500
AVG FAMILY INCOME
$40,573
AVG HOUSEHOLD INCOME
4.9%
WAGE / INCOME GAP [ % ]
95.1¢/ $1
WAGE / INCOME GAP [ $ ]
0.41
INEQUALITY / GINI INDEX
2,502
TOTAL POPULATION
1,090
MALE POPULATION
1,412
FEMALE POPULATION
77.20
MALES / 100 FEMALES
129.54
FEMALES / 100 MALES
38.3
MEDIAN AGE
3.4
AVG FAMILY SIZE
2.5
AVG HOUSEHOLD SIZE
1,021
LABOR FORCE [ PEOPLE ]
52.1%
PERCENT IN LABOR FORCE
8.9%
UNEMPLOYMENT RATE
Daingerfield Zip Codes
Daingerfield Area Codes
Income in Daingerfield
Income Overview in Daingerfield
Per Capita Income in Daingerfield is $21,374, while median incomes of families and households are $52,500 and $40,573 respectively.
| Characteristic | Number | Measure |
| Per Capita Income | 2,502 | $21,374 |
| Median Family Income | 576 | $52,500 |
| Mean Family Income | 576 | $65,018 |
| Median Household Income | 966 | $40,573 |
| Mean Household Income | 966 | $52,196 |
| Income Deficit | 576 | $0 |
| Wage / Income Gap (%) | 2,502 | 4.90% |
| Wage / Income Gap ($) | 2,502 | 95.10¢ per $1 |
| Gini / Inequality Index | 2,502 | 0.41 |
Earnings by Sex in Daingerfield
Average Earnings in Daingerfield are $29,290, $30,521 for men and $29,026 for women, a difference of 4.9%.
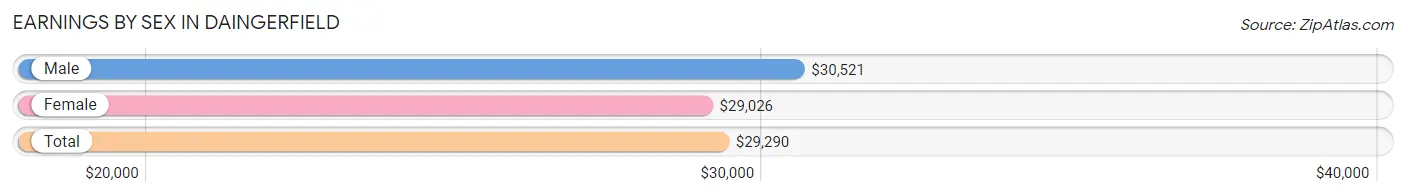
| Sex | Number | Average Earnings |
| Male | 398 (40.2%) | $30,521 |
| Female | 592 (59.8%) | $29,026 |
| Total | 990 (100.0%) | $29,290 |
Earnings by Sex by Income Bracket in Daingerfield
The most common earnings brackets in Daingerfield are $25,000 to $29,999 for men (75 | 18.8%) and $25,000 to $29,999 for women (91 | 15.4%).
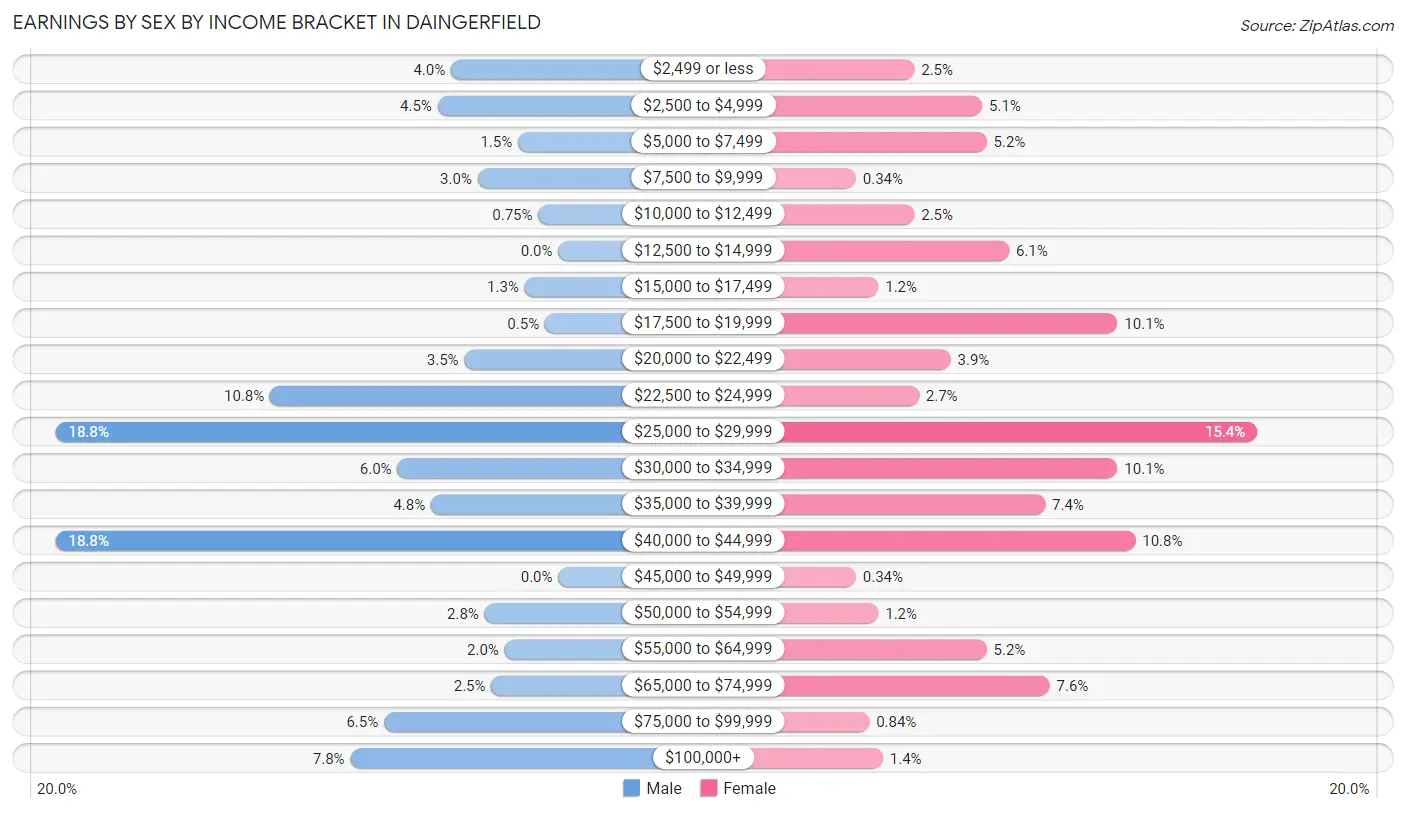
| Income | Male | Female |
| $2,499 or less | 16 (4.0%) | 15 (2.5%) |
| $2,500 to $4,999 | 18 (4.5%) | 30 (5.1%) |
| $5,000 to $7,499 | 6 (1.5%) | 31 (5.2%) |
| $7,500 to $9,999 | 12 (3.0%) | 2 (0.3%) |
| $10,000 to $12,499 | 3 (0.7%) | 15 (2.5%) |
| $12,500 to $14,999 | 0 (0.0%) | 36 (6.1%) |
| $15,000 to $17,499 | 5 (1.3%) | 7 (1.2%) |
| $17,500 to $19,999 | 2 (0.5%) | 60 (10.1%) |
| $20,000 to $22,499 | 14 (3.5%) | 23 (3.9%) |
| $22,500 to $24,999 | 43 (10.8%) | 16 (2.7%) |
| $25,000 to $29,999 | 75 (18.8%) | 91 (15.4%) |
| $30,000 to $34,999 | 24 (6.0%) | 60 (10.1%) |
| $35,000 to $39,999 | 19 (4.8%) | 44 (7.4%) |
| $40,000 to $44,999 | 75 (18.8%) | 64 (10.8%) |
| $45,000 to $49,999 | 0 (0.0%) | 2 (0.3%) |
| $50,000 to $54,999 | 11 (2.8%) | 7 (1.2%) |
| $55,000 to $64,999 | 8 (2.0%) | 31 (5.2%) |
| $65,000 to $74,999 | 10 (2.5%) | 45 (7.6%) |
| $75,000 to $99,999 | 26 (6.5%) | 5 (0.8%) |
| $100,000+ | 31 (7.8%) | 8 (1.3%) |
| Total | 398 (100.0%) | 592 (100.0%) |
Earnings by Sex by Educational Attainment in Daingerfield
Average earnings in Daingerfield are $32,135 for men and $32,833 for women, a difference of 2.1%. Men with an educational attainment of less than high school enjoy the highest average annual earnings of $44,213, while those with high school diploma education earn the least with $26,230. Women with an educational attainment of bachelor's degree earn the most with the average annual earnings of $40,833, while those with high school diploma education have the smallest earnings of $28,229.
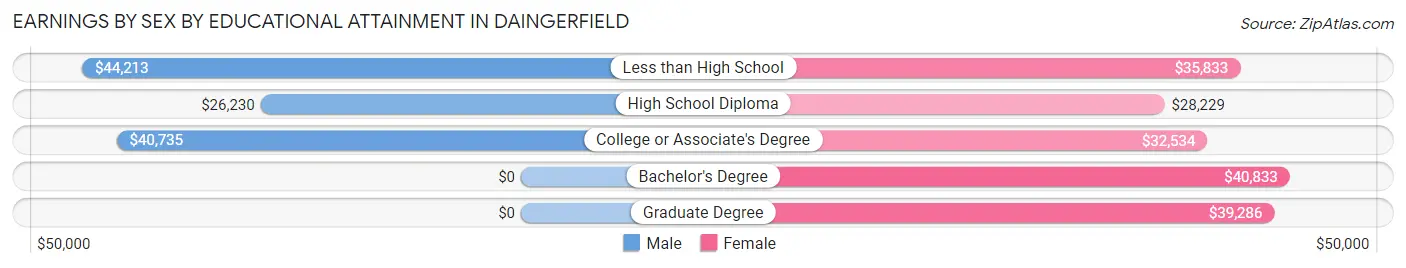
| Educational Attainment | Male Income | Female Income |
| Less than High School | $44,213 | $35,833 |
| High School Diploma | $26,230 | $28,229 |
| College or Associate's Degree | $40,735 | $32,534 |
| Bachelor's Degree | - | - |
| Graduate Degree | - | - |
| Total | $32,135 | $32,833 |
Family Income in Daingerfield
Family Income Brackets in Daingerfield
According to the Daingerfield family income data, there are 112 families falling into the $100,000 to $149,999 income range, which is the most common income bracket and makes up 19.4% of all families. Conversely, the $150,000 to $199,999 income bracket is the least frequent group with only 2 families (0.4%) belonging to this category.
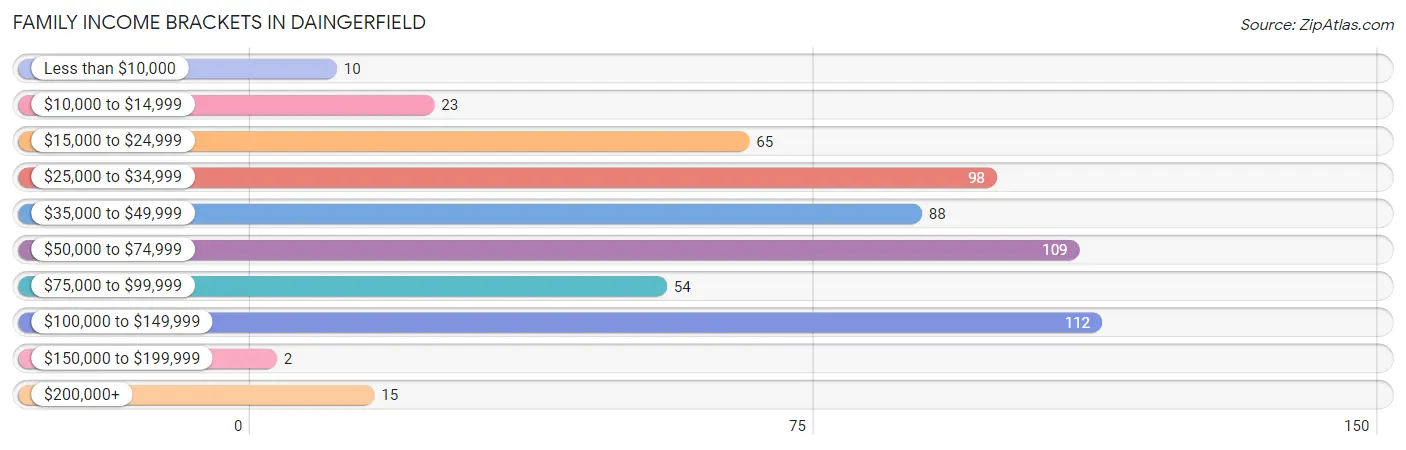
| Income Bracket | # Families | % Families |
| Less than $10,000 | 10 | 1.7% |
| $10,000 to $14,999 | 23 | 4.0% |
| $15,000 to $24,999 | 65 | 11.3% |
| $25,000 to $34,999 | 98 | 17.0% |
| $35,000 to $49,999 | 88 | 15.3% |
| $50,000 to $74,999 | 109 | 18.9% |
| $75,000 to $99,999 | 54 | 9.4% |
| $100,000 to $149,999 | 112 | 19.4% |
| $150,000 to $199,999 | 2 | 0.3% |
| $200,000+ | 15 | 2.6% |
Family Income by Famaliy Size in Daingerfield
4-person families (64 | 11.1%) account for the highest median family income in Daingerfield with $83,000 per family, while 2-person families (315 | 54.7%) have the highest median income of $26,562 per family member.
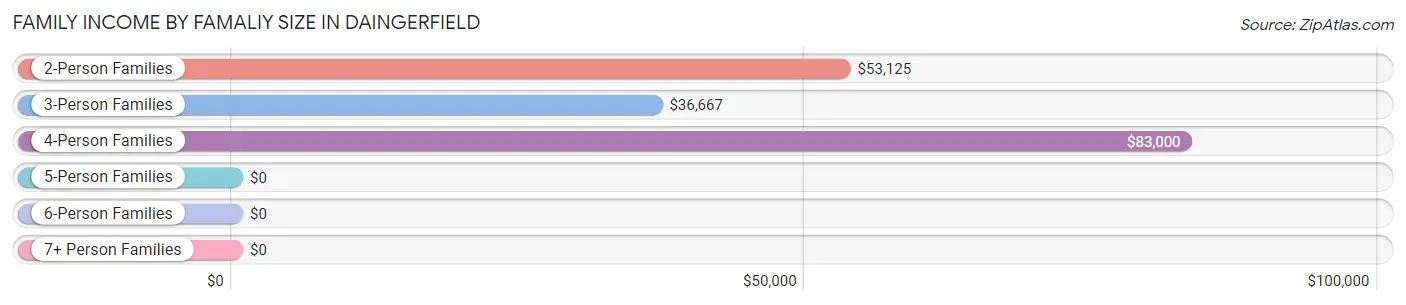
| Income Bracket | # Families | Median Income |
| 2-Person Families | 315 (54.7%) | $53,125 |
| 3-Person Families | 48 (8.3%) | $36,667 |
| 4-Person Families | 64 (11.1%) | $83,000 |
| 5-Person Families | 100 (17.4%) | $0 |
| 6-Person Families | 49 (8.5%) | $0 |
| 7+ Person Families | 0 (0.0%) | $0 |
| Total | 576 (100.0%) | $52,500 |
Family Income by Number of Earners in Daingerfield
The median family income in Daingerfield is $52,500, with families comprising 3+ earners (68) having the highest median family income of $118,333, while families with 1 earner (335) have the lowest median family income of $40,352, accounting for 11.8% and 58.2% of families, respectively.
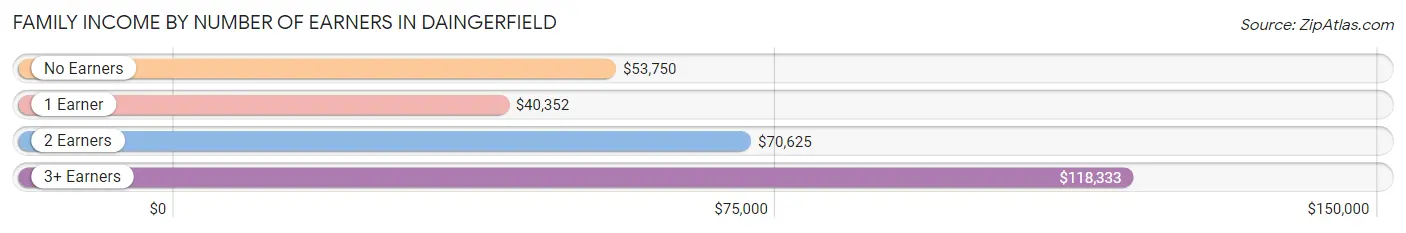
| Number of Earners | # Families | Median Income |
| No Earners | 96 (16.7%) | $53,750 |
| 1 Earner | 335 (58.2%) | $40,352 |
| 2 Earners | 77 (13.4%) | $70,625 |
| 3+ Earners | 68 (11.8%) | $118,333 |
| Total | 576 (100.0%) | $52,500 |
Household Income in Daingerfield
Household Income Brackets in Daingerfield
With 169 households falling in the category, the $25,000 to $34,999 income range is the most frequent in Daingerfield, accounting for 17.5% of all households. In contrast, only 11 households (1.1%) fall into the $150,000 to $199,999 income bracket, making it the least populous group.
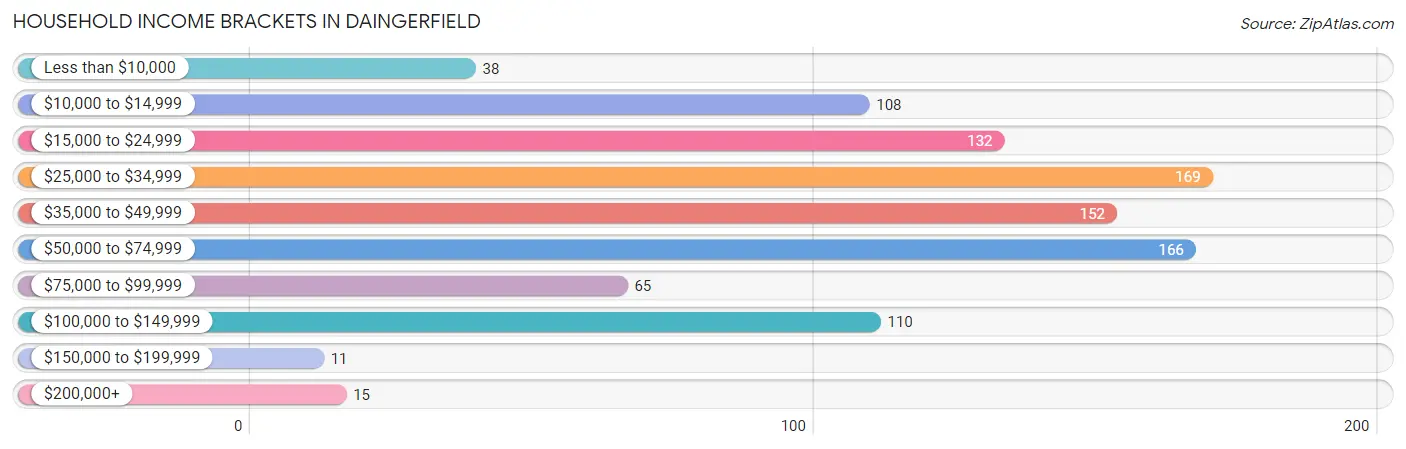
| Income Bracket | # Households | % Households |
| Less than $10,000 | 38 | 3.9% |
| $10,000 to $14,999 | 108 | 11.2% |
| $15,000 to $24,999 | 132 | 13.7% |
| $25,000 to $34,999 | 169 | 17.5% |
| $35,000 to $49,999 | 152 | 15.7% |
| $50,000 to $74,999 | 166 | 17.2% |
| $75,000 to $99,999 | 65 | 6.7% |
| $100,000 to $149,999 | 110 | 11.4% |
| $150,000 to $199,999 | 11 | 1.1% |
| $200,000+ | 15 | 1.6% |
Household Income by Householder Age in Daingerfield
The median household income in Daingerfield is $40,573, with the highest median household income of $44,583 found in the 65+ years age bracket for the primary householder. A total of 359 households (37.2%) fall into this category. Meanwhile, the 15 to 24 years age bracket for the primary householder has the lowest median household income of $0, with 30 households (3.1%) in this group.
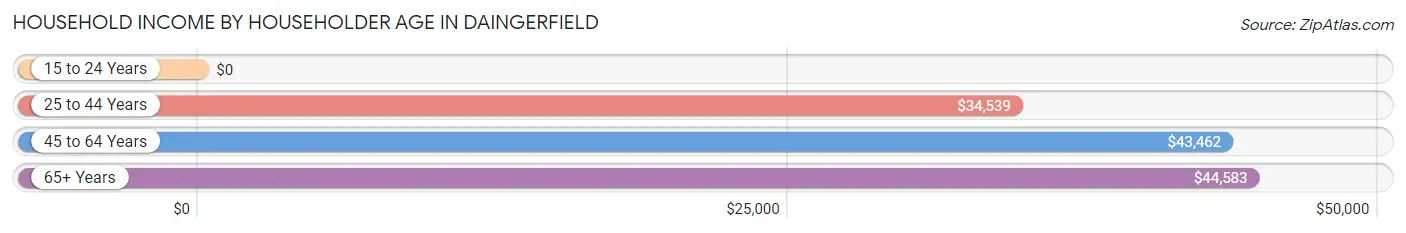
| Income Bracket | # Households | Median Income |
| 15 to 24 Years | 30 (3.1%) | $0 |
| 25 to 44 Years | 239 (24.7%) | $34,539 |
| 45 to 64 Years | 338 (35.0%) | $43,462 |
| 65+ Years | 359 (37.2%) | $44,583 |
| Total | 966 (100.0%) | $40,573 |
Poverty in Daingerfield
Income Below Poverty by Sex and Age in Daingerfield
With 23.8% poverty level for males and 32.3% for females among the residents of Daingerfield, under 5 year old males and 5 year old females are the most vulnerable to poverty, with 46 males (66.7%) and 25 females (100.0%) in their respective age groups living below the poverty level.
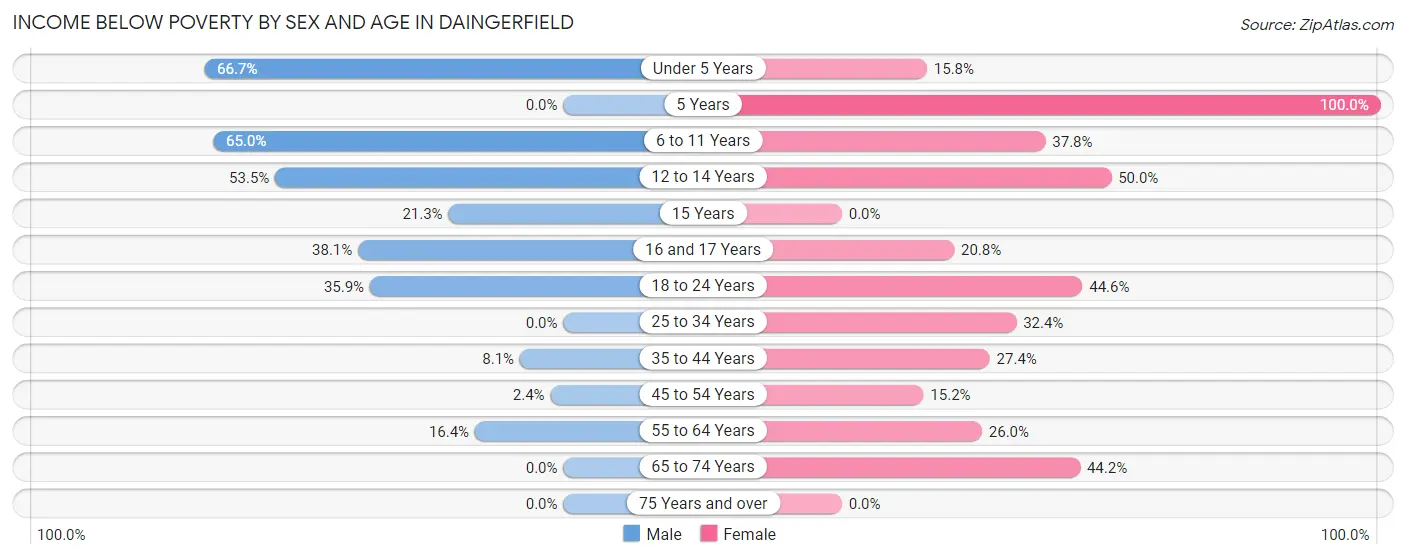
| Age Bracket | Male | Female |
| Under 5 Years | 46 (66.7%) | 3 (15.8%) |
| 5 Years | 0 (0.0%) | 25 (100.0%) |
| 6 to 11 Years | 65 (65.0%) | 65 (37.8%) |
| 12 to 14 Years | 23 (53.5%) | 15 (50.0%) |
| 15 Years | 16 (21.3%) | 0 (0.0%) |
| 16 and 17 Years | 16 (38.1%) | 10 (20.8%) |
| 18 to 24 Years | 56 (35.9%) | 75 (44.6%) |
| 25 to 34 Years | 0 (0.0%) | 56 (32.4%) |
| 35 to 44 Years | 5 (8.1%) | 45 (27.4%) |
| 45 to 54 Years | 3 (2.4%) | 10 (15.1%) |
| 55 to 64 Years | 21 (16.4%) | 52 (26.0%) |
| 65 to 74 Years | 0 (0.0%) | 84 (44.2%) |
| 75 Years and over | 0 (0.0%) | 0 (0.0%) |
| Total | 251 (23.8%) | 440 (32.3%) |
Income Above Poverty by Sex and Age in Daingerfield
According to the poverty statistics in Daingerfield, males aged 25 to 34 years and females aged 15 years are the age groups that are most secure financially, with 100.0% of males and 100.0% of females in these age groups living above the poverty line.
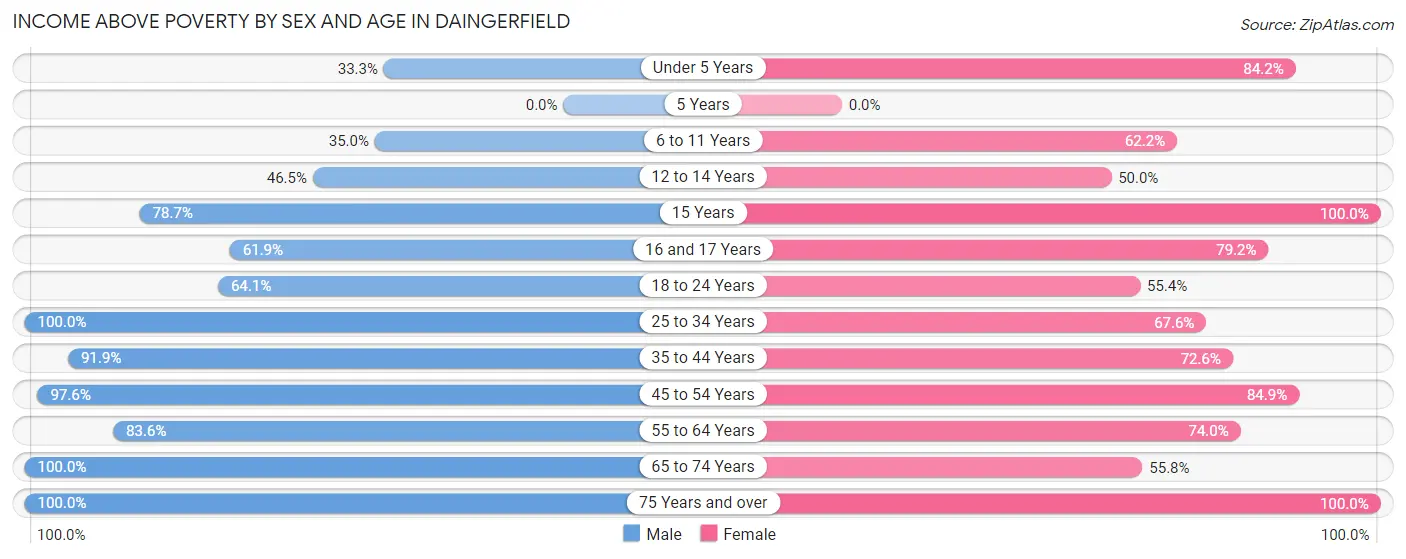
| Age Bracket | Male | Female |
| Under 5 Years | 23 (33.3%) | 16 (84.2%) |
| 5 Years | 0 (0.0%) | 0 (0.0%) |
| 6 to 11 Years | 35 (35.0%) | 107 (62.2%) |
| 12 to 14 Years | 20 (46.5%) | 15 (50.0%) |
| 15 Years | 59 (78.7%) | 9 (100.0%) |
| 16 and 17 Years | 26 (61.9%) | 38 (79.2%) |
| 18 to 24 Years | 100 (64.1%) | 93 (55.4%) |
| 25 to 34 Years | 52 (100.0%) | 117 (67.6%) |
| 35 to 44 Years | 57 (91.9%) | 119 (72.6%) |
| 45 to 54 Years | 122 (97.6%) | 56 (84.9%) |
| 55 to 64 Years | 107 (83.6%) | 148 (74.0%) |
| 65 to 74 Years | 130 (100.0%) | 106 (55.8%) |
| 75 Years and over | 72 (100.0%) | 97 (100.0%) |
| Total | 803 (76.2%) | 921 (67.7%) |
Income Below Poverty Among Married-Couple Families in Daingerfield
The poverty statistics for married-couple families in Daingerfield show that 0.7% or 2 of the total 296 families live below the poverty line. Families with 1 or 2 children have the highest poverty rate of 2.4%, comprising of 2 families. On the other hand, families with no children have the lowest poverty rate of 0.0%, which includes 0 families.
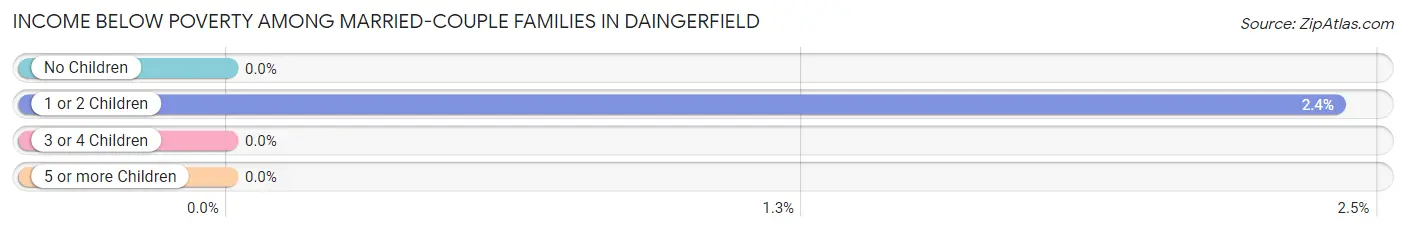
| Children | Above Poverty | Below Poverty |
| No Children | 191 (100.0%) | 0 (0.0%) |
| 1 or 2 Children | 81 (97.6%) | 2 (2.4%) |
| 3 or 4 Children | 22 (100.0%) | 0 (0.0%) |
| 5 or more Children | 0 (0.0%) | 0 (0.0%) |
| Total | 294 (99.3%) | 2 (0.7%) |
Income Below Poverty Among Single-Parent Households in Daingerfield
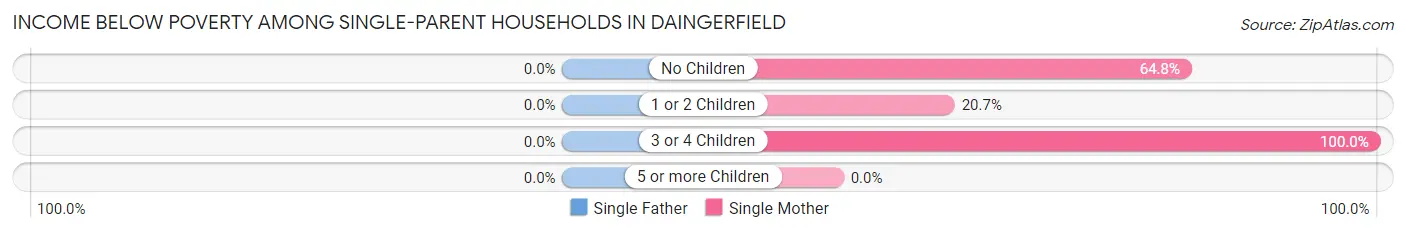
| Children | Single Father | Single Mother |
| No Children | 0 (0.0%) | 59 (64.8%) |
| 1 or 2 Children | 0 (0.0%) | 18 (20.7%) |
| 3 or 4 Children | 0 (0.0%) | 54 (100.0%) |
| 5 or more Children | 0 (0.0%) | 0 (0.0%) |
| Total | 0 (0.0%) | 131 (56.5%) |
Income Below Poverty Among Married-Couple vs Single-Parent Households in Daingerfield
The poverty data for Daingerfield shows that 2 of the married-couple family households (0.7%) and 131 of the single-parent households (46.8%) are living below the poverty level. Within the married-couple family households, those with 1 or 2 children have the highest poverty rate, with 2 households (2.4%) falling below the poverty line. Among the single-parent households, those with 3 or 4 children have the highest poverty rate, with 54 household (100.0%) living below poverty.
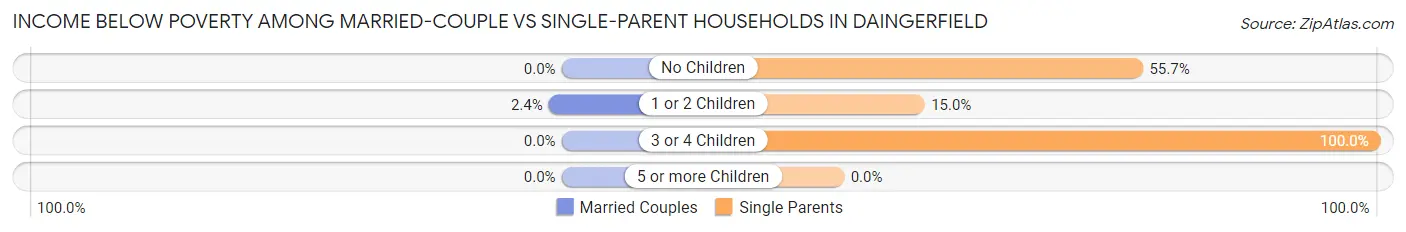
| Children | Married-Couple Families | Single-Parent Households |
| No Children | 0 (0.0%) | 59 (55.7%) |
| 1 or 2 Children | 2 (2.4%) | 18 (15.0%) |
| 3 or 4 Children | 0 (0.0%) | 54 (100.0%) |
| 5 or more Children | 0 (0.0%) | 0 (0.0%) |
| Total | 2 (0.7%) | 131 (46.8%) |
Race in Daingerfield
The most populous races in Daingerfield are White / Caucasian (1,240 | 49.6%), Black / African American (780 | 31.2%), and Hispanic or Latino (452 | 18.1%).
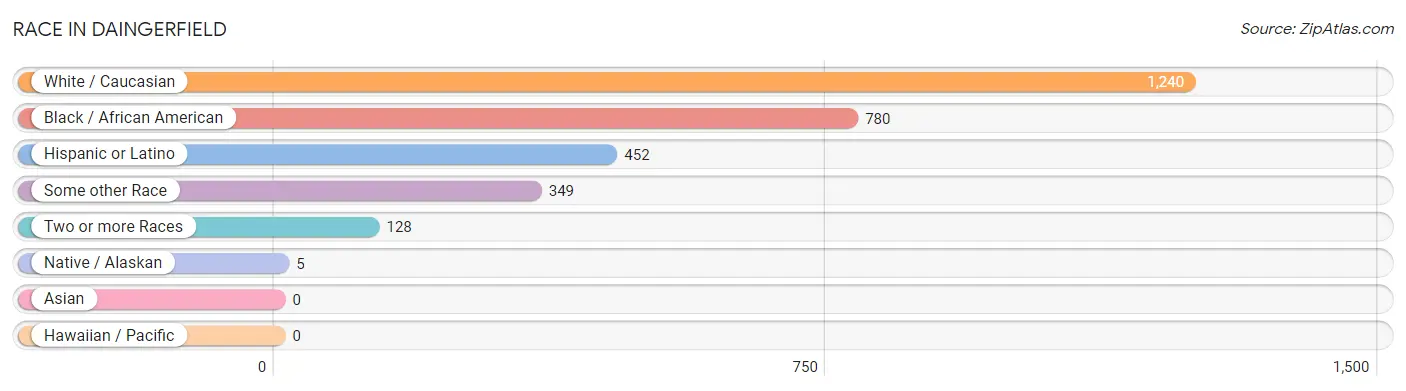
| Race | # Population | % Population |
| Asian | 0 | 0.0% |
| Black / African American | 780 | 31.2% |
| Hawaiian / Pacific | 0 | 0.0% |
| Hispanic or Latino | 452 | 18.1% |
| Native / Alaskan | 5 | 0.2% |
| White / Caucasian | 1,240 | 49.6% |
| Two or more Races | 128 | 5.1% |
| Some other Race | 349 | 14.0% |
| Total | 2,502 | 100.0% |
Ancestry in Daingerfield
The most populous ancestries reported in Daingerfield are American (791 | 31.6%), Mexican (421 | 16.8%), English (206 | 8.2%), Irish (99 | 4.0%), and German (77 | 3.1%), together accounting for 63.7% of all Daingerfield residents.
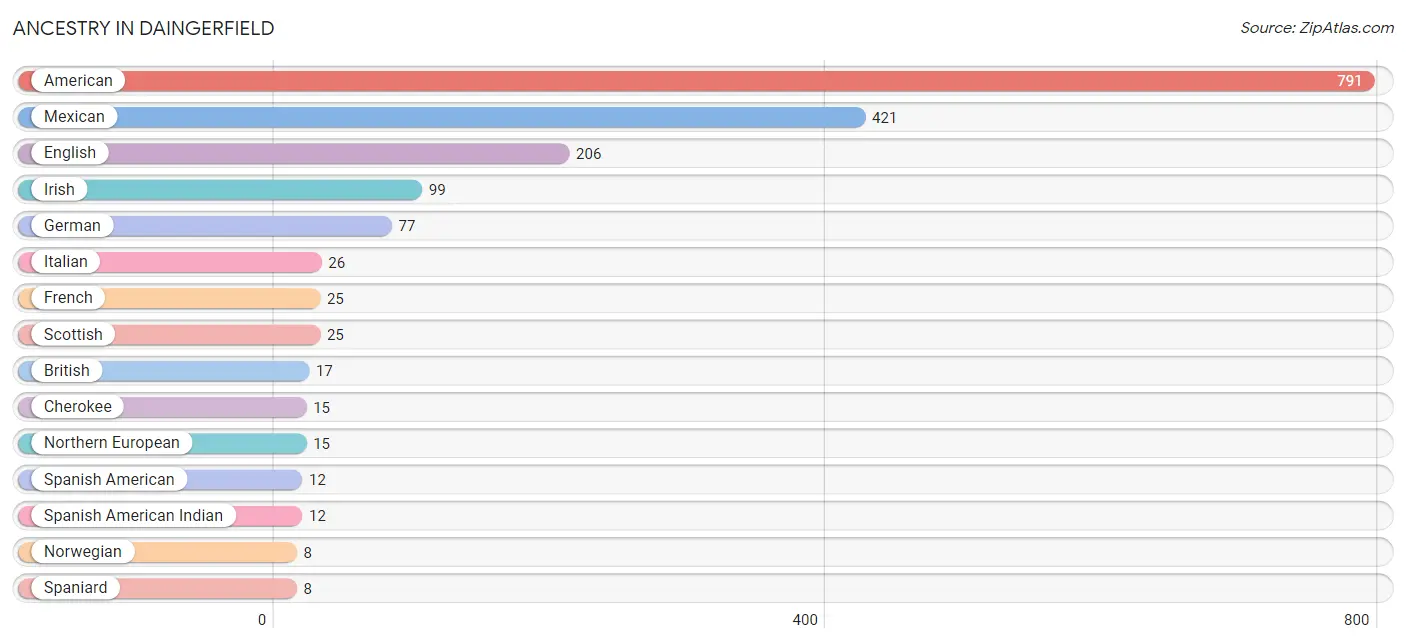
| Ancestry | # Population | % Population |
| African | 6 | 0.2% |
| American | 791 | 31.6% |
| British | 17 | 0.7% |
| Canadian | 5 | 0.2% |
| Central American | 6 | 0.2% |
| Cherokee | 15 | 0.6% |
| Choctaw | 3 | 0.1% |
| Dutch | 6 | 0.2% |
| English | 206 | 8.2% |
| French | 25 | 1.0% |
| German | 77 | 3.1% |
| Guatemalan | 1 | 0.0% |
| Irish | 99 | 4.0% |
| Italian | 26 | 1.0% |
| Mexican | 421 | 16.8% |
| Nicaraguan | 5 | 0.2% |
| Northern European | 15 | 0.6% |
| Norwegian | 8 | 0.3% |
| Scotch-Irish | 4 | 0.2% |
| Scottish | 25 | 1.0% |
| Spaniard | 8 | 0.3% |
| Spanish American | 12 | 0.5% |
| Spanish American Indian | 12 | 0.5% |
| Subsaharan African | 6 | 0.2% |
| Swiss | 4 | 0.2% |
| Welsh | 8 | 0.3% | View All 26 Rows |
Immigrants in Daingerfield
The most numerous immigrant groups reported in Daingerfield came from Central America (93 | 3.7%), Latin America (93 | 3.7%), Mexico (87 | 3.5%), Canada (5 | 0.2%), and Nicaragua (5 | 0.2%), together accounting for 11.3% of all Daingerfield residents.
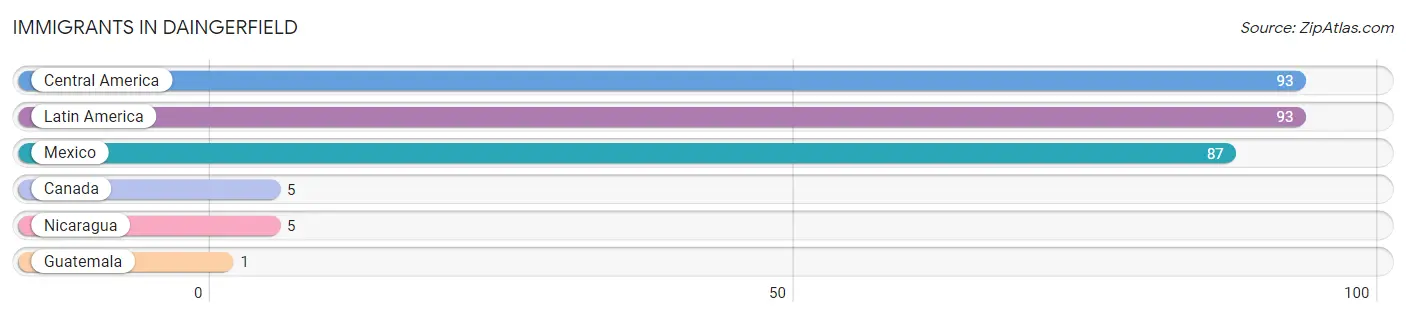
| Immigration Origin | # Population | % Population |
| Canada | 5 | 0.2% |
| Central America | 93 | 3.7% |
| Guatemala | 1 | 0.0% |
| Latin America | 93 | 3.7% |
| Mexico | 87 | 3.5% |
| Nicaragua | 5 | 0.2% | View All 6 Rows |
Sex and Age in Daingerfield
Sex and Age in Daingerfield
The most populous age groups in Daingerfield are 20 to 24 Years (148 | 13.6%) for men and 20 to 24 Years (136 | 9.6%) for women.
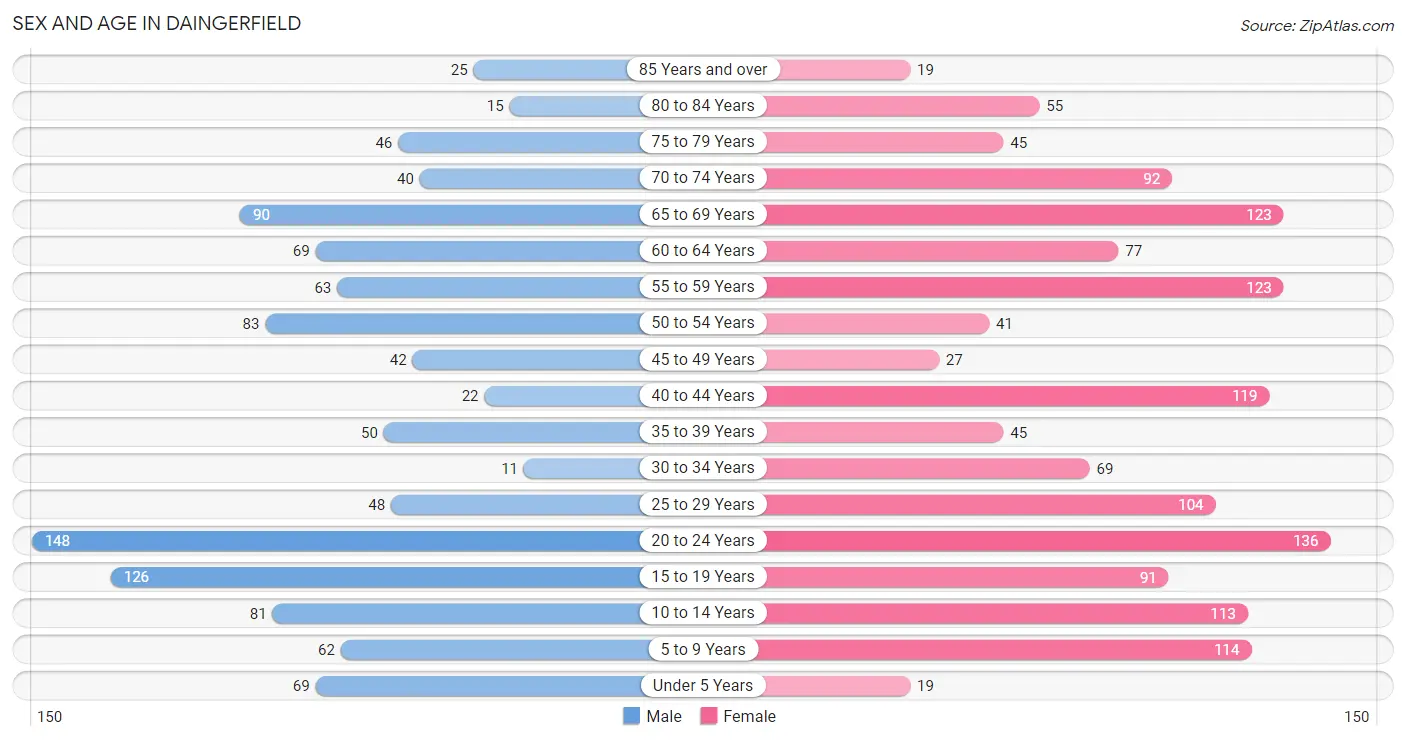
| Age Bracket | Male | Female |
| Under 5 Years | 69 (6.3%) | 19 (1.3%) |
| 5 to 9 Years | 62 (5.7%) | 114 (8.1%) |
| 10 to 14 Years | 81 (7.4%) | 113 (8.0%) |
| 15 to 19 Years | 126 (11.6%) | 91 (6.4%) |
| 20 to 24 Years | 148 (13.6%) | 136 (9.6%) |
| 25 to 29 Years | 48 (4.4%) | 104 (7.4%) |
| 30 to 34 Years | 11 (1.0%) | 69 (4.9%) |
| 35 to 39 Years | 50 (4.6%) | 45 (3.2%) |
| 40 to 44 Years | 22 (2.0%) | 119 (8.4%) |
| 45 to 49 Years | 42 (3.8%) | 27 (1.9%) |
| 50 to 54 Years | 83 (7.6%) | 41 (2.9%) |
| 55 to 59 Years | 63 (5.8%) | 123 (8.7%) |
| 60 to 64 Years | 69 (6.3%) | 77 (5.4%) |
| 65 to 69 Years | 90 (8.3%) | 123 (8.7%) |
| 70 to 74 Years | 40 (3.7%) | 92 (6.5%) |
| 75 to 79 Years | 46 (4.2%) | 45 (3.2%) |
| 80 to 84 Years | 15 (1.4%) | 55 (3.9%) |
| 85 Years and over | 25 (2.3%) | 19 (1.3%) |
| Total | 1,090 (100.0%) | 1,412 (100.0%) |
Families and Households in Daingerfield
Median Family Size in Daingerfield
The median family size in Daingerfield is 3.37 persons per family, with married-couple families (296 | 51.4%) accounting for the largest median family size of 3.46 persons per family. On the other hand, single male/father families (48 | 8.3%) represent the smallest median family size with 3.04 persons per family.
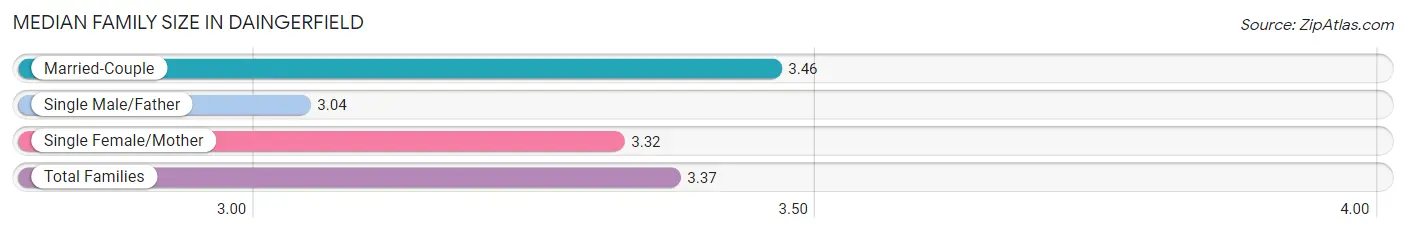
| Family Type | # Families | Family Size |
| Married-Couple | 296 (51.4%) | 3.46 |
| Single Male/Father | 48 (8.3%) | 3.04 |
| Single Female/Mother | 232 (40.3%) | 3.32 |
| Total Families | 576 (100.0%) | 3.37 |
Median Household Size in Daingerfield
The median household size in Daingerfield is 2.50 persons per household, with single male/father households (48 | 5.0%) accounting for the largest median household size of 3.52 persons per household. non-family households (390 | 40.4%) represent the smallest median household size with 1.10 persons per household.
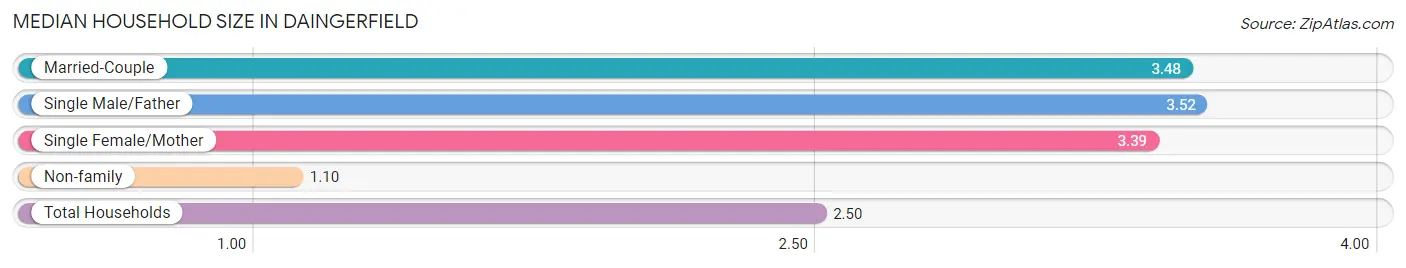
| Household Type | # Households | Household Size |
| Married-Couple | 296 (30.6%) | 3.48 |
| Single Male/Father | 48 (5.0%) | 3.52 |
| Single Female/Mother | 232 (24.0%) | 3.39 |
| Non-family | 390 (40.4%) | 1.10 |
| Total Households | 966 (100.0%) | 2.50 |
Household Size by Marriage Status in Daingerfield
Out of a total of 966 households in Daingerfield, 576 (59.6%) are family households, while 390 (40.4%) are nonfamily households. The most numerous type of family households are 2-person households, comprising 292, and the most common type of nonfamily households are 1-person households, comprising 367.
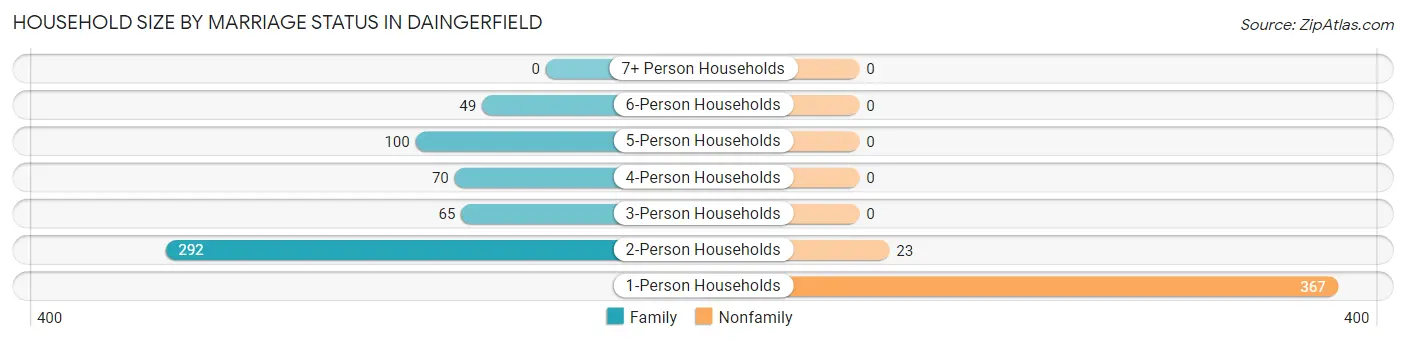
| Household Size | Family Households | Nonfamily Households |
| 1-Person Households | - | 367 (38.0%) |
| 2-Person Households | 292 (30.2%) | 23 (2.4%) |
| 3-Person Households | 65 (6.7%) | 0 (0.0%) |
| 4-Person Households | 70 (7.2%) | 0 (0.0%) |
| 5-Person Households | 100 (10.3%) | 0 (0.0%) |
| 6-Person Households | 49 (5.1%) | 0 (0.0%) |
| 7+ Person Households | 0 (0.0%) | 0 (0.0%) |
| Total | 576 (59.6%) | 390 (40.4%) |
Female Fertility in Daingerfield
Fertility by Age in Daingerfield
Average fertility rate in Daingerfield is 79.0 births per 1,000 women. Women in the age bracket of 20 to 34 years have the highest fertility rate with 123.0 births per 1,000 women. Women in the age bracket of 20 to 34 years acount for 80.8% of all women with births.
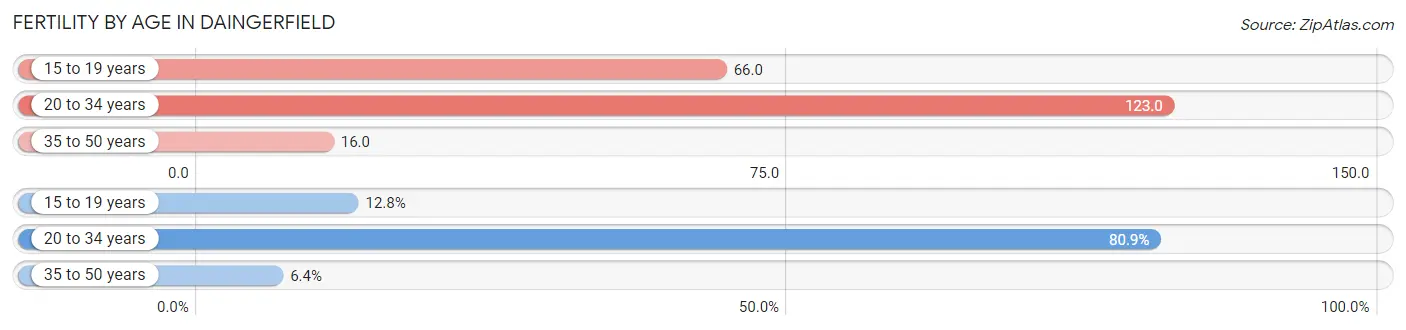
| Age Bracket | Women with Births | Births / 1,000 Women |
| 15 to 19 years | 6 (12.8%) | 66.0 |
| 20 to 34 years | 38 (80.8%) | 123.0 |
| 35 to 50 years | 3 (6.4%) | 16.0 |
| Total | 47 (100.0%) | 79.0 |
Fertility by Age by Marriage Status in Daingerfield
25.5% of women with births (47) in Daingerfield are married. The highest percentage of unmarried women with births falls into 15 to 19 years age bracket with 100.0% of them unmarried at the time of birth, while the lowest percentage of unmarried women with births belong to 35 to 50 years age bracket with 0.0% of them unmarried.
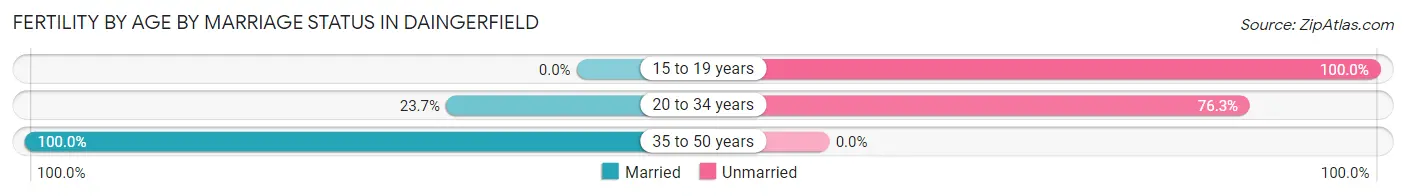
| Age Bracket | Married | Unmarried |
| 15 to 19 years | 0 (0.0%) | 6 (100.0%) |
| 20 to 34 years | 9 (23.7%) | 29 (76.3%) |
| 35 to 50 years | 3 (100.0%) | 0 (0.0%) |
| Total | 12 (25.5%) | 35 (74.5%) |
Fertility by Education in Daingerfield
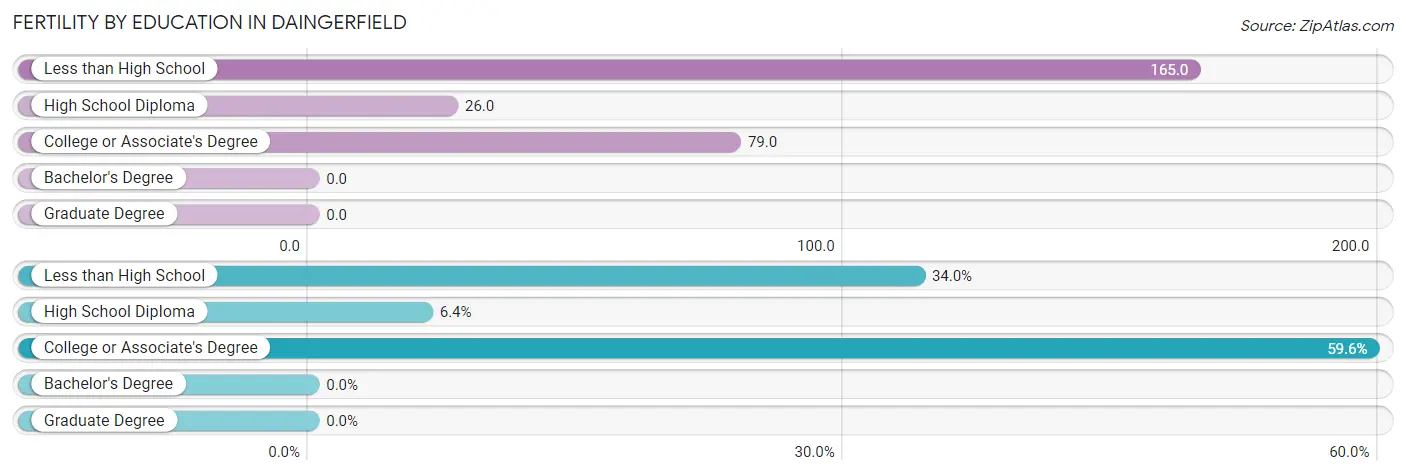
| Educational Attainment | Women with Births | Births / 1,000 Women |
| Less than High School | 16 (34.0%) | 165.0 |
| High School Diploma | 3 (6.4%) | 26.0 |
| College or Associate's Degree | 28 (59.6%) | 79.0 |
| Bachelor's Degree | 0 (0.0%) | 0.0 |
| Graduate Degree | 0 (0.0%) | 0.0 |
| Total | 47 (100.0%) | 79.0 |
Fertility by Education by Marriage Status in Daingerfield
74.5% of women with births in Daingerfield are unmarried. Women with the educational attainment of high school diploma are most likely to be married with 100.0% of them married at childbirth, while women with the educational attainment of college or associate's degree are least likely to be married with 82.1% of them unmarried at childbirth.
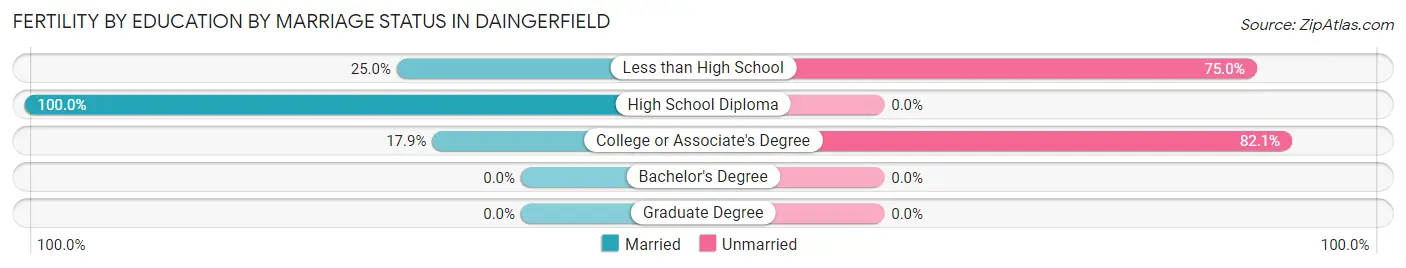
| Educational Attainment | Married | Unmarried |
| Less than High School | 4 (25.0%) | 12 (75.0%) |
| High School Diploma | 3 (100.0%) | 0 (0.0%) |
| College or Associate's Degree | 5 (17.9%) | 23 (82.1%) |
| Bachelor's Degree | 0 (0.0%) | 0 (0.0%) |
| Graduate Degree | 0 (0.0%) | 0 (0.0%) |
| Total | 12 (25.5%) | 35 (74.5%) |
Employment Characteristics in Daingerfield
Employment by Class of Employer in Daingerfield
Among the 930 employed individuals in Daingerfield, private company employees (613 | 65.9%), local government employees (86 | 9.2%), and state government employees (74 | 8.0%) make up the most common classes of employment.
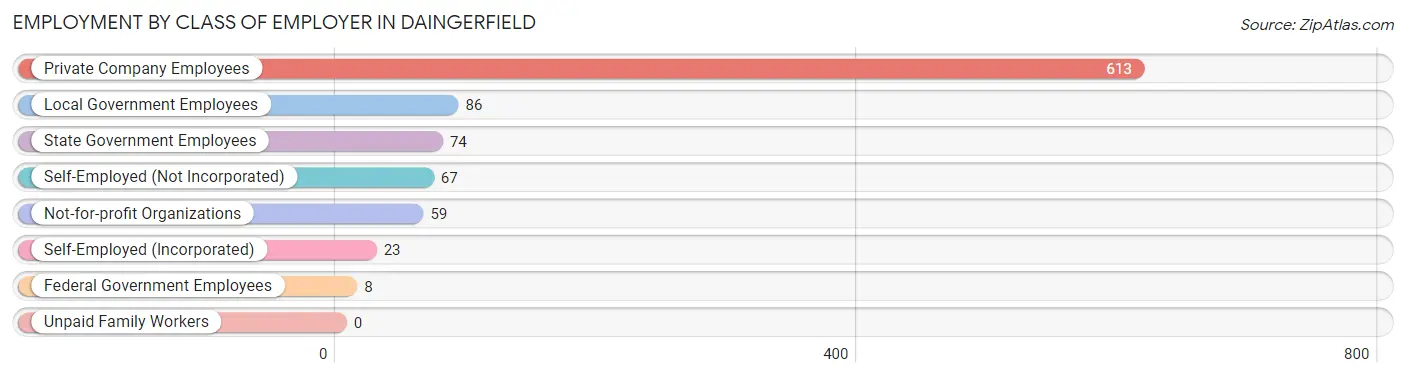
| Employer Class | # Employees | % Employees |
| Private Company Employees | 613 | 65.9% |
| Self-Employed (Incorporated) | 23 | 2.5% |
| Self-Employed (Not Incorporated) | 67 | 7.2% |
| Not-for-profit Organizations | 59 | 6.3% |
| Local Government Employees | 86 | 9.2% |
| State Government Employees | 74 | 8.0% |
| Federal Government Employees | 8 | 0.9% |
| Unpaid Family Workers | 0 | 0.0% |
| Total | 930 | 100.0% |
Employment Status by Age in Daingerfield
According to the labor force statistics for Daingerfield, out of the total population over 16 years of age (1,960), 52.1% or 1,021 individuals are in the labor force, with 8.9% or 91 of them unemployed. The age group with the highest labor force participation rate is 25 to 29 years, with 92.8% or 141 individuals in the labor force. Within the labor force, the 20 to 24 years age range has the highest percentage of unemployed individuals, with 39.8% or 78 of them being unemployed.
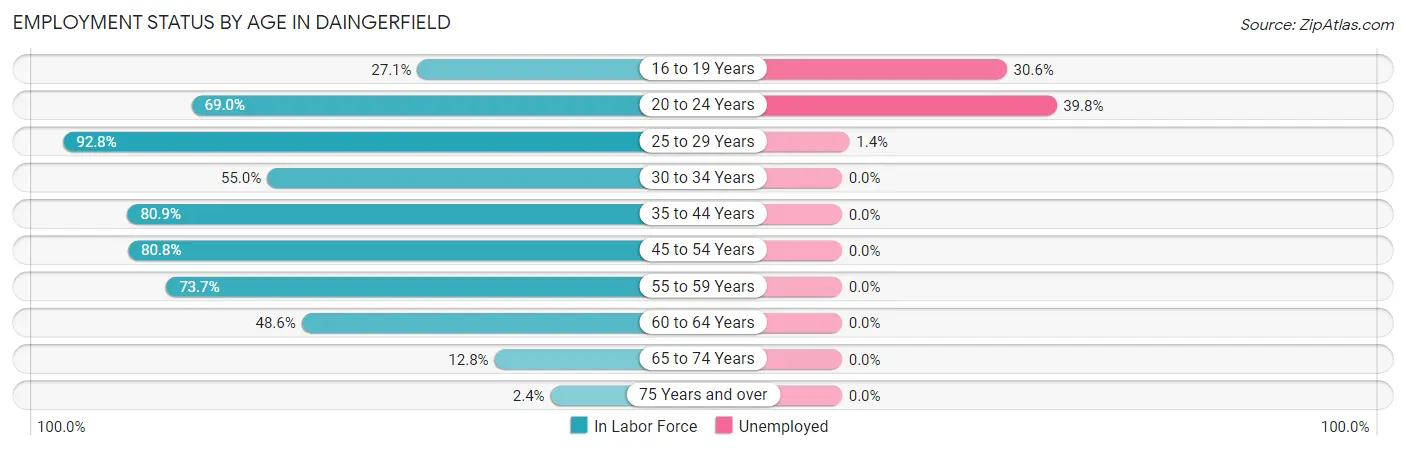
| Age Bracket | In Labor Force | Unemployed |
| 16 to 19 Years | 36 (27.1%) | 11 (30.6%) |
| 20 to 24 Years | 196 (69.0%) | 78 (39.8%) |
| 25 to 29 Years | 141 (92.8%) | 2 (1.4%) |
| 30 to 34 Years | 44 (55.0%) | 0 (0.0%) |
| 35 to 44 Years | 191 (80.9%) | 0 (0.0%) |
| 45 to 54 Years | 156 (80.8%) | 0 (0.0%) |
| 55 to 59 Years | 137 (73.7%) | 0 (0.0%) |
| 60 to 64 Years | 71 (48.6%) | 0 (0.0%) |
| 65 to 74 Years | 44 (12.8%) | 0 (0.0%) |
| 75 Years and over | 5 (2.4%) | 0 (0.0%) |
| Total | 1,021 (52.1%) | 91 (8.9%) |
Employment Status by Educational Attainment in Daingerfield
According to labor force statistics for Daingerfield, 74.5% of individuals (740) out of the total population between 25 and 64 years of age (993) are in the labor force, with 0.3% or 2 of them being unemployed. The group with the highest labor force participation rate are those with the educational attainment of bachelor's degree or higher, with 90.4% or 113 individuals in the labor force. Within the labor force, individuals with less than high school education have the highest percentage of unemployment, with 3.6% or 2 of them being unemployed.
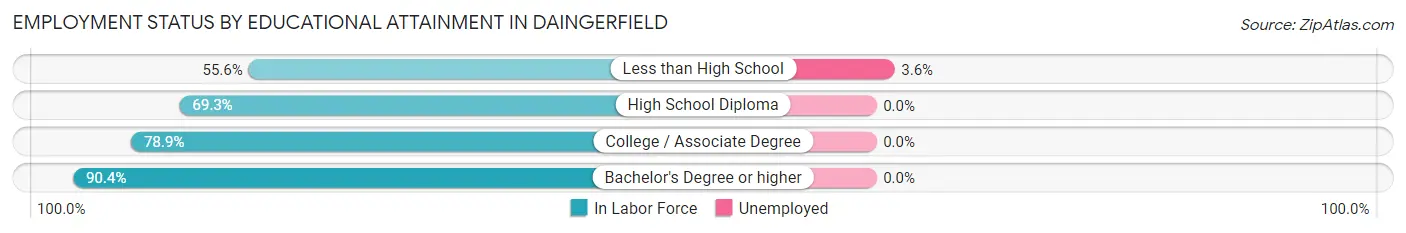
| Educational Attainment | In Labor Force | Unemployed |
| Less than High School | 55 (55.6%) | 4 (3.6%) |
| High School Diploma | 250 (69.3%) | 0 (0.0%) |
| College / Associate Degree | 322 (78.9%) | 0 (0.0%) |
| Bachelor's Degree or higher | 113 (90.4%) | 0 (0.0%) |
| Total | 740 (74.5%) | 3 (0.3%) |
Employment Occupations by Sex in Daingerfield
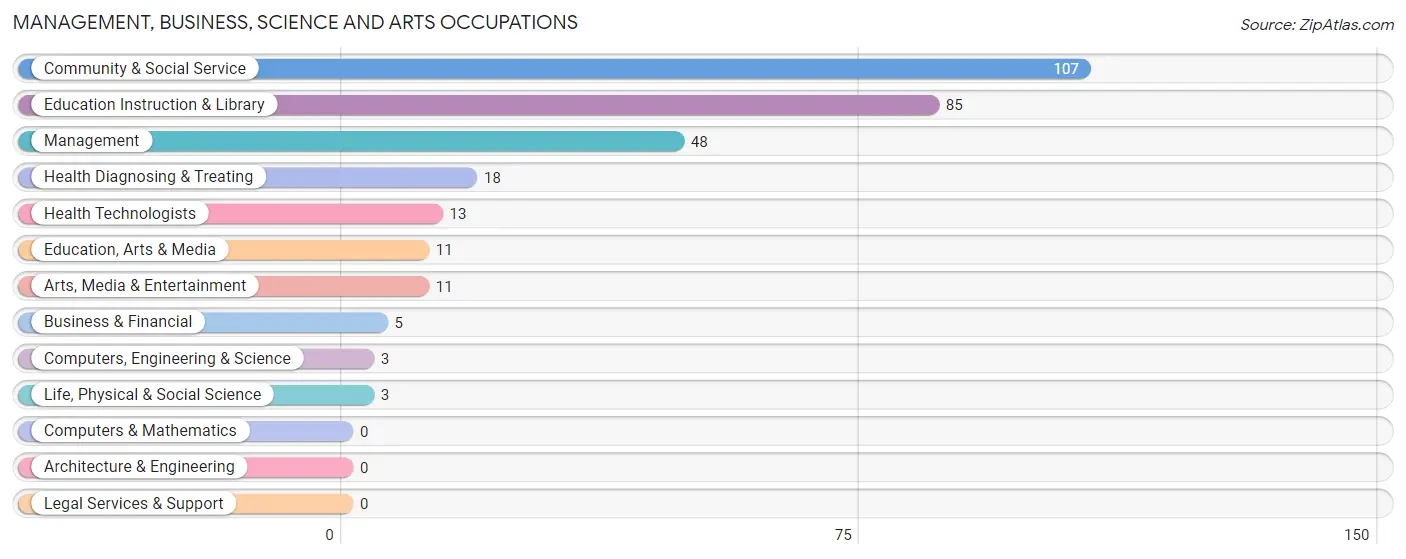
Management, Business, Science and Arts Occupations
The most common Management, Business, Science and Arts occupations in Daingerfield are Community & Social Service (107 | 11.5%), Education Instruction & Library (85 | 9.1%), Management (48 | 5.2%), Health Diagnosing & Treating (18 | 1.9%), and Health Technologists (13 | 1.4%).
Management, Business, Science and Arts Occupations by Sex
Within the Management, Business, Science and Arts occupations in Daingerfield, the most male-oriented occupations are Computers, Engineering & Science (100.0%), Life, Physical & Social Science (100.0%), and Education, Arts & Media (63.6%), while the most female-oriented occupations are Business & Financial (100.0%), Health Technologists (100.0%), and Education Instruction & Library (95.3%).
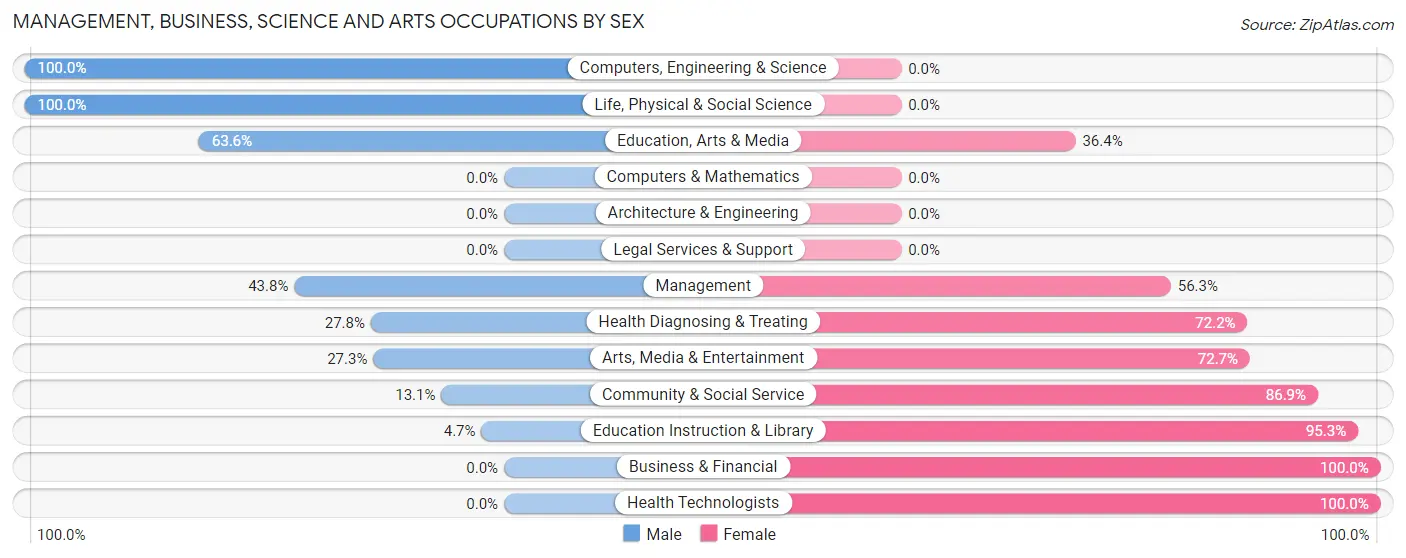
| Occupation | Male | Female |
| Management | 21 (43.8%) | 27 (56.2%) |
| Business & Financial | 0 (0.0%) | 5 (100.0%) |
| Computers, Engineering & Science | 3 (100.0%) | 0 (0.0%) |
| Computers & Mathematics | 0 (0.0%) | 0 (0.0%) |
| Architecture & Engineering | 0 (0.0%) | 0 (0.0%) |
| Life, Physical & Social Science | 3 (100.0%) | 0 (0.0%) |
| Community & Social Service | 14 (13.1%) | 93 (86.9%) |
| Education, Arts & Media | 7 (63.6%) | 4 (36.4%) |
| Legal Services & Support | 0 (0.0%) | 0 (0.0%) |
| Education Instruction & Library | 4 (4.7%) | 81 (95.3%) |
| Arts, Media & Entertainment | 3 (27.3%) | 8 (72.7%) |
| Health Diagnosing & Treating | 5 (27.8%) | 13 (72.2%) |
| Health Technologists | 0 (0.0%) | 13 (100.0%) |
| Total (Category) | 43 (23.8%) | 138 (76.2%) |
| Total (Overall) | 376 (40.4%) | 554 (59.6%) |
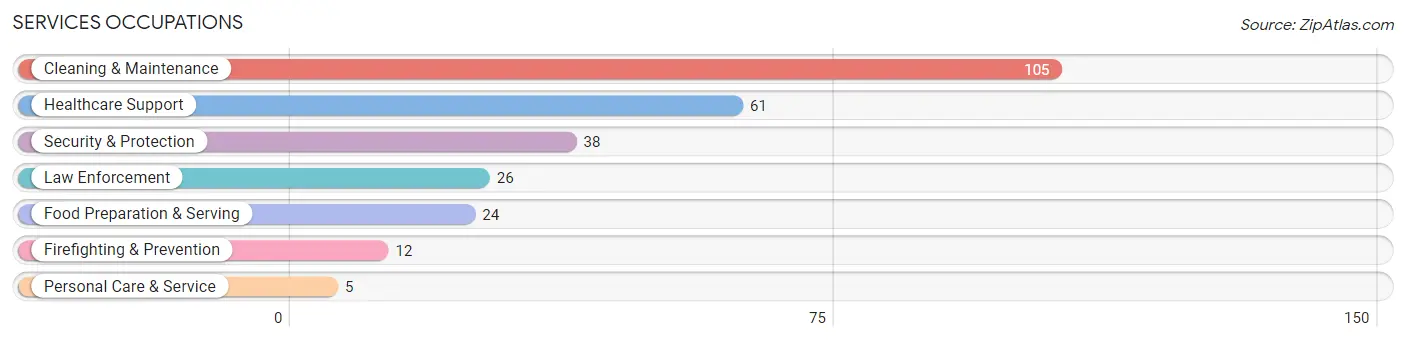
Services Occupations
The most common Services occupations in Daingerfield are Cleaning & Maintenance (105 | 11.3%), Healthcare Support (61 | 6.6%), Security & Protection (38 | 4.1%), Law Enforcement (26 | 2.8%), and Food Preparation & Serving (24 | 2.6%).
Services Occupations by Sex
Within the Services occupations in Daingerfield, the most male-oriented occupations are Firefighting & Prevention (100.0%), Food Preparation & Serving (87.5%), and Cleaning & Maintenance (50.5%), while the most female-oriented occupations are Law Enforcement (100.0%), Personal Care & Service (100.0%), and Healthcare Support (91.8%).
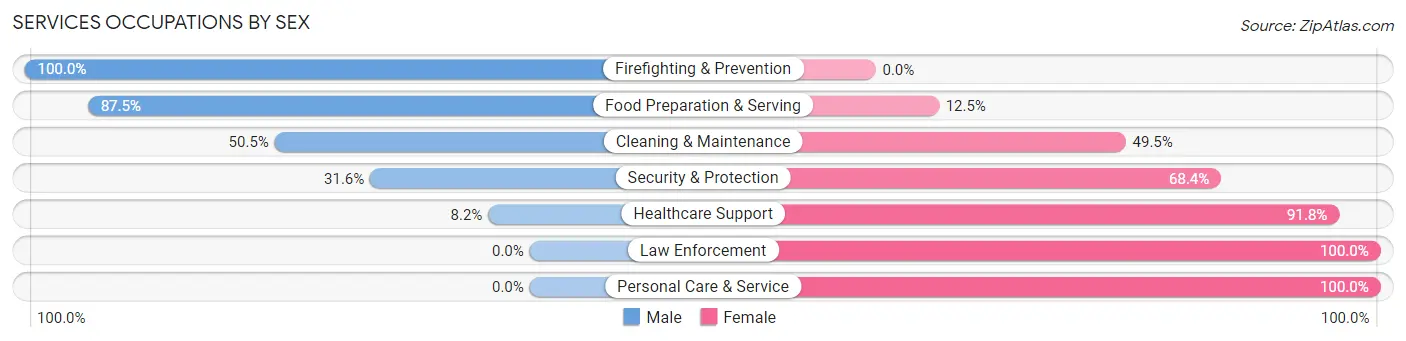
| Occupation | Male | Female |
| Healthcare Support | 5 (8.2%) | 56 (91.8%) |
| Security & Protection | 12 (31.6%) | 26 (68.4%) |
| Firefighting & Prevention | 12 (100.0%) | 0 (0.0%) |
| Law Enforcement | 0 (0.0%) | 26 (100.0%) |
| Food Preparation & Serving | 21 (87.5%) | 3 (12.5%) |
| Cleaning & Maintenance | 53 (50.5%) | 52 (49.5%) |
| Personal Care & Service | 0 (0.0%) | 5 (100.0%) |
| Total (Category) | 91 (39.1%) | 142 (60.9%) |
| Total (Overall) | 376 (40.4%) | 554 (59.6%) |
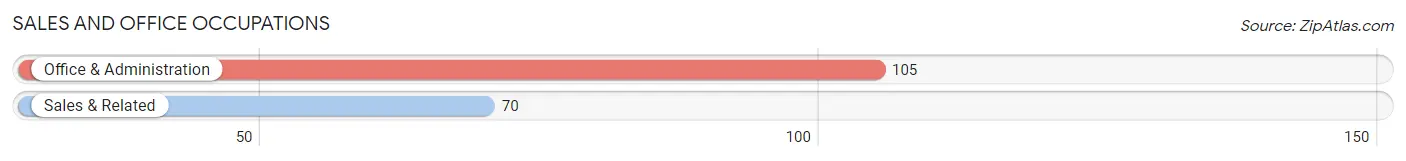
Sales and Office Occupations
The most common Sales and Office occupations in Daingerfield are Office & Administration (105 | 11.3%), and Sales & Related (70 | 7.5%).
Sales and Office Occupations by Sex
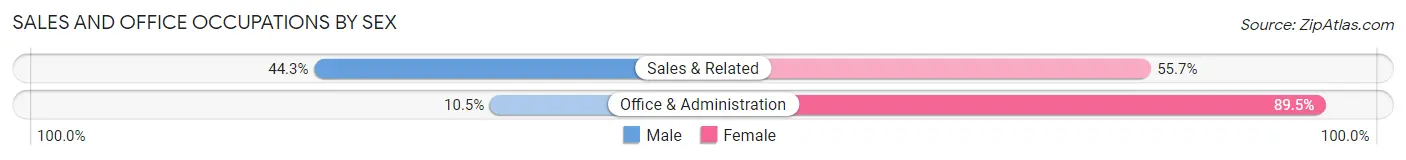
| Occupation | Male | Female |
| Sales & Related | 31 (44.3%) | 39 (55.7%) |
| Office & Administration | 11 (10.5%) | 94 (89.5%) |
| Total (Category) | 42 (24.0%) | 133 (76.0%) |
| Total (Overall) | 376 (40.4%) | 554 (59.6%) |
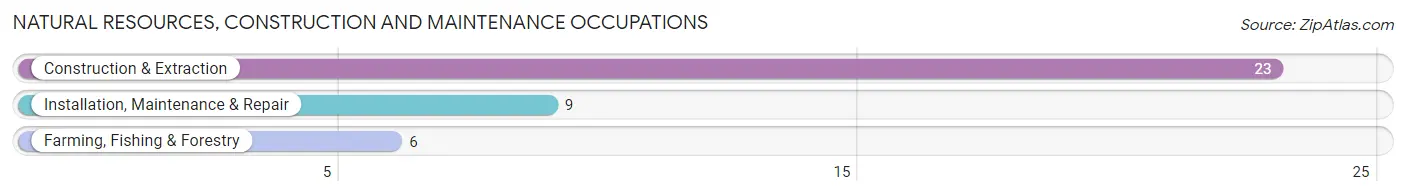
Natural Resources, Construction and Maintenance Occupations
The most common Natural Resources, Construction and Maintenance occupations in Daingerfield are Construction & Extraction (23 | 2.5%), Installation, Maintenance & Repair (9 | 1.0%), and Farming, Fishing & Forestry (6 | 0.6%).
Natural Resources, Construction and Maintenance Occupations by Sex
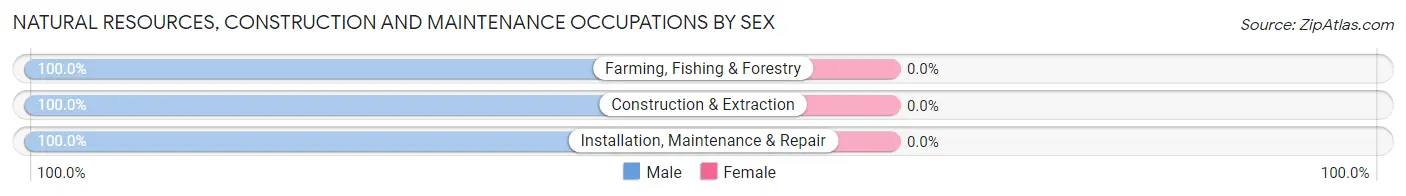
| Occupation | Male | Female |
| Farming, Fishing & Forestry | 6 (100.0%) | 0 (0.0%) |
| Construction & Extraction | 23 (100.0%) | 0 (0.0%) |
| Installation, Maintenance & Repair | 9 (100.0%) | 0 (0.0%) |
| Total (Category) | 38 (100.0%) | 0 (0.0%) |
| Total (Overall) | 376 (40.4%) | 554 (59.6%) |
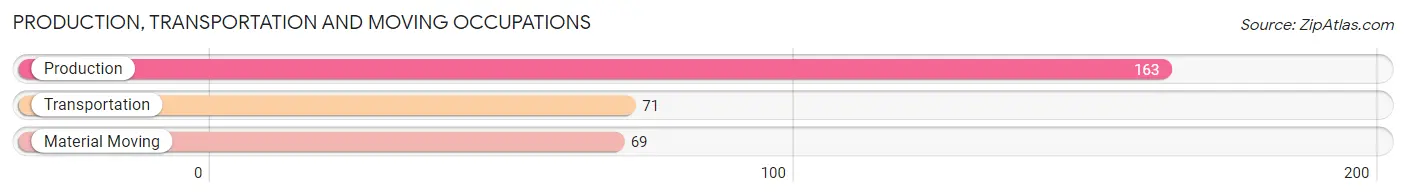
Production, Transportation and Moving Occupations
The most common Production, Transportation and Moving occupations in Daingerfield are Production (163 | 17.5%), Transportation (71 | 7.6%), and Material Moving (69 | 7.4%).
Production, Transportation and Moving Occupations by Sex
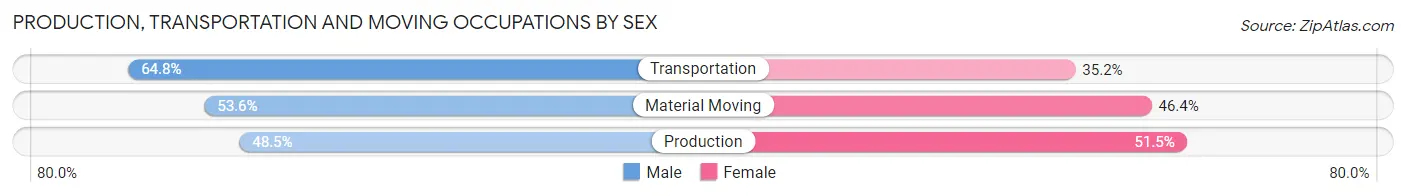
| Occupation | Male | Female |
| Production | 79 (48.5%) | 84 (51.5%) |
| Transportation | 46 (64.8%) | 25 (35.2%) |
| Material Moving | 37 (53.6%) | 32 (46.4%) |
| Total (Category) | 162 (53.5%) | 141 (46.5%) |
| Total (Overall) | 376 (40.4%) | 554 (59.6%) |
Employment Industries by Sex in Daingerfield
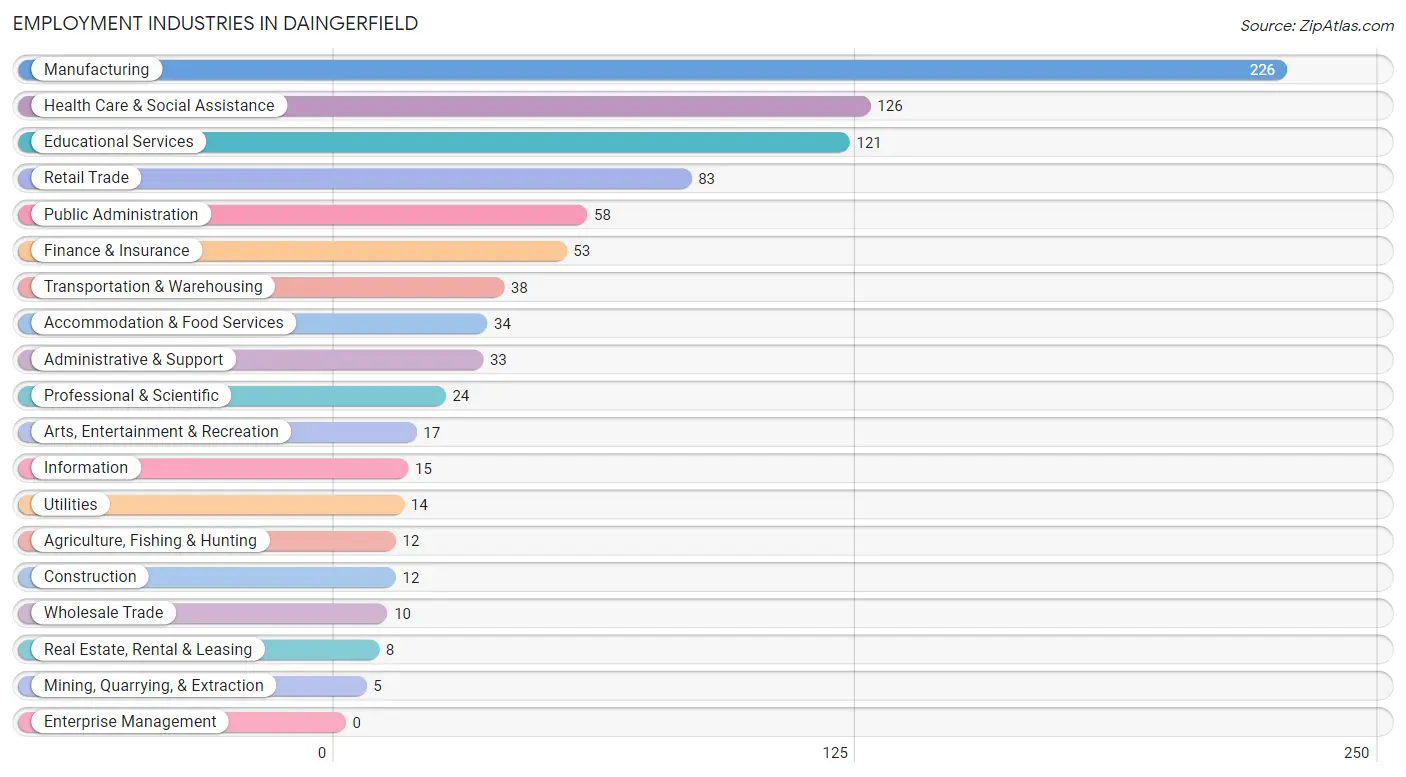
Employment Industries in Daingerfield
The major employment industries in Daingerfield include Manufacturing (226 | 24.3%), Health Care & Social Assistance (126 | 13.6%), Educational Services (121 | 13.0%), Retail Trade (83 | 8.9%), and Public Administration (58 | 6.2%).
Employment Industries by Sex in Daingerfield
The Daingerfield industries that see more men than women are Mining, Quarrying, & Extraction (100.0%), Wholesale Trade (100.0%), and Utilities (100.0%), whereas the industries that tend to have a higher number of women are Information (100.0%), Educational Services (93.4%), and Public Administration (87.9%).
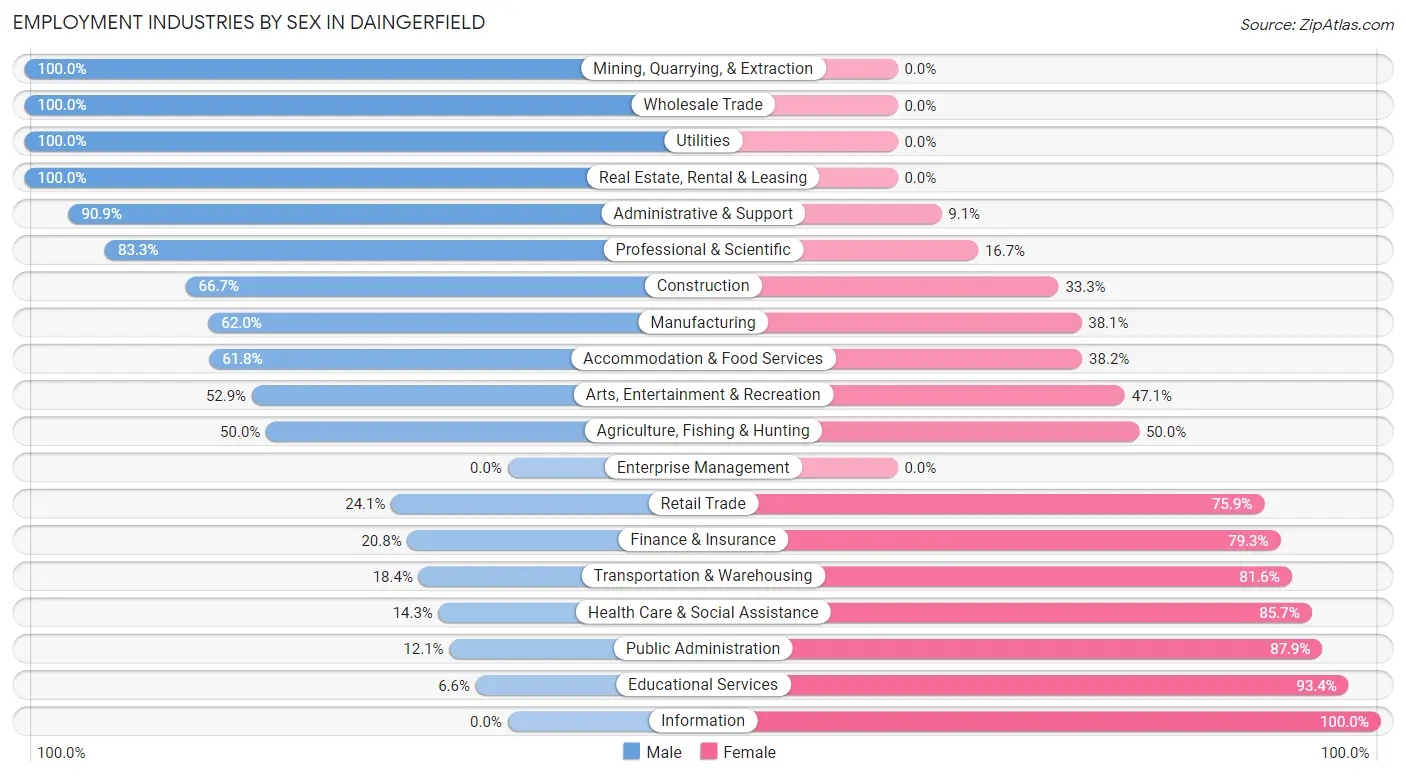
| Industry | Male | Female |
| Agriculture, Fishing & Hunting | 6 (50.0%) | 6 (50.0%) |
| Mining, Quarrying, & Extraction | 5 (100.0%) | 0 (0.0%) |
| Construction | 8 (66.7%) | 4 (33.3%) |
| Manufacturing | 140 (62.0%) | 86 (38.1%) |
| Wholesale Trade | 10 (100.0%) | 0 (0.0%) |
| Retail Trade | 20 (24.1%) | 63 (75.9%) |
| Transportation & Warehousing | 7 (18.4%) | 31 (81.6%) |
| Utilities | 14 (100.0%) | 0 (0.0%) |
| Information | 0 (0.0%) | 15 (100.0%) |
| Finance & Insurance | 11 (20.7%) | 42 (79.2%) |
| Real Estate, Rental & Leasing | 8 (100.0%) | 0 (0.0%) |
| Professional & Scientific | 20 (83.3%) | 4 (16.7%) |
| Enterprise Management | 0 (0.0%) | 0 (0.0%) |
| Administrative & Support | 30 (90.9%) | 3 (9.1%) |
| Educational Services | 8 (6.6%) | 113 (93.4%) |
| Health Care & Social Assistance | 18 (14.3%) | 108 (85.7%) |
| Arts, Entertainment & Recreation | 9 (52.9%) | 8 (47.1%) |
| Accommodation & Food Services | 21 (61.8%) | 13 (38.2%) |
| Public Administration | 7 (12.1%) | 51 (87.9%) |
| Total | 376 (40.4%) | 554 (59.6%) |
Education in Daingerfield
School Enrollment in Daingerfield
The most common levels of schooling among the 685 students in Daingerfield are high school (271 | 39.6%), elementary school (221 | 32.3%), and college / undergraduate (100 | 14.6%).
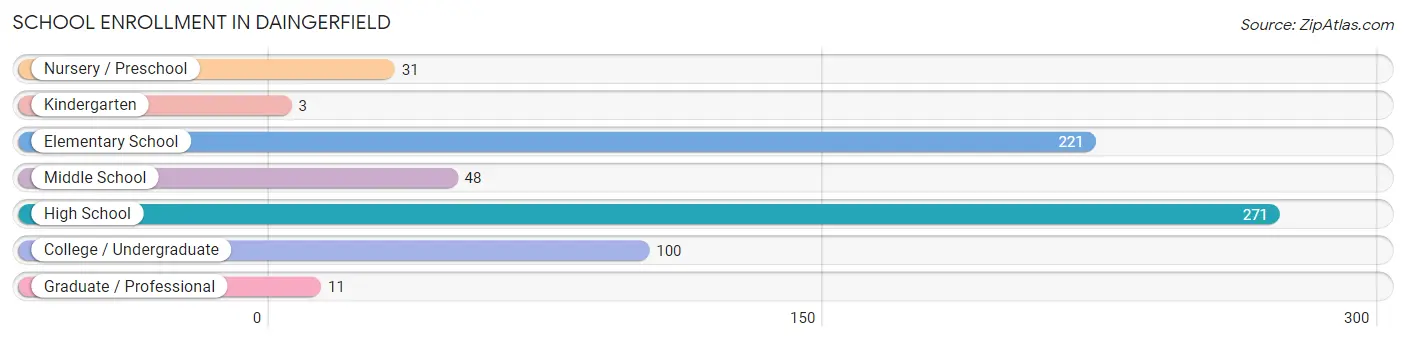
| School Level | # Students | % Students |
| Nursery / Preschool | 31 | 4.5% |
| Kindergarten | 3 | 0.4% |
| Elementary School | 221 | 32.3% |
| Middle School | 48 | 7.0% |
| High School | 271 | 39.6% |
| College / Undergraduate | 100 | 14.6% |
| Graduate / Professional | 11 | 1.6% |
| Total | 685 | 100.0% |
School Enrollment by Age by Funding Source in Daingerfield
Out of a total of 685 students who are enrolled in schools in Daingerfield, 12 (1.8%) attend a private institution, while the remaining 673 (98.2%) are enrolled in public schools. The age group of 25 to 34 year olds has the highest likelihood of being enrolled in private schools, with 7 (100.0% in the age bracket) enrolled. Conversely, the age group of 3 to 4 year olds has the lowest likelihood of being enrolled in a private school, with 6 (100.0% in the age bracket) attending a public institution.
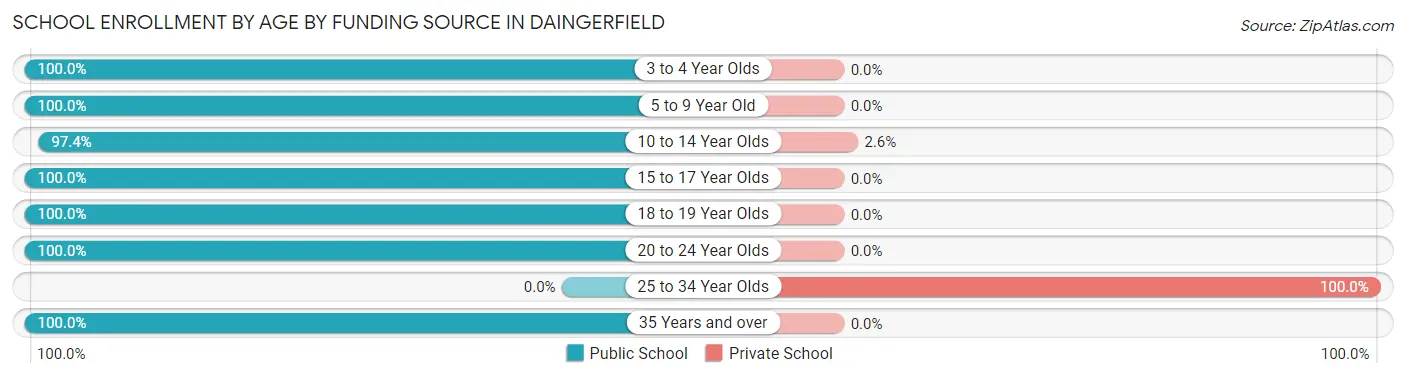
| Age Bracket | Public School | Private School |
| 3 to 4 Year Olds | 6 (100.0%) | 0 (0.0%) |
| 5 to 9 Year Old | 161 (100.0%) | 0 (0.0%) |
| 10 to 14 Year Olds | 189 (97.4%) | 5 (2.6%) |
| 15 to 17 Year Olds | 174 (100.0%) | 0 (0.0%) |
| 18 to 19 Year Olds | 43 (100.0%) | 0 (0.0%) |
| 20 to 24 Year Olds | 79 (100.0%) | 0 (0.0%) |
| 25 to 34 Year Olds | 0 (0.0%) | 7 (100.0%) |
| 35 Years and over | 21 (100.0%) | 0 (0.0%) |
| Total | 673 (98.2%) | 12 (1.8%) |
Educational Attainment by Field of Study in Daingerfield
Education (87 | 35.5%), business (55 | 22.5%), arts & humanities (44 | 18.0%), science & technology (21 | 8.6%), and visual & performing arts (12 | 4.9%) are the most common fields of study among 245 individuals in Daingerfield who have obtained a bachelor's degree or higher.
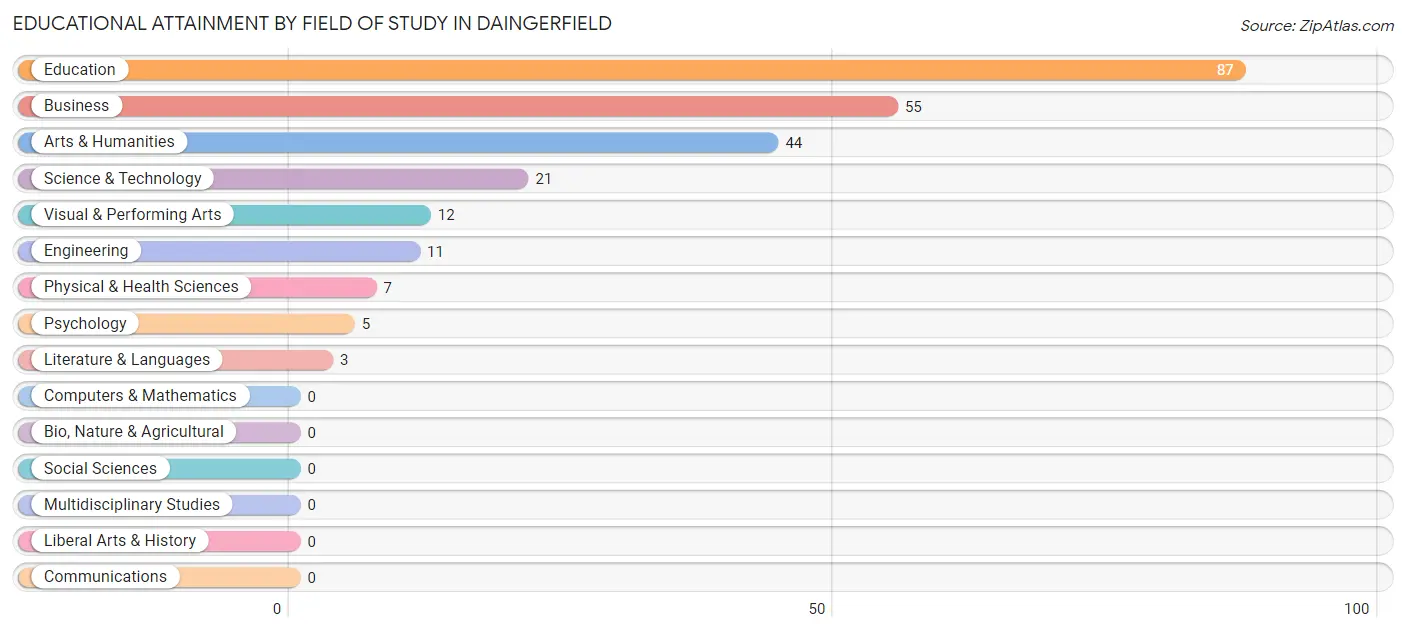
| Field of Study | # Graduates | % Graduates |
| Computers & Mathematics | 0 | 0.0% |
| Bio, Nature & Agricultural | 0 | 0.0% |
| Physical & Health Sciences | 7 | 2.9% |
| Psychology | 5 | 2.0% |
| Social Sciences | 0 | 0.0% |
| Engineering | 11 | 4.5% |
| Multidisciplinary Studies | 0 | 0.0% |
| Science & Technology | 21 | 8.6% |
| Business | 55 | 22.5% |
| Education | 87 | 35.5% |
| Literature & Languages | 3 | 1.2% |
| Liberal Arts & History | 0 | 0.0% |
| Visual & Performing Arts | 12 | 4.9% |
| Communications | 0 | 0.0% |
| Arts & Humanities | 44 | 18.0% |
| Total | 245 | 100.0% |
Transportation & Commute in Daingerfield
Vehicle Availability by Sex in Daingerfield
The most prevalent vehicle ownership categories in Daingerfield are males with 2 vehicles (139, accounting for 37.0%) and females with 2 vehicles (175, making up 25.1%).
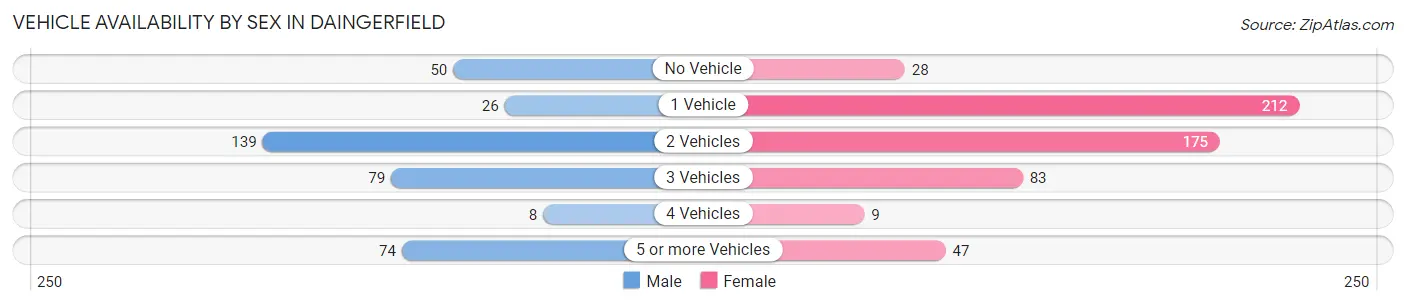
| Vehicles Available | Male | Female |
| No Vehicle | 50 (13.3%) | 28 (5.1%) |
| 1 Vehicle | 26 (6.9%) | 212 (38.3%) |
| 2 Vehicles | 139 (37.0%) | 175 (31.6%) |
| 3 Vehicles | 79 (21.0%) | 83 (15.0%) |
| 4 Vehicles | 8 (2.1%) | 9 (1.6%) |
| 5 or more Vehicles | 74 (19.7%) | 47 (8.5%) |
| Total | 376 (100.0%) | 554 (100.0%) |
Commute Time in Daingerfield
The most frequently occuring commute durations in Daingerfield are 10 to 14 minutes (146 commuters, 16.4%), 45 to 59 minutes (130 commuters, 14.6%), and 20 to 24 minutes (112 commuters, 12.6%).
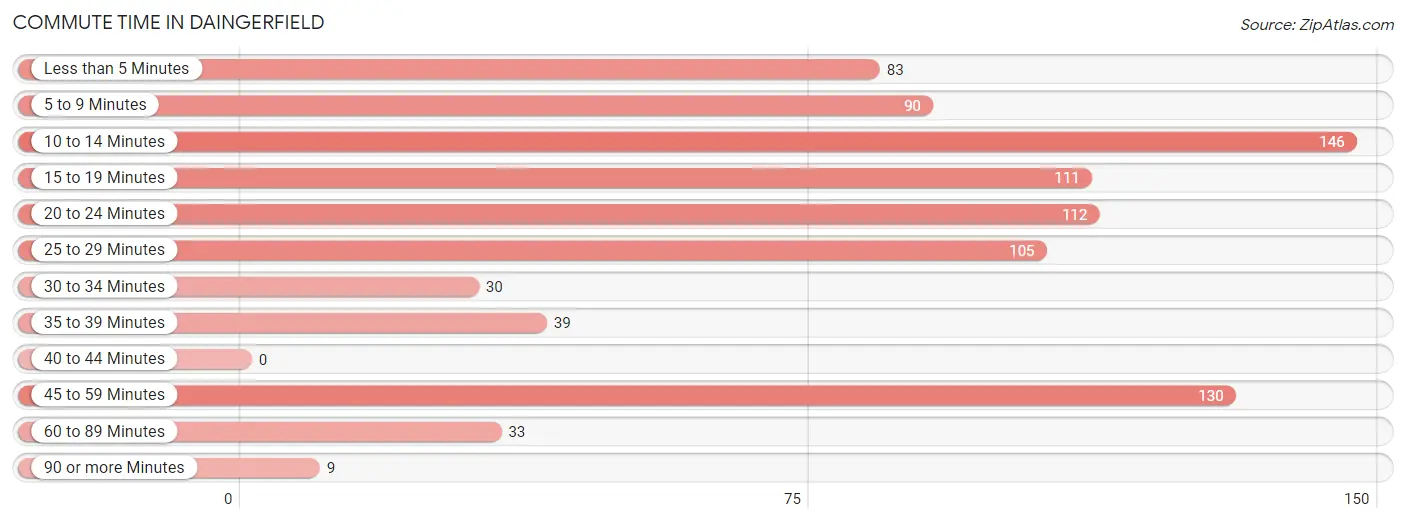
| Commute Time | # Commuters | % Commuters |
| Less than 5 Minutes | 83 | 9.3% |
| 5 to 9 Minutes | 90 | 10.1% |
| 10 to 14 Minutes | 146 | 16.4% |
| 15 to 19 Minutes | 111 | 12.5% |
| 20 to 24 Minutes | 112 | 12.6% |
| 25 to 29 Minutes | 105 | 11.8% |
| 30 to 34 Minutes | 30 | 3.4% |
| 35 to 39 Minutes | 39 | 4.4% |
| 40 to 44 Minutes | 0 | 0.0% |
| 45 to 59 Minutes | 130 | 14.6% |
| 60 to 89 Minutes | 33 | 3.7% |
| 90 or more Minutes | 9 | 1.0% |
Commute Time by Sex in Daingerfield
The most common commute times in Daingerfield are 15 to 19 minutes (79 commuters, 21.6%) for males and 25 to 29 minutes (91 commuters, 17.4%) for females.
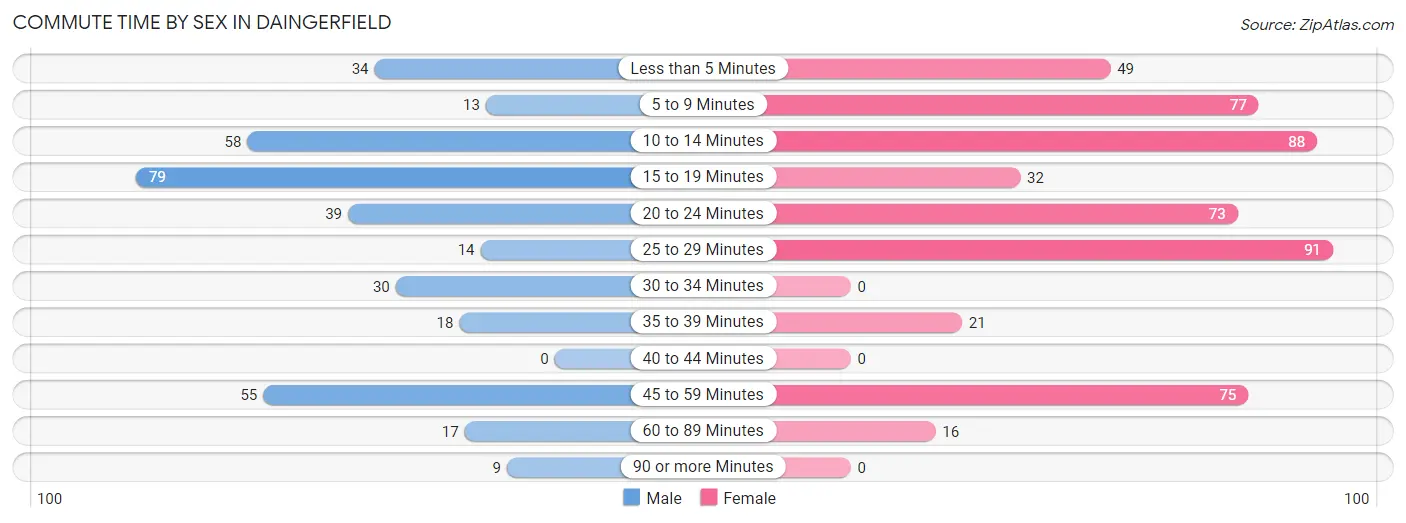
| Commute Time | Male | Female |
| Less than 5 Minutes | 34 (9.3%) | 49 (9.4%) |
| 5 to 9 Minutes | 13 (3.5%) | 77 (14.7%) |
| 10 to 14 Minutes | 58 (15.9%) | 88 (16.9%) |
| 15 to 19 Minutes | 79 (21.6%) | 32 (6.1%) |
| 20 to 24 Minutes | 39 (10.7%) | 73 (14.0%) |
| 25 to 29 Minutes | 14 (3.8%) | 91 (17.4%) |
| 30 to 34 Minutes | 30 (8.2%) | 0 (0.0%) |
| 35 to 39 Minutes | 18 (4.9%) | 21 (4.0%) |
| 40 to 44 Minutes | 0 (0.0%) | 0 (0.0%) |
| 45 to 59 Minutes | 55 (15.0%) | 75 (14.4%) |
| 60 to 89 Minutes | 17 (4.6%) | 16 (3.1%) |
| 90 or more Minutes | 9 (2.5%) | 0 (0.0%) |
Time of Departure to Work by Sex in Daingerfield
The most frequent times of departure to work in Daingerfield are 4:00 PM to 11:59 PM (92, 25.1%) for males and 7:00 AM to 7:29 AM (132, 25.3%) for females.
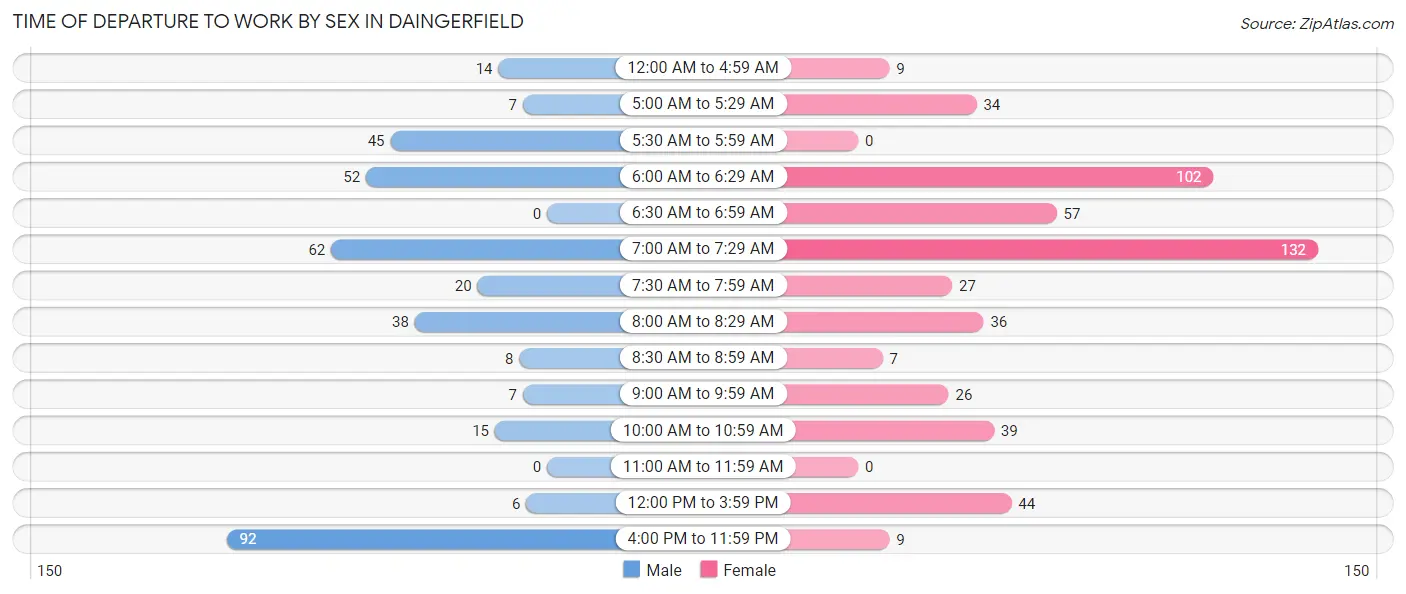
| Time of Departure | Male | Female |
| 12:00 AM to 4:59 AM | 14 (3.8%) | 9 (1.7%) |
| 5:00 AM to 5:29 AM | 7 (1.9%) | 34 (6.5%) |
| 5:30 AM to 5:59 AM | 45 (12.3%) | 0 (0.0%) |
| 6:00 AM to 6:29 AM | 52 (14.2%) | 102 (19.5%) |
| 6:30 AM to 6:59 AM | 0 (0.0%) | 57 (10.9%) |
| 7:00 AM to 7:29 AM | 62 (16.9%) | 132 (25.3%) |
| 7:30 AM to 7:59 AM | 20 (5.5%) | 27 (5.2%) |
| 8:00 AM to 8:29 AM | 38 (10.4%) | 36 (6.9%) |
| 8:30 AM to 8:59 AM | 8 (2.2%) | 7 (1.3%) |
| 9:00 AM to 9:59 AM | 7 (1.9%) | 26 (5.0%) |
| 10:00 AM to 10:59 AM | 15 (4.1%) | 39 (7.5%) |
| 11:00 AM to 11:59 AM | 0 (0.0%) | 0 (0.0%) |
| 12:00 PM to 3:59 PM | 6 (1.6%) | 44 (8.4%) |
| 4:00 PM to 11:59 PM | 92 (25.1%) | 9 (1.7%) |
| Total | 366 (100.0%) | 522 (100.0%) |
Housing Occupancy in Daingerfield
Occupancy by Ownership in Daingerfield
Of the total 966 dwellings in Daingerfield, owner-occupied units account for 642 (66.5%), while renter-occupied units make up 324 (33.5%).
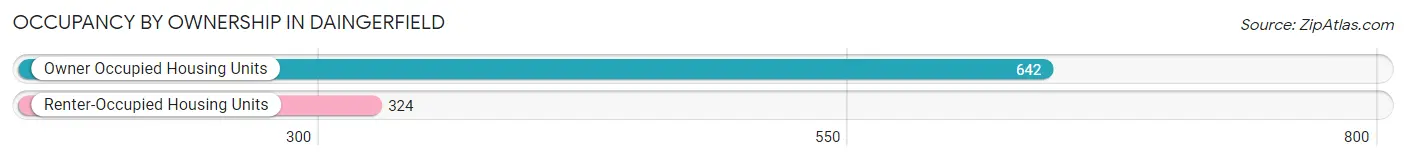
| Occupancy | # Housing Units | % Housing Units |
| Owner Occupied Housing Units | 642 | 66.5% |
| Renter-Occupied Housing Units | 324 | 33.5% |
| Total Occupied Housing Units | 966 | 100.0% |
Occupancy by Household Size in Daingerfield
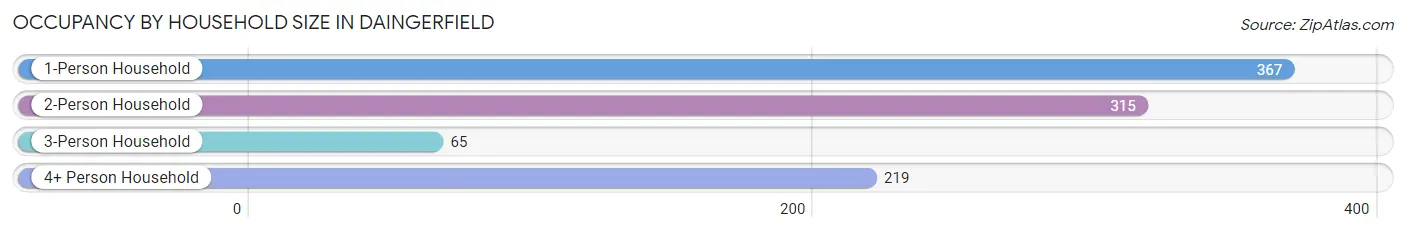
| Household Size | # Housing Units | % Housing Units |
| 1-Person Household | 367 | 38.0% |
| 2-Person Household | 315 | 32.6% |
| 3-Person Household | 65 | 6.7% |
| 4+ Person Household | 219 | 22.7% |
| Total Housing Units | 966 | 100.0% |
Occupancy by Ownership by Household Size in Daingerfield
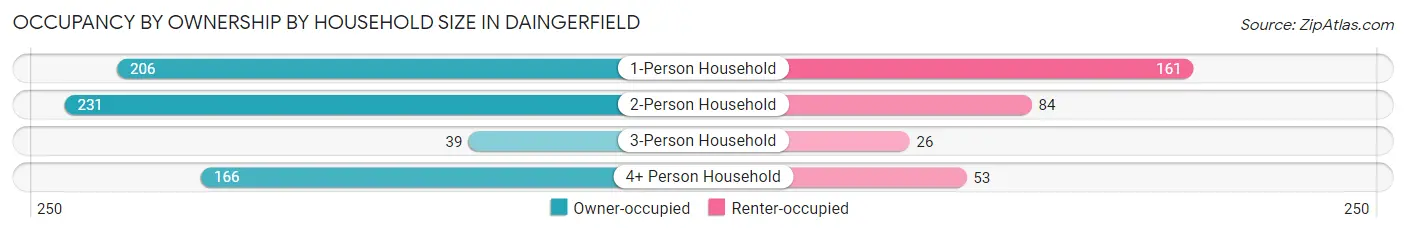
| Household Size | Owner-occupied | Renter-occupied |
| 1-Person Household | 206 (56.1%) | 161 (43.9%) |
| 2-Person Household | 231 (73.3%) | 84 (26.7%) |
| 3-Person Household | 39 (60.0%) | 26 (40.0%) |
| 4+ Person Household | 166 (75.8%) | 53 (24.2%) |
| Total Housing Units | 642 (66.5%) | 324 (33.5%) |
Occupancy by Educational Attainment in Daingerfield
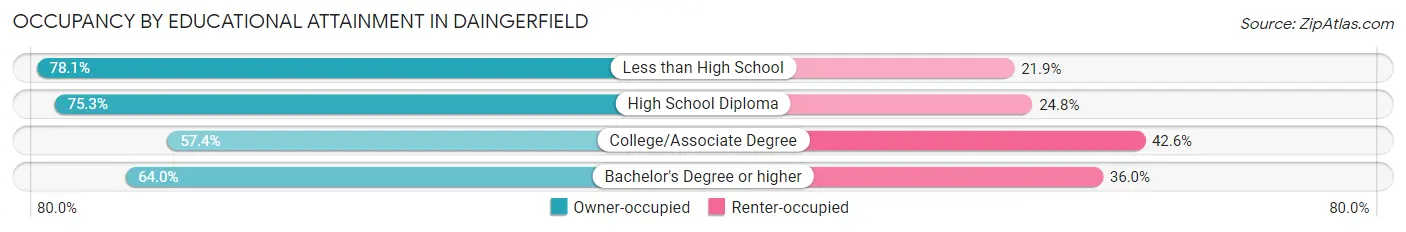
| Household Size | Owner-occupied | Renter-occupied |
| Less than High School | 82 (78.1%) | 23 (21.9%) |
| High School Diploma | 228 (75.2%) | 75 (24.7%) |
| College/Associate Degree | 218 (57.4%) | 162 (42.6%) |
| Bachelor's Degree or higher | 114 (64.0%) | 64 (36.0%) |
Occupancy by Age of Householder in Daingerfield
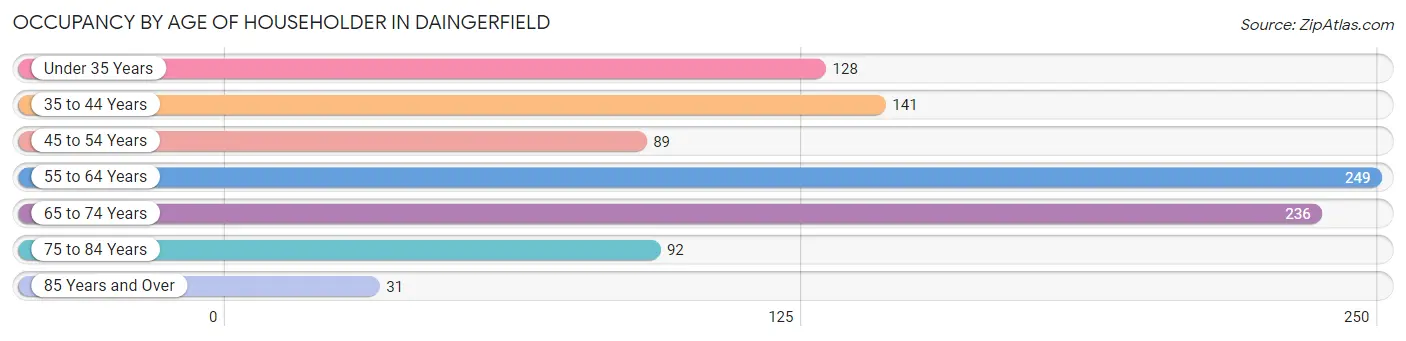
| Age Bracket | # Households | % Households |
| Under 35 Years | 128 | 13.3% |
| 35 to 44 Years | 141 | 14.6% |
| 45 to 54 Years | 89 | 9.2% |
| 55 to 64 Years | 249 | 25.8% |
| 65 to 74 Years | 236 | 24.4% |
| 75 to 84 Years | 92 | 9.5% |
| 85 Years and Over | 31 | 3.2% |
| Total | 966 | 100.0% |
Housing Finances in Daingerfield
Median Income by Occupancy in Daingerfield
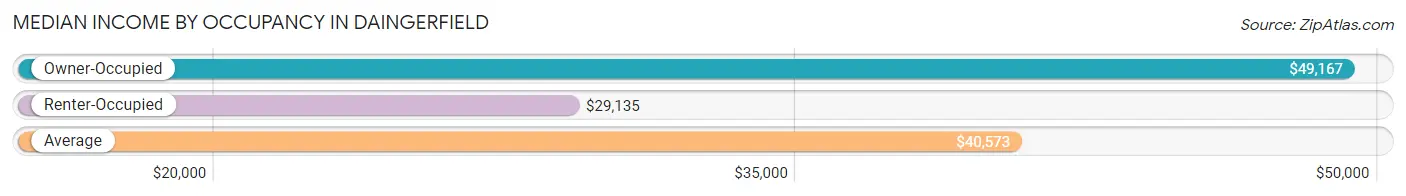
| Occupancy Type | # Households | Median Income |
| Owner-Occupied | 642 (66.5%) | $49,167 |
| Renter-Occupied | 324 (33.5%) | $29,135 |
| Average | 966 (100.0%) | $40,573 |
Occupancy by Householder Income Bracket in Daingerfield
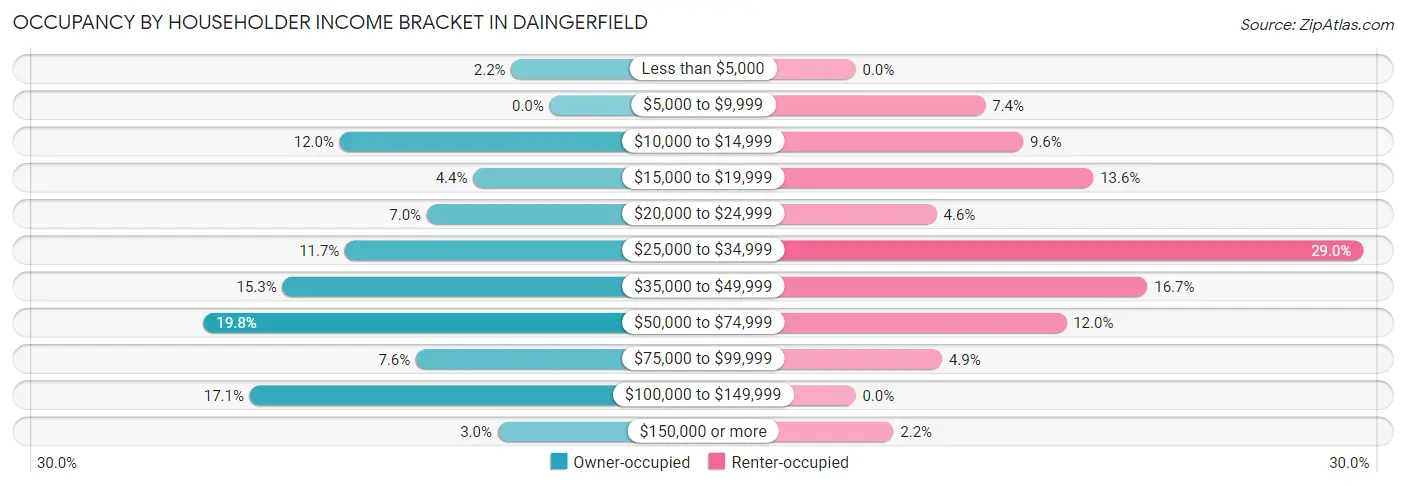
| Income Bracket | Owner-occupied | Renter-occupied |
| Less than $5,000 | 14 (2.2%) | 0 (0.0%) |
| $5,000 to $9,999 | 0 (0.0%) | 24 (7.4%) |
| $10,000 to $14,999 | 77 (12.0%) | 31 (9.6%) |
| $15,000 to $19,999 | 28 (4.4%) | 44 (13.6%) |
| $20,000 to $24,999 | 45 (7.0%) | 15 (4.6%) |
| $25,000 to $34,999 | 75 (11.7%) | 94 (29.0%) |
| $35,000 to $49,999 | 98 (15.3%) | 54 (16.7%) |
| $50,000 to $74,999 | 127 (19.8%) | 39 (12.0%) |
| $75,000 to $99,999 | 49 (7.6%) | 16 (4.9%) |
| $100,000 to $149,999 | 110 (17.1%) | 0 (0.0%) |
| $150,000 or more | 19 (3.0%) | 7 (2.2%) |
| Total | 642 (100.0%) | 324 (100.0%) |
Monthly Housing Cost Tiers in Daingerfield
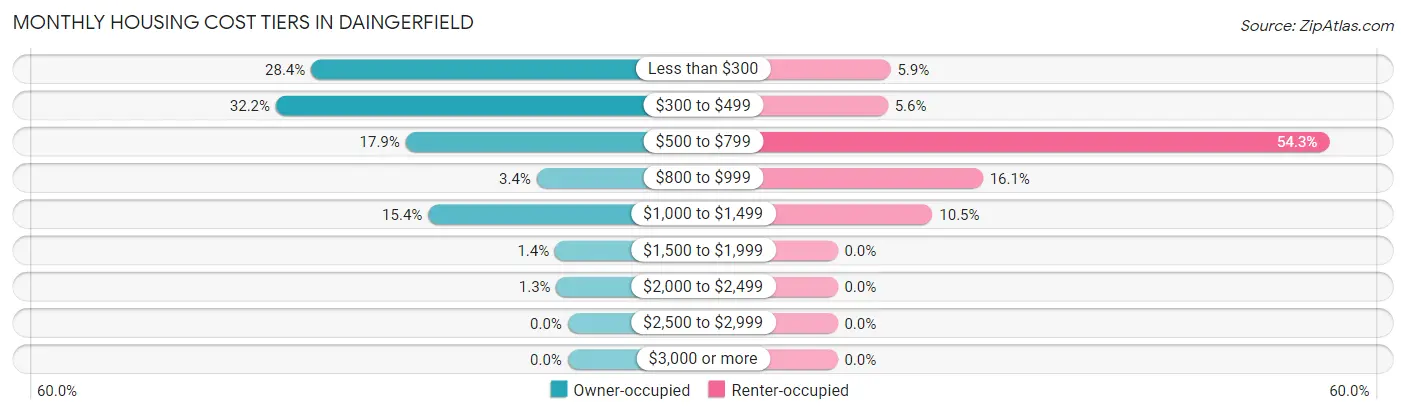
| Monthly Cost | Owner-occupied | Renter-occupied |
| Less than $300 | 182 (28.3%) | 19 (5.9%) |
| $300 to $499 | 207 (32.2%) | 18 (5.6%) |
| $500 to $799 | 115 (17.9%) | 176 (54.3%) |
| $800 to $999 | 22 (3.4%) | 52 (16.1%) |
| $1,000 to $1,499 | 99 (15.4%) | 34 (10.5%) |
| $1,500 to $1,999 | 9 (1.4%) | 0 (0.0%) |
| $2,000 to $2,499 | 8 (1.3%) | 0 (0.0%) |
| $2,500 to $2,999 | 0 (0.0%) | 0 (0.0%) |
| $3,000 or more | 0 (0.0%) | 0 (0.0%) |
| Total | 642 (100.0%) | 324 (100.0%) |
Physical Housing Characteristics in Daingerfield
Housing Structures in Daingerfield
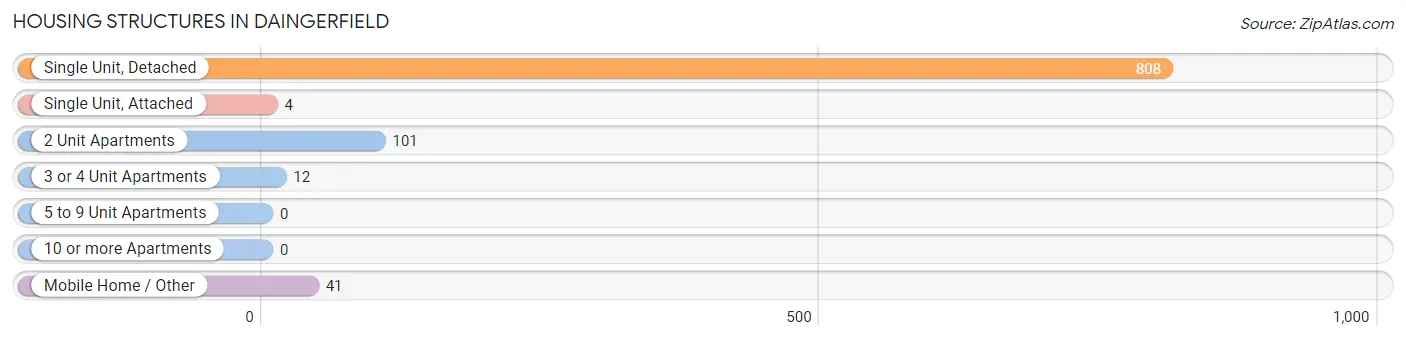
| Structure Type | # Housing Units | % Housing Units |
| Single Unit, Detached | 808 | 83.6% |
| Single Unit, Attached | 4 | 0.4% |
| 2 Unit Apartments | 101 | 10.5% |
| 3 or 4 Unit Apartments | 12 | 1.2% |
| 5 to 9 Unit Apartments | 0 | 0.0% |
| 10 or more Apartments | 0 | 0.0% |
| Mobile Home / Other | 41 | 4.2% |
| Total | 966 | 100.0% |
Housing Structures by Occupancy in Daingerfield
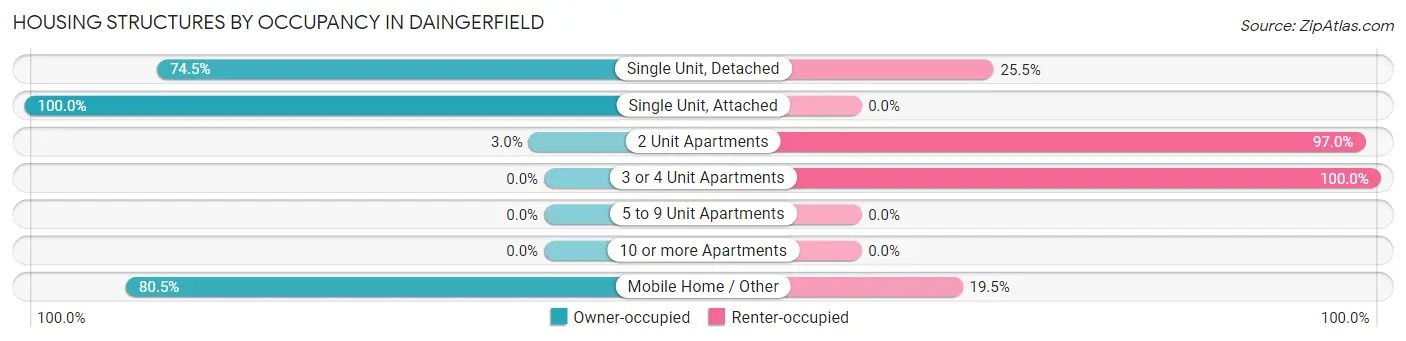
| Structure Type | Owner-occupied | Renter-occupied |
| Single Unit, Detached | 602 (74.5%) | 206 (25.5%) |
| Single Unit, Attached | 4 (100.0%) | 0 (0.0%) |
| 2 Unit Apartments | 3 (3.0%) | 98 (97.0%) |
| 3 or 4 Unit Apartments | 0 (0.0%) | 12 (100.0%) |
| 5 to 9 Unit Apartments | 0 (0.0%) | 0 (0.0%) |
| 10 or more Apartments | 0 (0.0%) | 0 (0.0%) |
| Mobile Home / Other | 33 (80.5%) | 8 (19.5%) |
| Total | 642 (66.5%) | 324 (33.5%) |
Housing Structures by Number of Rooms in Daingerfield
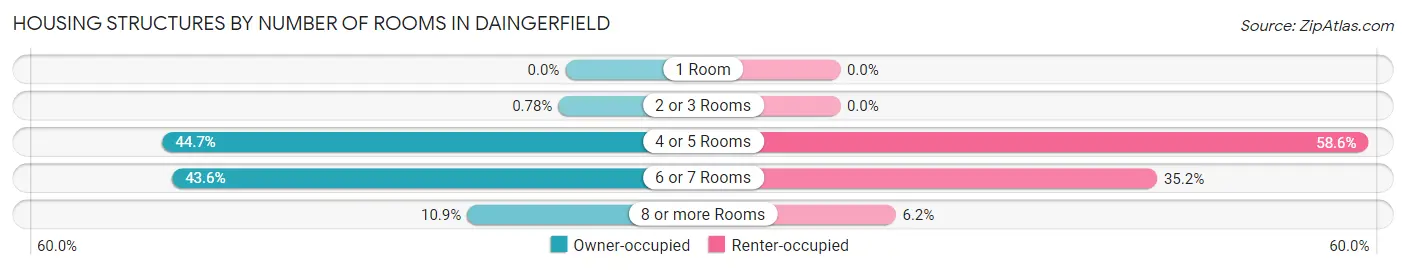
| Number of Rooms | Owner-occupied | Renter-occupied |
| 1 Room | 0 (0.0%) | 0 (0.0%) |
| 2 or 3 Rooms | 5 (0.8%) | 0 (0.0%) |
| 4 or 5 Rooms | 287 (44.7%) | 190 (58.6%) |
| 6 or 7 Rooms | 280 (43.6%) | 114 (35.2%) |
| 8 or more Rooms | 70 (10.9%) | 20 (6.2%) |
| Total | 642 (100.0%) | 324 (100.0%) |
Housing Structure by Heating Type in Daingerfield
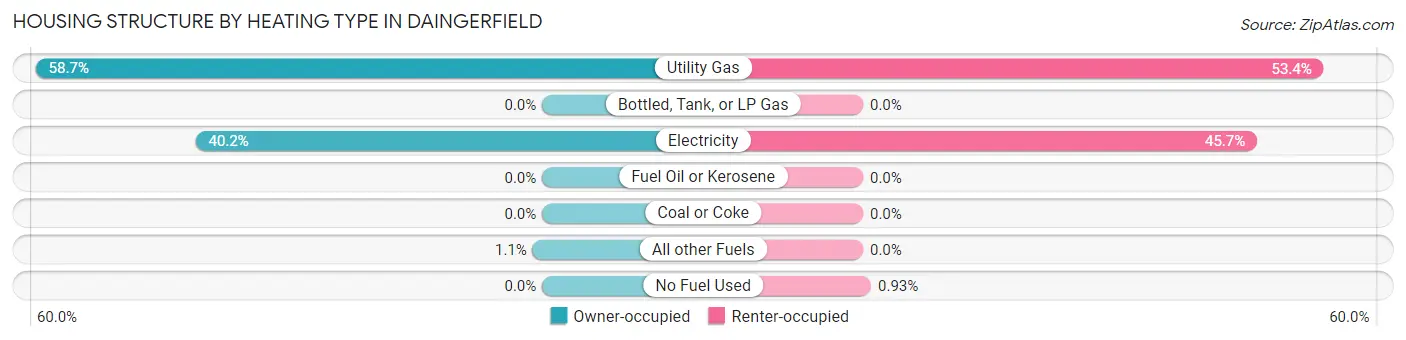
| Heating Type | Owner-occupied | Renter-occupied |
| Utility Gas | 377 (58.7%) | 173 (53.4%) |
| Bottled, Tank, or LP Gas | 0 (0.0%) | 0 (0.0%) |
| Electricity | 258 (40.2%) | 148 (45.7%) |
| Fuel Oil or Kerosene | 0 (0.0%) | 0 (0.0%) |
| Coal or Coke | 0 (0.0%) | 0 (0.0%) |
| All other Fuels | 7 (1.1%) | 0 (0.0%) |
| No Fuel Used | 0 (0.0%) | 3 (0.9%) |
| Total | 642 (100.0%) | 324 (100.0%) |
Household Vehicle Usage in Daingerfield
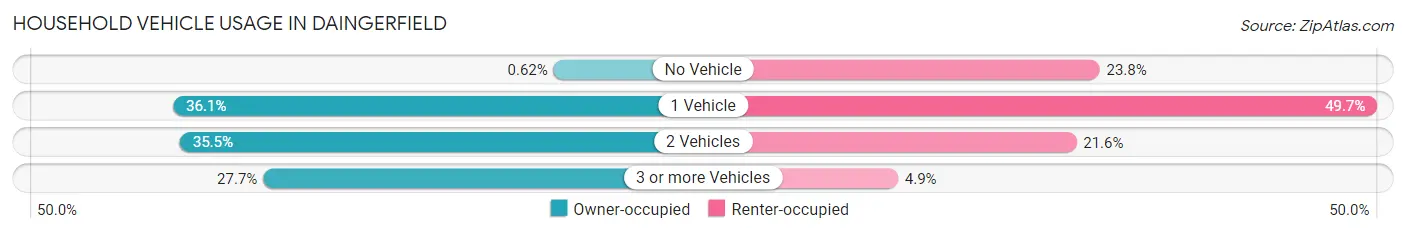
| Vehicles per Household | Owner-occupied | Renter-occupied |
| No Vehicle | 4 (0.6%) | 77 (23.8%) |
| 1 Vehicle | 232 (36.1%) | 161 (49.7%) |
| 2 Vehicles | 228 (35.5%) | 70 (21.6%) |
| 3 or more Vehicles | 178 (27.7%) | 16 (4.9%) |
| Total | 642 (100.0%) | 324 (100.0%) |
Real Estate & Mortgages in Daingerfield
Real Estate and Mortgage Overview in Daingerfield
| Characteristic | Without Mortgage | With Mortgage |
| Housing Units | 474 | 168 |
| Median Property Value | $56,400 | $119,200 |
| Median Household Income | $47,944 | $12 |
| Monthly Housing Costs | $365 | $0 |
| Real Estate Taxes | $751 | $18 |
Property Value by Mortgage Status in Daingerfield
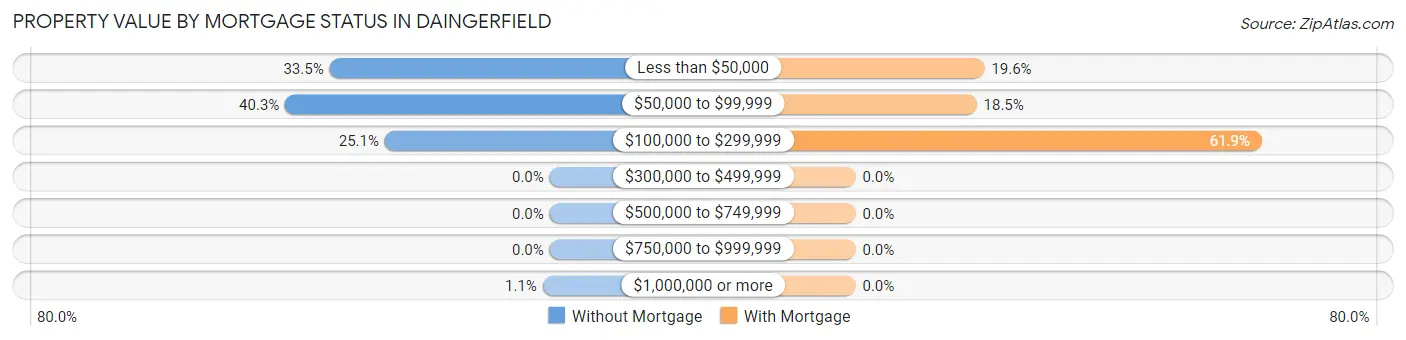
| Property Value | Without Mortgage | With Mortgage |
| Less than $50,000 | 159 (33.5%) | 33 (19.6%) |
| $50,000 to $99,999 | 191 (40.3%) | 31 (18.4%) |
| $100,000 to $299,999 | 119 (25.1%) | 104 (61.9%) |
| $300,000 to $499,999 | 0 (0.0%) | 0 (0.0%) |
| $500,000 to $749,999 | 0 (0.0%) | 0 (0.0%) |
| $750,000 to $999,999 | 0 (0.0%) | 0 (0.0%) |
| $1,000,000 or more | 5 (1.1%) | 0 (0.0%) |
| Total | 474 (100.0%) | 168 (100.0%) |
Household Income by Mortgage Status in Daingerfield
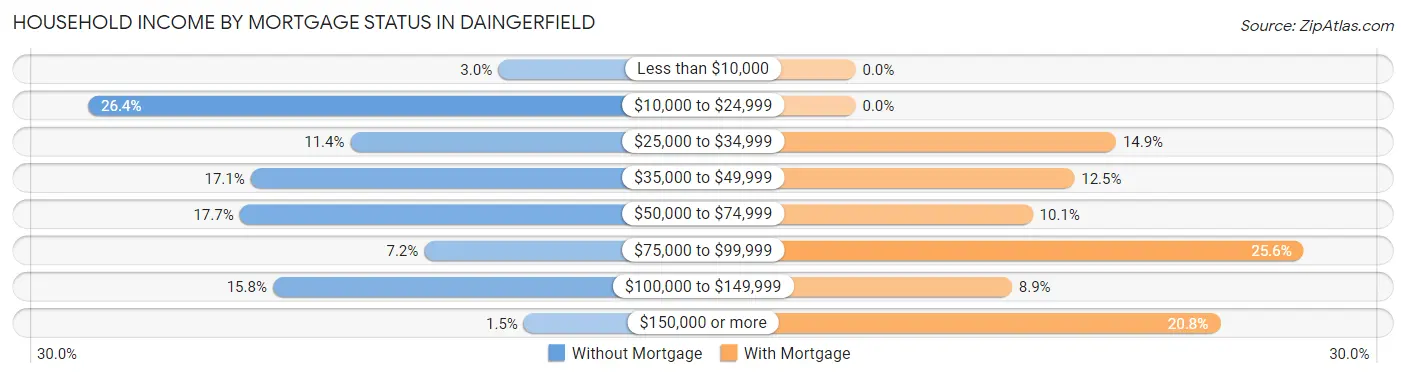
| Household Income | Without Mortgage | With Mortgage |
| Less than $10,000 | 14 (2.9%) | 0 (0.0%) |
| $10,000 to $24,999 | 125 (26.4%) | 0 (0.0%) |
| $25,000 to $34,999 | 54 (11.4%) | 25 (14.9%) |
| $35,000 to $49,999 | 81 (17.1%) | 21 (12.5%) |
| $50,000 to $74,999 | 84 (17.7%) | 17 (10.1%) |
| $75,000 to $99,999 | 34 (7.2%) | 43 (25.6%) |
| $100,000 to $149,999 | 75 (15.8%) | 15 (8.9%) |
| $150,000 or more | 7 (1.5%) | 35 (20.8%) |
| Total | 474 (100.0%) | 168 (100.0%) |
Property Value to Household Income Ratio in Daingerfield
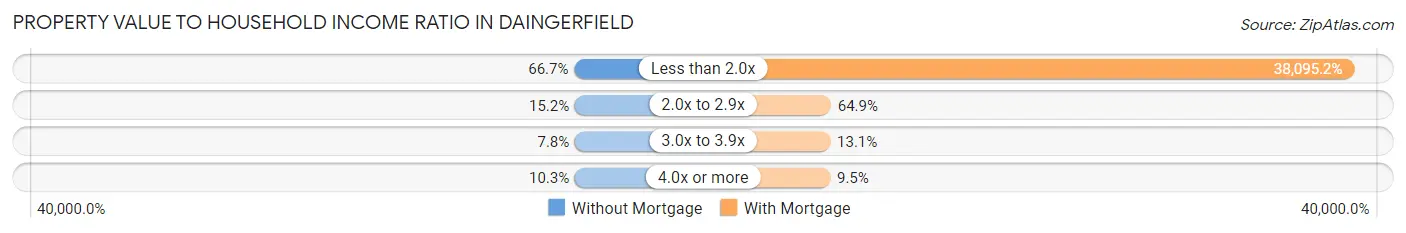
| Value-to-Income Ratio | Without Mortgage | With Mortgage |
| Less than 2.0x | 316 (66.7%) | 64,000 (38,095.2%) |
| 2.0x to 2.9x | 72 (15.2%) | 109 (64.9%) |
| 3.0x to 3.9x | 37 (7.8%) | 22 (13.1%) |
| 4.0x or more | 49 (10.3%) | 16 (9.5%) |
| Total | 474 (100.0%) | 168 (100.0%) |
Real Estate Taxes by Mortgage Status in Daingerfield
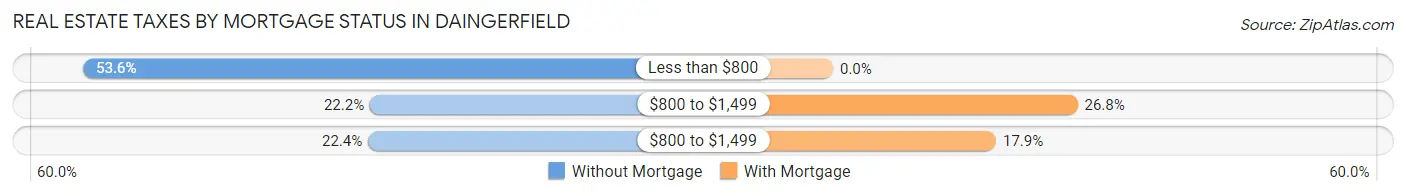
| Property Taxes | Without Mortgage | With Mortgage |
| Less than $800 | 254 (53.6%) | 0 (0.0%) |
| $800 to $1,499 | 105 (22.2%) | 45 (26.8%) |
| $800 to $1,499 | 106 (22.4%) | 30 (17.9%) |
| Total | 474 (100.0%) | 168 (100.0%) |
Health & Disability in Daingerfield
Health Insurance Coverage by Age in Daingerfield
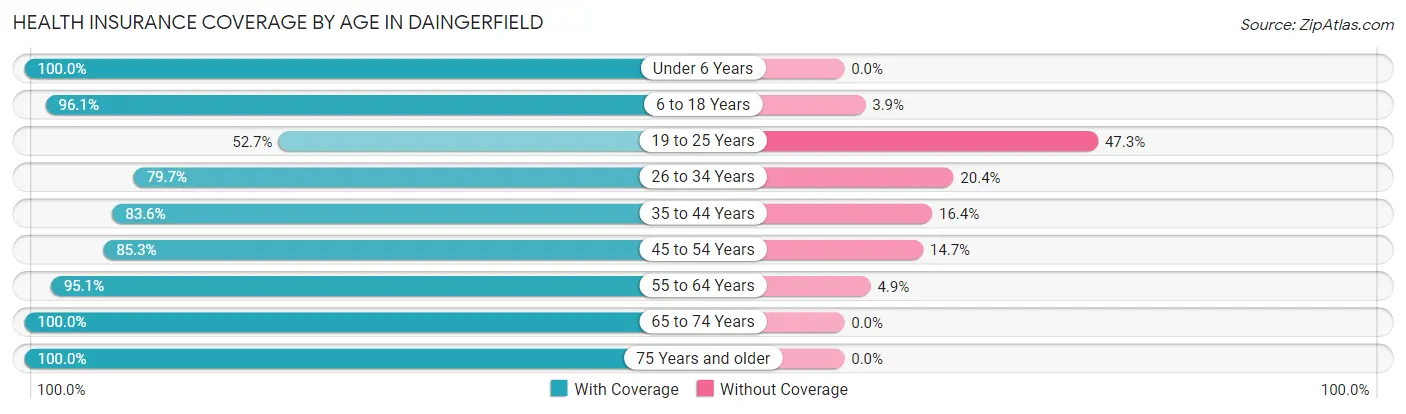
| Age Bracket | With Coverage | Without Coverage |
| Under 6 Years | 113 (100.0%) | 0 (0.0%) |
| 6 to 18 Years | 540 (96.1%) | 22 (3.9%) |
| 19 to 25 Years | 176 (52.7%) | 158 (47.3%) |
| 26 to 34 Years | 137 (79.6%) | 35 (20.3%) |
| 35 to 44 Years | 189 (83.6%) | 37 (16.4%) |
| 45 to 54 Years | 163 (85.3%) | 28 (14.7%) |
| 55 to 64 Years | 312 (95.1%) | 16 (4.9%) |
| 65 to 74 Years | 320 (100.0%) | 0 (0.0%) |
| 75 Years and older | 169 (100.0%) | 0 (0.0%) |
| Total | 2,119 (87.7%) | 296 (12.3%) |
Health Insurance Coverage by Citizenship Status in Daingerfield
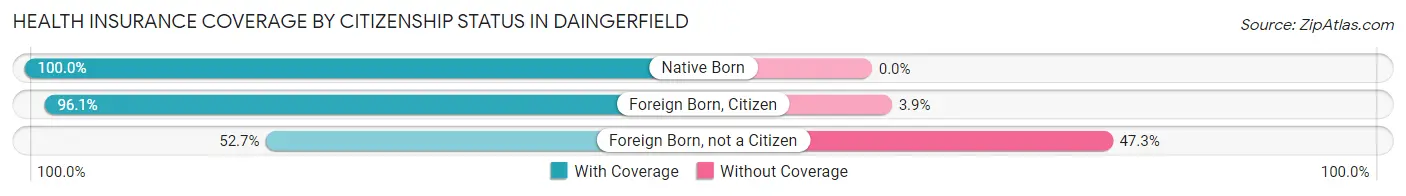
| Citizenship Status | With Coverage | Without Coverage |
| Native Born | 113 (100.0%) | 0 (0.0%) |
| Foreign Born, Citizen | 540 (96.1%) | 22 (3.9%) |
| Foreign Born, not a Citizen | 176 (52.7%) | 158 (47.3%) |
Health Insurance Coverage by Household Income in Daingerfield
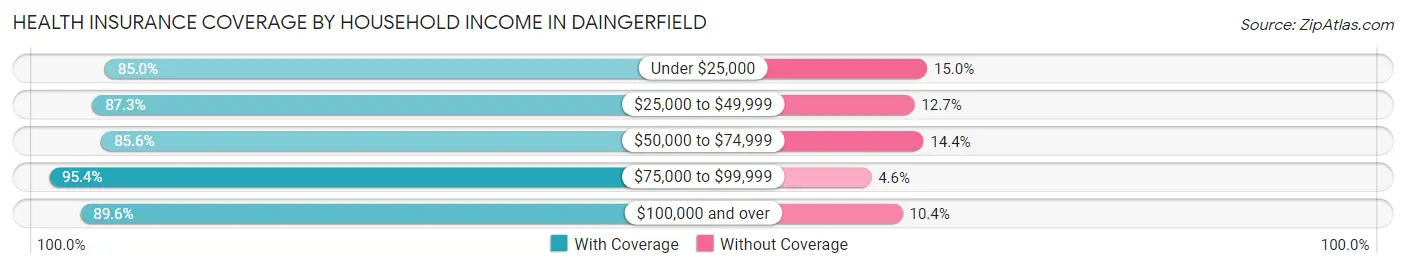
| Household Income | With Coverage | Without Coverage |
| Under $25,000 | 384 (85.0%) | 68 (15.0%) |
| $25,000 to $49,999 | 675 (87.3%) | 98 (12.7%) |
| $50,000 to $74,999 | 322 (85.6%) | 54 (14.4%) |
| $75,000 to $99,999 | 146 (95.4%) | 7 (4.6%) |
| $100,000 and over | 592 (89.6%) | 69 (10.4%) |
Public vs Private Health Insurance Coverage by Age in Daingerfield
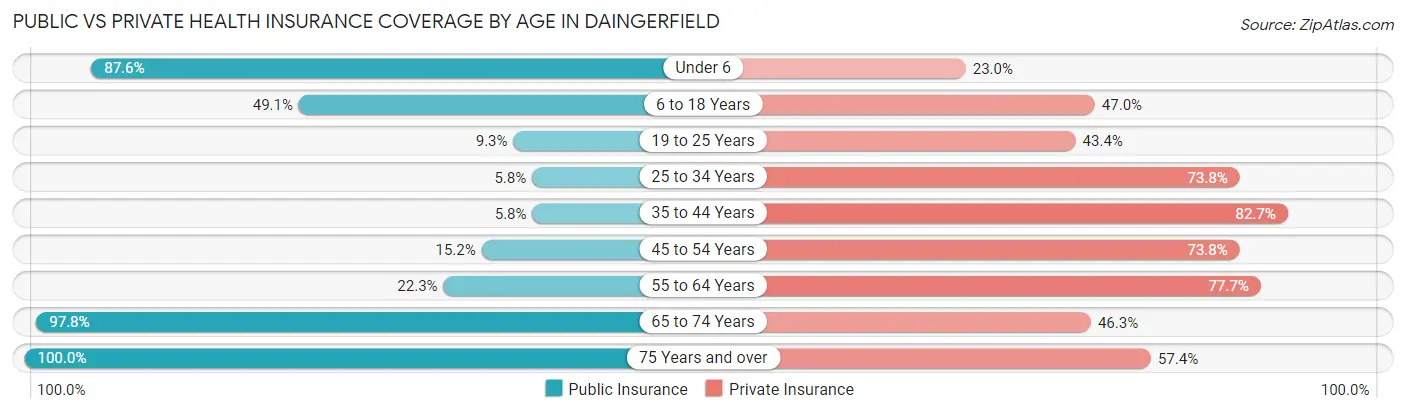
| Age Bracket | Public Insurance | Private Insurance |
| Under 6 | 99 (87.6%) | 26 (23.0%) |
| 6 to 18 Years | 276 (49.1%) | 264 (47.0%) |
| 19 to 25 Years | 31 (9.3%) | 145 (43.4%) |
| 25 to 34 Years | 10 (5.8%) | 127 (73.8%) |
| 35 to 44 Years | 13 (5.8%) | 187 (82.7%) |
| 45 to 54 Years | 29 (15.2%) | 141 (73.8%) |
| 55 to 64 Years | 73 (22.3%) | 255 (77.7%) |
| 65 to 74 Years | 313 (97.8%) | 148 (46.3%) |
| 75 Years and over | 169 (100.0%) | 97 (57.4%) |
| Total | 1,013 (41.9%) | 1,390 (57.6%) |
Disability Status by Sex by Age in Daingerfield
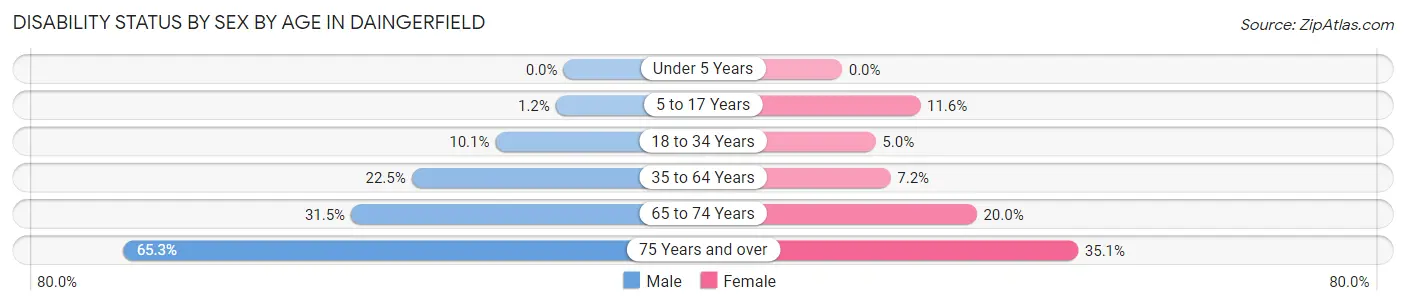
| Age Bracket | Male | Female |
| Under 5 Years | 0 (0.0%) | 0 (0.0%) |
| 5 to 17 Years | 3 (1.1%) | 33 (11.6%) |
| 18 to 34 Years | 21 (10.1%) | 17 (5.0%) |
| 35 to 64 Years | 71 (22.5%) | 31 (7.2%) |
| 65 to 74 Years | 41 (31.5%) | 38 (20.0%) |
| 75 Years and over | 47 (65.3%) | 34 (35.0%) |
Disability Class by Sex by Age in Daingerfield
Disability Class: Hearing Difficulty
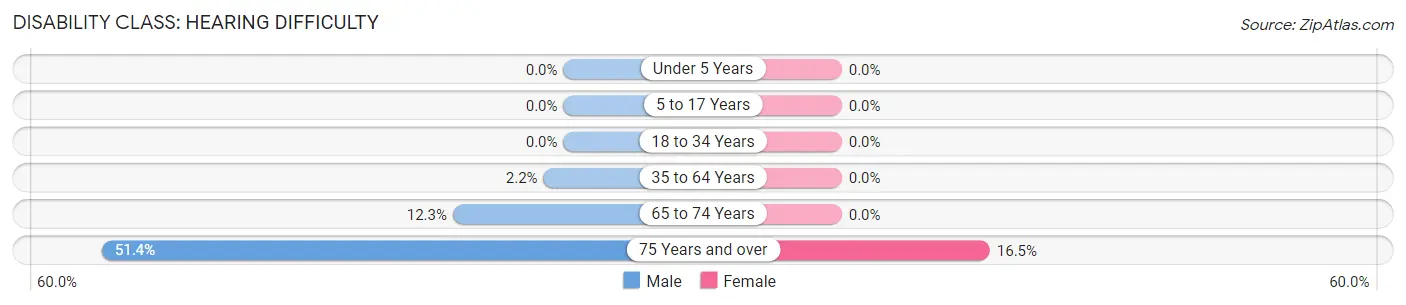
| Age Bracket | Male | Female |
| Under 5 Years | 0 (0.0%) | 0 (0.0%) |
| 5 to 17 Years | 0 (0.0%) | 0 (0.0%) |
| 18 to 34 Years | 0 (0.0%) | 0 (0.0%) |
| 35 to 64 Years | 7 (2.2%) | 0 (0.0%) |
| 65 to 74 Years | 16 (12.3%) | 0 (0.0%) |
| 75 Years and over | 37 (51.4%) | 16 (16.5%) |
Disability Class: Vision Difficulty
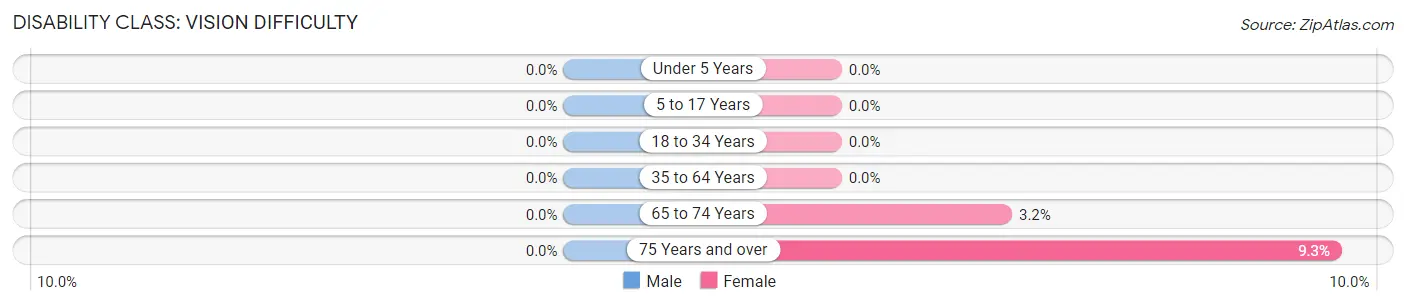
| Age Bracket | Male | Female |
| Under 5 Years | 0 (0.0%) | 0 (0.0%) |
| 5 to 17 Years | 0 (0.0%) | 0 (0.0%) |
| 18 to 34 Years | 0 (0.0%) | 0 (0.0%) |
| 35 to 64 Years | 0 (0.0%) | 0 (0.0%) |
| 65 to 74 Years | 0 (0.0%) | 6 (3.2%) |
| 75 Years and over | 0 (0.0%) | 9 (9.3%) |
Disability Class: Cognitive Difficulty
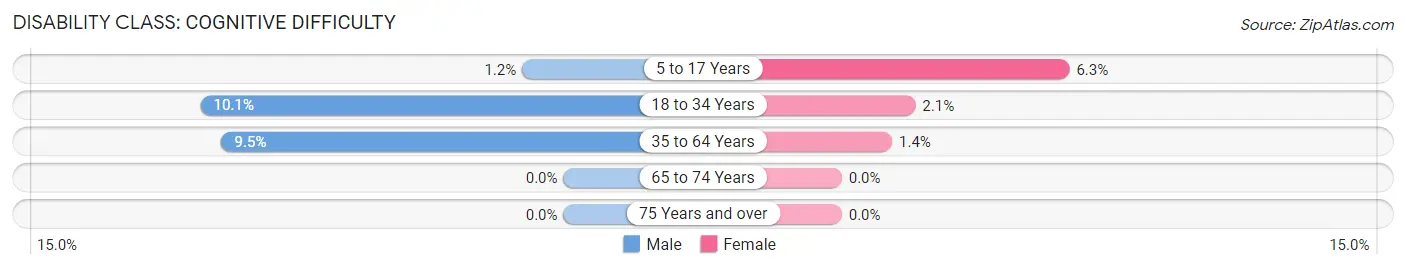
| Age Bracket | Male | Female |
| 5 to 17 Years | 3 (1.1%) | 18 (6.3%) |
| 18 to 34 Years | 21 (10.1%) | 7 (2.1%) |
| 35 to 64 Years | 30 (9.5%) | 6 (1.4%) |
| 65 to 74 Years | 0 (0.0%) | 0 (0.0%) |
| 75 Years and over | 0 (0.0%) | 0 (0.0%) |
Disability Class: Ambulatory Difficulty
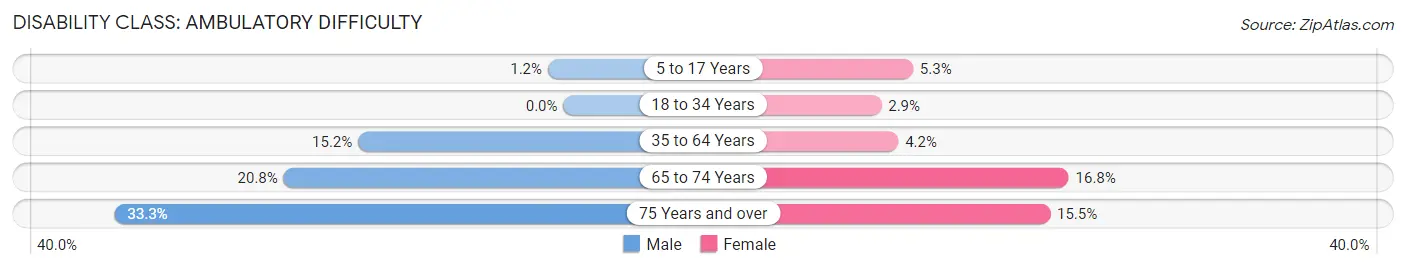
| Age Bracket | Male | Female |
| 5 to 17 Years | 3 (1.1%) | 15 (5.3%) |
| 18 to 34 Years | 0 (0.0%) | 10 (2.9%) |
| 35 to 64 Years | 48 (15.2%) | 18 (4.2%) |
| 65 to 74 Years | 27 (20.8%) | 32 (16.8%) |
| 75 Years and over | 24 (33.3%) | 15 (15.5%) |
Disability Class: Self-Care Difficulty
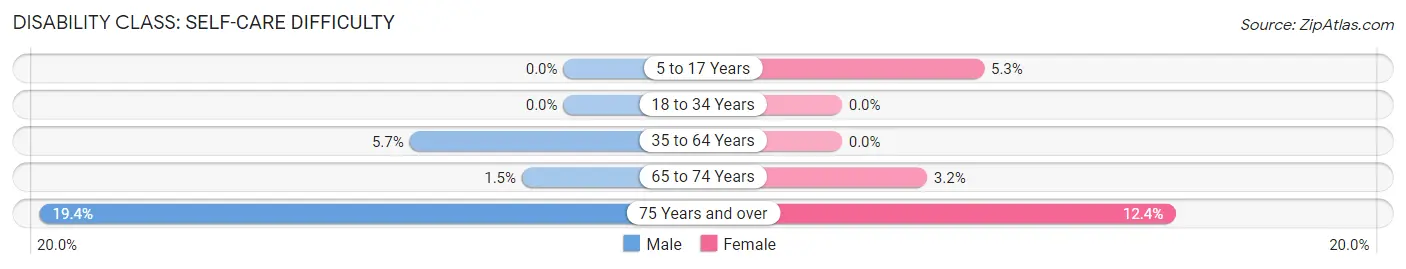
| Age Bracket | Male | Female |
| 5 to 17 Years | 0 (0.0%) | 15 (5.3%) |
| 18 to 34 Years | 0 (0.0%) | 0 (0.0%) |
| 35 to 64 Years | 18 (5.7%) | 0 (0.0%) |
| 65 to 74 Years | 2 (1.5%) | 6 (3.2%) |
| 75 Years and over | 14 (19.4%) | 12 (12.4%) |
Technology Access in Daingerfield
Computing Device Access in Daingerfield
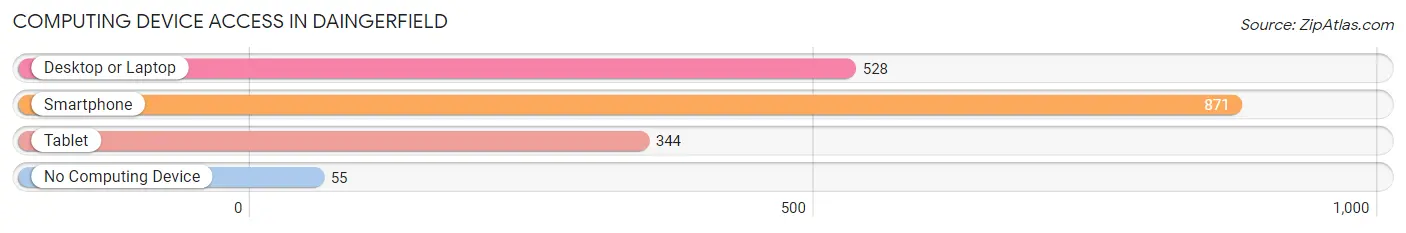
| Device Type | # Households | % Households |
| Desktop or Laptop | 528 | 54.7% |
| Smartphone | 871 | 90.2% |
| Tablet | 344 | 35.6% |
| No Computing Device | 55 | 5.7% |
| Total | 966 | 100.0% |
Internet Access in Daingerfield
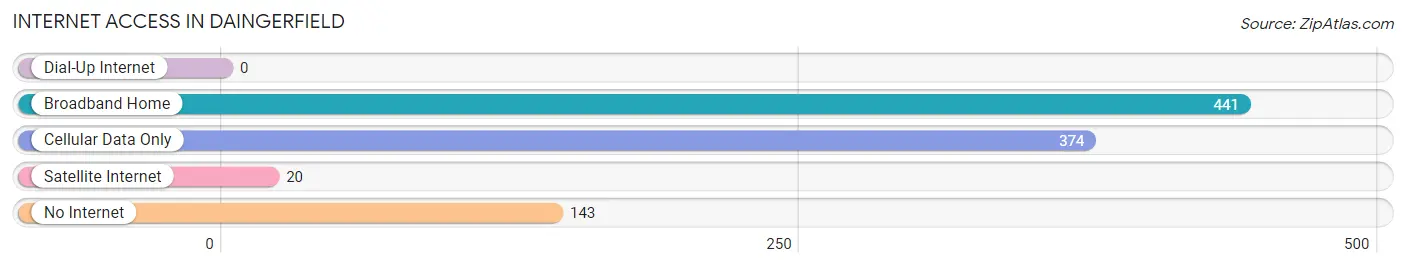
| Internet Type | # Households | % Households |
| Dial-Up Internet | 0 | 0.0% |
| Broadband Home | 441 | 45.7% |
| Cellular Data Only | 374 | 38.7% |
| Satellite Internet | 20 | 2.1% |
| No Internet | 143 | 14.8% |
| Total | 966 | 100.0% |
Daingerfield Summary
Daingerfield is a small town located in Morris County, Texas, United States. It is situated in the northeast corner of the state, about 100 miles east of Dallas. The population was 2,560 at the 2010 census.
History
Daingerfield was founded in 1845 by a group of settlers from Tennessee. The town was named after William D. Daingerfield, a prominent lawyer and politician from the area. The town was incorporated in 1876 and has remained a small, rural community ever since.
The town was an important stop on the Texas and Pacific Railway, which ran through the area in the late 19th century. The railroad brought economic growth to the area, and the town became a center for cotton production.
Geography
Daingerfield is located at 33°25'25" North, 94°51'45" West (33.423, -94.862). The town is situated in the northeast corner of the state, about 100 miles east of Dallas.
The town is located in the Piney Woods region of Texas, and is surrounded by rolling hills and forests. The area is known for its abundance of wildlife, including deer, wild turkeys, and other game animals.
Economy
The economy of Daingerfield is largely based on agriculture and timber production. The town is home to several large farms, as well as several small businesses.
The town is also home to a number of manufacturing companies, including a paper mill, a furniture factory, and a plastics plant.
Demographics
As of the 2010 census, the population of Daingerfield was 2,560. The racial makeup of the town was 79.3% White, 17.2% African American, 0.7% Native American, 0.3% Asian, 0.1% Pacific Islander, and 2.4% from other races.
The median household income in Daingerfield was $31,250, and the median family income was $37,500. The per capita income was $17,845. About 17.2% of the population was below the poverty line.
Conclusion
Daingerfield is a small town located in Morris County, Texas, United States. It was founded in 1845 and has remained a small, rural community ever since. The town is situated in the northeast corner of the state, about 100 miles east of Dallas. The economy of Daingerfield is largely based on agriculture and timber production, and the town is home to several large farms, as well as several small businesses. As of the 2010 census, the population of Daingerfield was 2,560. The median household income in Daingerfield was $31,250, and the median family income was $37,500. The per capita income was $17,845. About 17.2% of the population was below the poverty line.
Common Questions
What is Per Capita Income in Daingerfield?
Per Capita income in Daingerfield is $21,374.
What is the Median Family Income in Daingerfield?
Median Family Income in Daingerfield is $52,500.
What is the Median Household income in Daingerfield?
Median Household Income in Daingerfield is $40,573.
What is Income or Wage Gap in Daingerfield?
Income or Wage Gap in Daingerfield is 4.9%.
Women in Daingerfield earn 95.1 cents for every dollar earned by a man.
What is Inequality or Gini Index in Daingerfield?
Inequality or Gini Index in Daingerfield is 0.41.
What is the Total Population of Daingerfield?
Total Population of Daingerfield is 2,502.
What is the Total Male Population of Daingerfield?
Total Male Population of Daingerfield is 1,090.
What is the Total Female Population of Daingerfield?
Total Female Population of Daingerfield is 1,412.
What is the Ratio of Males per 100 Females in Daingerfield?
There are 77.20 Males per 100 Females in Daingerfield.
What is the Ratio of Females per 100 Males in Daingerfield?
There are 129.54 Females per 100 Males in Daingerfield.
What is the Median Population Age in Daingerfield?
Median Population Age in Daingerfield is 38.3 Years.
What is the Average Family Size in Daingerfield
Average Family Size in Daingerfield is 3.4 People.
What is the Average Household Size in Daingerfield
Average Household Size in Daingerfield is 2.5 People.
How Large is the Labor Force in Daingerfield?
There are 1,021 People in the Labor Forcein in Daingerfield.
What is the Percentage of People in the Labor Force in Daingerfield?
52.1% of People are in the Labor Force in Daingerfield.
What is the Unemployment Rate in Daingerfield?
Unemployment Rate in Daingerfield is 8.9%.