Del Rio, TX Map & Demographics
Del Rio Map
Del Rio Overview
$24,540
PER CAPITA INCOME
$68,415
AVG FAMILY INCOME
$57,072
AVG HOUSEHOLD INCOME
34.9%
WAGE / INCOME GAP [ % ]
65.1¢/ $1
WAGE / INCOME GAP [ $ ]
$12,137
FAMILY INCOME DEFICIT
0.45
INEQUALITY / GINI INDEX
34,722
TOTAL POPULATION
18,054
MALE POPULATION
16,668
FEMALE POPULATION
108.32
MALES / 100 FEMALES
92.32
FEMALES / 100 MALES
32.9
MEDIAN AGE
3.3
AVG FAMILY SIZE
2.8
AVG HOUSEHOLD SIZE
15,404
LABOR FORCE [ PEOPLE ]
59.6%
PERCENT IN LABOR FORCE
2.6%
UNEMPLOYMENT RATE
Del Rio Zip Codes
Income in Del Rio
Income Overview in Del Rio
Per Capita Income in Del Rio is $24,540, while median incomes of families and households are $68,415 and $57,072 respectively.
| Characteristic | Number | Measure |
| Per Capita Income | 34,722 | $24,540 |
| Median Family Income | 8,624 | $68,415 |
| Mean Family Income | 8,624 | $81,335 |
| Median Household Income | 12,166 | $57,072 |
| Mean Household Income | 12,166 | $69,850 |
| Income Deficit | 8,624 | $12,137 |
| Wage / Income Gap (%) | 34,722 | 34.94% |
| Wage / Income Gap ($) | 34,722 | 65.06¢ per $1 |
| Gini / Inequality Index | 34,722 | 0.45 |
Earnings by Sex in Del Rio
Average Earnings in Del Rio are $32,764, $40,109 for men and $26,094 for women, a difference of 34.9%.

| Sex | Number | Average Earnings |
| Male | 9,105 (56.2%) | $40,109 |
| Female | 7,107 (43.8%) | $26,094 |
| Total | 16,212 (100.0%) | $32,764 |
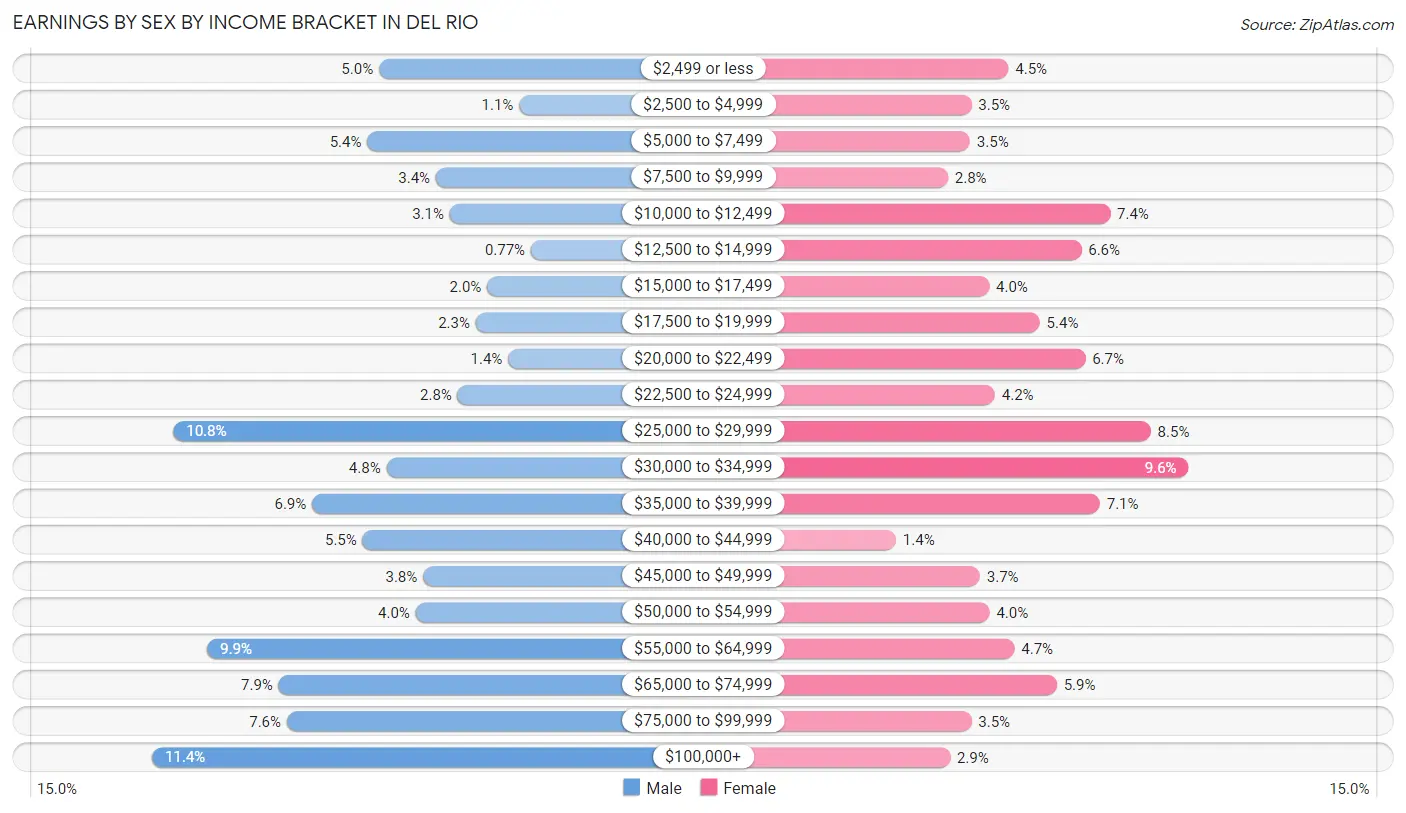
Earnings by Sex by Income Bracket in Del Rio
The most common earnings brackets in Del Rio are $100,000+ for men (1,040 | 11.4%) and $30,000 to $34,999 for women (682 | 9.6%).
| Income | Male | Female |
| $2,499 or less | 459 (5.0%) | 323 (4.5%) |
| $2,500 to $4,999 | 100 (1.1%) | 249 (3.5%) |
| $5,000 to $7,499 | 489 (5.4%) | 246 (3.5%) |
| $7,500 to $9,999 | 313 (3.4%) | 202 (2.8%) |
| $10,000 to $12,499 | 278 (3.0%) | 526 (7.4%) |
| $12,500 to $14,999 | 70 (0.8%) | 468 (6.6%) |
| $15,000 to $17,499 | 182 (2.0%) | 284 (4.0%) |
| $17,500 to $19,999 | 211 (2.3%) | 385 (5.4%) |
| $20,000 to $22,499 | 128 (1.4%) | 476 (6.7%) |
| $22,500 to $24,999 | 258 (2.8%) | 296 (4.2%) |
| $25,000 to $29,999 | 985 (10.8%) | 607 (8.5%) |
| $30,000 to $34,999 | 440 (4.8%) | 682 (9.6%) |
| $35,000 to $39,999 | 630 (6.9%) | 505 (7.1%) |
| $40,000 to $44,999 | 501 (5.5%) | 98 (1.4%) |
| $45,000 to $49,999 | 346 (3.8%) | 266 (3.7%) |
| $50,000 to $54,999 | 365 (4.0%) | 285 (4.0%) |
| $55,000 to $64,999 | 899 (9.9%) | 335 (4.7%) |
| $65,000 to $74,999 | 716 (7.9%) | 419 (5.9%) |
| $75,000 to $99,999 | 695 (7.6%) | 249 (3.5%) |
| $100,000+ | 1,040 (11.4%) | 206 (2.9%) |
| Total | 9,105 (100.0%) | 7,107 (100.0%) |
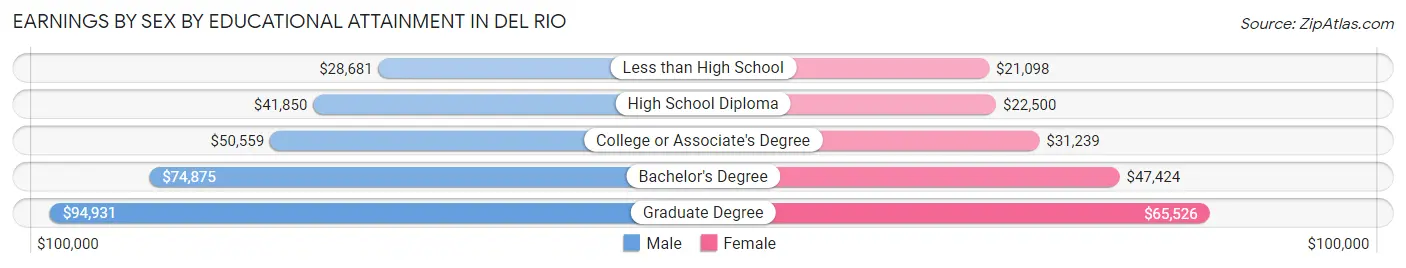
Earnings by Sex by Educational Attainment in Del Rio
Average earnings in Del Rio are $47,143 for men and $29,843 for women, a difference of 36.7%. Men with an educational attainment of graduate degree enjoy the highest average annual earnings of $94,931, while those with less than high school education earn the least with $28,681. Women with an educational attainment of graduate degree earn the most with the average annual earnings of $65,526, while those with less than high school education have the smallest earnings of $21,098.
| Educational Attainment | Male Income | Female Income |
| Less than High School | $28,681 | $21,098 |
| High School Diploma | $41,850 | $22,500 |
| College or Associate's Degree | $50,559 | $31,239 |
| Bachelor's Degree | $74,875 | $47,424 |
| Graduate Degree | $94,931 | $65,526 |
| Total | $47,143 | $29,843 |
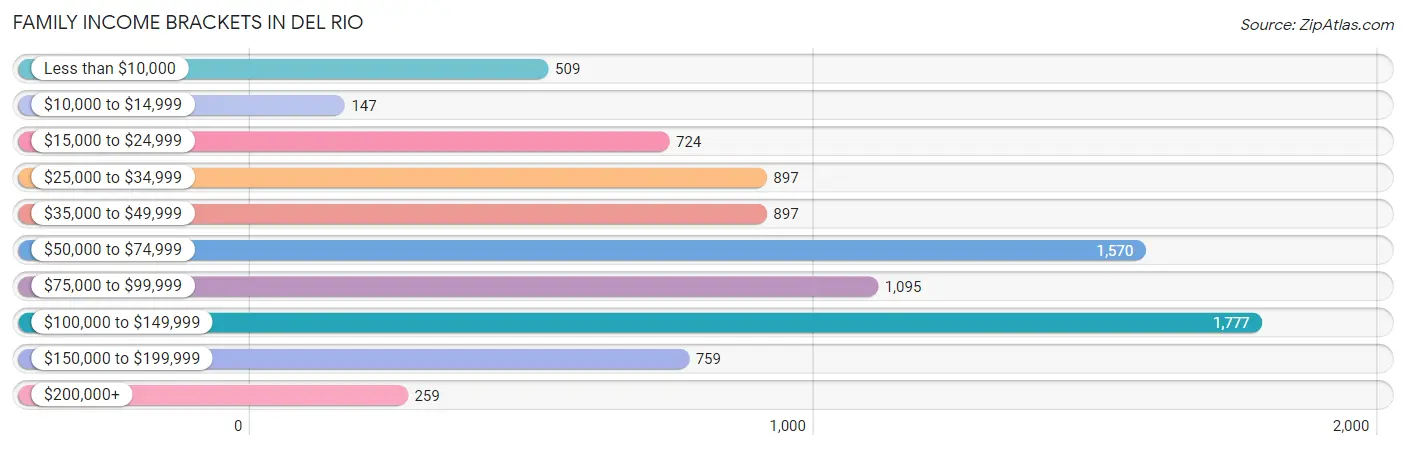
Family Income in Del Rio
Family Income Brackets in Del Rio
According to the Del Rio family income data, there are 1,777 families falling into the $100,000 to $149,999 income range, which is the most common income bracket and makes up 20.6% of all families. Conversely, the $10,000 to $14,999 income bracket is the least frequent group with only 147 families (1.7%) belonging to this category.
| Income Bracket | # Families | % Families |
| Less than $10,000 | 509 | 5.9% |
| $10,000 to $14,999 | 147 | 1.7% |
| $15,000 to $24,999 | 724 | 8.4% |
| $25,000 to $34,999 | 897 | 10.4% |
| $35,000 to $49,999 | 897 | 10.4% |
| $50,000 to $74,999 | 1,570 | 18.2% |
| $75,000 to $99,999 | 1,095 | 12.7% |
| $100,000 to $149,999 | 1,777 | 20.6% |
| $150,000 to $199,999 | 759 | 8.8% |
| $200,000+ | 259 | 3.0% |
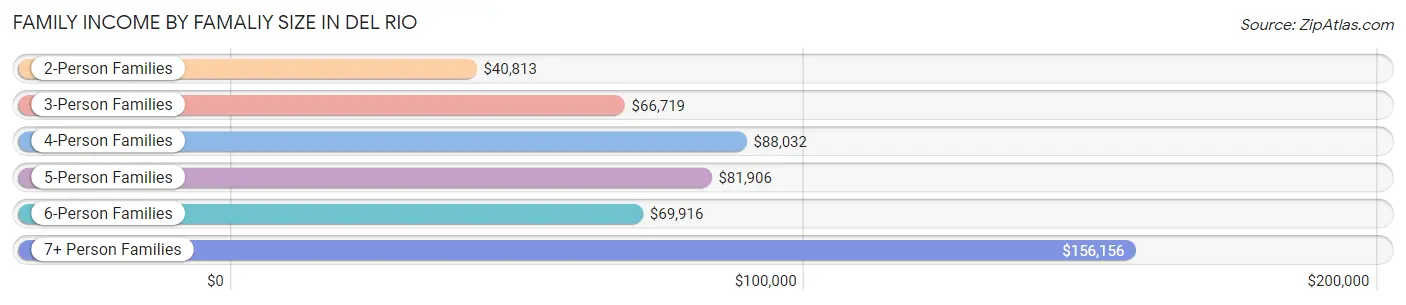
Family Income by Famaliy Size in Del Rio
7+ person families (146 | 1.7%) account for the highest median family income in Del Rio with $156,156 per family, while 7+ person families (146 | 1.7%) have the highest median income of $22,308 per family member.
| Income Bracket | # Families | Median Income |
| 2-Person Families | 2,946 (34.2%) | $40,813 |
| 3-Person Families | 1,666 (19.3%) | $66,719 |
| 4-Person Families | 2,032 (23.6%) | $88,032 |
| 5-Person Families | 1,299 (15.1%) | $81,906 |
| 6-Person Families | 535 (6.2%) | $69,916 |
| 7+ Person Families | 146 (1.7%) | $156,156 |
| Total | 8,624 (100.0%) | $68,415 |
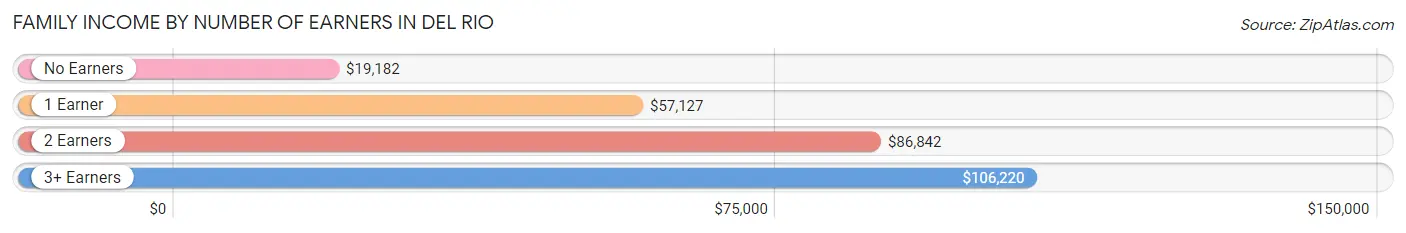
Family Income by Number of Earners in Del Rio
The median family income in Del Rio is $68,415, with families comprising 3+ earners (1,213) having the highest median family income of $106,220, while families with no earners (1,076) have the lowest median family income of $19,182, accounting for 14.1% and 12.5% of families, respectively.
| Number of Earners | # Families | Median Income |
| No Earners | 1,076 (12.5%) | $19,182 |
| 1 Earner | 3,277 (38.0%) | $57,127 |
| 2 Earners | 3,058 (35.5%) | $86,842 |
| 3+ Earners | 1,213 (14.1%) | $106,220 |
| Total | 8,624 (100.0%) | $68,415 |
Household Income in Del Rio
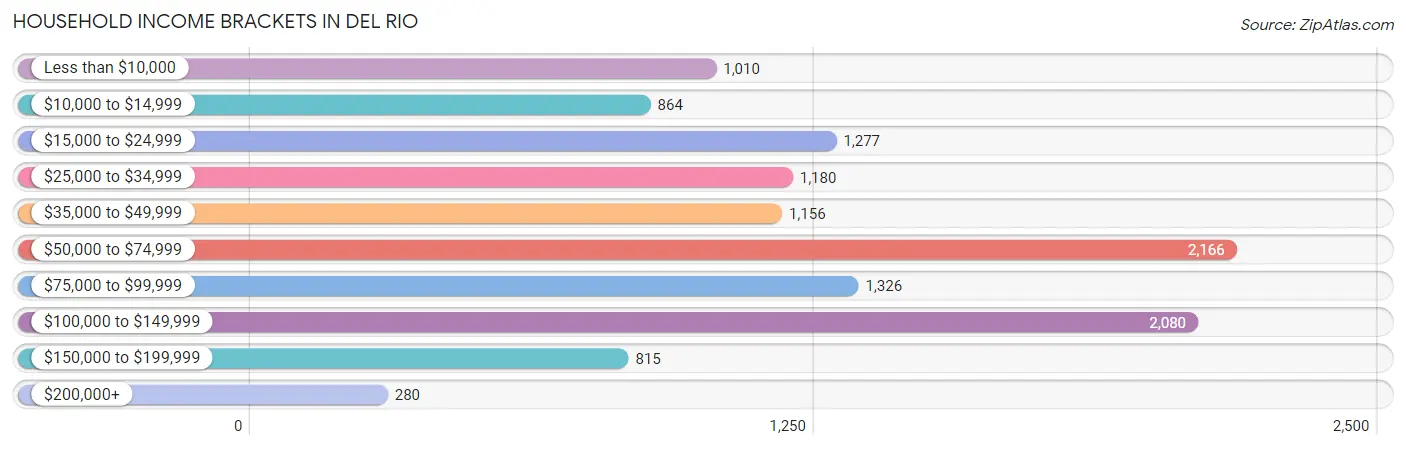
Household Income Brackets in Del Rio
With 2,166 households falling in the category, the $50,000 to $74,999 income range is the most frequent in Del Rio, accounting for 17.8% of all households. In contrast, only 280 households (2.3%) fall into the $200,000+ income bracket, making it the least populous group.
| Income Bracket | # Households | % Households |
| Less than $10,000 | 1,010 | 8.3% |
| $10,000 to $14,999 | 864 | 7.1% |
| $15,000 to $24,999 | 1,277 | 10.5% |
| $25,000 to $34,999 | 1,180 | 9.7% |
| $35,000 to $49,999 | 1,156 | 9.5% |
| $50,000 to $74,999 | 2,166 | 17.8% |
| $75,000 to $99,999 | 1,326 | 10.9% |
| $100,000 to $149,999 | 2,080 | 17.1% |
| $150,000 to $199,999 | 815 | 6.7% |
| $200,000+ | 280 | 2.3% |
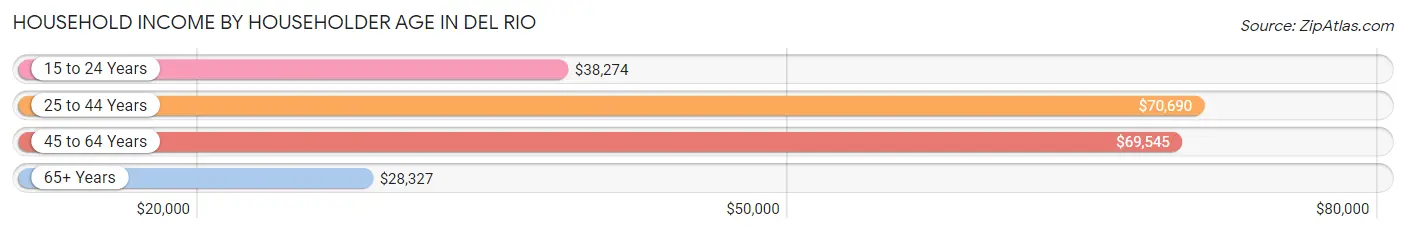
Household Income by Householder Age in Del Rio
The median household income in Del Rio is $57,072, with the highest median household income of $70,690 found in the 25 to 44 years age bracket for the primary householder. A total of 4,165 households (34.2%) fall into this category. Meanwhile, the 65+ years age bracket for the primary householder has the lowest median household income of $28,327, with 3,468 households (28.5%) in this group.
| Income Bracket | # Households | Median Income |
| 15 to 24 Years | 445 (3.7%) | $38,274 |
| 25 to 44 Years | 4,165 (34.2%) | $70,690 |
| 45 to 64 Years | 4,088 (33.6%) | $69,545 |
| 65+ Years | 3,468 (28.5%) | $28,327 |
| Total | 12,166 (100.0%) | $57,072 |
Poverty in Del Rio
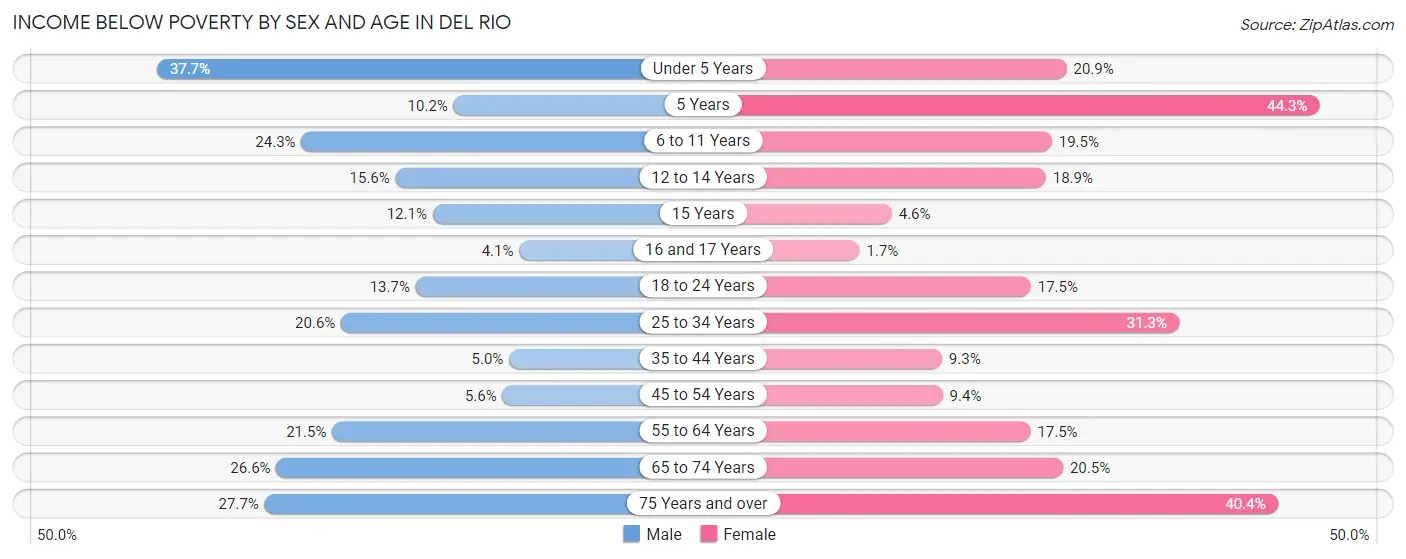
Income Below Poverty by Sex and Age in Del Rio
With 17.6% poverty level for males and 20.0% for females among the residents of Del Rio, under 5 year old males and 5 year old females are the most vulnerable to poverty, with 516 males (37.7%) and 148 females (44.3%) in their respective age groups living below the poverty level.
| Age Bracket | Male | Female |
| Under 5 Years | 516 (37.7%) | 276 (20.9%) |
| 5 Years | 39 (10.2%) | 148 (44.3%) |
| 6 to 11 Years | 362 (24.3%) | 301 (19.5%) |
| 12 to 14 Years | 168 (15.6%) | 148 (18.9%) |
| 15 Years | 20 (12.1%) | 16 (4.6%) |
| 16 and 17 Years | 25 (4.1%) | 8 (1.7%) |
| 18 to 24 Years | 269 (13.7%) | 249 (17.5%) |
| 25 to 34 Years | 480 (20.6%) | 646 (31.3%) |
| 35 to 44 Years | 106 (5.0%) | 175 (9.3%) |
| 45 to 54 Years | 102 (5.6%) | 159 (9.4%) |
| 55 to 64 Years | 341 (21.4%) | 295 (17.5%) |
| 65 to 74 Years | 282 (26.6%) | 308 (20.5%) |
| 75 Years and over | 278 (27.7%) | 562 (40.4%) |
| Total | 2,988 (17.6%) | 3,291 (20.0%) |
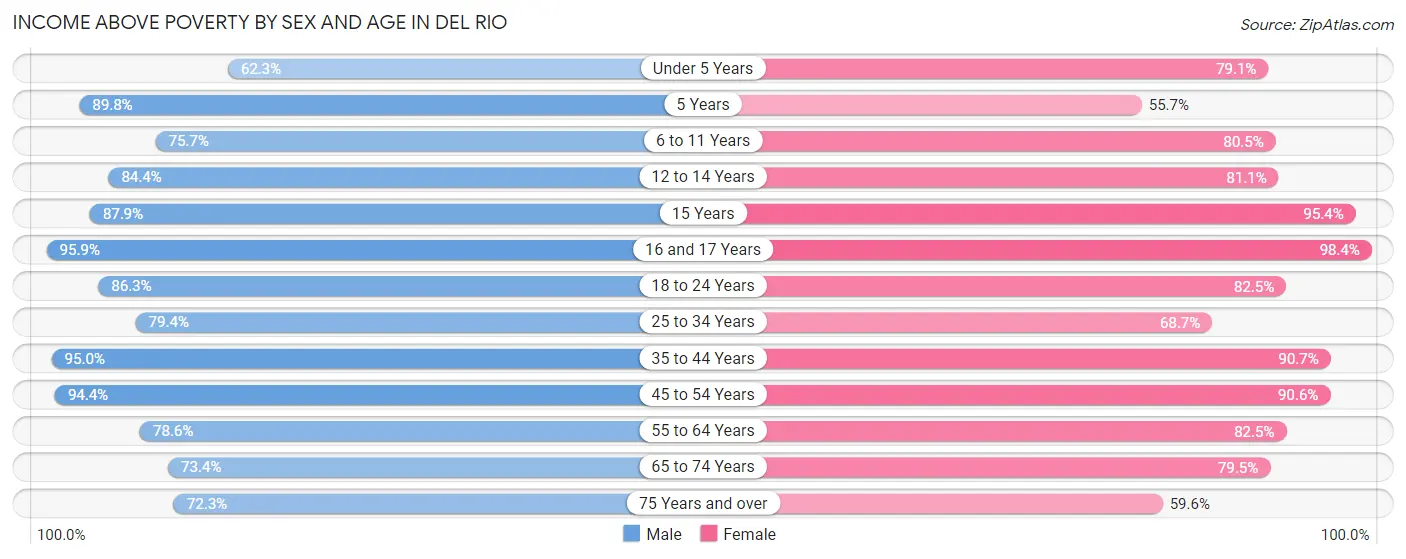
Income Above Poverty by Sex and Age in Del Rio
According to the poverty statistics in Del Rio, males aged 16 and 17 years and females aged 16 and 17 years are the age groups that are most secure financially, with 95.9% of males and 98.4% of females in these age groups living above the poverty line.
| Age Bracket | Male | Female |
| Under 5 Years | 852 (62.3%) | 1,047 (79.1%) |
| 5 Years | 344 (89.8%) | 186 (55.7%) |
| 6 to 11 Years | 1,127 (75.7%) | 1,243 (80.5%) |
| 12 to 14 Years | 911 (84.4%) | 634 (81.1%) |
| 15 Years | 145 (87.9%) | 329 (95.4%) |
| 16 and 17 Years | 586 (95.9%) | 476 (98.4%) |
| 18 to 24 Years | 1,695 (86.3%) | 1,171 (82.5%) |
| 25 to 34 Years | 1,848 (79.4%) | 1,420 (68.7%) |
| 35 to 44 Years | 2,001 (95.0%) | 1,708 (90.7%) |
| 45 to 54 Years | 1,706 (94.4%) | 1,539 (90.6%) |
| 55 to 64 Years | 1,249 (78.5%) | 1,390 (82.5%) |
| 65 to 74 Years | 777 (73.4%) | 1,192 (79.5%) |
| 75 Years and over | 725 (72.3%) | 828 (59.6%) |
| Total | 13,966 (82.4%) | 13,163 (80.0%) |
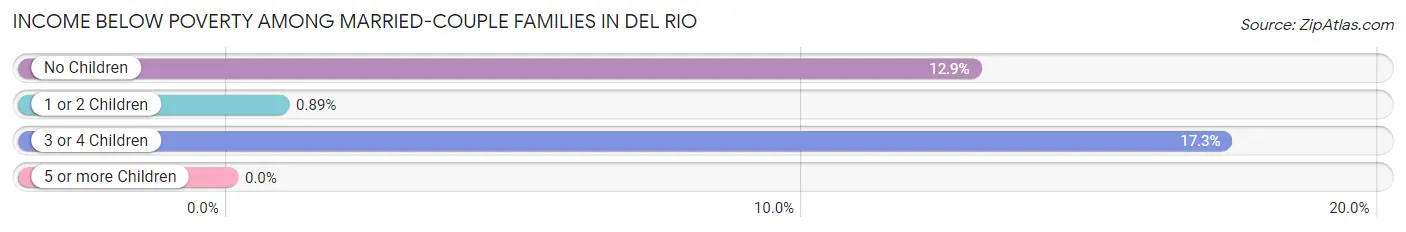
Income Below Poverty Among Married-Couple Families in Del Rio
The poverty statistics for married-couple families in Del Rio show that 9.0% or 512 of the total 5,708 families live below the poverty line. Families with 3 or 4 children have the highest poverty rate of 17.3%, comprising of 131 families. On the other hand, families with 5 or more children have the lowest poverty rate of 0.0%, which includes 0 families.
| Children | Above Poverty | Below Poverty |
| No Children | 2,435 (87.1%) | 362 (12.9%) |
| 1 or 2 Children | 2,112 (99.1%) | 19 (0.9%) |
| 3 or 4 Children | 626 (82.7%) | 131 (17.3%) |
| 5 or more Children | 23 (100.0%) | 0 (0.0%) |
| Total | 5,196 (91.0%) | 512 (9.0%) |
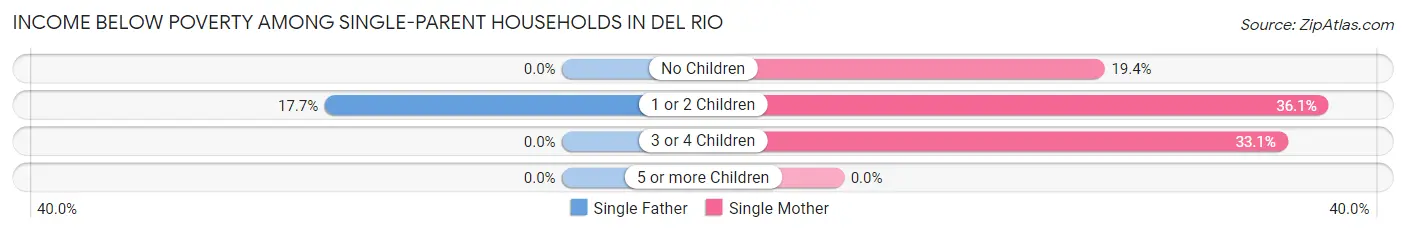
Income Below Poverty Among Single-Parent Households in Del Rio
According to the poverty data in Del Rio, 9.8% or 72 single-father households and 30.9% or 674 single-mother households are living below the poverty line. Among single-father households, those with 1 or 2 children have the highest poverty rate, with 72 households (17.7%) experiencing poverty. Likewise, among single-mother households, those with 1 or 2 children have the highest poverty rate, with 346 households (36.1%) falling below the poverty line.
| Children | Single Father | Single Mother |
| No Children | 0 (0.0%) | 109 (19.4%) |
| 1 or 2 Children | 72 (17.7%) | 346 (36.1%) |
| 3 or 4 Children | 0 (0.0%) | 219 (33.1%) |
| 5 or more Children | 0 (0.0%) | 0 (0.0%) |
| Total | 72 (9.8%) | 674 (30.9%) |
Income Below Poverty Among Married-Couple vs Single-Parent Households in Del Rio
The poverty data for Del Rio shows that 512 of the married-couple family households (9.0%) and 746 of the single-parent households (25.6%) are living below the poverty level. Within the married-couple family households, those with 3 or 4 children have the highest poverty rate, with 131 households (17.3%) falling below the poverty line. Among the single-parent households, those with 1 or 2 children have the highest poverty rate, with 418 household (30.6%) living below poverty.
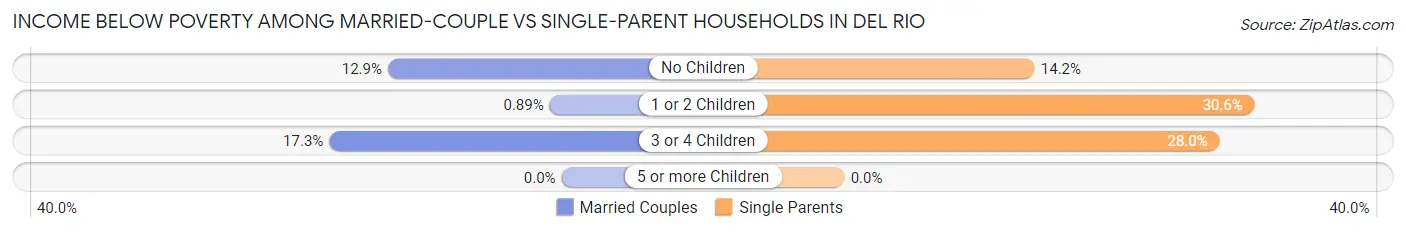
| Children | Married-Couple Families | Single-Parent Households |
| No Children | 362 (12.9%) | 109 (14.2%) |
| 1 or 2 Children | 19 (0.9%) | 418 (30.6%) |
| 3 or 4 Children | 131 (17.3%) | 219 (28.0%) |
| 5 or more Children | 0 (0.0%) | 0 (0.0%) |
| Total | 512 (9.0%) | 746 (25.6%) |
Race in Del Rio
The most populous races in Del Rio are Hispanic or Latino (30,225 | 87.1%), White / Caucasian (25,206 | 72.6%), and Two or more Races (5,389 | 15.5%).
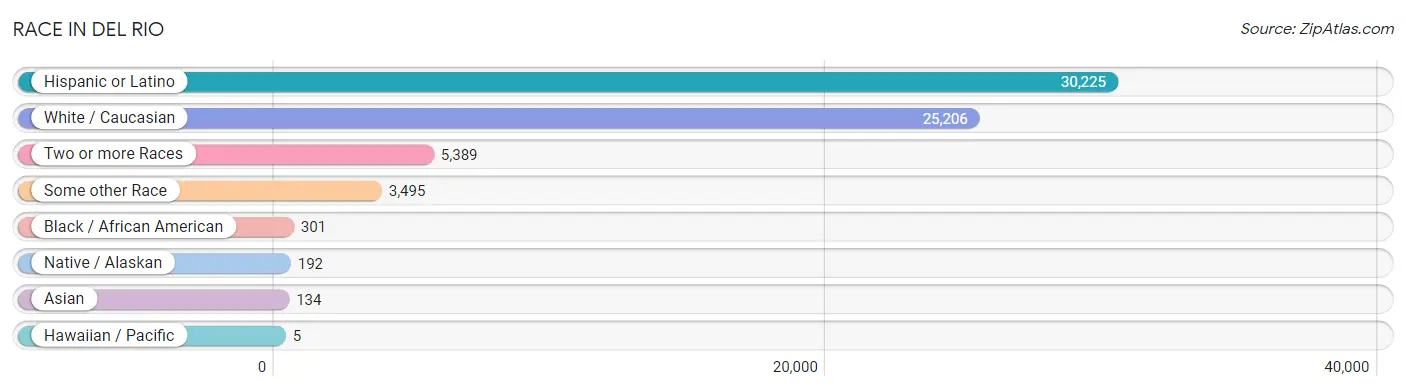
| Race | # Population | % Population |
| Asian | 134 | 0.4% |
| Black / African American | 301 | 0.9% |
| Hawaiian / Pacific | 5 | 0.0% |
| Hispanic or Latino | 30,225 | 87.1% |
| Native / Alaskan | 192 | 0.5% |
| White / Caucasian | 25,206 | 72.6% |
| Two or more Races | 5,389 | 15.5% |
| Some other Race | 3,495 | 10.1% |
| Total | 34,722 | 100.0% |
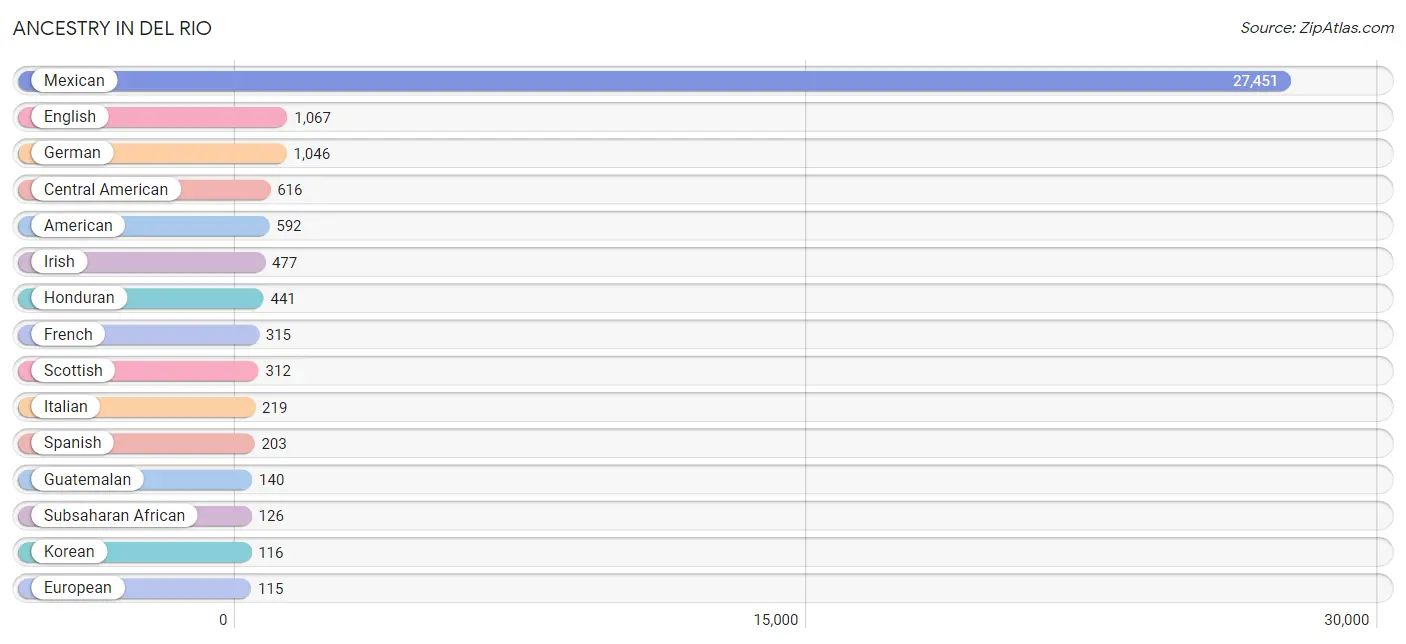
Ancestry in Del Rio
The most populous ancestries reported in Del Rio are Mexican (27,451 | 79.1%), English (1,067 | 3.1%), German (1,046 | 3.0%), Central American (616 | 1.8%), and American (592 | 1.7%), together accounting for 88.6% of all Del Rio residents.
| Ancestry | # Population | % Population |
| African | 111 | 0.3% |
| American | 592 | 1.7% |
| Apache | 39 | 0.1% |
| Arab | 88 | 0.3% |
| Austrian | 14 | 0.0% |
| Bhutanese | 63 | 0.2% |
| British | 66 | 0.2% |
| Burmese | 21 | 0.1% |
| Canadian | 5 | 0.0% |
| Central American | 616 | 1.8% |
| Choctaw | 22 | 0.1% |
| Cuban | 88 | 0.3% |
| Czech | 32 | 0.1% |
| Dominican | 16 | 0.1% |
| Dutch West Indian | 14 | 0.0% |
| Eastern European | 30 | 0.1% |
| Ecuadorian | 33 | 0.1% |
| English | 1,067 | 3.1% |
| European | 115 | 0.3% |
| Filipino | 37 | 0.1% |
| French | 315 | 0.9% |
| French Canadian | 10 | 0.0% |
| German | 1,046 | 3.0% |
| Greek | 13 | 0.0% |
| Guatemalan | 140 | 0.4% |
| Haitian | 3 | 0.0% |
| Honduran | 441 | 1.3% |
| Icelander | 14 | 0.0% |
| Irish | 477 | 1.4% |
| Italian | 219 | 0.6% |
| Korean | 116 | 0.3% |
| Laotian | 5 | 0.0% |
| Mexican | 27,451 | 79.1% |
| Mexican American Indian | 15 | 0.0% |
| Native Hawaiian | 5 | 0.0% |
| Navajo | 30 | 0.1% |
| Nigerian | 15 | 0.0% |
| Northern European | 74 | 0.2% |
| Norwegian | 57 | 0.2% |
| Peruvian | 59 | 0.2% |
| Polish | 91 | 0.3% |
| Portuguese | 85 | 0.2% |
| Puerto Rican | 112 | 0.3% |
| Russian | 5 | 0.0% |
| Salvadoran | 35 | 0.1% |
| Scandinavian | 67 | 0.2% |
| Scotch-Irish | 10 | 0.0% |
| Scottish | 312 | 0.9% |
| Seminole | 54 | 0.2% |
| South American | 92 | 0.3% |
| Spaniard | 92 | 0.3% |
| Spanish | 203 | 0.6% |
| Spanish American | 34 | 0.1% |
| Spanish American Indian | 40 | 0.1% |
| Subsaharan African | 126 | 0.4% |
| Swedish | 63 | 0.2% |
| Thai | 10 | 0.0% |
| Welsh | 12 | 0.0% |
| Yaqui | 11 | 0.0% | View All 59 Rows |
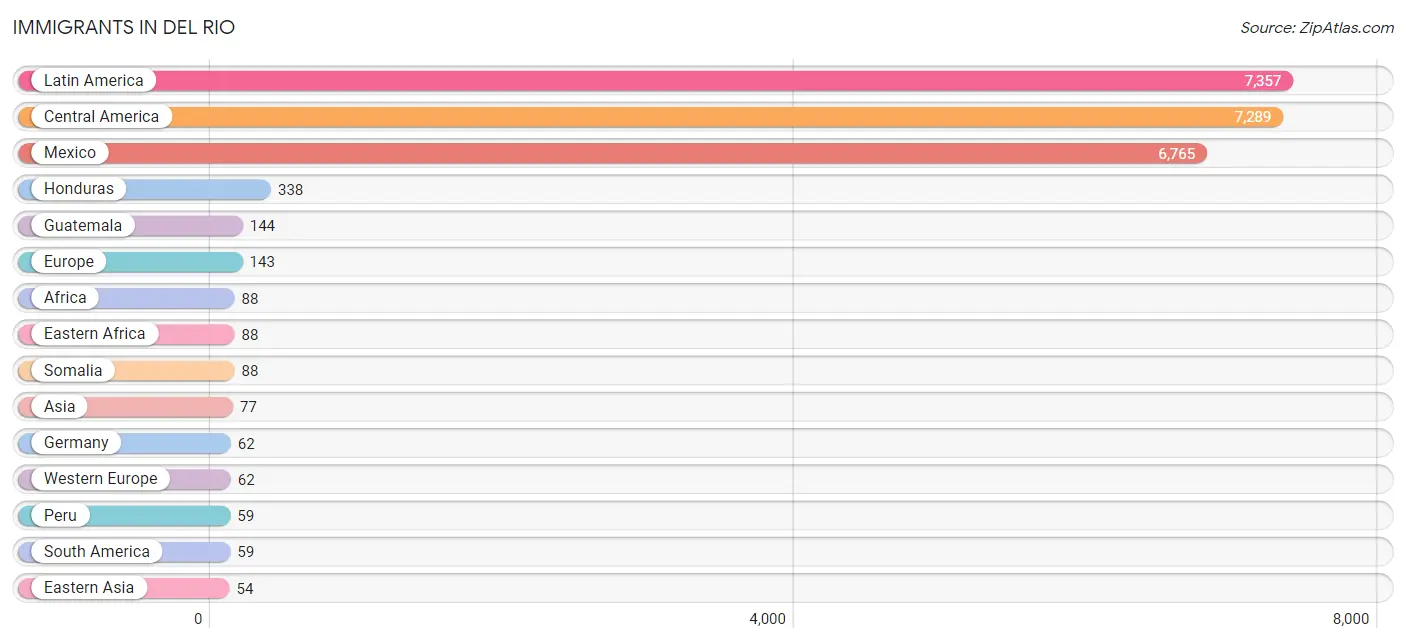
Immigrants in Del Rio
The most numerous immigrant groups reported in Del Rio came from Latin America (7,357 | 21.2%), Central America (7,289 | 21.0%), Mexico (6,765 | 19.5%), Honduras (338 | 1.0%), and Guatemala (144 | 0.4%), together accounting for 63.0% of all Del Rio residents.
| Immigration Origin | # Population | % Population |
| Africa | 88 | 0.3% |
| Asia | 77 | 0.2% |
| Caribbean | 9 | 0.0% |
| Central America | 7,289 | 21.0% |
| China | 15 | 0.0% |
| Eastern Africa | 88 | 0.3% |
| Eastern Asia | 54 | 0.2% |
| El Salvador | 42 | 0.1% |
| England | 4 | 0.0% |
| Europe | 143 | 0.4% |
| Germany | 62 | 0.2% |
| Guatemala | 144 | 0.4% |
| Haiti | 9 | 0.0% |
| Honduras | 338 | 1.0% |
| India | 10 | 0.0% |
| Indonesia | 5 | 0.0% |
| Ireland | 3 | 0.0% |
| Japan | 2 | 0.0% |
| Korea | 37 | 0.1% |
| Latin America | 7,357 | 21.2% |
| Mexico | 6,765 | 19.5% |
| Northern Europe | 44 | 0.1% |
| Oceania | 27 | 0.1% |
| Peru | 59 | 0.2% |
| Philippines | 8 | 0.0% |
| Scotland | 37 | 0.1% |
| Somalia | 88 | 0.3% |
| South America | 59 | 0.2% |
| South Central Asia | 10 | 0.0% |
| South Eastern Asia | 13 | 0.0% |
| Southern Europe | 37 | 0.1% |
| Spain | 37 | 0.1% |
| Taiwan | 15 | 0.0% |
| Western Europe | 62 | 0.2% | View All 34 Rows |
Sex and Age in Del Rio
Sex and Age in Del Rio
The most populous age groups in Del Rio are 10 to 14 Years (1,778 | 9.9%) for men and 5 to 9 Years (1,376 | 8.3%) for women.
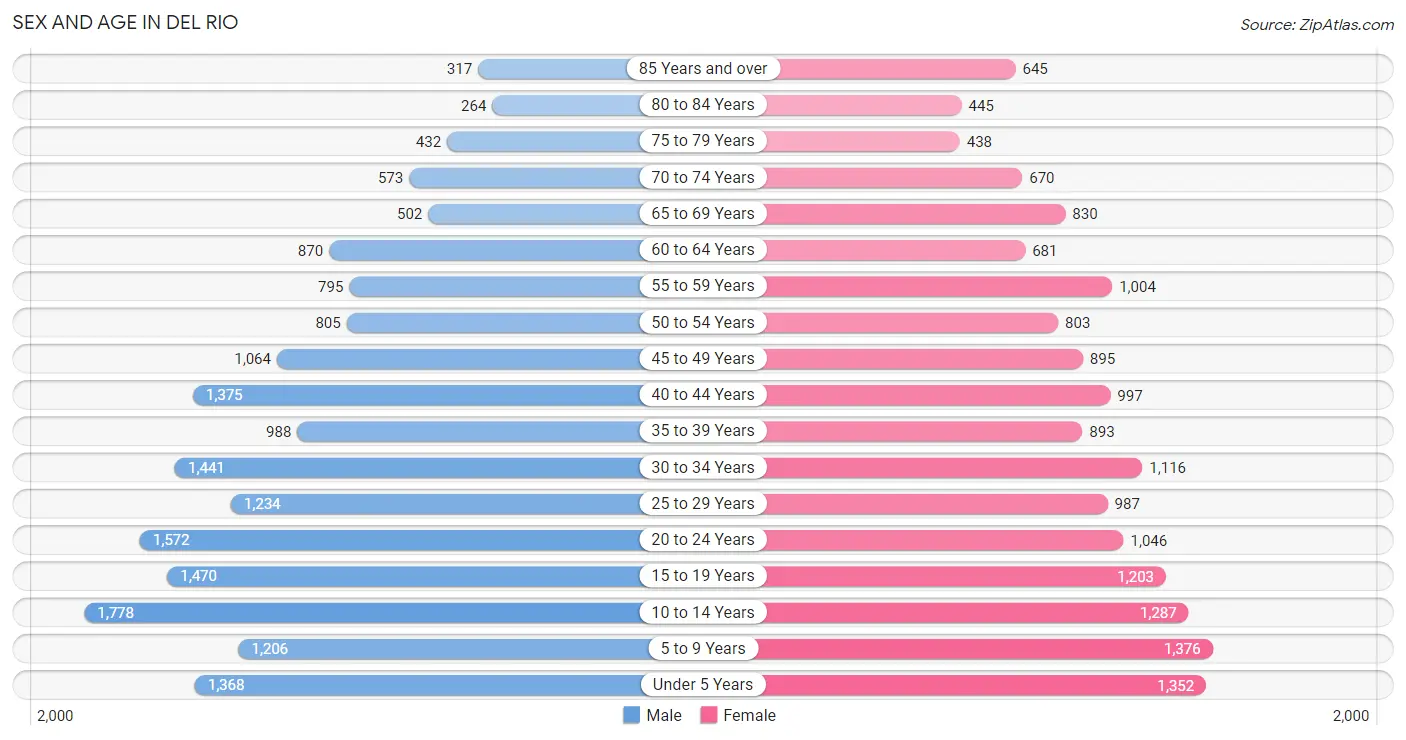
| Age Bracket | Male | Female |
| Under 5 Years | 1,368 (7.6%) | 1,352 (8.1%) |
| 5 to 9 Years | 1,206 (6.7%) | 1,376 (8.3%) |
| 10 to 14 Years | 1,778 (9.9%) | 1,287 (7.7%) |
| 15 to 19 Years | 1,470 (8.1%) | 1,203 (7.2%) |
| 20 to 24 Years | 1,572 (8.7%) | 1,046 (6.3%) |
| 25 to 29 Years | 1,234 (6.8%) | 987 (5.9%) |
| 30 to 34 Years | 1,441 (8.0%) | 1,116 (6.7%) |
| 35 to 39 Years | 988 (5.5%) | 893 (5.4%) |
| 40 to 44 Years | 1,375 (7.6%) | 997 (6.0%) |
| 45 to 49 Years | 1,064 (5.9%) | 895 (5.4%) |
| 50 to 54 Years | 805 (4.5%) | 803 (4.8%) |
| 55 to 59 Years | 795 (4.4%) | 1,004 (6.0%) |
| 60 to 64 Years | 870 (4.8%) | 681 (4.1%) |
| 65 to 69 Years | 502 (2.8%) | 830 (5.0%) |
| 70 to 74 Years | 573 (3.2%) | 670 (4.0%) |
| 75 to 79 Years | 432 (2.4%) | 438 (2.6%) |
| 80 to 84 Years | 264 (1.5%) | 445 (2.7%) |
| 85 Years and over | 317 (1.8%) | 645 (3.9%) |
| Total | 18,054 (100.0%) | 16,668 (100.0%) |
Families and Households in Del Rio
Median Family Size in Del Rio
The median family size in Del Rio is 3.34 persons per family, with married-couple families (5,708 | 66.2%) accounting for the largest median family size of 3.51 persons per family. On the other hand, single male/father families (735 | 8.5%) represent the smallest median family size with 2.22 persons per family.
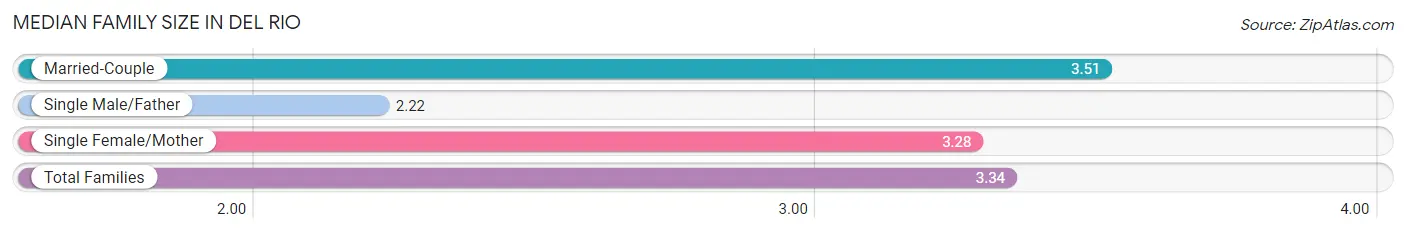
| Family Type | # Families | Family Size |
| Married-Couple | 5,708 (66.2%) | 3.51 |
| Single Male/Father | 735 (8.5%) | 2.22 |
| Single Female/Mother | 2,181 (25.3%) | 3.28 |
| Total Families | 8,624 (100.0%) | 3.34 |
Median Household Size in Del Rio
The median household size in Del Rio is 2.75 persons per household, with married-couple households (5,708 | 46.9%) accounting for the largest median household size of 3.51 persons per household. non-family households (3,542 | 29.1%) represent the smallest median household size with 1.11 persons per household.

| Household Type | # Households | Household Size |
| Married-Couple | 5,708 (46.9%) | 3.51 |
| Single Male/Father | 735 (6.0%) | 2.52 |
| Single Female/Mother | 2,181 (17.9%) | 3.48 |
| Non-family | 3,542 (29.1%) | 1.11 |
| Total Households | 12,166 (100.0%) | 2.75 |
Household Size by Marriage Status in Del Rio
Out of a total of 12,166 households in Del Rio, 8,624 (70.9%) are family households, while 3,542 (29.1%) are nonfamily households. The most numerous type of family households are 2-person households, comprising 2,751, and the most common type of nonfamily households are 1-person households, comprising 3,162.
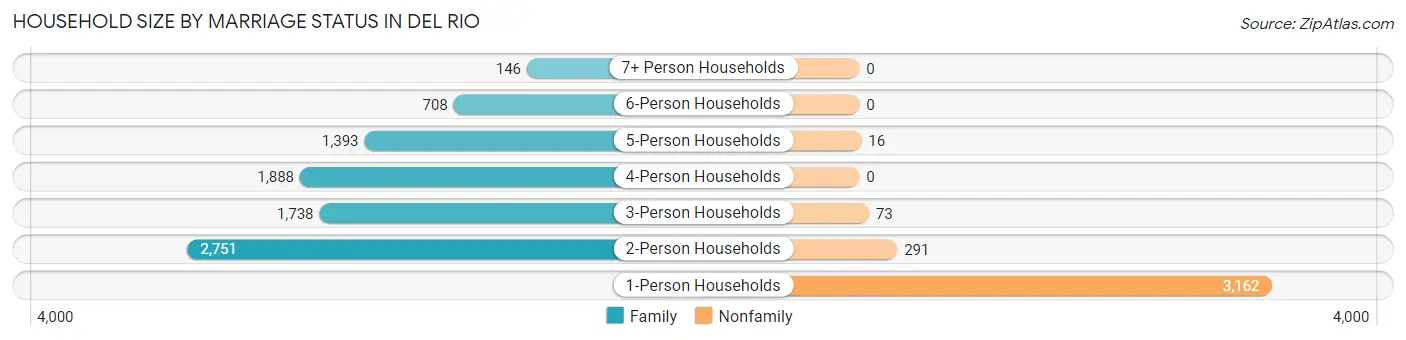
| Household Size | Family Households | Nonfamily Households |
| 1-Person Households | - | 3,162 (26.0%) |
| 2-Person Households | 2,751 (22.6%) | 291 (2.4%) |
| 3-Person Households | 1,738 (14.3%) | 73 (0.6%) |
| 4-Person Households | 1,888 (15.5%) | 0 (0.0%) |
| 5-Person Households | 1,393 (11.5%) | 16 (0.1%) |
| 6-Person Households | 708 (5.8%) | 0 (0.0%) |
| 7+ Person Households | 146 (1.2%) | 0 (0.0%) |
| Total | 8,624 (70.9%) | 3,542 (29.1%) |
Female Fertility in Del Rio
Fertility by Age in Del Rio
Average fertility rate in Del Rio is 85.0 births per 1,000 women. Women in the age bracket of 20 to 34 years have the highest fertility rate with 155.0 births per 1,000 women. Women in the age bracket of 20 to 34 years acount for 79.6% of all women with births.
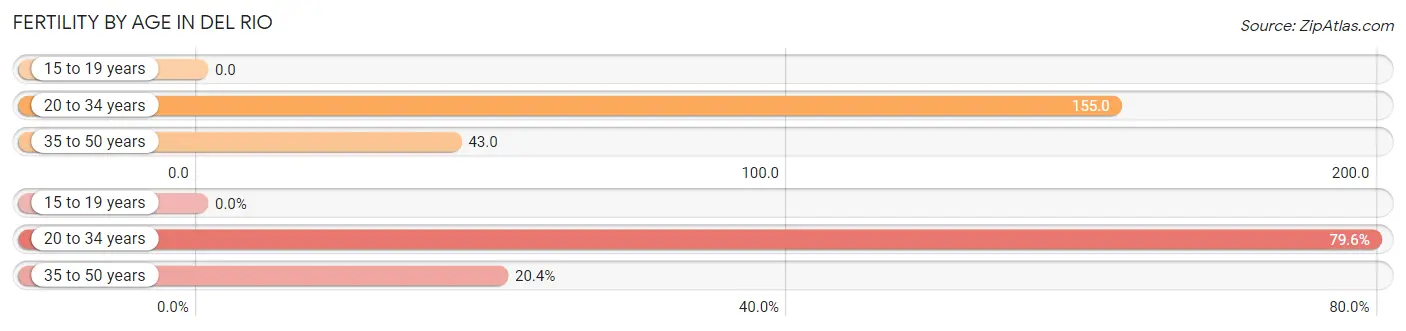
| Age Bracket | Women with Births | Births / 1,000 Women |
| 15 to 19 years | 0 (0.0%) | 0.0 |
| 20 to 34 years | 489 (79.6%) | 155.0 |
| 35 to 50 years | 125 (20.4%) | 43.0 |
| Total | 614 (100.0%) | 85.0 |
Fertility by Age by Marriage Status in Del Rio
54.1% of women with births (614) in Del Rio are married. The highest percentage of unmarried women with births falls into 20 to 34 years age bracket with 52.3% of them unmarried at the time of birth, while the lowest percentage of unmarried women with births belong to 35 to 50 years age bracket with 20.8% of them unmarried.
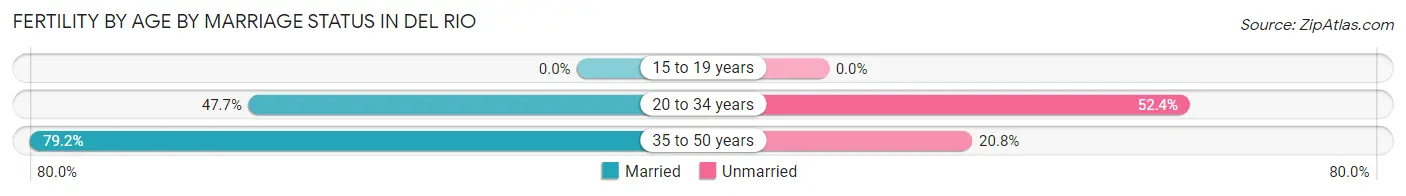
| Age Bracket | Married | Unmarried |
| 15 to 19 years | 0 (0.0%) | 0 (0.0%) |
| 20 to 34 years | 233 (47.6%) | 256 (52.3%) |
| 35 to 50 years | 99 (79.2%) | 26 (20.8%) |
| Total | 332 (54.1%) | 282 (45.9%) |
Fertility by Education in Del Rio
Average fertility rate in Del Rio is 85.0 births per 1,000 women. Women with the education attainment of less than high school have the highest fertility rate of 135.0 births per 1,000 women, while women with the education attainment of college or associate's degree have the lowest fertility at 49.0 births per 1,000 women. Women with the education attainment of less than high school represent 41.2% of all women with births.
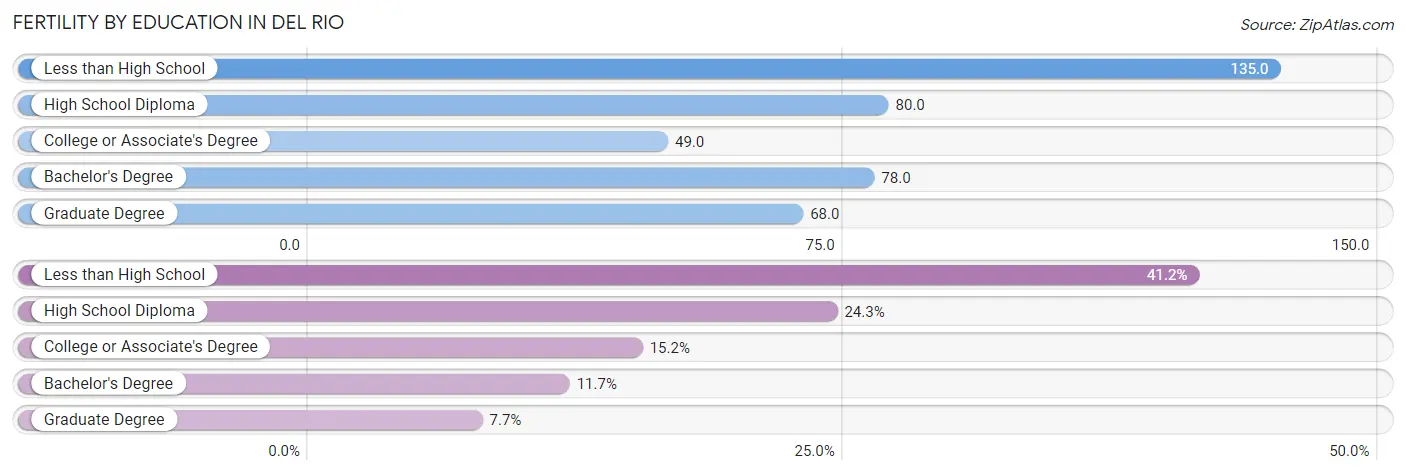
| Educational Attainment | Women with Births | Births / 1,000 Women |
| Less than High School | 253 (41.2%) | 135.0 |
| High School Diploma | 149 (24.3%) | 80.0 |
| College or Associate's Degree | 93 (15.1%) | 49.0 |
| Bachelor's Degree | 72 (11.7%) | 78.0 |
| Graduate Degree | 47 (7.6%) | 68.0 |
| Total | 614 (100.0%) | 85.0 |
Fertility by Education by Marriage Status in Del Rio
45.9% of women with births in Del Rio are unmarried. Women with the educational attainment of high school diploma are most likely to be married with 100.0% of them married at childbirth, while women with the educational attainment of less than high school are least likely to be married with 87.4% of them unmarried at childbirth.
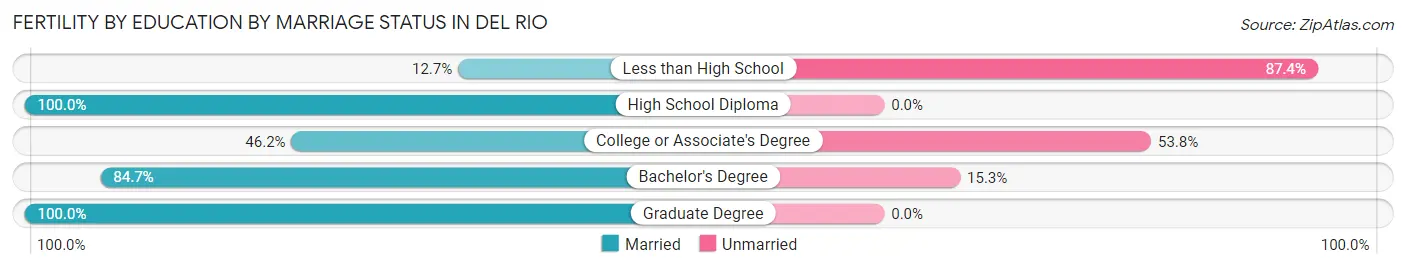
| Educational Attainment | Married | Unmarried |
| Less than High School | 32 (12.7%) | 221 (87.4%) |
| High School Diploma | 149 (100.0%) | 0 (0.0%) |
| College or Associate's Degree | 43 (46.2%) | 50 (53.8%) |
| Bachelor's Degree | 61 (84.7%) | 11 (15.3%) |
| Graduate Degree | 47 (100.0%) | 0 (0.0%) |
| Total | 332 (54.1%) | 282 (45.9%) |
Employment Characteristics in Del Rio
Employment by Class of Employer in Del Rio
Among the 14,845 employed individuals in Del Rio, private company employees (7,268 | 49.0%), not-for-profit organizations (2,362 | 15.9%), and federal government employees (2,247 | 15.1%) make up the most common classes of employment.
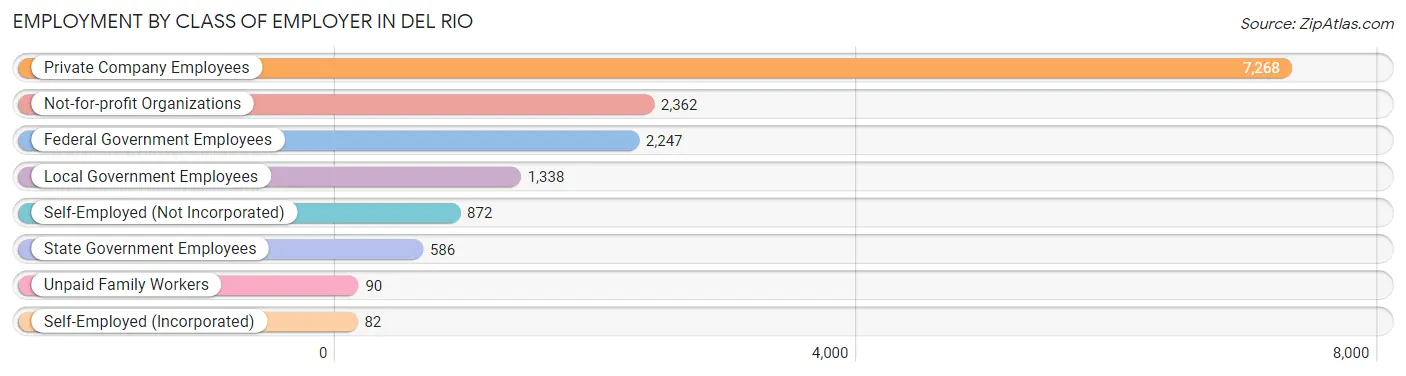
| Employer Class | # Employees | % Employees |
| Private Company Employees | 7,268 | 49.0% |
| Self-Employed (Incorporated) | 82 | 0.5% |
| Self-Employed (Not Incorporated) | 872 | 5.9% |
| Not-for-profit Organizations | 2,362 | 15.9% |
| Local Government Employees | 1,338 | 9.0% |
| State Government Employees | 586 | 4.0% |
| Federal Government Employees | 2,247 | 15.1% |
| Unpaid Family Workers | 90 | 0.6% |
| Total | 14,845 | 100.0% |
Employment Status by Age in Del Rio
According to the labor force statistics for Del Rio, out of the total population over 16 years of age (25,845), 59.6% or 15,404 individuals are in the labor force, with 2.6% or 401 of them unemployed. The age group with the highest labor force participation rate is 35 to 44 years, with 84.5% or 3,594 individuals in the labor force. Within the labor force, the 16 to 19 years age range has the highest percentage of unemployed individuals, with 13.3% or 94 of them being unemployed.
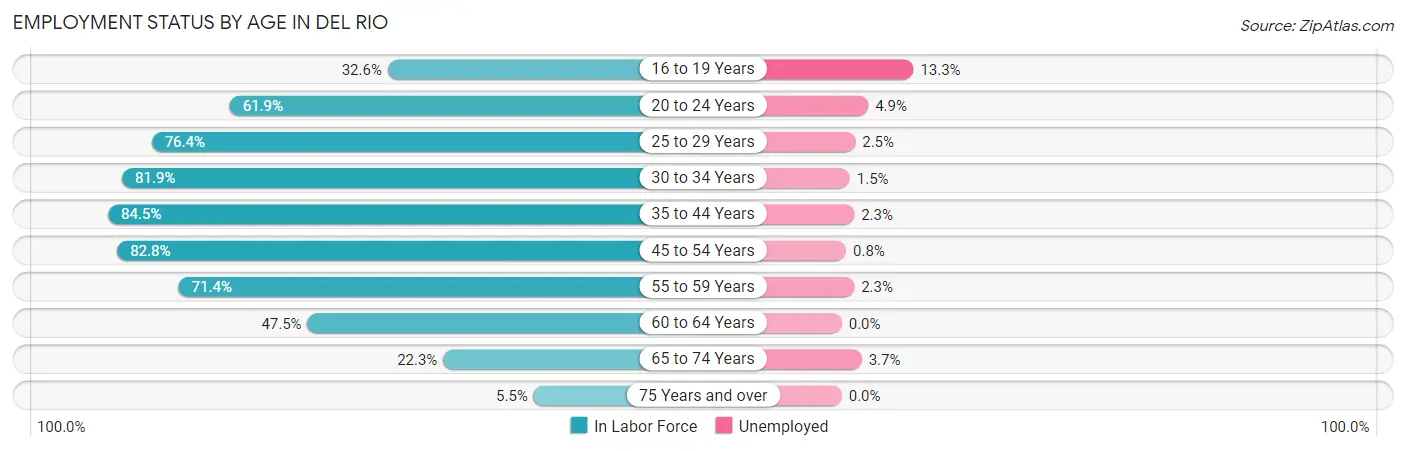
| Age Bracket | In Labor Force | Unemployed |
| 16 to 19 Years | 705 (32.6%) | 94 (13.3%) |
| 20 to 24 Years | 1,621 (61.9%) | 79 (4.9%) |
| 25 to 29 Years | 1,697 (76.4%) | 42 (2.5%) |
| 30 to 34 Years | 2,094 (81.9%) | 31 (1.5%) |
| 35 to 44 Years | 3,594 (84.5%) | 83 (2.3%) |
| 45 to 54 Years | 2,953 (82.8%) | 24 (0.8%) |
| 55 to 59 Years | 1,284 (71.4%) | 30 (2.3%) |
| 60 to 64 Years | 737 (47.5%) | 0 (0.0%) |
| 65 to 74 Years | 574 (22.3%) | 21 (3.7%) |
| 75 Years and over | 140 (5.5%) | 0 (0.0%) |
| Total | 15,404 (59.6%) | 401 (2.6%) |
Employment Status by Educational Attainment in Del Rio
According to labor force statistics for Del Rio, 77.5% of individuals (12,360) out of the total population between 25 and 64 years of age (15,948) are in the labor force, with 1.7% or 210 of them being unemployed. The group with the highest labor force participation rate are those with the educational attainment of bachelor's degree or higher, with 86.7% or 2,820 individuals in the labor force. Within the labor force, individuals with high school diploma education have the highest percentage of unemployment, with 2.8% or 103 of them being unemployed.

| Educational Attainment | In Labor Force | Unemployed |
| Less than High School | 2,257 (66.5%) | 88 (2.6%) |
| High School Diploma | 3,662 (77.0%) | 133 (2.8%) |
| College / Associate Degree | 3,618 (79.6%) | 50 (1.1%) |
| Bachelor's Degree or higher | 2,820 (86.7%) | 7 (0.2%) |
| Total | 12,360 (77.5%) | 271 (1.7%) |
Employment Occupations by Sex in Del Rio
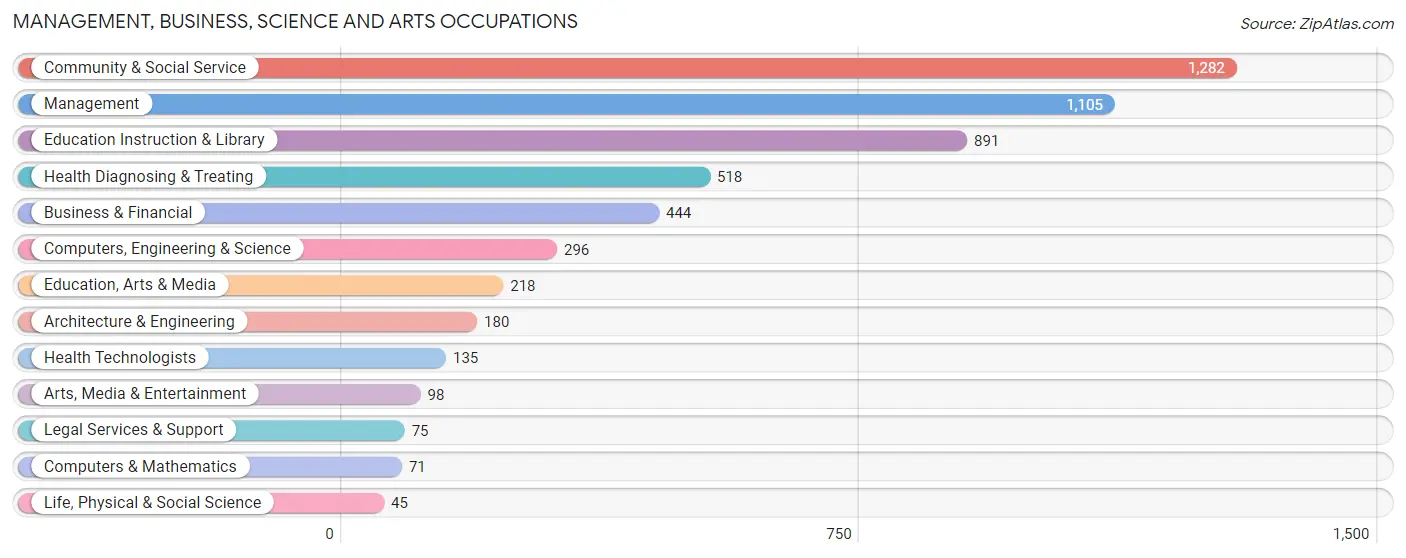
Management, Business, Science and Arts Occupations
The most common Management, Business, Science and Arts occupations in Del Rio are Community & Social Service (1,282 | 8.8%), Management (1,105 | 7.6%), Education Instruction & Library (891 | 6.1%), Health Diagnosing & Treating (518 | 3.6%), and Business & Financial (444 | 3.0%).
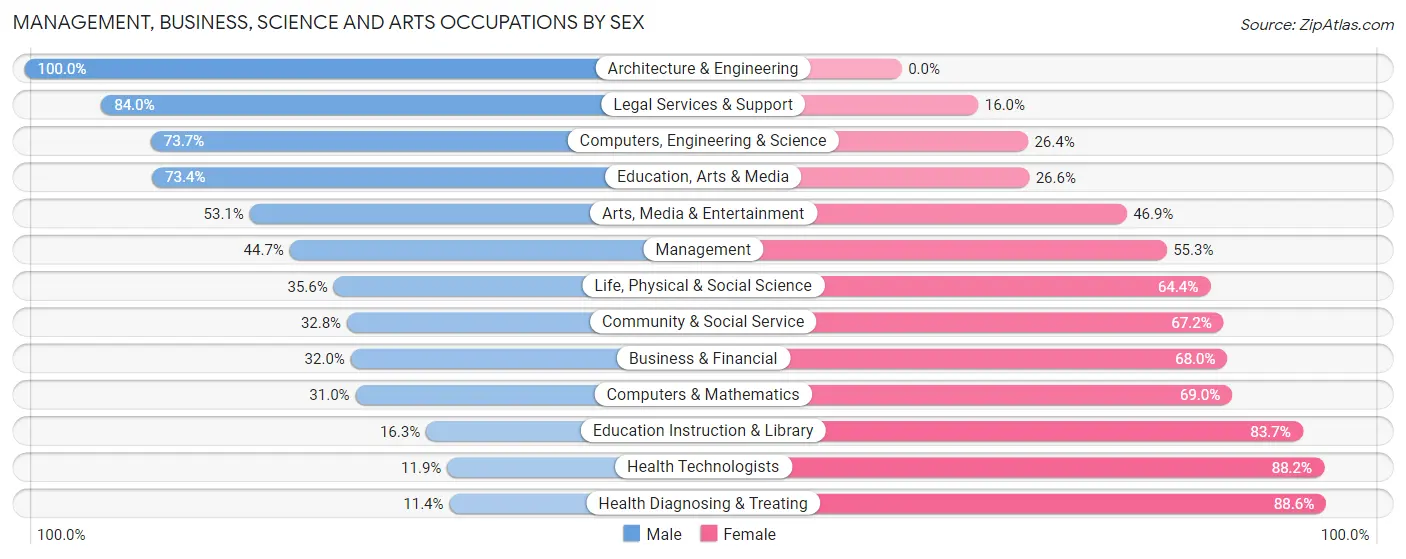
Management, Business, Science and Arts Occupations by Sex
Within the Management, Business, Science and Arts occupations in Del Rio, the most male-oriented occupations are Architecture & Engineering (100.0%), Legal Services & Support (84.0%), and Computers, Engineering & Science (73.7%), while the most female-oriented occupations are Health Diagnosing & Treating (88.6%), Health Technologists (88.1%), and Education Instruction & Library (83.7%).
| Occupation | Male | Female |
| Management | 494 (44.7%) | 611 (55.3%) |
| Business & Financial | 142 (32.0%) | 302 (68.0%) |
| Computers, Engineering & Science | 218 (73.7%) | 78 (26.4%) |
| Computers & Mathematics | 22 (31.0%) | 49 (69.0%) |
| Architecture & Engineering | 180 (100.0%) | 0 (0.0%) |
| Life, Physical & Social Science | 16 (35.6%) | 29 (64.4%) |
| Community & Social Service | 420 (32.8%) | 862 (67.2%) |
| Education, Arts & Media | 160 (73.4%) | 58 (26.6%) |
| Legal Services & Support | 63 (84.0%) | 12 (16.0%) |
| Education Instruction & Library | 145 (16.3%) | 746 (83.7%) |
| Arts, Media & Entertainment | 52 (53.1%) | 46 (46.9%) |
| Health Diagnosing & Treating | 59 (11.4%) | 459 (88.6%) |
| Health Technologists | 16 (11.8%) | 119 (88.1%) |
| Total (Category) | 1,333 (36.6%) | 2,312 (63.4%) |
| Total (Overall) | 7,808 (53.6%) | 6,761 (46.4%) |
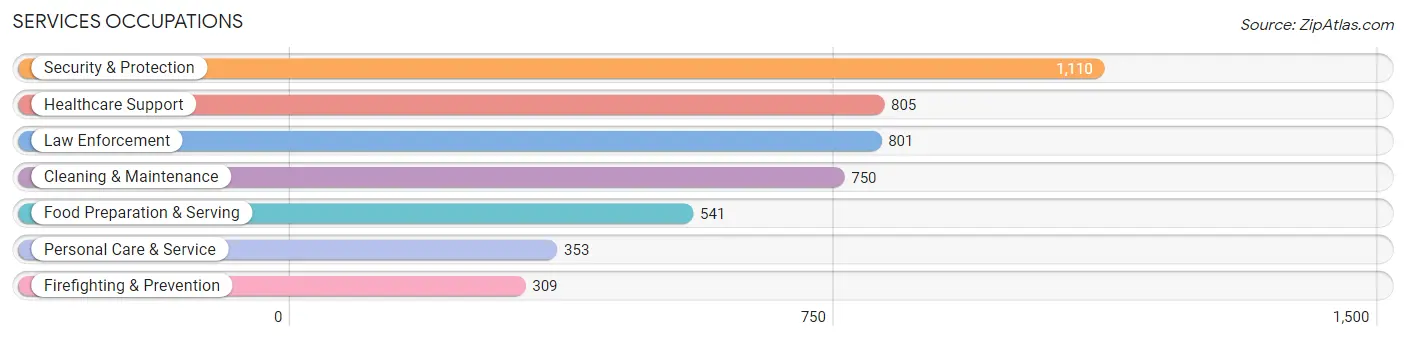
Services Occupations
The most common Services occupations in Del Rio are Security & Protection (1,110 | 7.6%), Healthcare Support (805 | 5.5%), Law Enforcement (801 | 5.5%), Cleaning & Maintenance (750 | 5.1%), and Food Preparation & Serving (541 | 3.7%).
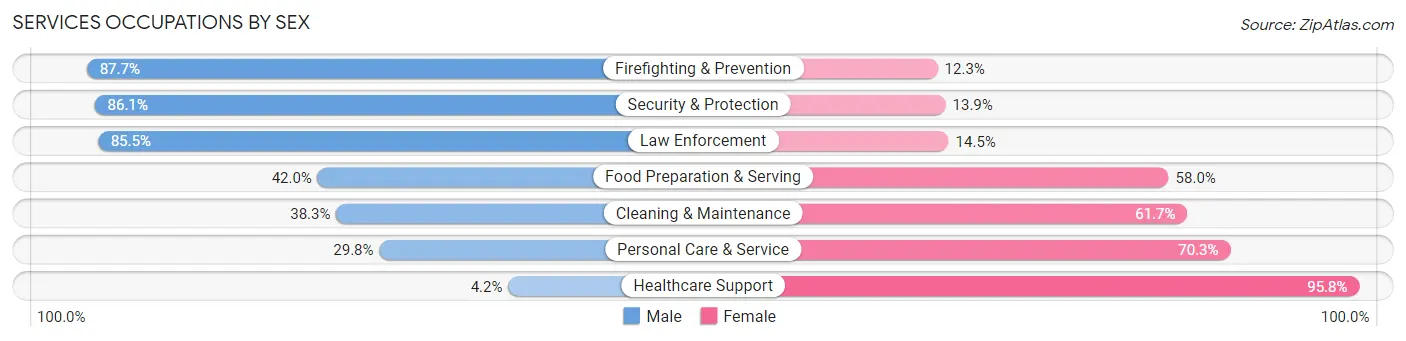
Services Occupations by Sex
Within the Services occupations in Del Rio, the most male-oriented occupations are Firefighting & Prevention (87.7%), Security & Protection (86.1%), and Law Enforcement (85.5%), while the most female-oriented occupations are Healthcare Support (95.8%), Personal Care & Service (70.3%), and Cleaning & Maintenance (61.7%).
| Occupation | Male | Female |
| Healthcare Support | 34 (4.2%) | 771 (95.8%) |
| Security & Protection | 956 (86.1%) | 154 (13.9%) |
| Firefighting & Prevention | 271 (87.7%) | 38 (12.3%) |
| Law Enforcement | 685 (85.5%) | 116 (14.5%) |
| Food Preparation & Serving | 227 (42.0%) | 314 (58.0%) |
| Cleaning & Maintenance | 287 (38.3%) | 463 (61.7%) |
| Personal Care & Service | 105 (29.7%) | 248 (70.3%) |
| Total (Category) | 1,609 (45.2%) | 1,950 (54.8%) |
| Total (Overall) | 7,808 (53.6%) | 6,761 (46.4%) |
Sales and Office Occupations
The most common Sales and Office occupations in Del Rio are Office & Administration (2,106 | 14.5%), and Sales & Related (1,301 | 8.9%).

Sales and Office Occupations by Sex

| Occupation | Male | Female |
| Sales & Related | 628 (48.3%) | 673 (51.7%) |
| Office & Administration | 844 (40.1%) | 1,262 (59.9%) |
| Total (Category) | 1,472 (43.2%) | 1,935 (56.8%) |
| Total (Overall) | 7,808 (53.6%) | 6,761 (46.4%) |
Natural Resources, Construction and Maintenance Occupations
The most common Natural Resources, Construction and Maintenance occupations in Del Rio are Construction & Extraction (944 | 6.5%), Installation, Maintenance & Repair (766 | 5.3%), and Farming, Fishing & Forestry (28 | 0.2%).

Natural Resources, Construction and Maintenance Occupations by Sex

| Occupation | Male | Female |
| Farming, Fishing & Forestry | 13 (46.4%) | 15 (53.6%) |
| Construction & Extraction | 937 (99.3%) | 7 (0.7%) |
| Installation, Maintenance & Repair | 672 (87.7%) | 94 (12.3%) |
| Total (Category) | 1,622 (93.3%) | 116 (6.7%) |
| Total (Overall) | 7,808 (53.6%) | 6,761 (46.4%) |
Production, Transportation and Moving Occupations
The most common Production, Transportation and Moving occupations in Del Rio are Production (866 | 5.9%), Transportation (826 | 5.7%), and Material Moving (528 | 3.6%).

Production, Transportation and Moving Occupations by Sex

| Occupation | Male | Female |
| Production | 741 (85.6%) | 125 (14.4%) |
| Transportation | 646 (78.2%) | 180 (21.8%) |
| Material Moving | 385 (72.9%) | 143 (27.1%) |
| Total (Category) | 1,772 (79.8%) | 448 (20.2%) |
| Total (Overall) | 7,808 (53.6%) | 6,761 (46.4%) |
Employment Industries by Sex in Del Rio
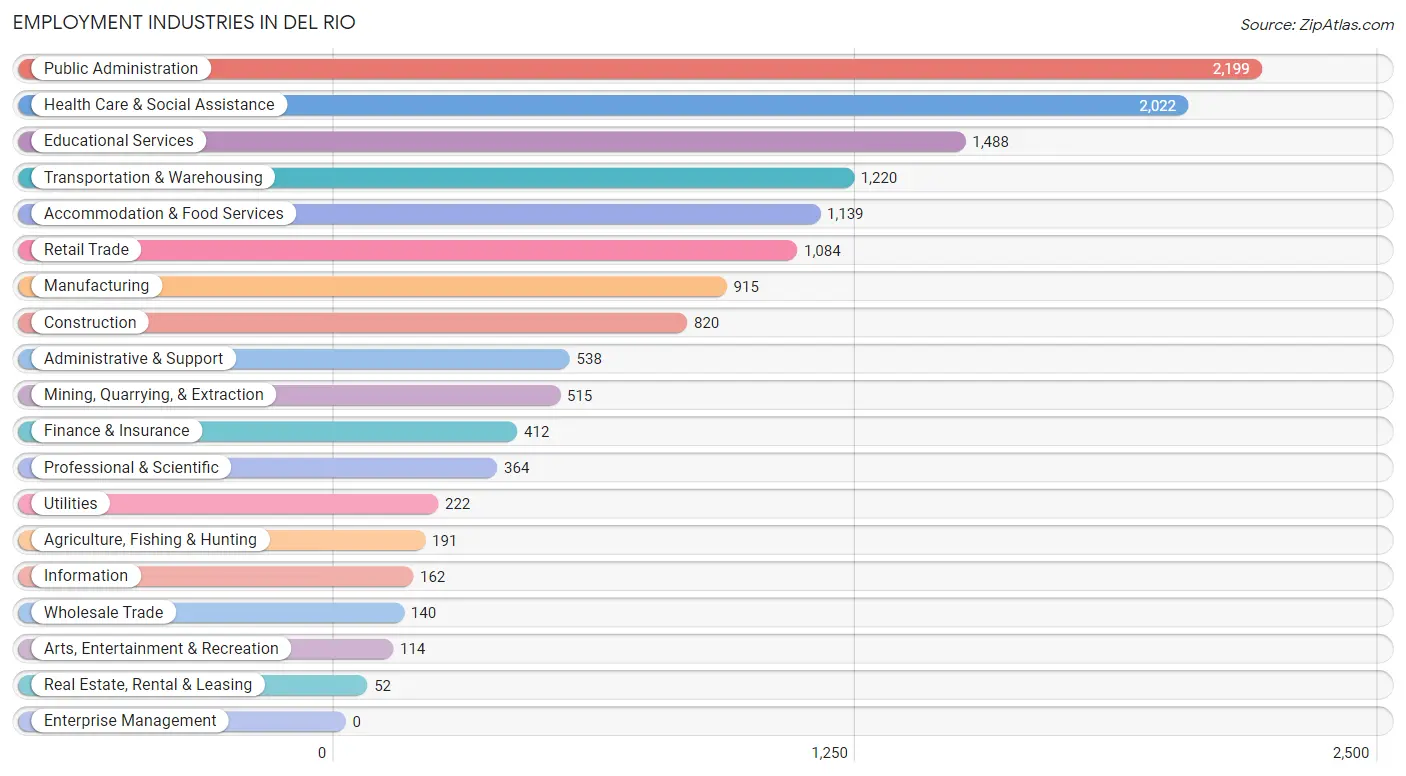
Employment Industries in Del Rio
The major employment industries in Del Rio include Public Administration (2,199 | 15.1%), Health Care & Social Assistance (2,022 | 13.9%), Educational Services (1,488 | 10.2%), Transportation & Warehousing (1,220 | 8.4%), and Accommodation & Food Services (1,139 | 7.8%).
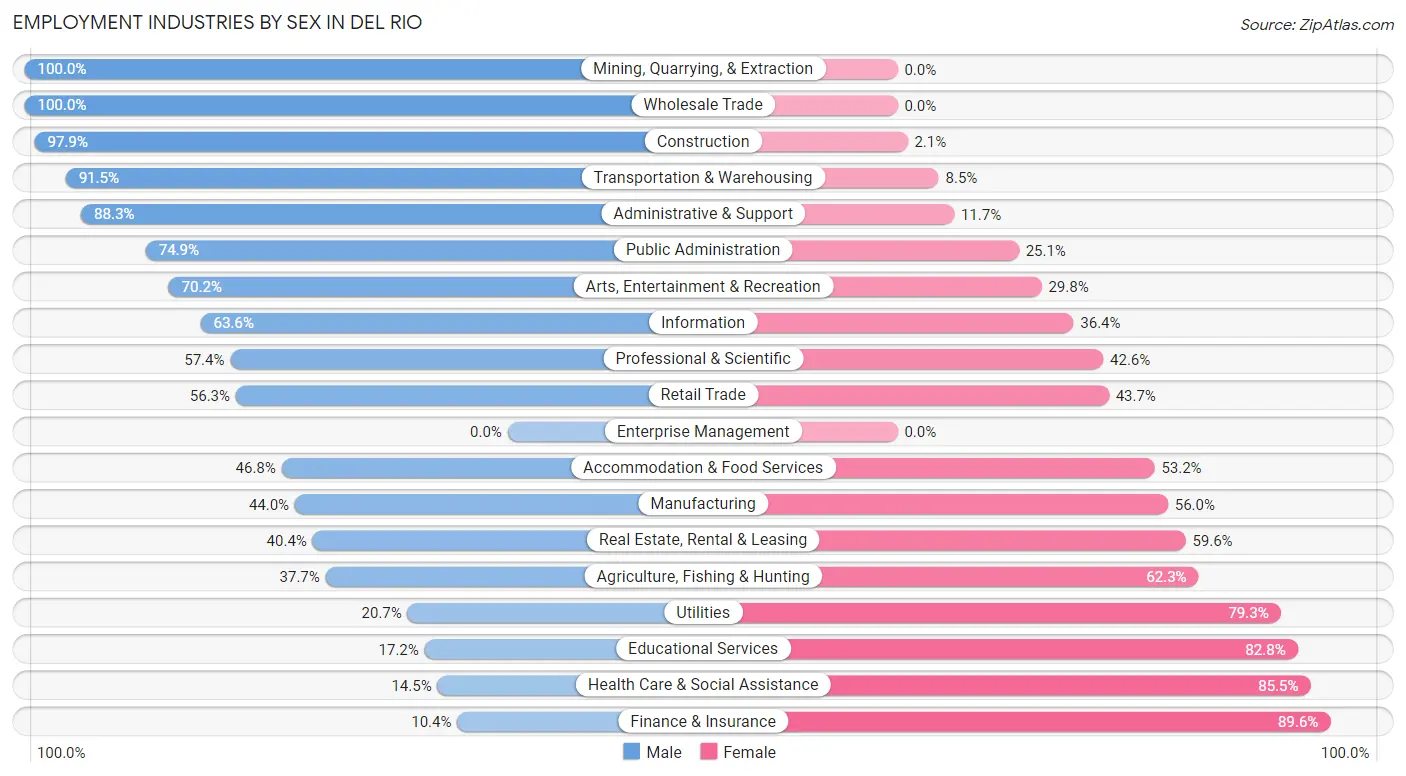
Employment Industries by Sex in Del Rio
The Del Rio industries that see more men than women are Mining, Quarrying, & Extraction (100.0%), Wholesale Trade (100.0%), and Construction (97.9%), whereas the industries that tend to have a higher number of women are Finance & Insurance (89.6%), Health Care & Social Assistance (85.5%), and Educational Services (82.8%).
| Industry | Male | Female |
| Agriculture, Fishing & Hunting | 72 (37.7%) | 119 (62.3%) |
| Mining, Quarrying, & Extraction | 515 (100.0%) | 0 (0.0%) |
| Construction | 803 (97.9%) | 17 (2.1%) |
| Manufacturing | 403 (44.0%) | 512 (56.0%) |
| Wholesale Trade | 140 (100.0%) | 0 (0.0%) |
| Retail Trade | 610 (56.3%) | 474 (43.7%) |
| Transportation & Warehousing | 1,116 (91.5%) | 104 (8.5%) |
| Utilities | 46 (20.7%) | 176 (79.3%) |
| Information | 103 (63.6%) | 59 (36.4%) |
| Finance & Insurance | 43 (10.4%) | 369 (89.6%) |
| Real Estate, Rental & Leasing | 21 (40.4%) | 31 (59.6%) |
| Professional & Scientific | 209 (57.4%) | 155 (42.6%) |
| Enterprise Management | 0 (0.0%) | 0 (0.0%) |
| Administrative & Support | 475 (88.3%) | 63 (11.7%) |
| Educational Services | 256 (17.2%) | 1,232 (82.8%) |
| Health Care & Social Assistance | 294 (14.5%) | 1,728 (85.5%) |
| Arts, Entertainment & Recreation | 80 (70.2%) | 34 (29.8%) |
| Accommodation & Food Services | 533 (46.8%) | 606 (53.2%) |
| Public Administration | 1,647 (74.9%) | 552 (25.1%) |
| Total | 7,808 (53.6%) | 6,761 (46.4%) |
Education in Del Rio
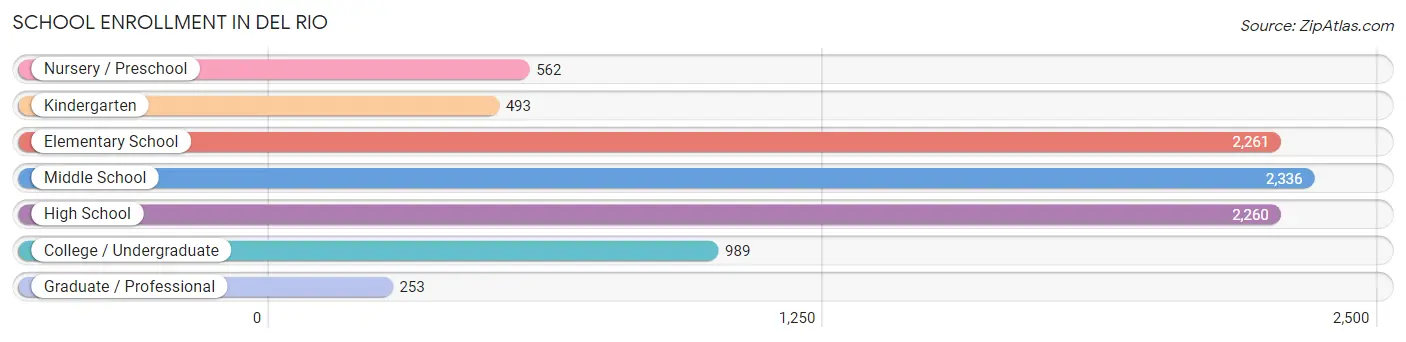
School Enrollment in Del Rio
The most common levels of schooling among the 9,154 students in Del Rio are middle school (2,336 | 25.5%), elementary school (2,261 | 24.7%), and high school (2,260 | 24.7%).
| School Level | # Students | % Students |
| Nursery / Preschool | 562 | 6.1% |
| Kindergarten | 493 | 5.4% |
| Elementary School | 2,261 | 24.7% |
| Middle School | 2,336 | 25.5% |
| High School | 2,260 | 24.7% |
| College / Undergraduate | 989 | 10.8% |
| Graduate / Professional | 253 | 2.8% |
| Total | 9,154 | 100.0% |
School Enrollment by Age by Funding Source in Del Rio
Out of a total of 9,154 students who are enrolled in schools in Del Rio, 1,245 (13.6%) attend a private institution, while the remaining 7,909 (86.4%) are enrolled in public schools. The age group of 35 years and over has the highest likelihood of being enrolled in private schools, with 203 (54.0% in the age bracket) enrolled. Conversely, the age group of 15 to 17 year olds has the lowest likelihood of being enrolled in a private school, with 1,543 (99.2% in the age bracket) attending a public institution.
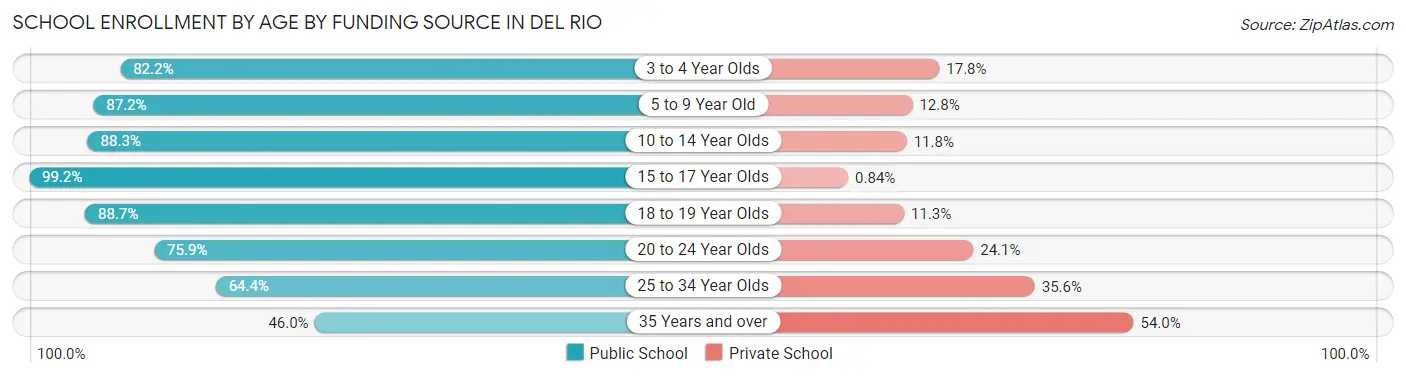
| Age Bracket | Public School | Private School |
| 3 to 4 Year Olds | 309 (82.2%) | 67 (17.8%) |
| 5 to 9 Year Old | 2,128 (87.2%) | 313 (12.8%) |
| 10 to 14 Year Olds | 2,705 (88.2%) | 360 (11.7%) |
| 15 to 17 Year Olds | 1,543 (99.2%) | 13 (0.8%) |
| 18 to 19 Year Olds | 465 (88.7%) | 59 (11.3%) |
| 20 to 24 Year Olds | 374 (75.9%) | 119 (24.1%) |
| 25 to 34 Year Olds | 208 (64.4%) | 115 (35.6%) |
| 35 Years and over | 173 (46.0%) | 203 (54.0%) |
| Total | 7,909 (86.4%) | 1,245 (13.6%) |
Educational Attainment by Field of Study in Del Rio
Business (811 | 19.2%), education (736 | 17.5%), arts & humanities (620 | 14.7%), social sciences (377 | 8.9%), and engineering (319 | 7.6%) are the most common fields of study among 4,215 individuals in Del Rio who have obtained a bachelor's degree or higher.
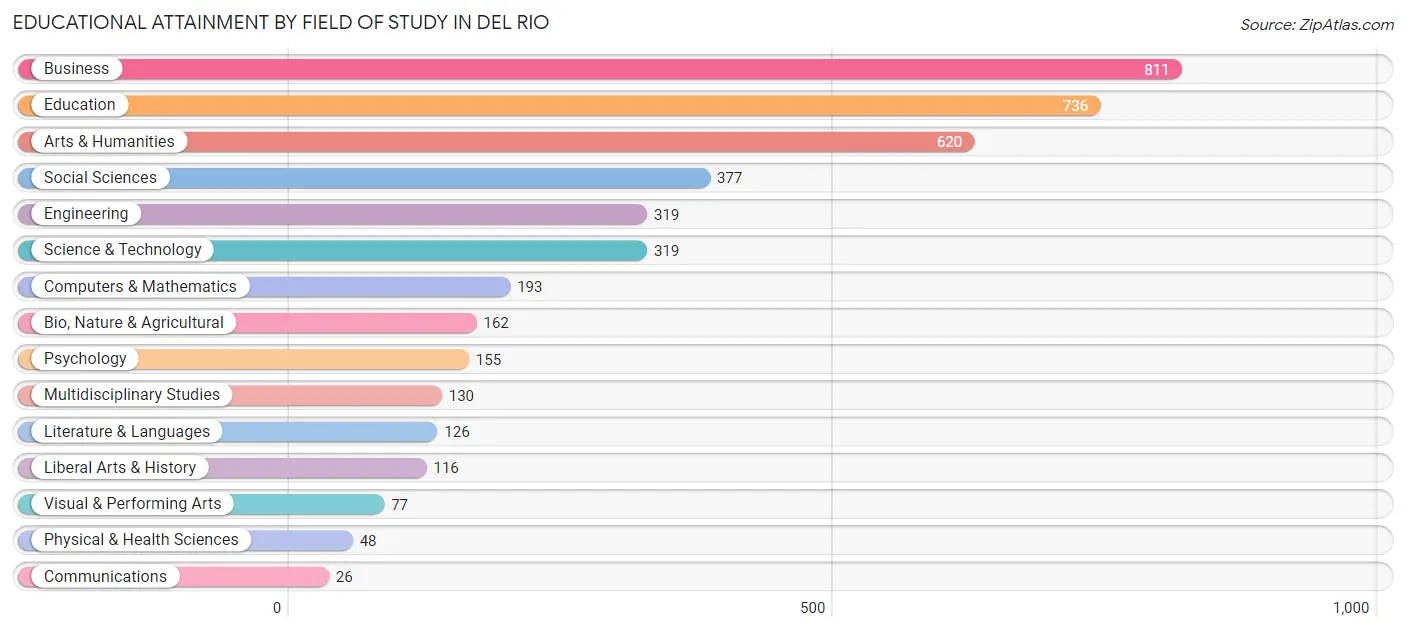
| Field of Study | # Graduates | % Graduates |
| Computers & Mathematics | 193 | 4.6% |
| Bio, Nature & Agricultural | 162 | 3.8% |
| Physical & Health Sciences | 48 | 1.1% |
| Psychology | 155 | 3.7% |
| Social Sciences | 377 | 8.9% |
| Engineering | 319 | 7.6% |
| Multidisciplinary Studies | 130 | 3.1% |
| Science & Technology | 319 | 7.6% |
| Business | 811 | 19.2% |
| Education | 736 | 17.5% |
| Literature & Languages | 126 | 3.0% |
| Liberal Arts & History | 116 | 2.8% |
| Visual & Performing Arts | 77 | 1.8% |
| Communications | 26 | 0.6% |
| Arts & Humanities | 620 | 14.7% |
| Total | 4,215 | 100.0% |
Transportation & Commute in Del Rio
Vehicle Availability by Sex in Del Rio
The most prevalent vehicle ownership categories in Del Rio are males with 2 vehicles (2,979, accounting for 36.6%) and females with 2 vehicles (2,982, making up 44.5%).
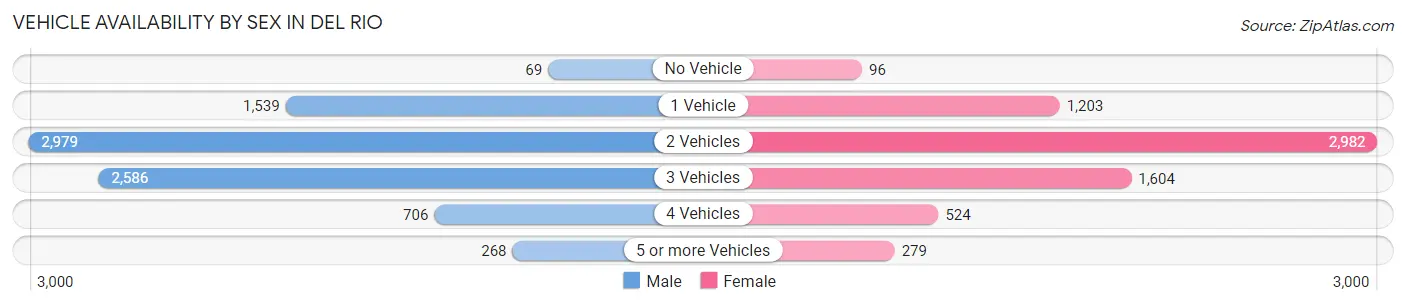
| Vehicles Available | Male | Female |
| No Vehicle | 69 (0.9%) | 96 (1.4%) |
| 1 Vehicle | 1,539 (18.9%) | 1,203 (18.0%) |
| 2 Vehicles | 2,979 (36.6%) | 2,982 (44.6%) |
| 3 Vehicles | 2,586 (31.7%) | 1,604 (24.0%) |
| 4 Vehicles | 706 (8.7%) | 524 (7.8%) |
| 5 or more Vehicles | 268 (3.3%) | 279 (4.2%) |
| Total | 8,147 (100.0%) | 6,688 (100.0%) |
Commute Time in Del Rio
The most frequently occuring commute durations in Del Rio are 10 to 14 minutes (3,940 commuters, 27.1%), 15 to 19 minutes (3,185 commuters, 21.9%), and 5 to 9 minutes (3,061 commuters, 21.1%).
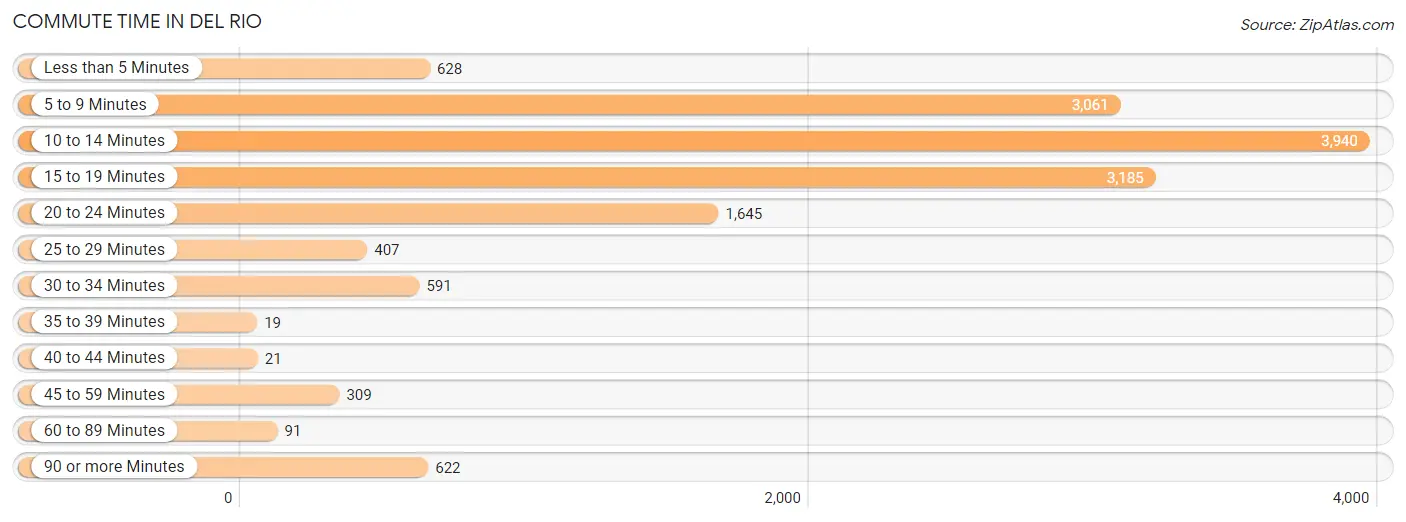
| Commute Time | # Commuters | % Commuters |
| Less than 5 Minutes | 628 | 4.3% |
| 5 to 9 Minutes | 3,061 | 21.1% |
| 10 to 14 Minutes | 3,940 | 27.1% |
| 15 to 19 Minutes | 3,185 | 21.9% |
| 20 to 24 Minutes | 1,645 | 11.3% |
| 25 to 29 Minutes | 407 | 2.8% |
| 30 to 34 Minutes | 591 | 4.1% |
| 35 to 39 Minutes | 19 | 0.1% |
| 40 to 44 Minutes | 21 | 0.1% |
| 45 to 59 Minutes | 309 | 2.1% |
| 60 to 89 Minutes | 91 | 0.6% |
| 90 or more Minutes | 622 | 4.3% |
Commute Time by Sex in Del Rio
The most common commute times in Del Rio are 10 to 14 minutes (2,325 commuters, 29.2%) for males and 5 to 9 minutes (1,886 commuters, 28.7%) for females.
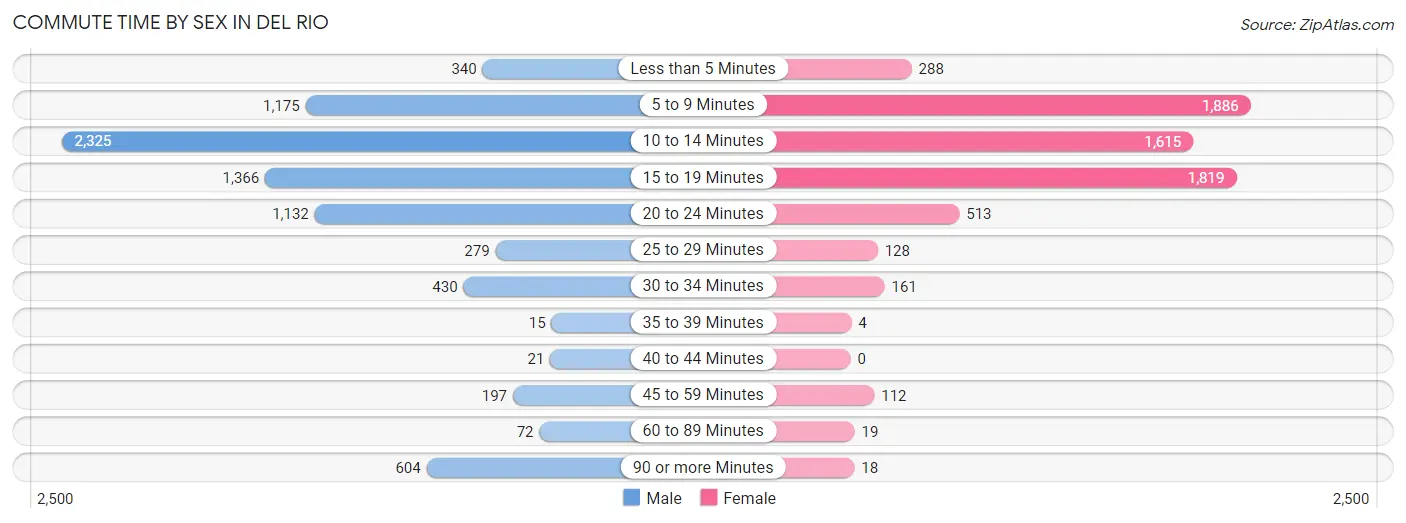
| Commute Time | Male | Female |
| Less than 5 Minutes | 340 (4.3%) | 288 (4.4%) |
| 5 to 9 Minutes | 1,175 (14.8%) | 1,886 (28.7%) |
| 10 to 14 Minutes | 2,325 (29.2%) | 1,615 (24.6%) |
| 15 to 19 Minutes | 1,366 (17.2%) | 1,819 (27.7%) |
| 20 to 24 Minutes | 1,132 (14.2%) | 513 (7.8%) |
| 25 to 29 Minutes | 279 (3.5%) | 128 (1.9%) |
| 30 to 34 Minutes | 430 (5.4%) | 161 (2.5%) |
| 35 to 39 Minutes | 15 (0.2%) | 4 (0.1%) |
| 40 to 44 Minutes | 21 (0.3%) | 0 (0.0%) |
| 45 to 59 Minutes | 197 (2.5%) | 112 (1.7%) |
| 60 to 89 Minutes | 72 (0.9%) | 19 (0.3%) |
| 90 or more Minutes | 604 (7.6%) | 18 (0.3%) |
Time of Departure to Work by Sex in Del Rio
The most frequent times of departure to work in Del Rio are 8:00 AM to 8:29 AM (1,207, 15.2%) for males and 7:00 AM to 7:29 AM (1,431, 21.8%) for females.
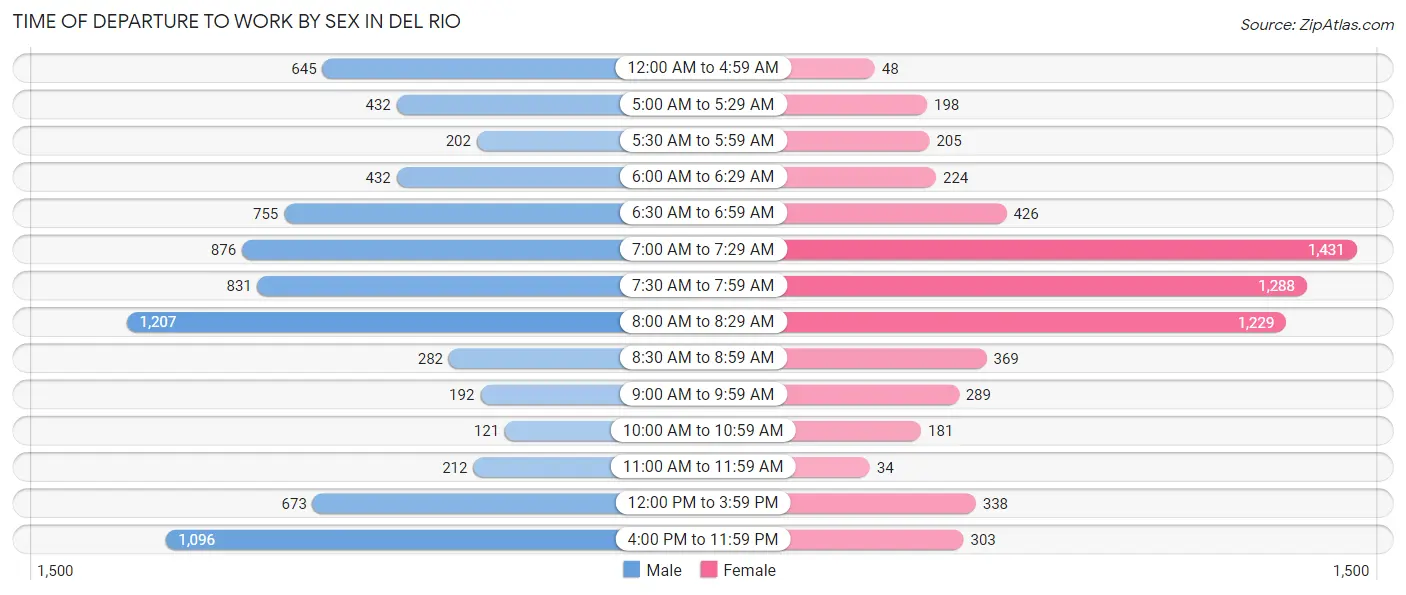
| Time of Departure | Male | Female |
| 12:00 AM to 4:59 AM | 645 (8.1%) | 48 (0.7%) |
| 5:00 AM to 5:29 AM | 432 (5.4%) | 198 (3.0%) |
| 5:30 AM to 5:59 AM | 202 (2.5%) | 205 (3.1%) |
| 6:00 AM to 6:29 AM | 432 (5.4%) | 224 (3.4%) |
| 6:30 AM to 6:59 AM | 755 (9.5%) | 426 (6.5%) |
| 7:00 AM to 7:29 AM | 876 (11.0%) | 1,431 (21.8%) |
| 7:30 AM to 7:59 AM | 831 (10.4%) | 1,288 (19.6%) |
| 8:00 AM to 8:29 AM | 1,207 (15.2%) | 1,229 (18.7%) |
| 8:30 AM to 8:59 AM | 282 (3.5%) | 369 (5.6%) |
| 9:00 AM to 9:59 AM | 192 (2.4%) | 289 (4.4%) |
| 10:00 AM to 10:59 AM | 121 (1.5%) | 181 (2.8%) |
| 11:00 AM to 11:59 AM | 212 (2.7%) | 34 (0.5%) |
| 12:00 PM to 3:59 PM | 673 (8.5%) | 338 (5.1%) |
| 4:00 PM to 11:59 PM | 1,096 (13.8%) | 303 (4.6%) |
| Total | 7,956 (100.0%) | 6,563 (100.0%) |
Housing Occupancy in Del Rio
Occupancy by Ownership in Del Rio
Of the total 12,166 dwellings in Del Rio, owner-occupied units account for 8,112 (66.7%), while renter-occupied units make up 4,054 (33.3%).
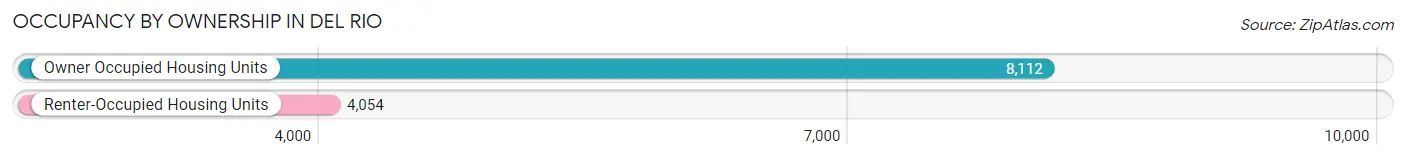
| Occupancy | # Housing Units | % Housing Units |
| Owner Occupied Housing Units | 8,112 | 66.7% |
| Renter-Occupied Housing Units | 4,054 | 33.3% |
| Total Occupied Housing Units | 12,166 | 100.0% |
Occupancy by Household Size in Del Rio
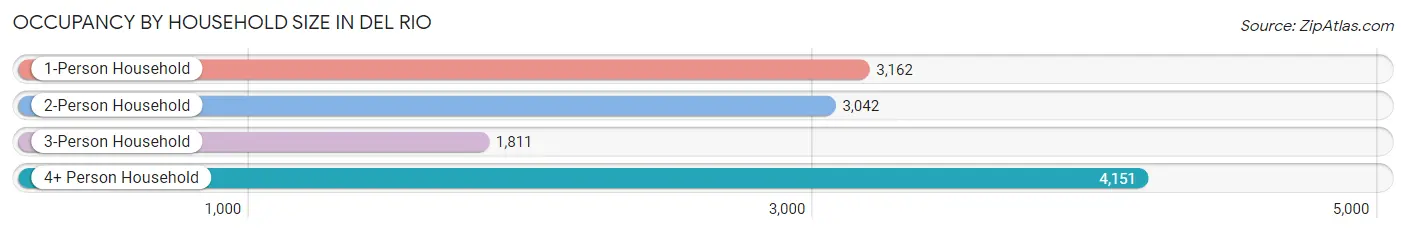
| Household Size | # Housing Units | % Housing Units |
| 1-Person Household | 3,162 | 26.0% |
| 2-Person Household | 3,042 | 25.0% |
| 3-Person Household | 1,811 | 14.9% |
| 4+ Person Household | 4,151 | 34.1% |
| Total Housing Units | 12,166 | 100.0% |
Occupancy by Ownership by Household Size in Del Rio
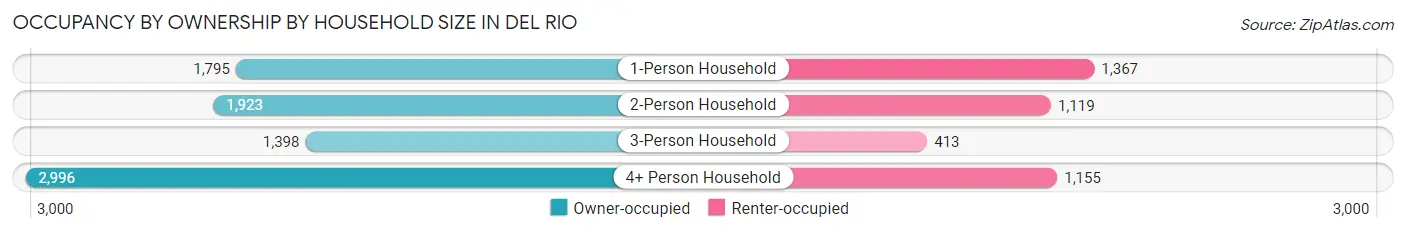
| Household Size | Owner-occupied | Renter-occupied |
| 1-Person Household | 1,795 (56.8%) | 1,367 (43.2%) |
| 2-Person Household | 1,923 (63.2%) | 1,119 (36.8%) |
| 3-Person Household | 1,398 (77.2%) | 413 (22.8%) |
| 4+ Person Household | 2,996 (72.2%) | 1,155 (27.8%) |
| Total Housing Units | 8,112 (66.7%) | 4,054 (33.3%) |
Occupancy by Educational Attainment in Del Rio
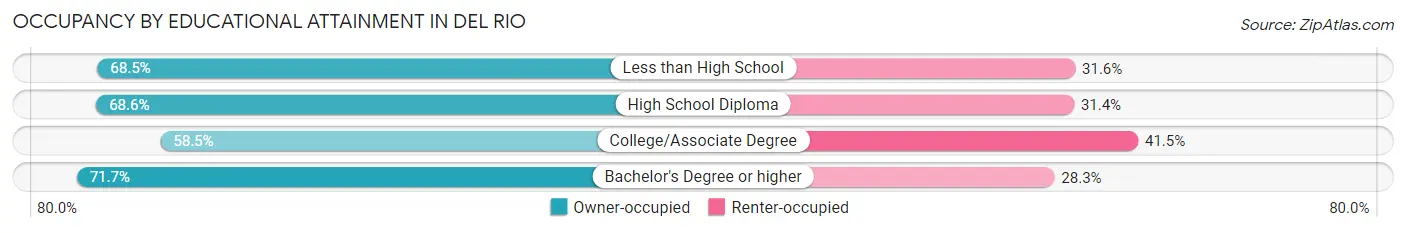
| Household Size | Owner-occupied | Renter-occupied |
| Less than High School | 2,050 (68.4%) | 945 (31.6%) |
| High School Diploma | 2,301 (68.6%) | 1,052 (31.4%) |
| College/Associate Degree | 1,817 (58.5%) | 1,291 (41.5%) |
| Bachelor's Degree or higher | 1,944 (71.7%) | 766 (28.3%) |
Occupancy by Age of Householder in Del Rio
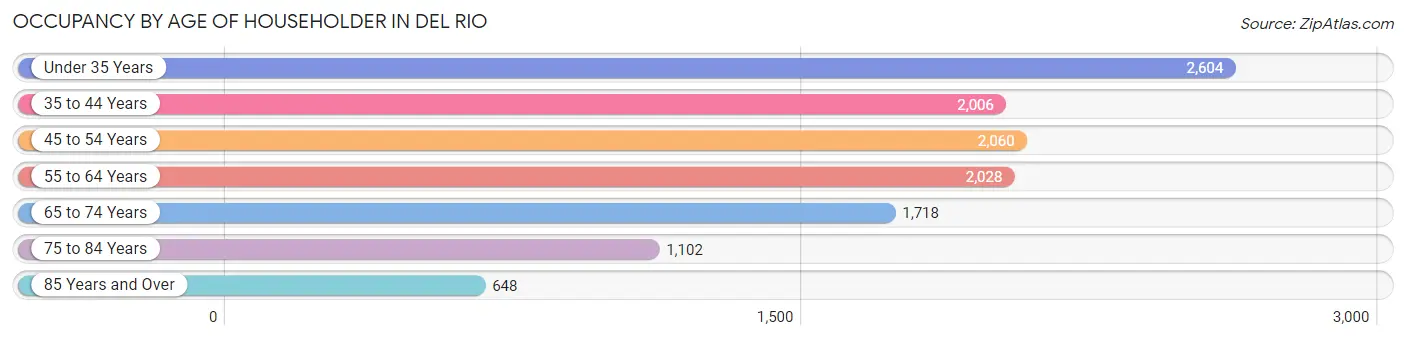
| Age Bracket | # Households | % Households |
| Under 35 Years | 2,604 | 21.4% |
| 35 to 44 Years | 2,006 | 16.5% |
| 45 to 54 Years | 2,060 | 16.9% |
| 55 to 64 Years | 2,028 | 16.7% |
| 65 to 74 Years | 1,718 | 14.1% |
| 75 to 84 Years | 1,102 | 9.1% |
| 85 Years and Over | 648 | 5.3% |
| Total | 12,166 | 100.0% |
Housing Finances in Del Rio
Median Income by Occupancy in Del Rio
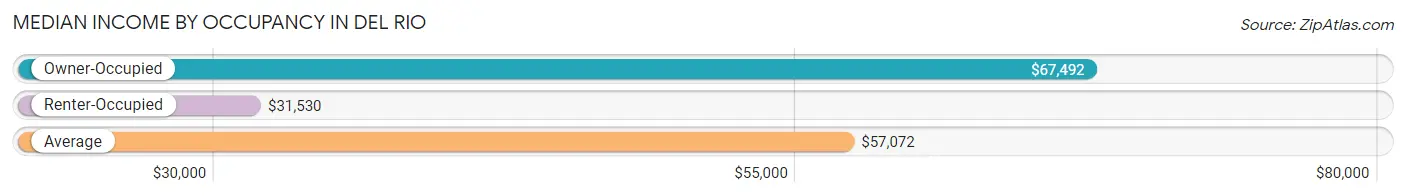
| Occupancy Type | # Households | Median Income |
| Owner-Occupied | 8,112 (66.7%) | $67,492 |
| Renter-Occupied | 4,054 (33.3%) | $31,530 |
| Average | 12,166 (100.0%) | $57,072 |
Occupancy by Householder Income Bracket in Del Rio
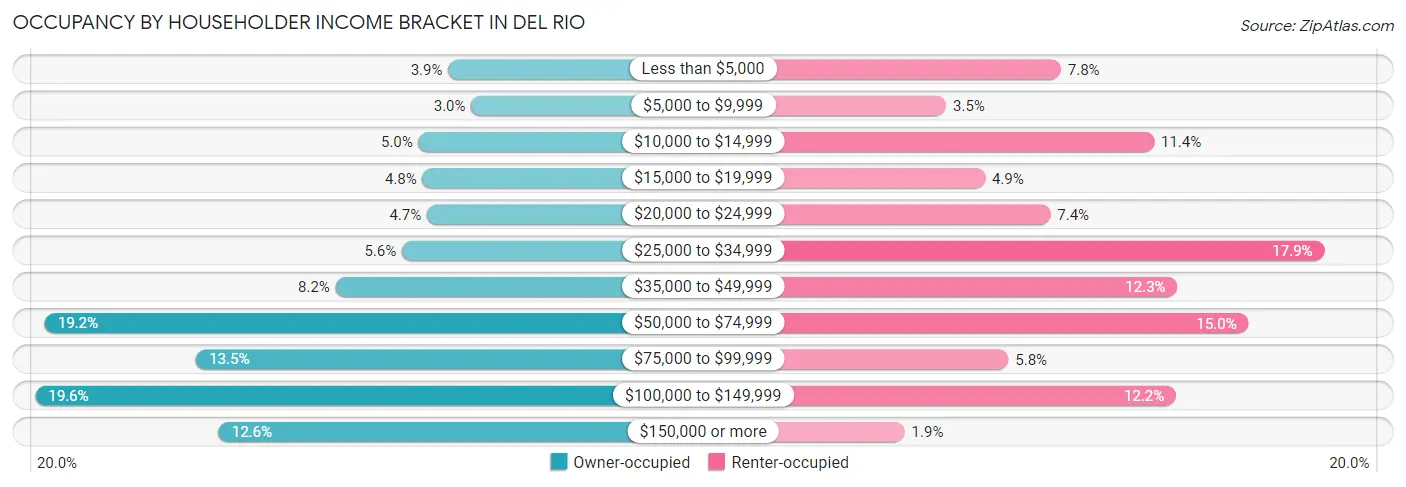
| Income Bracket | Owner-occupied | Renter-occupied |
| Less than $5,000 | 313 (3.9%) | 317 (7.8%) |
| $5,000 to $9,999 | 242 (3.0%) | 140 (3.5%) |
| $10,000 to $14,999 | 405 (5.0%) | 461 (11.4%) |
| $15,000 to $19,999 | 393 (4.8%) | 200 (4.9%) |
| $20,000 to $24,999 | 379 (4.7%) | 301 (7.4%) |
| $25,000 to $34,999 | 456 (5.6%) | 724 (17.9%) |
| $35,000 to $49,999 | 661 (8.2%) | 497 (12.3%) |
| $50,000 to $74,999 | 1,560 (19.2%) | 607 (15.0%) |
| $75,000 to $99,999 | 1,092 (13.5%) | 236 (5.8%) |
| $100,000 to $149,999 | 1,589 (19.6%) | 495 (12.2%) |
| $150,000 or more | 1,022 (12.6%) | 76 (1.9%) |
| Total | 8,112 (100.0%) | 4,054 (100.0%) |
Monthly Housing Cost Tiers in Del Rio
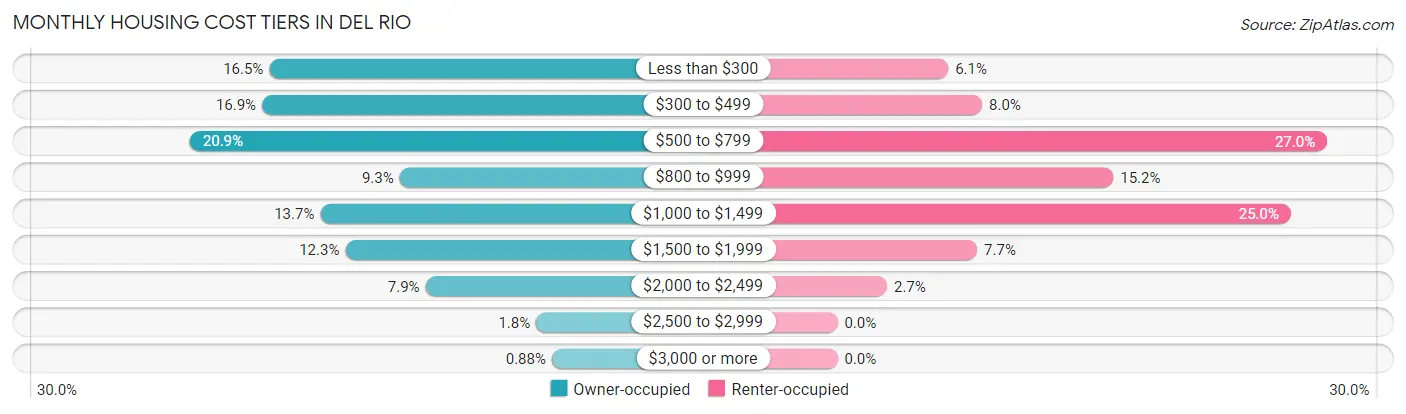
| Monthly Cost | Owner-occupied | Renter-occupied |
| Less than $300 | 1,338 (16.5%) | 248 (6.1%) |
| $300 to $499 | 1,370 (16.9%) | 324 (8.0%) |
| $500 to $799 | 1,693 (20.9%) | 1,096 (27.0%) |
| $800 to $999 | 754 (9.3%) | 618 (15.2%) |
| $1,000 to $1,499 | 1,109 (13.7%) | 1,015 (25.0%) |
| $1,500 to $1,999 | 997 (12.3%) | 313 (7.7%) |
| $2,000 to $2,499 | 638 (7.9%) | 111 (2.7%) |
| $2,500 to $2,999 | 142 (1.8%) | 0 (0.0%) |
| $3,000 or more | 71 (0.9%) | 0 (0.0%) |
| Total | 8,112 (100.0%) | 4,054 (100.0%) |
Physical Housing Characteristics in Del Rio
Housing Structures in Del Rio
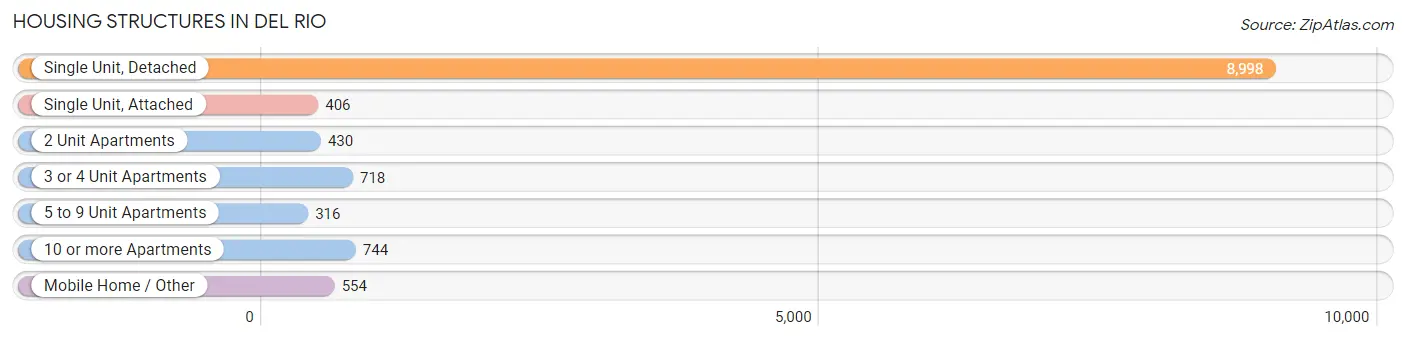
| Structure Type | # Housing Units | % Housing Units |
| Single Unit, Detached | 8,998 | 74.0% |
| Single Unit, Attached | 406 | 3.3% |
| 2 Unit Apartments | 430 | 3.5% |
| 3 or 4 Unit Apartments | 718 | 5.9% |
| 5 to 9 Unit Apartments | 316 | 2.6% |
| 10 or more Apartments | 744 | 6.1% |
| Mobile Home / Other | 554 | 4.5% |
| Total | 12,166 | 100.0% |
Housing Structures by Occupancy in Del Rio
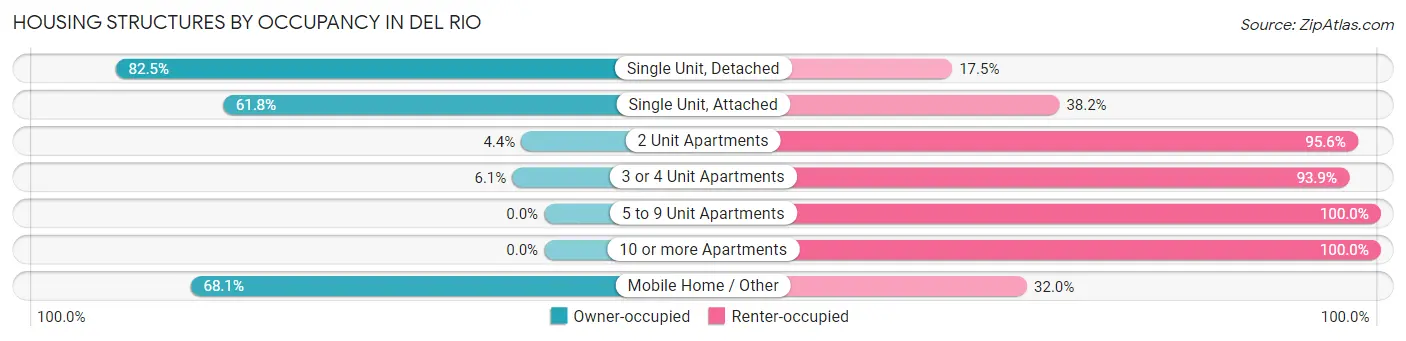
| Structure Type | Owner-occupied | Renter-occupied |
| Single Unit, Detached | 7,421 (82.5%) | 1,577 (17.5%) |
| Single Unit, Attached | 251 (61.8%) | 155 (38.2%) |
| 2 Unit Apartments | 19 (4.4%) | 411 (95.6%) |
| 3 or 4 Unit Apartments | 44 (6.1%) | 674 (93.9%) |
| 5 to 9 Unit Apartments | 0 (0.0%) | 316 (100.0%) |
| 10 or more Apartments | 0 (0.0%) | 744 (100.0%) |
| Mobile Home / Other | 377 (68.0%) | 177 (32.0%) |
| Total | 8,112 (66.7%) | 4,054 (33.3%) |
Housing Structures by Number of Rooms in Del Rio
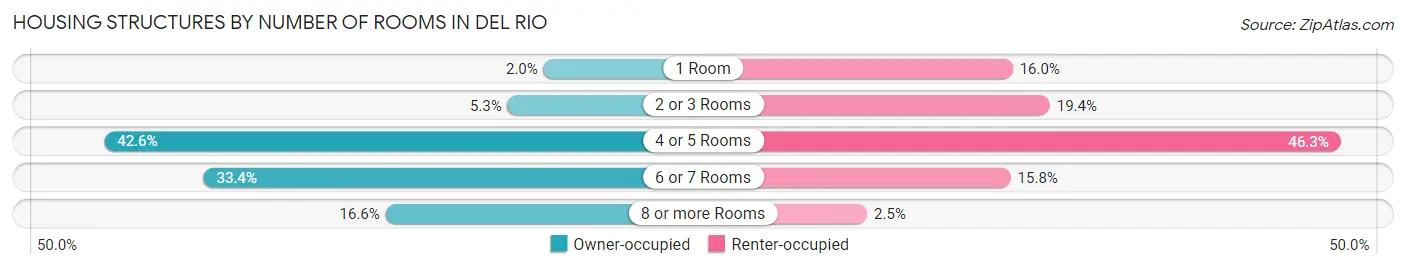
| Number of Rooms | Owner-occupied | Renter-occupied |
| 1 Room | 162 (2.0%) | 648 (16.0%) |
| 2 or 3 Rooms | 432 (5.3%) | 787 (19.4%) |
| 4 or 5 Rooms | 3,458 (42.6%) | 1,877 (46.3%) |
| 6 or 7 Rooms | 2,713 (33.4%) | 640 (15.8%) |
| 8 or more Rooms | 1,347 (16.6%) | 102 (2.5%) |
| Total | 8,112 (100.0%) | 4,054 (100.0%) |
Housing Structure by Heating Type in Del Rio
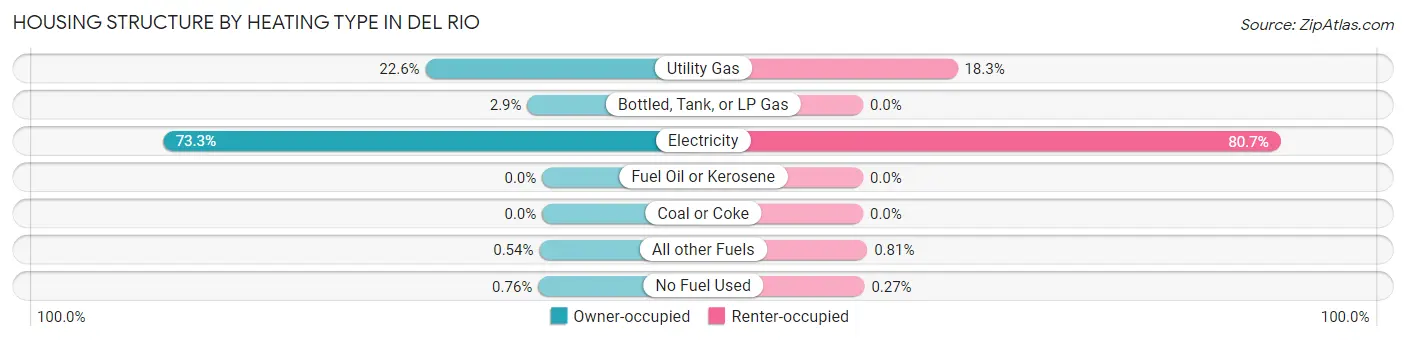
| Heating Type | Owner-occupied | Renter-occupied |
| Utility Gas | 1,829 (22.6%) | 740 (18.2%) |
| Bottled, Tank, or LP Gas | 231 (2.9%) | 0 (0.0%) |
| Electricity | 5,946 (73.3%) | 3,270 (80.7%) |
| Fuel Oil or Kerosene | 0 (0.0%) | 0 (0.0%) |
| Coal or Coke | 0 (0.0%) | 0 (0.0%) |
| All other Fuels | 44 (0.5%) | 33 (0.8%) |
| No Fuel Used | 62 (0.8%) | 11 (0.3%) |
| Total | 8,112 (100.0%) | 4,054 (100.0%) |
Household Vehicle Usage in Del Rio
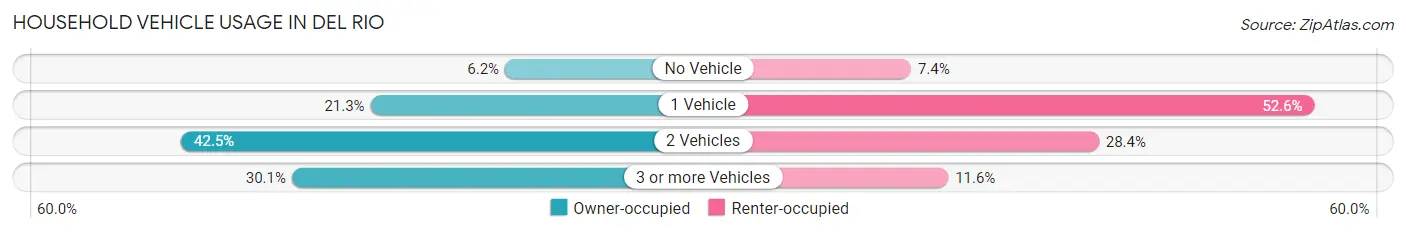
| Vehicles per Household | Owner-occupied | Renter-occupied |
| No Vehicle | 502 (6.2%) | 300 (7.4%) |
| 1 Vehicle | 1,725 (21.3%) | 2,132 (52.6%) |
| 2 Vehicles | 3,446 (42.5%) | 1,153 (28.4%) |
| 3 or more Vehicles | 2,439 (30.1%) | 469 (11.6%) |
| Total | 8,112 (100.0%) | 4,054 (100.0%) |
Real Estate & Mortgages in Del Rio
Real Estate and Mortgage Overview in Del Rio
| Characteristic | Without Mortgage | With Mortgage |
| Housing Units | 4,795 | 3,317 |
| Median Property Value | $97,500 | $181,000 |
| Median Household Income | $51,055 | $596 |
| Monthly Housing Costs | $456 | $71 |
| Real Estate Taxes | $1,361 | $128 |
Property Value by Mortgage Status in Del Rio
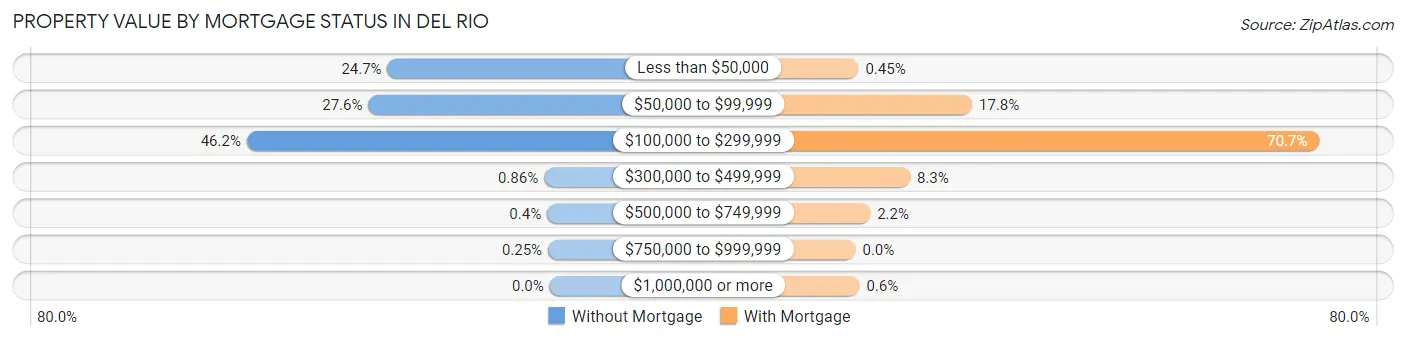
| Property Value | Without Mortgage | With Mortgage |
| Less than $50,000 | 1,185 (24.7%) | 15 (0.4%) |
| $50,000 to $99,999 | 1,325 (27.6%) | 589 (17.8%) |
| $100,000 to $299,999 | 2,213 (46.2%) | 2,344 (70.7%) |
| $300,000 to $499,999 | 41 (0.9%) | 275 (8.3%) |
| $500,000 to $749,999 | 19 (0.4%) | 74 (2.2%) |
| $750,000 to $999,999 | 12 (0.3%) | 0 (0.0%) |
| $1,000,000 or more | 0 (0.0%) | 20 (0.6%) |
| Total | 4,795 (100.0%) | 3,317 (100.0%) |
Household Income by Mortgage Status in Del Rio
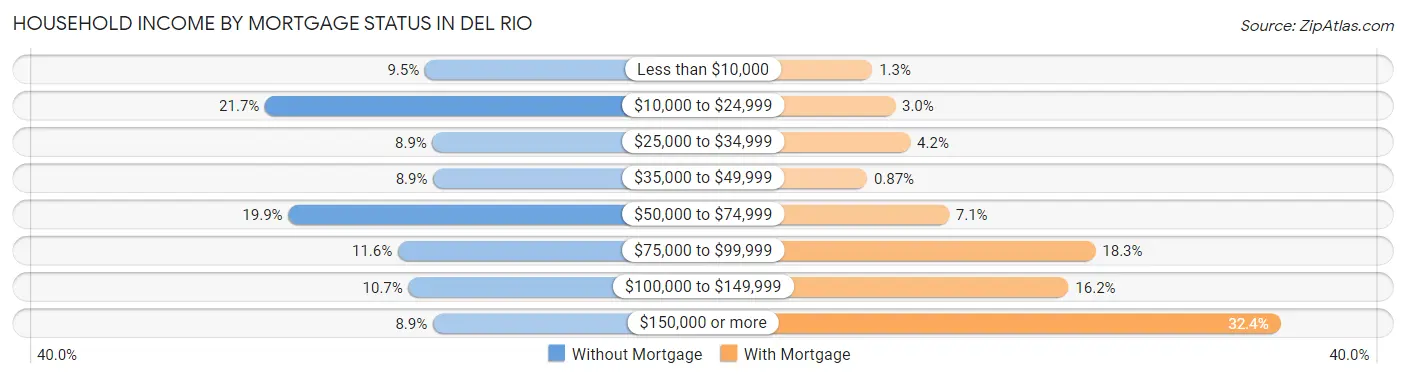
| Household Income | Without Mortgage | With Mortgage |
| Less than $10,000 | 455 (9.5%) | 42 (1.3%) |
| $10,000 to $24,999 | 1,039 (21.7%) | 100 (3.0%) |
| $25,000 to $34,999 | 427 (8.9%) | 138 (4.2%) |
| $35,000 to $49,999 | 425 (8.9%) | 29 (0.9%) |
| $50,000 to $74,999 | 954 (19.9%) | 236 (7.1%) |
| $75,000 to $99,999 | 554 (11.6%) | 606 (18.3%) |
| $100,000 to $149,999 | 515 (10.7%) | 538 (16.2%) |
| $150,000 or more | 426 (8.9%) | 1,074 (32.4%) |
| Total | 4,795 (100.0%) | 3,317 (100.0%) |
Property Value to Household Income Ratio in Del Rio

| Value-to-Income Ratio | Without Mortgage | With Mortgage |
| Less than 2.0x | 2,506 (52.3%) | 102,396 (3,087.0%) |
| 2.0x to 2.9x | 556 (11.6%) | 1,753 (52.8%) |
| 3.0x to 3.9x | 521 (10.9%) | 994 (30.0%) |
| 4.0x or more | 1,137 (23.7%) | 155 (4.7%) |
| Total | 4,795 (100.0%) | 3,317 (100.0%) |
Real Estate Taxes by Mortgage Status in Del Rio

| Property Taxes | Without Mortgage | With Mortgage |
| Less than $800 | 1,489 (31.0%) | 10 (0.3%) |
| $800 to $1,499 | 877 (18.3%) | 73 (2.2%) |
| $800 to $1,499 | 2,036 (42.5%) | 588 (17.7%) |
| Total | 4,795 (100.0%) | 3,317 (100.0%) |
Health & Disability in Del Rio
Health Insurance Coverage by Age in Del Rio
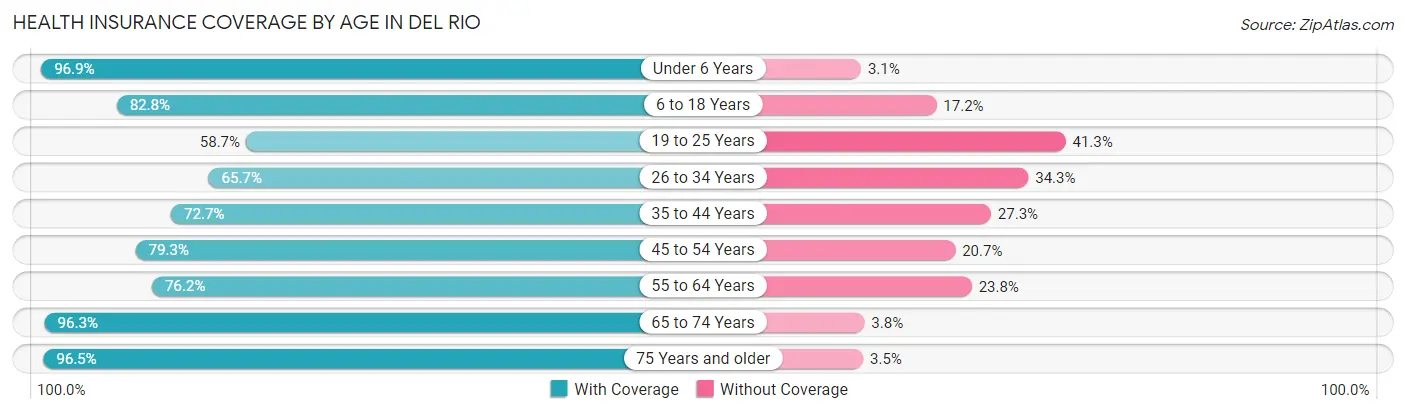
| Age Bracket | With Coverage | Without Coverage |
| Under 6 Years | 3,330 (96.9%) | 107 (3.1%) |
| 6 to 18 Years | 5,759 (82.8%) | 1,195 (17.2%) |
| 19 to 25 Years | 2,019 (58.7%) | 1,418 (41.3%) |
| 26 to 34 Years | 2,339 (65.7%) | 1,222 (34.3%) |
| 35 to 44 Years | 2,867 (72.7%) | 1,079 (27.3%) |
| 45 to 54 Years | 2,756 (79.3%) | 719 (20.7%) |
| 55 to 64 Years | 2,497 (76.2%) | 778 (23.8%) |
| 65 to 74 Years | 2,463 (96.3%) | 96 (3.7%) |
| 75 Years and older | 2,309 (96.5%) | 84 (3.5%) |
| Total | 26,339 (79.7%) | 6,698 (20.3%) |
Health Insurance Coverage by Citizenship Status in Del Rio

| Citizenship Status | With Coverage | Without Coverage |
| Native Born | 3,330 (96.9%) | 107 (3.1%) |
| Foreign Born, Citizen | 5,759 (82.8%) | 1,195 (17.2%) |
| Foreign Born, not a Citizen | 2,019 (58.7%) | 1,418 (41.3%) |
Health Insurance Coverage by Household Income in Del Rio
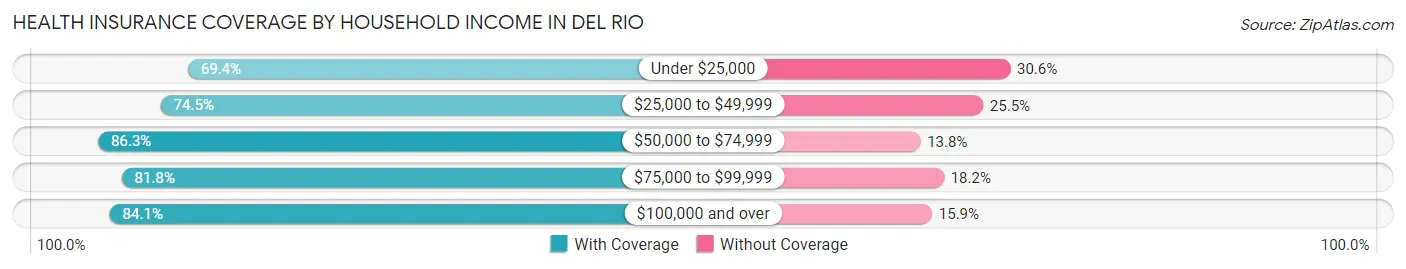
| Household Income | With Coverage | Without Coverage |
| Under $25,000 | 4,215 (69.4%) | 1,858 (30.6%) |
| $25,000 to $49,999 | 4,618 (74.5%) | 1,581 (25.5%) |
| $50,000 to $74,999 | 5,045 (86.3%) | 804 (13.8%) |
| $75,000 to $99,999 | 2,844 (81.8%) | 631 (18.2%) |
| $100,000 and over | 9,582 (84.1%) | 1,817 (15.9%) |
Public vs Private Health Insurance Coverage by Age in Del Rio
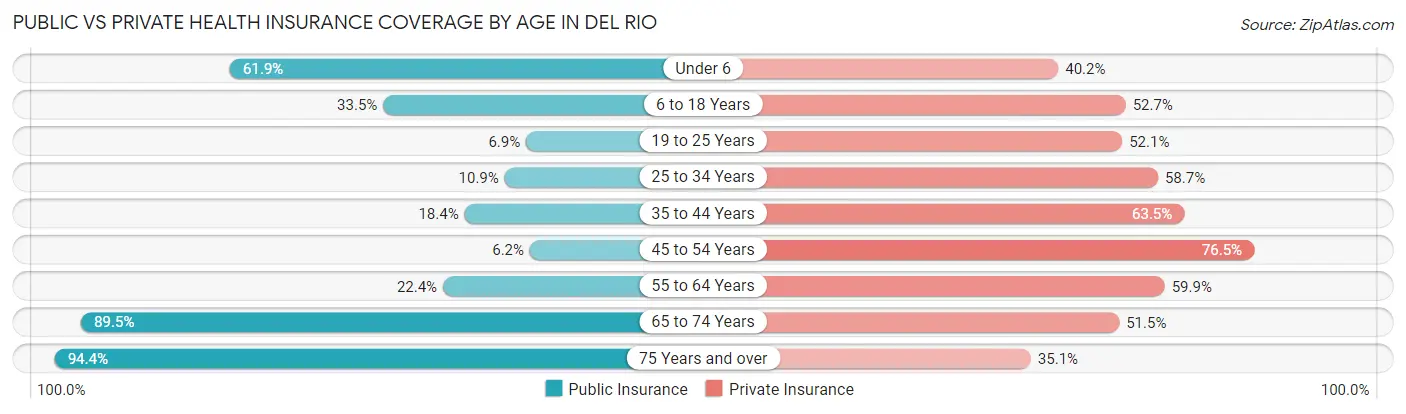
| Age Bracket | Public Insurance | Private Insurance |
| Under 6 | 2,127 (61.9%) | 1,381 (40.2%) |
| 6 to 18 Years | 2,326 (33.5%) | 3,665 (52.7%) |
| 19 to 25 Years | 238 (6.9%) | 1,789 (52.0%) |
| 25 to 34 Years | 388 (10.9%) | 2,090 (58.7%) |
| 35 to 44 Years | 724 (18.3%) | 2,507 (63.5%) |
| 45 to 54 Years | 216 (6.2%) | 2,658 (76.5%) |
| 55 to 64 Years | 732 (22.4%) | 1,963 (59.9%) |
| 65 to 74 Years | 2,291 (89.5%) | 1,318 (51.5%) |
| 75 Years and over | 2,259 (94.4%) | 840 (35.1%) |
| Total | 11,301 (34.2%) | 18,211 (55.1%) |
Disability Status by Sex by Age in Del Rio
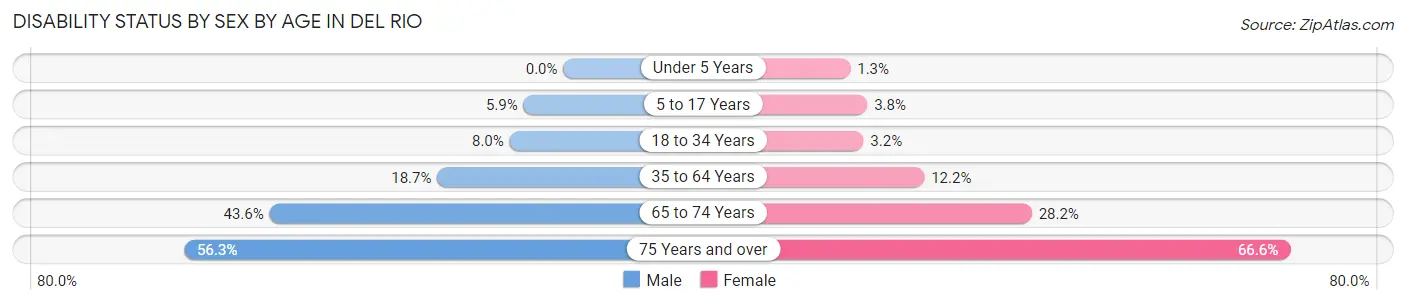
| Age Bracket | Male | Female |
| Under 5 Years | 0 (0.0%) | 17 (1.3%) |
| 5 to 17 Years | 222 (5.9%) | 132 (3.8%) |
| 18 to 34 Years | 316 (8.0%) | 111 (3.2%) |
| 35 to 64 Years | 1,019 (18.7%) | 643 (12.2%) |
| 65 to 74 Years | 462 (43.6%) | 423 (28.2%) |
| 75 Years and over | 565 (56.3%) | 925 (66.5%) |
Disability Class by Sex by Age in Del Rio
Disability Class: Hearing Difficulty
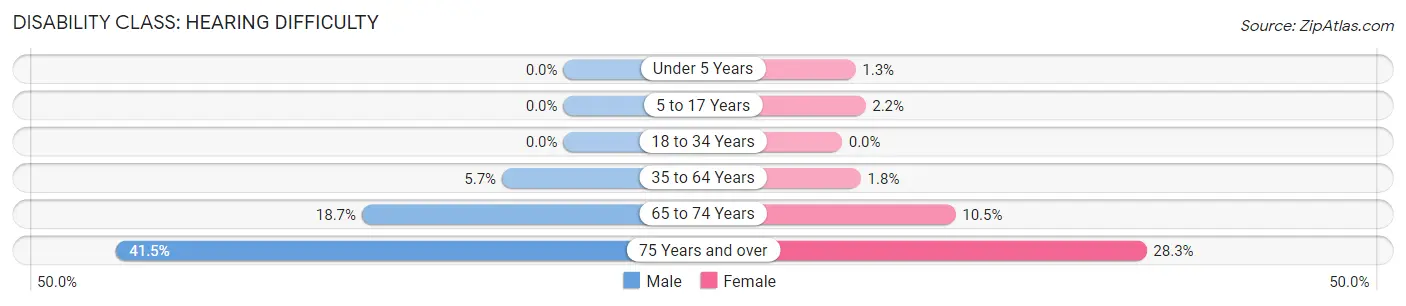
| Age Bracket | Male | Female |
| Under 5 Years | 0 (0.0%) | 17 (1.3%) |
| 5 to 17 Years | 0 (0.0%) | 76 (2.2%) |
| 18 to 34 Years | 0 (0.0%) | 0 (0.0%) |
| 35 to 64 Years | 310 (5.7%) | 92 (1.8%) |
| 65 to 74 Years | 198 (18.7%) | 158 (10.5%) |
| 75 Years and over | 416 (41.5%) | 393 (28.3%) |
Disability Class: Vision Difficulty
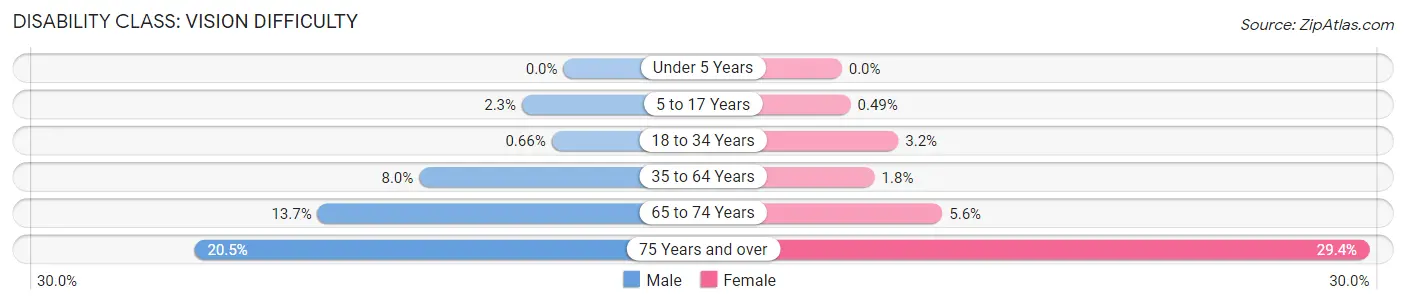
| Age Bracket | Male | Female |
| Under 5 Years | 0 (0.0%) | 0 (0.0%) |
| 5 to 17 Years | 87 (2.3%) | 17 (0.5%) |
| 18 to 34 Years | 26 (0.7%) | 109 (3.2%) |
| 35 to 64 Years | 437 (8.0%) | 96 (1.8%) |
| 65 to 74 Years | 145 (13.7%) | 84 (5.6%) |
| 75 Years and over | 206 (20.5%) | 408 (29.3%) |
Disability Class: Cognitive Difficulty
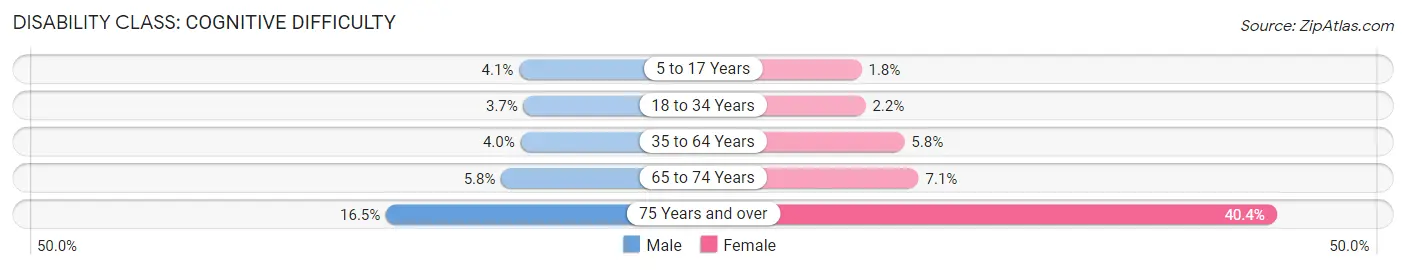
| Age Bracket | Male | Female |
| 5 to 17 Years | 154 (4.1%) | 64 (1.8%) |
| 18 to 34 Years | 146 (3.7%) | 76 (2.2%) |
| 35 to 64 Years | 216 (4.0%) | 305 (5.8%) |
| 65 to 74 Years | 61 (5.8%) | 107 (7.1%) |
| 75 Years and over | 165 (16.5%) | 561 (40.4%) |
Disability Class: Ambulatory Difficulty
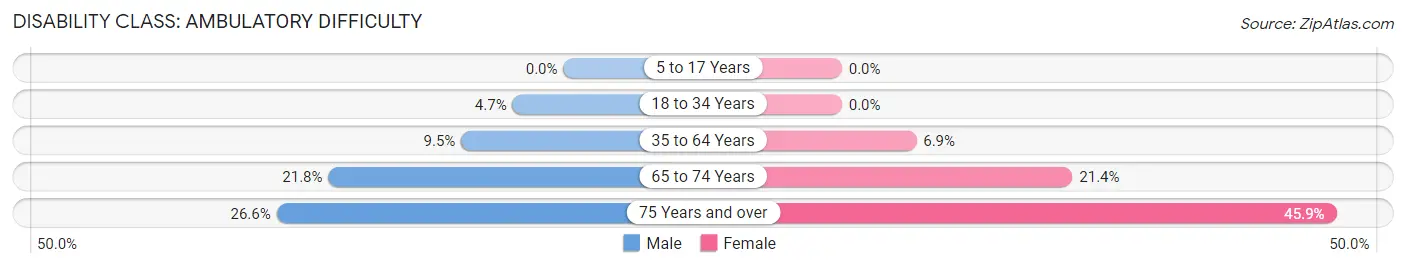
| Age Bracket | Male | Female |
| 5 to 17 Years | 0 (0.0%) | 0 (0.0%) |
| 18 to 34 Years | 187 (4.7%) | 0 (0.0%) |
| 35 to 64 Years | 516 (9.5%) | 363 (6.9%) |
| 65 to 74 Years | 231 (21.8%) | 321 (21.4%) |
| 75 Years and over | 267 (26.6%) | 638 (45.9%) |
Disability Class: Self-Care Difficulty
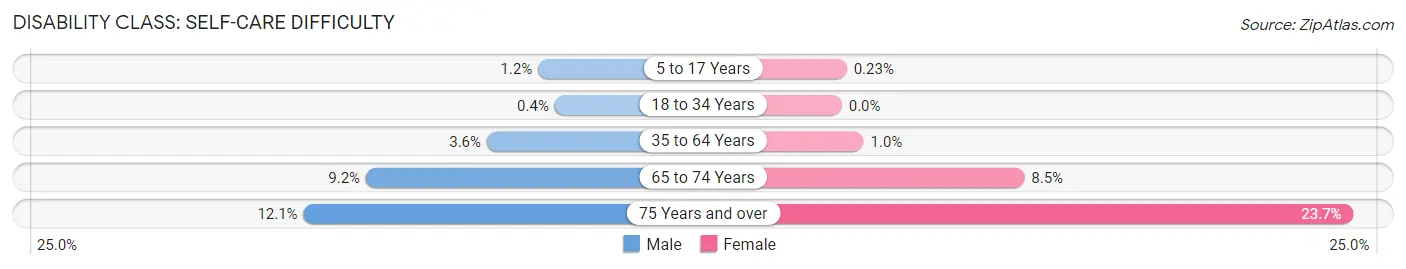
| Age Bracket | Male | Female |
| 5 to 17 Years | 44 (1.2%) | 8 (0.2%) |
| 18 to 34 Years | 16 (0.4%) | 0 (0.0%) |
| 35 to 64 Years | 193 (3.5%) | 53 (1.0%) |
| 65 to 74 Years | 97 (9.2%) | 127 (8.5%) |
| 75 Years and over | 121 (12.1%) | 330 (23.7%) |
Technology Access in Del Rio
Computing Device Access in Del Rio

| Device Type | # Households | % Households |
| Desktop or Laptop | 7,638 | 62.8% |
| Smartphone | 10,095 | 83.0% |
| Tablet | 7,160 | 58.9% |
| No Computing Device | 1,430 | 11.7% |
| Total | 12,166 | 100.0% |
Internet Access in Del Rio
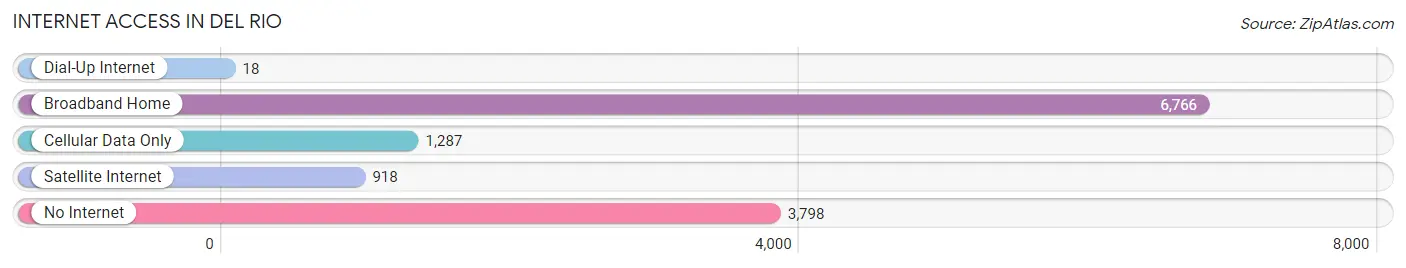
| Internet Type | # Households | % Households |
| Dial-Up Internet | 18 | 0.2% |
| Broadband Home | 6,766 | 55.6% |
| Cellular Data Only | 1,287 | 10.6% |
| Satellite Internet | 918 | 7.5% |
| No Internet | 3,798 | 31.2% |
| Total | 12,166 | 100.0% |
Del Rio Summary
Del Rio, Texas is a city located in Val Verde County in the southwestern part of the state. It is situated on the northern bank of the Rio Grande, across from Ciudad Acuña, Coahuila, Mexico. The city is known for its rich history, diverse geography, vibrant economy, and unique demographics.
History
Del Rio was founded in 1868 by a group of settlers from San Antonio, led by Don Jesus Treviño. The city was named after the nearby Rio Grande, which was known as the “Rio del Valle” or “River of the Valley” in Spanish. The settlers established a trading post and a ferry service across the river, which quickly became a popular crossing point for travelers and traders.
In 1883, the International-Great Northern Railroad arrived in Del Rio, connecting the city to San Antonio and other major cities in Texas. This allowed for the growth of the local economy and the population of the city began to grow rapidly.
In the early 1900s, Del Rio became a popular tourist destination due to its proximity to Mexico and its natural beauty. The city was also known for its mineral springs, which were believed to have healing properties.
In the 1920s, Del Rio experienced a period of economic growth due to the discovery of oil in the area. This led to the construction of several oil refineries and other industries, which provided jobs for many of the city’s residents.
In the 1950s, Del Rio was chosen as the site of a new Air Force base, Laughlin Air Force Base. This brought a large influx of military personnel to the city and helped to further stimulate the local economy.
Geography
Del Rio is located in the southwestern part of Texas, on the northern bank of the Rio Grande. The city is situated in a semi-arid region, with an average annual rainfall of just over 20 inches. The climate is generally hot and dry, with temperatures ranging from the mid-80s in the summer to the mid-50s in the winter.
The city is surrounded by several mountain ranges, including the Sierra Vieja, the Sierra de la Madera, and the Sierra de la Palma. The Rio Grande forms the western border of the city, while the Amistad Reservoir is located to the east.
Economy
Del Rio’s economy is largely based on tourism, agriculture, and the military. The city is home to Laughlin Air Force Base, which is the largest employer in the area. The base provides jobs for over 5,000 people and contributes significantly to the local economy.
Agriculture is also an important part of the local economy, with cotton, sorghum, and wheat being the main crops grown in the area. Tourism is also a major industry in Del Rio, with the city being a popular destination for outdoor activities such as fishing, hunting, and camping.
Demographics
As of the 2010 census, the population of Del Rio was 35,591. The city has a diverse population, with the majority of residents being of Hispanic or Latino origin. The city also has a significant population of African Americans, Native Americans, and other ethnicities.
The median household income in Del Rio is $35,845, which is slightly lower than the national average. The city has a poverty rate of 22.3%, which is higher than the national average.
Del Rio is a vibrant and diverse city with a rich history, diverse geography, vibrant economy, and unique demographics. The city is home to a large military base, which provides jobs for many of its residents. It is also a popular tourist destination, with its proximity to Mexico and its natural beauty. The city has a diverse population and a median household income that is slightly lower than the national average.
Common Questions
What is Per Capita Income in Del Rio?
Per Capita income in Del Rio is $24,540.
What is the Median Family Income in Del Rio?
Median Family Income in Del Rio is $68,415.
What is the Median Household income in Del Rio?
Median Household Income in Del Rio is $57,072.
What is Income or Wage Gap in Del Rio?
Income or Wage Gap in Del Rio is 34.9%.
Women in Del Rio earn 65.1 cents for every dollar earned by a man.
What is Family Income Deficit in Del Rio?
Family Income Deficit in Del Rio is $12,137.
Families that are below poverty line in Del Rio earn $12,137 less on average than the poverty threshold level.
What is Inequality or Gini Index in Del Rio?
Inequality or Gini Index in Del Rio is 0.45.
What is the Total Population of Del Rio?
Total Population of Del Rio is 34,722.
What is the Total Male Population of Del Rio?
Total Male Population of Del Rio is 18,054.
What is the Total Female Population of Del Rio?
Total Female Population of Del Rio is 16,668.
What is the Ratio of Males per 100 Females in Del Rio?
There are 108.32 Males per 100 Females in Del Rio.
What is the Ratio of Females per 100 Males in Del Rio?
There are 92.32 Females per 100 Males in Del Rio.
What is the Median Population Age in Del Rio?
Median Population Age in Del Rio is 32.9 Years.
What is the Average Family Size in Del Rio
Average Family Size in Del Rio is 3.3 People.
What is the Average Household Size in Del Rio
Average Household Size in Del Rio is 2.8 People.
How Large is the Labor Force in Del Rio?
There are 15,404 People in the Labor Forcein in Del Rio.
What is the Percentage of People in the Labor Force in Del Rio?
59.6% of People are in the Labor Force in Del Rio.
What is the Unemployment Rate in Del Rio?
Unemployment Rate in Del Rio is 2.6%.