Zip Codes with the Highest Percentage of Population Employed in Computer, Engineering & Science in the United States
RELATED REPORTS & OPTIONS
Computer, Engineering & Science
United States
Compare Zip Codes
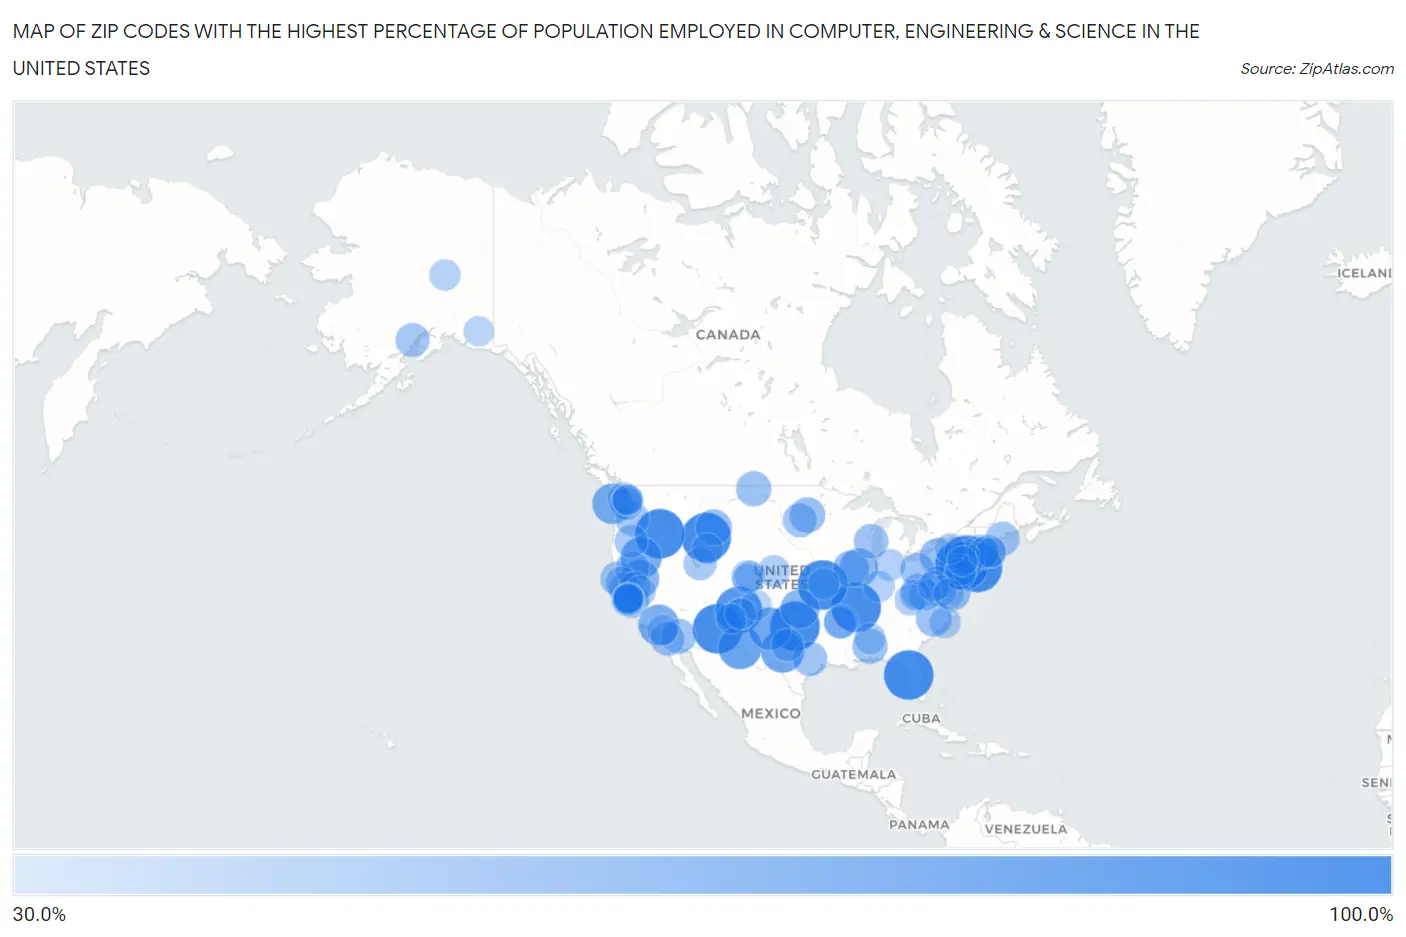
Map of Zip Codes with the Highest Percentage of Population Employed in Computer, Engineering & Science in the United States
30.0%
100.0%
Zip Codes with the Highest Percentage of Population Employed in Computer, Engineering & Science in the United States
| Zip Code | % Employed | vs State | vs National | |
| 1. | 18349 | 100.0% | 6.5%(+93.5)#1 | 6.8%(+93.2)#1 |
| 2. | 85927 | 100.0% | 6.8%(+93.2)#1 | 6.8%(+93.2)#2 |
| 3. | 34679 | 100.0% | 5.2%(+94.8)#1 | 6.8%(+93.2)#3 |
| 4. | 83424 | 100.0% | 5.8%(+94.2)#1 | 6.8%(+93.2)#4 |
| 5. | 63847 | 100.0% | 5.9%(+94.1)#1 | 6.8%(+93.2)#5 |
| 6. | 10985 | 100.0% | 5.8%(+94.2)#1 | 6.8%(+93.2)#6 |
| 7. | 11973 | 100.0% | 5.8%(+94.2)#2 | 6.8%(+93.2)#7 |
| 8. | 97903 | 100.0% | 7.5%(+92.5)#1 | 6.8%(+93.2)#8 |
| 9. | 73553 | 100.0% | 4.9%(+95.1)#1 | 6.8%(+93.2)#9 |
| 10. | 07881 | 100.0% | 7.7%(+92.3)#1 | 6.8%(+93.2)#10 |
| 11. | 66251 | 100.0% | 6.0%(+94.0)#1 | 6.8%(+93.2)#11 |
| 12. | 87064 | 90.9% | 6.7%(+84.2)#1 | 6.8%(+84.1)#12 |
| 13. | 79918 | 80.0% | 6.5%(+73.5)#1 | 6.8%(+73.2)#13 |
| 14. | 76957 | 78.3% | 6.5%(+71.8)#2 | 6.8%(+71.5)#14 |
| 15. | 79369 | 77.4% | 6.5%(+70.9)#3 | 6.8%(+70.7)#15 |
| 16. | 97635 | 72.2% | 7.5%(+64.6)#2 | 6.8%(+65.4)#16 |
| 17. | 93563 | 71.4% | 8.0%(+63.5)#1 | 6.8%(+64.7)#17 |
| 18. | 98562 | 70.5% | 10.2%(+60.4)#1 | 6.8%(+63.7)#18 |
| 19. | 73705 | 65.4% | 4.9%(+60.5)#2 | 6.8%(+58.6)#19 |
| 20. | 96124 | 63.8% | 8.0%(+55.8)#2 | 6.8%(+57.0)#20 |
| 21. | 61552 | 63.3% | 6.4%(+56.9)#1 | 6.8%(+56.6)#21 |
| 22. | 61478 | 57.7% | 6.4%(+51.3)#2 | 6.8%(+50.9)#22 |
| 23. | 59081 | 56.9% | 5.4%(+51.5)#1 | 6.8%(+50.1)#23 |
| 24. | 95140 | 56.0% | 8.0%(+48.0)#3 | 6.8%(+49.2)#24 |
| 25. | 16727 | 55.6% | 6.5%(+49.0)#2 | 6.8%(+48.8)#25 |
| 26. | 20630 | 54.8% | 10.7%(+44.1)#1 | 6.8%(+48.1)#26 |
| 27. | 28308 | 54.5% | 6.5%(+48.0)#1 | 6.8%(+47.8)#27 |
| 28. | 58074 | 54.3% | 4.7%(+49.6)#1 | 6.8%(+47.5)#28 |
| 29. | 95134 | 54.2% | 8.0%(+46.2)#4 | 6.8%(+47.4)#29 |
| 30. | 01066 | 53.8% | 9.8%(+44.0)#1 | 6.8%(+47.1)#30 |
| 31. | 59211 | 53.2% | 5.4%(+47.8)#2 | 6.8%(+46.5)#31 |
| 32. | 36727 | 53.2% | 5.7%(+47.5)#1 | 6.8%(+46.4)#32 |
| 33. | 77863 | 51.9% | 6.5%(+45.4)#4 | 6.8%(+45.1)#33 |
| 34. | 26656 | 51.9% | 4.4%(+47.4)#1 | 6.8%(+45.1)#34 |
| 35. | 92266 | 51.9% | 8.0%(+43.9)#5 | 6.8%(+45.1)#35 |
| 36. | 53031 | 51.3% | 6.4%(+44.9)#1 | 6.8%(+44.5)#36 |
| 37. | 44671 | 51.3% | 6.1%(+45.2)#1 | 6.8%(+44.5)#37 |
| 38. | 95417 | 50.7% | 8.0%(+42.7)#6 | 6.8%(+43.9)#38 |
| 39. | 91948 | 50.0% | 8.0%(+42.0)#7 | 6.8%(+43.2)#39 |
| 40. | 12495 | 50.0% | 5.8%(+44.2)#3 | 6.8%(+43.2)#40 |
| 41. | 96040 | 50.0% | 8.0%(+42.0)#8 | 6.8%(+43.2)#41 |
| 42. | 04541 | 50.0% | 5.5%(+44.5)#1 | 6.8%(+43.2)#42 |
| 43. | 57421 | 50.0% | 4.8%(+45.2)#1 | 6.8%(+43.2)#43 |
| 44. | 98623 | 50.0% | 10.2%(+39.8)#2 | 6.8%(+43.2)#44 |
| 45. | 72099 | 49.2% | 4.1%(+45.1)#1 | 6.8%(+42.5)#45 |
| 46. | 99635 | 49.1% | 6.3%(+42.8)#1 | 6.8%(+42.3)#46 |
| 47. | 13859 | 49.1% | 5.8%(+43.2)#4 | 6.8%(+42.3)#47 |
| 48. | 26714 | 48.2% | 4.4%(+43.8)#2 | 6.8%(+41.5)#48 |
| 49. | 01718 | 48.1% | 9.8%(+38.2)#2 | 6.8%(+41.3)#49 |
| 50. | 97737 | 46.8% | 7.5%(+39.2)#3 | 6.8%(+40.0)#50 |
| 51. | 94576 | 46.7% | 8.0%(+38.7)#9 | 6.8%(+39.9)#51 |
| 52. | 84408 | 46.4% | 7.7%(+38.7)#1 | 6.8%(+39.7)#52 |
| 53. | 98345 | 46.0% | 10.2%(+35.8)#3 | 6.8%(+39.2)#53 |
| 54. | 79519 | 45.8% | 6.5%(+39.3)#5 | 6.8%(+39.1)#54 |
| 55. | 98421 | 45.5% | 10.2%(+35.3)#4 | 6.8%(+38.7)#55 |
| 56. | 10919 | 44.7% | 5.8%(+38.9)#5 | 6.8%(+37.9)#56 |
| 57. | 12724 | 44.2% | 5.8%(+38.4)#6 | 6.8%(+37.4)#57 |
| 58. | 94021 | 43.8% | 8.0%(+35.9)#10 | 6.8%(+37.1)#58 |
| 59. | 72201 | 43.7% | 4.1%(+39.6)#2 | 6.8%(+36.9)#59 |
| 60. | 94086 | 43.7% | 8.0%(+35.7)#11 | 6.8%(+36.9)#60 |
| 61. | 95493 | 43.5% | 8.0%(+35.5)#12 | 6.8%(+36.7)#61 |
| 62. | 80025 | 42.9% | 9.0%(+33.9)#1 | 6.8%(+36.1)#62 |
| 63. | 69027 | 42.9% | 5.7%(+37.1)#1 | 6.8%(+36.1)#63 |
| 64. | 22732 | 42.6% | 9.8%(+32.7)#1 | 6.8%(+35.8)#64 |
| 65. | 24957 | 42.2% | 4.4%(+37.8)#3 | 6.8%(+35.5)#65 |
| 66. | 46704 | 42.1% | 5.5%(+36.6)#1 | 6.8%(+35.3)#66 |
| 67. | 28542 | 42.0% | 6.5%(+35.5)#2 | 6.8%(+35.2)#67 |
| 68. | 19490 | 41.7% | 6.5%(+35.2)#3 | 6.8%(+35.0)#68 |
| 69. | 95671 | 41.7% | 8.0%(+33.7)#13 | 6.8%(+34.9)#69 |
| 70. | 47522 | 41.6% | 5.5%(+36.1)#2 | 6.8%(+34.8)#70 |
| 71. | 87547 | 41.6% | 6.7%(+34.9)#2 | 6.8%(+34.8)#71 |
| 72. | 64101 | 41.5% | 5.9%(+35.7)#2 | 6.8%(+34.8)#72 |
| 73. | 95014 | 41.4% | 8.0%(+33.4)#14 | 6.8%(+34.6)#73 |
| 74. | 35443 | 41.3% | 5.7%(+35.6)#2 | 6.8%(+34.6)#74 |
| 75. | 95224 | 41.3% | 8.0%(+33.3)#15 | 6.8%(+34.5)#75 |
| 76. | 99775 | 41.0% | 6.3%(+34.7)#2 | 6.8%(+34.2)#76 |
| 77. | 41534 | 40.7% | 4.6%(+36.1)#1 | 6.8%(+34.0)#77 |
| 78. | 25047 | 40.7% | 4.4%(+36.3)#4 | 6.8%(+34.0)#78 |
| 79. | 83111 | 40.7% | 4.7%(+36.0)#1 | 6.8%(+33.9)#79 |
| 80. | 18921 | 40.4% | 6.5%(+33.8)#4 | 6.8%(+33.6)#80 |
| 81. | 87544 | 40.2% | 6.7%(+33.6)#3 | 6.8%(+33.5)#81 |
| 82. | 94085 | 40.1% | 8.0%(+32.1)#16 | 6.8%(+33.3)#82 |
| 83. | 95054 | 40.0% | 8.0%(+32.1)#17 | 6.8%(+33.3)#83 |
| 84. | 26838 | 40.0% | 4.4%(+35.6)#5 | 6.8%(+33.2)#84 |
| 85. | 01094 | 40.0% | 9.8%(+30.2)#3 | 6.8%(+33.2)#85 |
| 86. | 94087 | 39.3% | 8.0%(+31.4)#18 | 6.8%(+32.6)#86 |
| 87. | 98052 | 39.0% | 10.2%(+28.8)#5 | 6.8%(+32.2)#87 |
| 88. | 92518 | 38.8% | 8.0%(+30.8)#19 | 6.8%(+32.0)#88 |
| 89. | 98007 | 38.7% | 10.2%(+28.6)#6 | 6.8%(+31.9)#89 |
| 90. | 13065 | 38.6% | 5.8%(+32.8)#7 | 6.8%(+31.9)#90 |
| 91. | 22476 | 38.5% | 9.8%(+28.6)#2 | 6.8%(+31.7)#91 |
| 92. | 88414 | 38.5% | 6.7%(+31.8)#4 | 6.8%(+31.7)#92 |
| 93. | 94539 | 38.4% | 8.0%(+30.5)#20 | 6.8%(+31.7)#93 |
| 94. | 94040 | 38.3% | 8.0%(+30.4)#21 | 6.8%(+31.6)#94 |
| 95. | 80024 | 38.2% | 9.0%(+29.2)#2 | 6.8%(+31.5)#95 |
| 96. | 80453 | 38.2% | 9.0%(+29.2)#3 | 6.8%(+31.4)#96 |
| 97. | 87049 | 38.2% | 6.7%(+31.5)#5 | 6.8%(+31.4)#97 |
| 98. | 99566 | 38.1% | 6.3%(+31.8)#3 | 6.8%(+31.3)#98 |
| 99. | 18457 | 38.1% | 6.5%(+31.6)#5 | 6.8%(+31.3)#99 |
| 100. | 02142 | 38.0% | 9.8%(+28.1)#4 | 6.8%(+31.2)#100 |
Common Questions
What are the Top 10 Zip Codes with the Highest Percentage of Population Employed in Computer, Engineering & Science in the United States?
Top 10 Zip Codes with the Highest Percentage of Population Employed in Computer, Engineering & Science in the United States are:
What zip code has the Highest Percentage of Population Employed in Computer, Engineering & Science in the United States?
18349 has the Highest Percentage of Population Employed in Computer, Engineering & Science in the United States with 100.0%.
What is the Percentage of Population Employed in Computer, Engineering & Science in the United States?
Percentage of Population Employed in Computer, Engineering & Science in the United States is 6.8%.