Seth Ward, TX Map & Demographics
Seth Ward Map
Seth Ward Overview
$16,066
PER CAPITA INCOME
$60,132
AVG FAMILY INCOME
$53,000
AVG HOUSEHOLD INCOME
31.7%
WAGE / INCOME GAP [ % ]
68.3¢/ $1
WAGE / INCOME GAP [ $ ]
0.36
INEQUALITY / GINI INDEX
1,921
TOTAL POPULATION
1,022
MALE POPULATION
899
FEMALE POPULATION
113.68
MALES / 100 FEMALES
87.96
FEMALES / 100 MALES
27.7
MEDIAN AGE
4.1
AVG FAMILY SIZE
3.7
AVG HOUSEHOLD SIZE
845
LABOR FORCE [ PEOPLE ]
67.3%
PERCENT IN LABOR FORCE
Income in Seth Ward
Income Overview in Seth Ward
Per Capita Income in Seth Ward is $16,066, while median incomes of families and households are $60,132 and $53,000 respectively.
| Characteristic | Number | Measure |
| Per Capita Income | 1,921 | $16,066 |
| Median Family Income | 404 | $60,132 |
| Mean Family Income | 404 | $69,041 |
| Median Household Income | 524 | $53,000 |
| Mean Household Income | 524 | $60,799 |
| Income Deficit | 404 | $0 |
| Wage / Income Gap (%) | 1,921 | 31.74% |
| Wage / Income Gap ($) | 1,921 | 68.26¢ per $1 |
| Gini / Inequality Index | 1,921 | 0.36 |
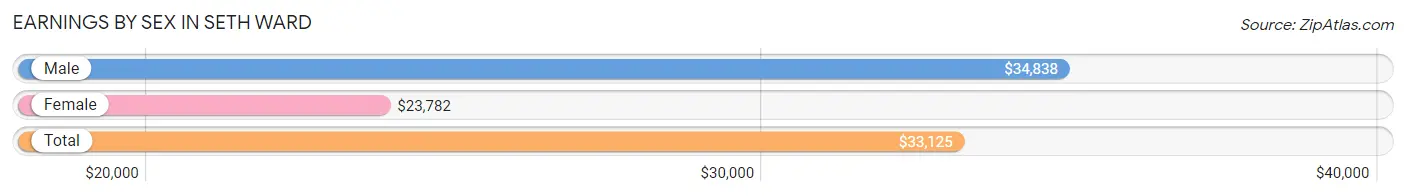
Earnings by Sex in Seth Ward
Average Earnings in Seth Ward are $33,125, $34,838 for men and $23,782 for women, a difference of 31.7%.
| Sex | Number | Average Earnings |
| Male | 593 (69.5%) | $34,838 |
| Female | 260 (30.5%) | $23,782 |
| Total | 853 (100.0%) | $33,125 |
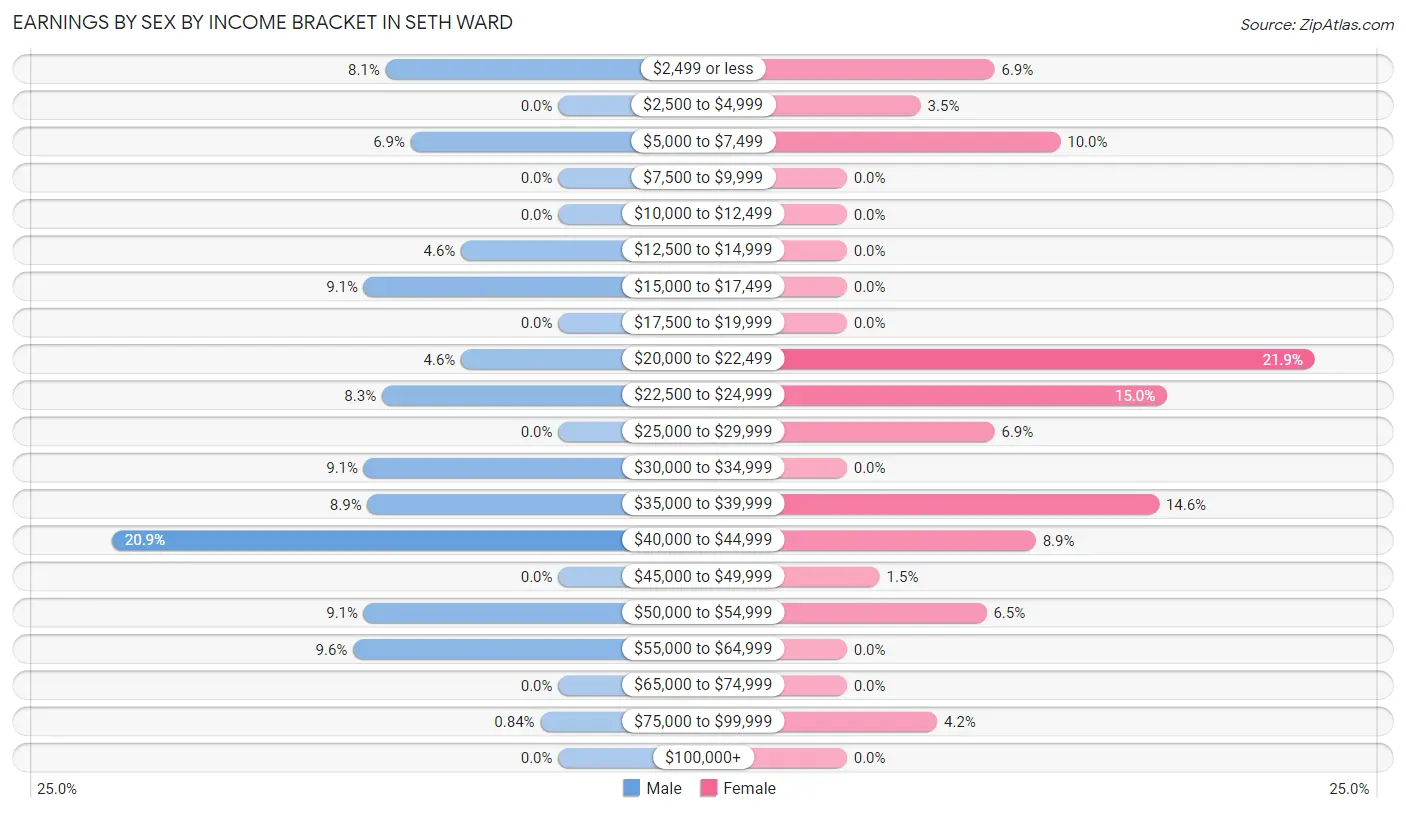
Earnings by Sex by Income Bracket in Seth Ward
The most common earnings brackets in Seth Ward are $40,000 to $44,999 for men (124 | 20.9%) and $20,000 to $22,499 for women (57 | 21.9%).
| Income | Male | Female |
| $2,499 or less | 48 (8.1%) | 18 (6.9%) |
| $2,500 to $4,999 | 0 (0.0%) | 9 (3.5%) |
| $5,000 to $7,499 | 41 (6.9%) | 26 (10.0%) |
| $7,500 to $9,999 | 0 (0.0%) | 0 (0.0%) |
| $10,000 to $12,499 | 0 (0.0%) | 0 (0.0%) |
| $12,500 to $14,999 | 27 (4.5%) | 0 (0.0%) |
| $15,000 to $17,499 | 54 (9.1%) | 0 (0.0%) |
| $17,500 to $19,999 | 0 (0.0%) | 0 (0.0%) |
| $20,000 to $22,499 | 27 (4.5%) | 57 (21.9%) |
| $22,500 to $24,999 | 49 (8.3%) | 39 (15.0%) |
| $25,000 to $29,999 | 0 (0.0%) | 18 (6.9%) |
| $30,000 to $34,999 | 54 (9.1%) | 0 (0.0%) |
| $35,000 to $39,999 | 53 (8.9%) | 38 (14.6%) |
| $40,000 to $44,999 | 124 (20.9%) | 23 (8.8%) |
| $45,000 to $49,999 | 0 (0.0%) | 4 (1.5%) |
| $50,000 to $54,999 | 54 (9.1%) | 17 (6.5%) |
| $55,000 to $64,999 | 57 (9.6%) | 0 (0.0%) |
| $65,000 to $74,999 | 0 (0.0%) | 0 (0.0%) |
| $75,000 to $99,999 | 5 (0.8%) | 11 (4.2%) |
| $100,000+ | 0 (0.0%) | 0 (0.0%) |
| Total | 593 (100.0%) | 260 (100.0%) |
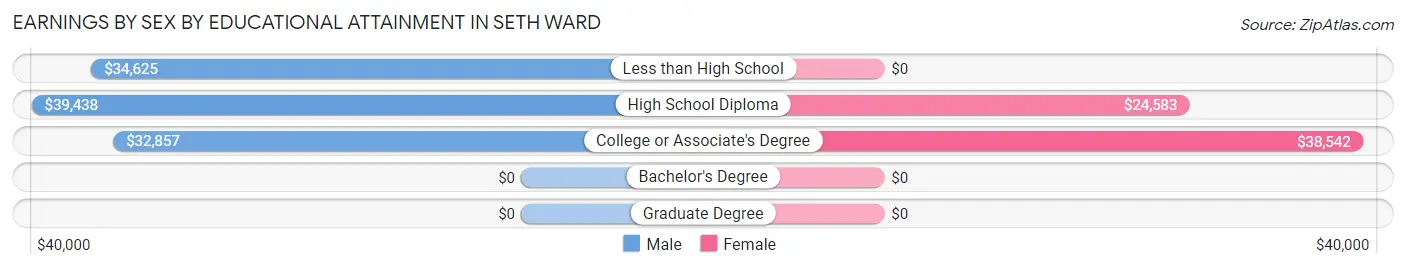
Earnings by Sex by Educational Attainment in Seth Ward
Average earnings in Seth Ward are $39,094 for men and $25,278 for women, a difference of 35.3%. Men with an educational attainment of high school diploma enjoy the highest average annual earnings of $39,438, while those with college or associate's degree education earn the least with $32,857. Women with an educational attainment of college or associate's degree earn the most with the average annual earnings of $38,542, while those with high school diploma education have the smallest earnings of $24,583.
| Educational Attainment | Male Income | Female Income |
| Less than High School | $34,625 | $0 |
| High School Diploma | $39,438 | $24,583 |
| College or Associate's Degree | $32,857 | $38,542 |
| Bachelor's Degree | - | - |
| Graduate Degree | - | - |
| Total | $39,094 | $25,278 |
Family Income in Seth Ward
Family Income Brackets in Seth Ward
According to the Seth Ward family income data, there are 124 families falling into the $50,000 to $74,999 income range, which is the most common income bracket and makes up 30.7% of all families.
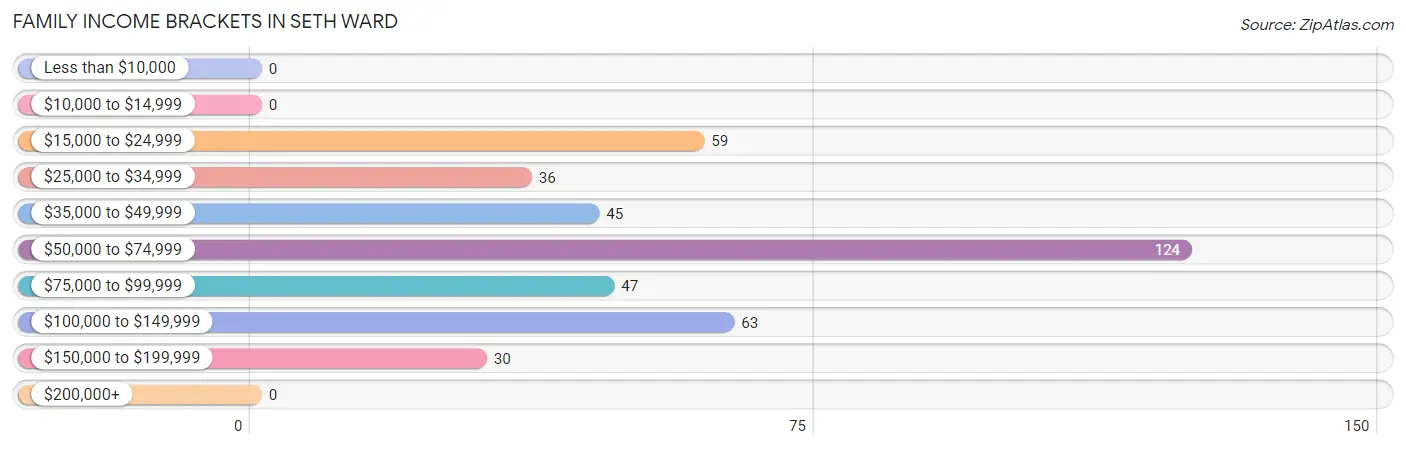
| Income Bracket | # Families | % Families |
| Less than $10,000 | 0 | 0.0% |
| $10,000 to $14,999 | 0 | 0.0% |
| $15,000 to $24,999 | 59 | 14.6% |
| $25,000 to $34,999 | 36 | 8.9% |
| $35,000 to $49,999 | 45 | 11.1% |
| $50,000 to $74,999 | 124 | 30.7% |
| $75,000 to $99,999 | 47 | 11.6% |
| $100,000 to $149,999 | 63 | 15.6% |
| $150,000 to $199,999 | 30 | 7.4% |
| $200,000+ | 0 | 0.0% |
Family Income by Famaliy Size in Seth Ward
2-person families (97 | 24.0%) account for the highest median family income in Seth Ward with $80,450 per family, while 2-person families (97 | 24.0%) have the highest median income of $40,225 per family member.
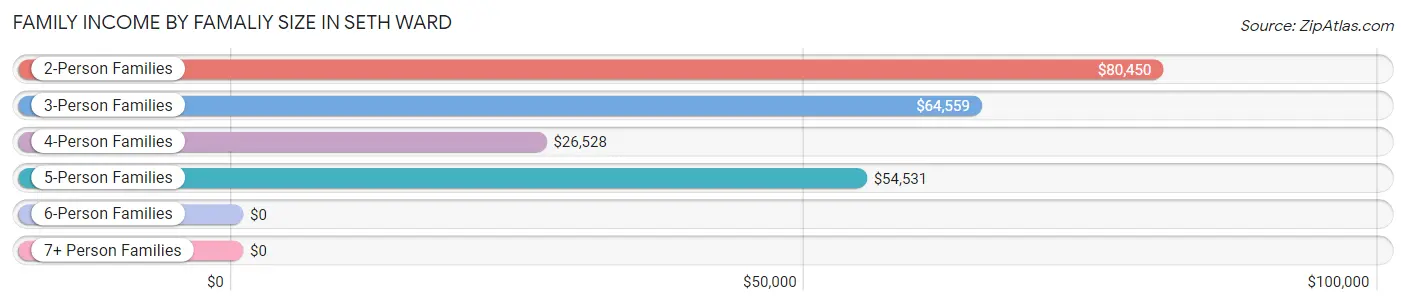
| Income Bracket | # Families | Median Income |
| 2-Person Families | 97 (24.0%) | $80,450 |
| 3-Person Families | 84 (20.8%) | $64,559 |
| 4-Person Families | 76 (18.8%) | $26,528 |
| 5-Person Families | 129 (31.9%) | $54,531 |
| 6-Person Families | 18 (4.5%) | $0 |
| 7+ Person Families | 0 (0.0%) | $0 |
| Total | 404 (100.0%) | $60,132 |
Family Income by Number of Earners in Seth Ward
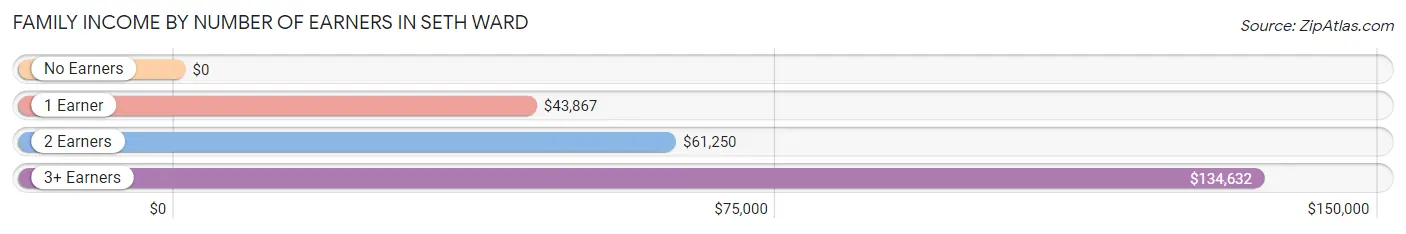
| Number of Earners | # Families | Median Income |
| No Earners | 25 (6.2%) | $0 |
| 1 Earner | 189 (46.8%) | $43,867 |
| 2 Earners | 125 (30.9%) | $61,250 |
| 3+ Earners | 65 (16.1%) | $134,632 |
| Total | 404 (100.0%) | $60,132 |
Household Income in Seth Ward
Household Income Brackets in Seth Ward
With 174 households falling in the category, the $50,000 to $74,999 income range is the most frequent in Seth Ward, accounting for 33.2% of all households.
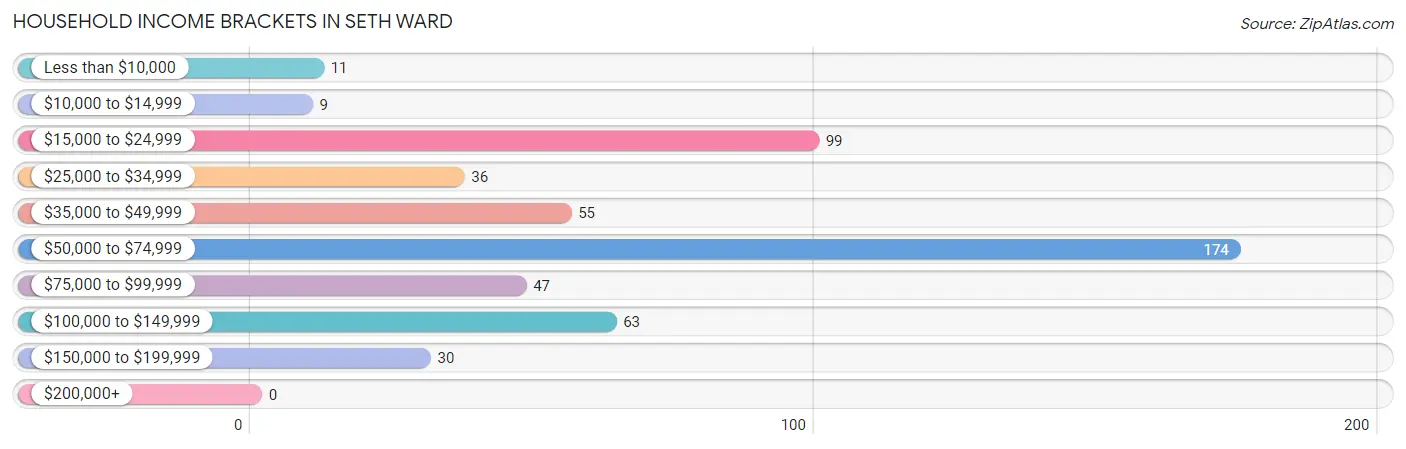
| Income Bracket | # Households | % Households |
| Less than $10,000 | 11 | 2.1% |
| $10,000 to $14,999 | 9 | 1.7% |
| $15,000 to $24,999 | 99 | 18.9% |
| $25,000 to $34,999 | 36 | 6.9% |
| $35,000 to $49,999 | 55 | 10.5% |
| $50,000 to $74,999 | 174 | 33.2% |
| $75,000 to $99,999 | 47 | 9.0% |
| $100,000 to $149,999 | 63 | 12.0% |
| $150,000 to $199,999 | 30 | 5.7% |
| $200,000+ | 0 | 0.0% |
Household Income by Householder Age in Seth Ward
The median household income in Seth Ward is $53,000, with the highest median household income of $60,724 found in the 45 to 64 years age bracket for the primary householder. A total of 251 households (47.9%) fall into this category. Meanwhile, the 15 to 24 years age bracket for the primary householder has the lowest median household income of $0, with 18 households (3.4%) in this group.
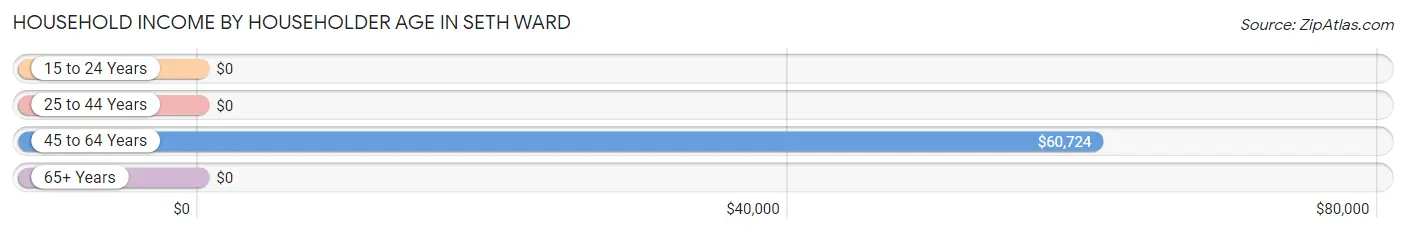
| Income Bracket | # Households | Median Income |
| 15 to 24 Years | 18 (3.4%) | $0 |
| 25 to 44 Years | 151 (28.8%) | $0 |
| 45 to 64 Years | 251 (47.9%) | $60,724 |
| 65+ Years | 104 (19.9%) | $0 |
| Total | 524 (100.0%) | $53,000 |
Poverty in Seth Ward
Income Below Poverty by Sex and Age in Seth Ward
With 10.5% poverty level for males and 19.1% for females among the residents of Seth Ward, 5 year old males and 75 year old and over females are the most vulnerable to poverty, with 23 males (100.0%) and 8 females (57.1%) in their respective age groups living below the poverty level.
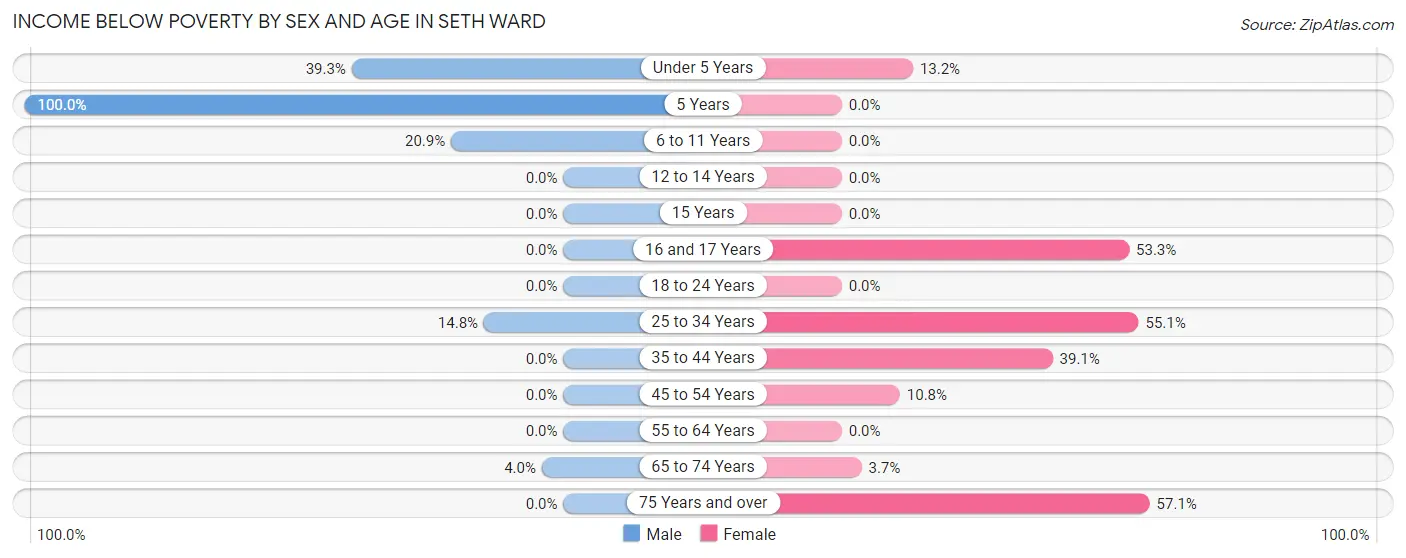
| Age Bracket | Male | Female |
| Under 5 Years | 11 (39.3%) | 21 (13.2%) |
| 5 Years | 23 (100.0%) | 0 (0.0%) |
| 6 to 11 Years | 44 (20.8%) | 0 (0.0%) |
| 12 to 14 Years | 0 (0.0%) | 0 (0.0%) |
| 15 Years | 0 (0.0%) | 0 (0.0%) |
| 16 and 17 Years | 0 (0.0%) | 8 (53.3%) |
| 18 to 24 Years | 0 (0.0%) | 0 (0.0%) |
| 25 to 34 Years | 27 (14.7%) | 103 (55.1%) |
| 35 to 44 Years | 0 (0.0%) | 18 (39.1%) |
| 45 to 54 Years | 0 (0.0%) | 11 (10.8%) |
| 55 to 64 Years | 0 (0.0%) | 0 (0.0%) |
| 65 to 74 Years | 2 (4.0%) | 3 (3.7%) |
| 75 Years and over | 0 (0.0%) | 8 (57.1%) |
| Total | 107 (10.5%) | 172 (19.1%) |
Income Above Poverty by Sex and Age in Seth Ward
According to the poverty statistics in Seth Ward, males aged 12 to 14 years and females aged 5 years are the age groups that are most secure financially, with 100.0% of males and 100.0% of females in these age groups living above the poverty line.
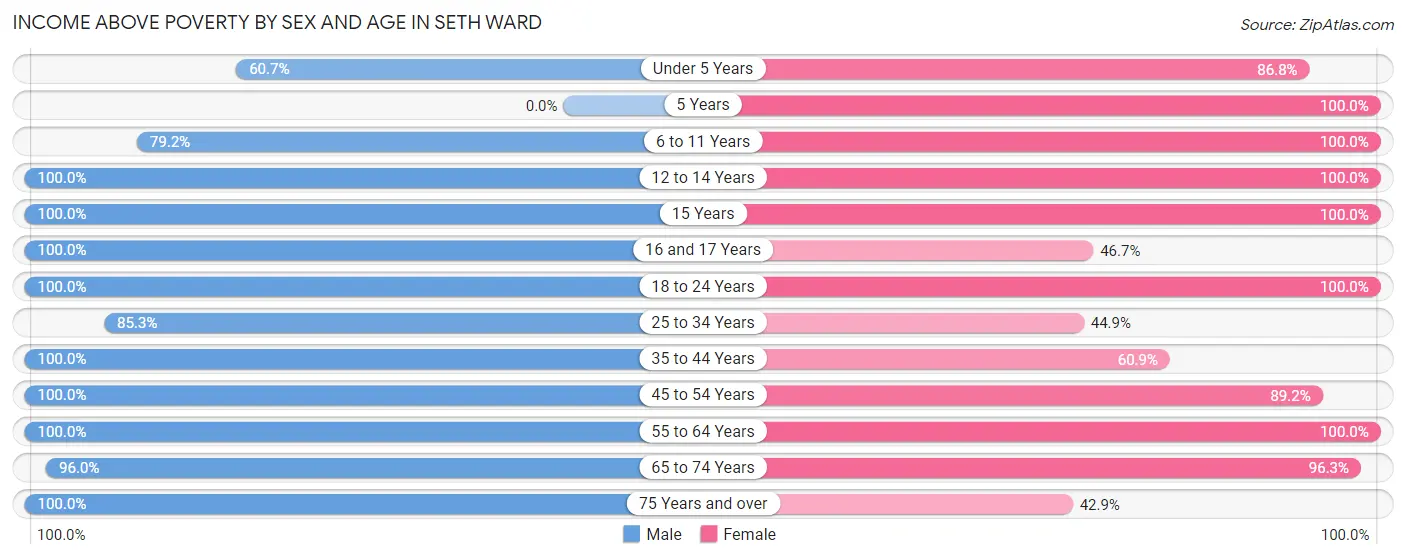
| Age Bracket | Male | Female |
| Under 5 Years | 17 (60.7%) | 138 (86.8%) |
| 5 Years | 0 (0.0%) | 18 (100.0%) |
| 6 to 11 Years | 167 (79.1%) | 60 (100.0%) |
| 12 to 14 Years | 33 (100.0%) | 13 (100.0%) |
| 15 Years | 48 (100.0%) | 73 (100.0%) |
| 16 and 17 Years | 48 (100.0%) | 7 (46.7%) |
| 18 to 24 Years | 72 (100.0%) | 46 (100.0%) |
| 25 to 34 Years | 156 (85.3%) | 84 (44.9%) |
| 35 to 44 Years | 68 (100.0%) | 28 (60.9%) |
| 45 to 54 Years | 141 (100.0%) | 91 (89.2%) |
| 55 to 64 Years | 109 (100.0%) | 84 (100.0%) |
| 65 to 74 Years | 48 (96.0%) | 79 (96.3%) |
| 75 Years and over | 8 (100.0%) | 6 (42.9%) |
| Total | 915 (89.5%) | 727 (80.9%) |
Income Below Poverty Among Married-Couple Families in Seth Ward
The poverty statistics for married-couple families in Seth Ward show that 0.8% or 2 of the total 255 families live below the poverty line. Families with no children have the highest poverty rate of 2.1%, comprising of 2 families. On the other hand, families with 1 or 2 children have the lowest poverty rate of 0.0%, which includes 0 families.
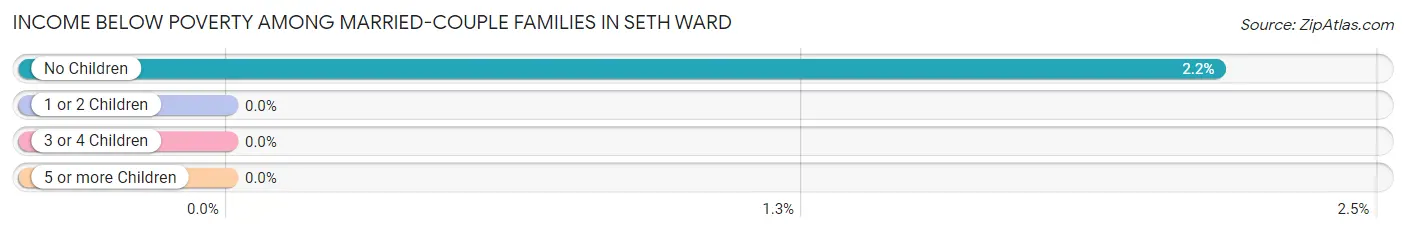
| Children | Above Poverty | Below Poverty |
| No Children | 91 (97.9%) | 2 (2.1%) |
| 1 or 2 Children | 135 (100.0%) | 0 (0.0%) |
| 3 or 4 Children | 27 (100.0%) | 0 (0.0%) |
| 5 or more Children | 0 (0.0%) | 0 (0.0%) |
| Total | 253 (99.2%) | 2 (0.8%) |
Income Below Poverty Among Single-Parent Households in Seth Ward
According to the poverty data in Seth Ward, 39.1% or 27 single-father households and 22.5% or 18 single-mother households are living below the poverty line. Among single-father households, those with 3 or 4 children have the highest poverty rate, with 27 households (45.8%) experiencing poverty. Likewise, among single-mother households, those with 3 or 4 children have the highest poverty rate, with 18 households (100.0%) falling below the poverty line.
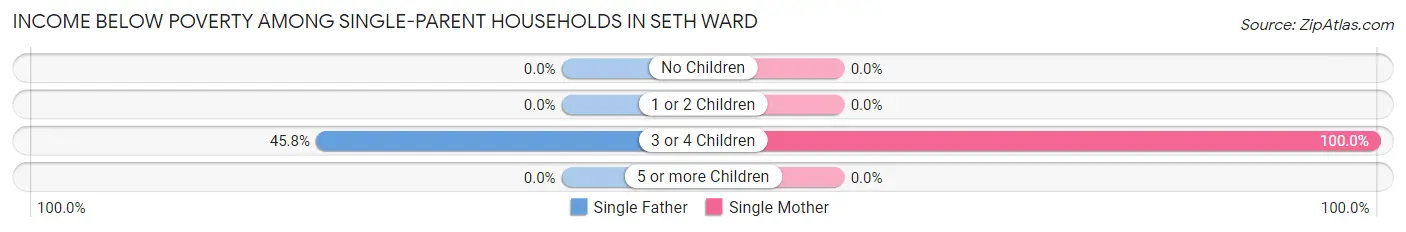
| Children | Single Father | Single Mother |
| No Children | 0 (0.0%) | 0 (0.0%) |
| 1 or 2 Children | 0 (0.0%) | 0 (0.0%) |
| 3 or 4 Children | 27 (45.8%) | 18 (100.0%) |
| 5 or more Children | 0 (0.0%) | 0 (0.0%) |
| Total | 27 (39.1%) | 18 (22.5%) |
Income Below Poverty Among Married-Couple vs Single-Parent Households in Seth Ward
The poverty data for Seth Ward shows that 2 of the married-couple family households (0.8%) and 45 of the single-parent households (30.2%) are living below the poverty level. Within the married-couple family households, those with no children have the highest poverty rate, with 2 households (2.1%) falling below the poverty line. Among the single-parent households, those with 3 or 4 children have the highest poverty rate, with 45 household (58.4%) living below poverty.
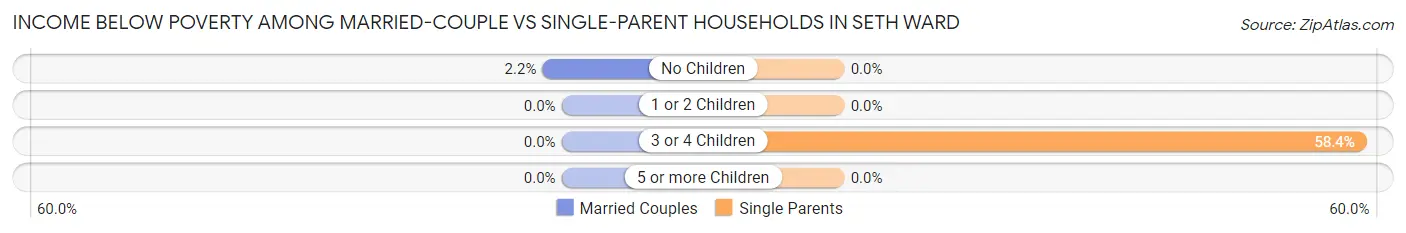
| Children | Married-Couple Families | Single-Parent Households |
| No Children | 2 (2.1%) | 0 (0.0%) |
| 1 or 2 Children | 0 (0.0%) | 0 (0.0%) |
| 3 or 4 Children | 0 (0.0%) | 45 (58.4%) |
| 5 or more Children | 0 (0.0%) | 0 (0.0%) |
| Total | 2 (0.8%) | 45 (30.2%) |
Race in Seth Ward
The most populous races in Seth Ward are Hispanic or Latino (1,502 | 78.2%), White / Caucasian (1,440 | 75.0%), and Two or more Races (298 | 15.5%).
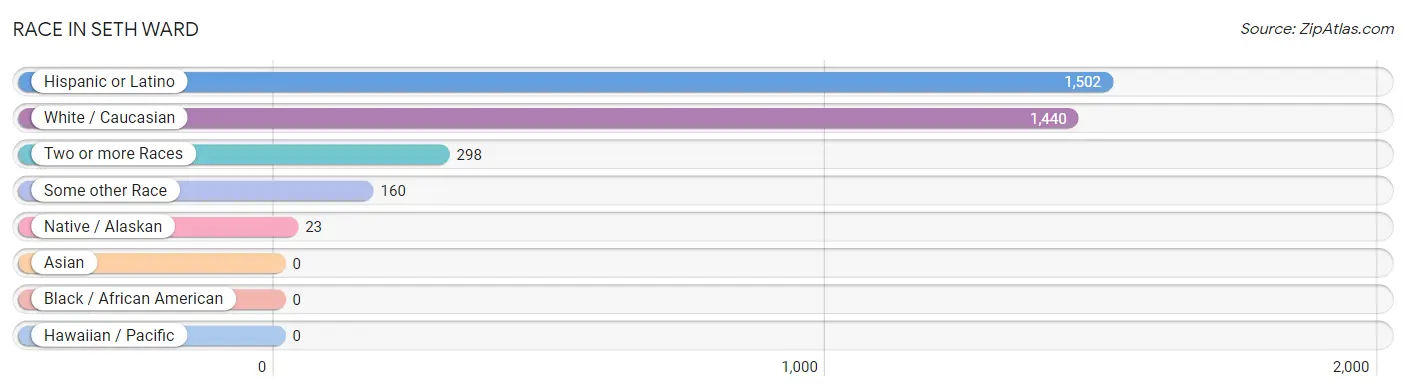
| Race | # Population | % Population |
| Asian | 0 | 0.0% |
| Black / African American | 0 | 0.0% |
| Hawaiian / Pacific | 0 | 0.0% |
| Hispanic or Latino | 1,502 | 78.2% |
| Native / Alaskan | 23 | 1.2% |
| White / Caucasian | 1,440 | 75.0% |
| Two or more Races | 298 | 15.5% |
| Some other Race | 160 | 8.3% |
| Total | 1,921 | 100.0% |
Ancestry in Seth Ward
The most populous ancestries reported in Seth Ward are Mexican (1,271 | 66.2%), Dominican (186 | 9.7%), German (176 | 9.2%), American (95 | 5.0%), and English (65 | 3.4%), together accounting for 93.3% of all Seth Ward residents.
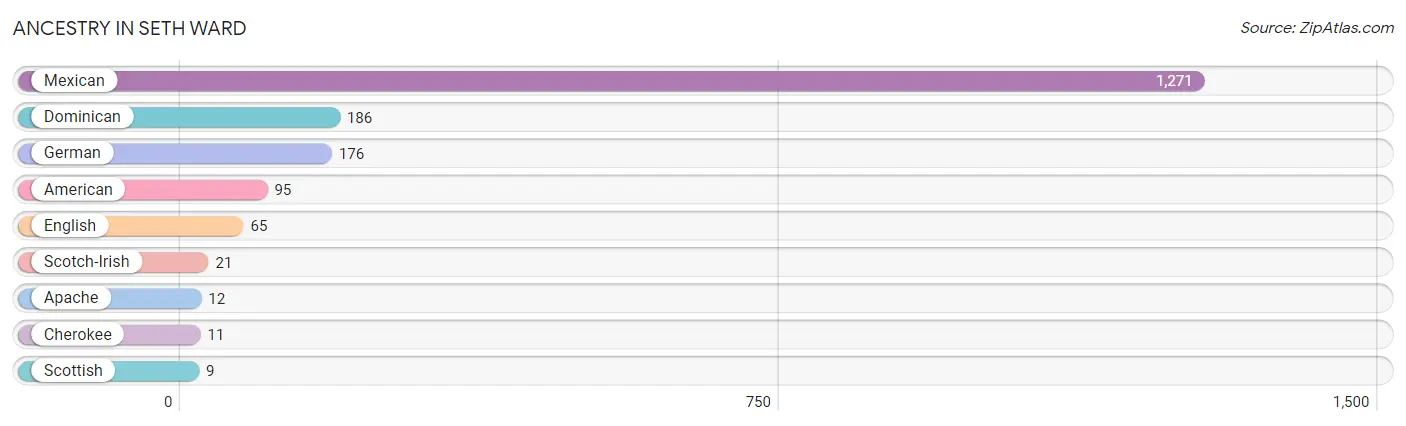
| Ancestry | # Population | % Population |
| American | 95 | 5.0% |
| Apache | 12 | 0.6% |
| Cherokee | 11 | 0.6% |
| Dominican | 186 | 9.7% |
| English | 65 | 3.4% |
| German | 176 | 9.2% |
| Mexican | 1,271 | 66.2% |
| Scotch-Irish | 21 | 1.1% |
| Scottish | 9 | 0.5% | View All 9 Rows |
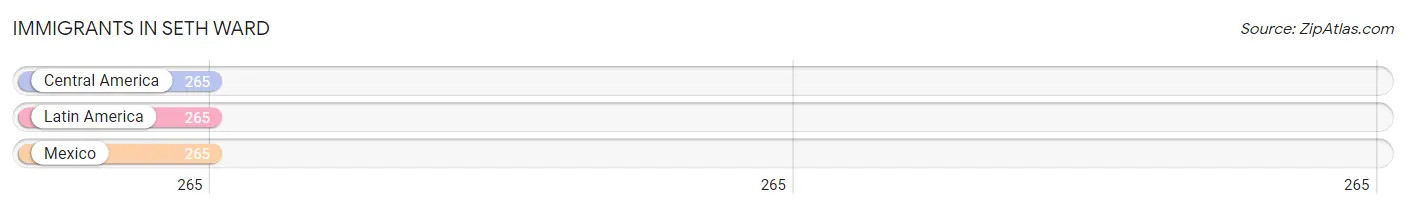
Immigrants in Seth Ward
The most numerous immigrant groups reported in Seth Ward came from Central America (265 | 13.8%), Latin America (265 | 13.8%), and Mexico (265 | 13.8%), together accounting for 41.4% of all Seth Ward residents.
| Immigration Origin | # Population | % Population |
| Central America | 265 | 13.8% |
| Latin America | 265 | 13.8% |
| Mexico | 265 | 13.8% | View All 3 Rows |
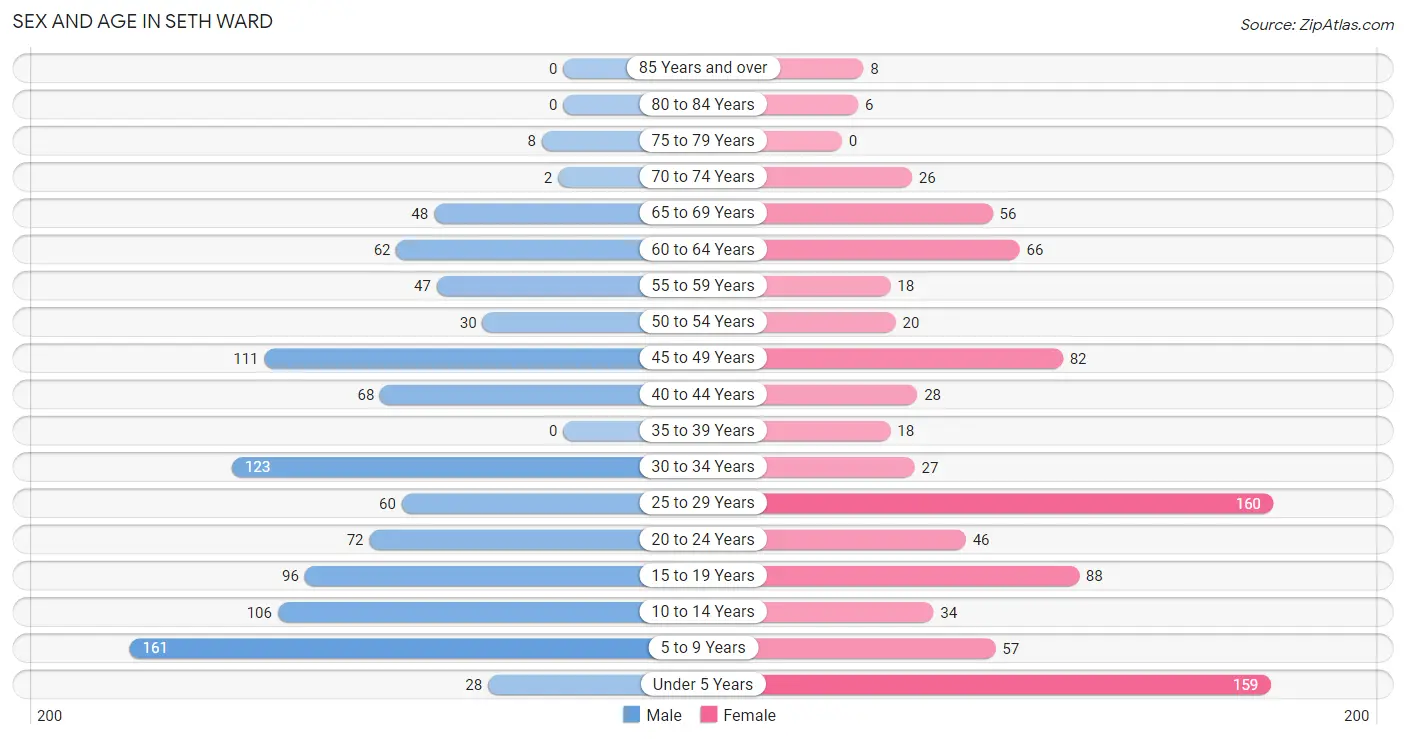
Sex and Age in Seth Ward
Sex and Age in Seth Ward
The most populous age groups in Seth Ward are 5 to 9 Years (161 | 15.8%) for men and 25 to 29 Years (160 | 17.8%) for women.
| Age Bracket | Male | Female |
| Under 5 Years | 28 (2.7%) | 159 (17.7%) |
| 5 to 9 Years | 161 (15.8%) | 57 (6.3%) |
| 10 to 14 Years | 106 (10.4%) | 34 (3.8%) |
| 15 to 19 Years | 96 (9.4%) | 88 (9.8%) |
| 20 to 24 Years | 72 (7.0%) | 46 (5.1%) |
| 25 to 29 Years | 60 (5.9%) | 160 (17.8%) |
| 30 to 34 Years | 123 (12.0%) | 27 (3.0%) |
| 35 to 39 Years | 0 (0.0%) | 18 (2.0%) |
| 40 to 44 Years | 68 (6.7%) | 28 (3.1%) |
| 45 to 49 Years | 111 (10.9%) | 82 (9.1%) |
| 50 to 54 Years | 30 (2.9%) | 20 (2.2%) |
| 55 to 59 Years | 47 (4.6%) | 18 (2.0%) |
| 60 to 64 Years | 62 (6.1%) | 66 (7.3%) |
| 65 to 69 Years | 48 (4.7%) | 56 (6.2%) |
| 70 to 74 Years | 2 (0.2%) | 26 (2.9%) |
| 75 to 79 Years | 8 (0.8%) | 0 (0.0%) |
| 80 to 84 Years | 0 (0.0%) | 6 (0.7%) |
| 85 Years and over | 0 (0.0%) | 8 (0.9%) |
| Total | 1,022 (100.0%) | 899 (100.0%) |
Families and Households in Seth Ward
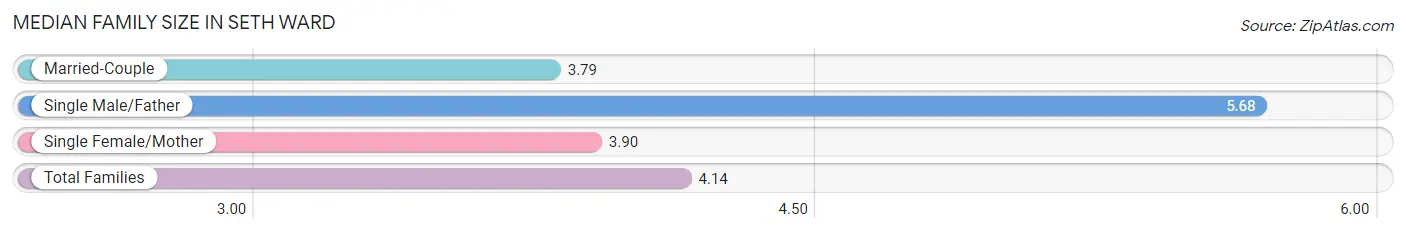
Median Family Size in Seth Ward
The median family size in Seth Ward is 4.14 persons per family, with single male/father families (69 | 17.1%) accounting for the largest median family size of 5.68 persons per family. On the other hand, married-couple families (255 | 63.1%) represent the smallest median family size with 3.79 persons per family.
| Family Type | # Families | Family Size |
| Married-Couple | 255 (63.1%) | 3.79 |
| Single Male/Father | 69 (17.1%) | 5.68 |
| Single Female/Mother | 80 (19.8%) | 3.90 |
| Total Families | 404 (100.0%) | 4.14 |
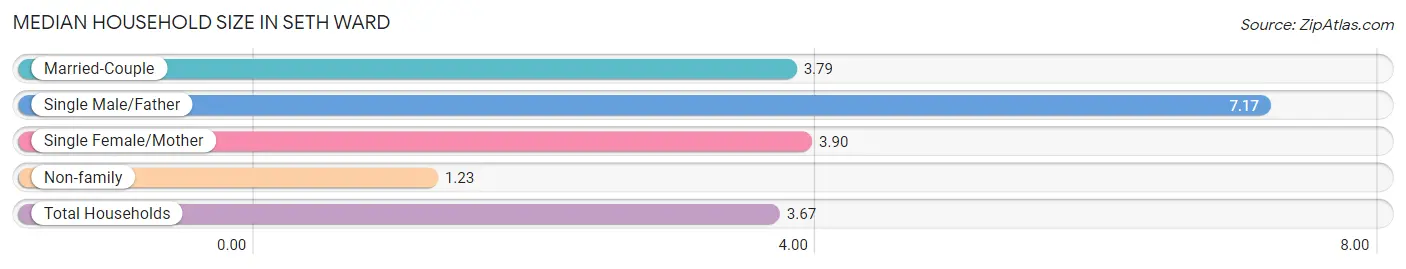
Median Household Size in Seth Ward
The median household size in Seth Ward is 3.67 persons per household, with single male/father households (69 | 13.2%) accounting for the largest median household size of 7.17 persons per household. non-family households (120 | 22.9%) represent the smallest median household size with 1.23 persons per household.
| Household Type | # Households | Household Size |
| Married-Couple | 255 (48.7%) | 3.79 |
| Single Male/Father | 69 (13.2%) | 7.17 |
| Single Female/Mother | 80 (15.3%) | 3.90 |
| Non-family | 120 (22.9%) | 1.23 |
| Total Households | 524 (100.0%) | 3.67 |
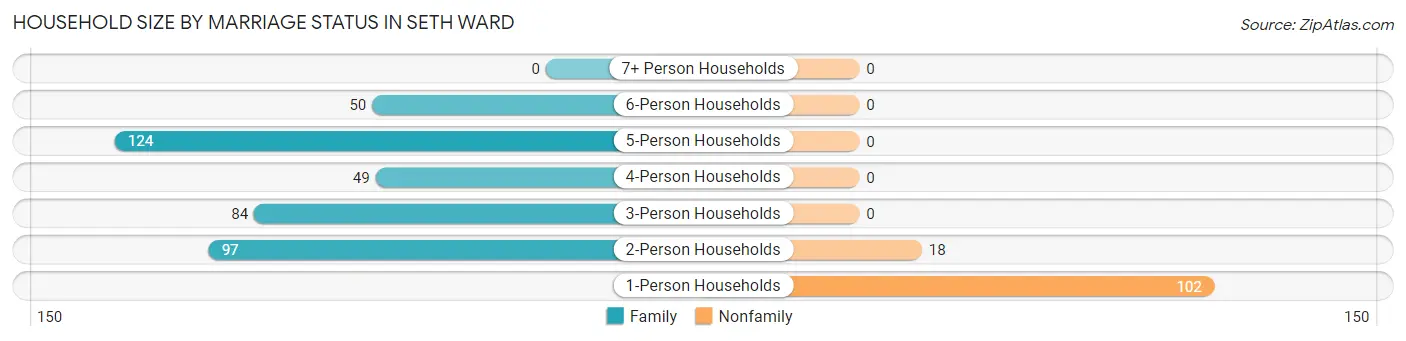
Household Size by Marriage Status in Seth Ward
Out of a total of 524 households in Seth Ward, 404 (77.1%) are family households, while 120 (22.9%) are nonfamily households. The most numerous type of family households are 5-person households, comprising 124, and the most common type of nonfamily households are 1-person households, comprising 102.
| Household Size | Family Households | Nonfamily Households |
| 1-Person Households | - | 102 (19.5%) |
| 2-Person Households | 97 (18.5%) | 18 (3.4%) |
| 3-Person Households | 84 (16.0%) | 0 (0.0%) |
| 4-Person Households | 49 (9.3%) | 0 (0.0%) |
| 5-Person Households | 124 (23.7%) | 0 (0.0%) |
| 6-Person Households | 50 (9.5%) | 0 (0.0%) |
| 7+ Person Households | 0 (0.0%) | 0 (0.0%) |
| Total | 404 (77.1%) | 120 (22.9%) |
Female Fertility in Seth Ward
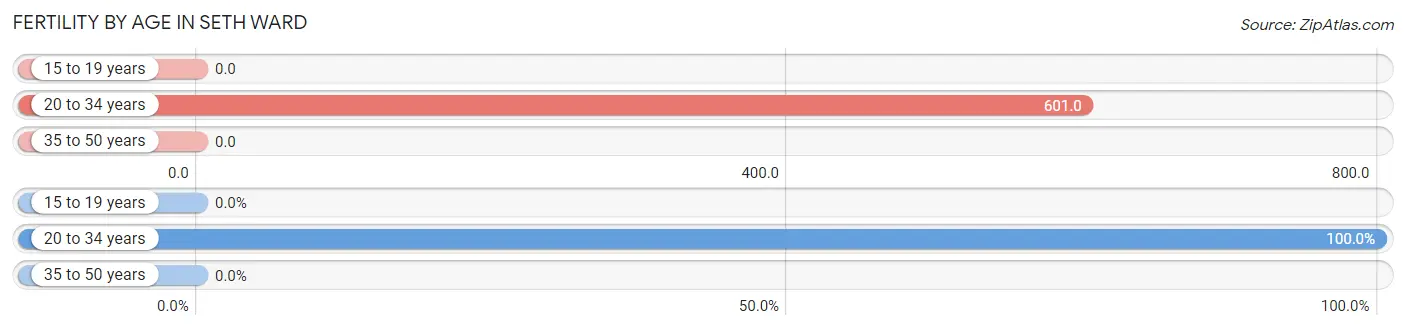
Fertility by Age in Seth Ward
Average fertility rate in Seth Ward is 312.0 births per 1,000 women. Women in the age bracket of 20 to 34 years have the highest fertility rate with 601.0 births per 1,000 women. Women in the age bracket of 20 to 34 years acount for 100.0% of all women with births.
| Age Bracket | Women with Births | Births / 1,000 Women |
| 15 to 19 years | 0 (0.0%) | 0.0 |
| 20 to 34 years | 140 (100.0%) | 601.0 |
| 35 to 50 years | 0 (0.0%) | 0.0 |
| Total | 140 (100.0%) | 312.0 |
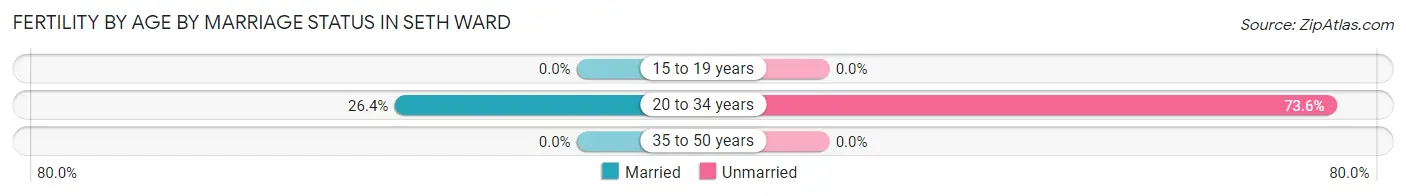
Fertility by Age by Marriage Status in Seth Ward
26.4% of women with births (140) in Seth Ward are married. The highest percentage of unmarried women with births falls into 20 to 34 years age bracket with 73.6% of them unmarried at the time of birth, while the lowest percentage of unmarried women with births belong to 20 to 34 years age bracket with 73.6% of them unmarried.
| Age Bracket | Married | Unmarried |
| 15 to 19 years | 0 (0.0%) | 0 (0.0%) |
| 20 to 34 years | 37 (26.4%) | 103 (73.6%) |
| 35 to 50 years | 0 (0.0%) | 0 (0.0%) |
| Total | 37 (26.4%) | 103 (73.6%) |
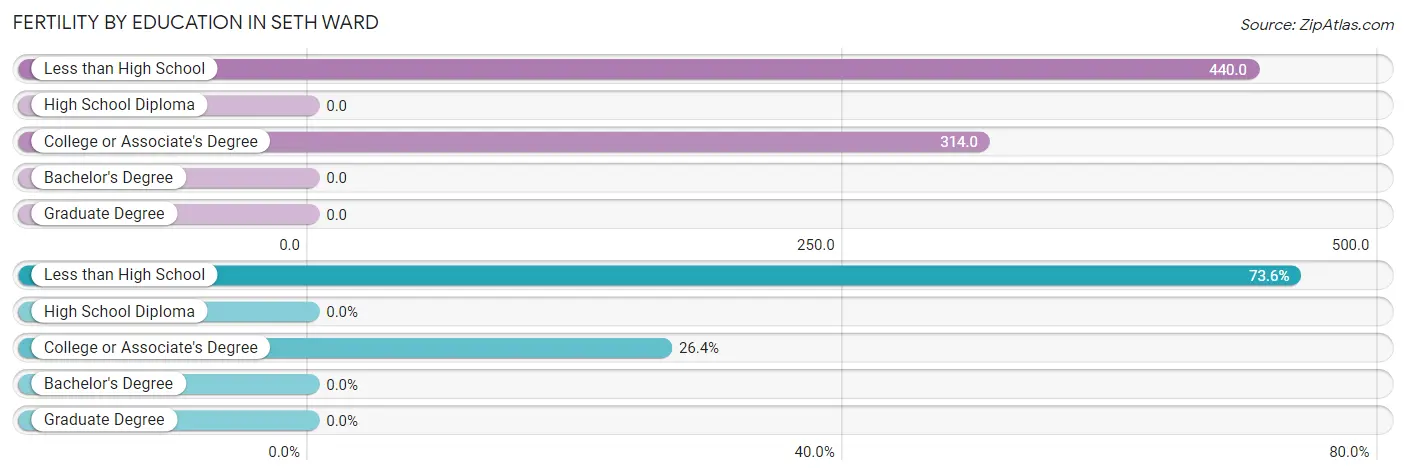
Fertility by Education in Seth Ward
| Educational Attainment | Women with Births | Births / 1,000 Women |
| Less than High School | 103 (73.6%) | 440.0 |
| High School Diploma | 0 (0.0%) | 0.0 |
| College or Associate's Degree | 37 (26.4%) | 314.0 |
| Bachelor's Degree | 0 (0.0%) | 0.0 |
| Graduate Degree | 0 (0.0%) | 0.0 |
| Total | 140 (100.0%) | 312.0 |
Fertility by Education by Marriage Status in Seth Ward
73.6% of women with births in Seth Ward are unmarried. Women with the educational attainment of college or associate's degree are most likely to be married with 100.0% of them married at childbirth, while women with the educational attainment of less than high school are least likely to be married with 100.0% of them unmarried at childbirth.
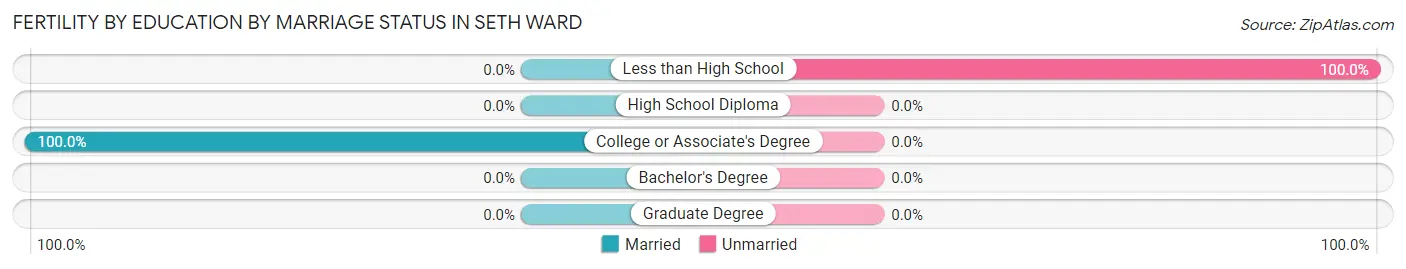
| Educational Attainment | Married | Unmarried |
| Less than High School | 0 (0.0%) | 103 (100.0%) |
| High School Diploma | 0 (0.0%) | 0 (0.0%) |
| College or Associate's Degree | 37 (100.0%) | 0 (0.0%) |
| Bachelor's Degree | 0 (0.0%) | 0 (0.0%) |
| Graduate Degree | 0 (0.0%) | 0 (0.0%) |
| Total | 37 (26.4%) | 103 (73.6%) |
Employment Characteristics in Seth Ward
Employment by Class of Employer in Seth Ward
Among the 817 employed individuals in Seth Ward, private company employees (639 | 78.2%), state government employees (88 | 10.8%), and local government employees (39 | 4.8%) make up the most common classes of employment.
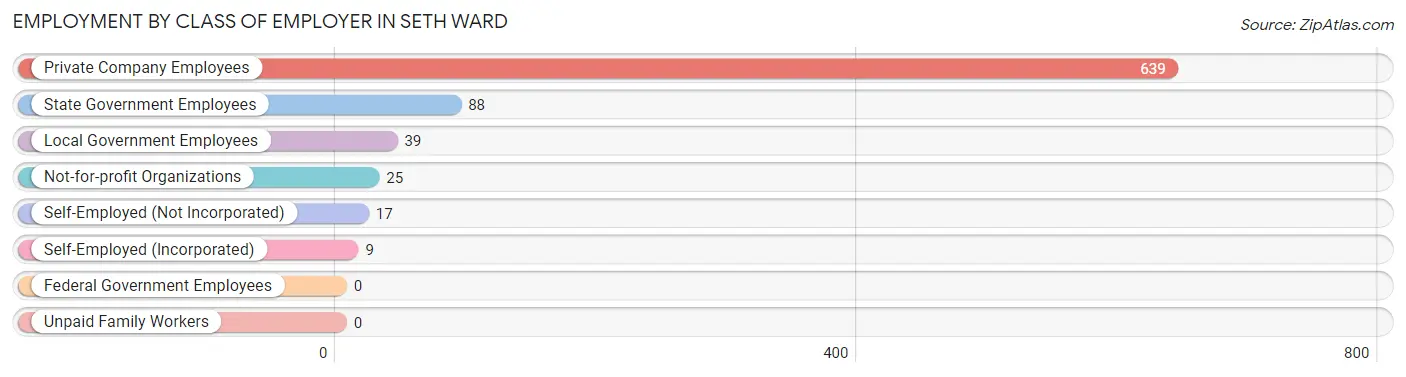
| Employer Class | # Employees | % Employees |
| Private Company Employees | 639 | 78.2% |
| Self-Employed (Incorporated) | 9 | 1.1% |
| Self-Employed (Not Incorporated) | 17 | 2.1% |
| Not-for-profit Organizations | 25 | 3.1% |
| Local Government Employees | 39 | 4.8% |
| State Government Employees | 88 | 10.8% |
| Federal Government Employees | 0 | 0.0% |
| Unpaid Family Workers | 0 | 0.0% |
| Total | 817 | 100.0% |
Employment Status by Age in Seth Ward
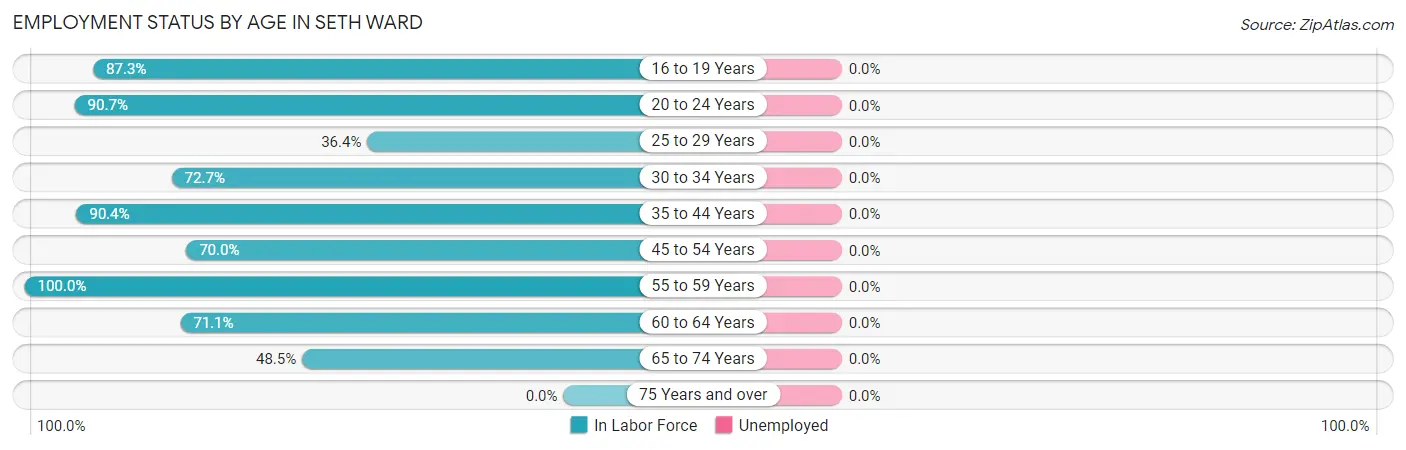
| Age Bracket | In Labor Force | Unemployed |
| 16 to 19 Years | 55 (87.3%) | 0 (0.0%) |
| 20 to 24 Years | 107 (90.7%) | 0 (0.0%) |
| 25 to 29 Years | 80 (36.4%) | 0 (0.0%) |
| 30 to 34 Years | 109 (72.7%) | 0 (0.0%) |
| 35 to 44 Years | 103 (90.4%) | 0 (0.0%) |
| 45 to 54 Years | 170 (70.0%) | 0 (0.0%) |
| 55 to 59 Years | 65 (100.0%) | 0 (0.0%) |
| 60 to 64 Years | 91 (71.1%) | 0 (0.0%) |
| 65 to 74 Years | 64 (48.5%) | 0 (0.0%) |
| 75 Years and over | 0 (0.0%) | 0 (0.0%) |
| Total | 845 (67.3%) | 0 (0.0%) |
Employment Status by Educational Attainment in Seth Ward
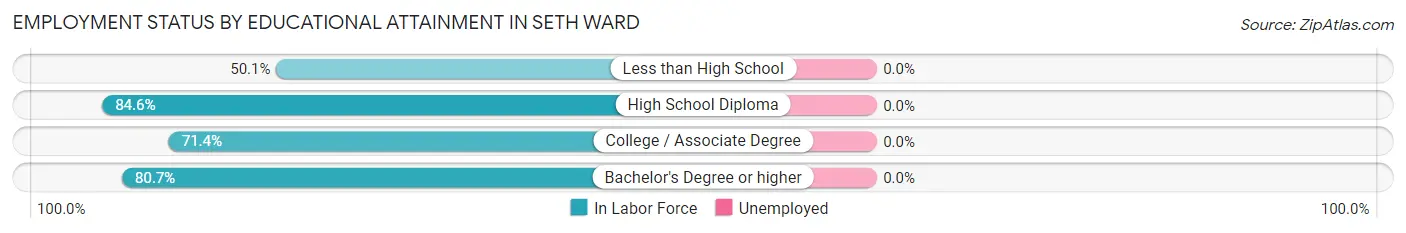
| Educational Attainment | In Labor Force | Unemployed |
| Less than High School | 187 (50.1%) | 0 (0.0%) |
| High School Diploma | 225 (84.6%) | 0 (0.0%) |
| College / Associate Degree | 160 (71.4%) | 0 (0.0%) |
| Bachelor's Degree or higher | 46 (80.7%) | 0 (0.0%) |
| Total | 618 (67.2%) | 0 (0.0%) |
Employment Occupations by Sex in Seth Ward
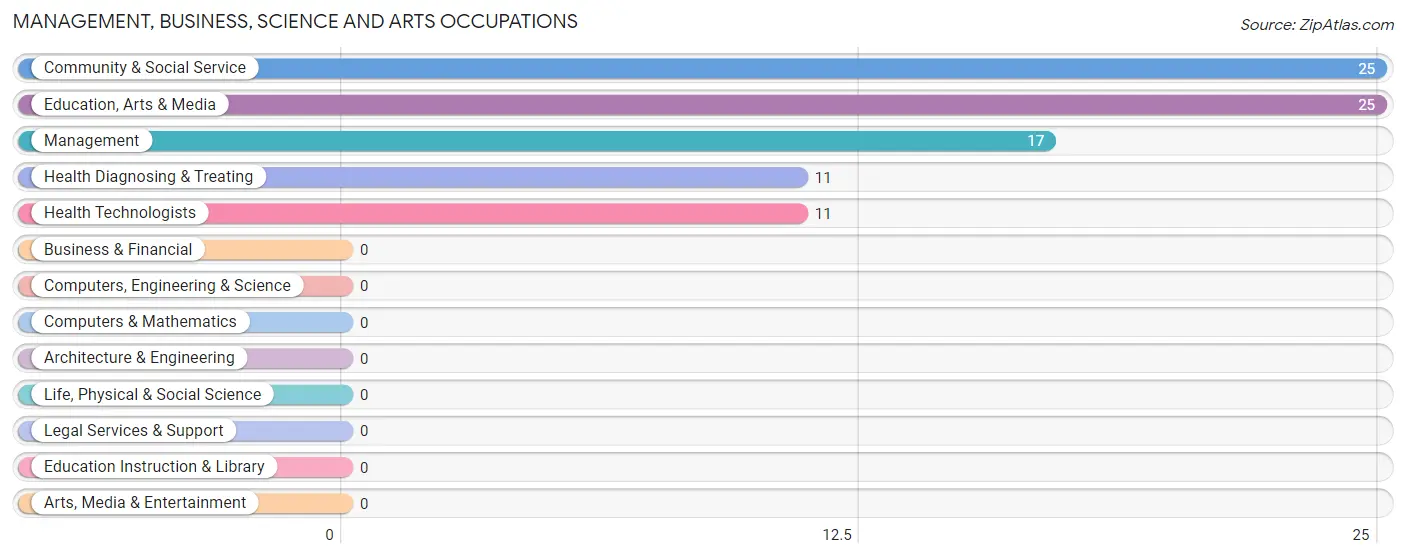
Management, Business, Science and Arts Occupations
The most common Management, Business, Science and Arts occupations in Seth Ward are Community & Social Service (25 | 3.0%), Education, Arts & Media (25 | 3.0%), Management (17 | 2.0%), Health Diagnosing & Treating (11 | 1.3%), and Health Technologists (11 | 1.3%).
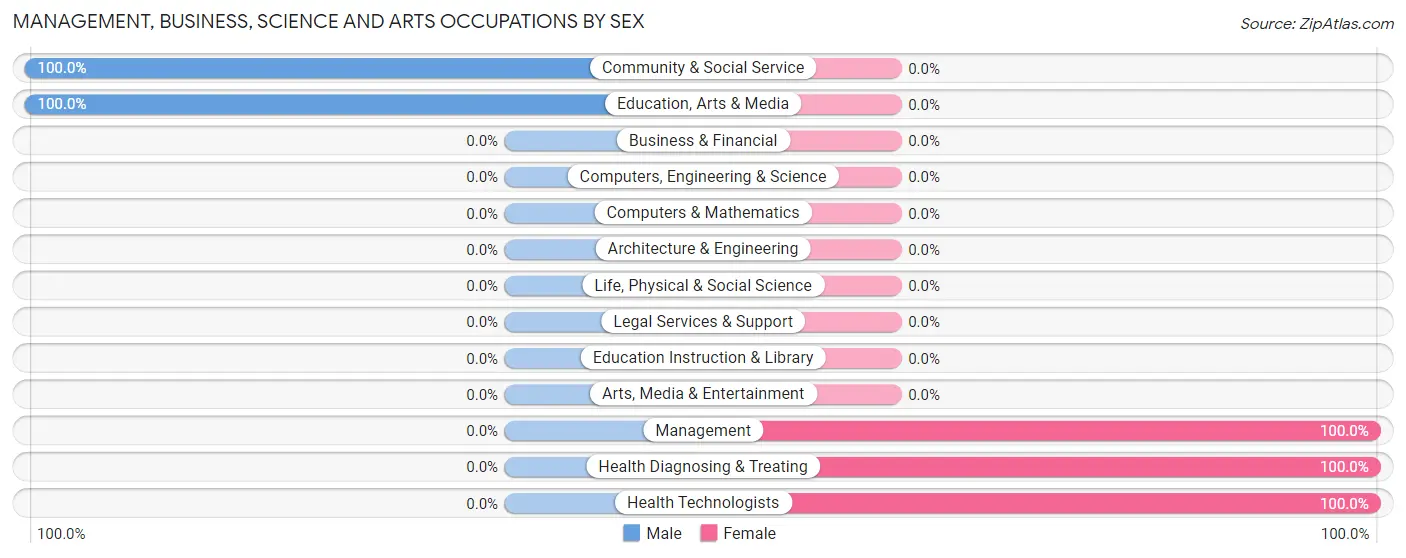
Management, Business, Science and Arts Occupations by Sex
Within the Management, Business, Science and Arts occupations in Seth Ward, the most male-oriented occupations are Community & Social Service (100.0%), and Education, Arts & Media (100.0%), while the most female-oriented occupations are Management (100.0%), Health Diagnosing & Treating (100.0%), and Health Technologists (100.0%).
| Occupation | Male | Female |
| Management | 0 (0.0%) | 17 (100.0%) |
| Business & Financial | 0 (0.0%) | 0 (0.0%) |
| Computers, Engineering & Science | 0 (0.0%) | 0 (0.0%) |
| Computers & Mathematics | 0 (0.0%) | 0 (0.0%) |
| Architecture & Engineering | 0 (0.0%) | 0 (0.0%) |
| Life, Physical & Social Science | 0 (0.0%) | 0 (0.0%) |
| Community & Social Service | 25 (100.0%) | 0 (0.0%) |
| Education, Arts & Media | 25 (100.0%) | 0 (0.0%) |
| Legal Services & Support | 0 (0.0%) | 0 (0.0%) |
| Education Instruction & Library | 0 (0.0%) | 0 (0.0%) |
| Arts, Media & Entertainment | 0 (0.0%) | 0 (0.0%) |
| Health Diagnosing & Treating | 0 (0.0%) | 11 (100.0%) |
| Health Technologists | 0 (0.0%) | 11 (100.0%) |
| Total (Category) | 25 (47.2%) | 28 (52.8%) |
| Total (Overall) | 593 (70.3%) | 251 (29.7%) |
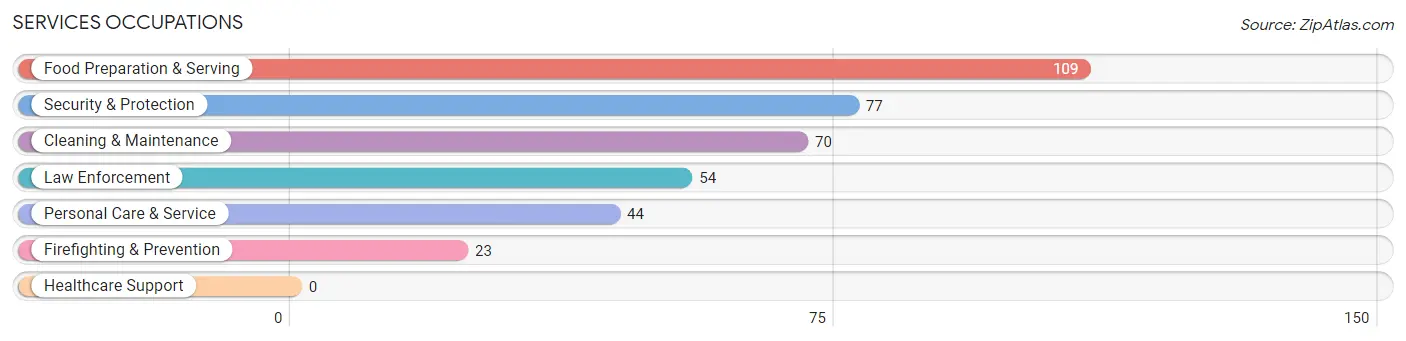
Services Occupations
The most common Services occupations in Seth Ward are Food Preparation & Serving (109 | 12.9%), Security & Protection (77 | 9.1%), Cleaning & Maintenance (70 | 8.3%), Law Enforcement (54 | 6.4%), and Personal Care & Service (44 | 5.2%).
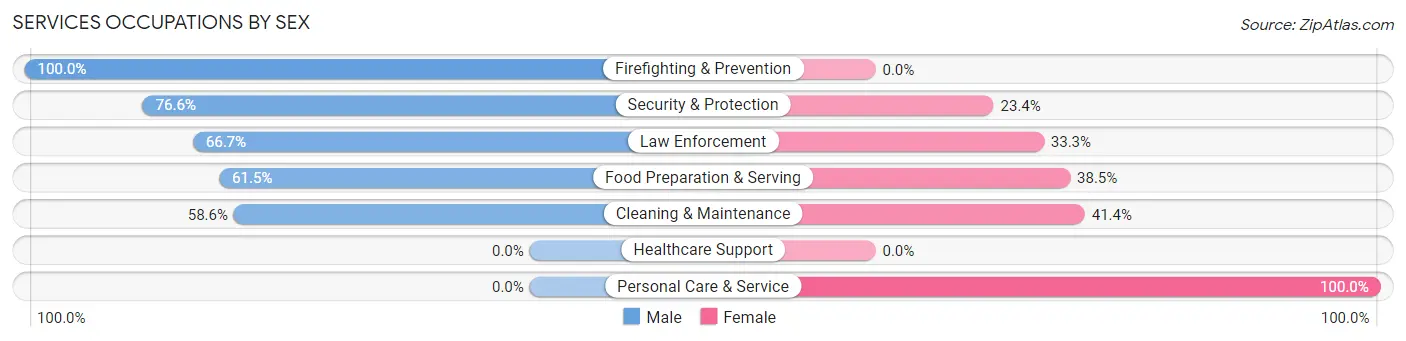
Services Occupations by Sex
Within the Services occupations in Seth Ward, the most male-oriented occupations are Firefighting & Prevention (100.0%), Security & Protection (76.6%), and Law Enforcement (66.7%), while the most female-oriented occupations are Personal Care & Service (100.0%), Cleaning & Maintenance (41.4%), and Food Preparation & Serving (38.5%).
| Occupation | Male | Female |
| Healthcare Support | 0 (0.0%) | 0 (0.0%) |
| Security & Protection | 59 (76.6%) | 18 (23.4%) |
| Firefighting & Prevention | 23 (100.0%) | 0 (0.0%) |
| Law Enforcement | 36 (66.7%) | 18 (33.3%) |
| Food Preparation & Serving | 67 (61.5%) | 42 (38.5%) |
| Cleaning & Maintenance | 41 (58.6%) | 29 (41.4%) |
| Personal Care & Service | 0 (0.0%) | 44 (100.0%) |
| Total (Category) | 167 (55.7%) | 133 (44.3%) |
| Total (Overall) | 593 (70.3%) | 251 (29.7%) |
Sales and Office Occupations
The most common Sales and Office occupations in Seth Ward are Office & Administration (79 | 9.4%), and Sales & Related (71 | 8.4%).
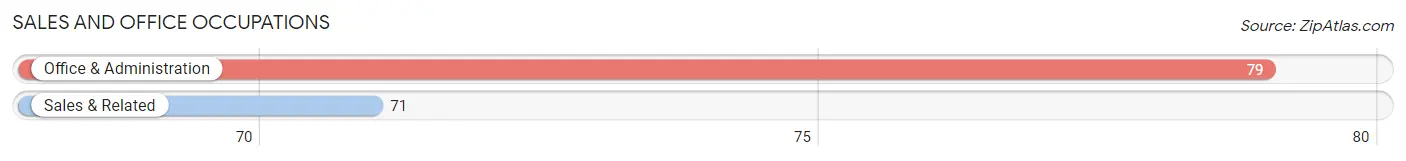
Sales and Office Occupations by Sex
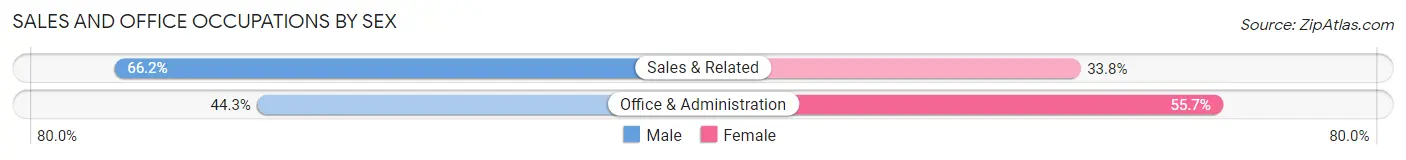
| Occupation | Male | Female |
| Sales & Related | 47 (66.2%) | 24 (33.8%) |
| Office & Administration | 35 (44.3%) | 44 (55.7%) |
| Total (Category) | 82 (54.7%) | 68 (45.3%) |
| Total (Overall) | 593 (70.3%) | 251 (29.7%) |
Natural Resources, Construction and Maintenance Occupations
The most common Natural Resources, Construction and Maintenance occupations in Seth Ward are Installation, Maintenance & Repair (62 | 7.3%), Construction & Extraction (32 | 3.8%), and Farming, Fishing & Forestry (9 | 1.1%).
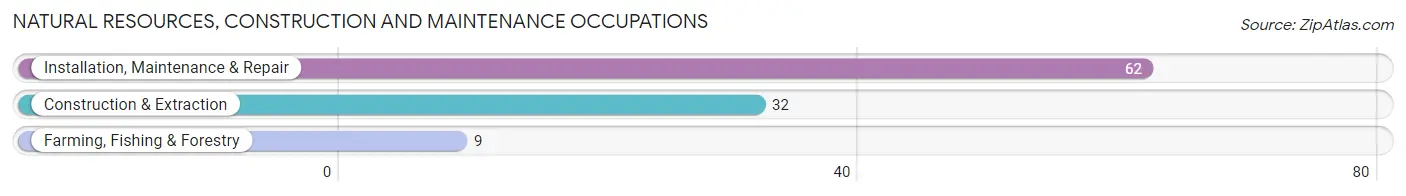
Natural Resources, Construction and Maintenance Occupations by Sex
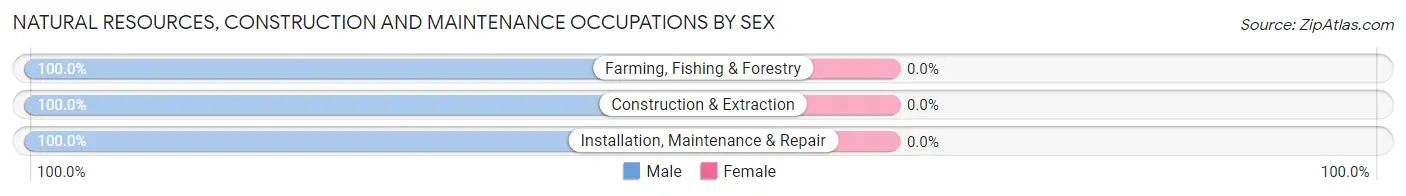
| Occupation | Male | Female |
| Farming, Fishing & Forestry | 9 (100.0%) | 0 (0.0%) |
| Construction & Extraction | 32 (100.0%) | 0 (0.0%) |
| Installation, Maintenance & Repair | 62 (100.0%) | 0 (0.0%) |
| Total (Category) | 103 (100.0%) | 0 (0.0%) |
| Total (Overall) | 593 (70.3%) | 251 (29.7%) |
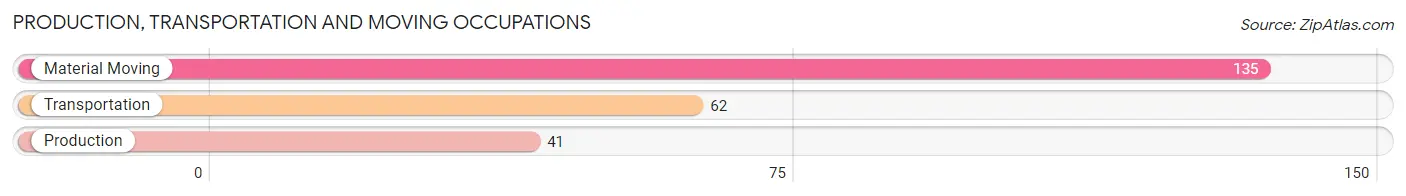
Production, Transportation and Moving Occupations
The most common Production, Transportation and Moving occupations in Seth Ward are Material Moving (135 | 16.0%), Transportation (62 | 7.3%), and Production (41 | 4.9%).
Production, Transportation and Moving Occupations by Sex
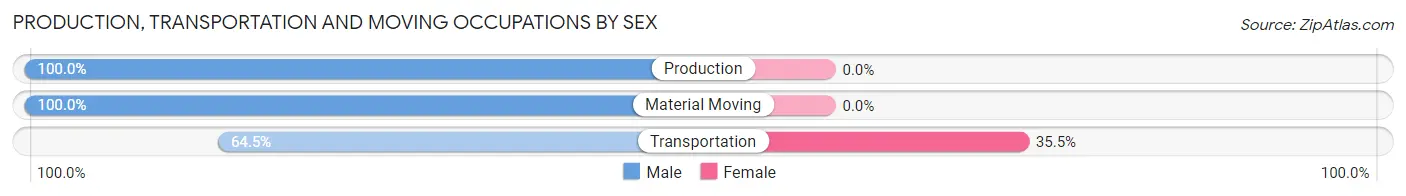
| Occupation | Male | Female |
| Production | 41 (100.0%) | 0 (0.0%) |
| Transportation | 40 (64.5%) | 22 (35.5%) |
| Material Moving | 135 (100.0%) | 0 (0.0%) |
| Total (Category) | 216 (90.8%) | 22 (9.2%) |
| Total (Overall) | 593 (70.3%) | 251 (29.7%) |
Employment Industries by Sex in Seth Ward
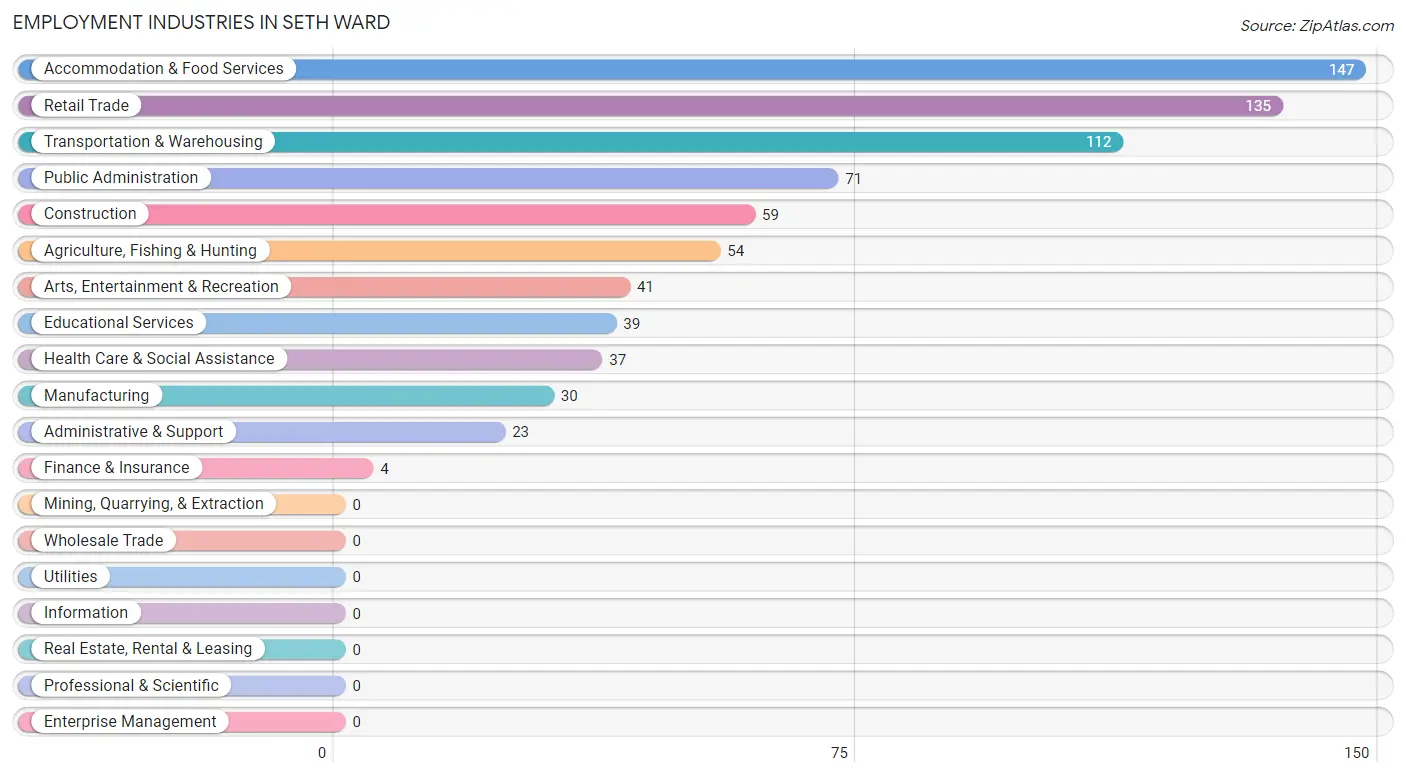
Employment Industries in Seth Ward
The major employment industries in Seth Ward include Accommodation & Food Services (147 | 17.4%), Retail Trade (135 | 16.0%), Transportation & Warehousing (112 | 13.3%), Public Administration (71 | 8.4%), and Construction (59 | 7.0%).
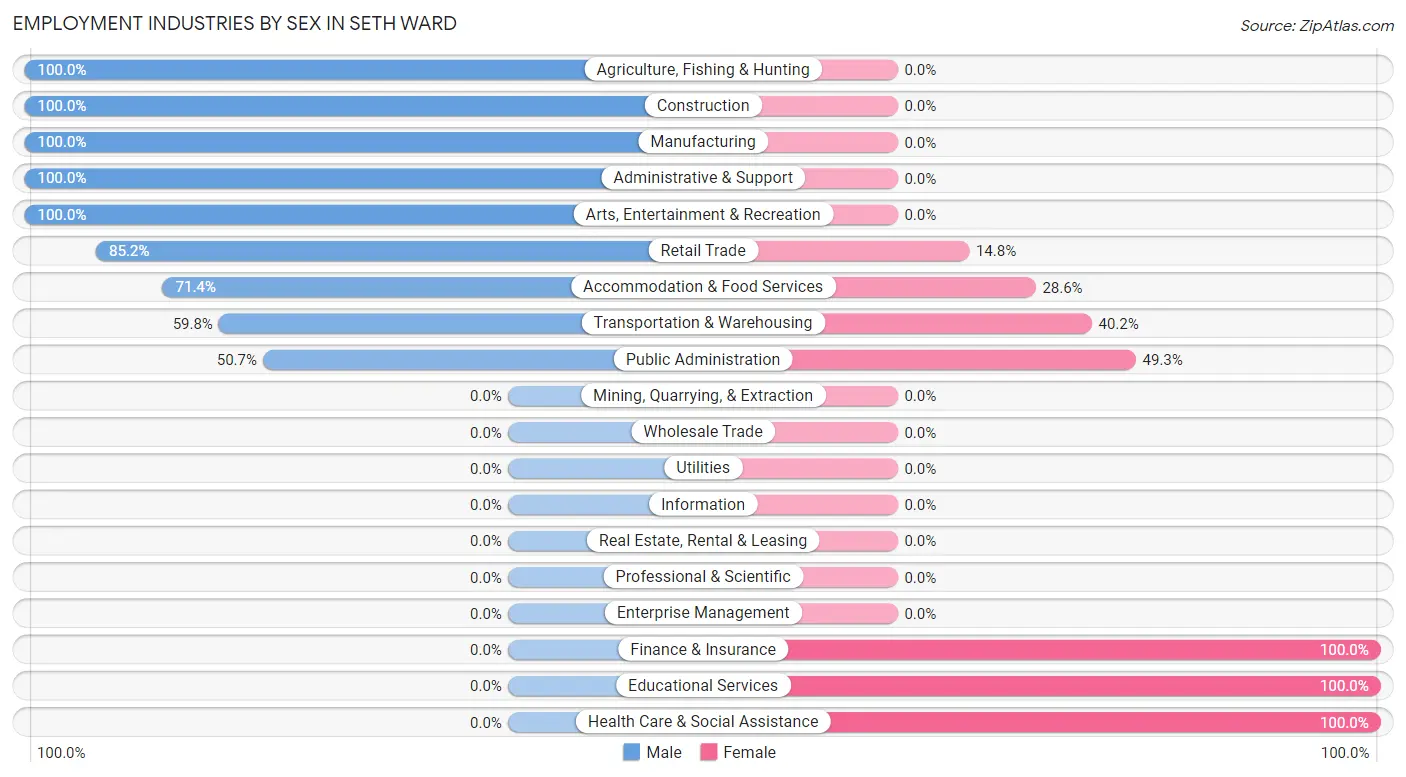
Employment Industries by Sex in Seth Ward
The Seth Ward industries that see more men than women are Agriculture, Fishing & Hunting (100.0%), Construction (100.0%), and Manufacturing (100.0%), whereas the industries that tend to have a higher number of women are Finance & Insurance (100.0%), Educational Services (100.0%), and Health Care & Social Assistance (100.0%).
| Industry | Male | Female |
| Agriculture, Fishing & Hunting | 54 (100.0%) | 0 (0.0%) |
| Mining, Quarrying, & Extraction | 0 (0.0%) | 0 (0.0%) |
| Construction | 59 (100.0%) | 0 (0.0%) |
| Manufacturing | 30 (100.0%) | 0 (0.0%) |
| Wholesale Trade | 0 (0.0%) | 0 (0.0%) |
| Retail Trade | 115 (85.2%) | 20 (14.8%) |
| Transportation & Warehousing | 67 (59.8%) | 45 (40.2%) |
| Utilities | 0 (0.0%) | 0 (0.0%) |
| Information | 0 (0.0%) | 0 (0.0%) |
| Finance & Insurance | 0 (0.0%) | 4 (100.0%) |
| Real Estate, Rental & Leasing | 0 (0.0%) | 0 (0.0%) |
| Professional & Scientific | 0 (0.0%) | 0 (0.0%) |
| Enterprise Management | 0 (0.0%) | 0 (0.0%) |
| Administrative & Support | 23 (100.0%) | 0 (0.0%) |
| Educational Services | 0 (0.0%) | 39 (100.0%) |
| Health Care & Social Assistance | 0 (0.0%) | 37 (100.0%) |
| Arts, Entertainment & Recreation | 41 (100.0%) | 0 (0.0%) |
| Accommodation & Food Services | 105 (71.4%) | 42 (28.6%) |
| Public Administration | 36 (50.7%) | 35 (49.3%) |
| Total | 593 (70.3%) | 251 (29.7%) |
Education in Seth Ward
School Enrollment in Seth Ward
The most common levels of schooling among the 550 students in Seth Ward are high school (197 | 35.8%), elementary school (141 | 25.6%), and middle school (84 | 15.3%).
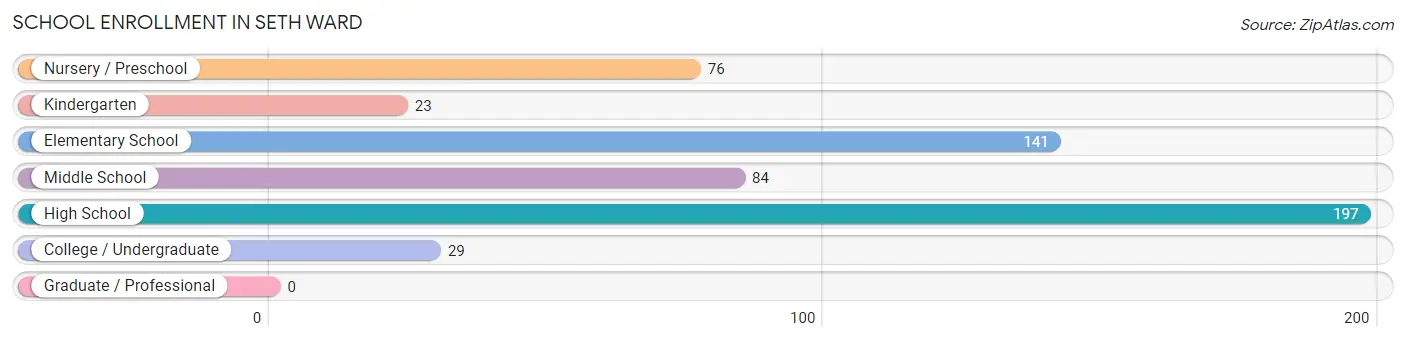
| School Level | # Students | % Students |
| Nursery / Preschool | 76 | 13.8% |
| Kindergarten | 23 | 4.2% |
| Elementary School | 141 | 25.6% |
| Middle School | 84 | 15.3% |
| High School | 197 | 35.8% |
| College / Undergraduate | 29 | 5.3% |
| Graduate / Professional | 0 | 0.0% |
| Total | 550 | 100.0% |
School Enrollment by Age by Funding Source in Seth Ward
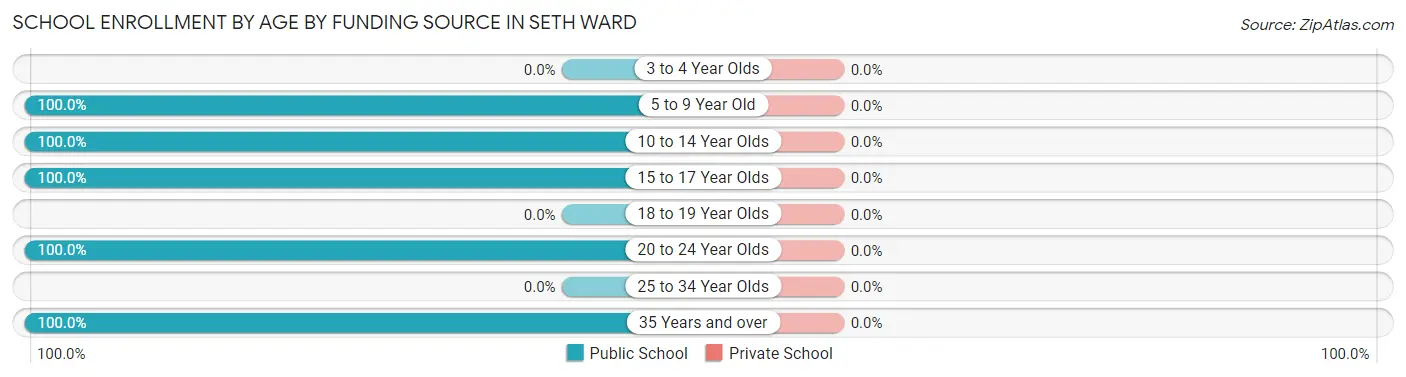
| Age Bracket | Public School | Private School |
| 3 to 4 Year Olds | 0 (0.0%) | 0 (0.0%) |
| 5 to 9 Year Old | 218 (100.0%) | 0 (0.0%) |
| 10 to 14 Year Olds | 119 (100.0%) | 0 (0.0%) |
| 15 to 17 Year Olds | 184 (100.0%) | 0 (0.0%) |
| 18 to 19 Year Olds | 0 (0.0%) | 0 (0.0%) |
| 20 to 24 Year Olds | 11 (100.0%) | 0 (0.0%) |
| 25 to 34 Year Olds | 0 (0.0%) | 0 (0.0%) |
| 35 Years and over | 18 (100.0%) | 0 (0.0%) |
| Total | 550 (100.0%) | 0 (0.0%) |
Educational Attainment by Field of Study in Seth Ward
Liberal arts & history (46 | 62.2%), education (17 | 23.0%), and business (11 | 14.9%) are the most common fields of study among 74 individuals in Seth Ward who have obtained a bachelor's degree or higher.
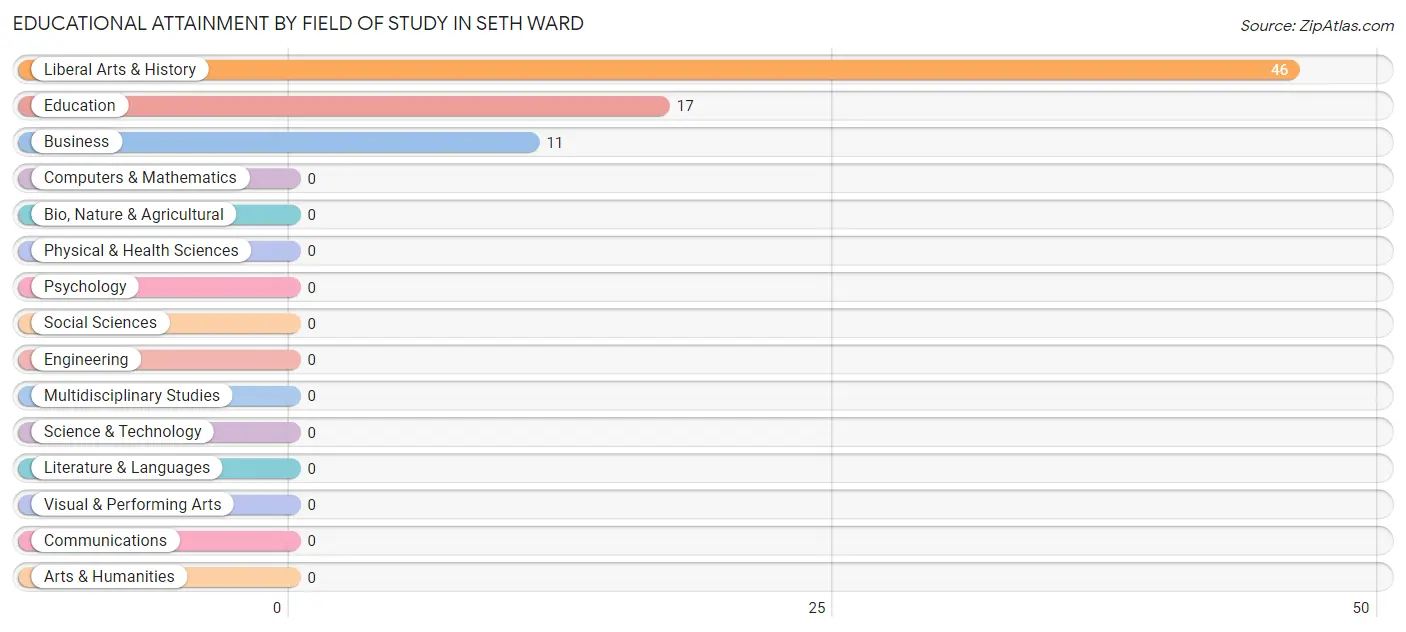
| Field of Study | # Graduates | % Graduates |
| Computers & Mathematics | 0 | 0.0% |
| Bio, Nature & Agricultural | 0 | 0.0% |
| Physical & Health Sciences | 0 | 0.0% |
| Psychology | 0 | 0.0% |
| Social Sciences | 0 | 0.0% |
| Engineering | 0 | 0.0% |
| Multidisciplinary Studies | 0 | 0.0% |
| Science & Technology | 0 | 0.0% |
| Business | 11 | 14.9% |
| Education | 17 | 23.0% |
| Literature & Languages | 0 | 0.0% |
| Liberal Arts & History | 46 | 62.2% |
| Visual & Performing Arts | 0 | 0.0% |
| Communications | 0 | 0.0% |
| Arts & Humanities | 0 | 0.0% |
| Total | 74 | 100.0% |
Transportation & Commute in Seth Ward
Vehicle Availability by Sex in Seth Ward
The most prevalent vehicle ownership categories in Seth Ward are males with 2 vehicles (221, accounting for 39.1%) and females with 2 vehicles (36, making up 88.0%).
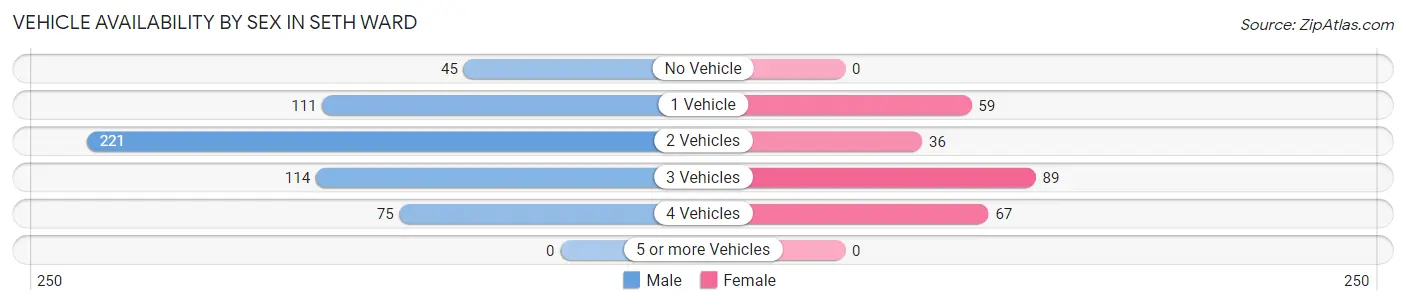
| Vehicles Available | Male | Female |
| No Vehicle | 45 (8.0%) | 0 (0.0%) |
| 1 Vehicle | 111 (19.6%) | 59 (23.5%) |
| 2 Vehicles | 221 (39.1%) | 36 (14.3%) |
| 3 Vehicles | 114 (20.1%) | 89 (35.5%) |
| 4 Vehicles | 75 (13.3%) | 67 (26.7%) |
| 5 or more Vehicles | 0 (0.0%) | 0 (0.0%) |
| Total | 566 (100.0%) | 251 (100.0%) |
Commute Time in Seth Ward
The most frequently occuring commute durations in Seth Ward are 10 to 14 minutes (278 commuters, 34.0%), 5 to 9 minutes (201 commuters, 24.6%), and 15 to 19 minutes (105 commuters, 12.9%).
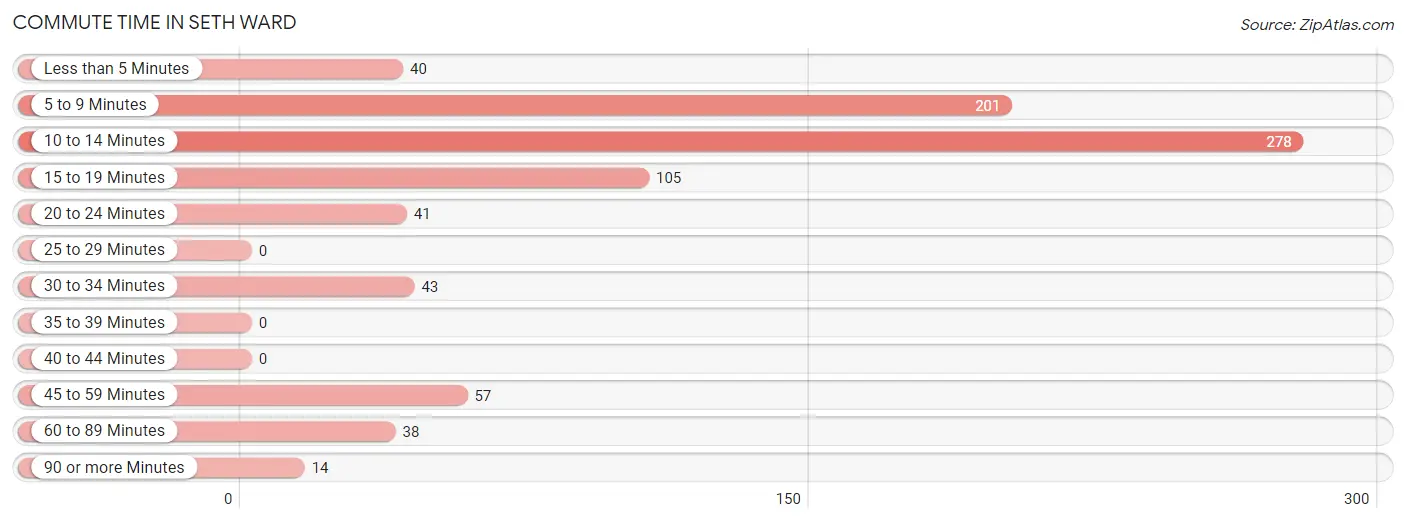
| Commute Time | # Commuters | % Commuters |
| Less than 5 Minutes | 40 | 4.9% |
| 5 to 9 Minutes | 201 | 24.6% |
| 10 to 14 Minutes | 278 | 34.0% |
| 15 to 19 Minutes | 105 | 12.9% |
| 20 to 24 Minutes | 41 | 5.0% |
| 25 to 29 Minutes | 0 | 0.0% |
| 30 to 34 Minutes | 43 | 5.3% |
| 35 to 39 Minutes | 0 | 0.0% |
| 40 to 44 Minutes | 0 | 0.0% |
| 45 to 59 Minutes | 57 | 7.0% |
| 60 to 89 Minutes | 38 | 4.6% |
| 90 or more Minutes | 14 | 1.7% |
Commute Time by Sex in Seth Ward
The most common commute times in Seth Ward are 10 to 14 minutes (191 commuters, 33.8%) for males and 10 to 14 minutes (87 commuters, 34.7%) for females.
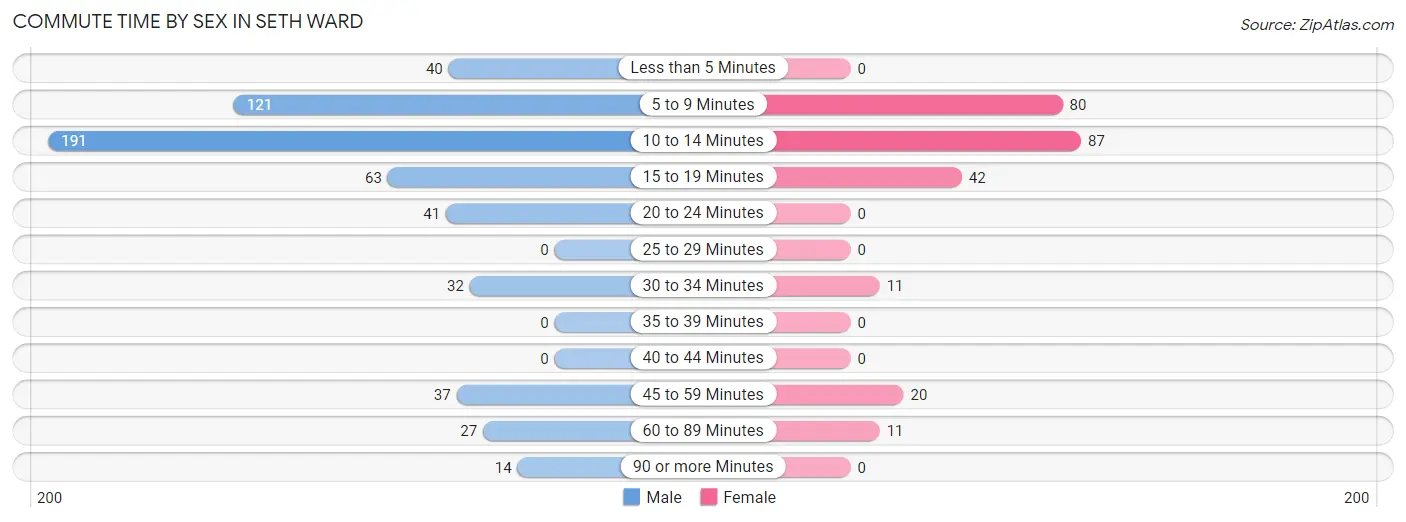
| Commute Time | Male | Female |
| Less than 5 Minutes | 40 (7.1%) | 0 (0.0%) |
| 5 to 9 Minutes | 121 (21.4%) | 80 (31.9%) |
| 10 to 14 Minutes | 191 (33.8%) | 87 (34.7%) |
| 15 to 19 Minutes | 63 (11.1%) | 42 (16.7%) |
| 20 to 24 Minutes | 41 (7.2%) | 0 (0.0%) |
| 25 to 29 Minutes | 0 (0.0%) | 0 (0.0%) |
| 30 to 34 Minutes | 32 (5.7%) | 11 (4.4%) |
| 35 to 39 Minutes | 0 (0.0%) | 0 (0.0%) |
| 40 to 44 Minutes | 0 (0.0%) | 0 (0.0%) |
| 45 to 59 Minutes | 37 (6.5%) | 20 (8.0%) |
| 60 to 89 Minutes | 27 (4.8%) | 11 (4.4%) |
| 90 or more Minutes | 14 (2.5%) | 0 (0.0%) |
Time of Departure to Work by Sex in Seth Ward
The most frequent times of departure to work in Seth Ward are 12:00 PM to 3:59 PM (156, 27.6%) for males and 7:00 AM to 7:29 AM (65, 25.9%) for females.
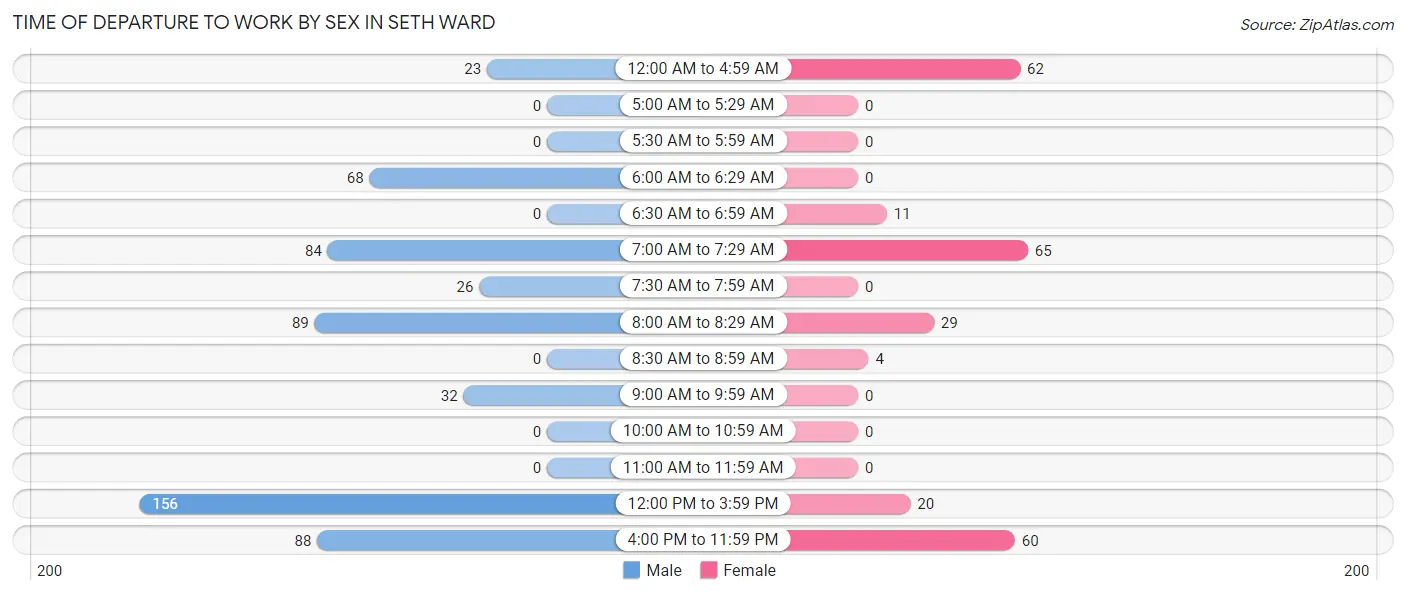
| Time of Departure | Male | Female |
| 12:00 AM to 4:59 AM | 23 (4.1%) | 62 (24.7%) |
| 5:00 AM to 5:29 AM | 0 (0.0%) | 0 (0.0%) |
| 5:30 AM to 5:59 AM | 0 (0.0%) | 0 (0.0%) |
| 6:00 AM to 6:29 AM | 68 (12.0%) | 0 (0.0%) |
| 6:30 AM to 6:59 AM | 0 (0.0%) | 11 (4.4%) |
| 7:00 AM to 7:29 AM | 84 (14.8%) | 65 (25.9%) |
| 7:30 AM to 7:59 AM | 26 (4.6%) | 0 (0.0%) |
| 8:00 AM to 8:29 AM | 89 (15.7%) | 29 (11.6%) |
| 8:30 AM to 8:59 AM | 0 (0.0%) | 4 (1.6%) |
| 9:00 AM to 9:59 AM | 32 (5.7%) | 0 (0.0%) |
| 10:00 AM to 10:59 AM | 0 (0.0%) | 0 (0.0%) |
| 11:00 AM to 11:59 AM | 0 (0.0%) | 0 (0.0%) |
| 12:00 PM to 3:59 PM | 156 (27.6%) | 20 (8.0%) |
| 4:00 PM to 11:59 PM | 88 (15.5%) | 60 (23.9%) |
| Total | 566 (100.0%) | 251 (100.0%) |
Housing Occupancy in Seth Ward
Occupancy by Ownership in Seth Ward
Of the total 524 dwellings in Seth Ward, owner-occupied units account for 418 (79.8%), while renter-occupied units make up 106 (20.2%).
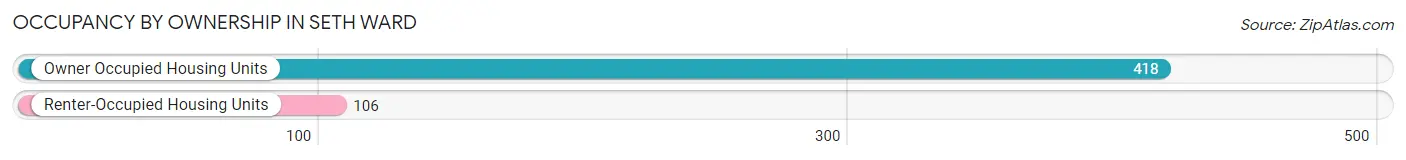
| Occupancy | # Housing Units | % Housing Units |
| Owner Occupied Housing Units | 418 | 79.8% |
| Renter-Occupied Housing Units | 106 | 20.2% |
| Total Occupied Housing Units | 524 | 100.0% |
Occupancy by Household Size in Seth Ward
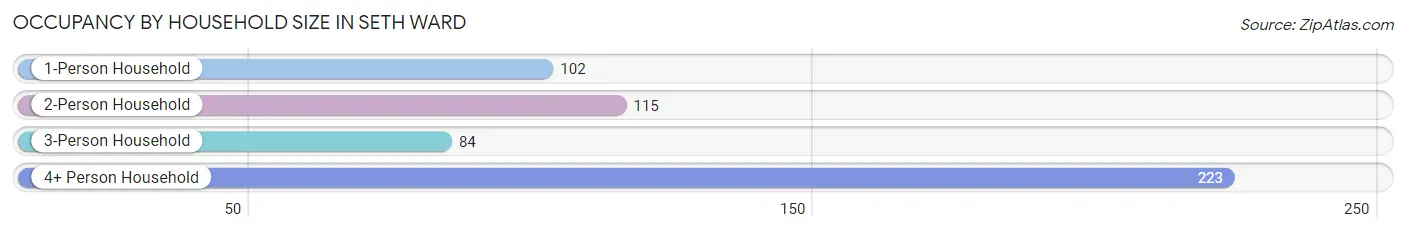
| Household Size | # Housing Units | % Housing Units |
| 1-Person Household | 102 | 19.5% |
| 2-Person Household | 115 | 22.0% |
| 3-Person Household | 84 | 16.0% |
| 4+ Person Household | 223 | 42.6% |
| Total Housing Units | 524 | 100.0% |
Occupancy by Ownership by Household Size in Seth Ward
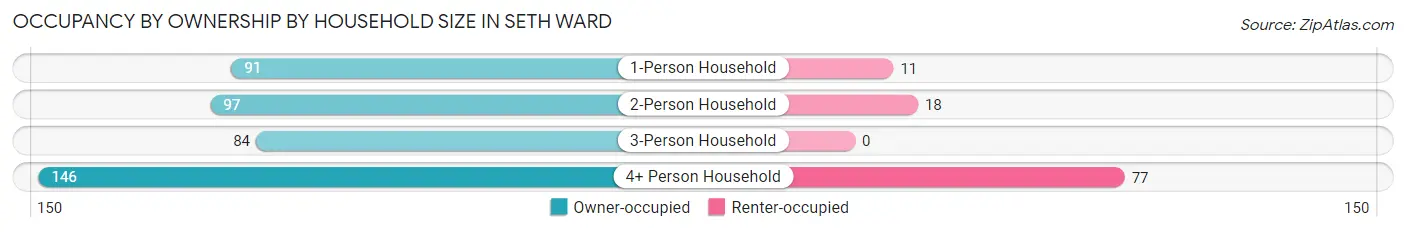
| Household Size | Owner-occupied | Renter-occupied |
| 1-Person Household | 91 (89.2%) | 11 (10.8%) |
| 2-Person Household | 97 (84.4%) | 18 (15.7%) |
| 3-Person Household | 84 (100.0%) | 0 (0.0%) |
| 4+ Person Household | 146 (65.5%) | 77 (34.5%) |
| Total Housing Units | 418 (79.8%) | 106 (20.2%) |
Occupancy by Educational Attainment in Seth Ward
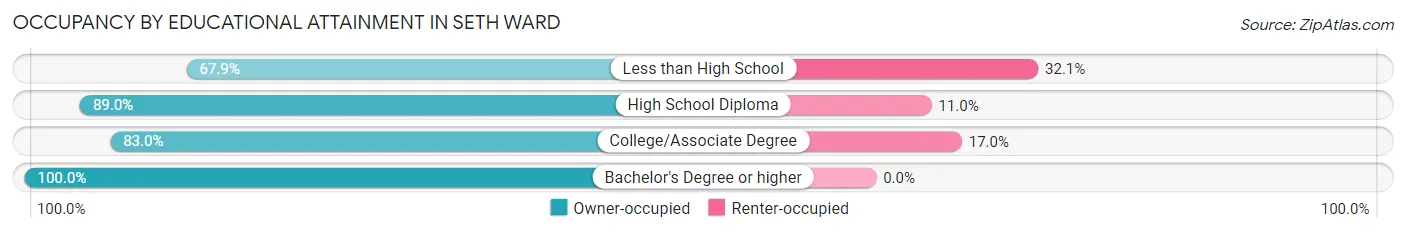
| Household Size | Owner-occupied | Renter-occupied |
| Less than High School | 148 (67.9%) | 70 (32.1%) |
| High School Diploma | 146 (89.0%) | 18 (11.0%) |
| College/Associate Degree | 88 (83.0%) | 18 (17.0%) |
| Bachelor's Degree or higher | 36 (100.0%) | 0 (0.0%) |
Occupancy by Age of Householder in Seth Ward
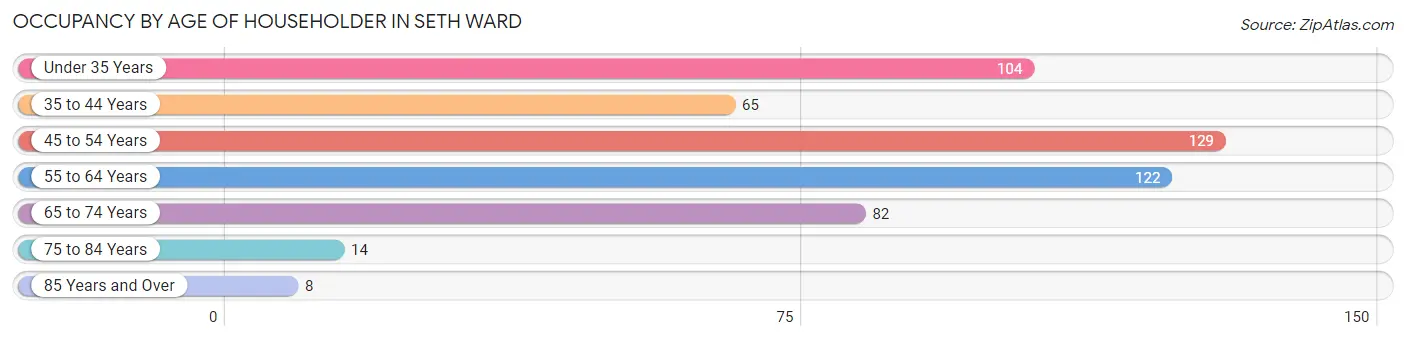
| Age Bracket | # Households | % Households |
| Under 35 Years | 104 | 19.9% |
| 35 to 44 Years | 65 | 12.4% |
| 45 to 54 Years | 129 | 24.6% |
| 55 to 64 Years | 122 | 23.3% |
| 65 to 74 Years | 82 | 15.7% |
| 75 to 84 Years | 14 | 2.7% |
| 85 Years and Over | 8 | 1.5% |
| Total | 524 | 100.0% |
Housing Finances in Seth Ward
Median Income by Occupancy in Seth Ward
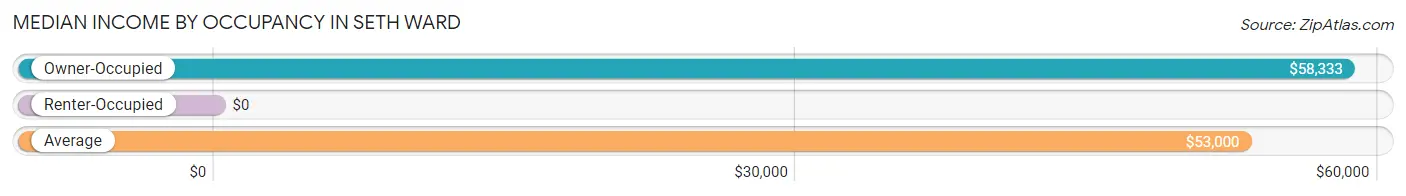
| Occupancy Type | # Households | Median Income |
| Owner-Occupied | 418 (79.8%) | $58,333 |
| Renter-Occupied | 106 (20.2%) | $0 |
| Average | 524 (100.0%) | $53,000 |
Occupancy by Householder Income Bracket in Seth Ward
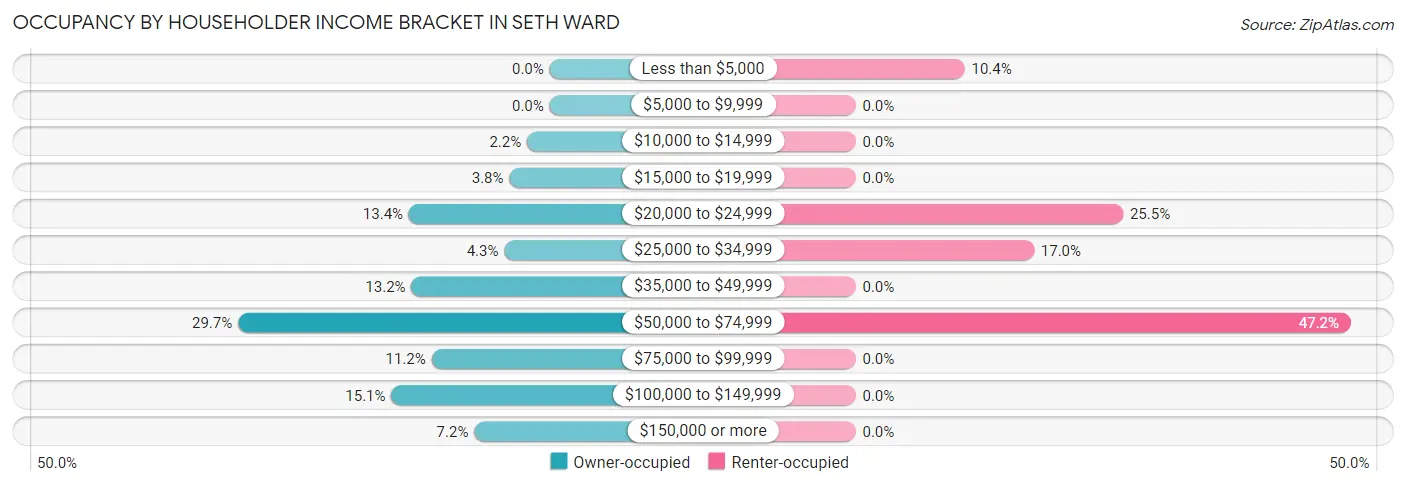
| Income Bracket | Owner-occupied | Renter-occupied |
| Less than $5,000 | 0 (0.0%) | 11 (10.4%) |
| $5,000 to $9,999 | 0 (0.0%) | 0 (0.0%) |
| $10,000 to $14,999 | 9 (2.1%) | 0 (0.0%) |
| $15,000 to $19,999 | 16 (3.8%) | 0 (0.0%) |
| $20,000 to $24,999 | 56 (13.4%) | 27 (25.5%) |
| $25,000 to $34,999 | 18 (4.3%) | 18 (17.0%) |
| $35,000 to $49,999 | 55 (13.2%) | 0 (0.0%) |
| $50,000 to $74,999 | 124 (29.7%) | 50 (47.2%) |
| $75,000 to $99,999 | 47 (11.2%) | 0 (0.0%) |
| $100,000 to $149,999 | 63 (15.1%) | 0 (0.0%) |
| $150,000 or more | 30 (7.2%) | 0 (0.0%) |
| Total | 418 (100.0%) | 106 (100.0%) |
Monthly Housing Cost Tiers in Seth Ward
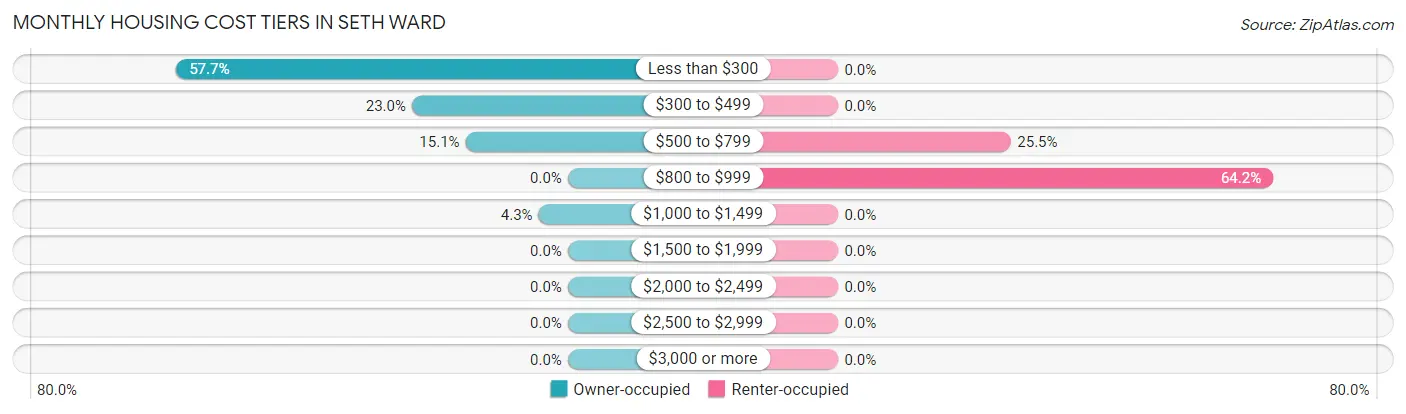
| Monthly Cost | Owner-occupied | Renter-occupied |
| Less than $300 | 241 (57.7%) | 0 (0.0%) |
| $300 to $499 | 96 (23.0%) | 0 (0.0%) |
| $500 to $799 | 63 (15.1%) | 27 (25.5%) |
| $800 to $999 | 0 (0.0%) | 68 (64.1%) |
| $1,000 to $1,499 | 18 (4.3%) | 0 (0.0%) |
| $1,500 to $1,999 | 0 (0.0%) | 0 (0.0%) |
| $2,000 to $2,499 | 0 (0.0%) | 0 (0.0%) |
| $2,500 to $2,999 | 0 (0.0%) | 0 (0.0%) |
| $3,000 or more | 0 (0.0%) | 0 (0.0%) |
| Total | 418 (100.0%) | 106 (100.0%) |
Physical Housing Characteristics in Seth Ward
Housing Structures in Seth Ward
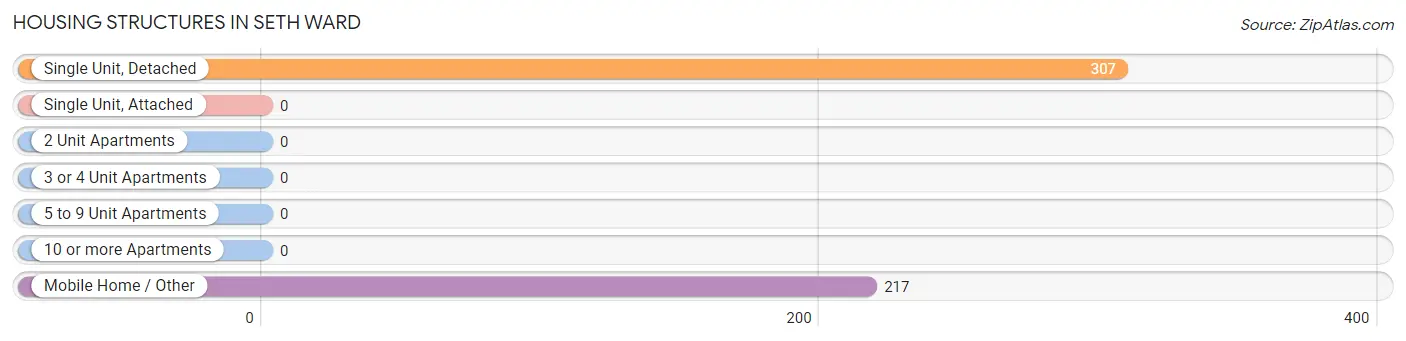
| Structure Type | # Housing Units | % Housing Units |
| Single Unit, Detached | 307 | 58.6% |
| Single Unit, Attached | 0 | 0.0% |
| 2 Unit Apartments | 0 | 0.0% |
| 3 or 4 Unit Apartments | 0 | 0.0% |
| 5 to 9 Unit Apartments | 0 | 0.0% |
| 10 or more Apartments | 0 | 0.0% |
| Mobile Home / Other | 217 | 41.4% |
| Total | 524 | 100.0% |
Housing Structures by Occupancy in Seth Ward
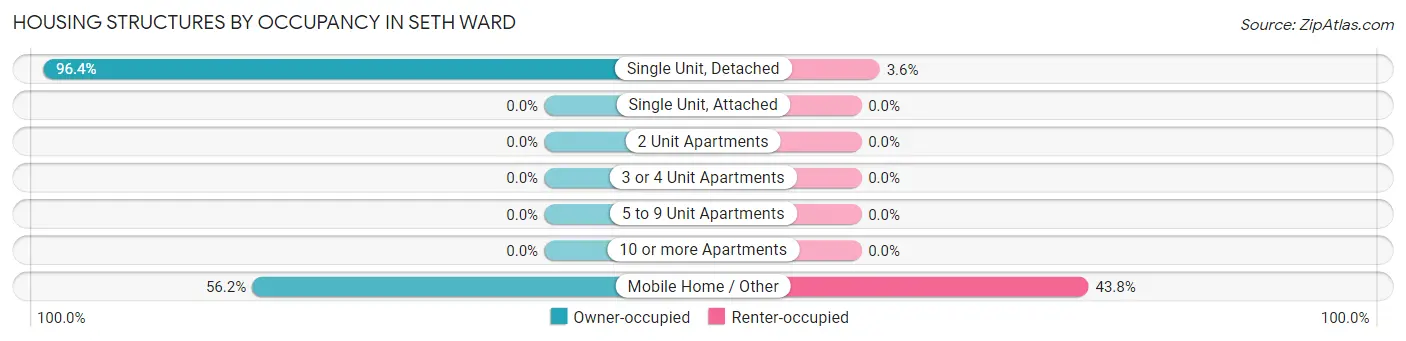
| Structure Type | Owner-occupied | Renter-occupied |
| Single Unit, Detached | 296 (96.4%) | 11 (3.6%) |
| Single Unit, Attached | 0 (0.0%) | 0 (0.0%) |
| 2 Unit Apartments | 0 (0.0%) | 0 (0.0%) |
| 3 or 4 Unit Apartments | 0 (0.0%) | 0 (0.0%) |
| 5 to 9 Unit Apartments | 0 (0.0%) | 0 (0.0%) |
| 10 or more Apartments | 0 (0.0%) | 0 (0.0%) |
| Mobile Home / Other | 122 (56.2%) | 95 (43.8%) |
| Total | 418 (79.8%) | 106 (20.2%) |
Housing Structures by Number of Rooms in Seth Ward
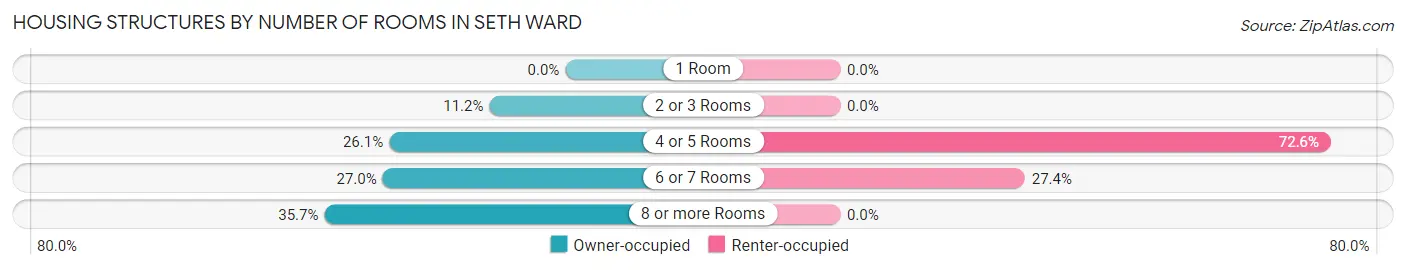
| Number of Rooms | Owner-occupied | Renter-occupied |
| 1 Room | 0 (0.0%) | 0 (0.0%) |
| 2 or 3 Rooms | 47 (11.2%) | 0 (0.0%) |
| 4 or 5 Rooms | 109 (26.1%) | 77 (72.6%) |
| 6 or 7 Rooms | 113 (27.0%) | 29 (27.4%) |
| 8 or more Rooms | 149 (35.6%) | 0 (0.0%) |
| Total | 418 (100.0%) | 106 (100.0%) |
Housing Structure by Heating Type in Seth Ward
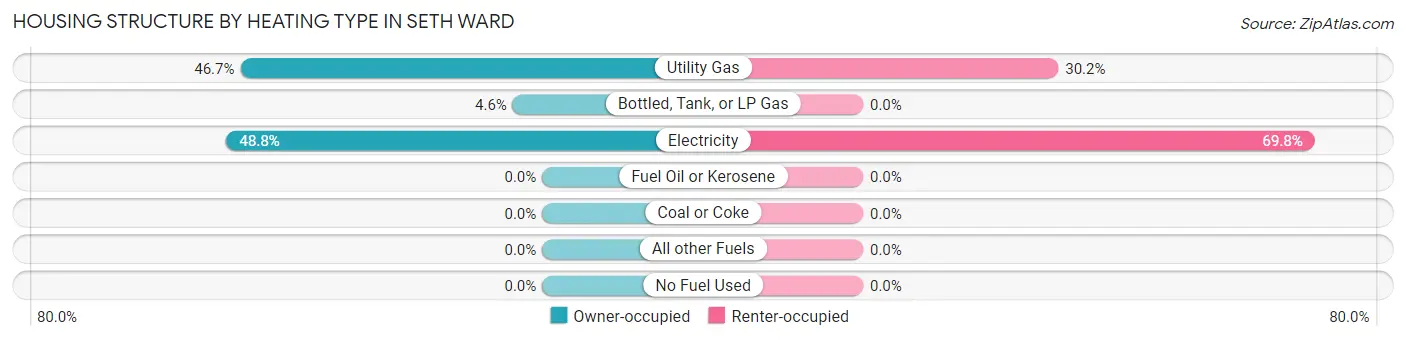
| Heating Type | Owner-occupied | Renter-occupied |
| Utility Gas | 195 (46.7%) | 32 (30.2%) |
| Bottled, Tank, or LP Gas | 19 (4.5%) | 0 (0.0%) |
| Electricity | 204 (48.8%) | 74 (69.8%) |
| Fuel Oil or Kerosene | 0 (0.0%) | 0 (0.0%) |
| Coal or Coke | 0 (0.0%) | 0 (0.0%) |
| All other Fuels | 0 (0.0%) | 0 (0.0%) |
| No Fuel Used | 0 (0.0%) | 0 (0.0%) |
| Total | 418 (100.0%) | 106 (100.0%) |
Household Vehicle Usage in Seth Ward
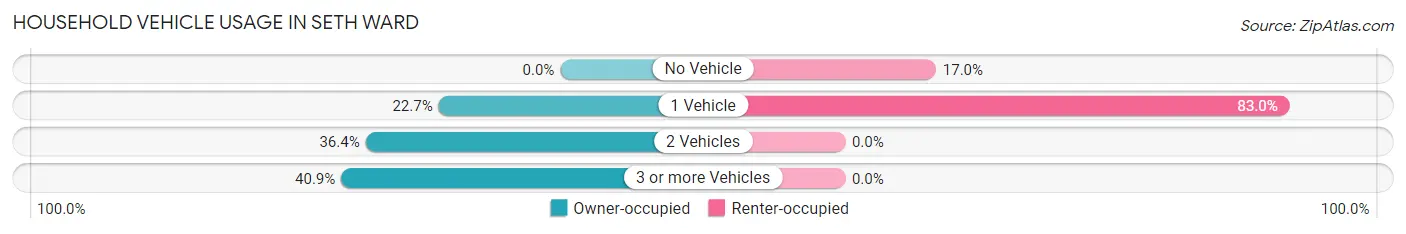
| Vehicles per Household | Owner-occupied | Renter-occupied |
| No Vehicle | 0 (0.0%) | 18 (17.0%) |
| 1 Vehicle | 95 (22.7%) | 88 (83.0%) |
| 2 Vehicles | 152 (36.4%) | 0 (0.0%) |
| 3 or more Vehicles | 171 (40.9%) | 0 (0.0%) |
| Total | 418 (100.0%) | 106 (100.0%) |
Real Estate & Mortgages in Seth Ward
Real Estate and Mortgage Overview in Seth Ward
| Characteristic | Without Mortgage | With Mortgage |
| Housing Units | 386 | 32 |
| Median Property Value | $46,500 | $81,100 |
| Median Household Income | $54,500 | $0 |
| Monthly Housing Costs | $282 | $0 |
| Real Estate Taxes | $500 | $0 |
Property Value by Mortgage Status in Seth Ward
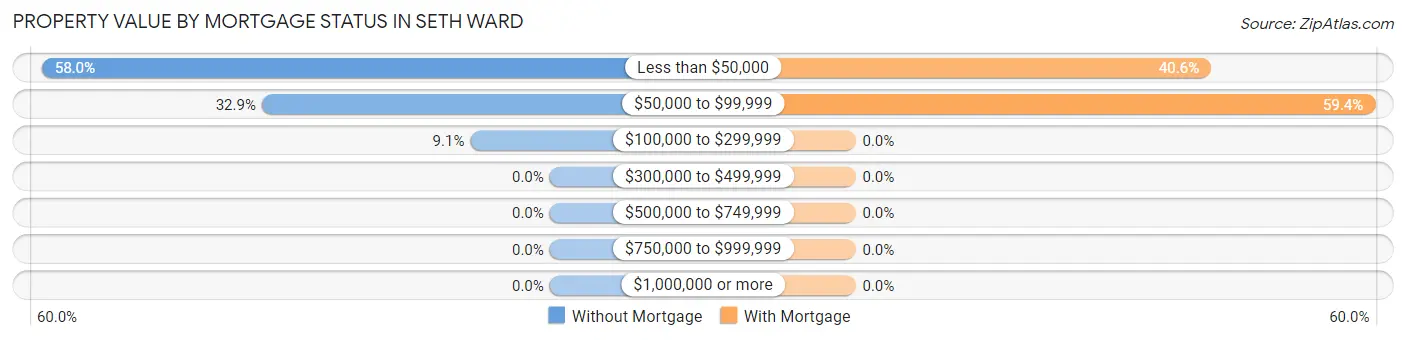
| Property Value | Without Mortgage | With Mortgage |
| Less than $50,000 | 224 (58.0%) | 13 (40.6%) |
| $50,000 to $99,999 | 127 (32.9%) | 19 (59.4%) |
| $100,000 to $299,999 | 35 (9.1%) | 0 (0.0%) |
| $300,000 to $499,999 | 0 (0.0%) | 0 (0.0%) |
| $500,000 to $749,999 | 0 (0.0%) | 0 (0.0%) |
| $750,000 to $999,999 | 0 (0.0%) | 0 (0.0%) |
| $1,000,000 or more | 0 (0.0%) | 0 (0.0%) |
| Total | 386 (100.0%) | 32 (100.0%) |
Household Income by Mortgage Status in Seth Ward
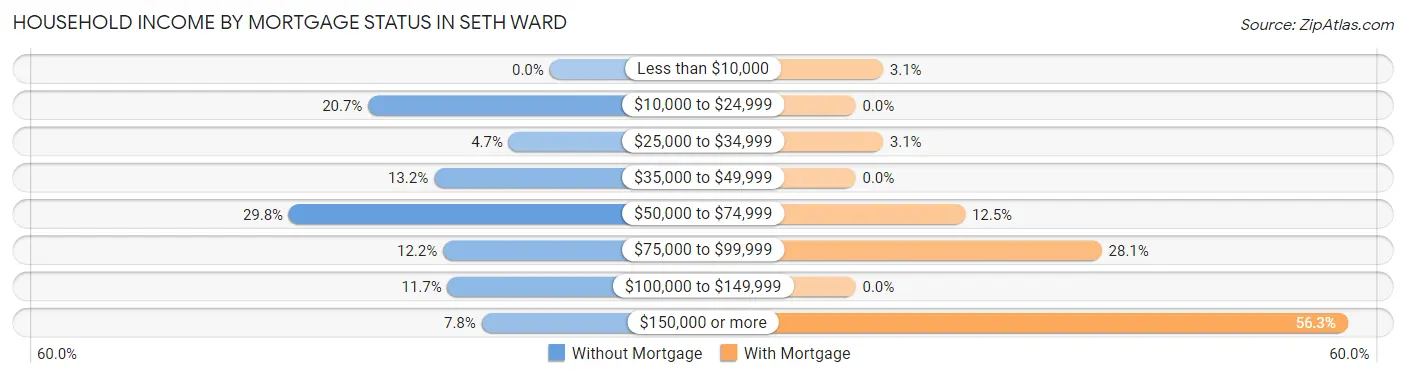
| Household Income | Without Mortgage | With Mortgage |
| Less than $10,000 | 0 (0.0%) | 1 (3.1%) |
| $10,000 to $24,999 | 80 (20.7%) | 0 (0.0%) |
| $25,000 to $34,999 | 18 (4.7%) | 1 (3.1%) |
| $35,000 to $49,999 | 51 (13.2%) | 0 (0.0%) |
| $50,000 to $74,999 | 115 (29.8%) | 4 (12.5%) |
| $75,000 to $99,999 | 47 (12.2%) | 9 (28.1%) |
| $100,000 to $149,999 | 45 (11.7%) | 0 (0.0%) |
| $150,000 or more | 30 (7.8%) | 18 (56.2%) |
| Total | 386 (100.0%) | 32 (100.0%) |
Property Value to Household Income Ratio in Seth Ward
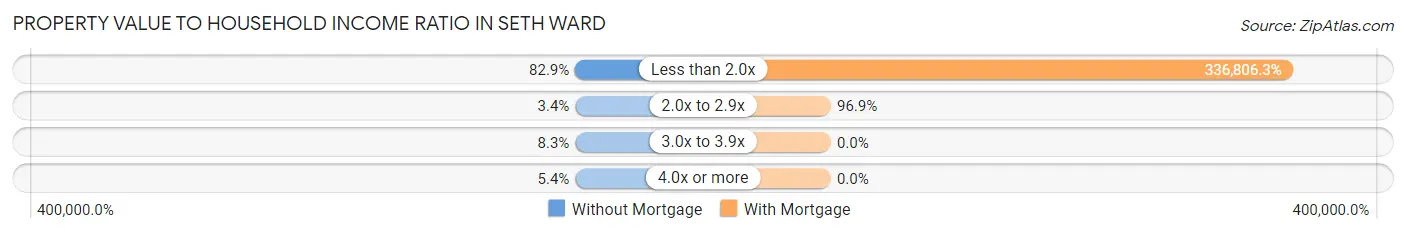
| Value-to-Income Ratio | Without Mortgage | With Mortgage |
| Less than 2.0x | 320 (82.9%) | 107,778 (336,806.2%) |
| 2.0x to 2.9x | 13 (3.4%) | 31 (96.9%) |
| 3.0x to 3.9x | 32 (8.3%) | 0 (0.0%) |
| 4.0x or more | 21 (5.4%) | 0 (0.0%) |
| Total | 386 (100.0%) | 32 (100.0%) |
Real Estate Taxes by Mortgage Status in Seth Ward
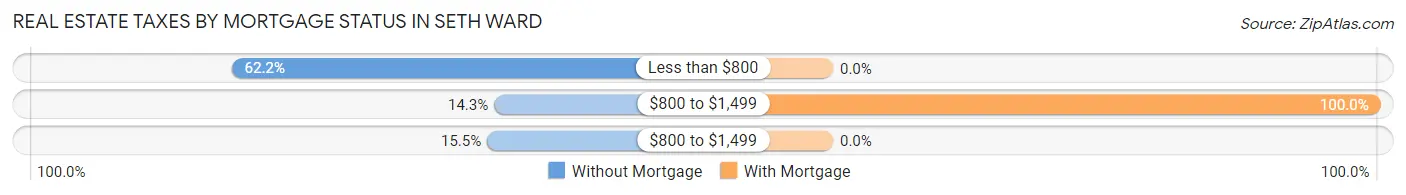
| Property Taxes | Without Mortgage | With Mortgage |
| Less than $800 | 240 (62.2%) | 0 (0.0%) |
| $800 to $1,499 | 55 (14.2%) | 32 (100.0%) |
| $800 to $1,499 | 60 (15.5%) | 0 (0.0%) |
| Total | 386 (100.0%) | 32 (100.0%) |
Health & Disability in Seth Ward
Health Insurance Coverage by Age in Seth Ward
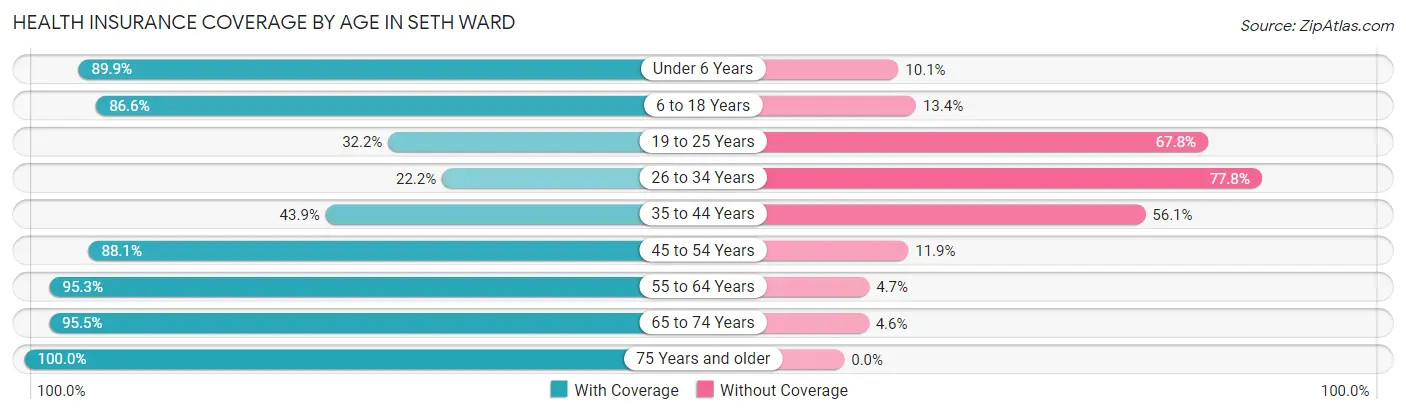
| Age Bracket | With Coverage | Without Coverage |
| Under 6 Years | 205 (89.9%) | 23 (10.1%) |
| 6 to 18 Years | 434 (86.6%) | 67 (13.4%) |
| 19 to 25 Years | 38 (32.2%) | 80 (67.8%) |
| 26 to 34 Years | 82 (22.2%) | 288 (77.8%) |
| 35 to 44 Years | 50 (43.9%) | 64 (56.1%) |
| 45 to 54 Years | 214 (88.1%) | 29 (11.9%) |
| 55 to 64 Years | 184 (95.3%) | 9 (4.7%) |
| 65 to 74 Years | 126 (95.5%) | 6 (4.5%) |
| 75 Years and older | 22 (100.0%) | 0 (0.0%) |
| Total | 1,355 (70.5%) | 566 (29.5%) |
Health Insurance Coverage by Citizenship Status in Seth Ward
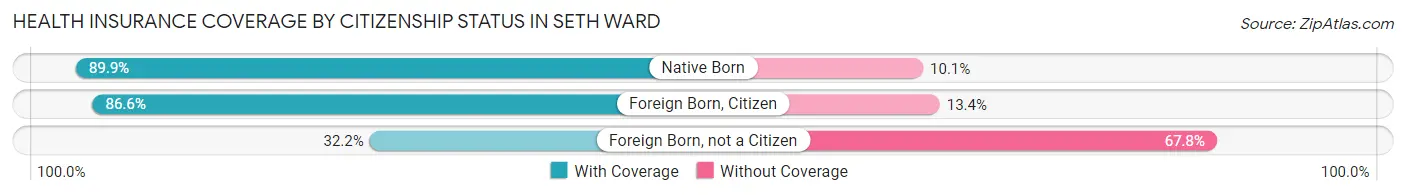
| Citizenship Status | With Coverage | Without Coverage |
| Native Born | 205 (89.9%) | 23 (10.1%) |
| Foreign Born, Citizen | 434 (86.6%) | 67 (13.4%) |
| Foreign Born, not a Citizen | 38 (32.2%) | 80 (67.8%) |
Health Insurance Coverage by Household Income in Seth Ward
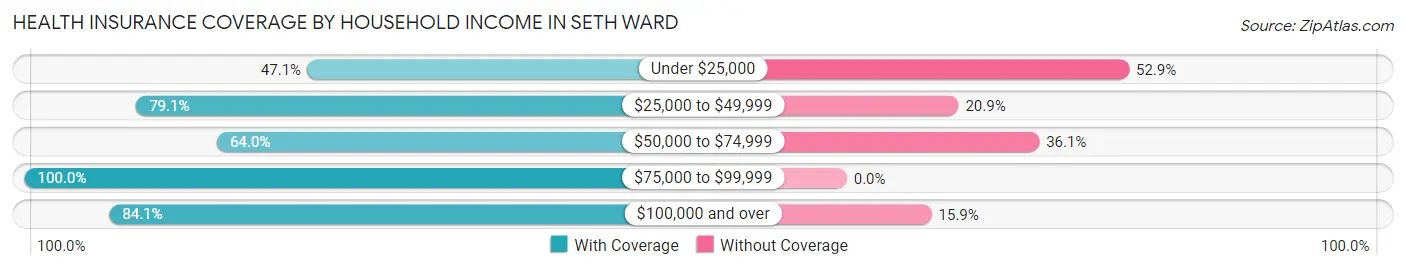
| Household Income | With Coverage | Without Coverage |
| Under $25,000 | 114 (47.1%) | 128 (52.9%) |
| $25,000 to $49,999 | 223 (79.1%) | 59 (20.9%) |
| $50,000 to $74,999 | 557 (63.9%) | 314 (36.0%) |
| $75,000 to $99,999 | 117 (100.0%) | 0 (0.0%) |
| $100,000 and over | 344 (84.1%) | 65 (15.9%) |
Public vs Private Health Insurance Coverage by Age in Seth Ward
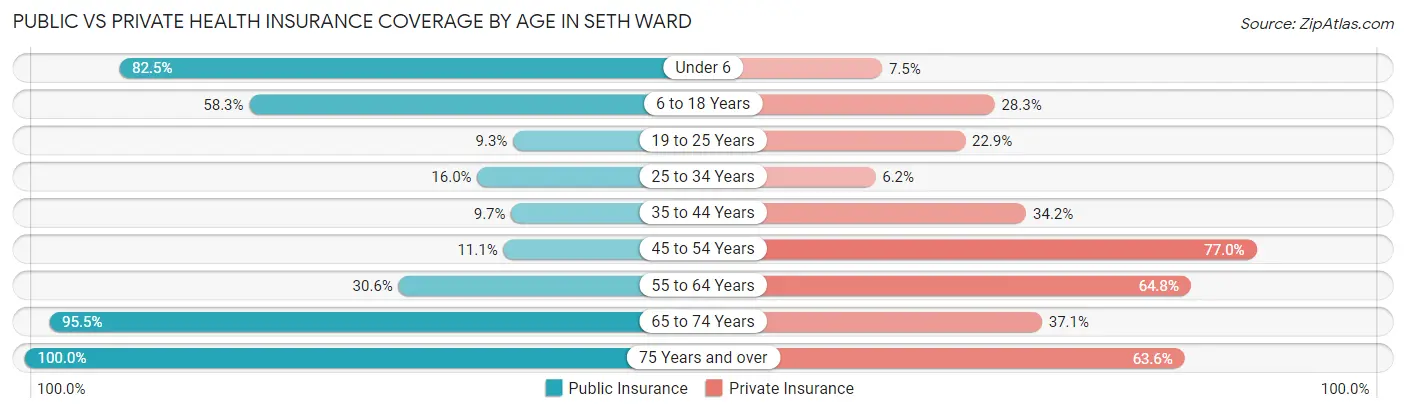
| Age Bracket | Public Insurance | Private Insurance |
| Under 6 | 188 (82.5%) | 17 (7.5%) |
| 6 to 18 Years | 292 (58.3%) | 142 (28.3%) |
| 19 to 25 Years | 11 (9.3%) | 27 (22.9%) |
| 25 to 34 Years | 59 (16.0%) | 23 (6.2%) |
| 35 to 44 Years | 11 (9.7%) | 39 (34.2%) |
| 45 to 54 Years | 27 (11.1%) | 187 (76.9%) |
| 55 to 64 Years | 59 (30.6%) | 125 (64.8%) |
| 65 to 74 Years | 126 (95.5%) | 49 (37.1%) |
| 75 Years and over | 22 (100.0%) | 14 (63.6%) |
| Total | 795 (41.4%) | 623 (32.4%) |
Disability Status by Sex by Age in Seth Ward
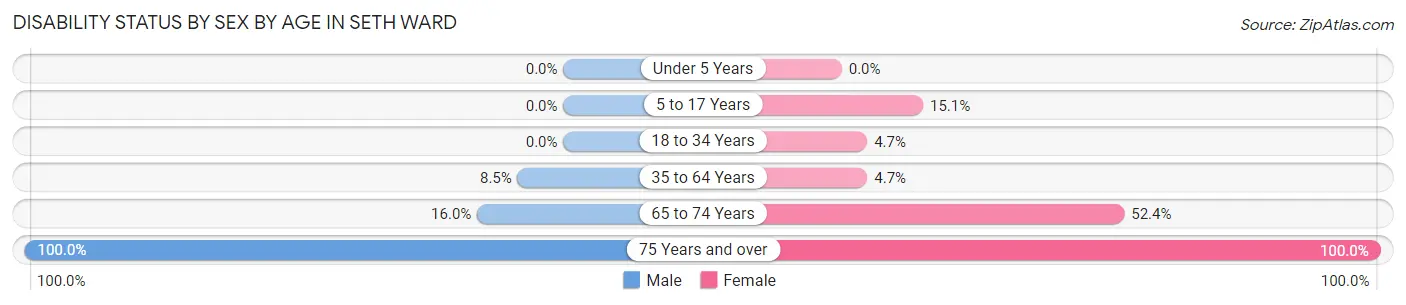
| Age Bracket | Male | Female |
| Under 5 Years | 0 (0.0%) | 0 (0.0%) |
| 5 to 17 Years | 0 (0.0%) | 27 (15.1%) |
| 18 to 34 Years | 0 (0.0%) | 11 (4.7%) |
| 35 to 64 Years | 27 (8.5%) | 11 (4.7%) |
| 65 to 74 Years | 8 (16.0%) | 43 (52.4%) |
| 75 Years and over | 8 (100.0%) | 14 (100.0%) |
Disability Class by Sex by Age in Seth Ward
Disability Class: Hearing Difficulty
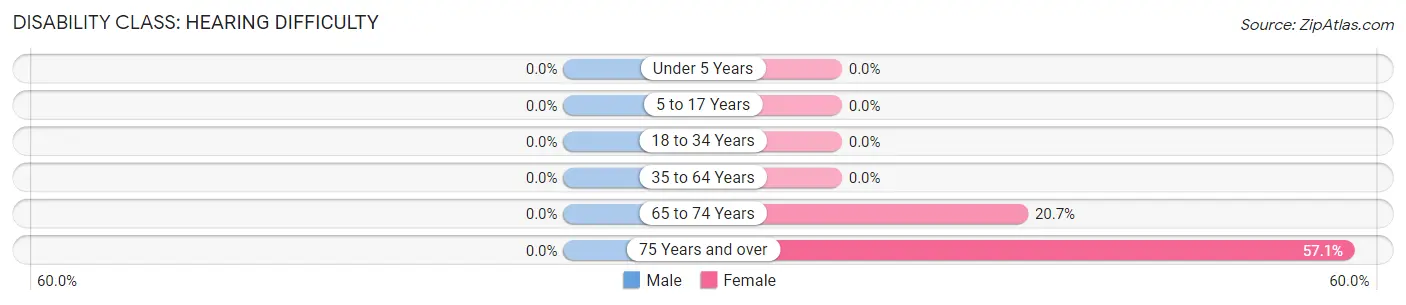
| Age Bracket | Male | Female |
| Under 5 Years | 0 (0.0%) | 0 (0.0%) |
| 5 to 17 Years | 0 (0.0%) | 0 (0.0%) |
| 18 to 34 Years | 0 (0.0%) | 0 (0.0%) |
| 35 to 64 Years | 0 (0.0%) | 0 (0.0%) |
| 65 to 74 Years | 0 (0.0%) | 17 (20.7%) |
| 75 Years and over | 0 (0.0%) | 8 (57.1%) |
Disability Class: Vision Difficulty
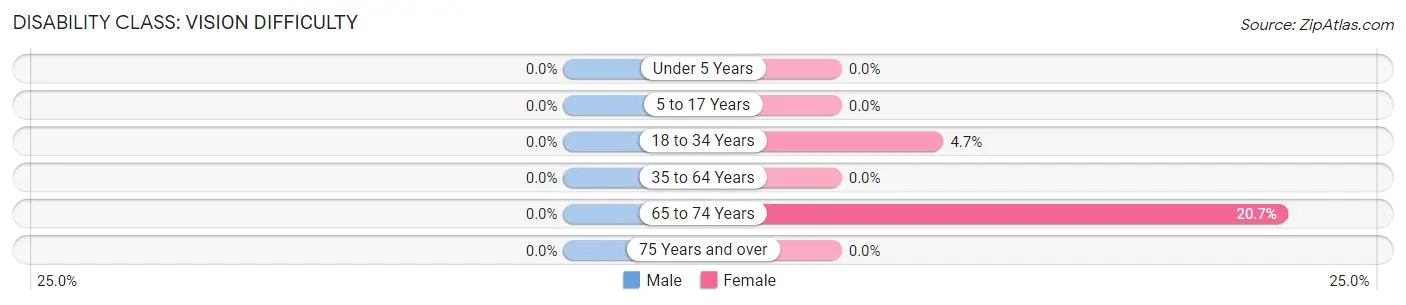
| Age Bracket | Male | Female |
| Under 5 Years | 0 (0.0%) | 0 (0.0%) |
| 5 to 17 Years | 0 (0.0%) | 0 (0.0%) |
| 18 to 34 Years | 0 (0.0%) | 11 (4.7%) |
| 35 to 64 Years | 0 (0.0%) | 0 (0.0%) |
| 65 to 74 Years | 0 (0.0%) | 17 (20.7%) |
| 75 Years and over | 0 (0.0%) | 0 (0.0%) |
Disability Class: Cognitive Difficulty
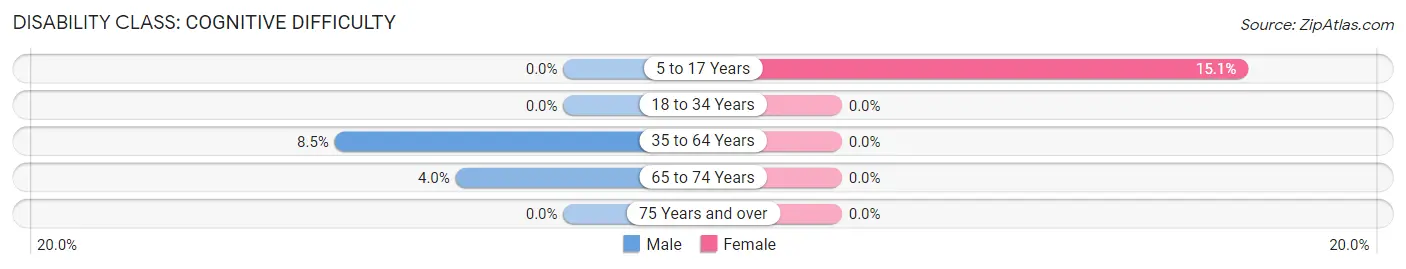
| Age Bracket | Male | Female |
| 5 to 17 Years | 0 (0.0%) | 27 (15.1%) |
| 18 to 34 Years | 0 (0.0%) | 0 (0.0%) |
| 35 to 64 Years | 27 (8.5%) | 0 (0.0%) |
| 65 to 74 Years | 2 (4.0%) | 0 (0.0%) |
| 75 Years and over | 0 (0.0%) | 0 (0.0%) |
Disability Class: Ambulatory Difficulty
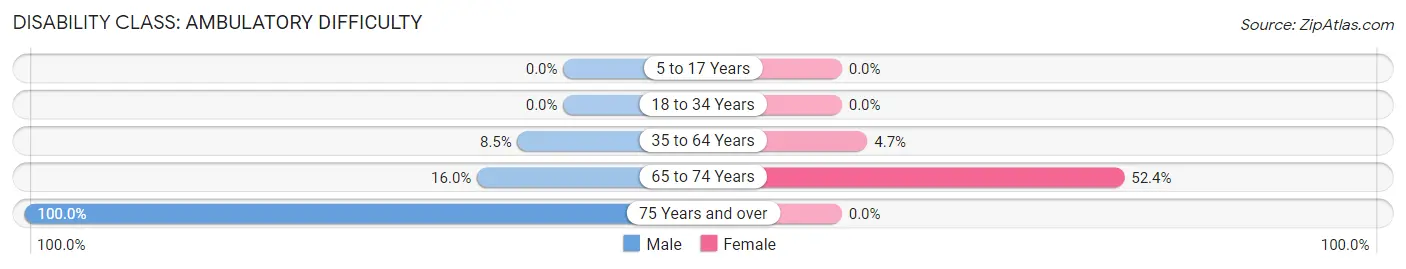
| Age Bracket | Male | Female |
| 5 to 17 Years | 0 (0.0%) | 0 (0.0%) |
| 18 to 34 Years | 0 (0.0%) | 0 (0.0%) |
| 35 to 64 Years | 27 (8.5%) | 11 (4.7%) |
| 65 to 74 Years | 8 (16.0%) | 43 (52.4%) |
| 75 Years and over | 8 (100.0%) | 0 (0.0%) |
Disability Class: Self-Care Difficulty
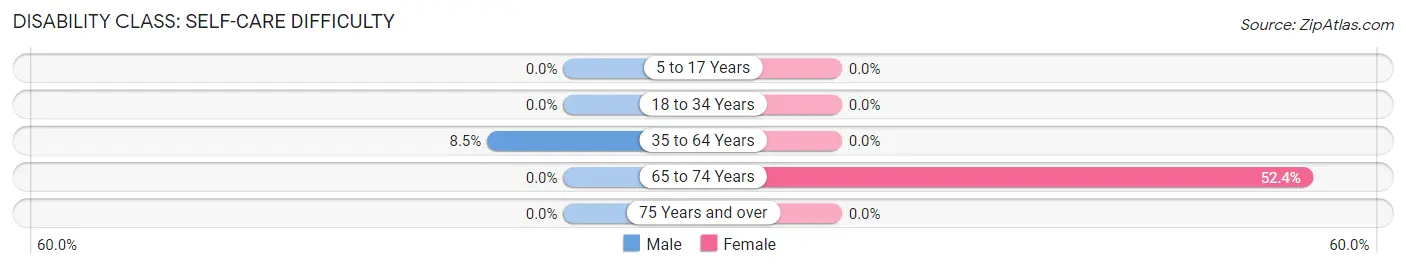
| Age Bracket | Male | Female |
| 5 to 17 Years | 0 (0.0%) | 0 (0.0%) |
| 18 to 34 Years | 0 (0.0%) | 0 (0.0%) |
| 35 to 64 Years | 27 (8.5%) | 0 (0.0%) |
| 65 to 74 Years | 0 (0.0%) | 43 (52.4%) |
| 75 Years and over | 0 (0.0%) | 0 (0.0%) |
Technology Access in Seth Ward
Computing Device Access in Seth Ward
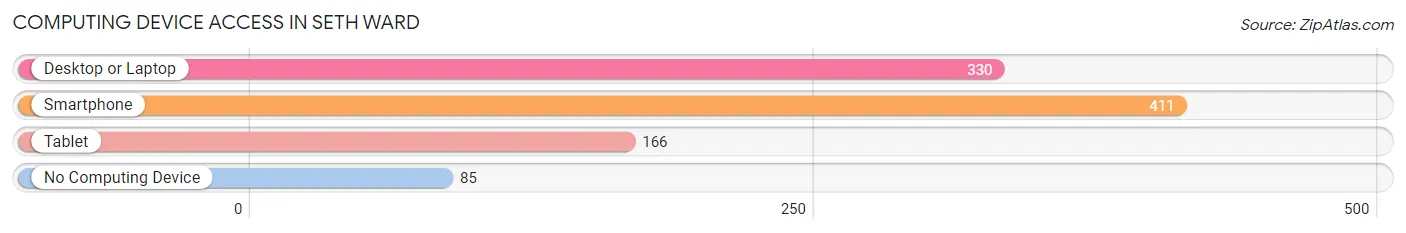
| Device Type | # Households | % Households |
| Desktop or Laptop | 330 | 63.0% |
| Smartphone | 411 | 78.4% |
| Tablet | 166 | 31.7% |
| No Computing Device | 85 | 16.2% |
| Total | 524 | 100.0% |
Internet Access in Seth Ward
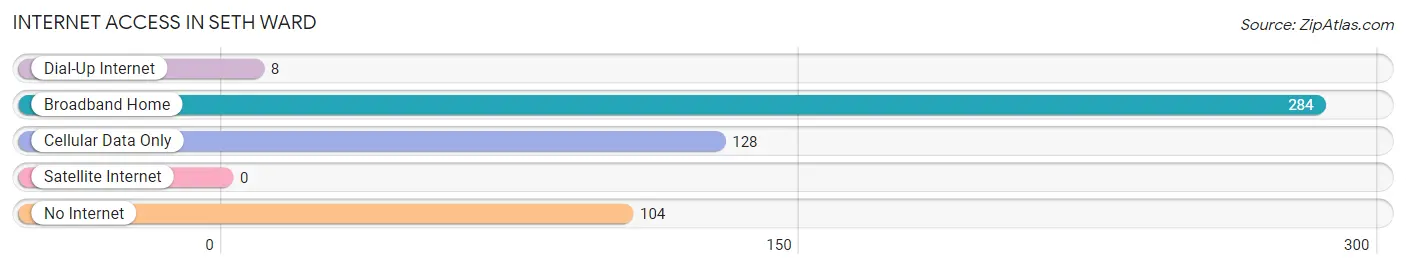
| Internet Type | # Households | % Households |
| Dial-Up Internet | 8 | 1.5% |
| Broadband Home | 284 | 54.2% |
| Cellular Data Only | 128 | 24.4% |
| Satellite Internet | 0 | 0.0% |
| No Internet | 104 | 19.9% |
| Total | 524 | 100.0% |
Seth Ward Summary
Seth Ward is a small unincorporated community located in Hale County, Texas. It is situated about 10 miles west of Plainview and about 20 miles east of Lubbock. The population of Seth Ward was estimated to be around 1,000 in 2020.
History
Seth Ward was founded in the late 1800s by a group of settlers from the nearby town of Plainview. The town was named after Seth Ward, a prominent local rancher and businessman. The first post office in Seth Ward was established in 1891.
In the early 1900s, Seth Ward was a thriving agricultural community. Cotton was the main crop grown in the area, and the town had several cotton gins and other businesses related to the cotton industry.
Geography
Seth Ward is located in the High Plains region of Texas. The terrain is mostly flat, with some rolling hills in the area. The climate is semi-arid, with hot summers and mild winters. The average annual precipitation is around 18 inches.
Economy
The economy of Seth Ward is largely based on agriculture. Cotton is still the main crop grown in the area, and there are several cotton gins and other businesses related to the cotton industry. Other crops grown in the area include corn, wheat, and sorghum.
In addition to agriculture, Seth Ward has several small businesses, including a grocery store, a hardware store, and a few restaurants. There is also a small airport located in the town.
Demographics
As of the 2010 census, the population of Seth Ward was 1,072. The racial makeup of the town was 79.3% White, 0.3% African American, 0.2% Native American, 0.2% Asian, 0.1% Pacific Islander, 17.7% from other races, and 2.4% from two or more races. Hispanic or Latino of any race were 33.2% of the population.
The median household income in Seth Ward was $31,250, and the median family income was $35,000. The per capita income was $14,845. About 18.2% of the population was below the poverty line.
Conclusion
Seth Ward is a small unincorporated community located in Hale County, Texas. It has a population of around 1,000 and is largely based on agriculture. Cotton is the main crop grown in the area, and there are several businesses related to the cotton industry. The town also has several small businesses, including a grocery store, a hardware store, and a few restaurants. The racial makeup of the town is mostly White, with a significant Hispanic or Latino population. The median household income in Seth Ward is $31,250, and the per capita income is $14,845.
Common Questions
What is Per Capita Income in Seth Ward?
Per Capita income in Seth Ward is $16,066.
What is the Median Family Income in Seth Ward?
Median Family Income in Seth Ward is $60,132.
What is the Median Household income in Seth Ward?
Median Household Income in Seth Ward is $53,000.
What is Income or Wage Gap in Seth Ward?
Income or Wage Gap in Seth Ward is 31.7%.
Women in Seth Ward earn 68.3 cents for every dollar earned by a man.
What is Inequality or Gini Index in Seth Ward?
Inequality or Gini Index in Seth Ward is 0.36.
What is the Total Population of Seth Ward?
Total Population of Seth Ward is 1,921.
What is the Total Male Population of Seth Ward?
Total Male Population of Seth Ward is 1,022.
What is the Total Female Population of Seth Ward?
Total Female Population of Seth Ward is 899.
What is the Ratio of Males per 100 Females in Seth Ward?
There are 113.68 Males per 100 Females in Seth Ward.
What is the Ratio of Females per 100 Males in Seth Ward?
There are 87.96 Females per 100 Males in Seth Ward.
What is the Median Population Age in Seth Ward?
Median Population Age in Seth Ward is 27.7 Years.
What is the Average Family Size in Seth Ward
Average Family Size in Seth Ward is 4.1 People.
What is the Average Household Size in Seth Ward
Average Household Size in Seth Ward is 3.7 People.
How Large is the Labor Force in Seth Ward?
There are 845 People in the Labor Forcein in Seth Ward.
What is the Percentage of People in the Labor Force in Seth Ward?
67.3% of People are in the Labor Force in Seth Ward.