Newry, SC Map & Demographics
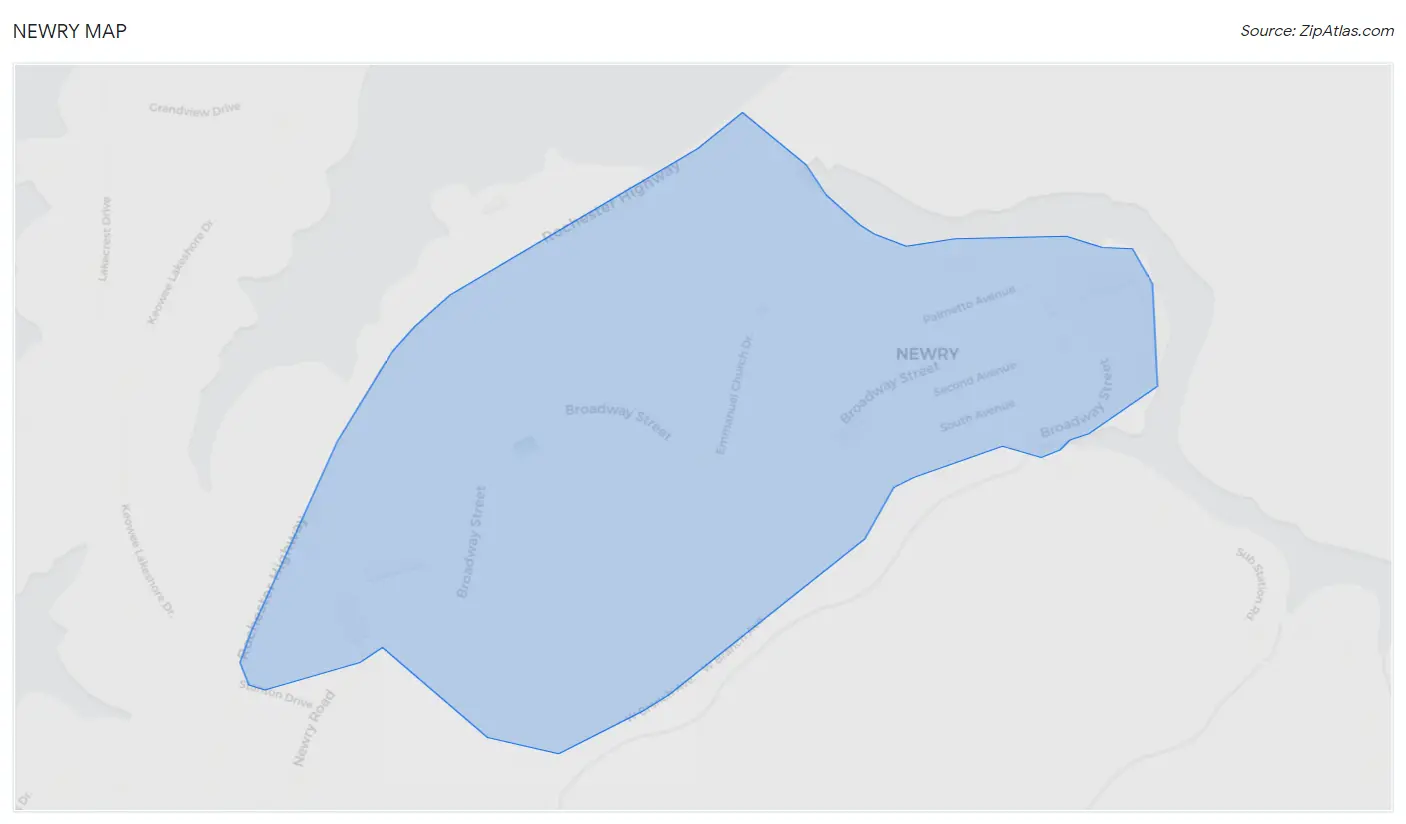
Newry Map
Newry Overview
$14,945
PER CAPITA INCOME
$43,476
AVG FAMILY INCOME
$42,550
AVG HOUSEHOLD INCOME
0.38
INEQUALITY / GINI INDEX
341
TOTAL POPULATION
196
MALE POPULATION
145
FEMALE POPULATION
135.17
MALES / 100 FEMALES
73.98
FEMALES / 100 MALES
58.0
MEDIAN AGE
2.8
AVG FAMILY SIZE
2.2
AVG HOUSEHOLD SIZE
32
LABOR FORCE [ PEOPLE ]
10.3%
PERCENT IN LABOR FORCE
Newry Zip Codes
Newry Area Codes
Income in Newry
Income Overview in Newry
Per Capita Income in Newry is $14,945, while median incomes of families and households are $43,476 and $42,550 respectively.
| Characteristic | Number | Measure |
| Per Capita Income | 341 | $14,945 |
| Median Family Income | 104 | $43,476 |
| Mean Family Income | 104 | $34,429 |
| Median Household Income | 152 | $42,550 |
| Mean Household Income | 152 | $33,118 |
| Income Deficit | 104 | $0 |
| Wage / Income Gap (%) | 341 | 0.00% |
| Wage / Income Gap ($) | 341 | 100.00¢ per $1 |
| Gini / Inequality Index | 341 | 0.38 |
Earnings by Sex in Newry
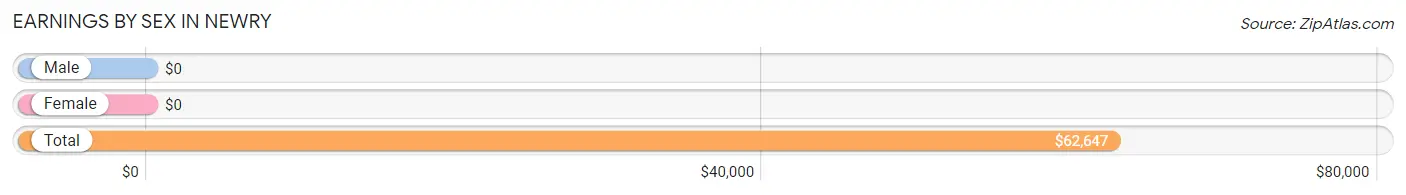
| Sex | Number | Average Earnings |
| Male | 27 (84.4%) | $0 |
| Female | 5 (15.6%) | $0 |
| Total | 32 (100.0%) | $62,647 |
Earnings by Sex by Income Bracket in Newry
The most common earnings brackets in Newry are $55,000 to $64,999 for men (17 | 63.0%) and $10,000 to $12,499 for women (5 | 100.0%).
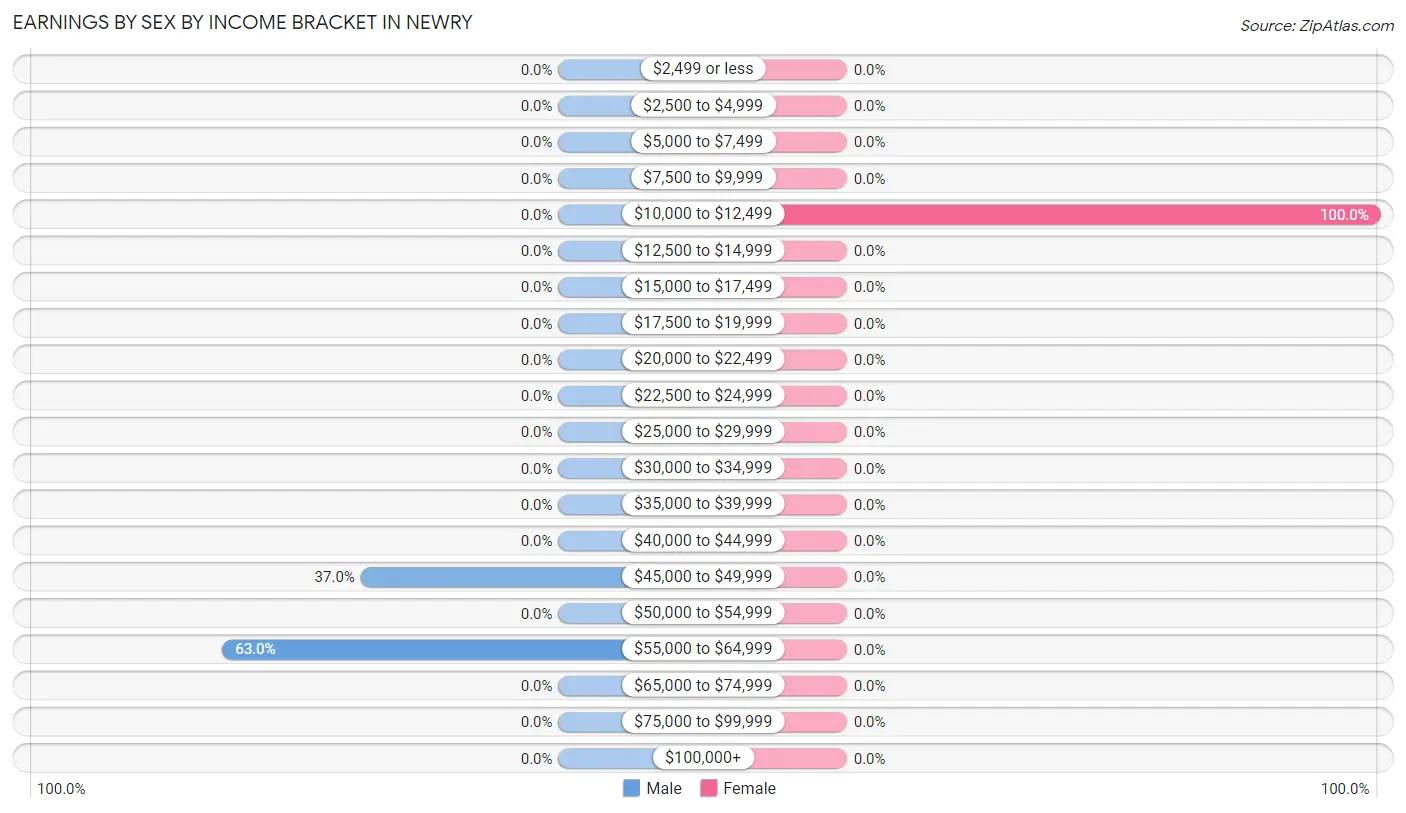
| Income | Male | Female |
| $2,499 or less | 0 (0.0%) | 0 (0.0%) |
| $2,500 to $4,999 | 0 (0.0%) | 0 (0.0%) |
| $5,000 to $7,499 | 0 (0.0%) | 0 (0.0%) |
| $7,500 to $9,999 | 0 (0.0%) | 0 (0.0%) |
| $10,000 to $12,499 | 0 (0.0%) | 5 (100.0%) |
| $12,500 to $14,999 | 0 (0.0%) | 0 (0.0%) |
| $15,000 to $17,499 | 0 (0.0%) | 0 (0.0%) |
| $17,500 to $19,999 | 0 (0.0%) | 0 (0.0%) |
| $20,000 to $22,499 | 0 (0.0%) | 0 (0.0%) |
| $22,500 to $24,999 | 0 (0.0%) | 0 (0.0%) |
| $25,000 to $29,999 | 0 (0.0%) | 0 (0.0%) |
| $30,000 to $34,999 | 0 (0.0%) | 0 (0.0%) |
| $35,000 to $39,999 | 0 (0.0%) | 0 (0.0%) |
| $40,000 to $44,999 | 0 (0.0%) | 0 (0.0%) |
| $45,000 to $49,999 | 10 (37.0%) | 0 (0.0%) |
| $50,000 to $54,999 | 0 (0.0%) | 0 (0.0%) |
| $55,000 to $64,999 | 17 (63.0%) | 0 (0.0%) |
| $65,000 to $74,999 | 0 (0.0%) | 0 (0.0%) |
| $75,000 to $99,999 | 0 (0.0%) | 0 (0.0%) |
| $100,000+ | 0 (0.0%) | 0 (0.0%) |
| Total | 27 (100.0%) | 5 (100.0%) |
Earnings by Sex by Educational Attainment in Newry
| Educational Attainment | Male Income | Female Income |
| Less than High School | - | - |
| High School Diploma | - | - |
| College or Associate's Degree | - | - |
| Bachelor's Degree | - | - |
| Graduate Degree | - | - |
| Total | - | - |
Family Income in Newry
Family Income Brackets in Newry
According to the Newry family income data, there are 41 families falling into the $35,000 to $49,999 income range, which is the most common income bracket and makes up 39.4% of all families.
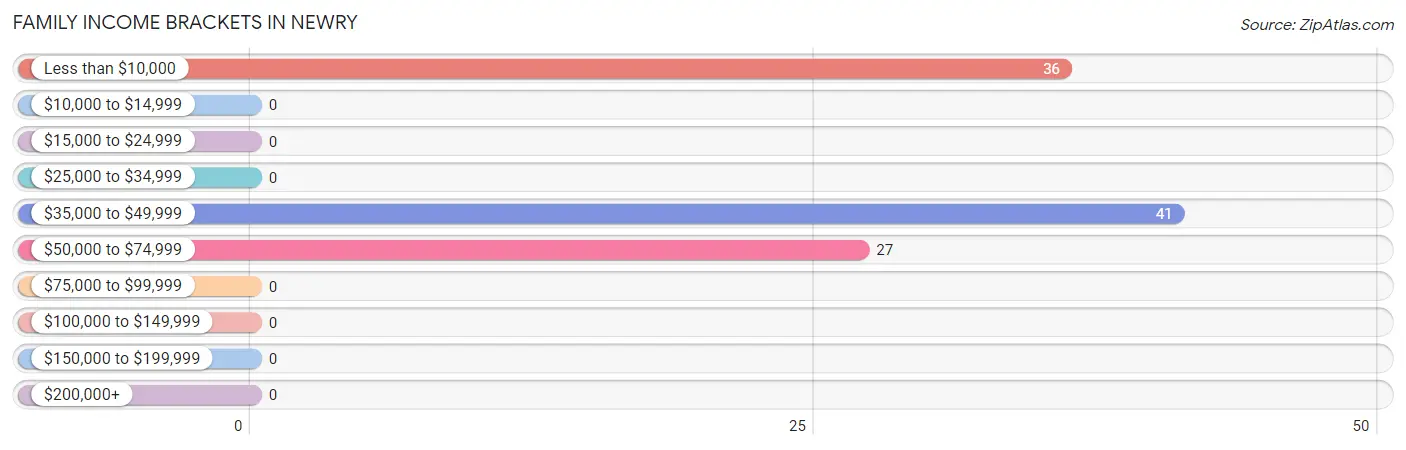
| Income Bracket | # Families | % Families |
| Less than $10,000 | 36 | 34.6% |
| $10,000 to $14,999 | 0 | 0.0% |
| $15,000 to $24,999 | 0 | 0.0% |
| $25,000 to $34,999 | 0 | 0.0% |
| $35,000 to $49,999 | 41 | 39.4% |
| $50,000 to $74,999 | 27 | 26.0% |
| $75,000 to $99,999 | 0 | 0.0% |
| $100,000 to $149,999 | 0 | 0.0% |
| $150,000 to $199,999 | 0 | 0.0% |
| $200,000+ | 0 | 0.0% |
Family Income by Famaliy Size in Newry
| Income Bracket | # Families | Median Income |
| 2-Person Families | 77 (74.0%) | $0 |
| 3-Person Families | 17 (16.4%) | $0 |
| 4-Person Families | 0 (0.0%) | $0 |
| 5-Person Families | 0 (0.0%) | $0 |
| 6-Person Families | 0 (0.0%) | $0 |
| 7+ Person Families | 10 (9.6%) | $0 |
| Total | 104 (100.0%) | $43,476 |
Family Income by Number of Earners in Newry
| Number of Earners | # Families | Median Income |
| No Earners | 77 (74.0%) | $0 |
| 1 Earner | 17 (16.4%) | $0 |
| 2 Earners | 10 (9.6%) | $0 |
| 3+ Earners | 0 (0.0%) | $0 |
| Total | 104 (100.0%) | $43,476 |
Household Income in Newry
Household Income Brackets in Newry
With 50 households falling in the category, the $35,000 to $49,999 income range is the most frequent in Newry, accounting for 32.9% of all households.
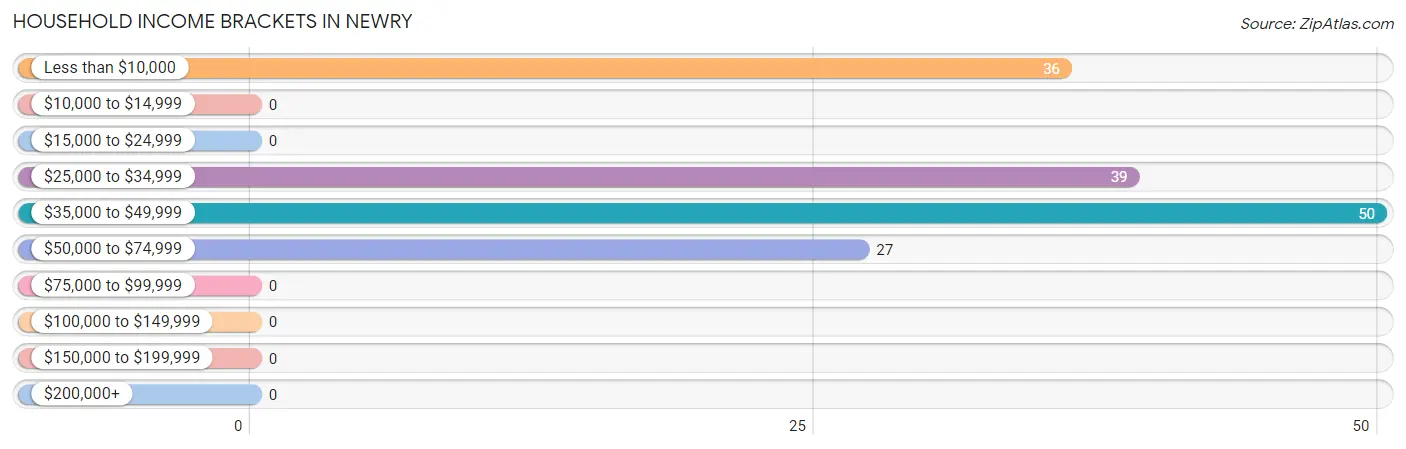
| Income Bracket | # Households | % Households |
| Less than $10,000 | 36 | 23.7% |
| $10,000 to $14,999 | 0 | 0.0% |
| $15,000 to $24,999 | 0 | 0.0% |
| $25,000 to $34,999 | 39 | 25.7% |
| $35,000 to $49,999 | 50 | 32.9% |
| $50,000 to $74,999 | 27 | 17.8% |
| $75,000 to $99,999 | 0 | 0.0% |
| $100,000 to $149,999 | 0 | 0.0% |
| $150,000 to $199,999 | 0 | 0.0% |
| $200,000+ | 0 | 0.0% |
Household Income by Householder Age in Newry
The median household income in Newry is $42,550, with the highest median household income of $42,775 found in the 65+ years age bracket for the primary householder. A total of 89 households (58.6%) fall into this category.
| Income Bracket | # Households | Median Income |
| 15 to 24 Years | 0 (0.0%) | $0 |
| 25 to 44 Years | 10 (6.6%) | $0 |
| 45 to 64 Years | 53 (34.9%) | $0 |
| 65+ Years | 89 (58.6%) | $42,775 |
| Total | 152 (100.0%) | $42,550 |
Poverty in Newry
Income Below Poverty by Sex and Age in Newry
With 25.5% poverty level for males and 24.8% for females among the residents of Newry, 45 to 54 year old males and 55 to 64 year old females are the most vulnerable to poverty, with 50 males (74.6%) and 36 females (100.0%) in their respective age groups living below the poverty level.
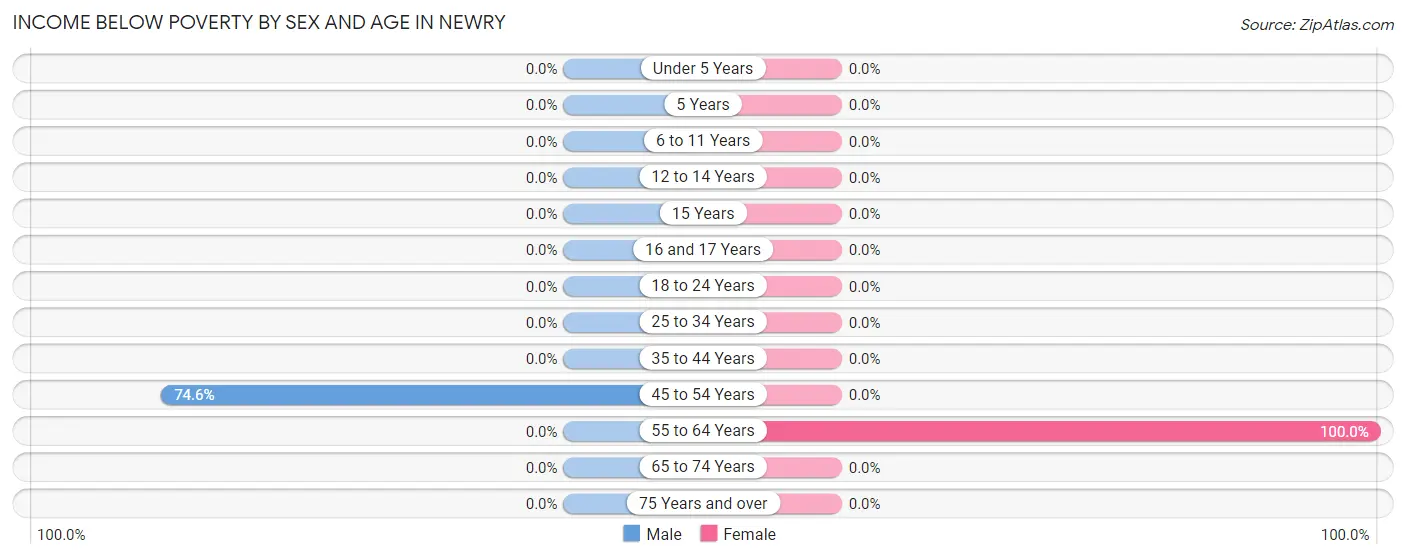
| Age Bracket | Male | Female |
| Under 5 Years | 0 (0.0%) | 0 (0.0%) |
| 5 Years | 0 (0.0%) | 0 (0.0%) |
| 6 to 11 Years | 0 (0.0%) | 0 (0.0%) |
| 12 to 14 Years | 0 (0.0%) | 0 (0.0%) |
| 15 Years | 0 (0.0%) | 0 (0.0%) |
| 16 and 17 Years | 0 (0.0%) | 0 (0.0%) |
| 18 to 24 Years | 0 (0.0%) | 0 (0.0%) |
| 25 to 34 Years | 0 (0.0%) | 0 (0.0%) |
| 35 to 44 Years | 0 (0.0%) | 0 (0.0%) |
| 45 to 54 Years | 50 (74.6%) | 0 (0.0%) |
| 55 to 64 Years | 0 (0.0%) | 36 (100.0%) |
| 65 to 74 Years | 0 (0.0%) | 0 (0.0%) |
| 75 Years and over | 0 (0.0%) | 0 (0.0%) |
| Total | 50 (25.5%) | 36 (24.8%) |
Income Above Poverty by Sex and Age in Newry
According to the poverty statistics in Newry, males aged 6 to 11 years and females aged 12 to 14 years are the age groups that are most secure financially, with 100.0% of males and 100.0% of females in these age groups living above the poverty line.
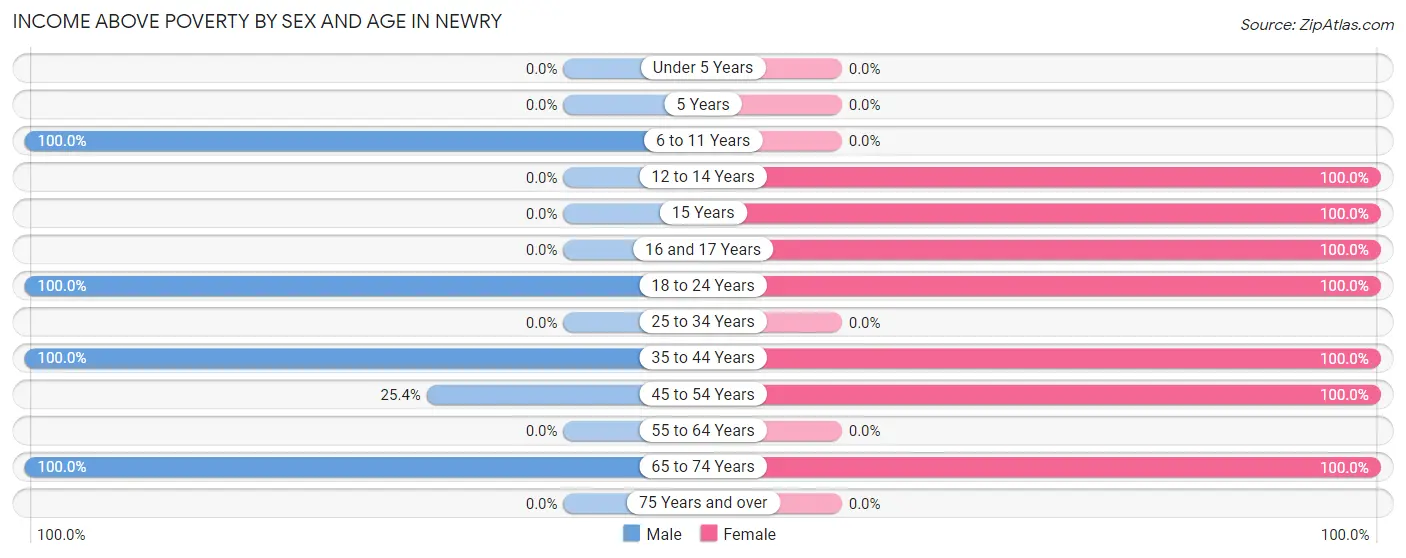
| Age Bracket | Male | Female |
| Under 5 Years | 0 (0.0%) | 0 (0.0%) |
| 5 Years | 0 (0.0%) | 0 (0.0%) |
| 6 to 11 Years | 9 (100.0%) | 0 (0.0%) |
| 12 to 14 Years | 0 (0.0%) | 10 (100.0%) |
| 15 Years | 0 (0.0%) | 10 (100.0%) |
| 16 and 17 Years | 0 (0.0%) | 9 (100.0%) |
| 18 to 24 Years | 21 (100.0%) | 5 (100.0%) |
| 25 to 34 Years | 0 (0.0%) | 0 (0.0%) |
| 35 to 44 Years | 10 (100.0%) | 10 (100.0%) |
| 45 to 54 Years | 17 (25.4%) | 19 (100.0%) |
| 55 to 64 Years | 0 (0.0%) | 0 (0.0%) |
| 65 to 74 Years | 89 (100.0%) | 46 (100.0%) |
| 75 Years and over | 0 (0.0%) | 0 (0.0%) |
| Total | 146 (74.5%) | 109 (75.2%) |
Income Below Poverty Among Married-Couple Families in Newry
The poverty statistics for married-couple families in Newry show that 34.6% or 36 of the total 104 families live below the poverty line. Families with no children have the highest poverty rate of 38.3%, comprising of 36 families. On the other hand, families with 3 or 4 children have the lowest poverty rate of 0.0%, which includes 0 families.
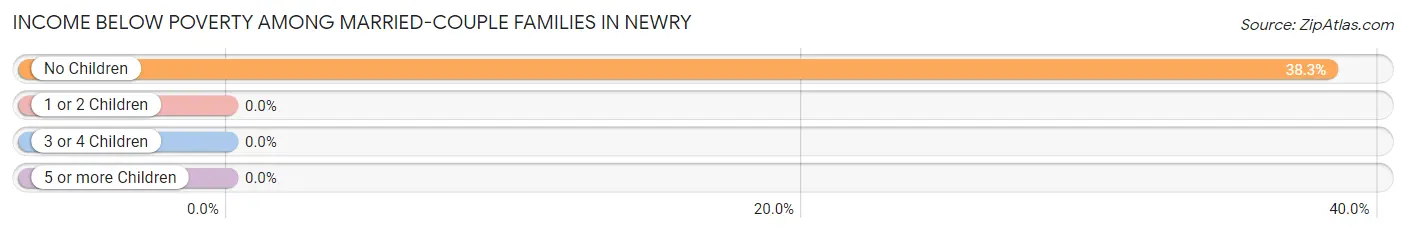
| Children | Above Poverty | Below Poverty |
| No Children | 58 (61.7%) | 36 (38.3%) |
| 1 or 2 Children | 0 (0.0%) | 0 (0.0%) |
| 3 or 4 Children | 10 (100.0%) | 0 (0.0%) |
| 5 or more Children | 0 (0.0%) | 0 (0.0%) |
| Total | 68 (65.4%) | 36 (34.6%) |
Income Below Poverty Among Single-Parent Households in Newry
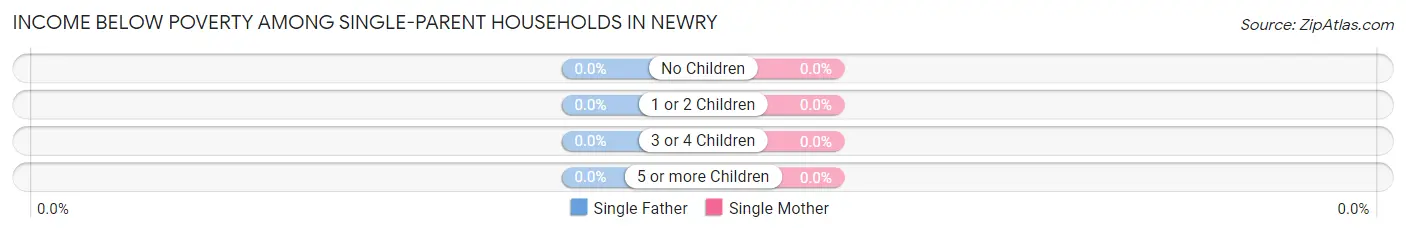
| Children | Single Father | Single Mother |
| No Children | 0 (0.0%) | 0 (0.0%) |
| 1 or 2 Children | 0 (0.0%) | 0 (0.0%) |
| 3 or 4 Children | 0 (0.0%) | 0 (0.0%) |
| 5 or more Children | 0 (0.0%) | 0 (0.0%) |
| Total | 0 (0.0%) | 0 (0.0%) |
Income Below Poverty Among Married-Couple vs Single-Parent Households in Newry
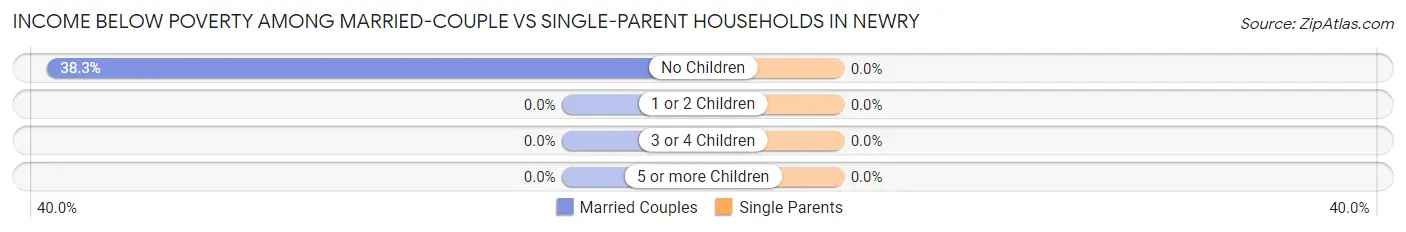
| Children | Married-Couple Families | Single-Parent Households |
| No Children | 36 (38.3%) | 0 (0.0%) |
| 1 or 2 Children | 0 (0.0%) | 0 (0.0%) |
| 3 or 4 Children | 0 (0.0%) | 0 (0.0%) |
| 5 or more Children | 0 (0.0%) | 0 (0.0%) |
| Total | 36 (34.6%) | 0 (0.0%) |
Race in Newry
The most populous races in Newry are White / Caucasian (216 | 63.3%), Some other Race (125 | 36.7%), and Hispanic or Latino (86 | 25.2%).
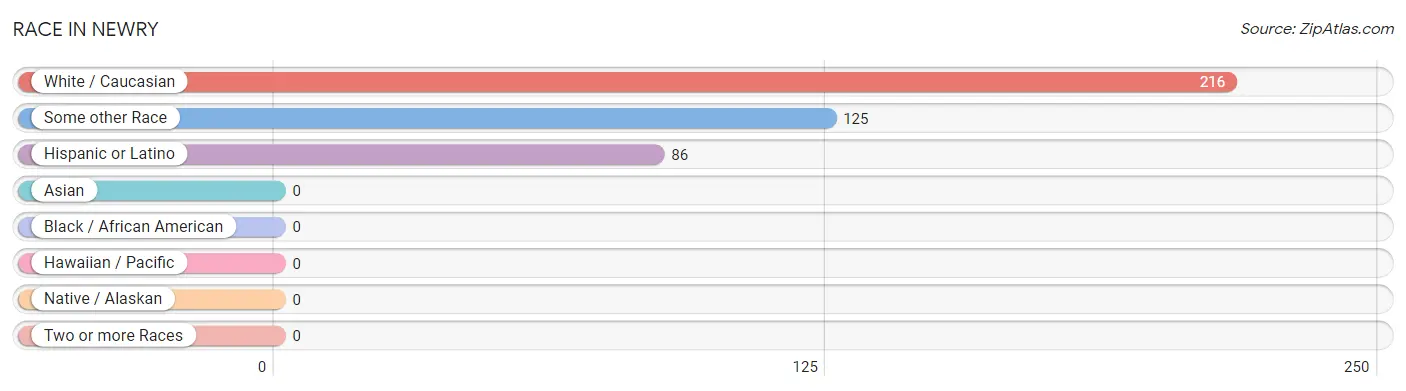
| Race | # Population | % Population |
| Asian | 0 | 0.0% |
| Black / African American | 0 | 0.0% |
| Hawaiian / Pacific | 0 | 0.0% |
| Hispanic or Latino | 86 | 25.2% |
| Native / Alaskan | 0 | 0.0% |
| White / Caucasian | 216 | 63.3% |
| Two or more Races | 0 | 0.0% |
| Some other Race | 125 | 36.7% |
| Total | 341 | 100.0% |
Ancestry in Newry
The most populous ancestries reported in Newry are Mexican (50 | 14.7%), American (45 | 13.2%), German (41 | 12.0%), and Dominican (36 | 10.6%), together accounting for 50.4% of all Newry residents.
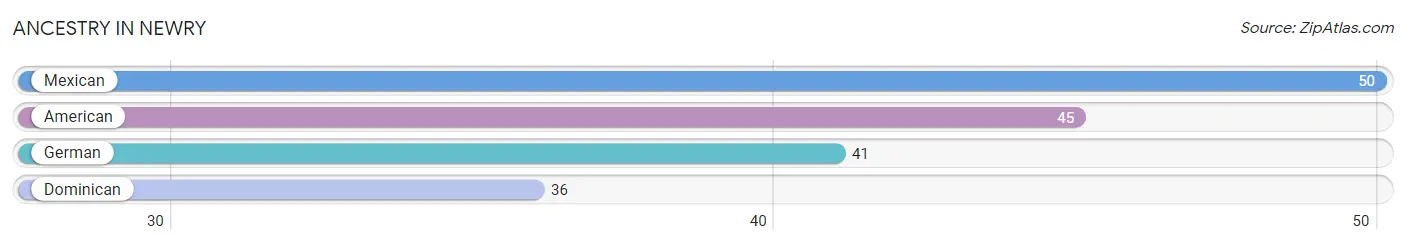
| Ancestry | # Population | % Population |
| American | 45 | 13.2% |
| Dominican | 36 | 10.6% |
| German | 41 | 12.0% |
| Mexican | 50 | 14.7% | View All 4 Rows |
Immigrants in Newry
The most numerous immigrant groups reported in Newry came from Latin America (86 | 25.2%), Central America (50 | 14.7%), Mexico (50 | 14.7%), Caribbean (36 | 10.6%), and Dominican Republic (36 | 10.6%), together accounting for 75.7% of all Newry residents.
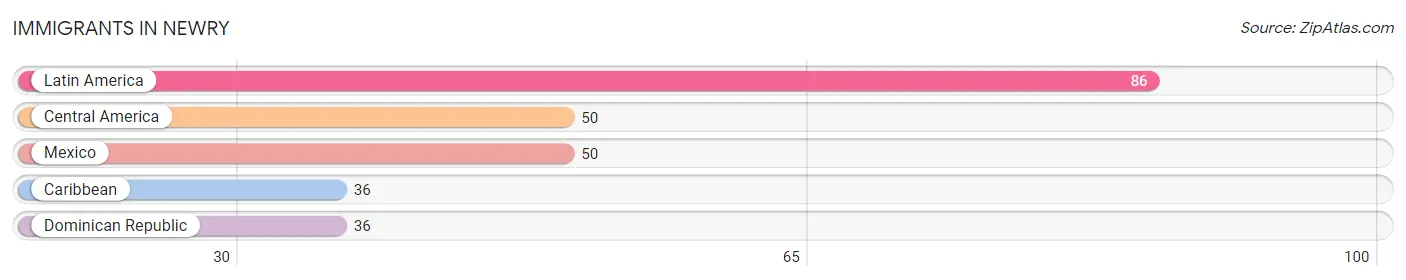
| Immigration Origin | # Population | % Population |
| Caribbean | 36 | 10.6% |
| Central America | 50 | 14.7% |
| Dominican Republic | 36 | 10.6% |
| Latin America | 86 | 25.2% |
| Mexico | 50 | 14.7% | View All 5 Rows |
Sex and Age in Newry
Sex and Age in Newry
The most populous age groups in Newry are 50 to 54 Years (67 | 34.2%) for men and 70 to 74 Years (46 | 31.7%) for women.
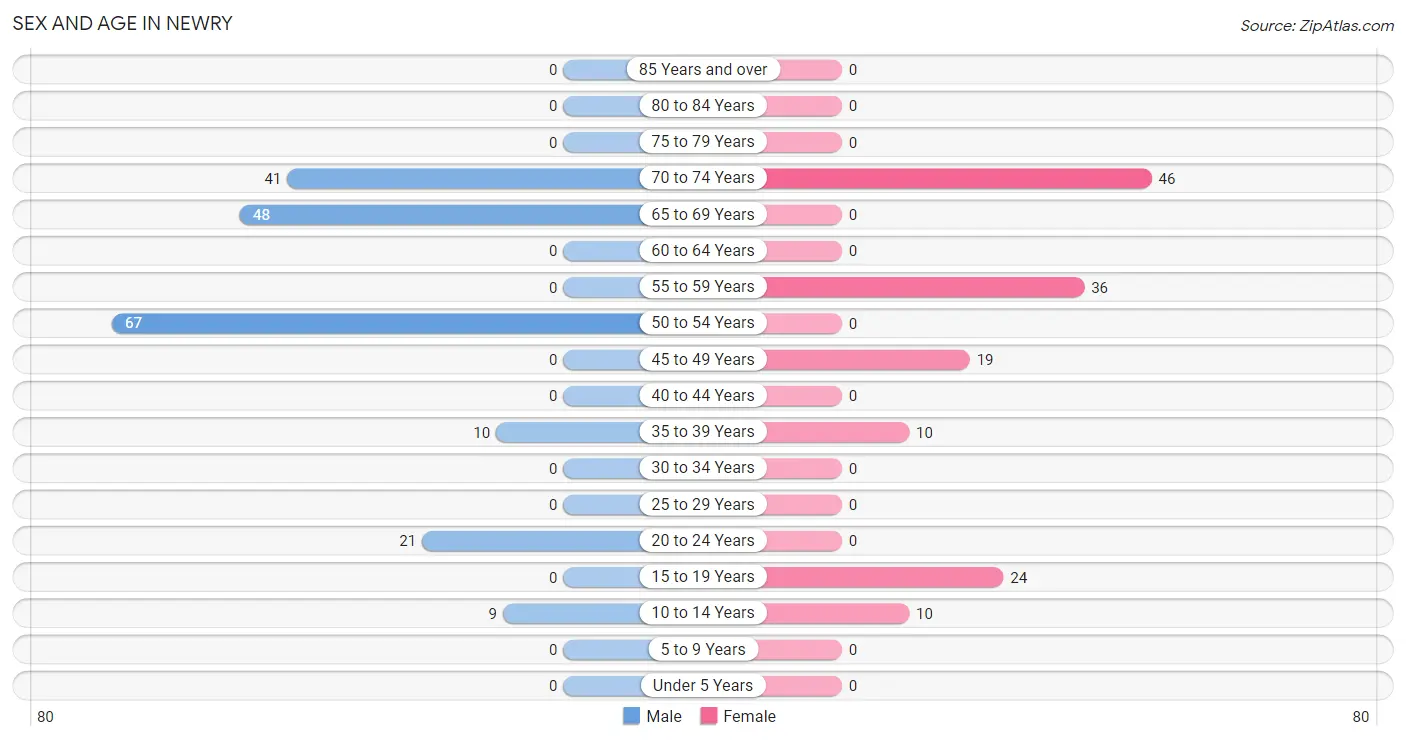
| Age Bracket | Male | Female |
| Under 5 Years | 0 (0.0%) | 0 (0.0%) |
| 5 to 9 Years | 0 (0.0%) | 0 (0.0%) |
| 10 to 14 Years | 9 (4.6%) | 10 (6.9%) |
| 15 to 19 Years | 0 (0.0%) | 24 (16.6%) |
| 20 to 24 Years | 21 (10.7%) | 0 (0.0%) |
| 25 to 29 Years | 0 (0.0%) | 0 (0.0%) |
| 30 to 34 Years | 0 (0.0%) | 0 (0.0%) |
| 35 to 39 Years | 10 (5.1%) | 10 (6.9%) |
| 40 to 44 Years | 0 (0.0%) | 0 (0.0%) |
| 45 to 49 Years | 0 (0.0%) | 19 (13.1%) |
| 50 to 54 Years | 67 (34.2%) | 0 (0.0%) |
| 55 to 59 Years | 0 (0.0%) | 36 (24.8%) |
| 60 to 64 Years | 0 (0.0%) | 0 (0.0%) |
| 65 to 69 Years | 48 (24.5%) | 0 (0.0%) |
| 70 to 74 Years | 41 (20.9%) | 46 (31.7%) |
| 75 to 79 Years | 0 (0.0%) | 0 (0.0%) |
| 80 to 84 Years | 0 (0.0%) | 0 (0.0%) |
| 85 Years and over | 0 (0.0%) | 0 (0.0%) |
| Total | 196 (100.0%) | 145 (100.0%) |
Families and Households in Newry
Median Family Size in Newry
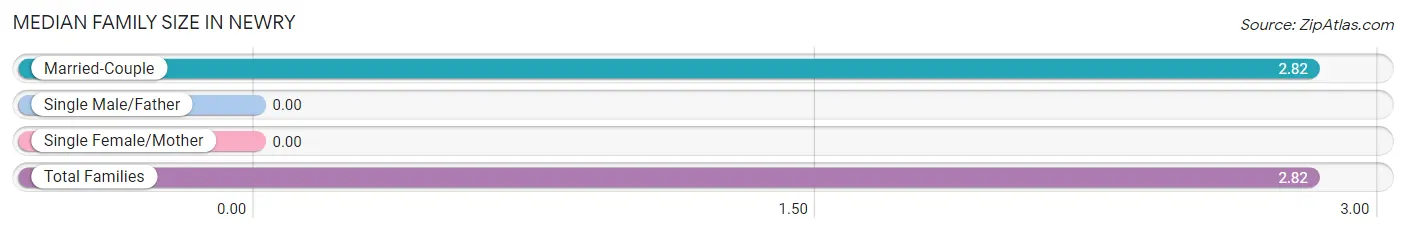
| Family Type | # Families | Family Size |
| Married-Couple | 104 (100.0%) | 2.82 |
| Single Male/Father | 0 (0.0%) | - |
| Single Female/Mother | 0 (0.0%) | - |
| Total Families | 104 (100.0%) | 2.82 |
Median Household Size in Newry
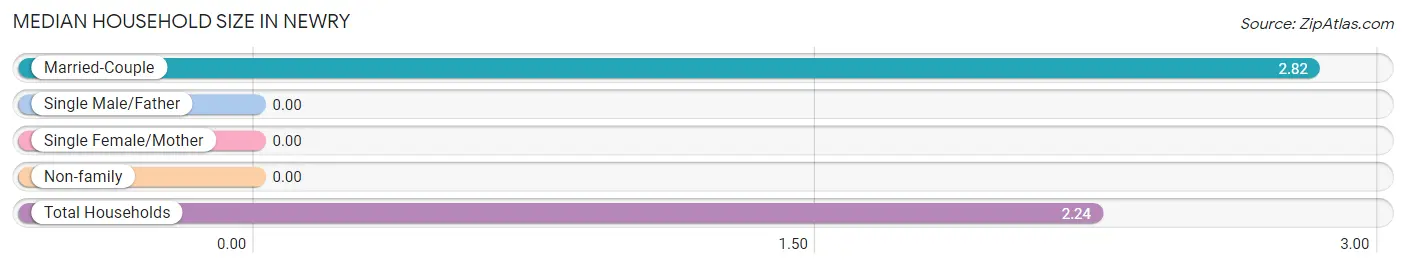
| Household Type | # Households | Household Size |
| Married-Couple | 104 (68.4%) | 2.82 |
| Single Male/Father | 0 (0.0%) | - |
| Single Female/Mother | 0 (0.0%) | - |
| Non-family | 48 (31.6%) | - |
| Total Households | 152 (100.0%) | 2.24 |
Household Size by Marriage Status in Newry
Out of a total of 152 households in Newry, 104 (68.4%) are family households, while 48 (31.6%) are nonfamily households. The most numerous type of family households are 2-person households, comprising 77, and the most common type of nonfamily households are 1-person households, comprising 48.
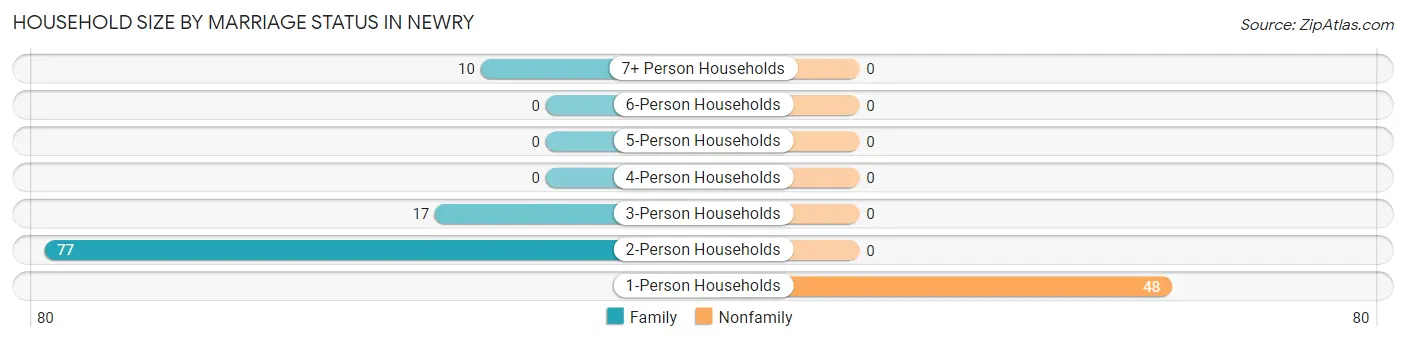
| Household Size | Family Households | Nonfamily Households |
| 1-Person Households | - | 48 (31.6%) |
| 2-Person Households | 77 (50.7%) | 0 (0.0%) |
| 3-Person Households | 17 (11.2%) | 0 (0.0%) |
| 4-Person Households | 0 (0.0%) | 0 (0.0%) |
| 5-Person Households | 0 (0.0%) | 0 (0.0%) |
| 6-Person Households | 0 (0.0%) | 0 (0.0%) |
| 7+ Person Households | 10 (6.6%) | 0 (0.0%) |
| Total | 104 (68.4%) | 48 (31.6%) |
Female Fertility in Newry
Fertility by Age in Newry
| Age Bracket | Women with Births | Births / 1,000 Women |
| 15 to 19 years | 0 (0.0%) | 0.0 |
| 20 to 34 years | 0 (0.0%) | 0.0 |
| 35 to 50 years | 0 (0.0%) | 0.0 |
| Total | 0 (0.0%) | 0.0 |
Fertility by Age by Marriage Status in Newry
| Age Bracket | Married | Unmarried |
| 15 to 19 years | 0 (0.0%) | 0 (0.0%) |
| 20 to 34 years | 0 (0.0%) | 0 (0.0%) |
| 35 to 50 years | 0 (0.0%) | 0 (0.0%) |
| Total | 0 (0.0%) | 0 (0.0%) |
Fertility by Education in Newry
| Educational Attainment | Women with Births | Births / 1,000 Women |
| Less than High School | 0 (0.0%) | 0.0 |
| High School Diploma | 0 (0.0%) | 0.0 |
| College or Associate's Degree | 0 (0.0%) | 0.0 |
| Bachelor's Degree | 0 (0.0%) | 0.0 |
| Graduate Degree | 0 (0.0%) | 0.0 |
| Total | 0 (0.0%) | 0.0 |
Fertility by Education by Marriage Status in Newry
| Educational Attainment | Married | Unmarried |
| Less than High School | 0 (0.0%) | 0 (0.0%) |
| High School Diploma | 0 (0.0%) | 0 (0.0%) |
| College or Associate's Degree | 0 (0.0%) | 0 (0.0%) |
| Bachelor's Degree | 0 (0.0%) | 0 (0.0%) |
| Graduate Degree | 0 (0.0%) | 0 (0.0%) |
| Total | 0 (0.0%) | 0 (0.0%) |
Employment Characteristics in Newry
Employment by Class of Employer in Newry
Among the 32 employed individuals in Newry, , and private company employees (32 | 100.0%) make up the most common classes of employment.
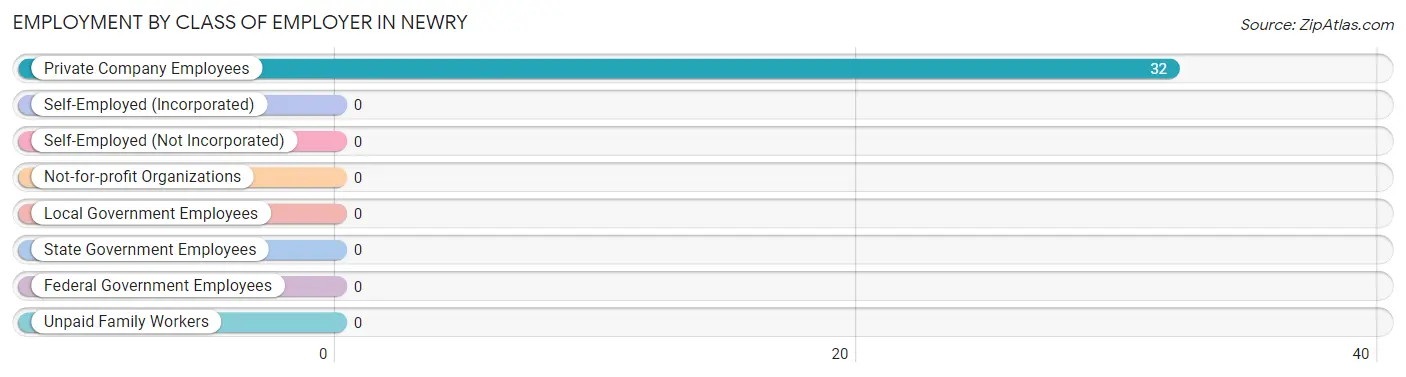
| Employer Class | # Employees | % Employees |
| Private Company Employees | 32 | 100.0% |
| Self-Employed (Incorporated) | 0 | 0.0% |
| Self-Employed (Not Incorporated) | 0 | 0.0% |
| Not-for-profit Organizations | 0 | 0.0% |
| Local Government Employees | 0 | 0.0% |
| State Government Employees | 0 | 0.0% |
| Federal Government Employees | 0 | 0.0% |
| Unpaid Family Workers | 0 | 0.0% |
| Total | 32 | 100.0% |
Employment Status by Age in Newry
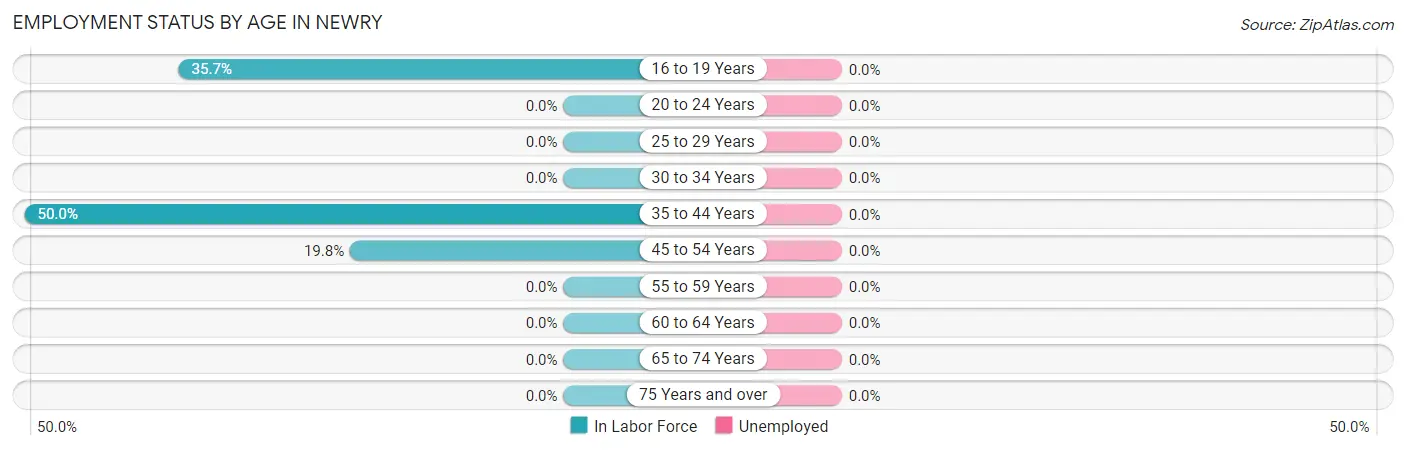
| Age Bracket | In Labor Force | Unemployed |
| 16 to 19 Years | 5 (35.7%) | 0 (0.0%) |
| 20 to 24 Years | 0 (0.0%) | 0 (0.0%) |
| 25 to 29 Years | 0 (0.0%) | 0 (0.0%) |
| 30 to 34 Years | 0 (0.0%) | 0 (0.0%) |
| 35 to 44 Years | 10 (50.0%) | 0 (0.0%) |
| 45 to 54 Years | 17 (19.8%) | 0 (0.0%) |
| 55 to 59 Years | 0 (0.0%) | 0 (0.0%) |
| 60 to 64 Years | 0 (0.0%) | 0 (0.0%) |
| 65 to 74 Years | 0 (0.0%) | 0 (0.0%) |
| 75 Years and over | 0 (0.0%) | 0 (0.0%) |
| Total | 32 (10.3%) | 0 (0.0%) |
Employment Status by Educational Attainment in Newry
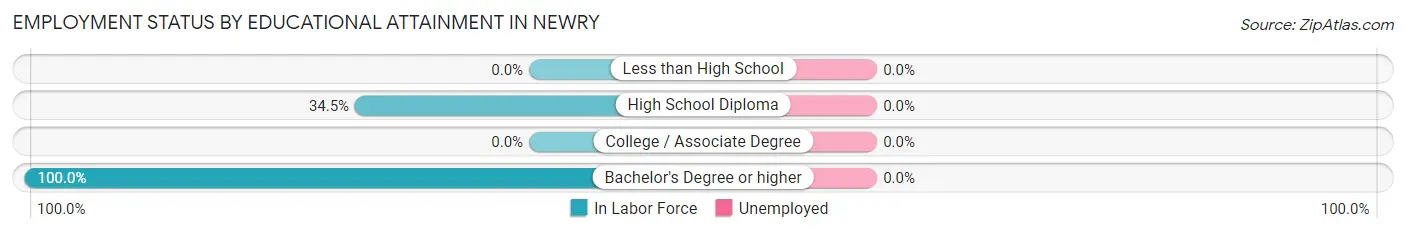
| Educational Attainment | In Labor Force | Unemployed |
| Less than High School | 0 (0.0%) | 0 (0.0%) |
| High School Diploma | 10 (34.5%) | 0 (0.0%) |
| College / Associate Degree | 0 (0.0%) | 0 (0.0%) |
| Bachelor's Degree or higher | 17 (100.0%) | 0 (0.0%) |
| Total | 27 (19.0%) | 0 (0.0%) |
Employment Occupations by Sex in Newry
Management, Business, Science and Arts Occupations
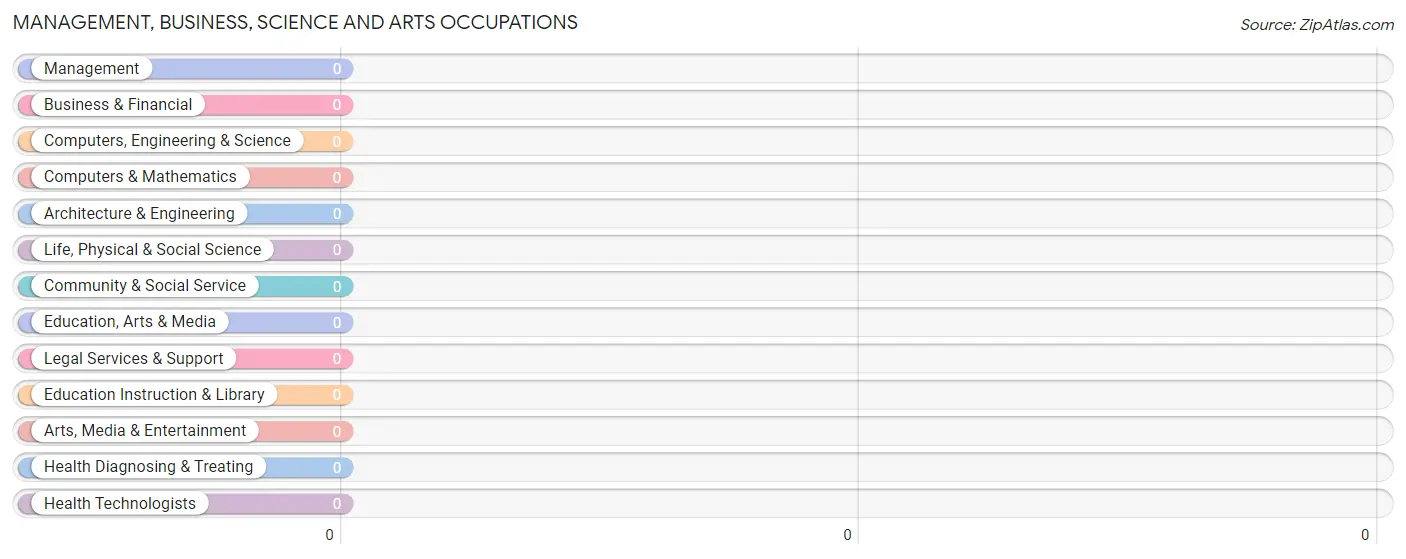
Management, Business, Science and Arts Occupations by Sex
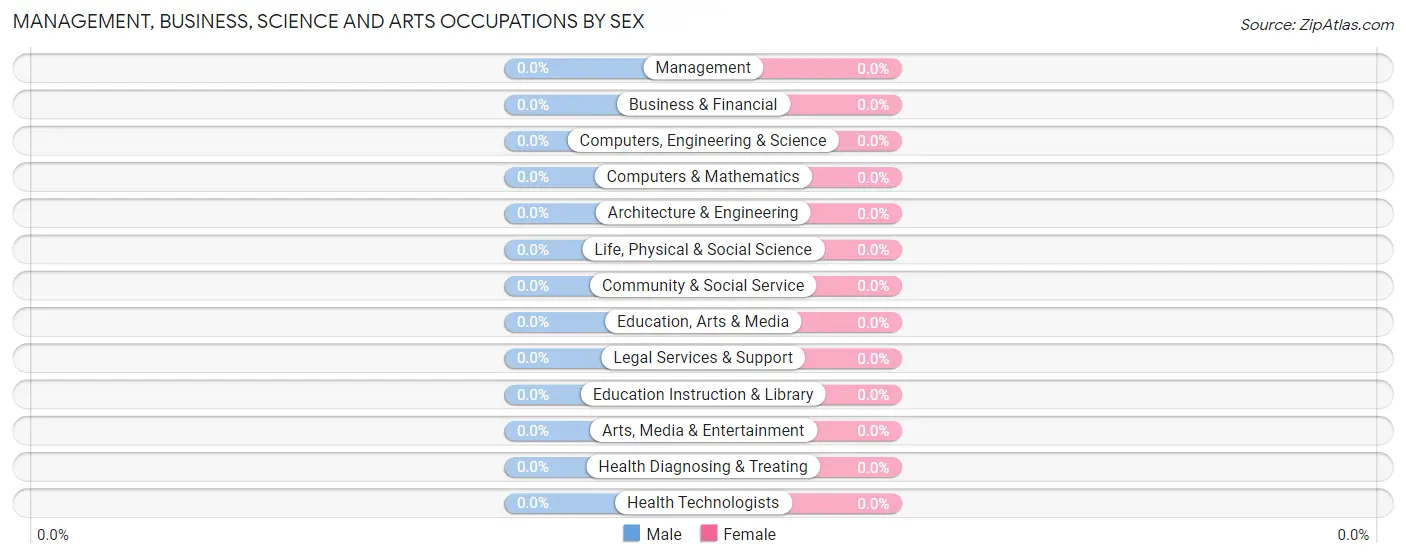
| Occupation | Male | Female |
| Management | 0 (0.0%) | 0 (0.0%) |
| Business & Financial | 0 (0.0%) | 0 (0.0%) |
| Computers, Engineering & Science | 0 (0.0%) | 0 (0.0%) |
| Computers & Mathematics | 0 (0.0%) | 0 (0.0%) |
| Architecture & Engineering | 0 (0.0%) | 0 (0.0%) |
| Life, Physical & Social Science | 0 (0.0%) | 0 (0.0%) |
| Community & Social Service | 0 (0.0%) | 0 (0.0%) |
| Education, Arts & Media | 0 (0.0%) | 0 (0.0%) |
| Legal Services & Support | 0 (0.0%) | 0 (0.0%) |
| Education Instruction & Library | 0 (0.0%) | 0 (0.0%) |
| Arts, Media & Entertainment | 0 (0.0%) | 0 (0.0%) |
| Health Diagnosing & Treating | 0 (0.0%) | 0 (0.0%) |
| Health Technologists | 0 (0.0%) | 0 (0.0%) |
| Total (Category) | 0 (0.0%) | 0 (0.0%) |
| Total (Overall) | 27 (84.4%) | 5 (15.6%) |
Services Occupations
The most common Services occupations in Newry are , and Cleaning & Maintenance (10 | 31.2%).
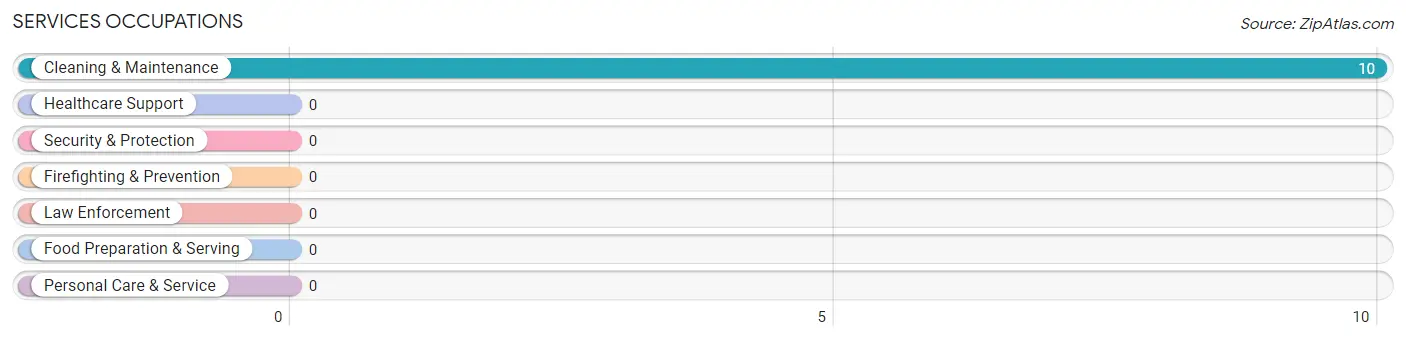
Services Occupations by Sex
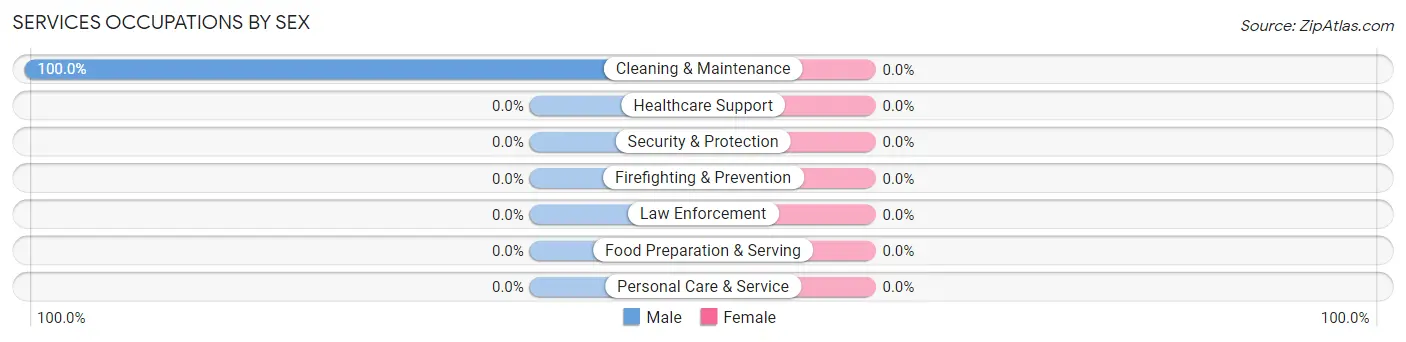
| Occupation | Male | Female |
| Healthcare Support | 0 (0.0%) | 0 (0.0%) |
| Security & Protection | 0 (0.0%) | 0 (0.0%) |
| Firefighting & Prevention | 0 (0.0%) | 0 (0.0%) |
| Law Enforcement | 0 (0.0%) | 0 (0.0%) |
| Food Preparation & Serving | 0 (0.0%) | 0 (0.0%) |
| Cleaning & Maintenance | 10 (100.0%) | 0 (0.0%) |
| Personal Care & Service | 0 (0.0%) | 0 (0.0%) |
| Total (Category) | 10 (100.0%) | 0 (0.0%) |
| Total (Overall) | 27 (84.4%) | 5 (15.6%) |
Sales and Office Occupations
The most common Sales and Office occupations in Newry are , and Office & Administration (5 | 15.6%).
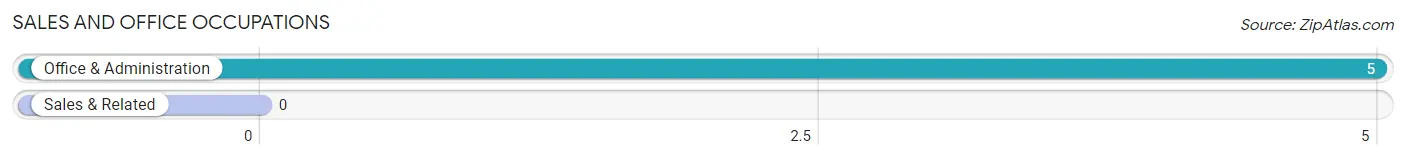
Sales and Office Occupations by Sex
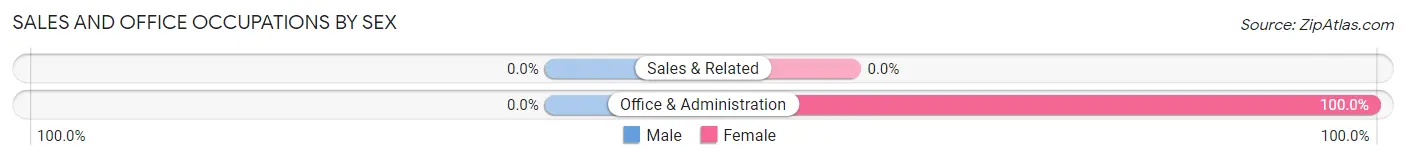
| Occupation | Male | Female |
| Sales & Related | 0 (0.0%) | 0 (0.0%) |
| Office & Administration | 0 (0.0%) | 5 (100.0%) |
| Total (Category) | 0 (0.0%) | 5 (100.0%) |
| Total (Overall) | 27 (84.4%) | 5 (15.6%) |
Natural Resources, Construction and Maintenance Occupations
The most common Natural Resources, Construction and Maintenance occupations in Newry are , and Construction & Extraction (17 | 53.1%).
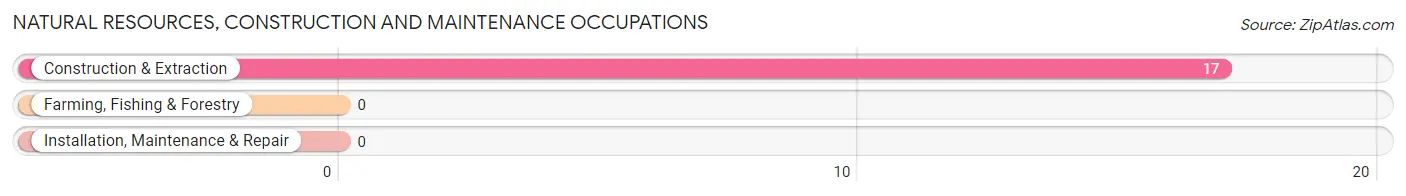
Natural Resources, Construction and Maintenance Occupations by Sex
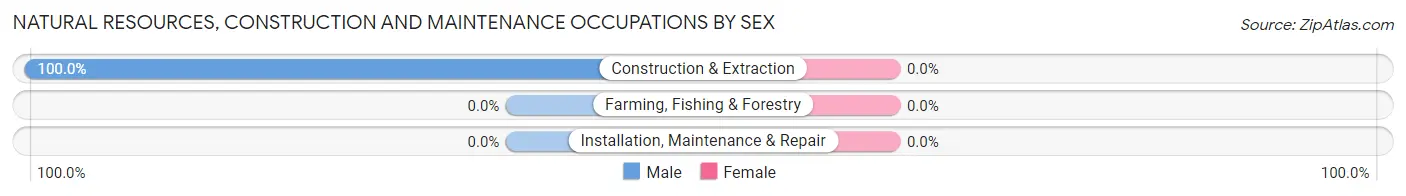
| Occupation | Male | Female |
| Farming, Fishing & Forestry | 0 (0.0%) | 0 (0.0%) |
| Construction & Extraction | 17 (100.0%) | 0 (0.0%) |
| Installation, Maintenance & Repair | 0 (0.0%) | 0 (0.0%) |
| Total (Category) | 17 (100.0%) | 0 (0.0%) |
| Total (Overall) | 27 (84.4%) | 5 (15.6%) |
Production, Transportation and Moving Occupations
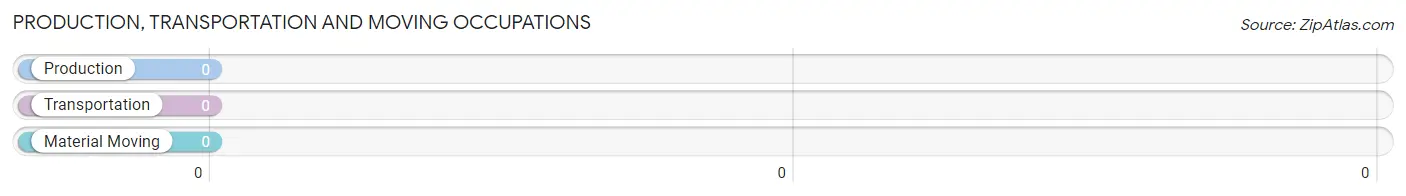
Production, Transportation and Moving Occupations by Sex
| Occupation | Male | Female |
| Production | 0 (0.0%) | 0 (0.0%) |
| Transportation | 0 (0.0%) | 0 (0.0%) |
| Material Moving | 0 (0.0%) | 0 (0.0%) |
| Total (Category) | 0 (0.0%) | 0 (0.0%) |
| Total (Overall) | 27 (84.4%) | 5 (15.6%) |
Employment Industries by Sex in Newry
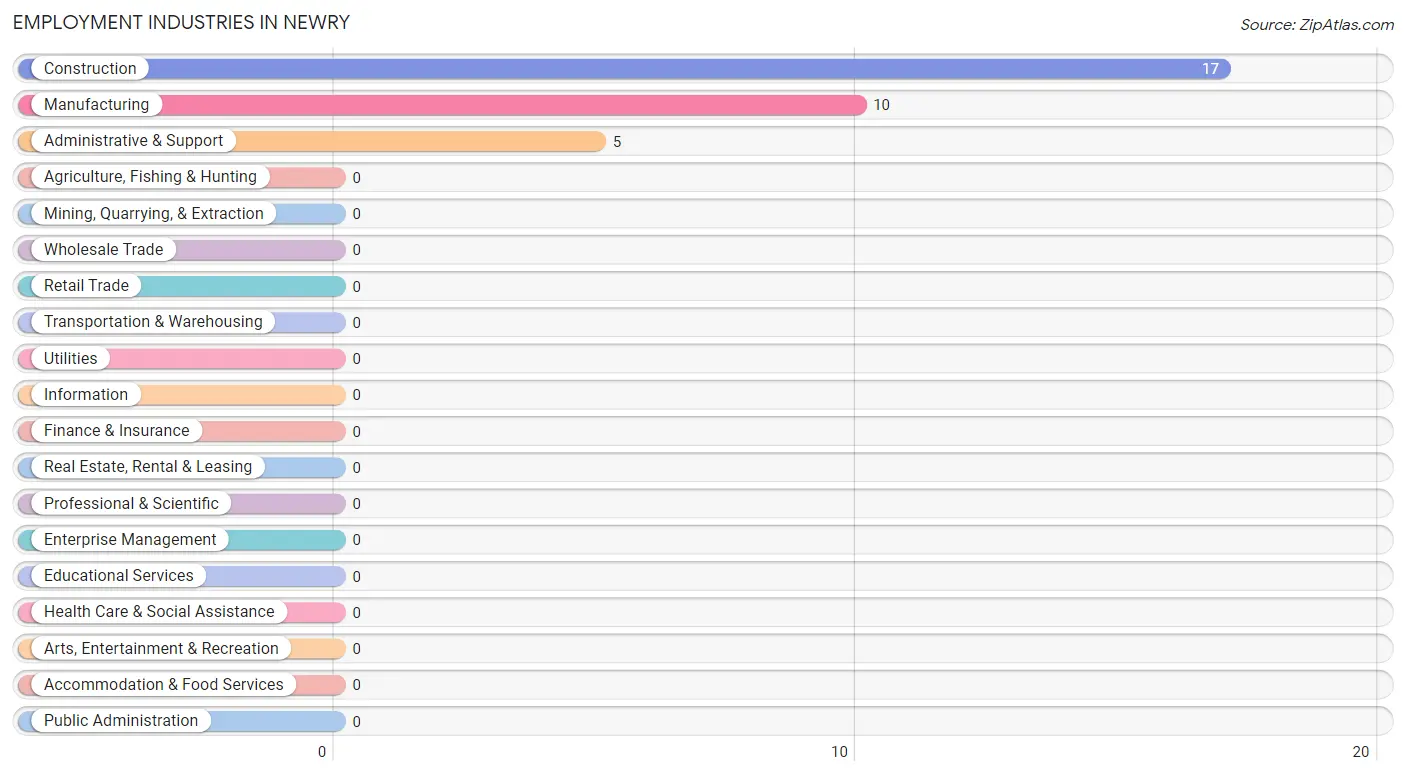
Employment Industries in Newry
The major employment industries in Newry include Construction (17 | 53.1%), Manufacturing (10 | 31.2%), and Administrative & Support (5 | 15.6%).
Employment Industries by Sex in Newry
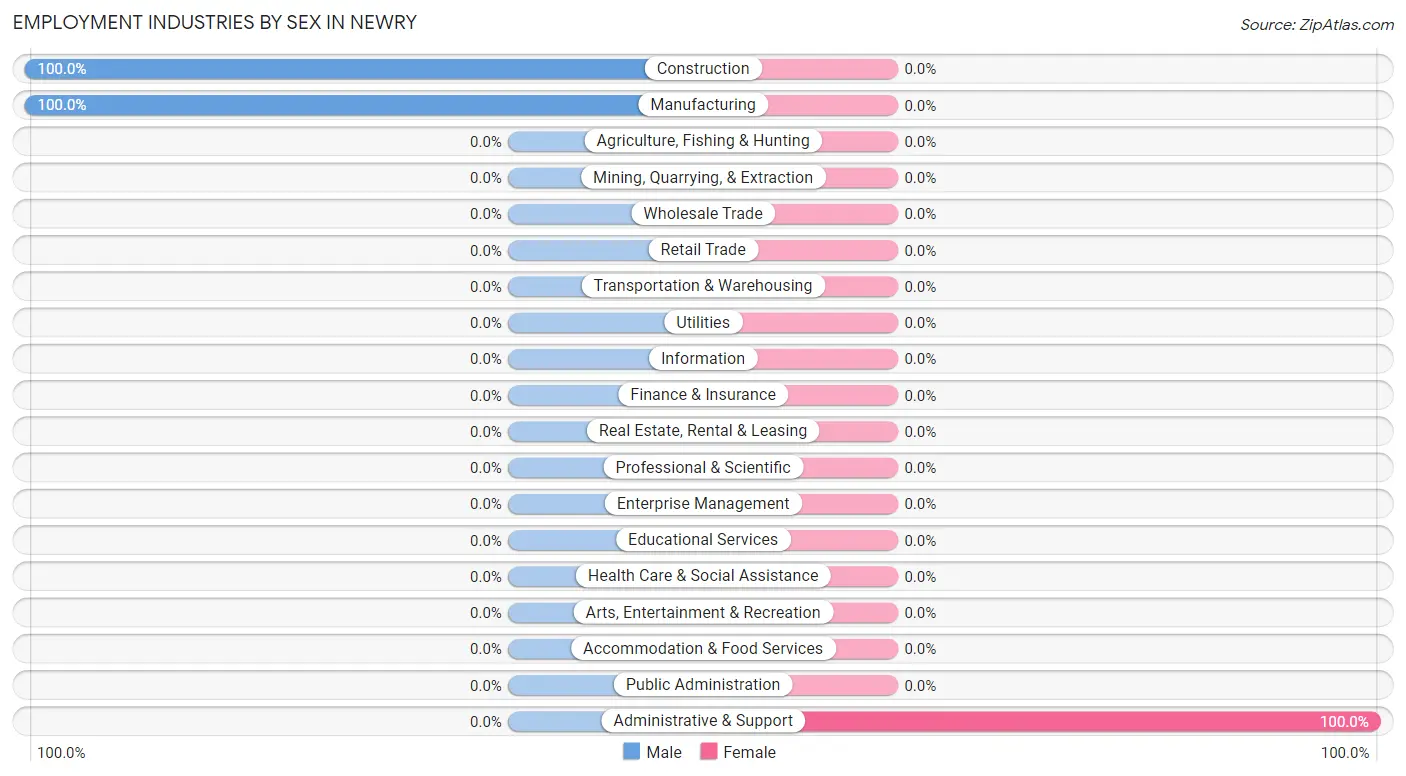
| Industry | Male | Female |
| Agriculture, Fishing & Hunting | 0 (0.0%) | 0 (0.0%) |
| Mining, Quarrying, & Extraction | 0 (0.0%) | 0 (0.0%) |
| Construction | 17 (100.0%) | 0 (0.0%) |
| Manufacturing | 10 (100.0%) | 0 (0.0%) |
| Wholesale Trade | 0 (0.0%) | 0 (0.0%) |
| Retail Trade | 0 (0.0%) | 0 (0.0%) |
| Transportation & Warehousing | 0 (0.0%) | 0 (0.0%) |
| Utilities | 0 (0.0%) | 0 (0.0%) |
| Information | 0 (0.0%) | 0 (0.0%) |
| Finance & Insurance | 0 (0.0%) | 0 (0.0%) |
| Real Estate, Rental & Leasing | 0 (0.0%) | 0 (0.0%) |
| Professional & Scientific | 0 (0.0%) | 0 (0.0%) |
| Enterprise Management | 0 (0.0%) | 0 (0.0%) |
| Administrative & Support | 0 (0.0%) | 5 (100.0%) |
| Educational Services | 0 (0.0%) | 0 (0.0%) |
| Health Care & Social Assistance | 0 (0.0%) | 0 (0.0%) |
| Arts, Entertainment & Recreation | 0 (0.0%) | 0 (0.0%) |
| Accommodation & Food Services | 0 (0.0%) | 0 (0.0%) |
| Public Administration | 0 (0.0%) | 0 (0.0%) |
| Total | 27 (84.4%) | 5 (15.6%) |
Education in Newry
School Enrollment in Newry
The most common levels of schooling among the 38 students in Newry are middle school (19 | 50.0%), and high school (19 | 50.0%).
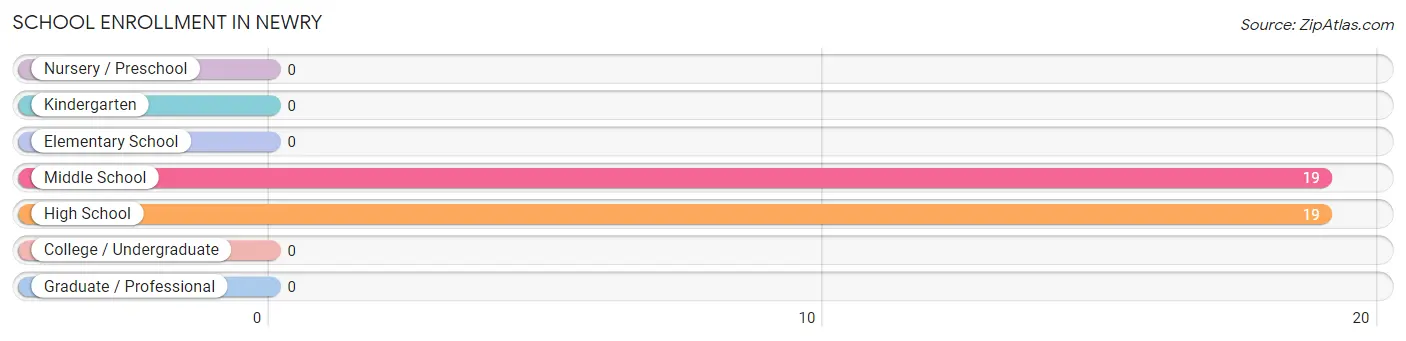
| School Level | # Students | % Students |
| Nursery / Preschool | 0 | 0.0% |
| Kindergarten | 0 | 0.0% |
| Elementary School | 0 | 0.0% |
| Middle School | 19 | 50.0% |
| High School | 19 | 50.0% |
| College / Undergraduate | 0 | 0.0% |
| Graduate / Professional | 0 | 0.0% |
| Total | 38 | 100.0% |
School Enrollment by Age by Funding Source in Newry
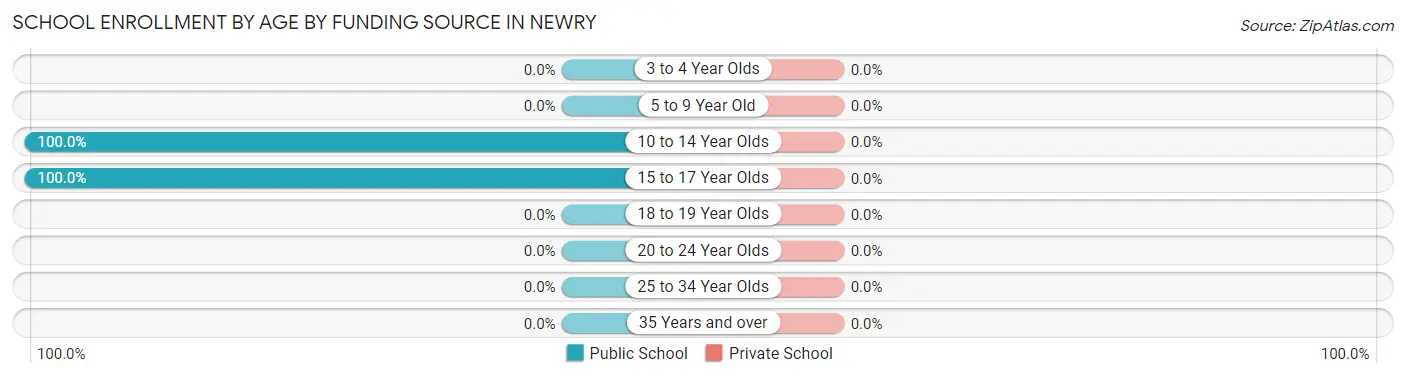
| Age Bracket | Public School | Private School |
| 3 to 4 Year Olds | 0 (0.0%) | 0 (0.0%) |
| 5 to 9 Year Old | 0 (0.0%) | 0 (0.0%) |
| 10 to 14 Year Olds | 19 (100.0%) | 0 (0.0%) |
| 15 to 17 Year Olds | 19 (100.0%) | 0 (0.0%) |
| 18 to 19 Year Olds | 0 (0.0%) | 0 (0.0%) |
| 20 to 24 Year Olds | 0 (0.0%) | 0 (0.0%) |
| 25 to 34 Year Olds | 0 (0.0%) | 0 (0.0%) |
| 35 Years and over | 0 (0.0%) | 0 (0.0%) |
| Total | 38 (100.0%) | 0 (0.0%) |
Educational Attainment by Field of Study in Newry
Education (39 | 69.6%), and engineering (17 | 30.4%) are the most common fields of study among 56 individuals in Newry who have obtained a bachelor's degree or higher.
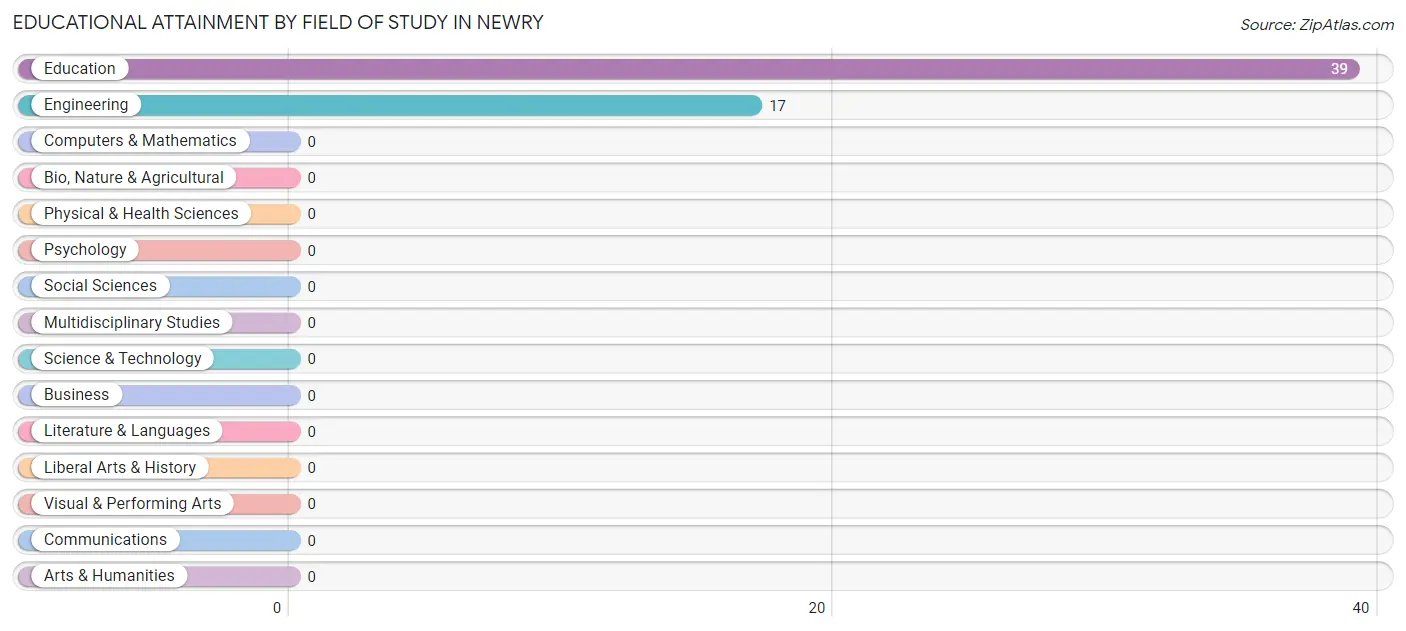
| Field of Study | # Graduates | % Graduates |
| Computers & Mathematics | 0 | 0.0% |
| Bio, Nature & Agricultural | 0 | 0.0% |
| Physical & Health Sciences | 0 | 0.0% |
| Psychology | 0 | 0.0% |
| Social Sciences | 0 | 0.0% |
| Engineering | 17 | 30.4% |
| Multidisciplinary Studies | 0 | 0.0% |
| Science & Technology | 0 | 0.0% |
| Business | 0 | 0.0% |
| Education | 39 | 69.6% |
| Literature & Languages | 0 | 0.0% |
| Liberal Arts & History | 0 | 0.0% |
| Visual & Performing Arts | 0 | 0.0% |
| Communications | 0 | 0.0% |
| Arts & Humanities | 0 | 0.0% |
| Total | 56 | 100.0% |
Transportation & Commute in Newry
Vehicle Availability by Sex in Newry
The most prevalent vehicle ownership categories in Newry are males with 3 vehicles (17, accounting for 63.0%) and females with 3 vehicles (0, making up 340.0%).
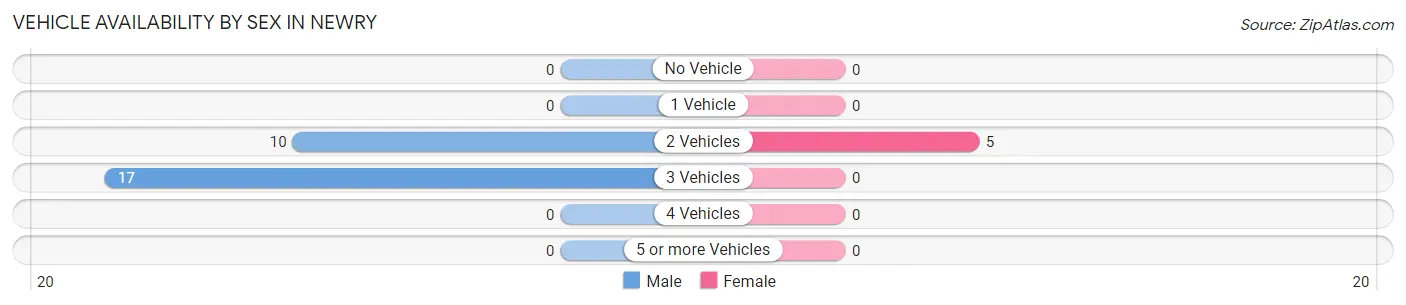
| Vehicles Available | Male | Female |
| No Vehicle | 0 (0.0%) | 0 (0.0%) |
| 1 Vehicle | 0 (0.0%) | 0 (0.0%) |
| 2 Vehicles | 10 (37.0%) | 5 (100.0%) |
| 3 Vehicles | 17 (63.0%) | 0 (0.0%) |
| 4 Vehicles | 0 (0.0%) | 0 (0.0%) |
| 5 or more Vehicles | 0 (0.0%) | 0 (0.0%) |
| Total | 27 (100.0%) | 5 (100.0%) |
Commute Time in Newry
The most frequently occuring commute durations in Newry are 20 to 24 minutes (17 commuters, 53.1%), 25 to 29 minutes (10 commuters, 31.2%), and 10 to 14 minutes (5 commuters, 15.6%).
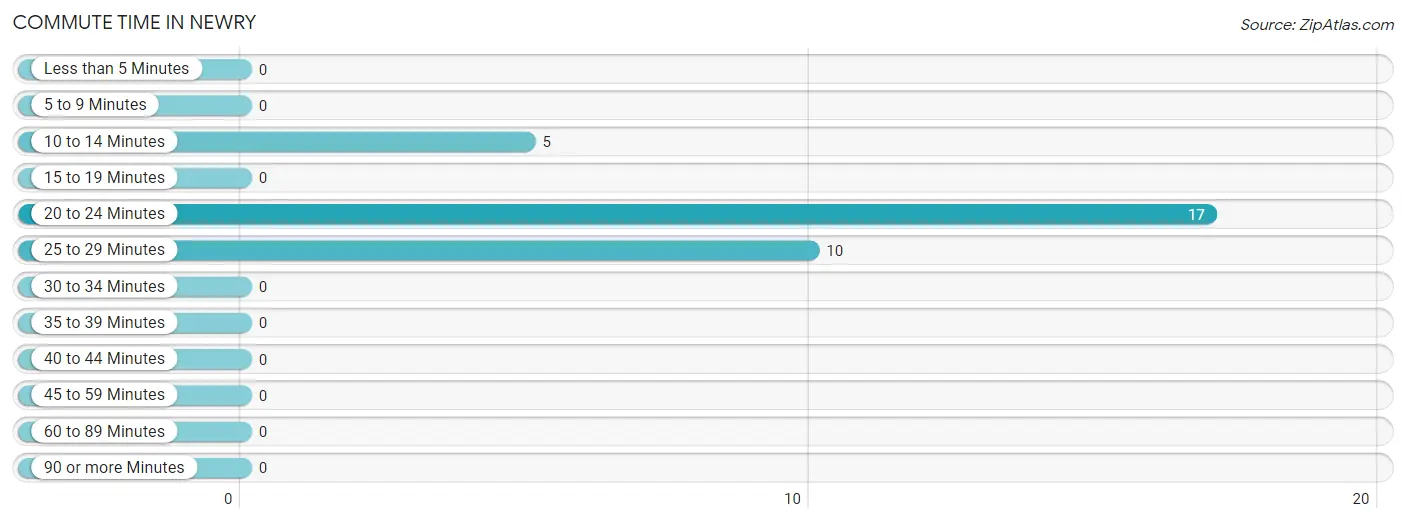
| Commute Time | # Commuters | % Commuters |
| Less than 5 Minutes | 0 | 0.0% |
| 5 to 9 Minutes | 0 | 0.0% |
| 10 to 14 Minutes | 5 | 15.6% |
| 15 to 19 Minutes | 0 | 0.0% |
| 20 to 24 Minutes | 17 | 53.1% |
| 25 to 29 Minutes | 10 | 31.2% |
| 30 to 34 Minutes | 0 | 0.0% |
| 35 to 39 Minutes | 0 | 0.0% |
| 40 to 44 Minutes | 0 | 0.0% |
| 45 to 59 Minutes | 0 | 0.0% |
| 60 to 89 Minutes | 0 | 0.0% |
| 90 or more Minutes | 0 | 0.0% |
Commute Time by Sex in Newry
The most common commute times in Newry are 20 to 24 minutes (17 commuters, 63.0%) for males and 10 to 14 minutes (5 commuters, 100.0%) for females.
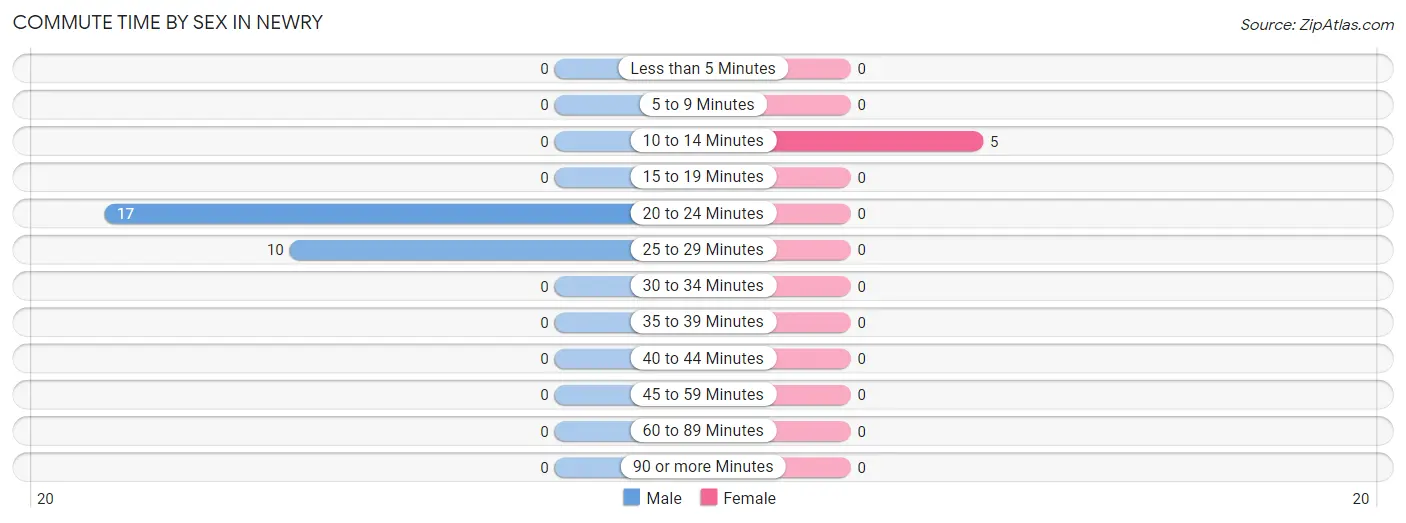
| Commute Time | Male | Female |
| Less than 5 Minutes | 0 (0.0%) | 0 (0.0%) |
| 5 to 9 Minutes | 0 (0.0%) | 0 (0.0%) |
| 10 to 14 Minutes | 0 (0.0%) | 5 (100.0%) |
| 15 to 19 Minutes | 0 (0.0%) | 0 (0.0%) |
| 20 to 24 Minutes | 17 (63.0%) | 0 (0.0%) |
| 25 to 29 Minutes | 10 (37.0%) | 0 (0.0%) |
| 30 to 34 Minutes | 0 (0.0%) | 0 (0.0%) |
| 35 to 39 Minutes | 0 (0.0%) | 0 (0.0%) |
| 40 to 44 Minutes | 0 (0.0%) | 0 (0.0%) |
| 45 to 59 Minutes | 0 (0.0%) | 0 (0.0%) |
| 60 to 89 Minutes | 0 (0.0%) | 0 (0.0%) |
| 90 or more Minutes | 0 (0.0%) | 0 (0.0%) |
Time of Departure to Work by Sex in Newry
The most frequent times of departure to work in Newry are 8:00 AM to 8:29 AM (17, 63.0%) for males and 6:30 AM to 6:59 AM (5, 100.0%) for females.
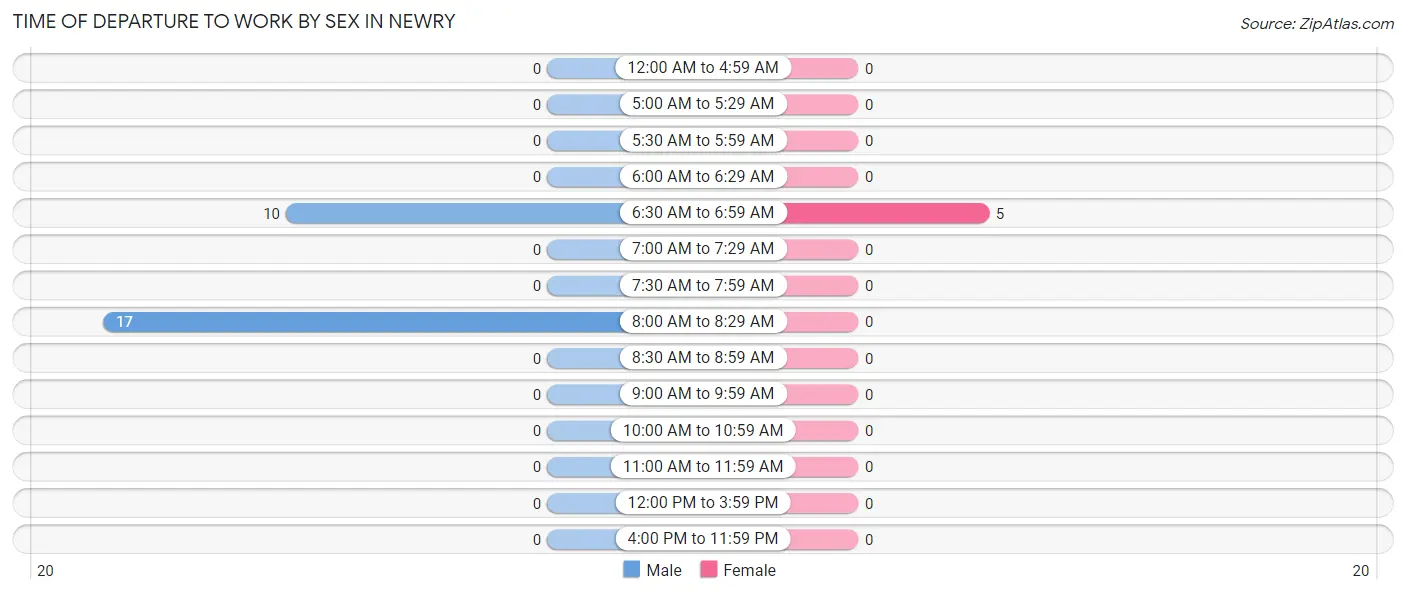
| Time of Departure | Male | Female |
| 12:00 AM to 4:59 AM | 0 (0.0%) | 0 (0.0%) |
| 5:00 AM to 5:29 AM | 0 (0.0%) | 0 (0.0%) |
| 5:30 AM to 5:59 AM | 0 (0.0%) | 0 (0.0%) |
| 6:00 AM to 6:29 AM | 0 (0.0%) | 0 (0.0%) |
| 6:30 AM to 6:59 AM | 10 (37.0%) | 5 (100.0%) |
| 7:00 AM to 7:29 AM | 0 (0.0%) | 0 (0.0%) |
| 7:30 AM to 7:59 AM | 0 (0.0%) | 0 (0.0%) |
| 8:00 AM to 8:29 AM | 17 (63.0%) | 0 (0.0%) |
| 8:30 AM to 8:59 AM | 0 (0.0%) | 0 (0.0%) |
| 9:00 AM to 9:59 AM | 0 (0.0%) | 0 (0.0%) |
| 10:00 AM to 10:59 AM | 0 (0.0%) | 0 (0.0%) |
| 11:00 AM to 11:59 AM | 0 (0.0%) | 0 (0.0%) |
| 12:00 PM to 3:59 PM | 0 (0.0%) | 0 (0.0%) |
| 4:00 PM to 11:59 PM | 0 (0.0%) | 0 (0.0%) |
| Total | 27 (100.0%) | 5 (100.0%) |
Housing Occupancy in Newry
Occupancy by Ownership in Newry
Of the total 152 dwellings in Newry, owner-occupied units account for 152 (100.0%), while renter-occupied units make up 0 (0.0%).
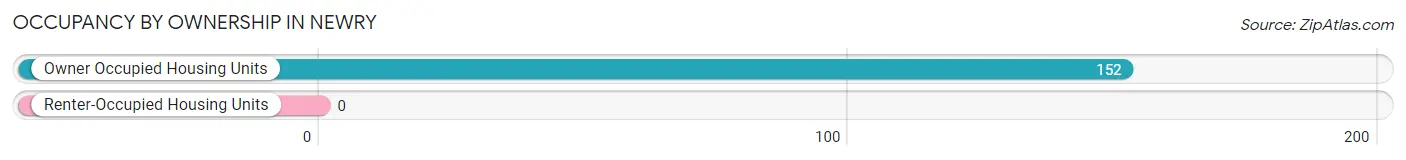
| Occupancy | # Housing Units | % Housing Units |
| Owner Occupied Housing Units | 152 | 100.0% |
| Renter-Occupied Housing Units | 0 | 0.0% |
| Total Occupied Housing Units | 152 | 100.0% |
Occupancy by Household Size in Newry
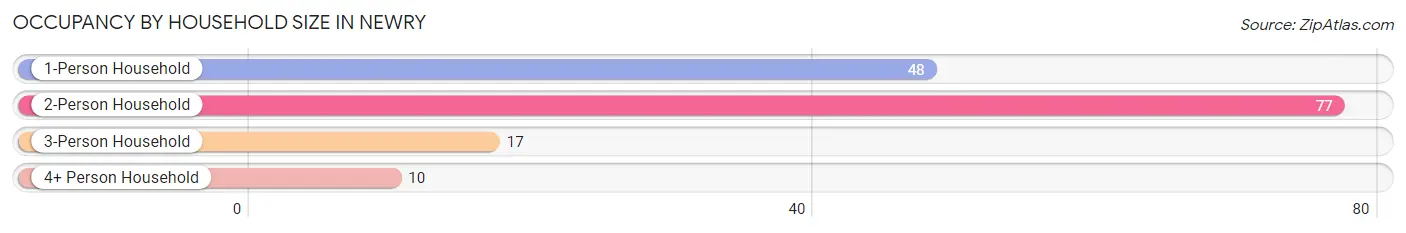
| Household Size | # Housing Units | % Housing Units |
| 1-Person Household | 48 | 31.6% |
| 2-Person Household | 77 | 50.7% |
| 3-Person Household | 17 | 11.2% |
| 4+ Person Household | 10 | 6.6% |
| Total Housing Units | 152 | 100.0% |
Occupancy by Ownership by Household Size in Newry
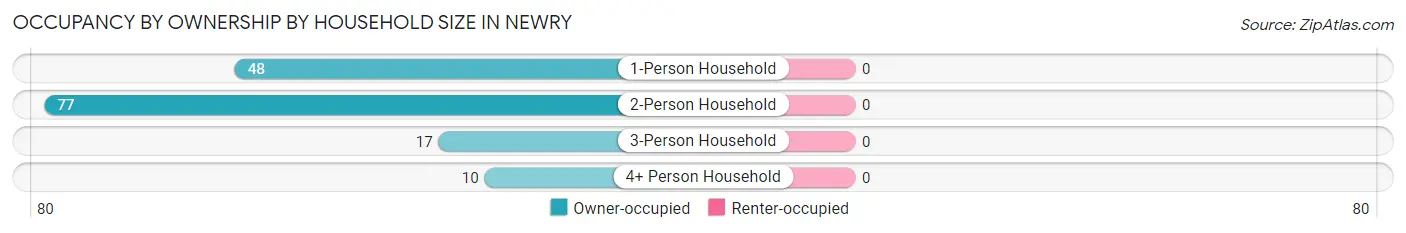
| Household Size | Owner-occupied | Renter-occupied |
| 1-Person Household | 48 (100.0%) | 0 (0.0%) |
| 2-Person Household | 77 (100.0%) | 0 (0.0%) |
| 3-Person Household | 17 (100.0%) | 0 (0.0%) |
| 4+ Person Household | 10 (100.0%) | 0 (0.0%) |
| Total Housing Units | 152 (100.0%) | 0 (0.0%) |
Occupancy by Educational Attainment in Newry
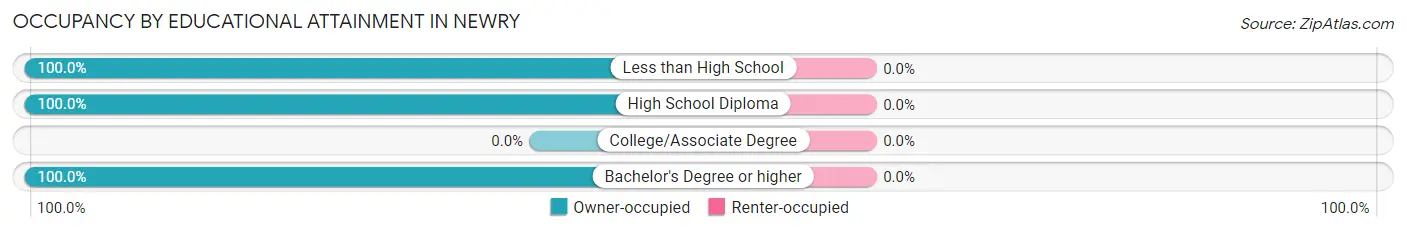
| Household Size | Owner-occupied | Renter-occupied |
| Less than High School | 36 (100.0%) | 0 (0.0%) |
| High School Diploma | 60 (100.0%) | 0 (0.0%) |
| College/Associate Degree | 0 (0.0%) | 0 (0.0%) |
| Bachelor's Degree or higher | 56 (100.0%) | 0 (0.0%) |
Occupancy by Age of Householder in Newry
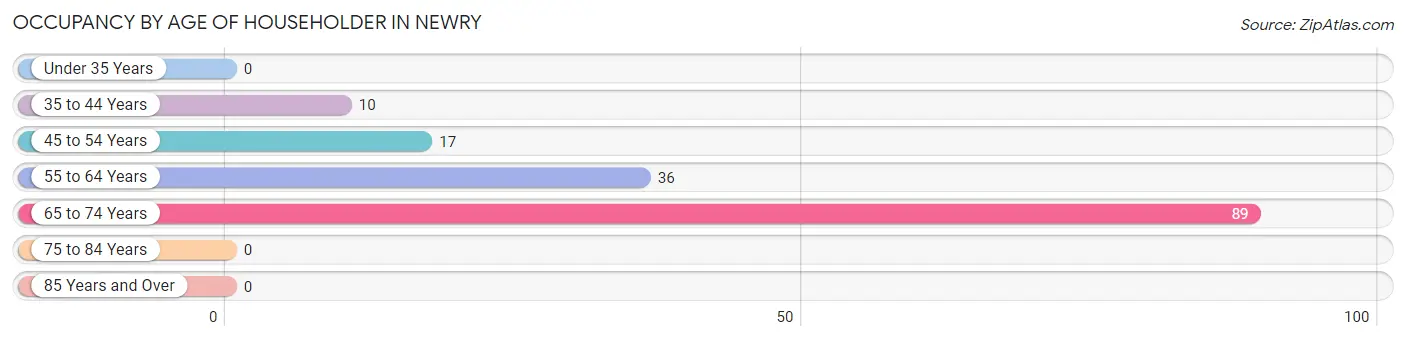
| Age Bracket | # Households | % Households |
| Under 35 Years | 0 | 0.0% |
| 35 to 44 Years | 10 | 6.6% |
| 45 to 54 Years | 17 | 11.2% |
| 55 to 64 Years | 36 | 23.7% |
| 65 to 74 Years | 89 | 58.6% |
| 75 to 84 Years | 0 | 0.0% |
| 85 Years and Over | 0 | 0.0% |
| Total | 152 | 100.0% |
Housing Finances in Newry
Median Income by Occupancy in Newry
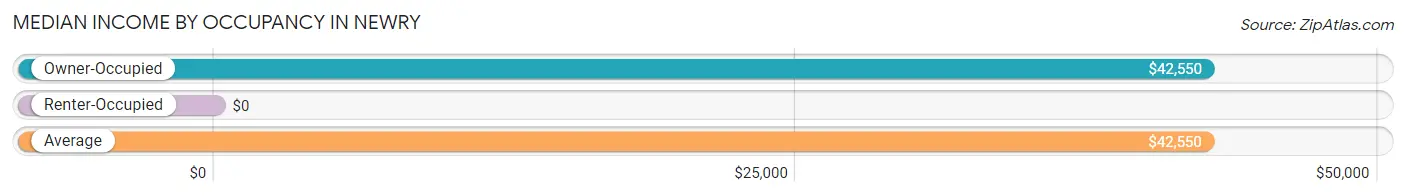
| Occupancy Type | # Households | Median Income |
| Owner-Occupied | 152 (100.0%) | $42,550 |
| Renter-Occupied | 0 (0.0%) | $0 |
| Average | 152 (100.0%) | $42,550 |
Occupancy by Householder Income Bracket in Newry
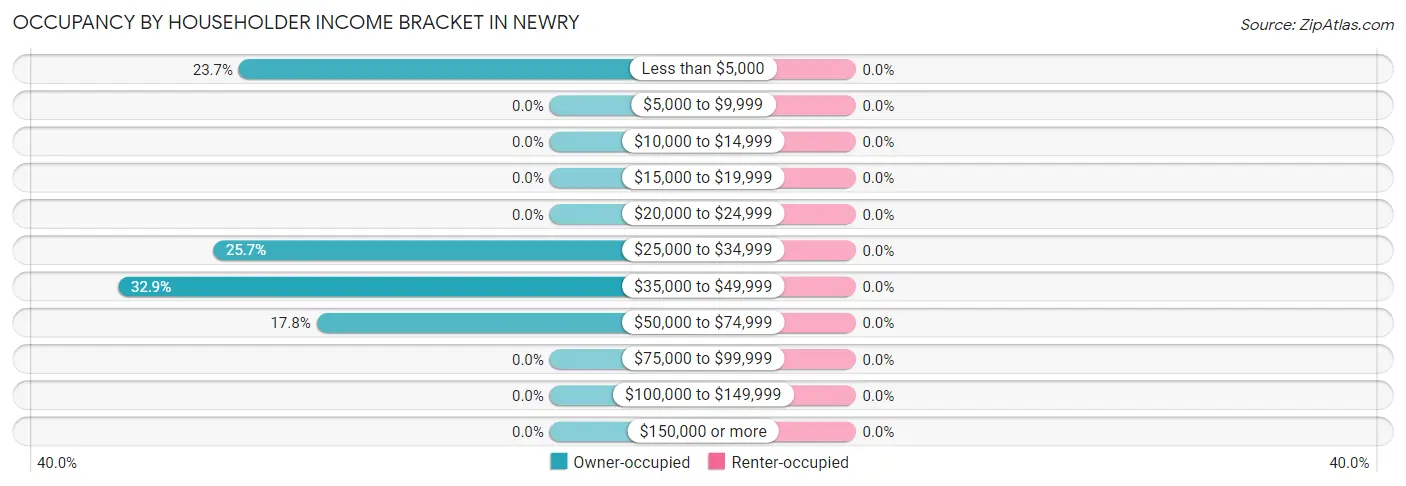
| Income Bracket | Owner-occupied | Renter-occupied |
| Less than $5,000 | 36 (23.7%) | 0 (0.0%) |
| $5,000 to $9,999 | 0 (0.0%) | 0 (0.0%) |
| $10,000 to $14,999 | 0 (0.0%) | 0 (0.0%) |
| $15,000 to $19,999 | 0 (0.0%) | 0 (0.0%) |
| $20,000 to $24,999 | 0 (0.0%) | 0 (0.0%) |
| $25,000 to $34,999 | 39 (25.7%) | 0 (0.0%) |
| $35,000 to $49,999 | 50 (32.9%) | 0 (0.0%) |
| $50,000 to $74,999 | 27 (17.8%) | 0 (0.0%) |
| $75,000 to $99,999 | 0 (0.0%) | 0 (0.0%) |
| $100,000 to $149,999 | 0 (0.0%) | 0 (0.0%) |
| $150,000 or more | 0 (0.0%) | 0 (0.0%) |
| Total | 152 (100.0%) | 0 (0.0%) |
Monthly Housing Cost Tiers in Newry
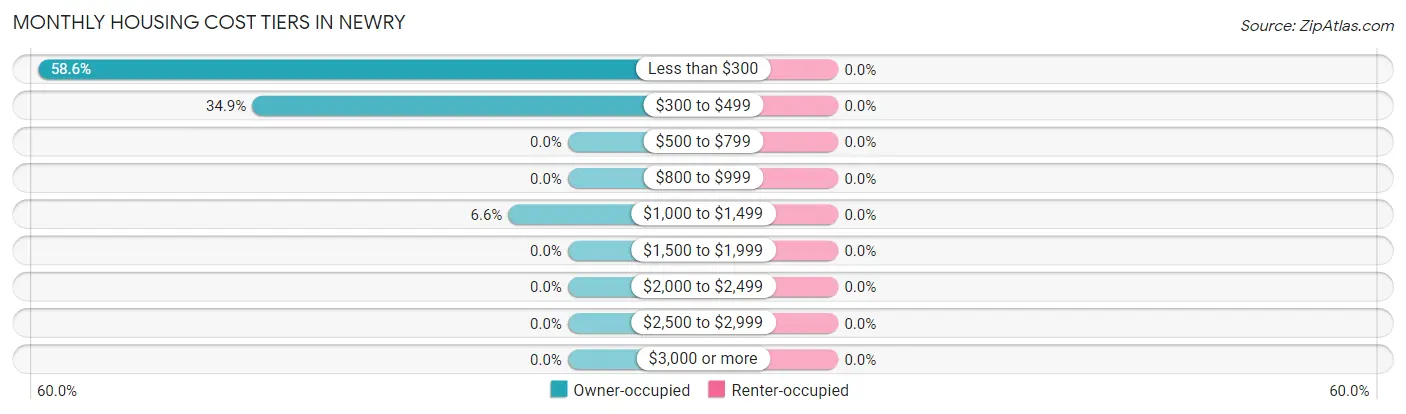
| Monthly Cost | Owner-occupied | Renter-occupied |
| Less than $300 | 89 (58.6%) | 0 (0.0%) |
| $300 to $499 | 53 (34.9%) | 0 (0.0%) |
| $500 to $799 | 0 (0.0%) | 0 (0.0%) |
| $800 to $999 | 0 (0.0%) | 0 (0.0%) |
| $1,000 to $1,499 | 10 (6.6%) | 0 (0.0%) |
| $1,500 to $1,999 | 0 (0.0%) | 0 (0.0%) |
| $2,000 to $2,499 | 0 (0.0%) | 0 (0.0%) |
| $2,500 to $2,999 | 0 (0.0%) | 0 (0.0%) |
| $3,000 or more | 0 (0.0%) | 0 (0.0%) |
| Total | 152 (100.0%) | 0 (0.0%) |
Physical Housing Characteristics in Newry
Housing Structures in Newry
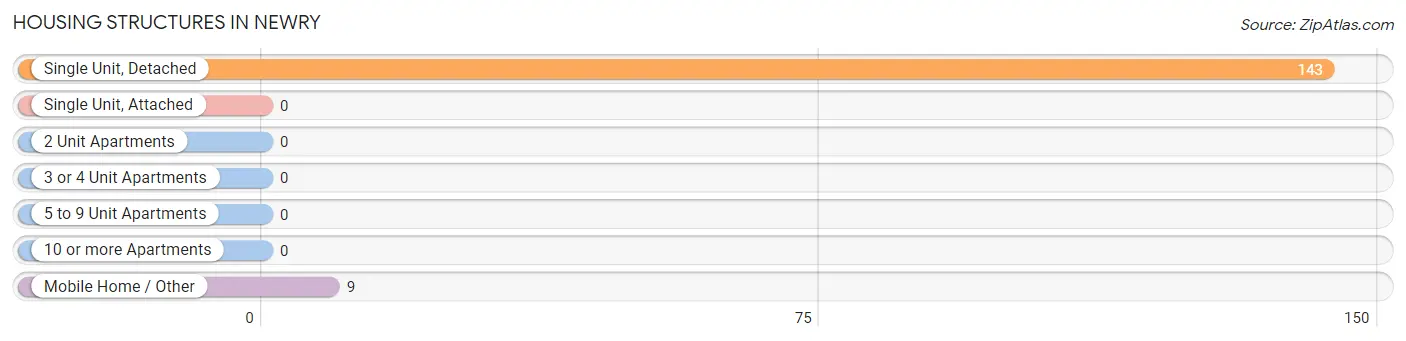
| Structure Type | # Housing Units | % Housing Units |
| Single Unit, Detached | 143 | 94.1% |
| Single Unit, Attached | 0 | 0.0% |
| 2 Unit Apartments | 0 | 0.0% |
| 3 or 4 Unit Apartments | 0 | 0.0% |
| 5 to 9 Unit Apartments | 0 | 0.0% |
| 10 or more Apartments | 0 | 0.0% |
| Mobile Home / Other | 9 | 5.9% |
| Total | 152 | 100.0% |
Housing Structures by Occupancy in Newry
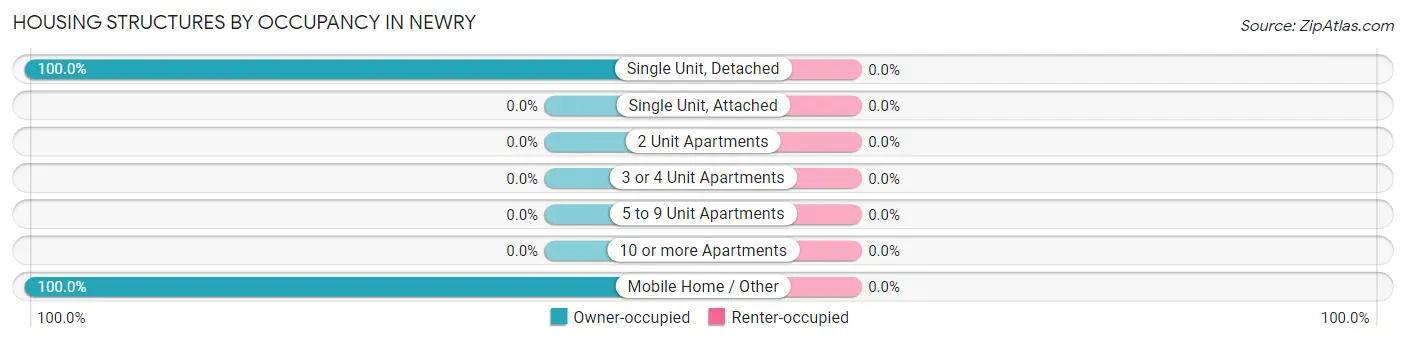
| Structure Type | Owner-occupied | Renter-occupied |
| Single Unit, Detached | 143 (100.0%) | 0 (0.0%) |
| Single Unit, Attached | 0 (0.0%) | 0 (0.0%) |
| 2 Unit Apartments | 0 (0.0%) | 0 (0.0%) |
| 3 or 4 Unit Apartments | 0 (0.0%) | 0 (0.0%) |
| 5 to 9 Unit Apartments | 0 (0.0%) | 0 (0.0%) |
| 10 or more Apartments | 0 (0.0%) | 0 (0.0%) |
| Mobile Home / Other | 9 (100.0%) | 0 (0.0%) |
| Total | 152 (100.0%) | 0 (0.0%) |
Housing Structures by Number of Rooms in Newry
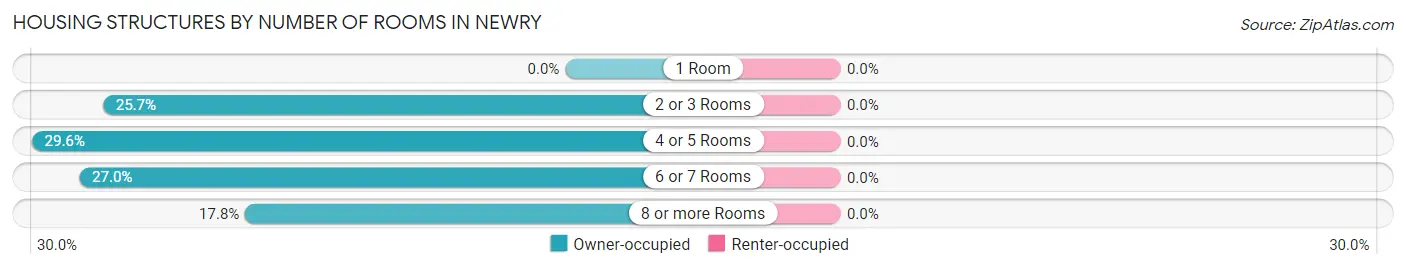
| Number of Rooms | Owner-occupied | Renter-occupied |
| 1 Room | 0 (0.0%) | 0 (0.0%) |
| 2 or 3 Rooms | 39 (25.7%) | 0 (0.0%) |
| 4 or 5 Rooms | 45 (29.6%) | 0 (0.0%) |
| 6 or 7 Rooms | 41 (27.0%) | 0 (0.0%) |
| 8 or more Rooms | 27 (17.8%) | 0 (0.0%) |
| Total | 152 (100.0%) | 0 (0.0%) |
Housing Structure by Heating Type in Newry
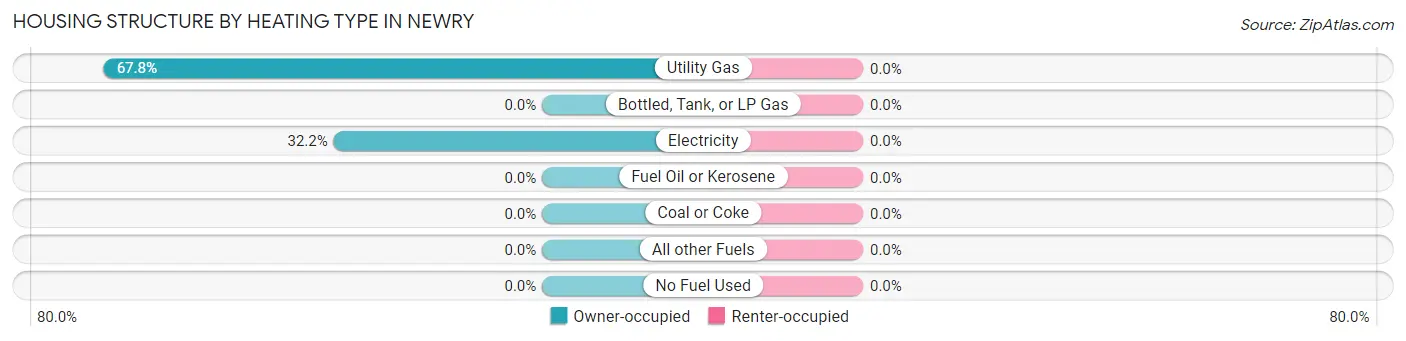
| Heating Type | Owner-occupied | Renter-occupied |
| Utility Gas | 103 (67.8%) | 0 (0.0%) |
| Bottled, Tank, or LP Gas | 0 (0.0%) | 0 (0.0%) |
| Electricity | 49 (32.2%) | 0 (0.0%) |
| Fuel Oil or Kerosene | 0 (0.0%) | 0 (0.0%) |
| Coal or Coke | 0 (0.0%) | 0 (0.0%) |
| All other Fuels | 0 (0.0%) | 0 (0.0%) |
| No Fuel Used | 0 (0.0%) | 0 (0.0%) |
| Total | 152 (100.0%) | 0 (0.0%) |
Household Vehicle Usage in Newry
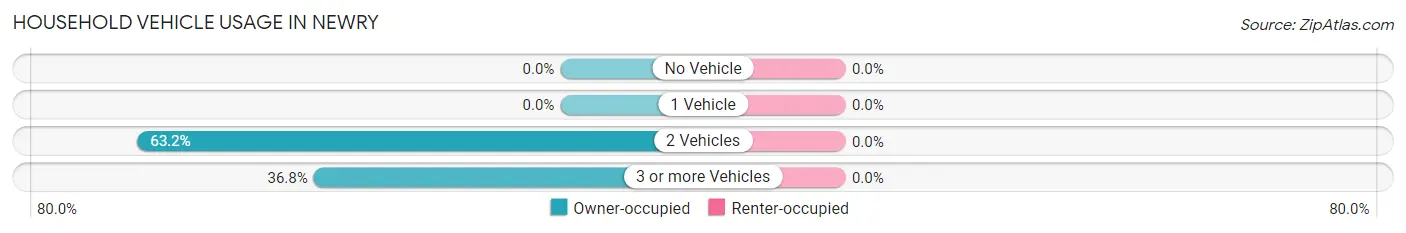
| Vehicles per Household | Owner-occupied | Renter-occupied |
| No Vehicle | 0 (0.0%) | 0 (0.0%) |
| 1 Vehicle | 0 (0.0%) | 0 (0.0%) |
| 2 Vehicles | 96 (63.2%) | 0 (0.0%) |
| 3 or more Vehicles | 56 (36.8%) | 0 (0.0%) |
| Total | 152 (100.0%) | 0 (0.0%) |
Real Estate & Mortgages in Newry
Real Estate and Mortgage Overview in Newry
| Characteristic | Without Mortgage | With Mortgage |
| Housing Units | 142 | 10 |
| Median Property Value | $138,500 | $0 |
| Median Household Income | - | - |
| Monthly Housing Costs | $277 | $0 |
| Real Estate Taxes | $477 | $0 |
Property Value by Mortgage Status in Newry
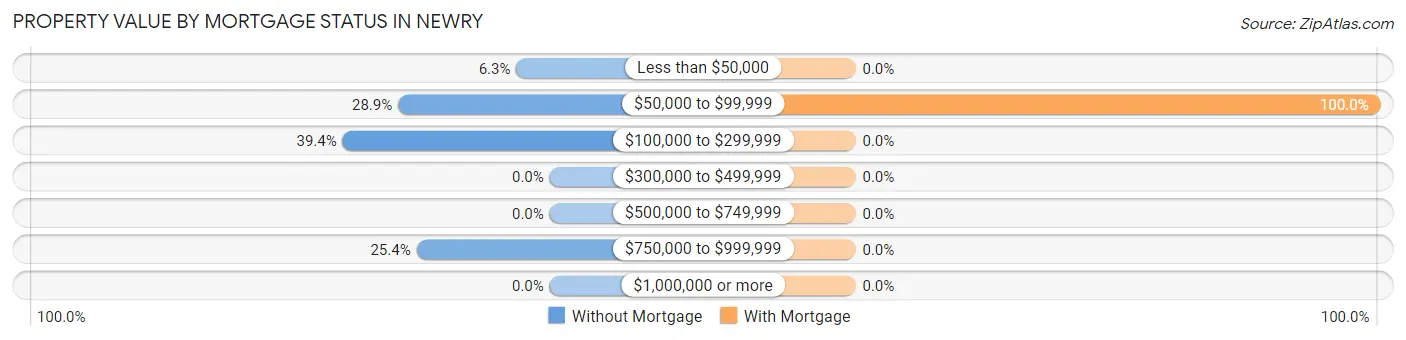
| Property Value | Without Mortgage | With Mortgage |
| Less than $50,000 | 9 (6.3%) | 0 (0.0%) |
| $50,000 to $99,999 | 41 (28.9%) | 10 (100.0%) |
| $100,000 to $299,999 | 56 (39.4%) | 0 (0.0%) |
| $300,000 to $499,999 | 0 (0.0%) | 0 (0.0%) |
| $500,000 to $749,999 | 0 (0.0%) | 0 (0.0%) |
| $750,000 to $999,999 | 36 (25.4%) | 0 (0.0%) |
| $1,000,000 or more | 0 (0.0%) | 0 (0.0%) |
| Total | 142 (100.0%) | 10 (100.0%) |
Household Income by Mortgage Status in Newry
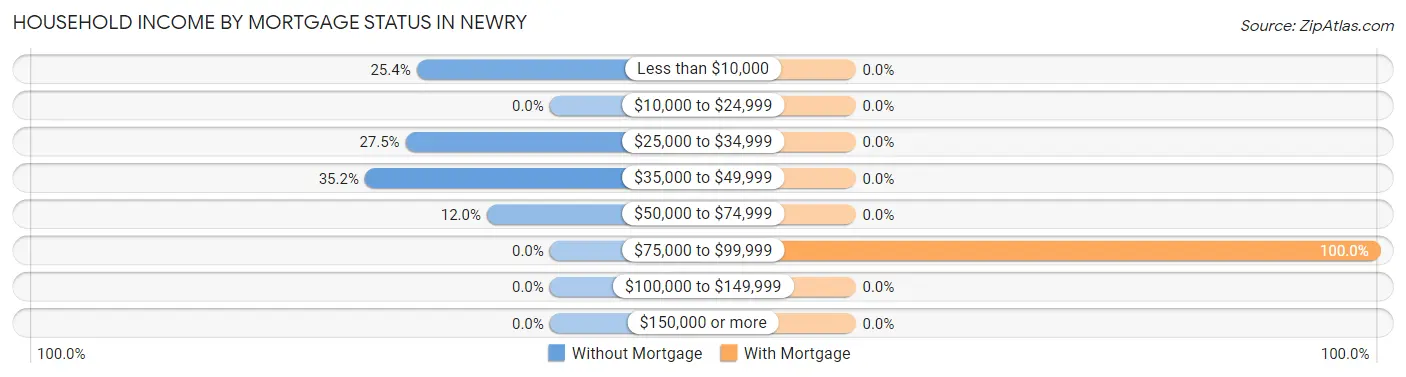
| Household Income | Without Mortgage | With Mortgage |
| Less than $10,000 | 36 (25.4%) | 0 (0.0%) |
| $10,000 to $24,999 | 0 (0.0%) | 0 (0.0%) |
| $25,000 to $34,999 | 39 (27.5%) | 0 (0.0%) |
| $35,000 to $49,999 | 50 (35.2%) | 0 (0.0%) |
| $50,000 to $74,999 | 17 (12.0%) | 0 (0.0%) |
| $75,000 to $99,999 | 0 (0.0%) | 10 (100.0%) |
| $100,000 to $149,999 | 0 (0.0%) | 0 (0.0%) |
| $150,000 or more | 0 (0.0%) | 0 (0.0%) |
| Total | 142 (100.0%) | 10 (100.0%) |
Property Value to Household Income Ratio in Newry
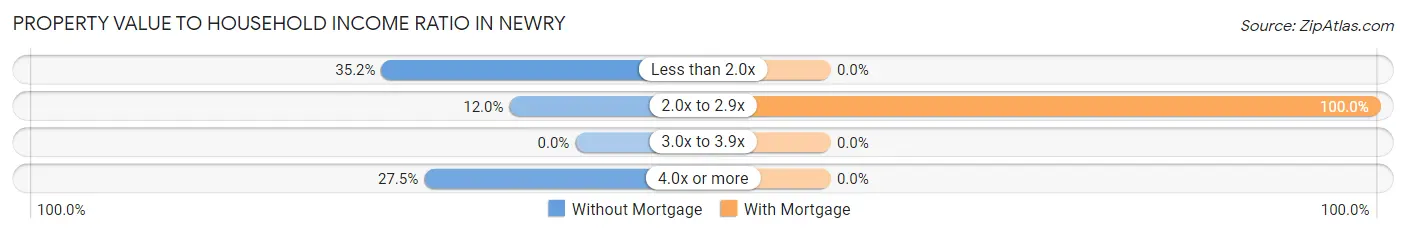
| Value-to-Income Ratio | Without Mortgage | With Mortgage |
| Less than 2.0x | 50 (35.2%) | 0 (0.0%) |
| 2.0x to 2.9x | 17 (12.0%) | 10 (100.0%) |
| 3.0x to 3.9x | 0 (0.0%) | 0 (0.0%) |
| 4.0x or more | 39 (27.5%) | 0 (0.0%) |
| Total | 142 (100.0%) | 10 (100.0%) |
Real Estate Taxes by Mortgage Status in Newry
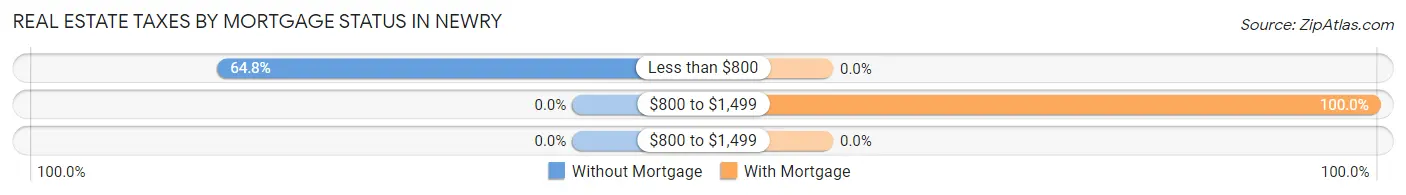
| Property Taxes | Without Mortgage | With Mortgage |
| Less than $800 | 92 (64.8%) | 0 (0.0%) |
| $800 to $1,499 | 0 (0.0%) | 10 (100.0%) |
| $800 to $1,499 | 0 (0.0%) | 0 (0.0%) |
| Total | 142 (100.0%) | 10 (100.0%) |
Health & Disability in Newry
Health Insurance Coverage by Age in Newry
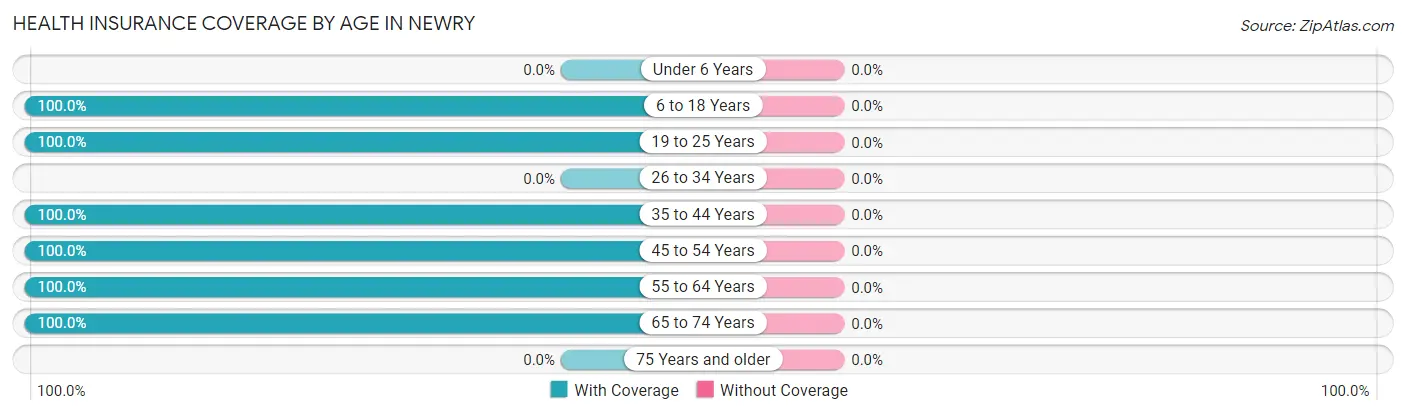
| Age Bracket | With Coverage | Without Coverage |
| Under 6 Years | 0 (0.0%) | 0 (0.0%) |
| 6 to 18 Years | 38 (100.0%) | 0 (0.0%) |
| 19 to 25 Years | 26 (100.0%) | 0 (0.0%) |
| 26 to 34 Years | 0 (0.0%) | 0 (0.0%) |
| 35 to 44 Years | 20 (100.0%) | 0 (0.0%) |
| 45 to 54 Years | 86 (100.0%) | 0 (0.0%) |
| 55 to 64 Years | 36 (100.0%) | 0 (0.0%) |
| 65 to 74 Years | 135 (100.0%) | 0 (0.0%) |
| 75 Years and older | 0 (0.0%) | 0 (0.0%) |
| Total | 341 (100.0%) | 0 (0.0%) |
Health Insurance Coverage by Citizenship Status in Newry
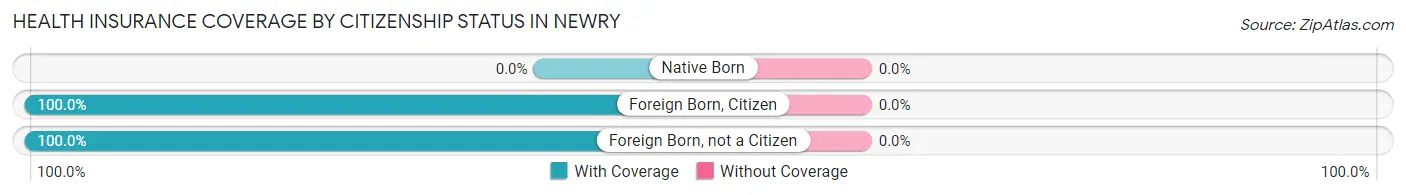
| Citizenship Status | With Coverage | Without Coverage |
| Native Born | 0 (0.0%) | 0 (0.0%) |
| Foreign Born, Citizen | 38 (100.0%) | 0 (0.0%) |
| Foreign Born, not a Citizen | 26 (100.0%) | 0 (0.0%) |
Health Insurance Coverage by Household Income in Newry
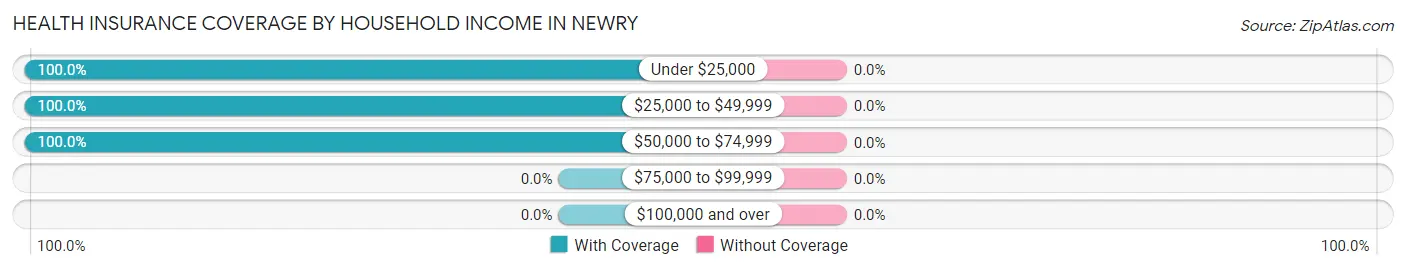
| Household Income | With Coverage | Without Coverage |
| Under $25,000 | 86 (100.0%) | 0 (0.0%) |
| $25,000 to $49,999 | 135 (100.0%) | 0 (0.0%) |
| $50,000 to $74,999 | 120 (100.0%) | 0 (0.0%) |
| $75,000 to $99,999 | 0 (0.0%) | 0 (0.0%) |
| $100,000 and over | 0 (0.0%) | 0 (0.0%) |
Public vs Private Health Insurance Coverage by Age in Newry
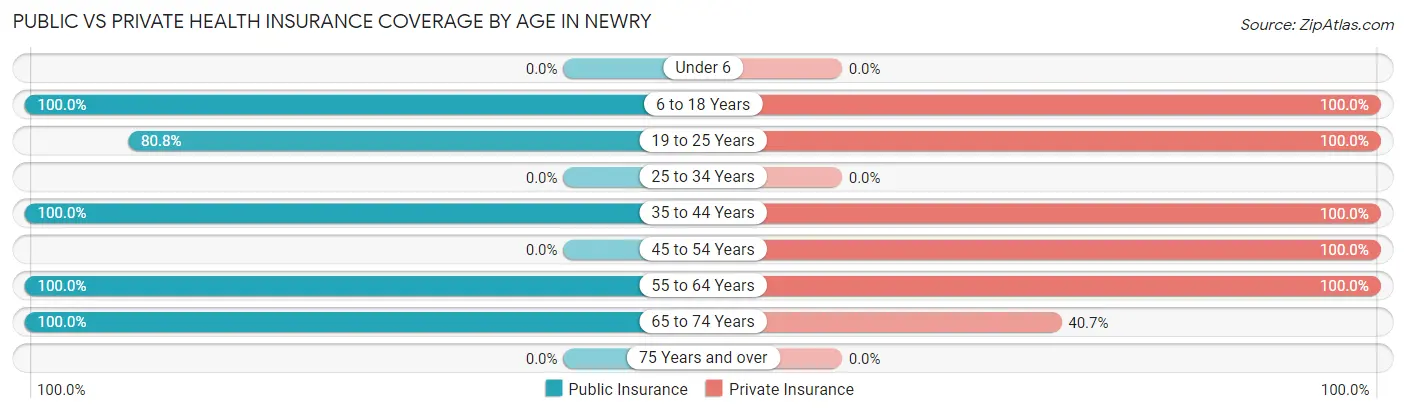
| Age Bracket | Public Insurance | Private Insurance |
| Under 6 | 0 (0.0%) | 0 (0.0%) |
| 6 to 18 Years | 38 (100.0%) | 38 (100.0%) |
| 19 to 25 Years | 21 (80.8%) | 26 (100.0%) |
| 25 to 34 Years | 0 (0.0%) | 0 (0.0%) |
| 35 to 44 Years | 20 (100.0%) | 20 (100.0%) |
| 45 to 54 Years | 0 (0.0%) | 86 (100.0%) |
| 55 to 64 Years | 36 (100.0%) | 36 (100.0%) |
| 65 to 74 Years | 135 (100.0%) | 55 (40.7%) |
| 75 Years and over | 0 (0.0%) | 0 (0.0%) |
| Total | 250 (73.3%) | 261 (76.5%) |
Disability Status by Sex by Age in Newry
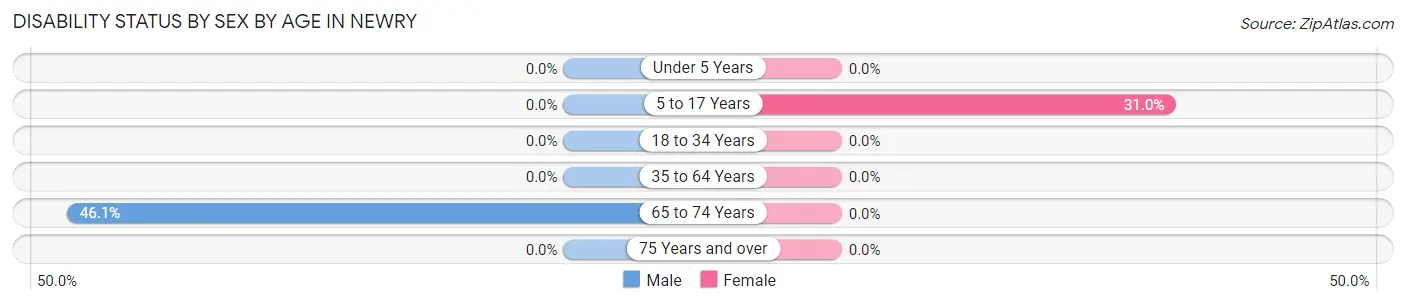
| Age Bracket | Male | Female |
| Under 5 Years | 0 (0.0%) | 0 (0.0%) |
| 5 to 17 Years | 0 (0.0%) | 9 (31.0%) |
| 18 to 34 Years | 0 (0.0%) | 0 (0.0%) |
| 35 to 64 Years | 0 (0.0%) | 0 (0.0%) |
| 65 to 74 Years | 41 (46.1%) | 0 (0.0%) |
| 75 Years and over | 0 (0.0%) | 0 (0.0%) |
Disability Class by Sex by Age in Newry
Disability Class: Hearing Difficulty
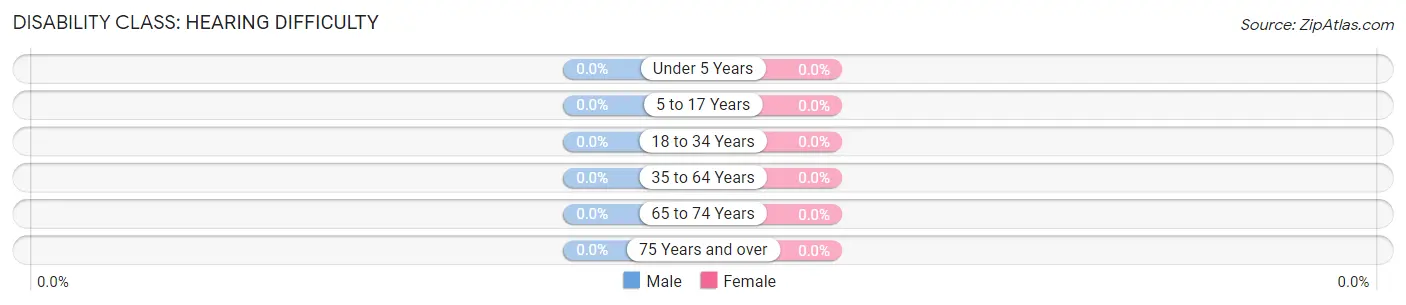
| Age Bracket | Male | Female |
| Under 5 Years | 0 (0.0%) | 0 (0.0%) |
| 5 to 17 Years | 0 (0.0%) | 0 (0.0%) |
| 18 to 34 Years | 0 (0.0%) | 0 (0.0%) |
| 35 to 64 Years | 0 (0.0%) | 0 (0.0%) |
| 65 to 74 Years | 0 (0.0%) | 0 (0.0%) |
| 75 Years and over | 0 (0.0%) | 0 (0.0%) |
Disability Class: Vision Difficulty
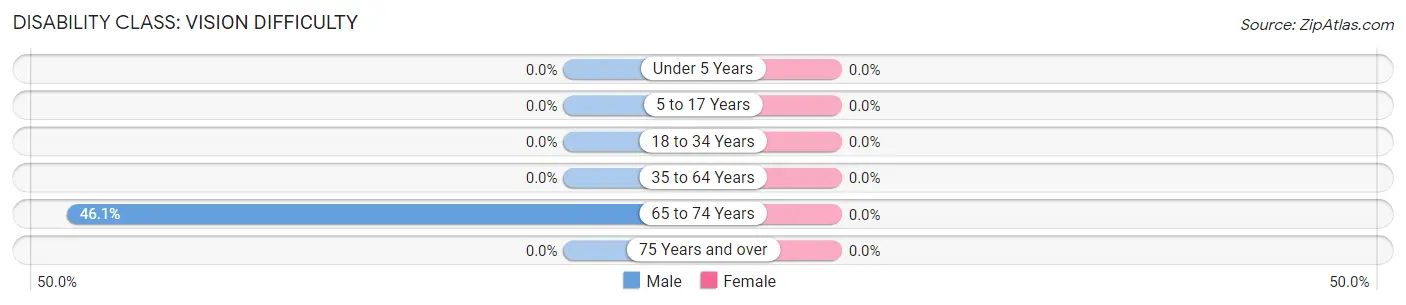
| Age Bracket | Male | Female |
| Under 5 Years | 0 (0.0%) | 0 (0.0%) |
| 5 to 17 Years | 0 (0.0%) | 0 (0.0%) |
| 18 to 34 Years | 0 (0.0%) | 0 (0.0%) |
| 35 to 64 Years | 0 (0.0%) | 0 (0.0%) |
| 65 to 74 Years | 41 (46.1%) | 0 (0.0%) |
| 75 Years and over | 0 (0.0%) | 0 (0.0%) |
Disability Class: Cognitive Difficulty
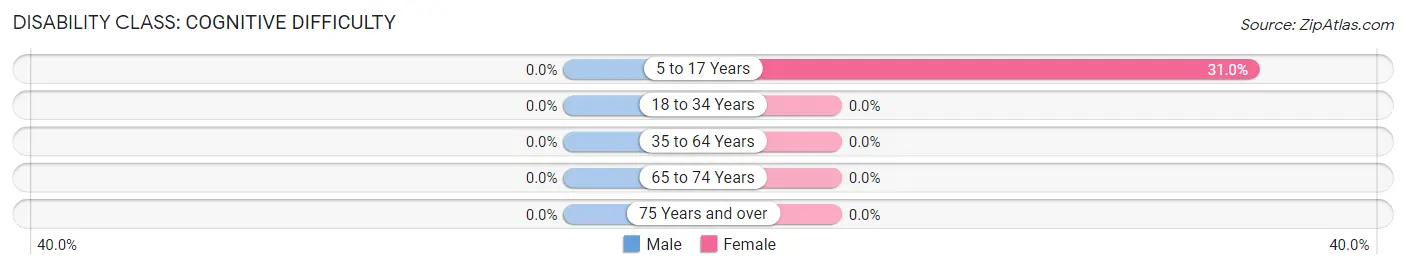
| Age Bracket | Male | Female |
| 5 to 17 Years | 0 (0.0%) | 9 (31.0%) |
| 18 to 34 Years | 0 (0.0%) | 0 (0.0%) |
| 35 to 64 Years | 0 (0.0%) | 0 (0.0%) |
| 65 to 74 Years | 0 (0.0%) | 0 (0.0%) |
| 75 Years and over | 0 (0.0%) | 0 (0.0%) |
Disability Class: Ambulatory Difficulty
| Age Bracket | Male | Female |
| 5 to 17 Years | 0 (0.0%) | 0 (0.0%) |
| 18 to 34 Years | 0 (0.0%) | 0 (0.0%) |
| 35 to 64 Years | 0 (0.0%) | 0 (0.0%) |
| 65 to 74 Years | 0 (0.0%) | 0 (0.0%) |
| 75 Years and over | 0 (0.0%) | 0 (0.0%) |
Disability Class: Self-Care Difficulty
| Age Bracket | Male | Female |
| 5 to 17 Years | 0 (0.0%) | 0 (0.0%) |
| 18 to 34 Years | 0 (0.0%) | 0 (0.0%) |
| 35 to 64 Years | 0 (0.0%) | 0 (0.0%) |
| 65 to 74 Years | 0 (0.0%) | 0 (0.0%) |
| 75 Years and over | 0 (0.0%) | 0 (0.0%) |
Technology Access in Newry
Computing Device Access in Newry
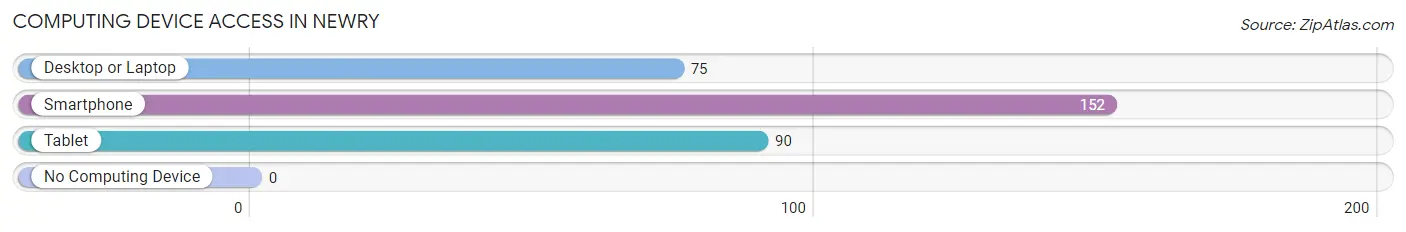
| Device Type | # Households | % Households |
| Desktop or Laptop | 75 | 49.3% |
| Smartphone | 152 | 100.0% |
| Tablet | 90 | 59.2% |
| No Computing Device | 0 | 0.0% |
| Total | 152 | 100.0% |
Internet Access in Newry
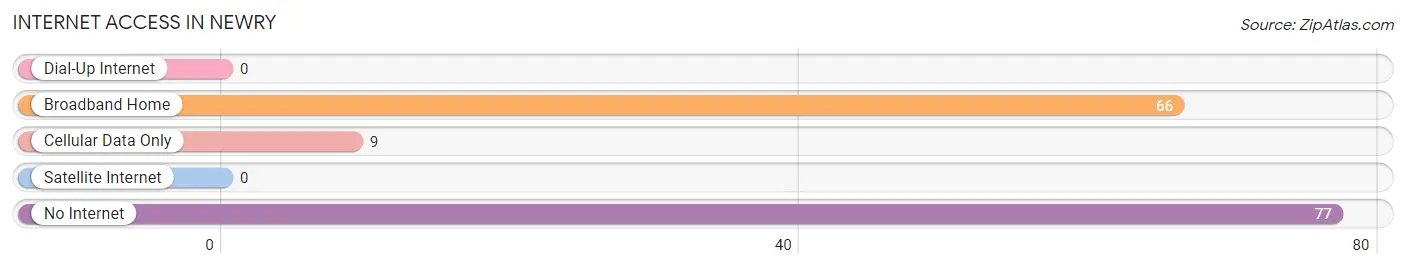
| Internet Type | # Households | % Households |
| Dial-Up Internet | 0 | 0.0% |
| Broadband Home | 66 | 43.4% |
| Cellular Data Only | 9 | 5.9% |
| Satellite Internet | 0 | 0.0% |
| No Internet | 77 | 50.7% |
| Total | 152 | 100.0% |
Newry Summary
Newry is a small town located in the state of South Carolina, United States. It is situated in the northwestern corner of the state, near the border with North Carolina. The town is part of the Greenville-Spartanburg-Anderson metropolitan area, and is located in Spartanburg County. The population of Newry was estimated to be 1,845 in 2020.
History
Newry was founded in 1845 by a group of settlers from North Carolina. The town was named after the town of Newry in Ireland. The settlers were mostly of Irish descent, and the town was originally known as Newryville. The town was incorporated in 1887.
The town was a major center of the textile industry in the early 20th century. The town was home to several cotton mills, and the town's economy was largely dependent on the textile industry. The town was also home to several other industries, including a furniture factory and a brickyard.
The town was also home to a large African-American population. The town was home to several African-American churches, and the town was a major center of the civil rights movement in the 1960s.
Geography
Newry is located in the northwestern corner of South Carolina, near the border with North Carolina. The town is situated in the foothills of the Blue Ridge Mountains, and is located in Spartanburg County. The town is located at an elevation of 890 feet above sea level.
The town is located along the Pacolet River, and is surrounded by several small lakes. The town is located near several state parks, including Jones Gap State Park and Caesars Head State Park.
Economy
The economy of Newry is largely based on the textile industry. The town is home to several cotton mills, and the town's economy is largely dependent on the textile industry. The town is also home to several other industries, including a furniture factory and a brickyard.
The town is also home to several small businesses, including restaurants, retail stores, and other services. The town is also home to several small farms, and the town is a major center of the agricultural industry in the region.
Demographics
The population of Newry was estimated to be 1,845 in 2020. The town has a population that is largely white, with a small African-American population. The town has a median household income of $37,000, and the median age is 44. The town has a poverty rate of 17.3%, and the unemployment rate is 5.2%.
Common Questions
What is Per Capita Income in Newry?
Per Capita income in Newry is $14,945.
What is the Median Family Income in Newry?
Median Family Income in Newry is $43,476.
What is the Median Household income in Newry?
Median Household Income in Newry is $42,550.
What is Inequality or Gini Index in Newry?
Inequality or Gini Index in Newry is 0.38.
What is the Total Population of Newry?
Total Population of Newry is 341.
What is the Total Male Population of Newry?
Total Male Population of Newry is 196.
What is the Total Female Population of Newry?
Total Female Population of Newry is 145.
What is the Ratio of Males per 100 Females in Newry?
There are 135.17 Males per 100 Females in Newry.
What is the Ratio of Females per 100 Males in Newry?
There are 73.98 Females per 100 Males in Newry.
What is the Median Population Age in Newry?
Median Population Age in Newry is 58.0 Years.
What is the Average Family Size in Newry
Average Family Size in Newry is 2.8 People.
What is the Average Household Size in Newry
Average Household Size in Newry is 2.2 People.
How Large is the Labor Force in Newry?
There are 32 People in the Labor Forcein in Newry.
What is the Percentage of People in the Labor Force in Newry?
10.3% of People are in the Labor Force in Newry.