High Rolls, NM Map & Demographics
High Rolls Map
High Rolls Overview
$22,535
PER CAPITA INCOME
$84,392
AVG FAMILY INCOME
$71,094
AVG HOUSEHOLD INCOME
0.25
INEQUALITY / GINI INDEX
1,611
TOTAL POPULATION
850
MALE POPULATION
761
FEMALE POPULATION
111.70
MALES / 100 FEMALES
89.53
FEMALES / 100 MALES
27.0
MEDIAN AGE
4.9
AVG FAMILY SIZE
3.6
AVG HOUSEHOLD SIZE
457
LABOR FORCE [ PEOPLE ]
44.9%
PERCENT IN LABOR FORCE
Income in High Rolls
Income Overview in High Rolls
Per Capita Income in High Rolls is $22,535, while median incomes of families and households are $84,392 and $71,094 respectively.
| Characteristic | Number | Measure |
| Per Capita Income | 1,611 | $22,535 |
| Median Family Income | 300 | $84,392 |
| Mean Family Income | 300 | $91,512 |
| Median Household Income | 441 | $71,094 |
| Mean Household Income | 441 | $78,203 |
| Income Deficit | 300 | $0 |
| Wage / Income Gap (%) | 1,611 | 0.00% |
| Wage / Income Gap ($) | 1,611 | 100.00¢ per $1 |
| Gini / Inequality Index | 1,611 | 0.25 |
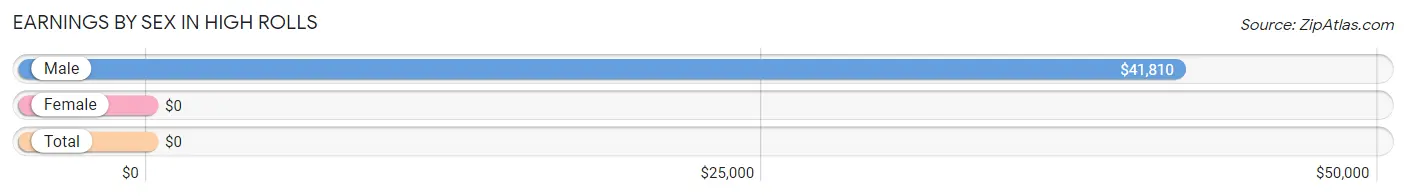
Earnings by Sex in High Rolls
| Sex | Number | Average Earnings |
| Male | 242 (39.9%) | $41,810 |
| Female | 364 (60.1%) | $0 |
| Total | 606 (100.0%) | $0 |
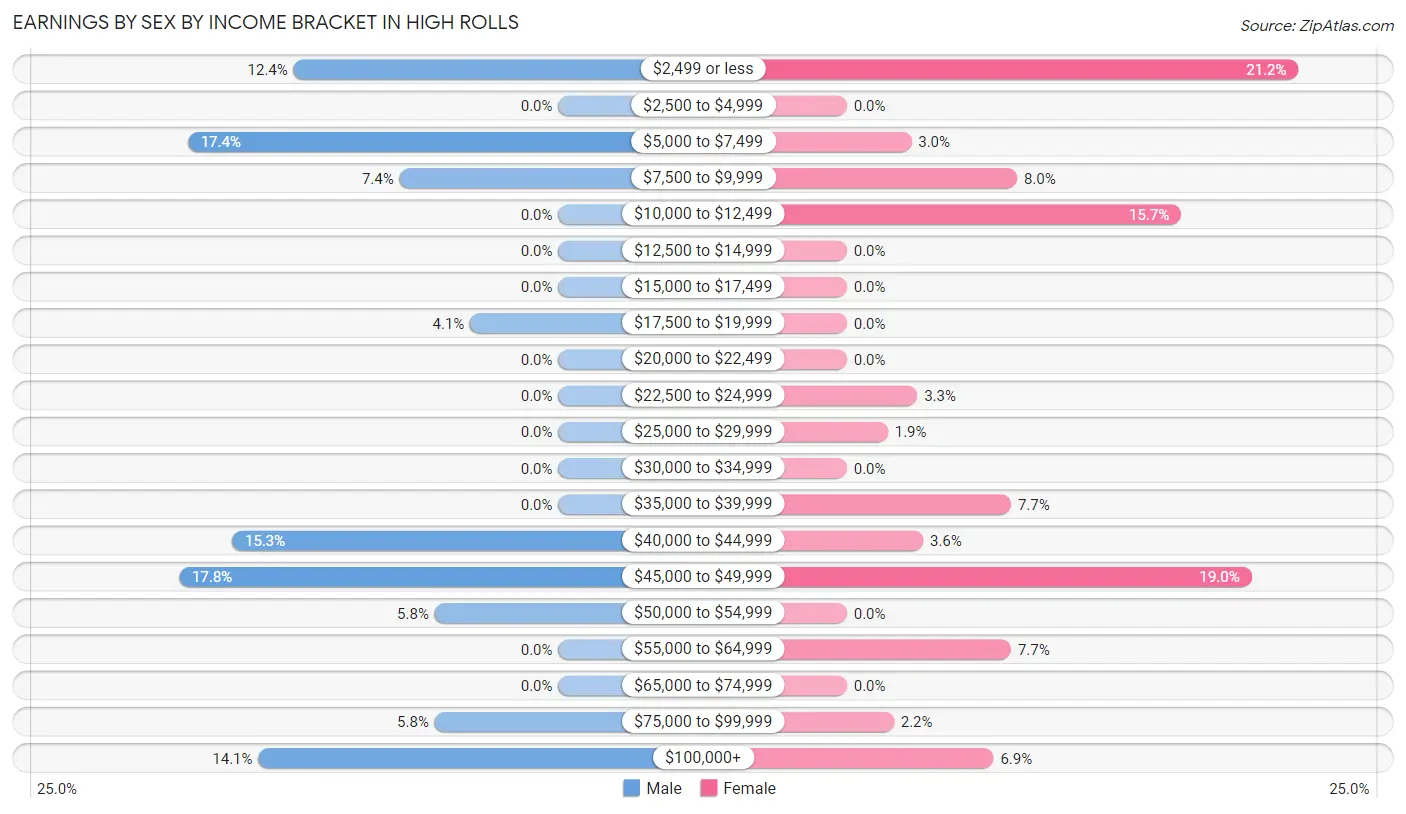
Earnings by Sex by Income Bracket in High Rolls
The most common earnings brackets in High Rolls are $45,000 to $49,999 for men (43 | 17.8%) and $2,499 or less for women (77 | 21.1%).
| Income | Male | Female |
| $2,499 or less | 30 (12.4%) | 77 (21.1%) |
| $2,500 to $4,999 | 0 (0.0%) | 0 (0.0%) |
| $5,000 to $7,499 | 42 (17.4%) | 11 (3.0%) |
| $7,500 to $9,999 | 18 (7.4%) | 29 (8.0%) |
| $10,000 to $12,499 | 0 (0.0%) | 57 (15.7%) |
| $12,500 to $14,999 | 0 (0.0%) | 0 (0.0%) |
| $15,000 to $17,499 | 0 (0.0%) | 0 (0.0%) |
| $17,500 to $19,999 | 10 (4.1%) | 0 (0.0%) |
| $20,000 to $22,499 | 0 (0.0%) | 0 (0.0%) |
| $22,500 to $24,999 | 0 (0.0%) | 12 (3.3%) |
| $25,000 to $29,999 | 0 (0.0%) | 7 (1.9%) |
| $30,000 to $34,999 | 0 (0.0%) | 0 (0.0%) |
| $35,000 to $39,999 | 0 (0.0%) | 28 (7.7%) |
| $40,000 to $44,999 | 37 (15.3%) | 13 (3.6%) |
| $45,000 to $49,999 | 43 (17.8%) | 69 (19.0%) |
| $50,000 to $54,999 | 14 (5.8%) | 0 (0.0%) |
| $55,000 to $64,999 | 0 (0.0%) | 28 (7.7%) |
| $65,000 to $74,999 | 0 (0.0%) | 0 (0.0%) |
| $75,000 to $99,999 | 14 (5.8%) | 8 (2.2%) |
| $100,000+ | 34 (14.1%) | 25 (6.9%) |
| Total | 242 (100.0%) | 364 (100.0%) |
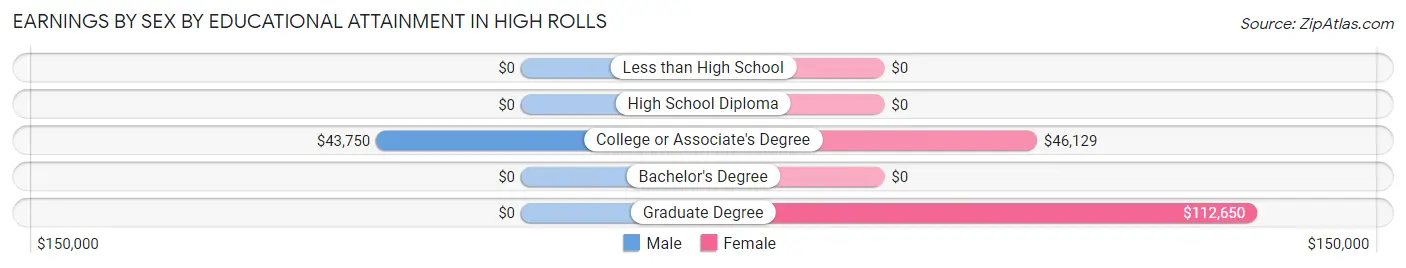
Earnings by Sex by Educational Attainment in High Rolls
Average earnings in High Rolls are $44,688 for men and $45,942 for women, a difference of 2.7%. Men with an educational attainment of college or associate's degree enjoy the highest average annual earnings of $43,750, while those with college or associate's degree education earn the least with $43,750. Women with an educational attainment of graduate degree earn the most with the average annual earnings of $112,650, while those with college or associate's degree education have the smallest earnings of $46,129.
| Educational Attainment | Male Income | Female Income |
| Less than High School | - | - |
| High School Diploma | - | - |
| College or Associate's Degree | $43,750 | $46,129 |
| Bachelor's Degree | - | - |
| Graduate Degree | - | - |
| Total | $44,688 | $45,942 |
Family Income in High Rolls
Family Income Brackets in High Rolls
According to the High Rolls family income data, there are 105 families falling into the $75,000 to $99,999 income range, which is the most common income bracket and makes up 35.0% of all families.
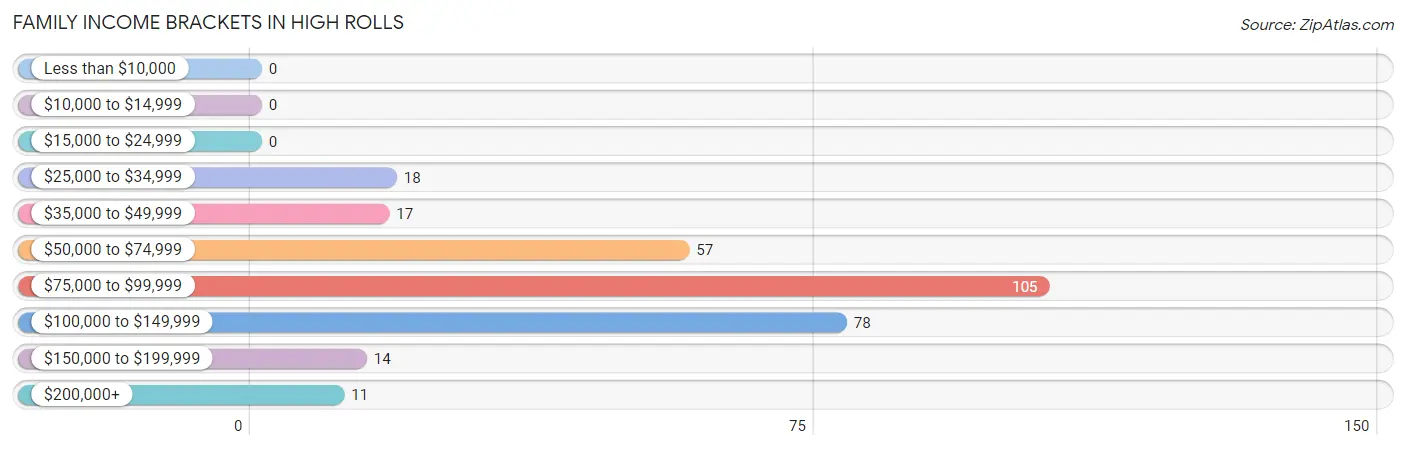
| Income Bracket | # Families | % Families |
| Less than $10,000 | 0 | 0.0% |
| $10,000 to $14,999 | 0 | 0.0% |
| $15,000 to $24,999 | 0 | 0.0% |
| $25,000 to $34,999 | 18 | 6.0% |
| $35,000 to $49,999 | 17 | 5.7% |
| $50,000 to $74,999 | 57 | 19.0% |
| $75,000 to $99,999 | 105 | 35.0% |
| $100,000 to $149,999 | 78 | 26.0% |
| $150,000 to $199,999 | 14 | 4.7% |
| $200,000+ | 11 | 3.7% |
Family Income by Famaliy Size in High Rolls
2-person families (163 | 54.3%) account for the highest median family income in High Rolls with $66,979 per family, while 2-person families (163 | 54.3%) have the highest median income of $33,490 per family member.
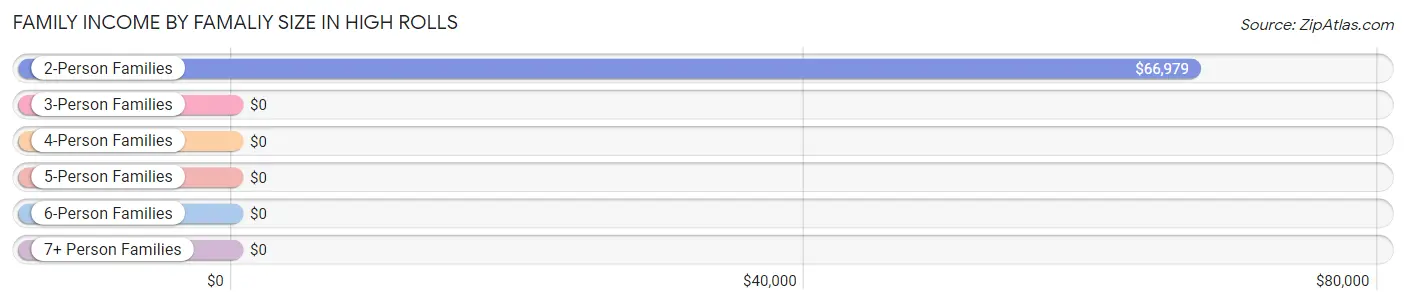
| Income Bracket | # Families | Median Income |
| 2-Person Families | 163 (54.3%) | $66,979 |
| 3-Person Families | 27 (9.0%) | $0 |
| 4-Person Families | 19 (6.3%) | $0 |
| 5-Person Families | 23 (7.7%) | $0 |
| 6-Person Families | 25 (8.3%) | $0 |
| 7+ Person Families | 43 (14.3%) | $0 |
| Total | 300 (100.0%) | $84,392 |
Family Income by Number of Earners in High Rolls
The median family income in High Rolls is $84,392, with families comprising 3+ earners (33) having the highest median family income of $166,518, while families with no earners (140) have the lowest median family income of $75,500, accounting for 11.0% and 46.7% of families, respectively.
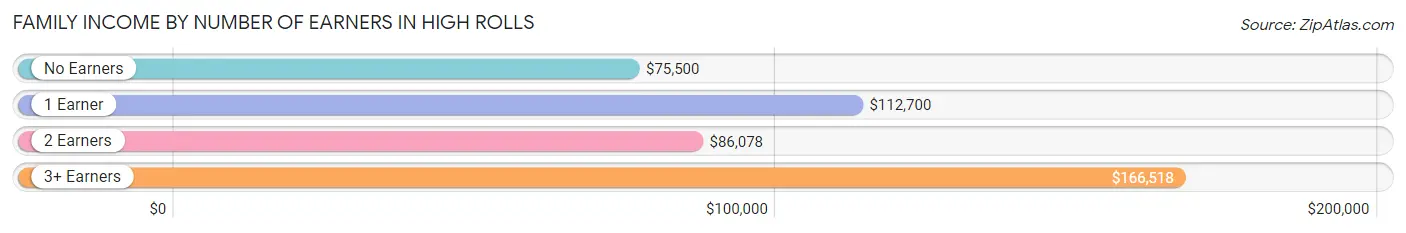
| Number of Earners | # Families | Median Income |
| No Earners | 140 (46.7%) | $75,500 |
| 1 Earner | 46 (15.3%) | $112,700 |
| 2 Earners | 81 (27.0%) | $86,078 |
| 3+ Earners | 33 (11.0%) | $166,518 |
| Total | 300 (100.0%) | $84,392 |
Household Income in High Rolls
Household Income Brackets in High Rolls
With 117 households falling in the category, the $35,000 to $49,999 income range is the most frequent in High Rolls, accounting for 26.5% of all households.
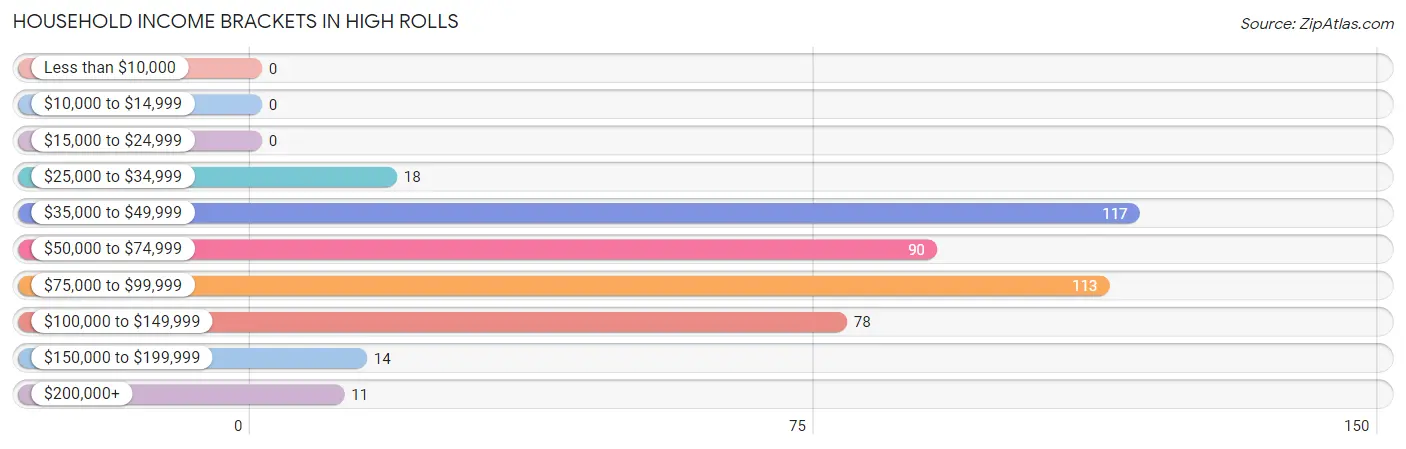
| Income Bracket | # Households | % Households |
| Less than $10,000 | 0 | 0.0% |
| $10,000 to $14,999 | 0 | 0.0% |
| $15,000 to $24,999 | 0 | 0.0% |
| $25,000 to $34,999 | 18 | 4.1% |
| $35,000 to $49,999 | 117 | 26.5% |
| $50,000 to $74,999 | 90 | 20.4% |
| $75,000 to $99,999 | 113 | 25.6% |
| $100,000 to $149,999 | 78 | 17.7% |
| $150,000 to $199,999 | 14 | 3.2% |
| $200,000+ | 11 | 2.5% |
Household Income by Householder Age in High Rolls
The median household income in High Rolls is $71,094, with the highest median household income of $112,750 found in the 25 to 44 years age bracket for the primary householder. A total of 73 households (16.6%) fall into this category.
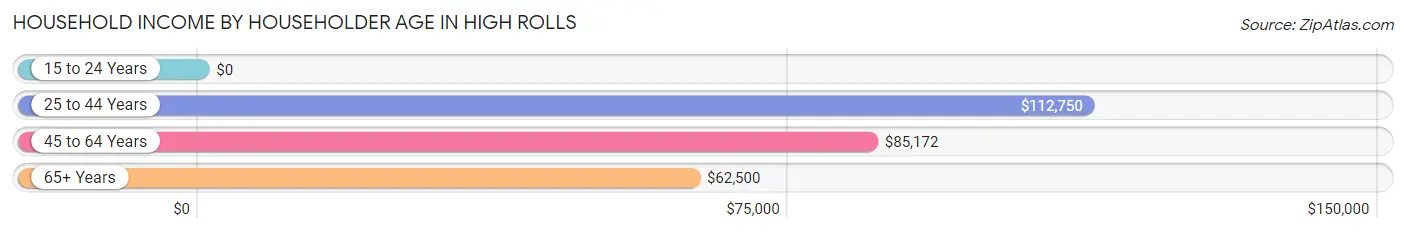
| Income Bracket | # Households | Median Income |
| 15 to 24 Years | 0 (0.0%) | $0 |
| 25 to 44 Years | 73 (16.6%) | $112,750 |
| 45 to 64 Years | 140 (31.8%) | $85,172 |
| 65+ Years | 228 (51.7%) | $62,500 |
| Total | 441 (100.0%) | $71,094 |
Poverty in High Rolls
Income Below Poverty by Sex and Age in High Rolls
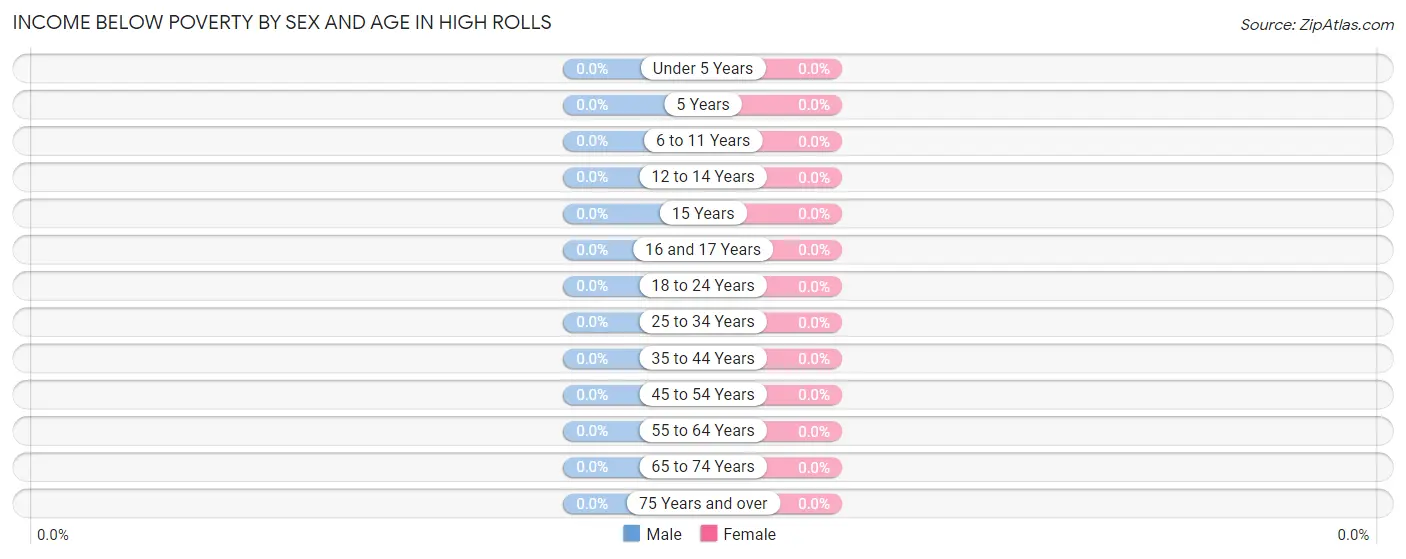
| Age Bracket | Male | Female |
| Under 5 Years | 0 (0.0%) | 0 (0.0%) |
| 5 Years | 0 (0.0%) | 0 (0.0%) |
| 6 to 11 Years | 0 (0.0%) | 0 (0.0%) |
| 12 to 14 Years | 0 (0.0%) | 0 (0.0%) |
| 15 Years | 0 (0.0%) | 0 (0.0%) |
| 16 and 17 Years | 0 (0.0%) | 0 (0.0%) |
| 18 to 24 Years | 0 (0.0%) | 0 (0.0%) |
| 25 to 34 Years | 0 (0.0%) | 0 (0.0%) |
| 35 to 44 Years | 0 (0.0%) | 0 (0.0%) |
| 45 to 54 Years | 0 (0.0%) | 0 (0.0%) |
| 55 to 64 Years | 0 (0.0%) | 0 (0.0%) |
| 65 to 74 Years | 0 (0.0%) | 0 (0.0%) |
| 75 Years and over | 0 (0.0%) | 0 (0.0%) |
| Total | 0 (0.0%) | 0 (0.0%) |
Income Above Poverty by Sex and Age in High Rolls
According to the poverty statistics in High Rolls, males aged under 5 years and females aged under 5 years are the age groups that are most secure financially, with 100.0% of males and 100.0% of females in these age groups living above the poverty line.
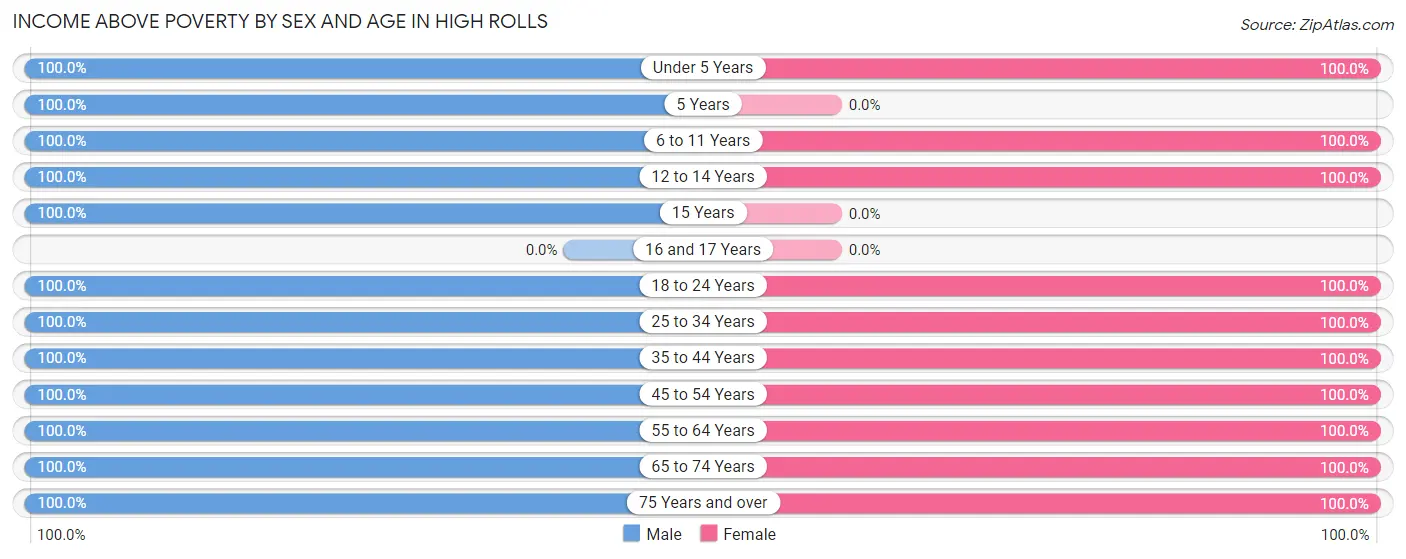
| Age Bracket | Male | Female |
| Under 5 Years | 157 (100.0%) | 107 (100.0%) |
| 5 Years | 32 (100.0%) | 0 (0.0%) |
| 6 to 11 Years | 135 (100.0%) | 78 (100.0%) |
| 12 to 14 Years | 38 (100.0%) | 24 (100.0%) |
| 15 Years | 23 (100.0%) | 0 (0.0%) |
| 16 and 17 Years | 0 (0.0%) | 0 (0.0%) |
| 18 to 24 Years | 30 (100.0%) | 156 (100.0%) |
| 25 to 34 Years | 35 (100.0%) | 51 (100.0%) |
| 35 to 44 Years | 78 (100.0%) | 38 (100.0%) |
| 45 to 54 Years | 31 (100.0%) | 82 (100.0%) |
| 55 to 64 Years | 75 (100.0%) | 49 (100.0%) |
| 65 to 74 Years | 152 (100.0%) | 127 (100.0%) |
| 75 Years and over | 64 (100.0%) | 49 (100.0%) |
| Total | 850 (100.0%) | 761 (100.0%) |
Income Below Poverty Among Married-Couple Families in High Rolls
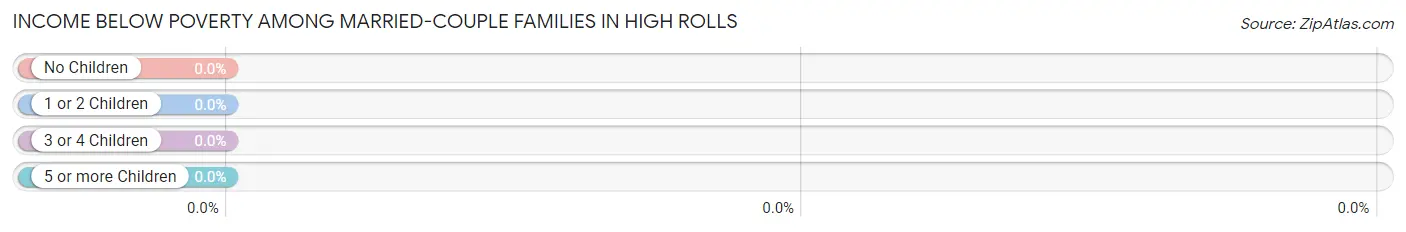
| Children | Above Poverty | Below Poverty |
| No Children | 209 (100.0%) | 0 (0.0%) |
| 1 or 2 Children | 14 (100.0%) | 0 (0.0%) |
| 3 or 4 Children | 48 (100.0%) | 0 (0.0%) |
| 5 or more Children | 29 (100.0%) | 0 (0.0%) |
| Total | 300 (100.0%) | 0 (0.0%) |
Income Below Poverty Among Single-Parent Households in High Rolls
| Children | Single Father | Single Mother |
| No Children | 0 (0.0%) | 0 (0.0%) |
| 1 or 2 Children | 0 (0.0%) | 0 (0.0%) |
| 3 or 4 Children | 0 (0.0%) | 0 (0.0%) |
| 5 or more Children | 0 (0.0%) | 0 (0.0%) |
| Total | 0 (0.0%) | 0 (0.0%) |
Income Below Poverty Among Married-Couple vs Single-Parent Households in High Rolls
| Children | Married-Couple Families | Single-Parent Households |
| No Children | 0 (0.0%) | 0 (0.0%) |
| 1 or 2 Children | 0 (0.0%) | 0 (0.0%) |
| 3 or 4 Children | 0 (0.0%) | 0 (0.0%) |
| 5 or more Children | 0 (0.0%) | 0 (0.0%) |
| Total | 0 (0.0%) | 0 (0.0%) |
Race in High Rolls
The most populous races in High Rolls are White / Caucasian (1,224 | 76.0%), Hispanic or Latino (358 | 22.2%), and Two or more Races (309 | 19.2%).
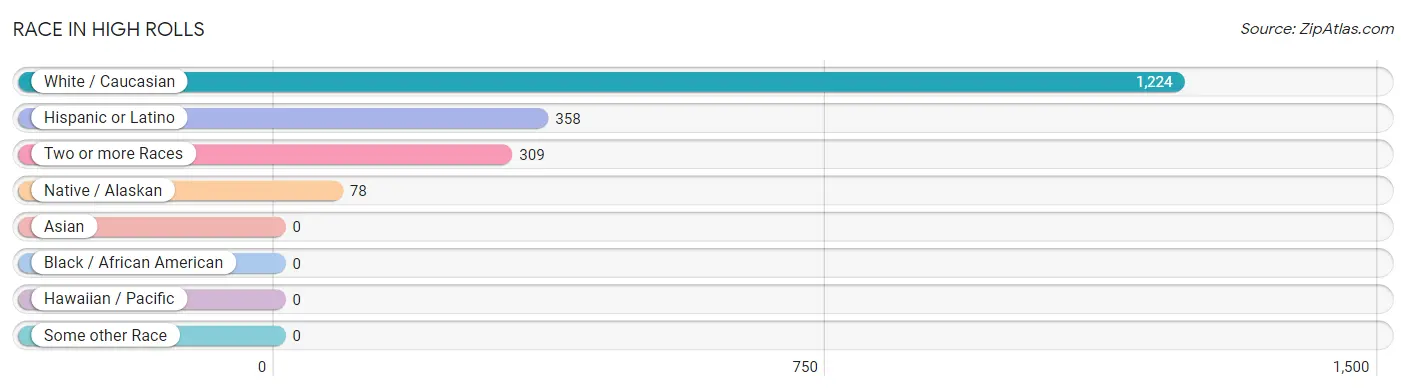
| Race | # Population | % Population |
| Asian | 0 | 0.0% |
| Black / African American | 0 | 0.0% |
| Hawaiian / Pacific | 0 | 0.0% |
| Hispanic or Latino | 358 | 22.2% |
| Native / Alaskan | 78 | 4.8% |
| White / Caucasian | 1,224 | 76.0% |
| Two or more Races | 309 | 19.2% |
| Some other Race | 0 | 0.0% |
| Total | 1,611 | 100.0% |
Ancestry in High Rolls
The most populous ancestries reported in High Rolls are English (329 | 20.4%), Central American Indian (292 | 18.1%), Dominican (292 | 18.1%), American (242 | 15.0%), and German (142 | 8.8%), together accounting for 80.5% of all High Rolls residents.
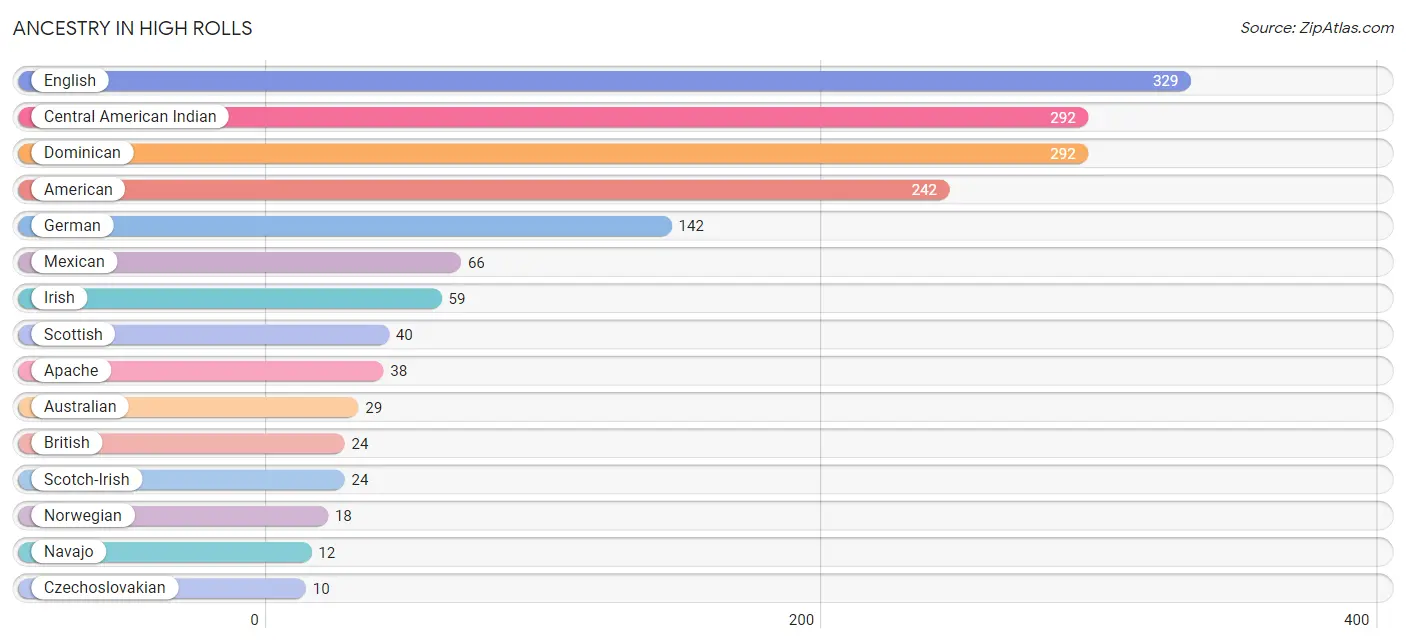
| Ancestry | # Population | % Population |
| American | 242 | 15.0% |
| Apache | 38 | 2.4% |
| Australian | 29 | 1.8% |
| British | 24 | 1.5% |
| Central American Indian | 292 | 18.1% |
| Czechoslovakian | 10 | 0.6% |
| Dominican | 292 | 18.1% |
| English | 329 | 20.4% |
| German | 142 | 8.8% |
| Irish | 59 | 3.7% |
| Lithuanian | 10 | 0.6% |
| Mexican | 66 | 4.1% |
| Navajo | 12 | 0.7% |
| Norwegian | 18 | 1.1% |
| Scotch-Irish | 24 | 1.5% |
| Scottish | 40 | 2.5% | View All 16 Rows |
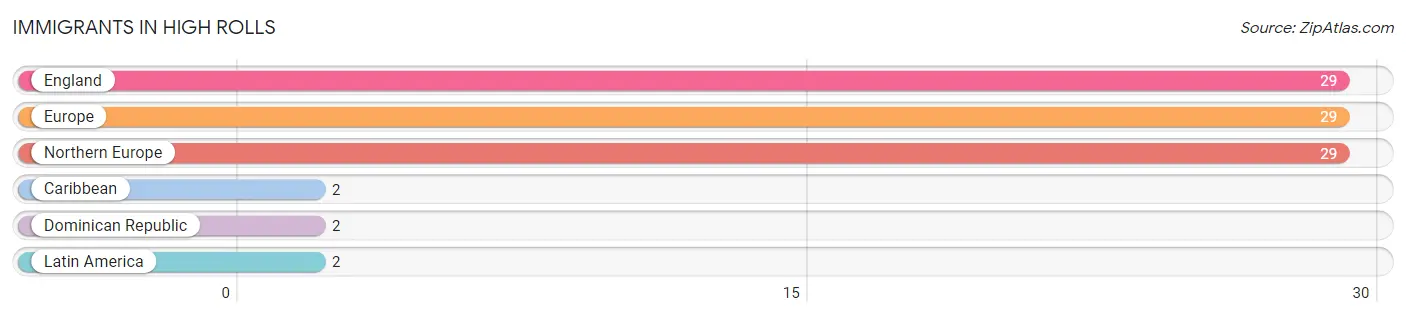
Immigrants in High Rolls
The most numerous immigrant groups reported in High Rolls came from England (29 | 1.8%), Europe (29 | 1.8%), Northern Europe (29 | 1.8%), Caribbean (2 | 0.1%), and Dominican Republic (2 | 0.1%), together accounting for 5.6% of all High Rolls residents.
| Immigration Origin | # Population | % Population |
| Caribbean | 2 | 0.1% |
| Dominican Republic | 2 | 0.1% |
| England | 29 | 1.8% |
| Europe | 29 | 1.8% |
| Latin America | 2 | 0.1% |
| Northern Europe | 29 | 1.8% | View All 6 Rows |
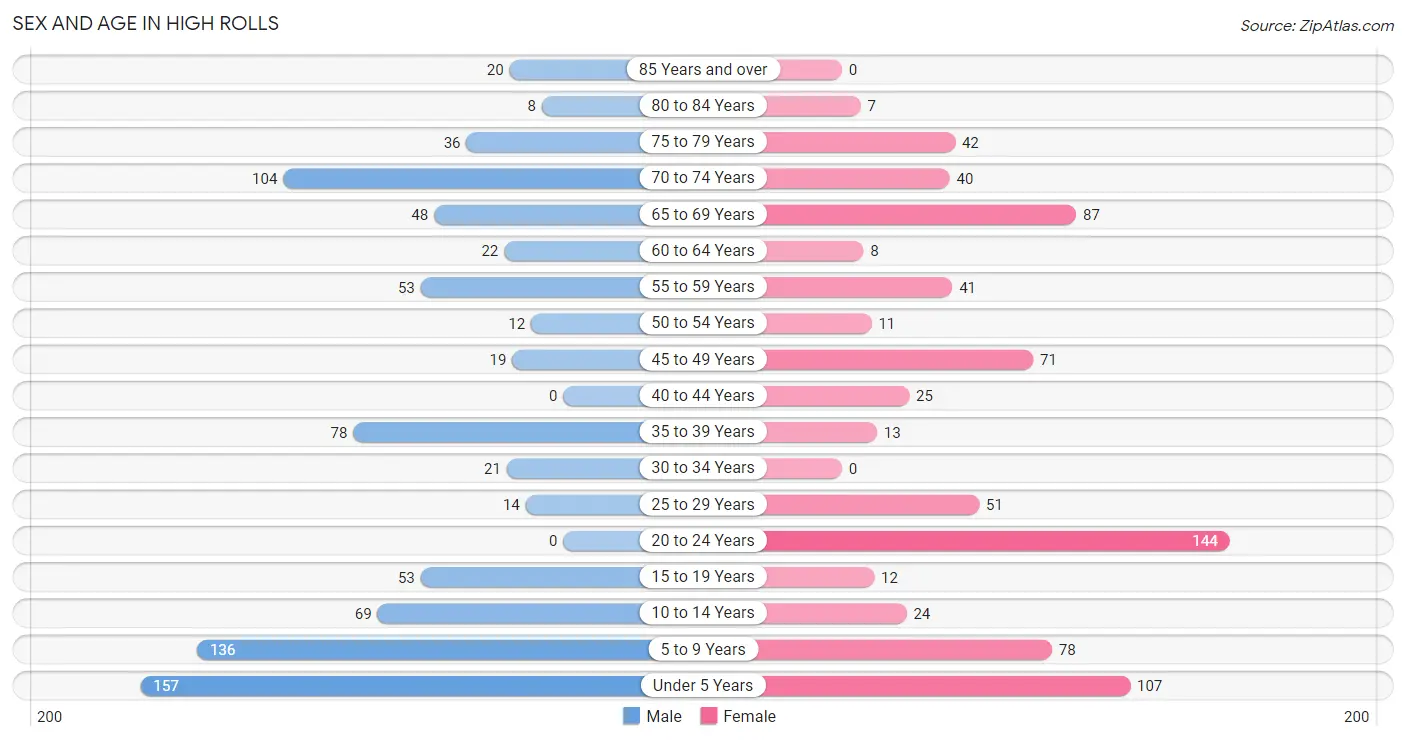
Sex and Age in High Rolls
Sex and Age in High Rolls
The most populous age groups in High Rolls are Under 5 Years (157 | 18.5%) for men and 20 to 24 Years (144 | 18.9%) for women.
| Age Bracket | Male | Female |
| Under 5 Years | 157 (18.5%) | 107 (14.1%) |
| 5 to 9 Years | 136 (16.0%) | 78 (10.2%) |
| 10 to 14 Years | 69 (8.1%) | 24 (3.2%) |
| 15 to 19 Years | 53 (6.2%) | 12 (1.6%) |
| 20 to 24 Years | 0 (0.0%) | 144 (18.9%) |
| 25 to 29 Years | 14 (1.7%) | 51 (6.7%) |
| 30 to 34 Years | 21 (2.5%) | 0 (0.0%) |
| 35 to 39 Years | 78 (9.2%) | 13 (1.7%) |
| 40 to 44 Years | 0 (0.0%) | 25 (3.3%) |
| 45 to 49 Years | 19 (2.2%) | 71 (9.3%) |
| 50 to 54 Years | 12 (1.4%) | 11 (1.5%) |
| 55 to 59 Years | 53 (6.2%) | 41 (5.4%) |
| 60 to 64 Years | 22 (2.6%) | 8 (1.1%) |
| 65 to 69 Years | 48 (5.7%) | 87 (11.4%) |
| 70 to 74 Years | 104 (12.2%) | 40 (5.3%) |
| 75 to 79 Years | 36 (4.2%) | 42 (5.5%) |
| 80 to 84 Years | 8 (0.9%) | 7 (0.9%) |
| 85 Years and over | 20 (2.4%) | 0 (0.0%) |
| Total | 850 (100.0%) | 761 (100.0%) |
Families and Households in High Rolls
Median Family Size in High Rolls
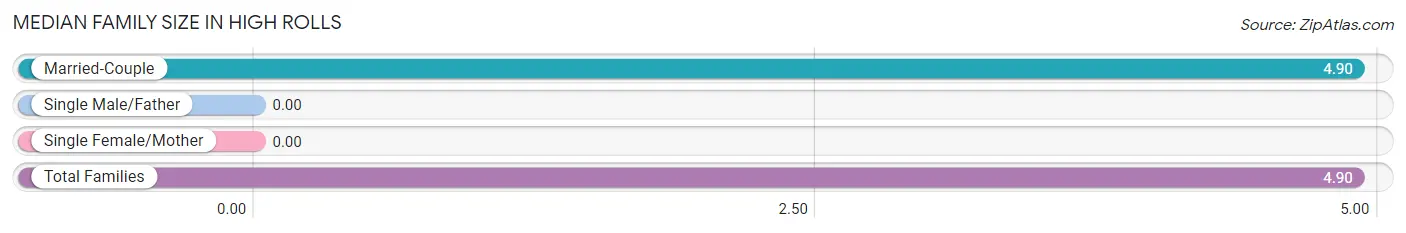
| Family Type | # Families | Family Size |
| Married-Couple | 300 (100.0%) | 4.90 |
| Single Male/Father | 0 (0.0%) | - |
| Single Female/Mother | 0 (0.0%) | - |
| Total Families | 300 (100.0%) | 4.90 |
Median Household Size in High Rolls
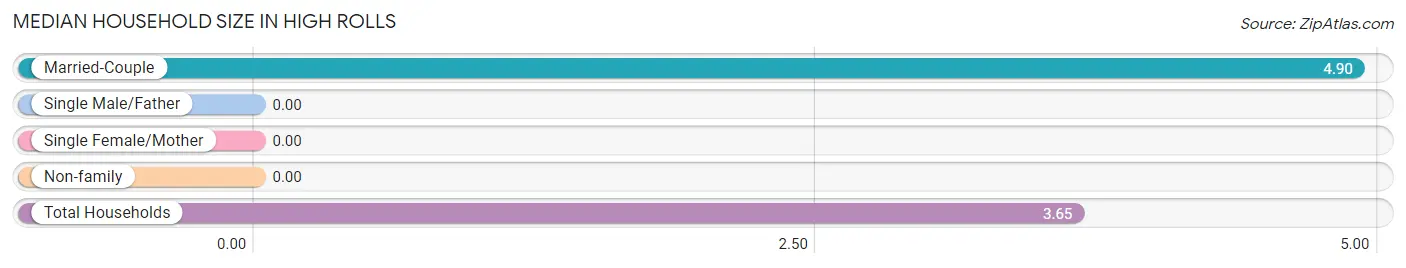
| Household Type | # Households | Household Size |
| Married-Couple | 300 (68.0%) | 4.90 |
| Single Male/Father | 0 (0.0%) | - |
| Single Female/Mother | 0 (0.0%) | - |
| Non-family | 141 (32.0%) | - |
| Total Households | 441 (100.0%) | 3.65 |
Household Size by Marriage Status in High Rolls
Out of a total of 441 households in High Rolls, 300 (68.0%) are family households, while 141 (32.0%) are nonfamily households. The most numerous type of family households are 2-person households, comprising 163, and the most common type of nonfamily households are 1-person households, comprising 141.
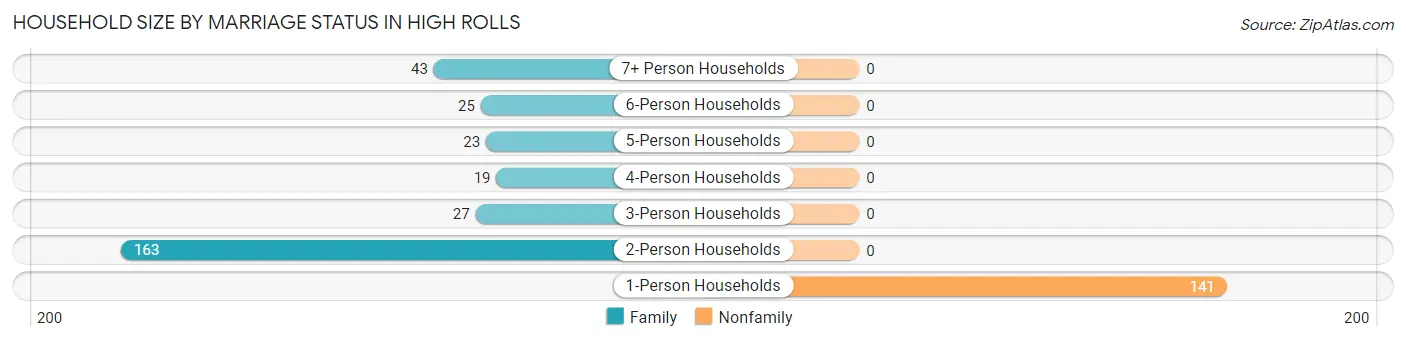
| Household Size | Family Households | Nonfamily Households |
| 1-Person Households | - | 141 (32.0%) |
| 2-Person Households | 163 (37.0%) | 0 (0.0%) |
| 3-Person Households | 27 (6.1%) | 0 (0.0%) |
| 4-Person Households | 19 (4.3%) | 0 (0.0%) |
| 5-Person Households | 23 (5.2%) | 0 (0.0%) |
| 6-Person Households | 25 (5.7%) | 0 (0.0%) |
| 7+ Person Households | 43 (9.8%) | 0 (0.0%) |
| Total | 300 (68.0%) | 141 (32.0%) |
Female Fertility in High Rolls
Fertility by Age in High Rolls
| Age Bracket | Women with Births | Births / 1,000 Women |
| 15 to 19 years | 0 (0.0%) | 0.0 |
| 20 to 34 years | 0 (0.0%) | 0.0 |
| 35 to 50 years | 0 (0.0%) | 0.0 |
| Total | 0 (0.0%) | 0.0 |
Fertility by Age by Marriage Status in High Rolls
| Age Bracket | Married | Unmarried |
| 15 to 19 years | 0 (0.0%) | 0 (0.0%) |
| 20 to 34 years | 0 (0.0%) | 0 (0.0%) |
| 35 to 50 years | 0 (0.0%) | 0 (0.0%) |
| Total | 0 (0.0%) | 0 (0.0%) |
Fertility by Education in High Rolls
| Educational Attainment | Women with Births | Births / 1,000 Women |
| Less than High School | 0 (0.0%) | 0.0 |
| High School Diploma | 0 (0.0%) | 0.0 |
| College or Associate's Degree | 0 (0.0%) | 0.0 |
| Bachelor's Degree | 0 (0.0%) | 0.0 |
| Graduate Degree | 0 (0.0%) | 0.0 |
| Total | 0 (0.0%) | 0.0 |
Fertility by Education by Marriage Status in High Rolls
| Educational Attainment | Married | Unmarried |
| Less than High School | 0 (0.0%) | 0 (0.0%) |
| High School Diploma | 0 (0.0%) | 0 (0.0%) |
| College or Associate's Degree | 0 (0.0%) | 0 (0.0%) |
| Bachelor's Degree | 0 (0.0%) | 0 (0.0%) |
| Graduate Degree | 0 (0.0%) | 0 (0.0%) |
| Total | 0 (0.0%) | 0 (0.0%) |
Employment Characteristics in High Rolls
Employment by Class of Employer in High Rolls
Among the 428 employed individuals in High Rolls, private company employees (207 | 48.4%), local government employees (98 | 22.9%), and self-employed (not incorporated) (39 | 9.1%) make up the most common classes of employment.
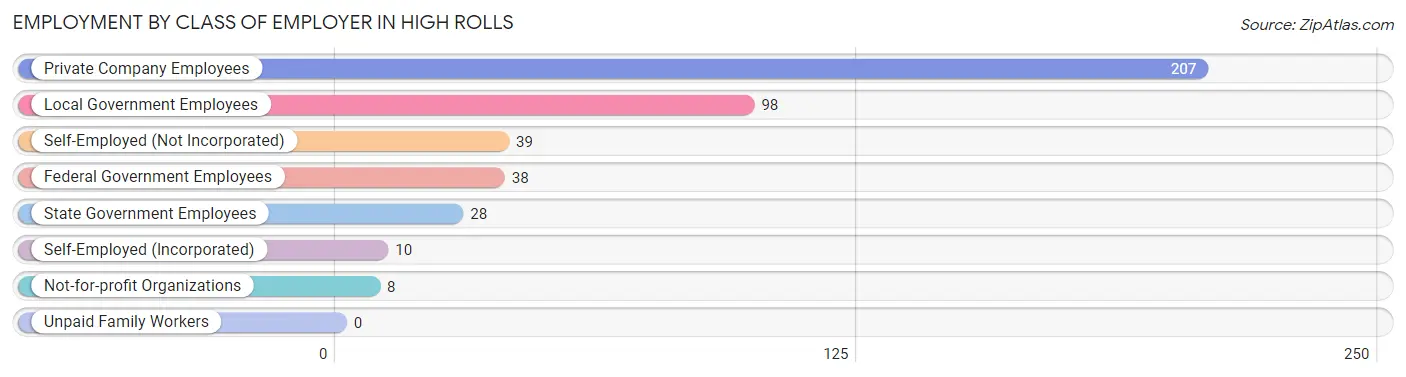
| Employer Class | # Employees | % Employees |
| Private Company Employees | 207 | 48.4% |
| Self-Employed (Incorporated) | 10 | 2.3% |
| Self-Employed (Not Incorporated) | 39 | 9.1% |
| Not-for-profit Organizations | 8 | 1.9% |
| Local Government Employees | 98 | 22.9% |
| State Government Employees | 28 | 6.5% |
| Federal Government Employees | 38 | 8.9% |
| Unpaid Family Workers | 0 | 0.0% |
| Total | 428 | 100.0% |
Employment Status by Age in High Rolls

| Age Bracket | In Labor Force | Unemployed |
| 16 to 19 Years | 12 (28.6%) | 0 (0.0%) |
| 20 to 24 Years | 67 (46.5%) | 0 (0.0%) |
| 25 to 29 Years | 40 (61.5%) | 0 (0.0%) |
| 30 to 34 Years | 21 (100.0%) | 0 (0.0%) |
| 35 to 44 Years | 38 (32.8%) | 0 (0.0%) |
| 45 to 54 Years | 111 (98.2%) | 0 (0.0%) |
| 55 to 59 Years | 94 (100.0%) | 0 (0.0%) |
| 60 to 64 Years | 30 (100.0%) | 0 (0.0%) |
| 65 to 74 Years | 37 (13.3%) | 0 (0.0%) |
| 75 Years and over | 7 (6.2%) | 0 (0.0%) |
| Total | 457 (44.9%) | 0 (0.0%) |
Employment Status by Educational Attainment in High Rolls
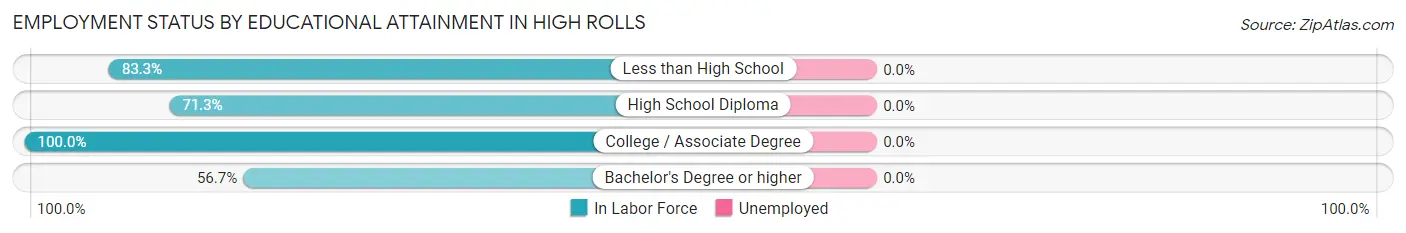
| Educational Attainment | In Labor Force | Unemployed |
| Less than High School | 10 (83.3%) | 0 (0.0%) |
| High School Diploma | 62 (71.3%) | 0 (0.0%) |
| College / Associate Degree | 160 (100.0%) | 0 (0.0%) |
| Bachelor's Degree or higher | 102 (56.7%) | 0 (0.0%) |
| Total | 334 (76.1%) | 0 (0.0%) |
Employment Occupations by Sex in High Rolls
Management, Business, Science and Arts Occupations
The most common Management, Business, Science and Arts occupations in High Rolls are Community & Social Service (128 | 28.0%), Education Instruction & Library (110 | 24.1%), Health Diagnosing & Treating (46 | 10.1%), Health Technologists (46 | 10.1%), and Management (37 | 8.1%).
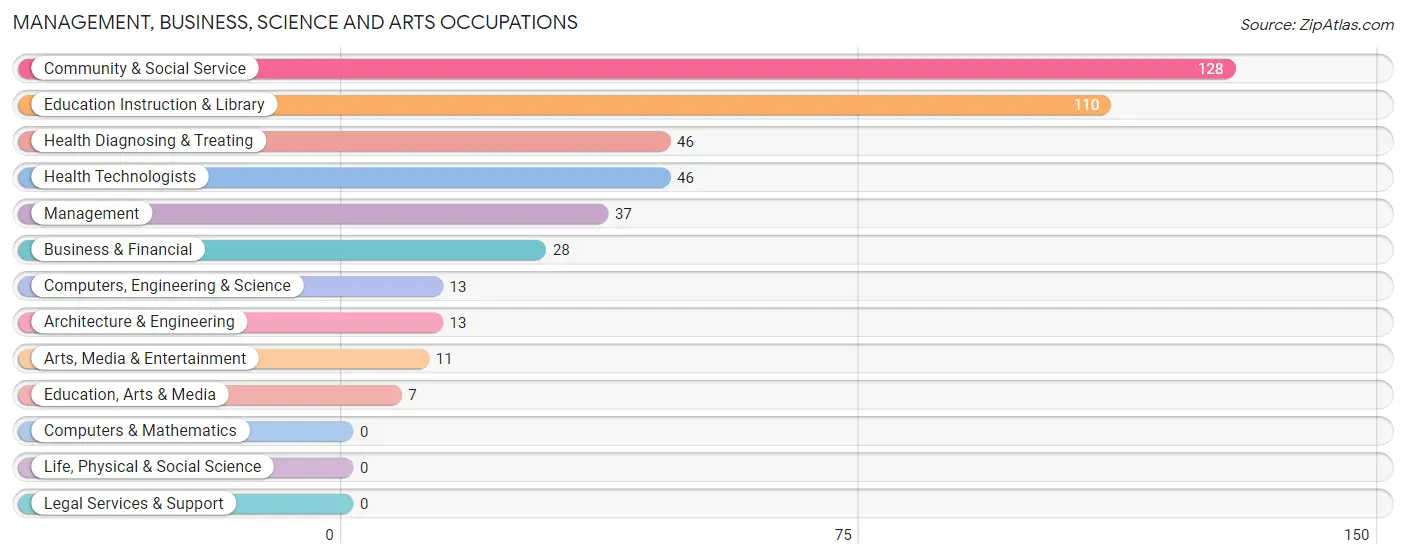
Management, Business, Science and Arts Occupations by Sex
Within the Management, Business, Science and Arts occupations in High Rolls, the most male-oriented occupations are Management (100.0%), Business & Financial (100.0%), and Computers, Engineering & Science (100.0%), while the most female-oriented occupations are Education, Arts & Media (100.0%), Arts, Media & Entertainment (100.0%), and Health Diagnosing & Treating (100.0%).
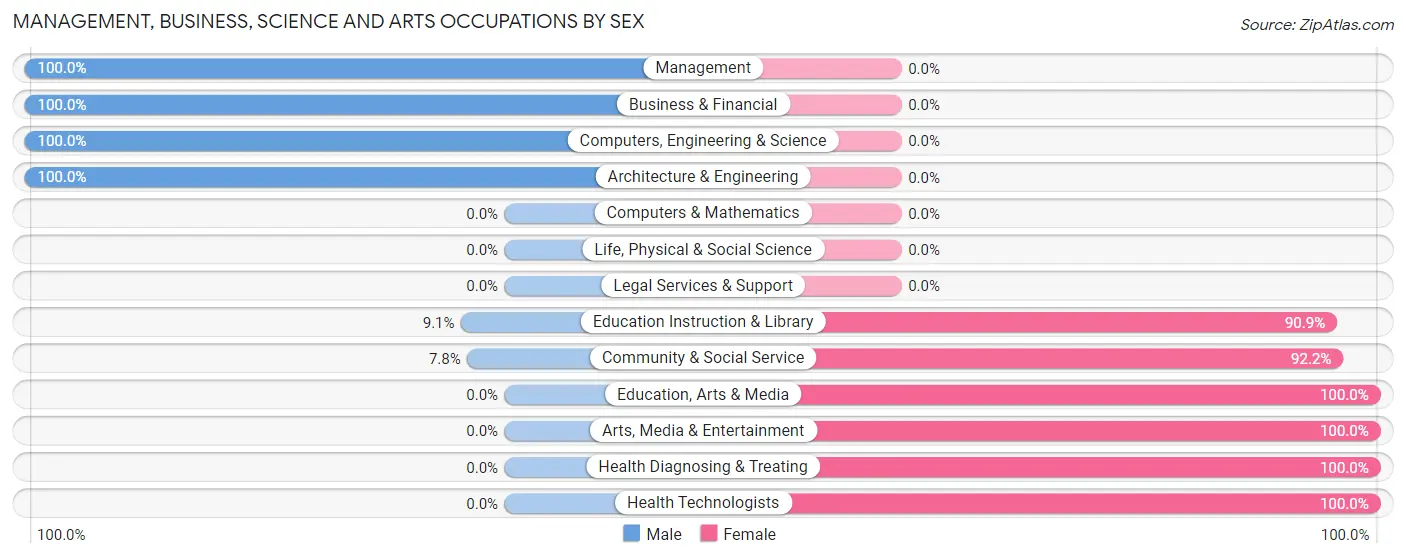
| Occupation | Male | Female |
| Management | 37 (100.0%) | 0 (0.0%) |
| Business & Financial | 28 (100.0%) | 0 (0.0%) |
| Computers, Engineering & Science | 13 (100.0%) | 0 (0.0%) |
| Computers & Mathematics | 0 (0.0%) | 0 (0.0%) |
| Architecture & Engineering | 13 (100.0%) | 0 (0.0%) |
| Life, Physical & Social Science | 0 (0.0%) | 0 (0.0%) |
| Community & Social Service | 10 (7.8%) | 118 (92.2%) |
| Education, Arts & Media | 0 (0.0%) | 7 (100.0%) |
| Legal Services & Support | 0 (0.0%) | 0 (0.0%) |
| Education Instruction & Library | 10 (9.1%) | 100 (90.9%) |
| Arts, Media & Entertainment | 0 (0.0%) | 11 (100.0%) |
| Health Diagnosing & Treating | 0 (0.0%) | 46 (100.0%) |
| Health Technologists | 0 (0.0%) | 46 (100.0%) |
| Total (Category) | 88 (34.9%) | 164 (65.1%) |
| Total (Overall) | 170 (37.2%) | 287 (62.8%) |
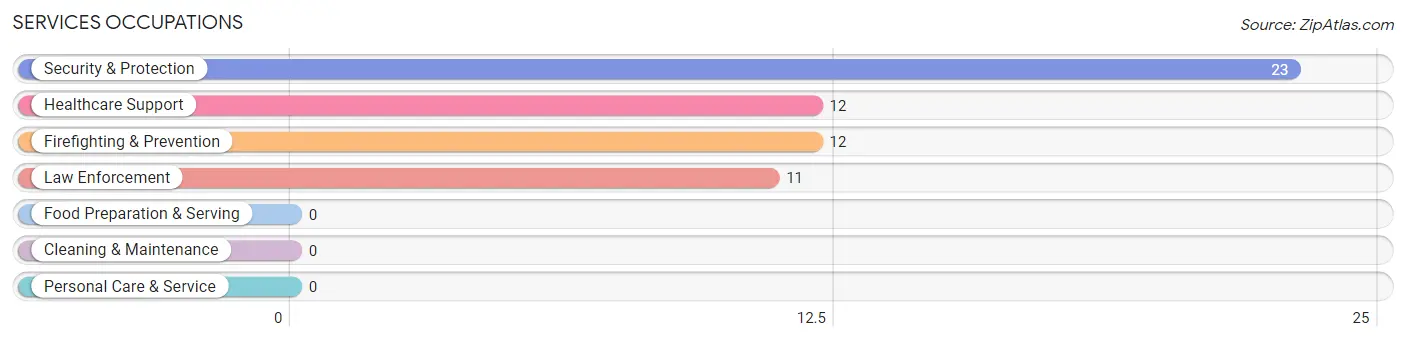
Services Occupations
The most common Services occupations in High Rolls are Security & Protection (23 | 5.0%), Healthcare Support (12 | 2.6%), Firefighting & Prevention (12 | 2.6%), and Law Enforcement (11 | 2.4%).
Services Occupations by Sex
Within the Services occupations in High Rolls, the most male-oriented occupations are Law Enforcement (100.0%), and Security & Protection (47.8%), while the most female-oriented occupations are Healthcare Support (100.0%), Firefighting & Prevention (100.0%), and Security & Protection (52.2%).
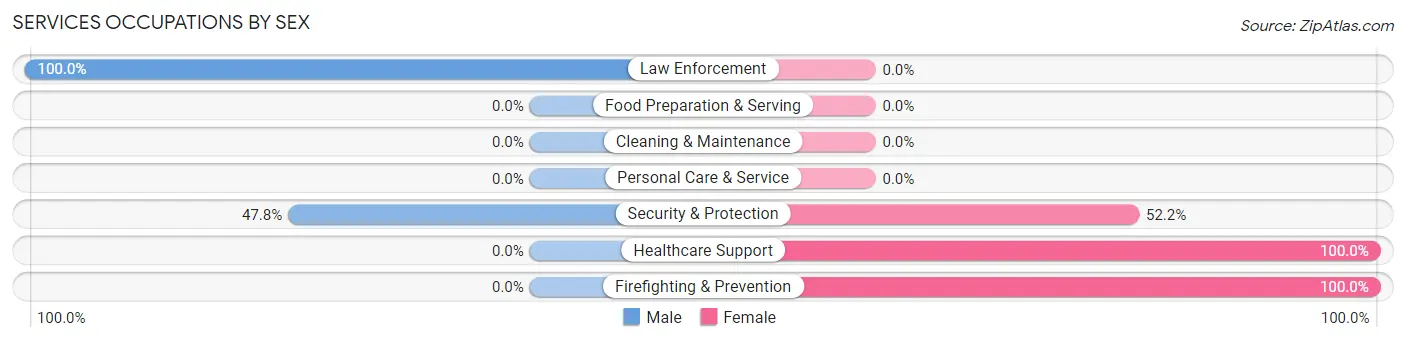
| Occupation | Male | Female |
| Healthcare Support | 0 (0.0%) | 12 (100.0%) |
| Security & Protection | 11 (47.8%) | 12 (52.2%) |
| Firefighting & Prevention | 0 (0.0%) | 12 (100.0%) |
| Law Enforcement | 11 (100.0%) | 0 (0.0%) |
| Food Preparation & Serving | 0 (0.0%) | 0 (0.0%) |
| Cleaning & Maintenance | 0 (0.0%) | 0 (0.0%) |
| Personal Care & Service | 0 (0.0%) | 0 (0.0%) |
| Total (Category) | 11 (31.4%) | 24 (68.6%) |
| Total (Overall) | 170 (37.2%) | 287 (62.8%) |
Sales and Office Occupations
The most common Sales and Office occupations in High Rolls are , and Sales & Related (86 | 18.8%).
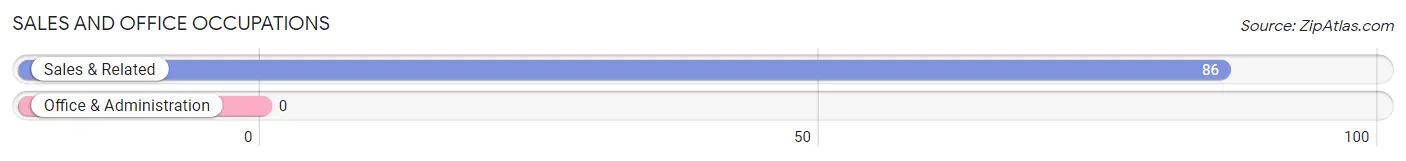
Sales and Office Occupations by Sex
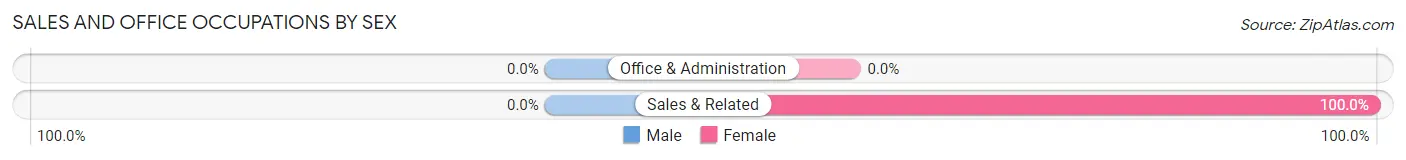
| Occupation | Male | Female |
| Sales & Related | 0 (0.0%) | 86 (100.0%) |
| Office & Administration | 0 (0.0%) | 0 (0.0%) |
| Total (Category) | 0 (0.0%) | 86 (100.0%) |
| Total (Overall) | 170 (37.2%) | 287 (62.8%) |
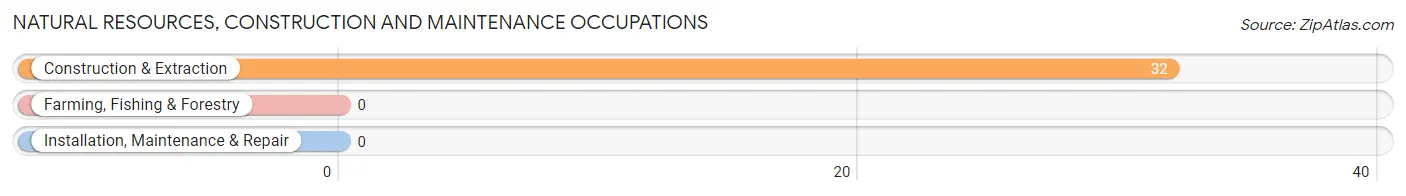
Natural Resources, Construction and Maintenance Occupations
The most common Natural Resources, Construction and Maintenance occupations in High Rolls are , and Construction & Extraction (32 | 7.0%).
Natural Resources, Construction and Maintenance Occupations by Sex
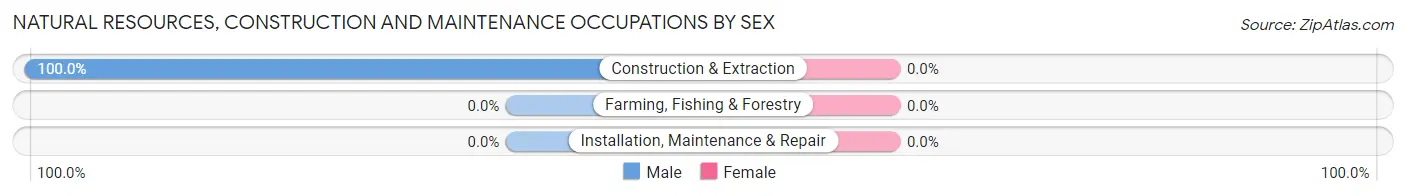
| Occupation | Male | Female |
| Farming, Fishing & Forestry | 0 (0.0%) | 0 (0.0%) |
| Construction & Extraction | 32 (100.0%) | 0 (0.0%) |
| Installation, Maintenance & Repair | 0 (0.0%) | 0 (0.0%) |
| Total (Category) | 32 (100.0%) | 0 (0.0%) |
| Total (Overall) | 170 (37.2%) | 287 (62.8%) |
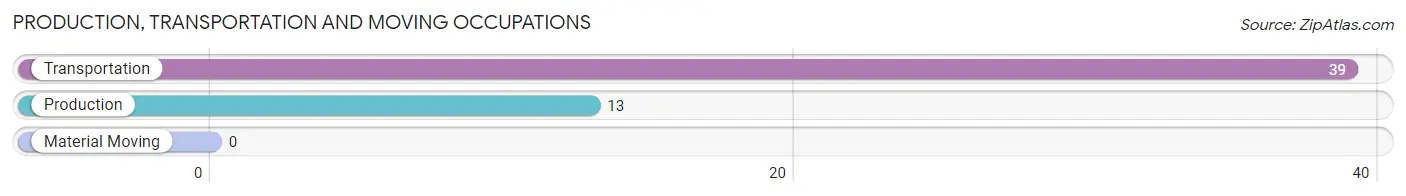
Production, Transportation and Moving Occupations
The most common Production, Transportation and Moving occupations in High Rolls are Transportation (39 | 8.5%), and Production (13 | 2.8%).
Production, Transportation and Moving Occupations by Sex
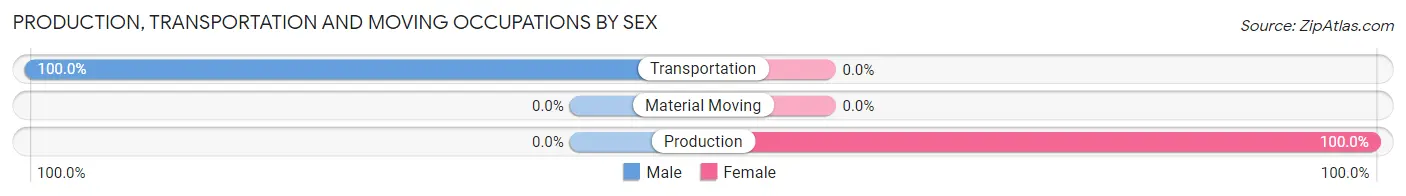
| Occupation | Male | Female |
| Production | 0 (0.0%) | 13 (100.0%) |
| Transportation | 39 (100.0%) | 0 (0.0%) |
| Material Moving | 0 (0.0%) | 0 (0.0%) |
| Total (Category) | 39 (75.0%) | 13 (25.0%) |
| Total (Overall) | 170 (37.2%) | 287 (62.8%) |
Employment Industries by Sex in High Rolls
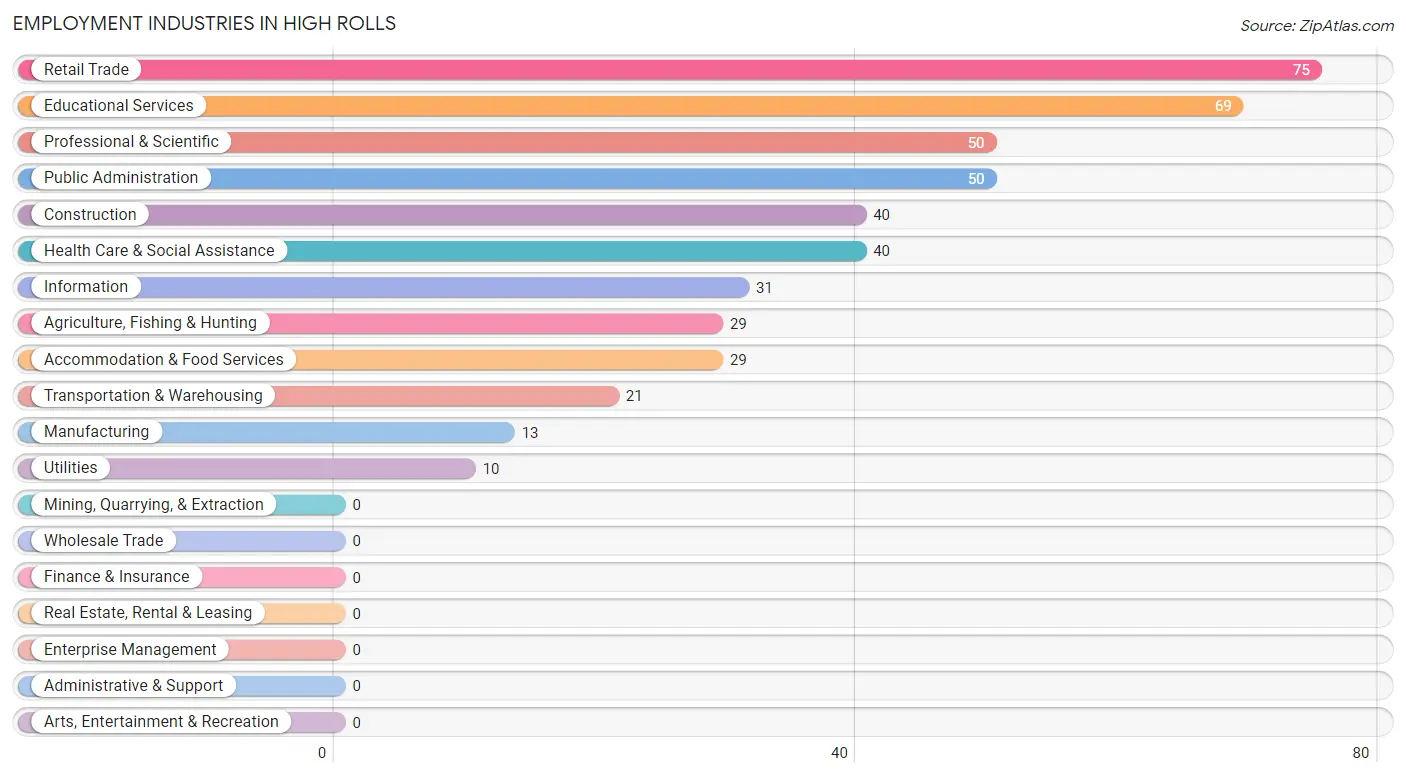
Employment Industries in High Rolls
The major employment industries in High Rolls include Retail Trade (75 | 16.4%), Educational Services (69 | 15.1%), Professional & Scientific (50 | 10.9%), Public Administration (50 | 10.9%), and Construction (40 | 8.7%).
Employment Industries by Sex in High Rolls
The High Rolls industries that see more men than women are Agriculture, Fishing & Hunting (100.0%), Construction (100.0%), and Transportation & Warehousing (100.0%), whereas the industries that tend to have a higher number of women are Manufacturing (100.0%), Information (100.0%), and Educational Services (100.0%).
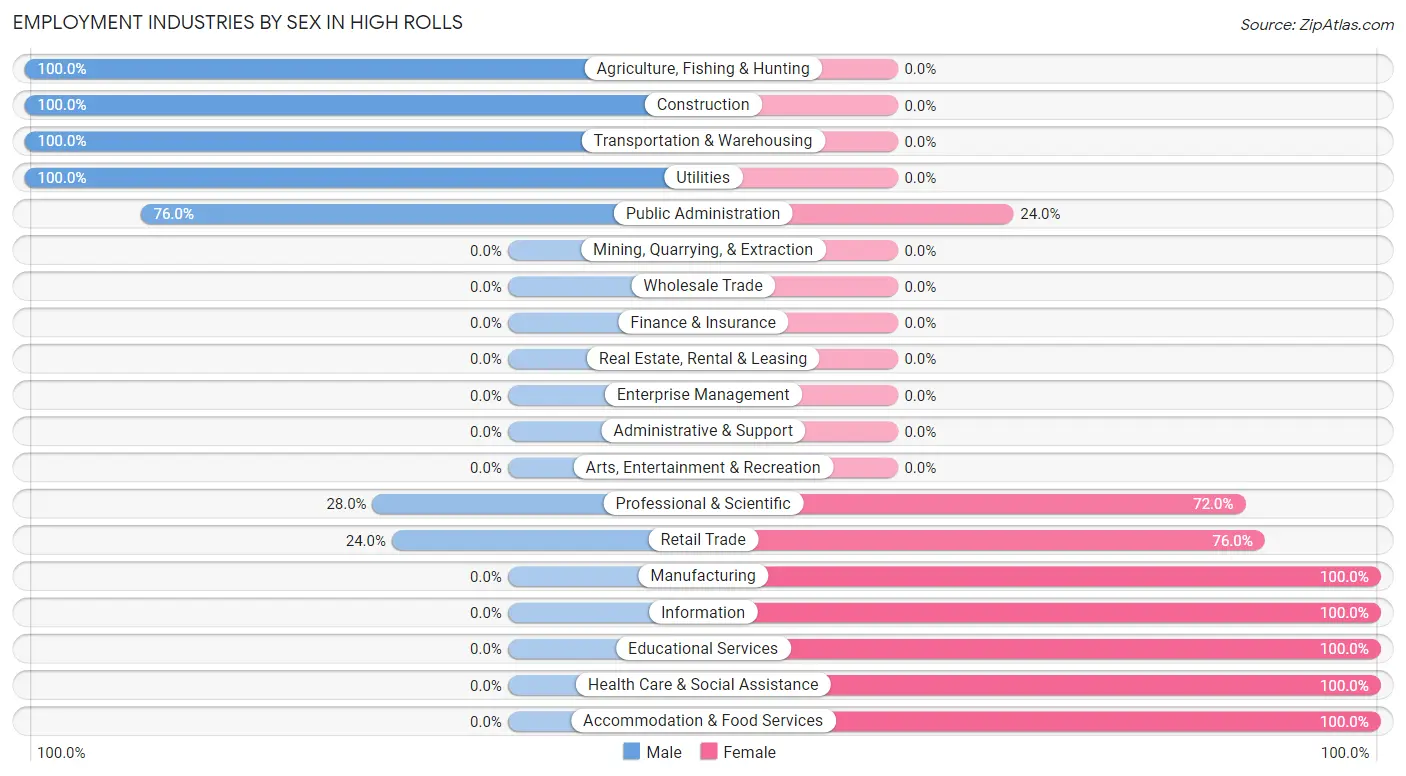
| Industry | Male | Female |
| Agriculture, Fishing & Hunting | 29 (100.0%) | 0 (0.0%) |
| Mining, Quarrying, & Extraction | 0 (0.0%) | 0 (0.0%) |
| Construction | 40 (100.0%) | 0 (0.0%) |
| Manufacturing | 0 (0.0%) | 13 (100.0%) |
| Wholesale Trade | 0 (0.0%) | 0 (0.0%) |
| Retail Trade | 18 (24.0%) | 57 (76.0%) |
| Transportation & Warehousing | 21 (100.0%) | 0 (0.0%) |
| Utilities | 10 (100.0%) | 0 (0.0%) |
| Information | 0 (0.0%) | 31 (100.0%) |
| Finance & Insurance | 0 (0.0%) | 0 (0.0%) |
| Real Estate, Rental & Leasing | 0 (0.0%) | 0 (0.0%) |
| Professional & Scientific | 14 (28.0%) | 36 (72.0%) |
| Enterprise Management | 0 (0.0%) | 0 (0.0%) |
| Administrative & Support | 0 (0.0%) | 0 (0.0%) |
| Educational Services | 0 (0.0%) | 69 (100.0%) |
| Health Care & Social Assistance | 0 (0.0%) | 40 (100.0%) |
| Arts, Entertainment & Recreation | 0 (0.0%) | 0 (0.0%) |
| Accommodation & Food Services | 0 (0.0%) | 29 (100.0%) |
| Public Administration | 38 (76.0%) | 12 (24.0%) |
| Total | 170 (37.2%) | 287 (62.8%) |
Education in High Rolls
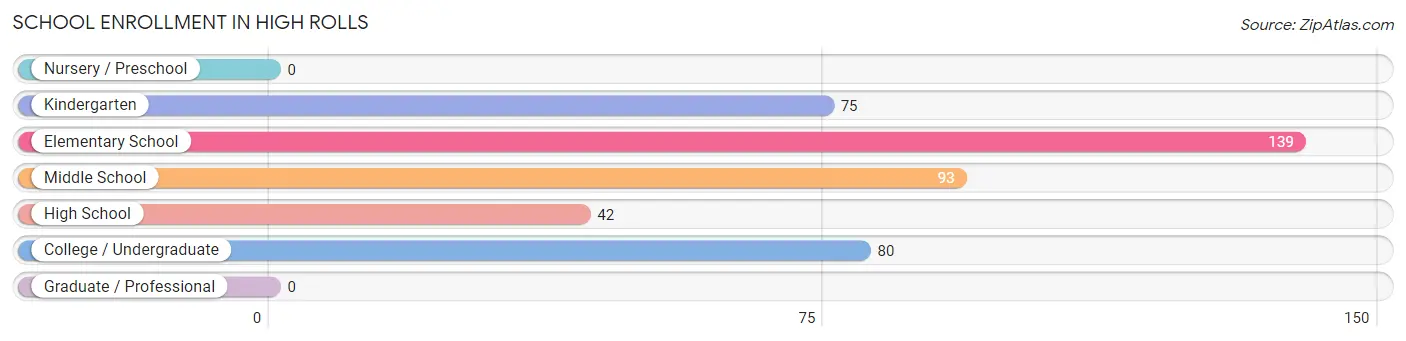
School Enrollment in High Rolls
The most common levels of schooling among the 429 students in High Rolls are elementary school (139 | 32.4%), middle school (93 | 21.7%), and college / undergraduate (80 | 18.6%).
| School Level | # Students | % Students |
| Nursery / Preschool | 0 | 0.0% |
| Kindergarten | 75 | 17.5% |
| Elementary School | 139 | 32.4% |
| Middle School | 93 | 21.7% |
| High School | 42 | 9.8% |
| College / Undergraduate | 80 | 18.6% |
| Graduate / Professional | 0 | 0.0% |
| Total | 429 | 100.0% |
School Enrollment by Age by Funding Source in High Rolls
Out of a total of 429 students who are enrolled in schools in High Rolls, 47 (11.0%) attend a private institution, while the remaining 382 (89.0%) are enrolled in public schools. The age group of 15 to 17 year olds has the highest likelihood of being enrolled in private schools, with 23 (100.0% in the age bracket) enrolled. Conversely, the age group of 5 to 9 year old has the lowest likelihood of being enrolled in a private school, with 214 (100.0% in the age bracket) attending a public institution.
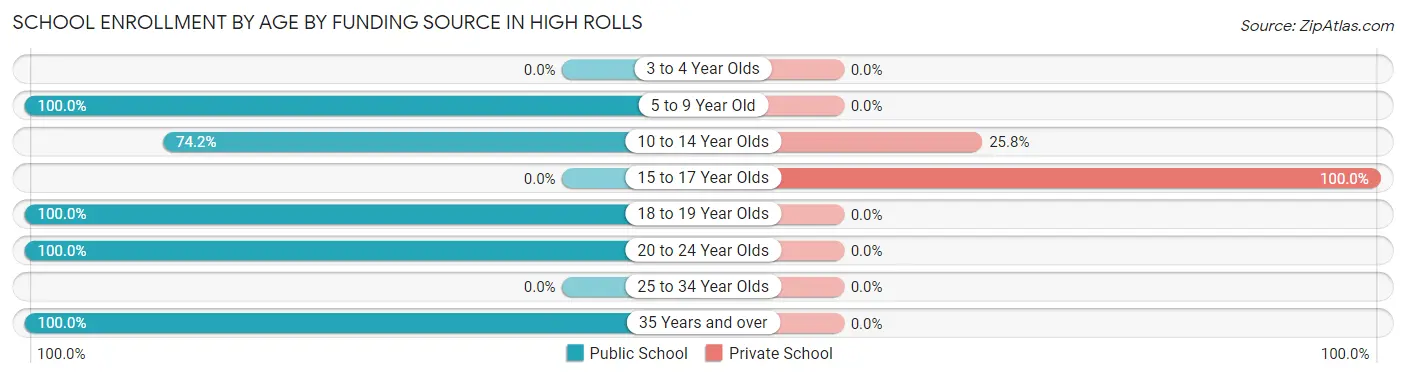
| Age Bracket | Public School | Private School |
| 3 to 4 Year Olds | 0 (0.0%) | 0 (0.0%) |
| 5 to 9 Year Old | 214 (100.0%) | 0 (0.0%) |
| 10 to 14 Year Olds | 69 (74.2%) | 24 (25.8%) |
| 15 to 17 Year Olds | 0 (0.0%) | 23 (100.0%) |
| 18 to 19 Year Olds | 12 (100.0%) | 0 (0.0%) |
| 20 to 24 Year Olds | 55 (100.0%) | 0 (0.0%) |
| 25 to 34 Year Olds | 0 (0.0%) | 0 (0.0%) |
| 35 Years and over | 32 (100.0%) | 0 (0.0%) |
| Total | 382 (89.0%) | 47 (11.0%) |
Educational Attainment by Field of Study in High Rolls
Education (106 | 25.5%), bio, nature & agricultural (82 | 19.7%), computers & mathematics (65 | 15.6%), engineering (57 | 13.7%), and science & technology (47 | 11.3%) are the most common fields of study among 416 individuals in High Rolls who have obtained a bachelor's degree or higher.
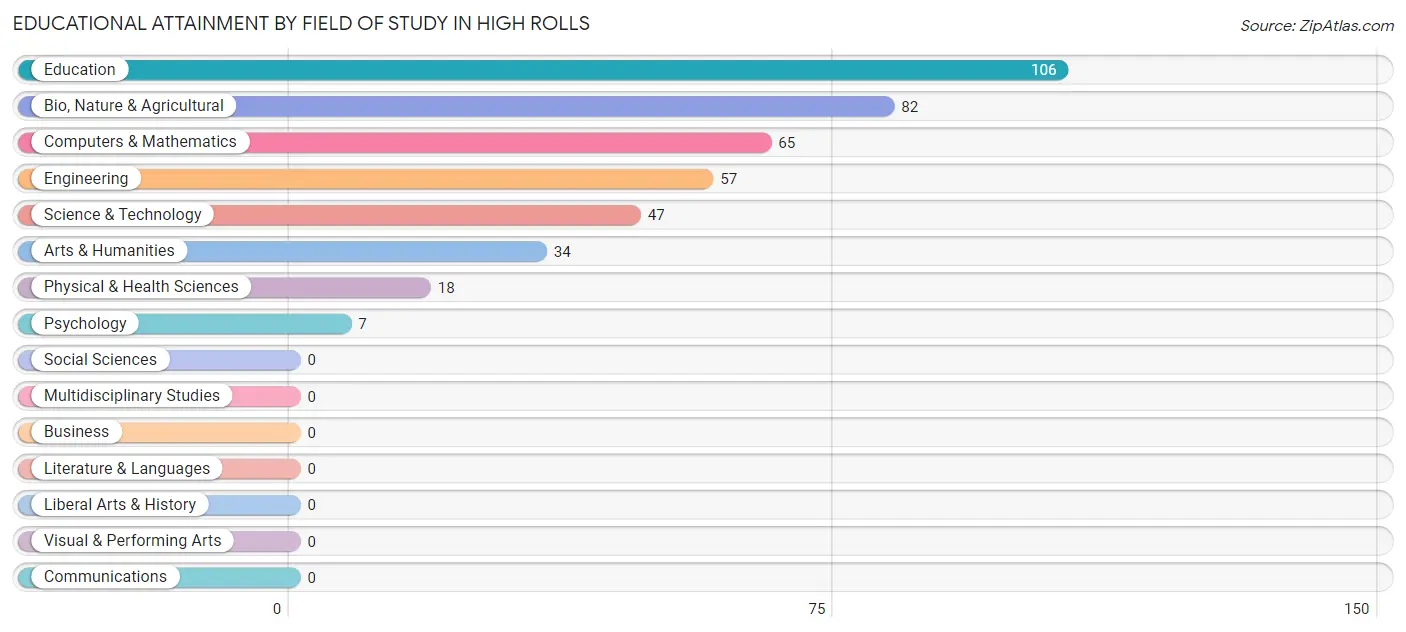
| Field of Study | # Graduates | % Graduates |
| Computers & Mathematics | 65 | 15.6% |
| Bio, Nature & Agricultural | 82 | 19.7% |
| Physical & Health Sciences | 18 | 4.3% |
| Psychology | 7 | 1.7% |
| Social Sciences | 0 | 0.0% |
| Engineering | 57 | 13.7% |
| Multidisciplinary Studies | 0 | 0.0% |
| Science & Technology | 47 | 11.3% |
| Business | 0 | 0.0% |
| Education | 106 | 25.5% |
| Literature & Languages | 0 | 0.0% |
| Liberal Arts & History | 0 | 0.0% |
| Visual & Performing Arts | 0 | 0.0% |
| Communications | 0 | 0.0% |
| Arts & Humanities | 34 | 8.2% |
| Total | 416 | 100.0% |
Transportation & Commute in High Rolls
Vehicle Availability by Sex in High Rolls
The most prevalent vehicle ownership categories in High Rolls are males with 2 vehicles (68, accounting for 40.0%) and females with 2 vehicles (66, making up 26.4%).
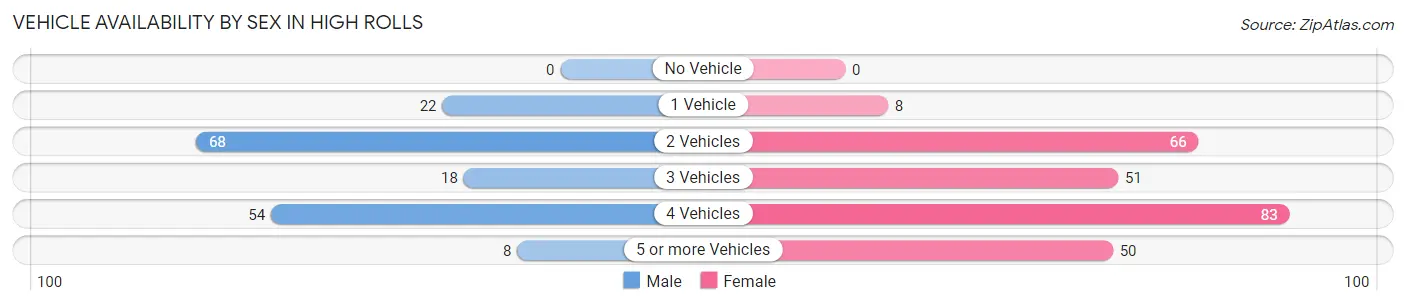
| Vehicles Available | Male | Female |
| No Vehicle | 0 (0.0%) | 0 (0.0%) |
| 1 Vehicle | 22 (12.9%) | 8 (3.1%) |
| 2 Vehicles | 68 (40.0%) | 66 (25.6%) |
| 3 Vehicles | 18 (10.6%) | 51 (19.8%) |
| 4 Vehicles | 54 (31.8%) | 83 (32.2%) |
| 5 or more Vehicles | 8 (4.7%) | 50 (19.4%) |
| Total | 170 (100.0%) | 258 (100.0%) |
Commute Time in High Rolls
The most frequently occuring commute durations in High Rolls are 30 to 34 minutes (131 commuters, 31.1%), 10 to 14 minutes (56 commuters, 13.3%), and 20 to 24 minutes (43 commuters, 10.2%).
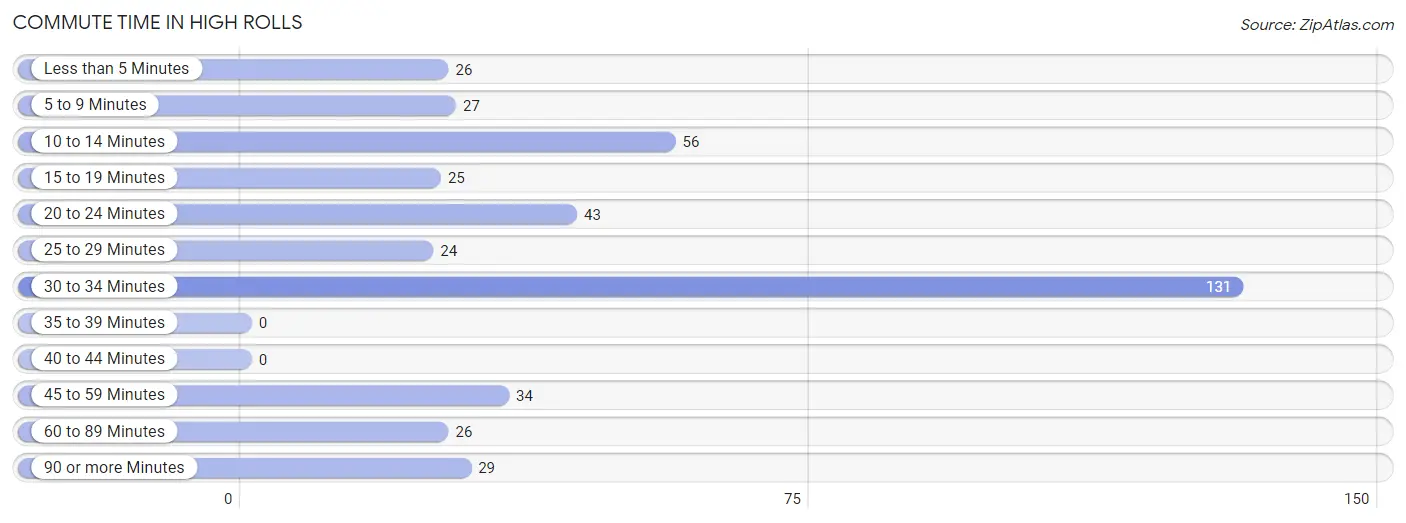
| Commute Time | # Commuters | % Commuters |
| Less than 5 Minutes | 26 | 6.2% |
| 5 to 9 Minutes | 27 | 6.4% |
| 10 to 14 Minutes | 56 | 13.3% |
| 15 to 19 Minutes | 25 | 5.9% |
| 20 to 24 Minutes | 43 | 10.2% |
| 25 to 29 Minutes | 24 | 5.7% |
| 30 to 34 Minutes | 131 | 31.1% |
| 35 to 39 Minutes | 0 | 0.0% |
| 40 to 44 Minutes | 0 | 0.0% |
| 45 to 59 Minutes | 34 | 8.1% |
| 60 to 89 Minutes | 26 | 6.2% |
| 90 or more Minutes | 29 | 6.9% |
Commute Time by Sex in High Rolls
The most common commute times in High Rolls are 45 to 59 minutes (34 commuters, 20.0%) for males and 30 to 34 minutes (110 commuters, 43.8%) for females.
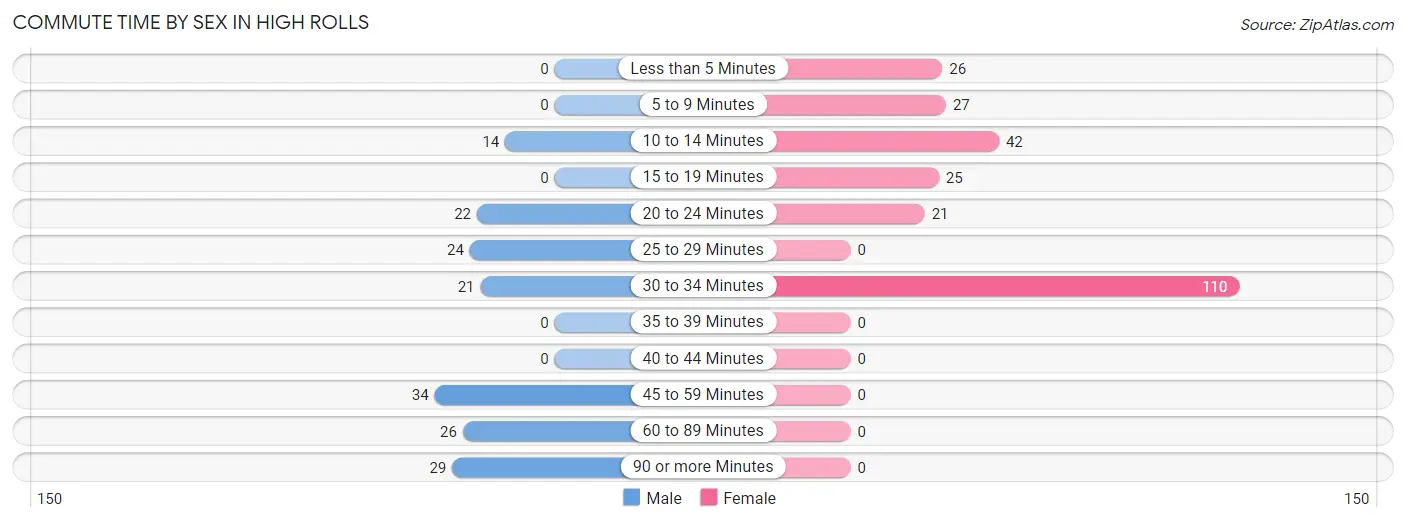
| Commute Time | Male | Female |
| Less than 5 Minutes | 0 (0.0%) | 26 (10.4%) |
| 5 to 9 Minutes | 0 (0.0%) | 27 (10.8%) |
| 10 to 14 Minutes | 14 (8.2%) | 42 (16.7%) |
| 15 to 19 Minutes | 0 (0.0%) | 25 (10.0%) |
| 20 to 24 Minutes | 22 (12.9%) | 21 (8.4%) |
| 25 to 29 Minutes | 24 (14.1%) | 0 (0.0%) |
| 30 to 34 Minutes | 21 (12.3%) | 110 (43.8%) |
| 35 to 39 Minutes | 0 (0.0%) | 0 (0.0%) |
| 40 to 44 Minutes | 0 (0.0%) | 0 (0.0%) |
| 45 to 59 Minutes | 34 (20.0%) | 0 (0.0%) |
| 60 to 89 Minutes | 26 (15.3%) | 0 (0.0%) |
| 90 or more Minutes | 29 (17.1%) | 0 (0.0%) |
Time of Departure to Work by Sex in High Rolls
The most frequent times of departure to work in High Rolls are 6:00 AM to 6:29 AM (69, 40.6%) for males and 7:00 AM to 7:29 AM (90, 35.9%) for females.
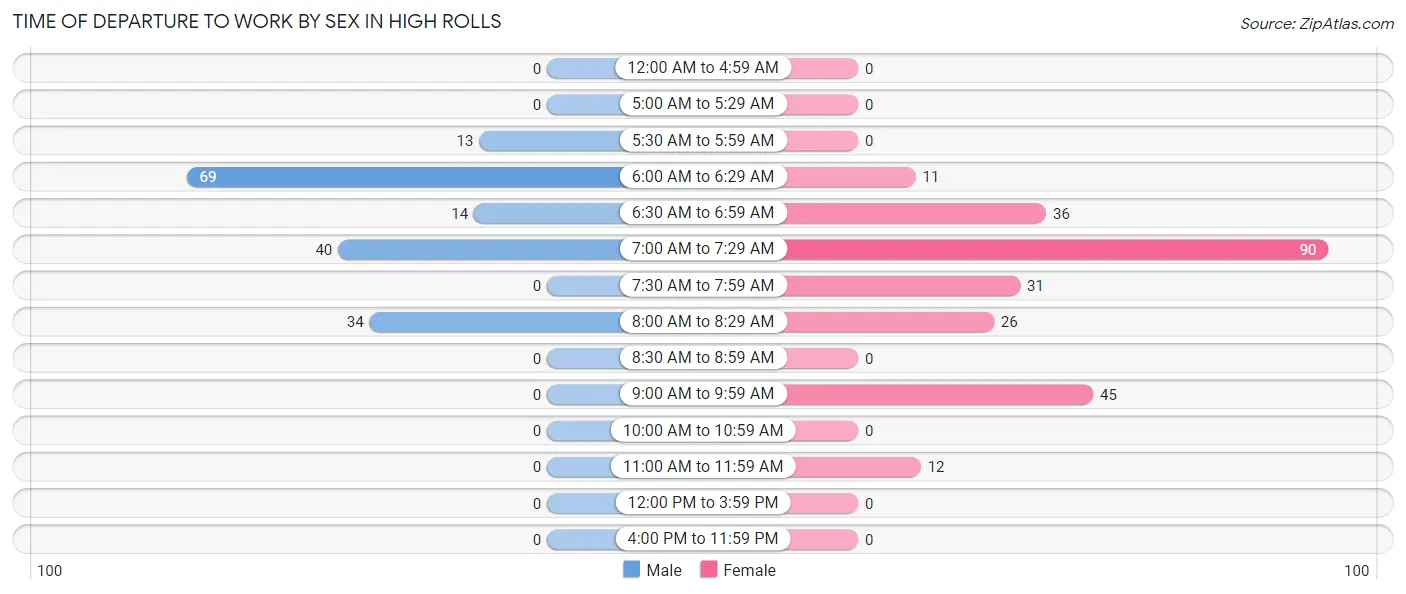
| Time of Departure | Male | Female |
| 12:00 AM to 4:59 AM | 0 (0.0%) | 0 (0.0%) |
| 5:00 AM to 5:29 AM | 0 (0.0%) | 0 (0.0%) |
| 5:30 AM to 5:59 AM | 13 (7.6%) | 0 (0.0%) |
| 6:00 AM to 6:29 AM | 69 (40.6%) | 11 (4.4%) |
| 6:30 AM to 6:59 AM | 14 (8.2%) | 36 (14.3%) |
| 7:00 AM to 7:29 AM | 40 (23.5%) | 90 (35.9%) |
| 7:30 AM to 7:59 AM | 0 (0.0%) | 31 (12.3%) |
| 8:00 AM to 8:29 AM | 34 (20.0%) | 26 (10.4%) |
| 8:30 AM to 8:59 AM | 0 (0.0%) | 0 (0.0%) |
| 9:00 AM to 9:59 AM | 0 (0.0%) | 45 (17.9%) |
| 10:00 AM to 10:59 AM | 0 (0.0%) | 0 (0.0%) |
| 11:00 AM to 11:59 AM | 0 (0.0%) | 12 (4.8%) |
| 12:00 PM to 3:59 PM | 0 (0.0%) | 0 (0.0%) |
| 4:00 PM to 11:59 PM | 0 (0.0%) | 0 (0.0%) |
| Total | 170 (100.0%) | 251 (100.0%) |
Housing Occupancy in High Rolls
Occupancy by Ownership in High Rolls
Of the total 441 dwellings in High Rolls, owner-occupied units account for 380 (86.2%), while renter-occupied units make up 61 (13.8%).
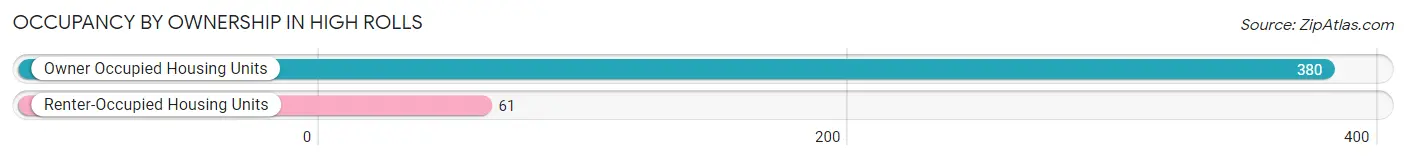
| Occupancy | # Housing Units | % Housing Units |
| Owner Occupied Housing Units | 380 | 86.2% |
| Renter-Occupied Housing Units | 61 | 13.8% |
| Total Occupied Housing Units | 441 | 100.0% |
Occupancy by Household Size in High Rolls
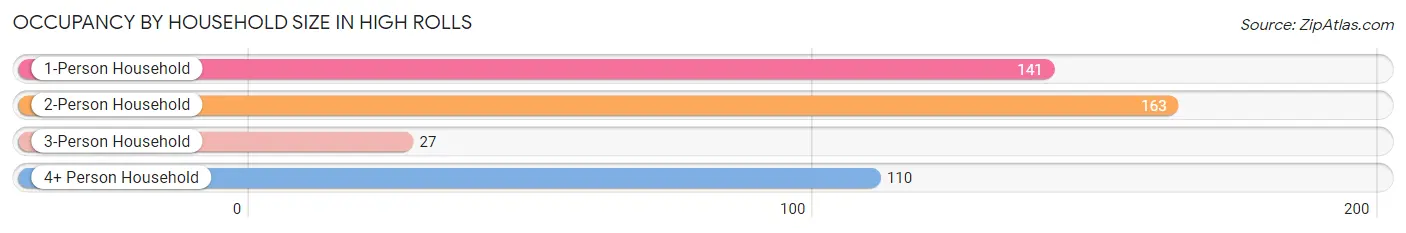
| Household Size | # Housing Units | % Housing Units |
| 1-Person Household | 141 | 32.0% |
| 2-Person Household | 163 | 37.0% |
| 3-Person Household | 27 | 6.1% |
| 4+ Person Household | 110 | 24.9% |
| Total Housing Units | 441 | 100.0% |
Occupancy by Ownership by Household Size in High Rolls
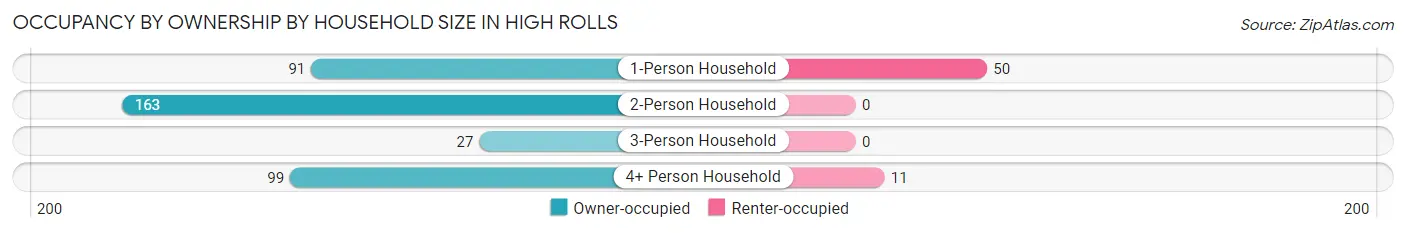
| Household Size | Owner-occupied | Renter-occupied |
| 1-Person Household | 91 (64.5%) | 50 (35.5%) |
| 2-Person Household | 163 (100.0%) | 0 (0.0%) |
| 3-Person Household | 27 (100.0%) | 0 (0.0%) |
| 4+ Person Household | 99 (90.0%) | 11 (10.0%) |
| Total Housing Units | 380 (86.2%) | 61 (13.8%) |
Occupancy by Educational Attainment in High Rolls
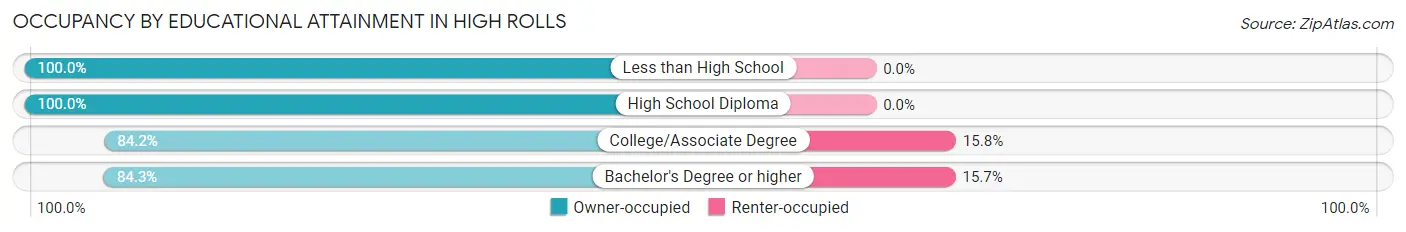
| Household Size | Owner-occupied | Renter-occupied |
| Less than High School | 10 (100.0%) | 0 (0.0%) |
| High School Diploma | 44 (100.0%) | 0 (0.0%) |
| College/Associate Degree | 101 (84.2%) | 19 (15.8%) |
| Bachelor's Degree or higher | 225 (84.3%) | 42 (15.7%) |
Occupancy by Age of Householder in High Rolls
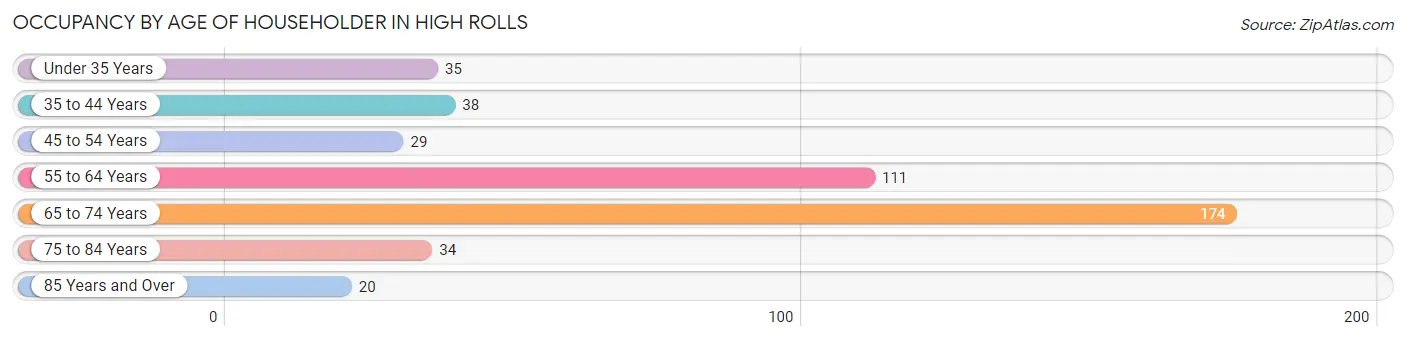
| Age Bracket | # Households | % Households |
| Under 35 Years | 35 | 7.9% |
| 35 to 44 Years | 38 | 8.6% |
| 45 to 54 Years | 29 | 6.6% |
| 55 to 64 Years | 111 | 25.2% |
| 65 to 74 Years | 174 | 39.5% |
| 75 to 84 Years | 34 | 7.7% |
| 85 Years and Over | 20 | 4.5% |
| Total | 441 | 100.0% |
Housing Finances in High Rolls
Median Income by Occupancy in High Rolls
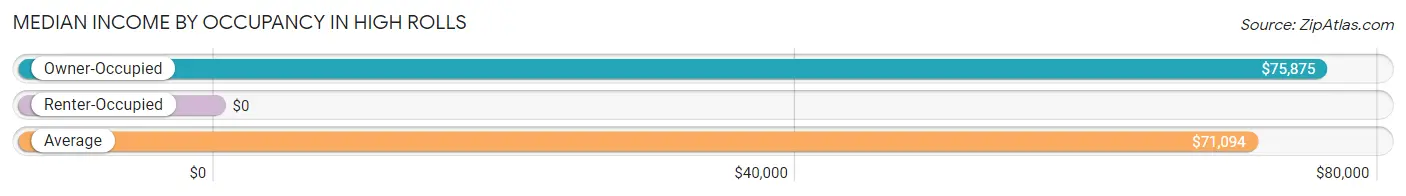
| Occupancy Type | # Households | Median Income |
| Owner-Occupied | 380 (86.2%) | $75,875 |
| Renter-Occupied | 61 (13.8%) | $0 |
| Average | 441 (100.0%) | $71,094 |
Occupancy by Householder Income Bracket in High Rolls
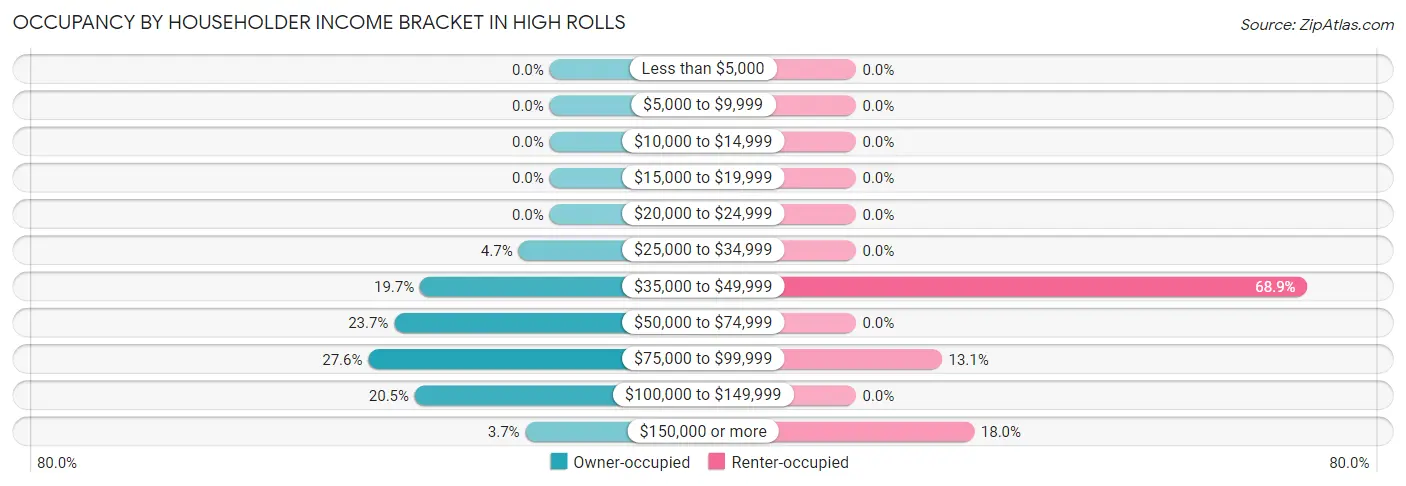
| Income Bracket | Owner-occupied | Renter-occupied |
| Less than $5,000 | 0 (0.0%) | 0 (0.0%) |
| $5,000 to $9,999 | 0 (0.0%) | 0 (0.0%) |
| $10,000 to $14,999 | 0 (0.0%) | 0 (0.0%) |
| $15,000 to $19,999 | 0 (0.0%) | 0 (0.0%) |
| $20,000 to $24,999 | 0 (0.0%) | 0 (0.0%) |
| $25,000 to $34,999 | 18 (4.7%) | 0 (0.0%) |
| $35,000 to $49,999 | 75 (19.7%) | 42 (68.9%) |
| $50,000 to $74,999 | 90 (23.7%) | 0 (0.0%) |
| $75,000 to $99,999 | 105 (27.6%) | 8 (13.1%) |
| $100,000 to $149,999 | 78 (20.5%) | 0 (0.0%) |
| $150,000 or more | 14 (3.7%) | 11 (18.0%) |
| Total | 380 (100.0%) | 61 (100.0%) |
Monthly Housing Cost Tiers in High Rolls
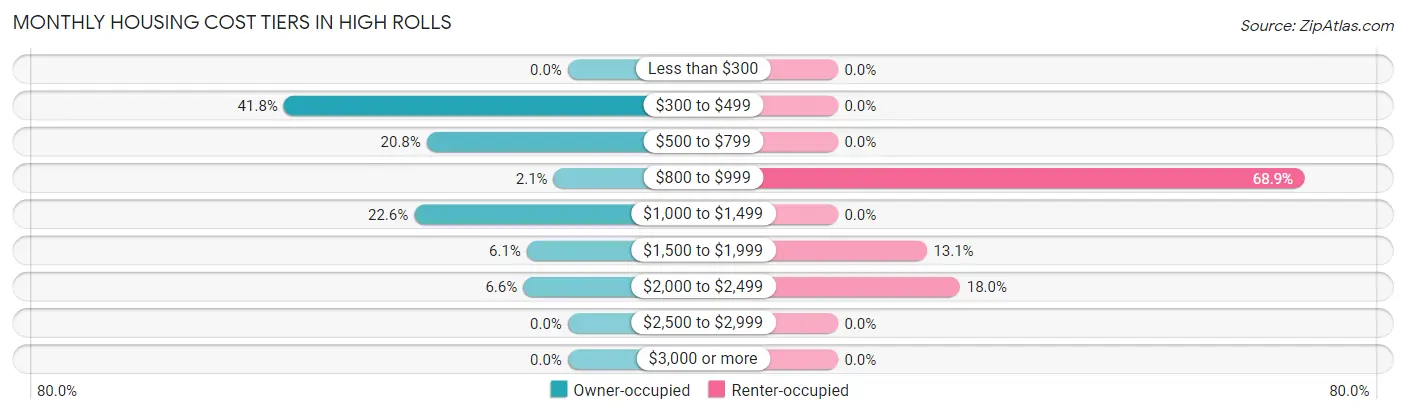
| Monthly Cost | Owner-occupied | Renter-occupied |
| Less than $300 | 0 (0.0%) | 0 (0.0%) |
| $300 to $499 | 159 (41.8%) | 0 (0.0%) |
| $500 to $799 | 79 (20.8%) | 0 (0.0%) |
| $800 to $999 | 8 (2.1%) | 42 (68.9%) |
| $1,000 to $1,499 | 86 (22.6%) | 0 (0.0%) |
| $1,500 to $1,999 | 23 (6.0%) | 8 (13.1%) |
| $2,000 to $2,499 | 25 (6.6%) | 11 (18.0%) |
| $2,500 to $2,999 | 0 (0.0%) | 0 (0.0%) |
| $3,000 or more | 0 (0.0%) | 0 (0.0%) |
| Total | 380 (100.0%) | 61 (100.0%) |
Physical Housing Characteristics in High Rolls
Housing Structures in High Rolls
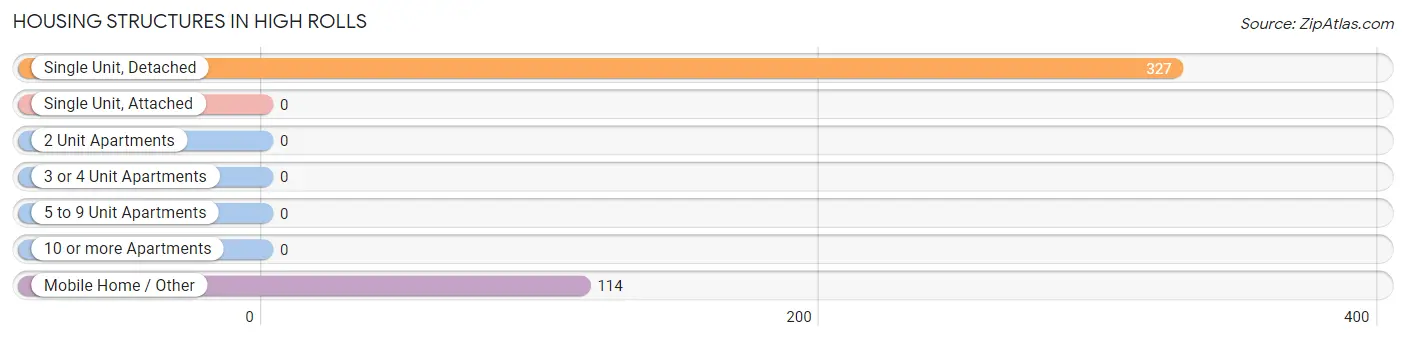
| Structure Type | # Housing Units | % Housing Units |
| Single Unit, Detached | 327 | 74.2% |
| Single Unit, Attached | 0 | 0.0% |
| 2 Unit Apartments | 0 | 0.0% |
| 3 or 4 Unit Apartments | 0 | 0.0% |
| 5 to 9 Unit Apartments | 0 | 0.0% |
| 10 or more Apartments | 0 | 0.0% |
| Mobile Home / Other | 114 | 25.9% |
| Total | 441 | 100.0% |
Housing Structures by Occupancy in High Rolls
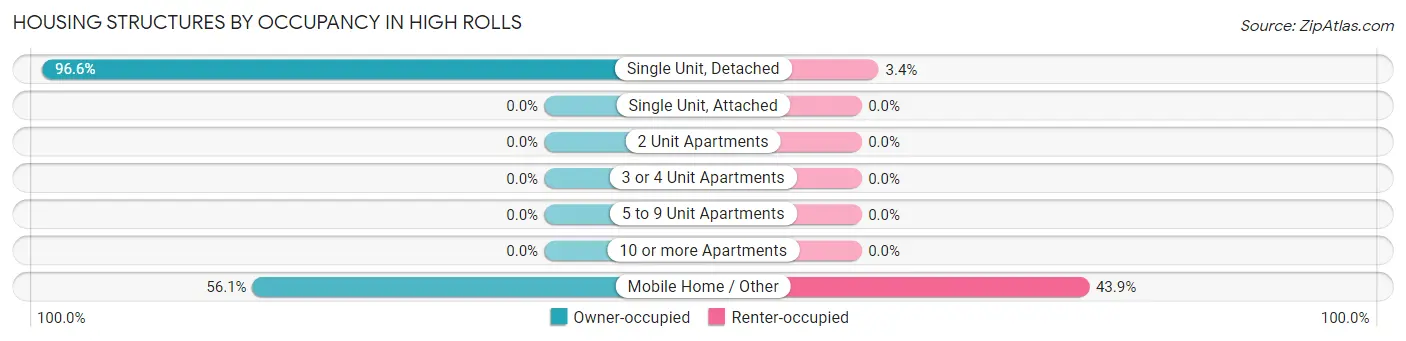
| Structure Type | Owner-occupied | Renter-occupied |
| Single Unit, Detached | 316 (96.6%) | 11 (3.4%) |
| Single Unit, Attached | 0 (0.0%) | 0 (0.0%) |
| 2 Unit Apartments | 0 (0.0%) | 0 (0.0%) |
| 3 or 4 Unit Apartments | 0 (0.0%) | 0 (0.0%) |
| 5 to 9 Unit Apartments | 0 (0.0%) | 0 (0.0%) |
| 10 or more Apartments | 0 (0.0%) | 0 (0.0%) |
| Mobile Home / Other | 64 (56.1%) | 50 (43.9%) |
| Total | 380 (86.2%) | 61 (13.8%) |
Housing Structures by Number of Rooms in High Rolls
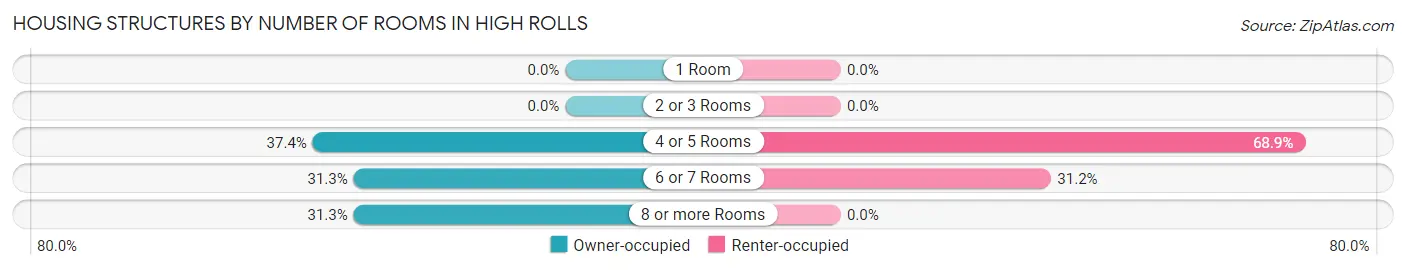
| Number of Rooms | Owner-occupied | Renter-occupied |
| 1 Room | 0 (0.0%) | 0 (0.0%) |
| 2 or 3 Rooms | 0 (0.0%) | 0 (0.0%) |
| 4 or 5 Rooms | 142 (37.4%) | 42 (68.9%) |
| 6 or 7 Rooms | 119 (31.3%) | 19 (31.1%) |
| 8 or more Rooms | 119 (31.3%) | 0 (0.0%) |
| Total | 380 (100.0%) | 61 (100.0%) |
Housing Structure by Heating Type in High Rolls
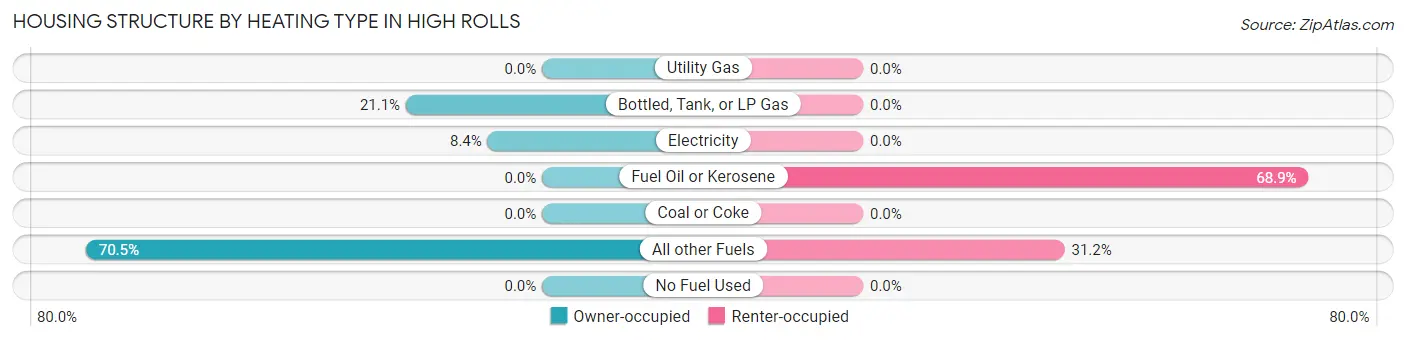
| Heating Type | Owner-occupied | Renter-occupied |
| Utility Gas | 0 (0.0%) | 0 (0.0%) |
| Bottled, Tank, or LP Gas | 80 (21.0%) | 0 (0.0%) |
| Electricity | 32 (8.4%) | 0 (0.0%) |
| Fuel Oil or Kerosene | 0 (0.0%) | 42 (68.9%) |
| Coal or Coke | 0 (0.0%) | 0 (0.0%) |
| All other Fuels | 268 (70.5%) | 19 (31.1%) |
| No Fuel Used | 0 (0.0%) | 0 (0.0%) |
| Total | 380 (100.0%) | 61 (100.0%) |
Household Vehicle Usage in High Rolls
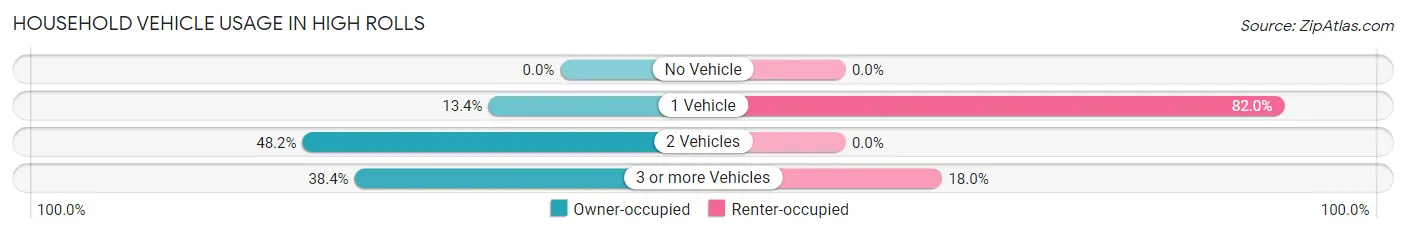
| Vehicles per Household | Owner-occupied | Renter-occupied |
| No Vehicle | 0 (0.0%) | 0 (0.0%) |
| 1 Vehicle | 51 (13.4%) | 50 (82.0%) |
| 2 Vehicles | 183 (48.2%) | 0 (0.0%) |
| 3 or more Vehicles | 146 (38.4%) | 11 (18.0%) |
| Total | 380 (100.0%) | 61 (100.0%) |
Real Estate & Mortgages in High Rolls
Real Estate and Mortgage Overview in High Rolls
| Characteristic | Without Mortgage | With Mortgage |
| Housing Units | 219 | 161 |
| Median Property Value | $223,800 | $271,500 |
| Median Household Income | $62,277 | $0 |
| Monthly Housing Costs | $446 | $0 |
| Real Estate Taxes | $1,125 | $0 |
Property Value by Mortgage Status in High Rolls
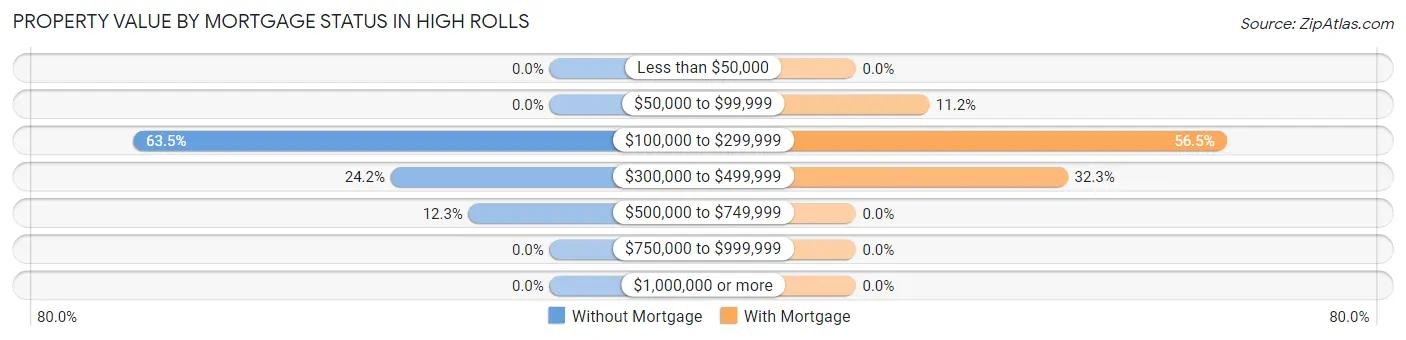
| Property Value | Without Mortgage | With Mortgage |
| Less than $50,000 | 0 (0.0%) | 0 (0.0%) |
| $50,000 to $99,999 | 0 (0.0%) | 18 (11.2%) |
| $100,000 to $299,999 | 139 (63.5%) | 91 (56.5%) |
| $300,000 to $499,999 | 53 (24.2%) | 52 (32.3%) |
| $500,000 to $749,999 | 27 (12.3%) | 0 (0.0%) |
| $750,000 to $999,999 | 0 (0.0%) | 0 (0.0%) |
| $1,000,000 or more | 0 (0.0%) | 0 (0.0%) |
| Total | 219 (100.0%) | 161 (100.0%) |
Household Income by Mortgage Status in High Rolls
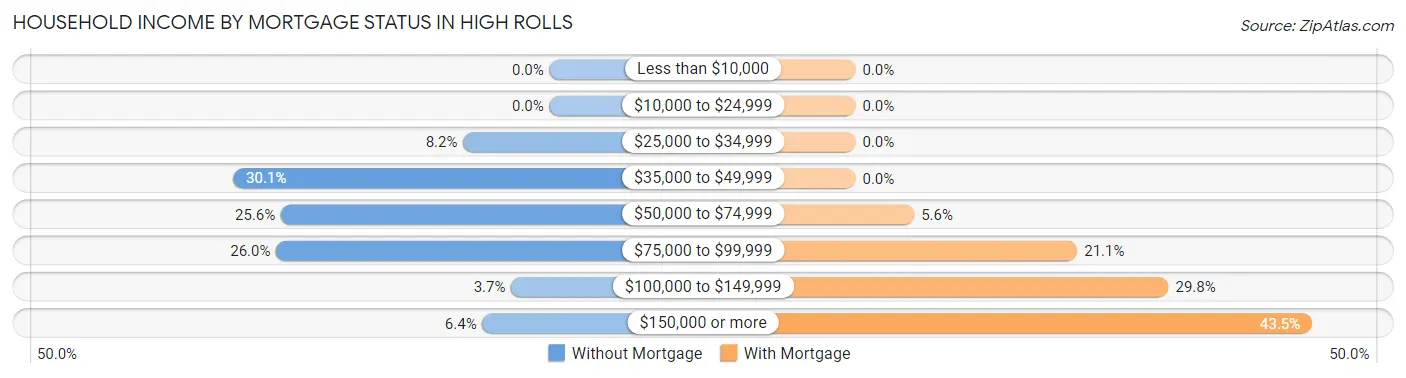
| Household Income | Without Mortgage | With Mortgage |
| Less than $10,000 | 0 (0.0%) | 0 (0.0%) |
| $10,000 to $24,999 | 0 (0.0%) | 0 (0.0%) |
| $25,000 to $34,999 | 18 (8.2%) | 0 (0.0%) |
| $35,000 to $49,999 | 66 (30.1%) | 0 (0.0%) |
| $50,000 to $74,999 | 56 (25.6%) | 9 (5.6%) |
| $75,000 to $99,999 | 57 (26.0%) | 34 (21.1%) |
| $100,000 to $149,999 | 8 (3.6%) | 48 (29.8%) |
| $150,000 or more | 14 (6.4%) | 70 (43.5%) |
| Total | 219 (100.0%) | 161 (100.0%) |
Property Value to Household Income Ratio in High Rolls
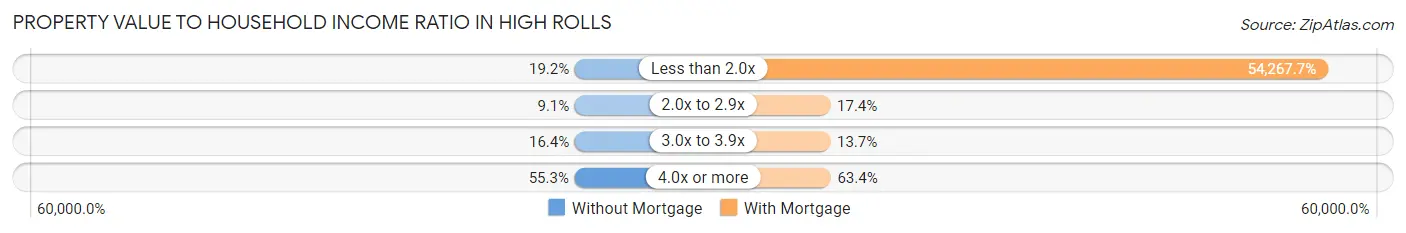
| Value-to-Income Ratio | Without Mortgage | With Mortgage |
| Less than 2.0x | 42 (19.2%) | 87,371 (54,267.7%) |
| 2.0x to 2.9x | 20 (9.1%) | 28 (17.4%) |
| 3.0x to 3.9x | 36 (16.4%) | 22 (13.7%) |
| 4.0x or more | 121 (55.2%) | 102 (63.3%) |
| Total | 219 (100.0%) | 161 (100.0%) |
Real Estate Taxes by Mortgage Status in High Rolls
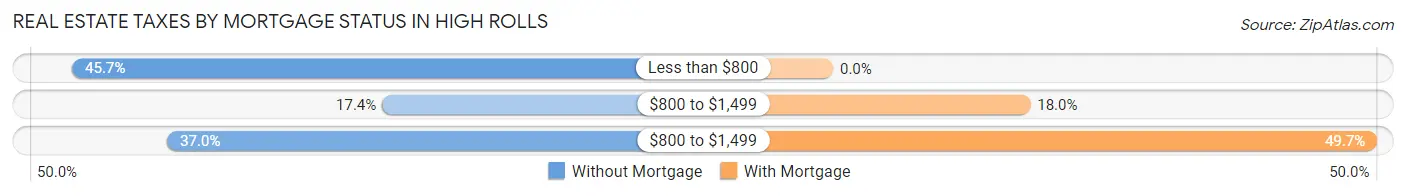
| Property Taxes | Without Mortgage | With Mortgage |
| Less than $800 | 100 (45.7%) | 0 (0.0%) |
| $800 to $1,499 | 38 (17.3%) | 29 (18.0%) |
| $800 to $1,499 | 81 (37.0%) | 80 (49.7%) |
| Total | 219 (100.0%) | 161 (100.0%) |
Health & Disability in High Rolls
Health Insurance Coverage by Age in High Rolls
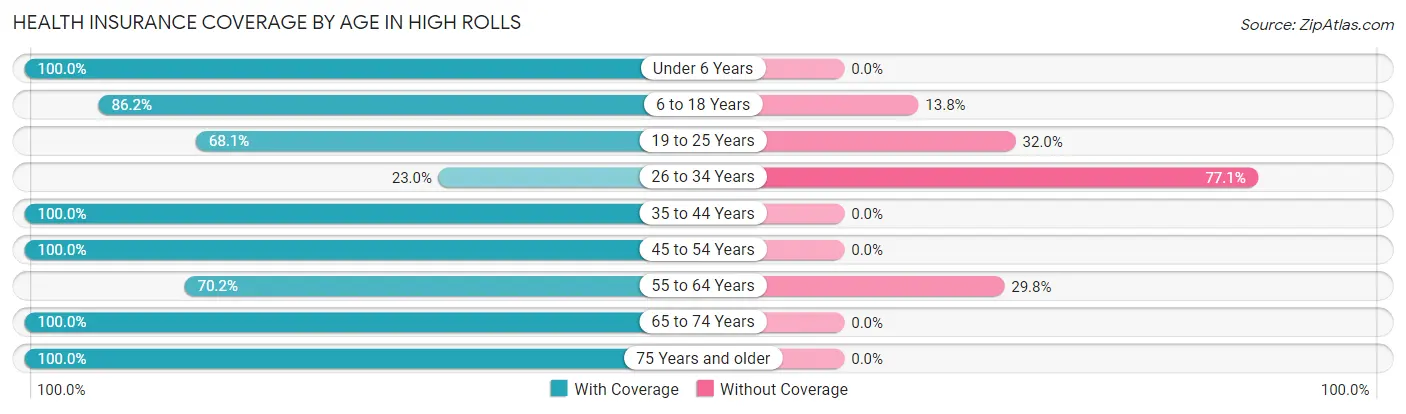
| Age Bracket | With Coverage | Without Coverage |
| Under 6 Years | 296 (100.0%) | 0 (0.0%) |
| 6 to 18 Years | 293 (86.2%) | 47 (13.8%) |
| 19 to 25 Years | 115 (68.0%) | 54 (32.0%) |
| 26 to 34 Years | 14 (23.0%) | 47 (77.0%) |
| 35 to 44 Years | 116 (100.0%) | 0 (0.0%) |
| 45 to 54 Years | 113 (100.0%) | 0 (0.0%) |
| 55 to 64 Years | 87 (70.2%) | 37 (29.8%) |
| 65 to 74 Years | 279 (100.0%) | 0 (0.0%) |
| 75 Years and older | 113 (100.0%) | 0 (0.0%) |
| Total | 1,426 (88.5%) | 185 (11.5%) |
Health Insurance Coverage by Citizenship Status in High Rolls
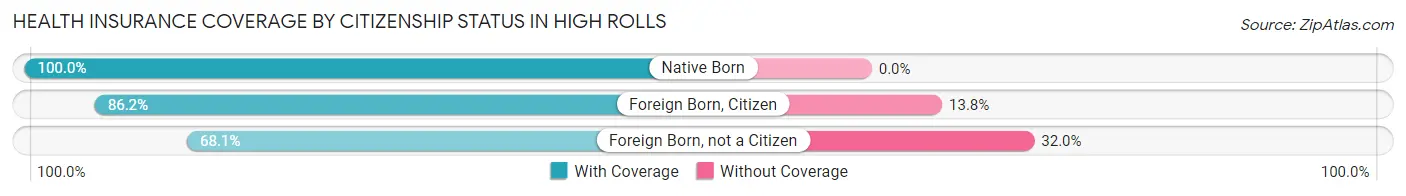
| Citizenship Status | With Coverage | Without Coverage |
| Native Born | 296 (100.0%) | 0 (0.0%) |
| Foreign Born, Citizen | 293 (86.2%) | 47 (13.8%) |
| Foreign Born, not a Citizen | 115 (68.0%) | 54 (32.0%) |
Health Insurance Coverage by Household Income in High Rolls
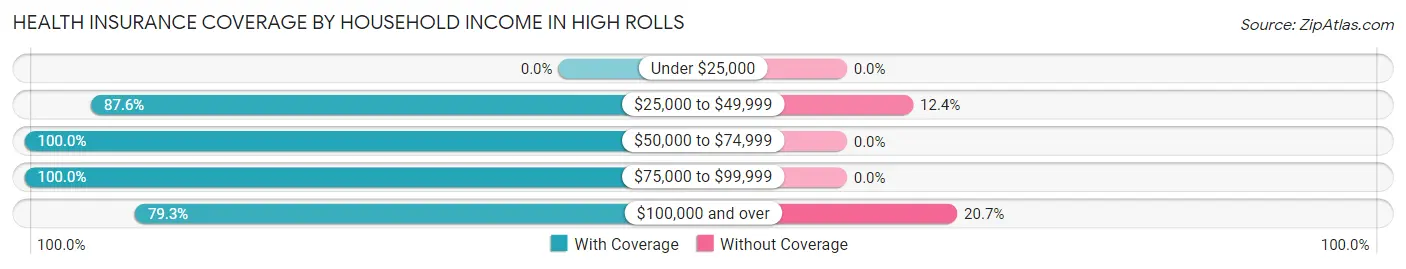
| Household Income | With Coverage | Without Coverage |
| Under $25,000 | 0 (0.0%) | 0 (0.0%) |
| $25,000 to $49,999 | 148 (87.6%) | 21 (12.4%) |
| $50,000 to $74,999 | 144 (100.0%) | 0 (0.0%) |
| $75,000 to $99,999 | 505 (100.0%) | 0 (0.0%) |
| $100,000 and over | 629 (79.3%) | 164 (20.7%) |
Public vs Private Health Insurance Coverage by Age in High Rolls
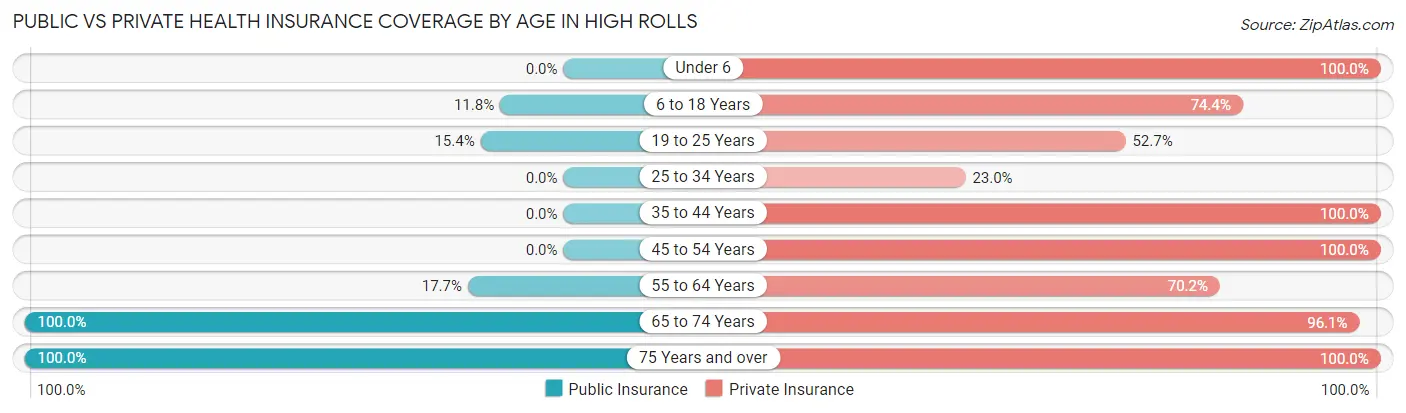
| Age Bracket | Public Insurance | Private Insurance |
| Under 6 | 0 (0.0%) | 296 (100.0%) |
| 6 to 18 Years | 40 (11.8%) | 253 (74.4%) |
| 19 to 25 Years | 26 (15.4%) | 89 (52.7%) |
| 25 to 34 Years | 0 (0.0%) | 14 (23.0%) |
| 35 to 44 Years | 0 (0.0%) | 116 (100.0%) |
| 45 to 54 Years | 0 (0.0%) | 113 (100.0%) |
| 55 to 64 Years | 22 (17.7%) | 87 (70.2%) |
| 65 to 74 Years | 279 (100.0%) | 268 (96.1%) |
| 75 Years and over | 113 (100.0%) | 113 (100.0%) |
| Total | 480 (29.8%) | 1,349 (83.7%) |
Disability Status by Sex by Age in High Rolls
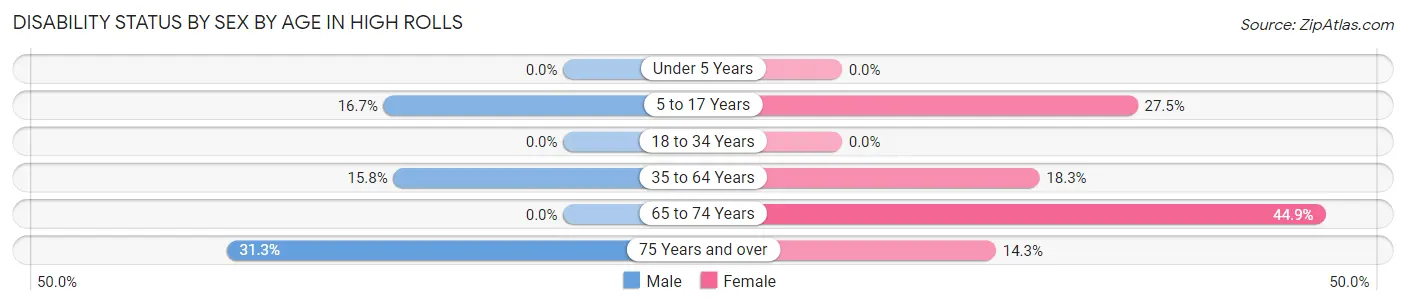
| Age Bracket | Male | Female |
| Under 5 Years | 0 (0.0%) | 0 (0.0%) |
| 5 to 17 Years | 38 (16.7%) | 28 (27.5%) |
| 18 to 34 Years | 0 (0.0%) | 0 (0.0%) |
| 35 to 64 Years | 29 (15.8%) | 31 (18.3%) |
| 65 to 74 Years | 0 (0.0%) | 57 (44.9%) |
| 75 Years and over | 20 (31.2%) | 7 (14.3%) |
Disability Class by Sex by Age in High Rolls
Disability Class: Hearing Difficulty
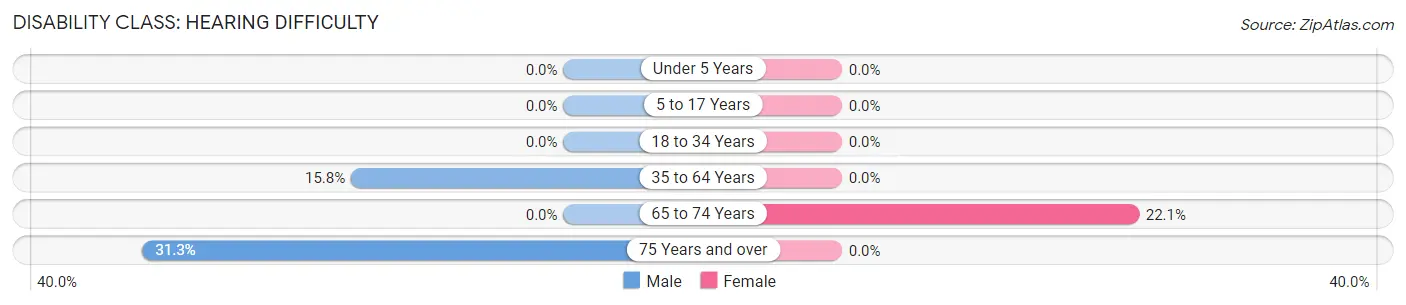
| Age Bracket | Male | Female |
| Under 5 Years | 0 (0.0%) | 0 (0.0%) |
| 5 to 17 Years | 0 (0.0%) | 0 (0.0%) |
| 18 to 34 Years | 0 (0.0%) | 0 (0.0%) |
| 35 to 64 Years | 29 (15.8%) | 0 (0.0%) |
| 65 to 74 Years | 0 (0.0%) | 28 (22.1%) |
| 75 Years and over | 20 (31.2%) | 0 (0.0%) |
Disability Class: Vision Difficulty
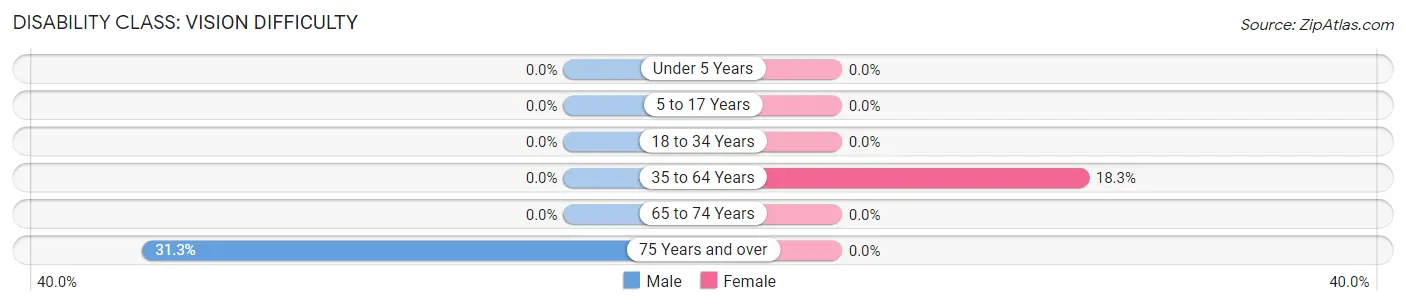
| Age Bracket | Male | Female |
| Under 5 Years | 0 (0.0%) | 0 (0.0%) |
| 5 to 17 Years | 0 (0.0%) | 0 (0.0%) |
| 18 to 34 Years | 0 (0.0%) | 0 (0.0%) |
| 35 to 64 Years | 0 (0.0%) | 31 (18.3%) |
| 65 to 74 Years | 0 (0.0%) | 0 (0.0%) |
| 75 Years and over | 20 (31.2%) | 0 (0.0%) |
Disability Class: Cognitive Difficulty
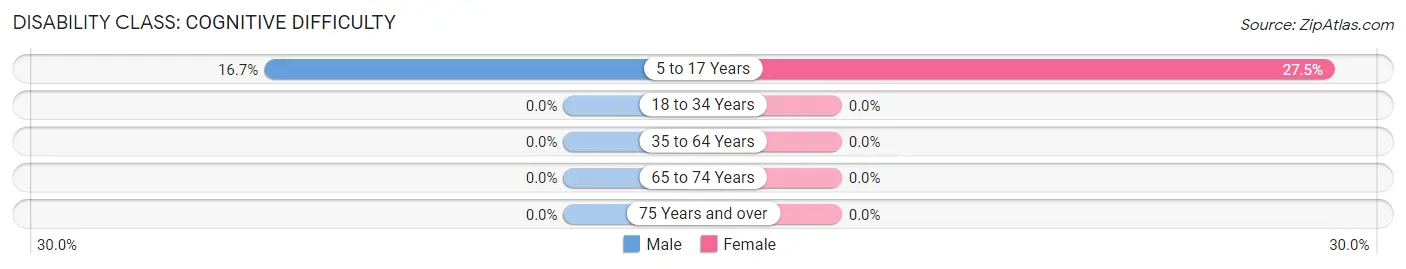
| Age Bracket | Male | Female |
| 5 to 17 Years | 38 (16.7%) | 28 (27.5%) |
| 18 to 34 Years | 0 (0.0%) | 0 (0.0%) |
| 35 to 64 Years | 0 (0.0%) | 0 (0.0%) |
| 65 to 74 Years | 0 (0.0%) | 0 (0.0%) |
| 75 Years and over | 0 (0.0%) | 0 (0.0%) |
Disability Class: Ambulatory Difficulty
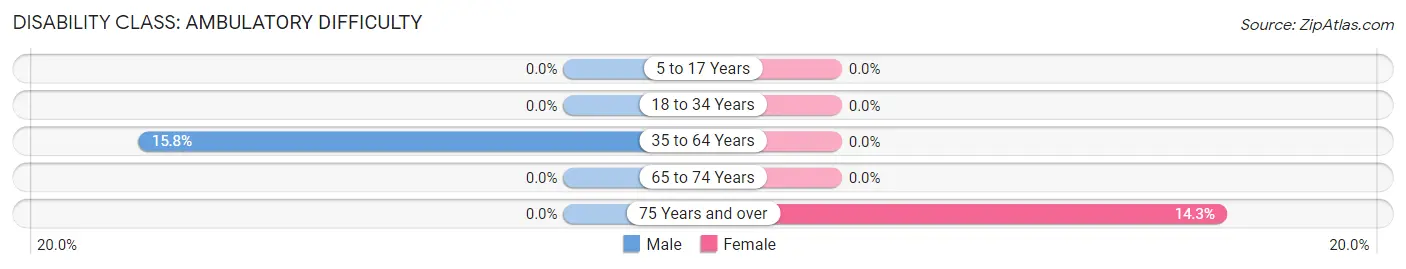
| Age Bracket | Male | Female |
| 5 to 17 Years | 0 (0.0%) | 0 (0.0%) |
| 18 to 34 Years | 0 (0.0%) | 0 (0.0%) |
| 35 to 64 Years | 29 (15.8%) | 0 (0.0%) |
| 65 to 74 Years | 0 (0.0%) | 0 (0.0%) |
| 75 Years and over | 0 (0.0%) | 7 (14.3%) |
Disability Class: Self-Care Difficulty
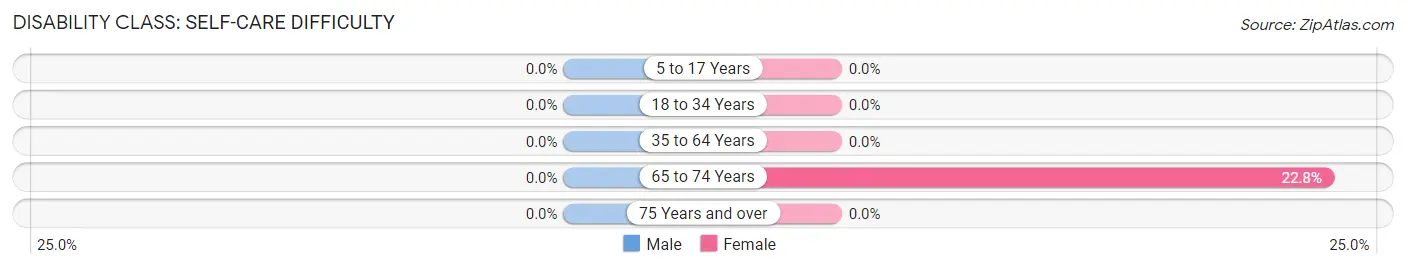
| Age Bracket | Male | Female |
| 5 to 17 Years | 0 (0.0%) | 0 (0.0%) |
| 18 to 34 Years | 0 (0.0%) | 0 (0.0%) |
| 35 to 64 Years | 0 (0.0%) | 0 (0.0%) |
| 65 to 74 Years | 0 (0.0%) | 29 (22.8%) |
| 75 Years and over | 0 (0.0%) | 0 (0.0%) |
Technology Access in High Rolls
Computing Device Access in High Rolls
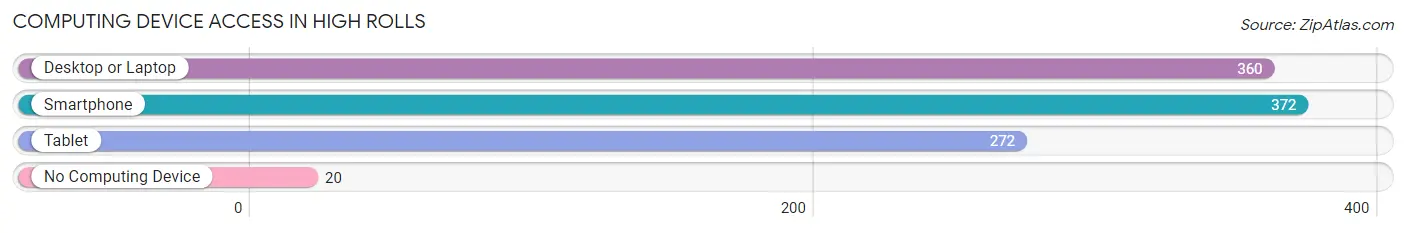
| Device Type | # Households | % Households |
| Desktop or Laptop | 360 | 81.6% |
| Smartphone | 372 | 84.4% |
| Tablet | 272 | 61.7% |
| No Computing Device | 20 | 4.5% |
| Total | 441 | 100.0% |
Internet Access in High Rolls
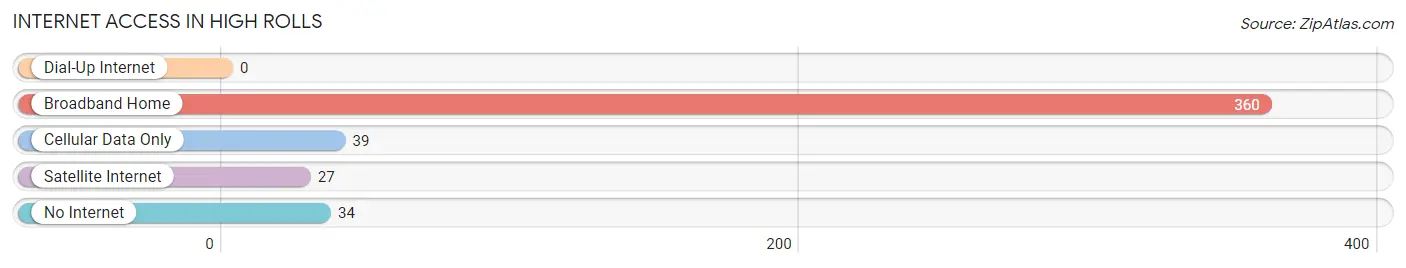
| Internet Type | # Households | % Households |
| Dial-Up Internet | 0 | 0.0% |
| Broadband Home | 360 | 81.6% |
| Cellular Data Only | 39 | 8.8% |
| Satellite Internet | 27 | 6.1% |
| No Internet | 34 | 7.7% |
| Total | 441 | 100.0% |
High Rolls Summary
Rolls, New Mexico is a small unincorporated community located in Otero County in the south-central part of the state. It is situated in the foothills of the Sacramento Mountains, approximately 20 miles east of Alamogordo and about 40 miles west of Carlsbad. The population of High Rolls was estimated to be around 1,000 in 2000.
Geography
High Rolls is located in the foothills of the Sacramento Mountains at an elevation of 4,890 feet. The area is characterized by rolling hills and valleys, with the highest point in the area being the summit of High Rolls Mountain at 8,000 feet. The climate is semi-arid, with hot summers and mild winters. The average annual precipitation is about 12 inches.
The area is home to a variety of wildlife, including mule deer, elk, coyotes, bobcats, and mountain lions. The area is also home to a variety of birds, including hawks, eagles, and owls.
History
High Rolls was first settled in the late 1800s by ranchers and farmers. The area was originally known as High Rolls Ranch, and the name was changed to High Rolls in the early 1900s. The town was officially incorporated in 1912.
High Rolls was a popular stop on the Butterfield Overland Mail route, which ran from St. Louis to San Francisco. The town was also a popular stop for travelers on the Santa Fe Trail.
Economy
The economy of High Rolls is largely based on agriculture and tourism. The area is home to several farms and ranches, which produce a variety of crops, including alfalfa, hay, and wheat. The area is also home to several wineries, which produce a variety of wines.
Tourism is an important part of the local economy. The area is home to several attractions, including the High Rolls Mountain Park, which offers hiking, camping, and other outdoor activities. The area is also home to several museums, including the High Rolls Museum of History and the High Rolls Museum of Art.
Demographics
As of the 2000 census, the population of High Rolls was 1,000. The racial makeup of the town was 94.2% White, 0.7% African American, 0.7% Native American, 0.3% Asian, 0.1% Pacific Islander, 2.2% from other races, and 1.7% from two or more races. Hispanic or Latino of any race were 5.7% of the population.
The median income for a household in High Rolls was $30,000, and the median income for a family was $35,000. The per capita income for the town was $14,000. About 11.7% of families and 14.3% of the population were below the poverty line, including 18.2% of those under age 18 and 8.3% of those age 65 or over.
Common Questions
What is Per Capita Income in High Rolls?
Per Capita income in High Rolls is $22,535.
What is the Median Family Income in High Rolls?
Median Family Income in High Rolls is $84,392.
What is the Median Household income in High Rolls?
Median Household Income in High Rolls is $71,094.
What is Inequality or Gini Index in High Rolls?
Inequality or Gini Index in High Rolls is 0.25.
What is the Total Population of High Rolls?
Total Population of High Rolls is 1,611.
What is the Total Male Population of High Rolls?
Total Male Population of High Rolls is 850.
What is the Total Female Population of High Rolls?
Total Female Population of High Rolls is 761.
What is the Ratio of Males per 100 Females in High Rolls?
There are 111.70 Males per 100 Females in High Rolls.
What is the Ratio of Females per 100 Males in High Rolls?
There are 89.53 Females per 100 Males in High Rolls.
What is the Median Population Age in High Rolls?
Median Population Age in High Rolls is 27.0 Years.
What is the Average Family Size in High Rolls
Average Family Size in High Rolls is 4.9 People.
What is the Average Household Size in High Rolls
Average Household Size in High Rolls is 3.6 People.
How Large is the Labor Force in High Rolls?
There are 457 People in the Labor Forcein in High Rolls.
What is the Percentage of People in the Labor Force in High Rolls?
44.9% of People are in the Labor Force in High Rolls.