Paincourtville, LA Map & Demographics
Paincourtville Map
Paincourtville Overview
$24,012
PER CAPITA INCOME
$71,458
AVG FAMILY INCOME
$67,644
AVG HOUSEHOLD INCOME
71.4%
WAGE / INCOME GAP [ % ]
28.6¢/ $1
WAGE / INCOME GAP [ $ ]
0.25
INEQUALITY / GINI INDEX
1,329
TOTAL POPULATION
417
MALE POPULATION
912
FEMALE POPULATION
45.72
MALES / 100 FEMALES
218.71
FEMALES / 100 MALES
23.2
MEDIAN AGE
4.1
AVG FAMILY SIZE
3.4
AVG HOUSEHOLD SIZE
747
LABOR FORCE [ PEOPLE ]
80.1%
PERCENT IN LABOR FORCE
5.8%
UNEMPLOYMENT RATE
Paincourtville Zip Codes
Paincourtville Area Codes
Income in Paincourtville
Income Overview in Paincourtville
Per Capita Income in Paincourtville is $24,012, while median incomes of families and households are $71,458 and $67,644 respectively.
| Characteristic | Number | Measure |
| Per Capita Income | 1,329 | $24,012 |
| Median Family Income | 297 | $71,458 |
| Mean Family Income | 297 | $75,245 |
| Median Household Income | 395 | $67,644 |
| Mean Household Income | 395 | $70,855 |
| Income Deficit | 297 | $0 |
| Wage / Income Gap (%) | 1,329 | 71.40% |
| Wage / Income Gap ($) | 1,329 | 28.60¢ per $1 |
| Gini / Inequality Index | 1,329 | 0.25 |
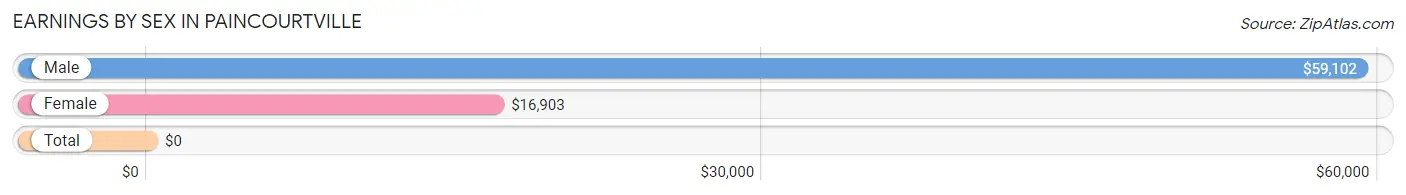
Earnings by Sex in Paincourtville
| Sex | Number | Average Earnings |
| Male | 181 (24.9%) | $59,102 |
| Female | 546 (75.1%) | $16,903 |
| Total | 727 (100.0%) | $0 |
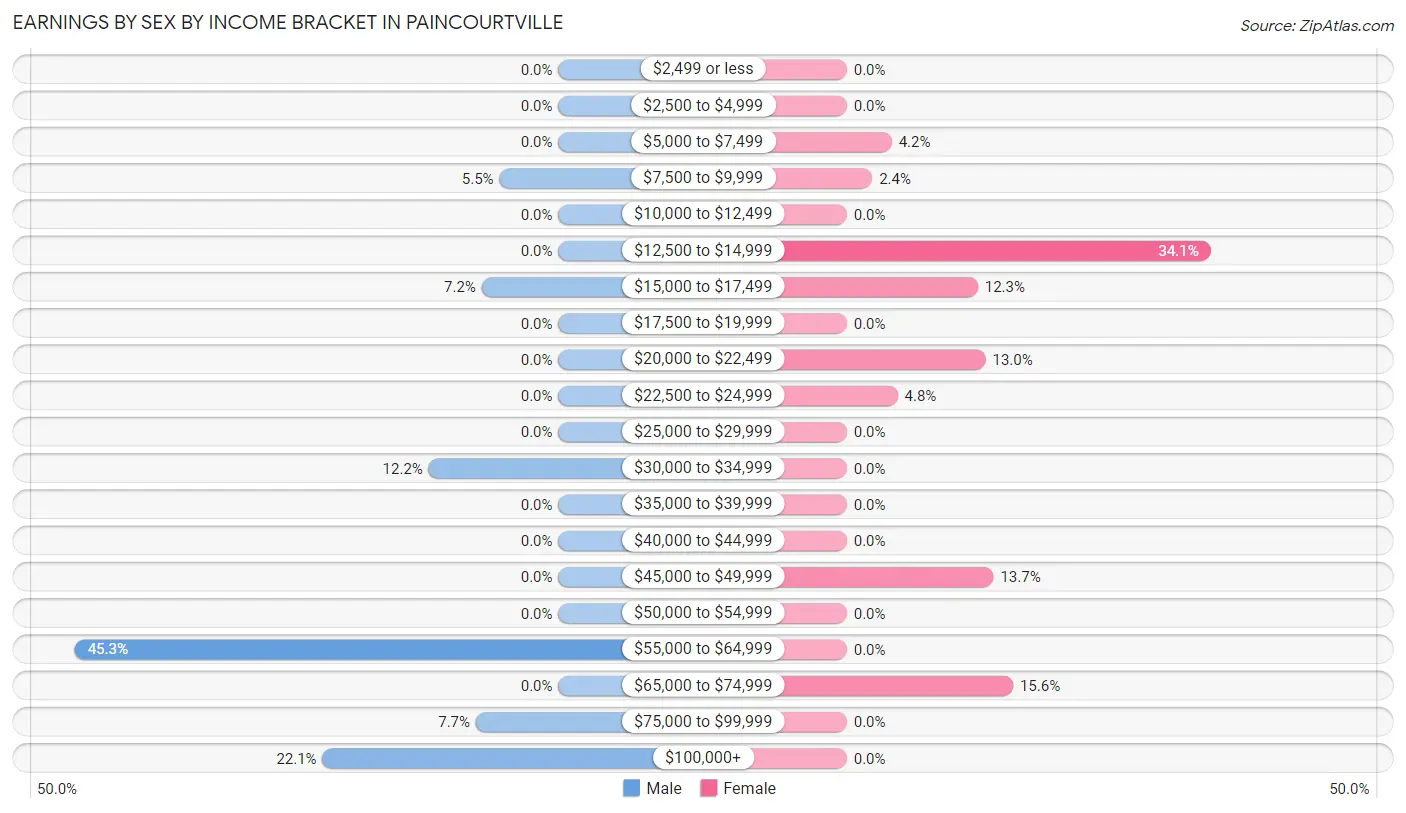
Earnings by Sex by Income Bracket in Paincourtville
The most common earnings brackets in Paincourtville are $55,000 to $64,999 for men (82 | 45.3%) and $12,500 to $14,999 for women (186 | 34.1%).
| Income | Male | Female |
| $2,499 or less | 0 (0.0%) | 0 (0.0%) |
| $2,500 to $4,999 | 0 (0.0%) | 0 (0.0%) |
| $5,000 to $7,499 | 0 (0.0%) | 23 (4.2%) |
| $7,500 to $9,999 | 10 (5.5%) | 13 (2.4%) |
| $10,000 to $12,499 | 0 (0.0%) | 0 (0.0%) |
| $12,500 to $14,999 | 0 (0.0%) | 186 (34.1%) |
| $15,000 to $17,499 | 13 (7.2%) | 67 (12.3%) |
| $17,500 to $19,999 | 0 (0.0%) | 0 (0.0%) |
| $20,000 to $22,499 | 0 (0.0%) | 71 (13.0%) |
| $22,500 to $24,999 | 0 (0.0%) | 26 (4.8%) |
| $25,000 to $29,999 | 0 (0.0%) | 0 (0.0%) |
| $30,000 to $34,999 | 22 (12.1%) | 0 (0.0%) |
| $35,000 to $39,999 | 0 (0.0%) | 0 (0.0%) |
| $40,000 to $44,999 | 0 (0.0%) | 0 (0.0%) |
| $45,000 to $49,999 | 0 (0.0%) | 75 (13.7%) |
| $50,000 to $54,999 | 0 (0.0%) | 0 (0.0%) |
| $55,000 to $64,999 | 82 (45.3%) | 0 (0.0%) |
| $65,000 to $74,999 | 0 (0.0%) | 85 (15.6%) |
| $75,000 to $99,999 | 14 (7.7%) | 0 (0.0%) |
| $100,000+ | 40 (22.1%) | 0 (0.0%) |
| Total | 181 (100.0%) | 546 (100.0%) |
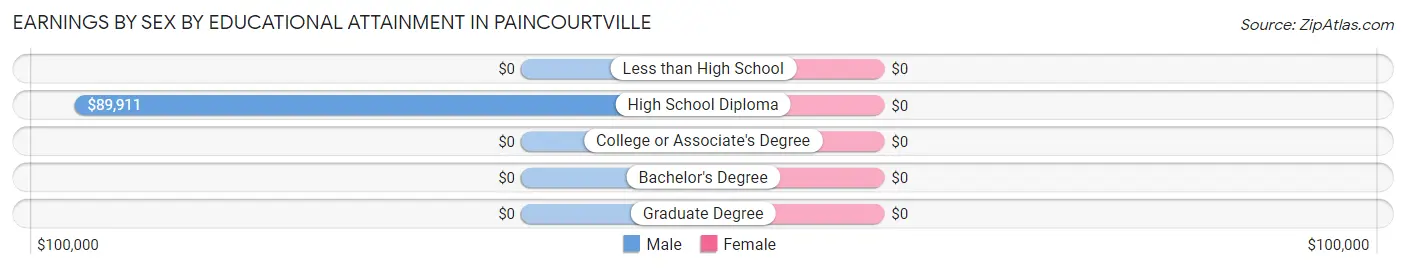
Earnings by Sex by Educational Attainment in Paincourtville
| Educational Attainment | Male Income | Female Income |
| Less than High School | - | - |
| High School Diploma | $89,911 | $0 |
| College or Associate's Degree | - | - |
| Bachelor's Degree | - | - |
| Graduate Degree | - | - |
| Total | - | - |
Family Income in Paincourtville
Family Income Brackets in Paincourtville
According to the Paincourtville family income data, there are 93 families falling into the $35,000 to $49,999 income range, which is the most common income bracket and makes up 31.3% of all families.
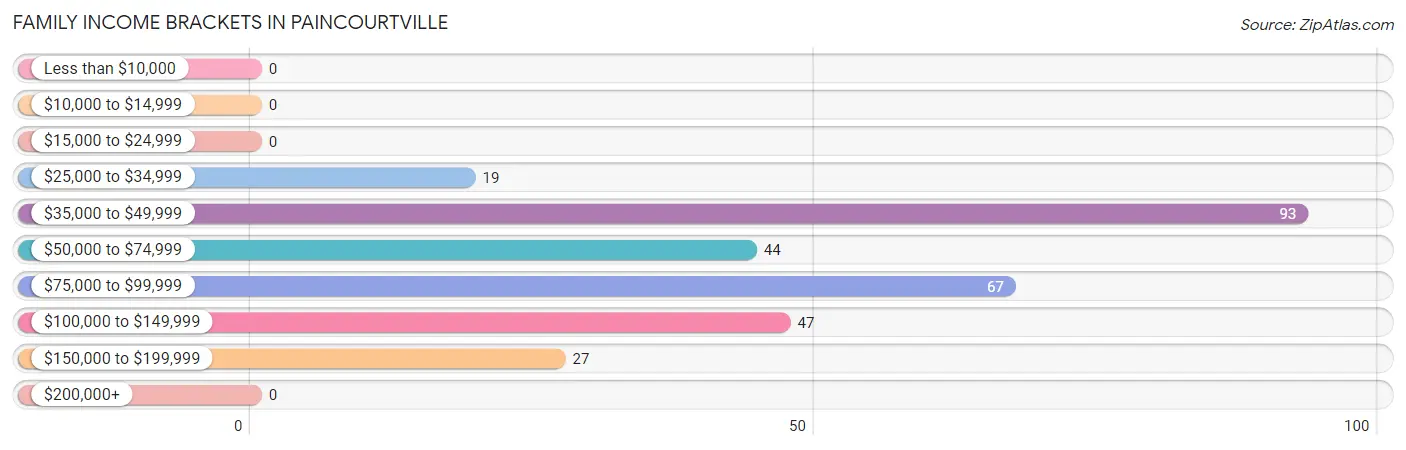
| Income Bracket | # Families | % Families |
| Less than $10,000 | 0 | 0.0% |
| $10,000 to $14,999 | 0 | 0.0% |
| $15,000 to $24,999 | 0 | 0.0% |
| $25,000 to $34,999 | 19 | 6.4% |
| $35,000 to $49,999 | 93 | 31.3% |
| $50,000 to $74,999 | 44 | 14.8% |
| $75,000 to $99,999 | 67 | 22.6% |
| $100,000 to $149,999 | 47 | 15.8% |
| $150,000 to $199,999 | 27 | 9.1% |
| $200,000+ | 0 | 0.0% |
Family Income by Famaliy Size in Paincourtville
2-person families (146 | 49.2%) account for the highest median family income in Paincourtville with $81,530 per family, while 2-person families (146 | 49.2%) have the highest median income of $40,765 per family member.
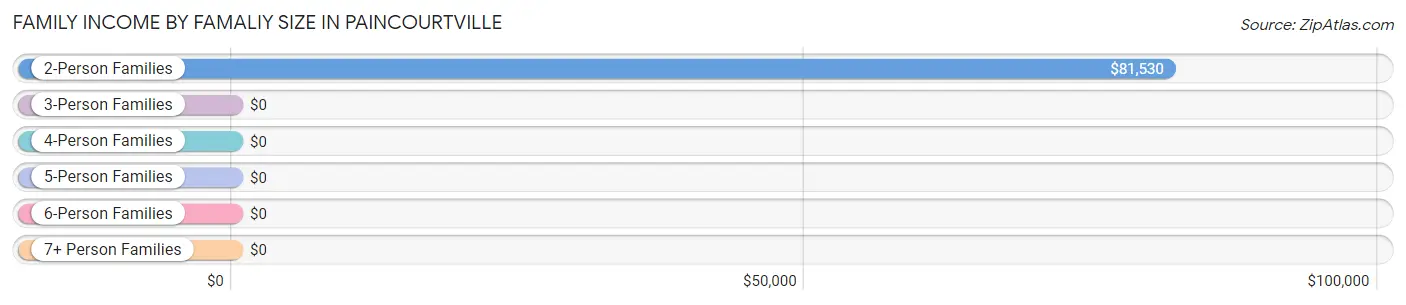
| Income Bracket | # Families | Median Income |
| 2-Person Families | 146 (49.2%) | $81,530 |
| 3-Person Families | 46 (15.5%) | $0 |
| 4-Person Families | 79 (26.6%) | $0 |
| 5-Person Families | 0 (0.0%) | $0 |
| 6-Person Families | 26 (8.7%) | $0 |
| 7+ Person Families | 0 (0.0%) | $0 |
| Total | 297 (100.0%) | $71,458 |
Family Income by Number of Earners in Paincourtville
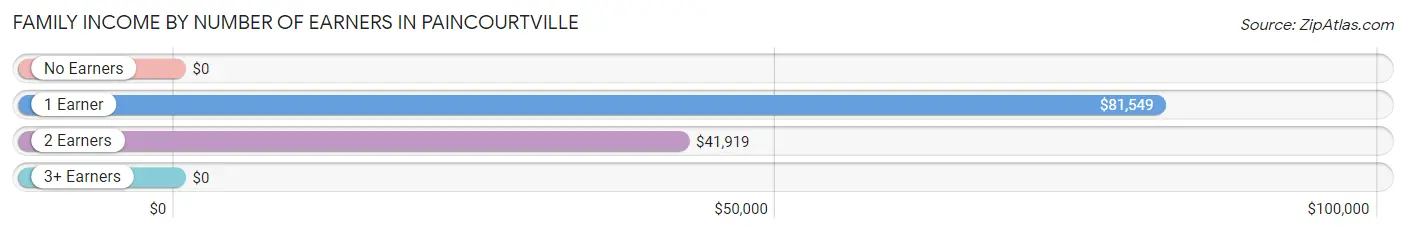
| Number of Earners | # Families | Median Income |
| No Earners | 13 (4.4%) | $0 |
| 1 Earner | 119 (40.1%) | $81,549 |
| 2 Earners | 147 (49.5%) | $41,919 |
| 3+ Earners | 18 (6.1%) | $0 |
| Total | 297 (100.0%) | $71,458 |
Household Income in Paincourtville
Household Income Brackets in Paincourtville
With 115 households falling in the category, the $50,000 to $74,999 income range is the most frequent in Paincourtville, accounting for 29.1% of all households.
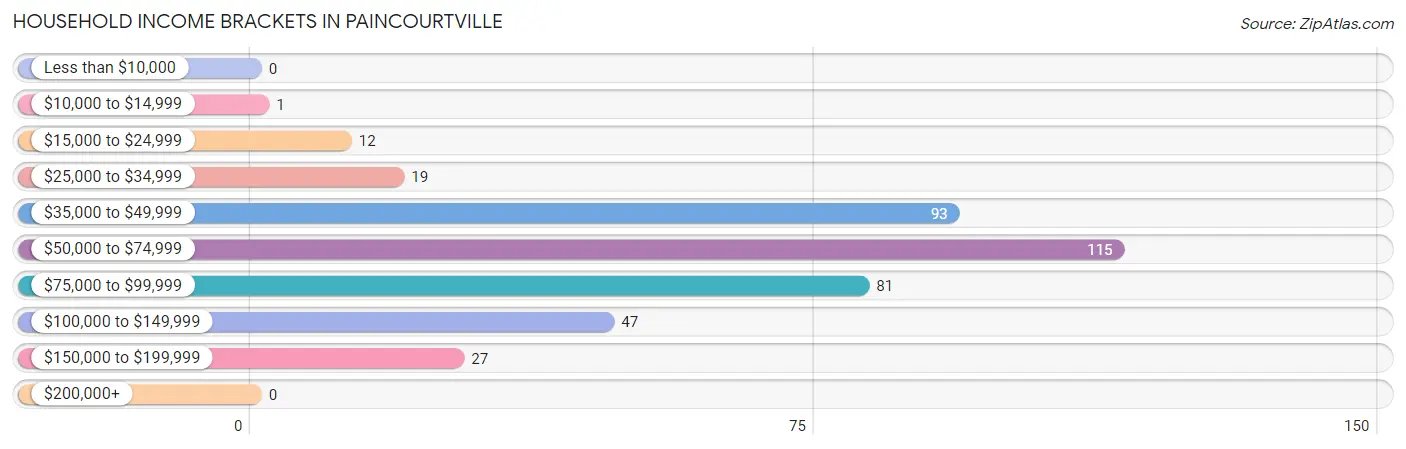
| Income Bracket | # Households | % Households |
| Less than $10,000 | 0 | 0.0% |
| $10,000 to $14,999 | 1 | 0.3% |
| $15,000 to $24,999 | 12 | 3.0% |
| $25,000 to $34,999 | 19 | 4.8% |
| $35,000 to $49,999 | 93 | 23.5% |
| $50,000 to $74,999 | 115 | 29.1% |
| $75,000 to $99,999 | 81 | 20.5% |
| $100,000 to $149,999 | 47 | 11.9% |
| $150,000 to $199,999 | 27 | 6.8% |
| $200,000+ | 0 | 0.0% |
Household Income by Householder Age in Paincourtville
The median household income in Paincourtville is $67,644, with the highest median household income of $72,361 found in the 45 to 64 years age bracket for the primary householder. A total of 268 households (67.8%) fall into this category. Meanwhile, the 15 to 24 years age bracket for the primary householder has the lowest median household income of $0, with 71 households (18.0%) in this group.
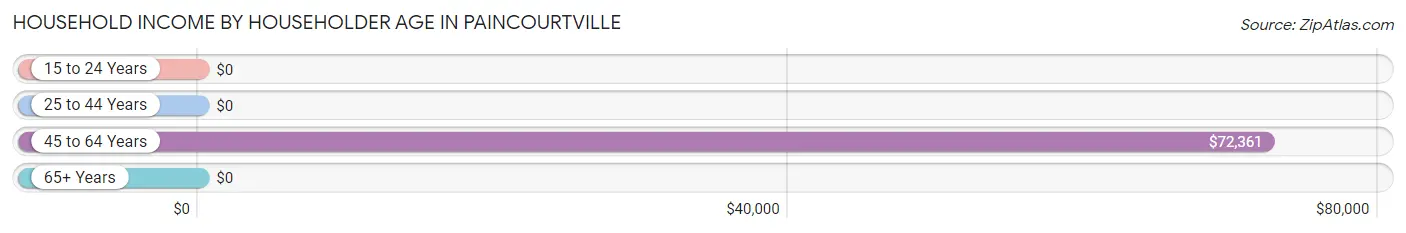
| Income Bracket | # Households | Median Income |
| 15 to 24 Years | 71 (18.0%) | $0 |
| 25 to 44 Years | 31 (7.9%) | $0 |
| 45 to 64 Years | 268 (67.8%) | $72,361 |
| 65+ Years | 25 (6.3%) | $0 |
| Total | 395 (100.0%) | $67,644 |
Poverty in Paincourtville
Income Below Poverty by Sex and Age in Paincourtville
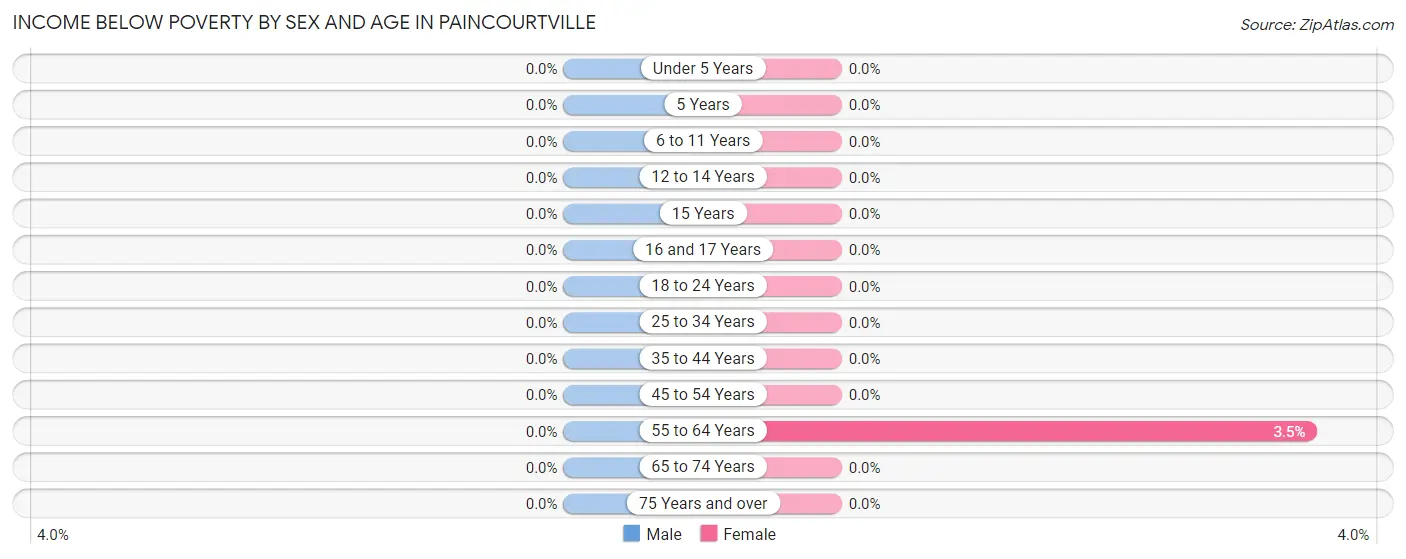
| Age Bracket | Male | Female |
| Under 5 Years | 0 (0.0%) | 0 (0.0%) |
| 5 Years | 0 (0.0%) | 0 (0.0%) |
| 6 to 11 Years | 0 (0.0%) | 0 (0.0%) |
| 12 to 14 Years | 0 (0.0%) | 0 (0.0%) |
| 15 Years | 0 (0.0%) | 0 (0.0%) |
| 16 and 17 Years | 0 (0.0%) | 0 (0.0%) |
| 18 to 24 Years | 0 (0.0%) | 0 (0.0%) |
| 25 to 34 Years | 0 (0.0%) | 0 (0.0%) |
| 35 to 44 Years | 0 (0.0%) | 0 (0.0%) |
| 45 to 54 Years | 0 (0.0%) | 0 (0.0%) |
| 55 to 64 Years | 0 (0.0%) | 3 (3.5%) |
| 65 to 74 Years | 0 (0.0%) | 0 (0.0%) |
| 75 Years and over | 0 (0.0%) | 0 (0.0%) |
| Total | 0 (0.0%) | 3 (0.3%) |
Income Above Poverty by Sex and Age in Paincourtville
According to the poverty statistics in Paincourtville, males aged under 5 years and females aged under 5 years are the age groups that are most secure financially, with 100.0% of males and 100.0% of females in these age groups living above the poverty line.
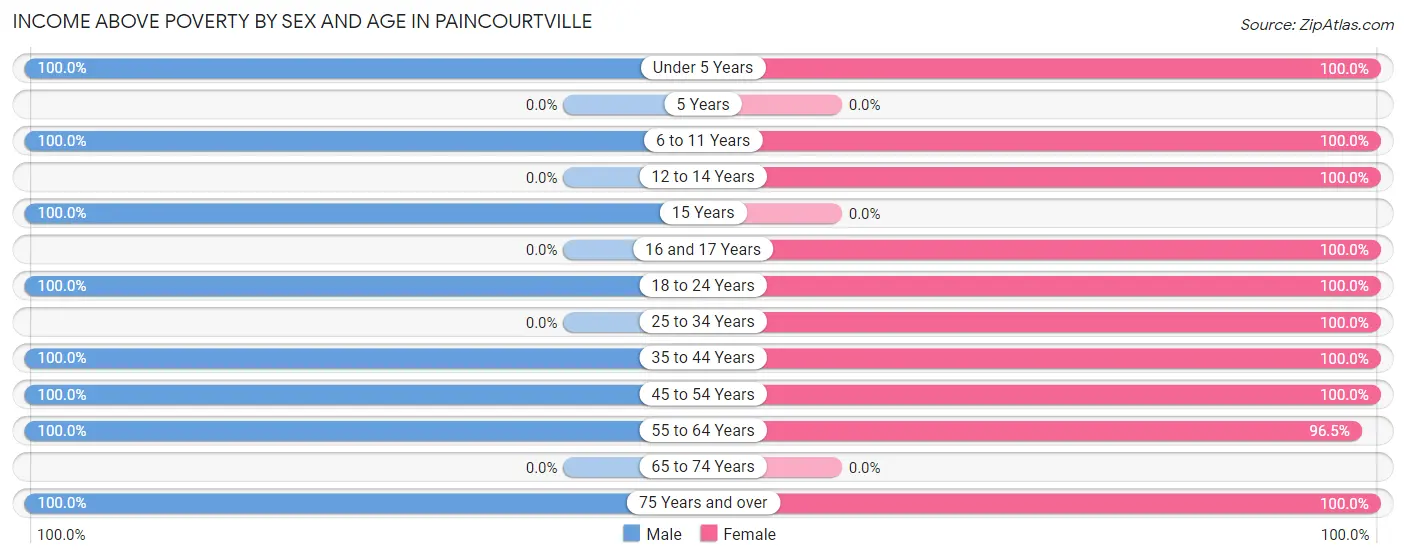
| Age Bracket | Male | Female |
| Under 5 Years | 73 (100.0%) | 114 (100.0%) |
| 5 Years | 0 (0.0%) | 0 (0.0%) |
| 6 to 11 Years | 17 (100.0%) | 106 (100.0%) |
| 12 to 14 Years | 0 (0.0%) | 52 (100.0%) |
| 15 Years | 34 (100.0%) | 0 (0.0%) |
| 16 and 17 Years | 0 (0.0%) | 23 (100.0%) |
| 18 to 24 Years | 169 (100.0%) | 218 (100.0%) |
| 25 to 34 Years | 0 (0.0%) | 66 (100.0%) |
| 35 to 44 Years | 23 (100.0%) | 49 (100.0%) |
| 45 to 54 Years | 66 (100.0%) | 174 (100.0%) |
| 55 to 64 Years | 21 (100.0%) | 82 (96.5%) |
| 65 to 74 Years | 0 (0.0%) | 0 (0.0%) |
| 75 Years and over | 14 (100.0%) | 25 (100.0%) |
| Total | 417 (100.0%) | 909 (99.7%) |
Income Below Poverty Among Married-Couple Families in Paincourtville
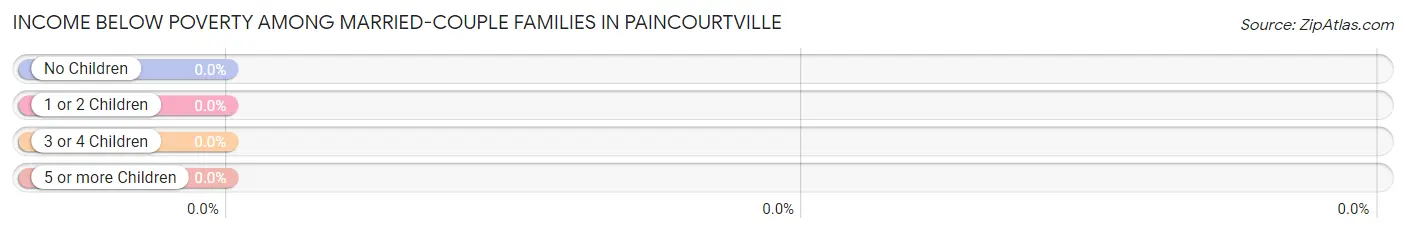
| Children | Above Poverty | Below Poverty |
| No Children | 79 (100.0%) | 0 (0.0%) |
| 1 or 2 Children | 27 (100.0%) | 0 (0.0%) |
| 3 or 4 Children | 0 (0.0%) | 0 (0.0%) |
| 5 or more Children | 0 (0.0%) | 0 (0.0%) |
| Total | 106 (100.0%) | 0 (0.0%) |
Income Below Poverty Among Single-Parent Households in Paincourtville
| Children | Single Father | Single Mother |
| No Children | 0 (0.0%) | 0 (0.0%) |
| 1 or 2 Children | 0 (0.0%) | 0 (0.0%) |
| 3 or 4 Children | 0 (0.0%) | 0 (0.0%) |
| 5 or more Children | 0 (0.0%) | 0 (0.0%) |
| Total | 0 (0.0%) | 0 (0.0%) |
Income Below Poverty Among Married-Couple vs Single-Parent Households in Paincourtville
| Children | Married-Couple Families | Single-Parent Households |
| No Children | 0 (0.0%) | 0 (0.0%) |
| 1 or 2 Children | 0 (0.0%) | 0 (0.0%) |
| 3 or 4 Children | 0 (0.0%) | 0 (0.0%) |
| 5 or more Children | 0 (0.0%) | 0 (0.0%) |
| Total | 0 (0.0%) | 0 (0.0%) |
Race in Paincourtville
The most populous races in Paincourtville are Black / African American (881 | 66.3%), White / Caucasian (324 | 24.4%), and Asian (80 | 6.0%).
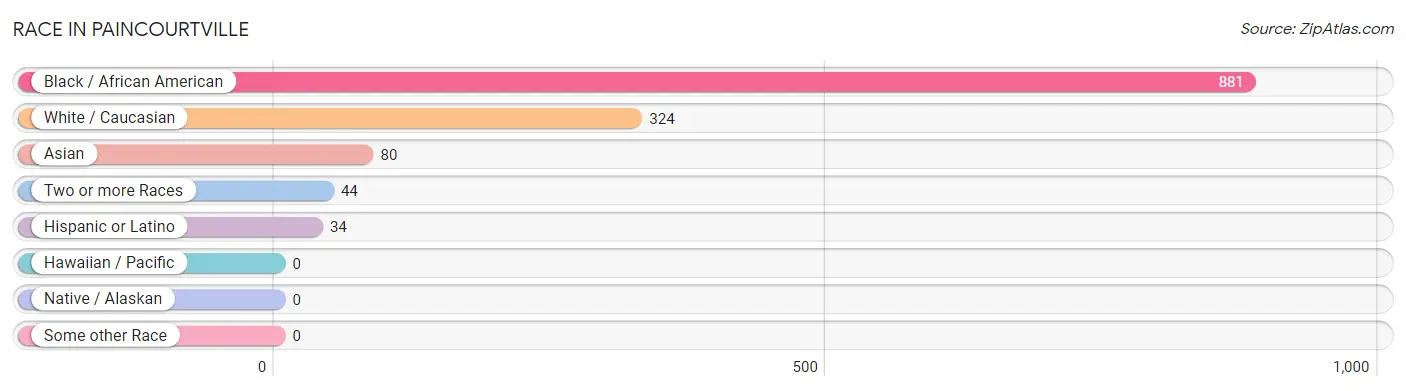
| Race | # Population | % Population |
| Asian | 80 | 6.0% |
| Black / African American | 881 | 66.3% |
| Hawaiian / Pacific | 0 | 0.0% |
| Hispanic or Latino | 34 | 2.6% |
| Native / Alaskan | 0 | 0.0% |
| White / Caucasian | 324 | 24.4% |
| Two or more Races | 44 | 3.3% |
| Some other Race | 0 | 0.0% |
| Total | 1,329 | 100.0% |
Ancestry in Paincourtville
The most populous ancestries reported in Paincourtville are French (212 | 16.0%), Irish (118 | 8.9%), Sri Lankan (80 | 6.0%), French Canadian (53 | 4.0%), and German (34 | 2.6%), together accounting for 37.4% of all Paincourtville residents.
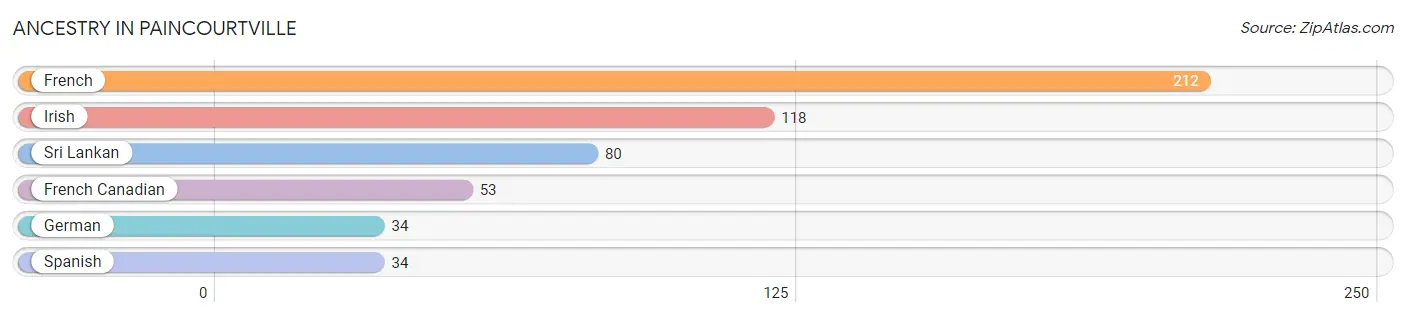
| Ancestry | # Population | % Population |
| French | 212 | 16.0% |
| French Canadian | 53 | 4.0% |
| German | 34 | 2.6% |
| Irish | 118 | 8.9% |
| Spanish | 34 | 2.6% |
| Sri Lankan | 80 | 6.0% | View All 6 Rows |
Immigrants in Paincourtville
The most numerous immigrant groups reported in Paincourtville came from Asia (80 | 6.0%), South Eastern Asia (80 | 6.0%), and Vietnam (80 | 6.0%), together accounting for 18.1% of all Paincourtville residents.
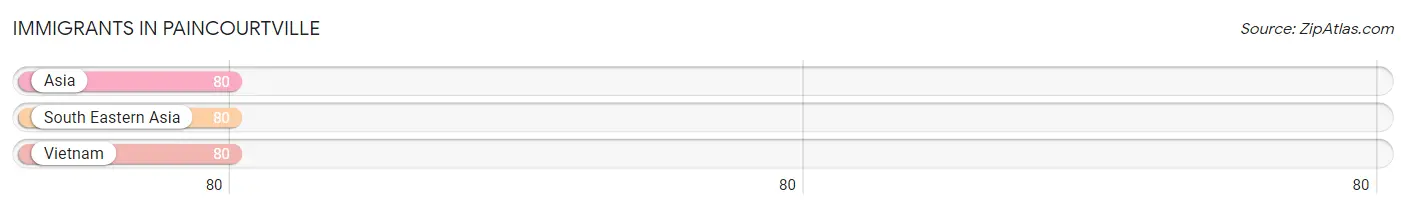
| Immigration Origin | # Population | % Population |
| Asia | 80 | 6.0% |
| South Eastern Asia | 80 | 6.0% |
| Vietnam | 80 | 6.0% | View All 3 Rows |
Sex and Age in Paincourtville
Sex and Age in Paincourtville
The most populous age groups in Paincourtville are 15 to 19 Years (203 | 48.7%) for men and 20 to 24 Years (218 | 23.9%) for women.
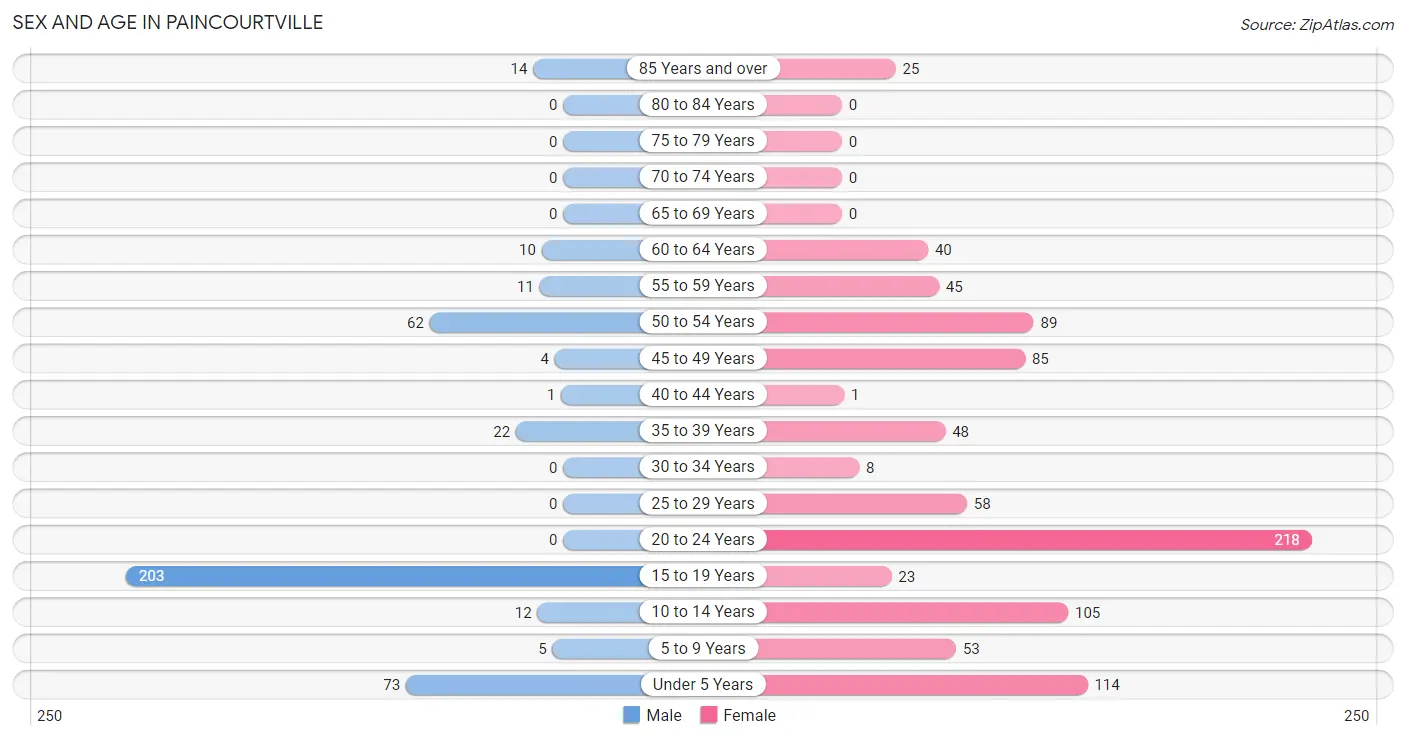
| Age Bracket | Male | Female |
| Under 5 Years | 73 (17.5%) | 114 (12.5%) |
| 5 to 9 Years | 5 (1.2%) | 53 (5.8%) |
| 10 to 14 Years | 12 (2.9%) | 105 (11.5%) |
| 15 to 19 Years | 203 (48.7%) | 23 (2.5%) |
| 20 to 24 Years | 0 (0.0%) | 218 (23.9%) |
| 25 to 29 Years | 0 (0.0%) | 58 (6.4%) |
| 30 to 34 Years | 0 (0.0%) | 8 (0.9%) |
| 35 to 39 Years | 22 (5.3%) | 48 (5.3%) |
| 40 to 44 Years | 1 (0.2%) | 1 (0.1%) |
| 45 to 49 Years | 4 (1.0%) | 85 (9.3%) |
| 50 to 54 Years | 62 (14.9%) | 89 (9.8%) |
| 55 to 59 Years | 11 (2.6%) | 45 (4.9%) |
| 60 to 64 Years | 10 (2.4%) | 40 (4.4%) |
| 65 to 69 Years | 0 (0.0%) | 0 (0.0%) |
| 70 to 74 Years | 0 (0.0%) | 0 (0.0%) |
| 75 to 79 Years | 0 (0.0%) | 0 (0.0%) |
| 80 to 84 Years | 0 (0.0%) | 0 (0.0%) |
| 85 Years and over | 14 (3.4%) | 25 (2.7%) |
| Total | 417 (100.0%) | 912 (100.0%) |
Families and Households in Paincourtville
Median Family Size in Paincourtville
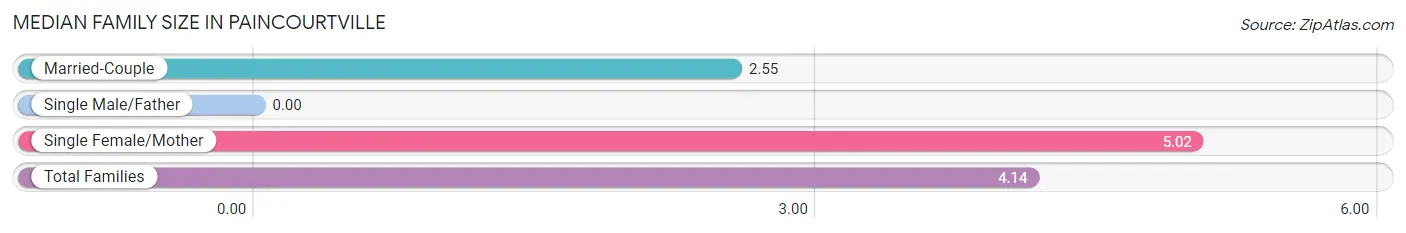
| Family Type | # Families | Family Size |
| Married-Couple | 106 (35.7%) | 2.55 |
| Single Male/Father | 0 (0.0%) | - |
| Single Female/Mother | 191 (64.3%) | 5.02 |
| Total Families | 297 (100.0%) | 4.14 |
Median Household Size in Paincourtville
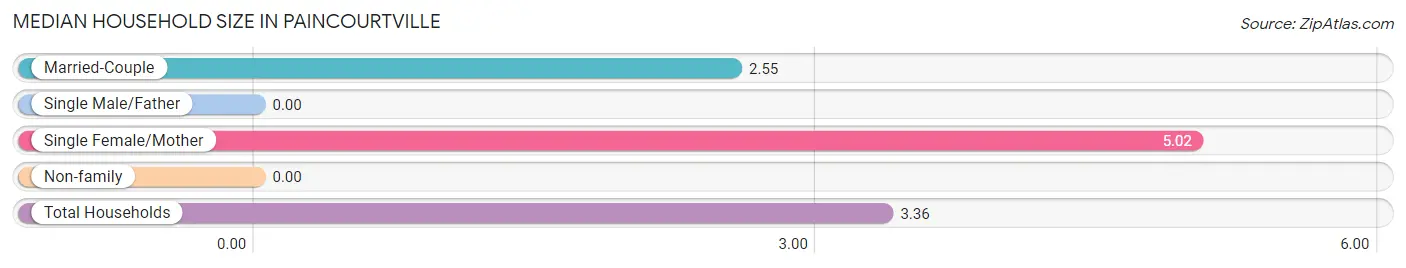
| Household Type | # Households | Household Size |
| Married-Couple | 106 (26.8%) | 2.55 |
| Single Male/Father | 0 (0.0%) | - |
| Single Female/Mother | 191 (48.3%) | 5.02 |
| Non-family | 98 (24.8%) | - |
| Total Households | 395 (100.0%) | 3.36 |
Household Size by Marriage Status in Paincourtville
Out of a total of 395 households in Paincourtville, 297 (75.2%) are family households, while 98 (24.8%) are nonfamily households. The most numerous type of family households are 2-person households, comprising 146, and the most common type of nonfamily households are 1-person households, comprising 98.
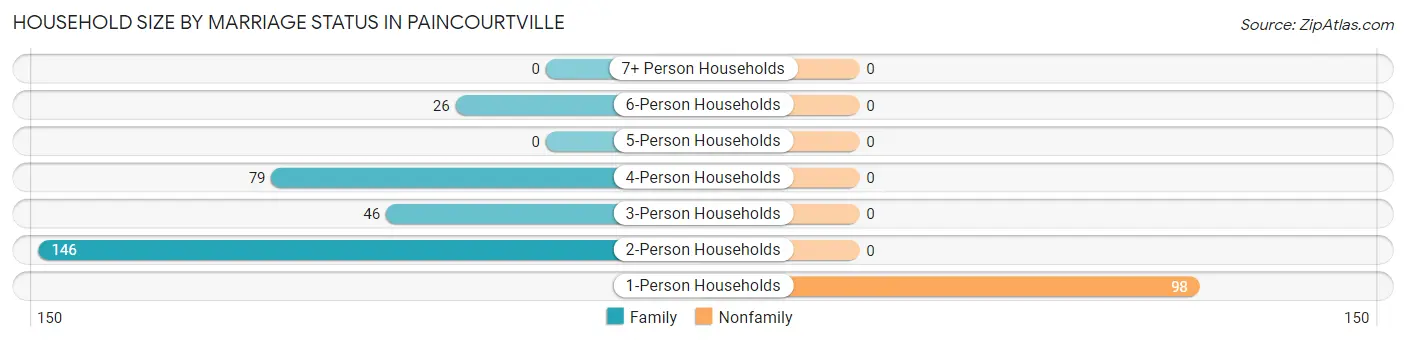
| Household Size | Family Households | Nonfamily Households |
| 1-Person Households | - | 98 (24.8%) |
| 2-Person Households | 146 (37.0%) | 0 (0.0%) |
| 3-Person Households | 46 (11.7%) | 0 (0.0%) |
| 4-Person Households | 79 (20.0%) | 0 (0.0%) |
| 5-Person Households | 0 (0.0%) | 0 (0.0%) |
| 6-Person Households | 26 (6.6%) | 0 (0.0%) |
| 7+ Person Households | 0 (0.0%) | 0 (0.0%) |
| Total | 297 (75.2%) | 98 (24.8%) |
Female Fertility in Paincourtville
Fertility by Age in Paincourtville
Average fertility rate in Paincourtville is 109.0 births per 1,000 women. Women in the age bracket of 35 to 50 years have the highest fertility rate with 358.0 births per 1,000 women. Women in the age bracket of 35 to 50 years acount for 100.0% of all women with births.
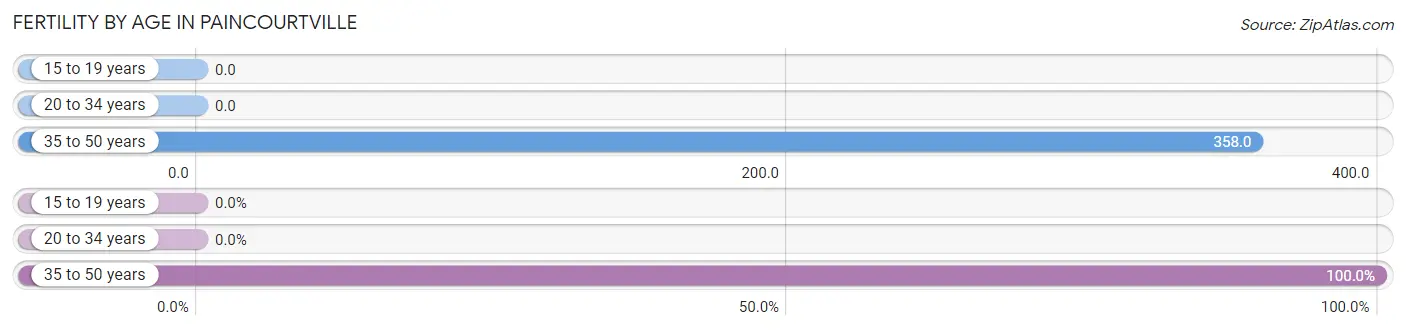
| Age Bracket | Women with Births | Births / 1,000 Women |
| 15 to 19 years | 0 (0.0%) | 0.0 |
| 20 to 34 years | 0 (0.0%) | 0.0 |
| 35 to 50 years | 48 (100.0%) | 358.0 |
| Total | 48 (100.0%) | 109.0 |
Fertility by Age by Marriage Status in Paincourtville
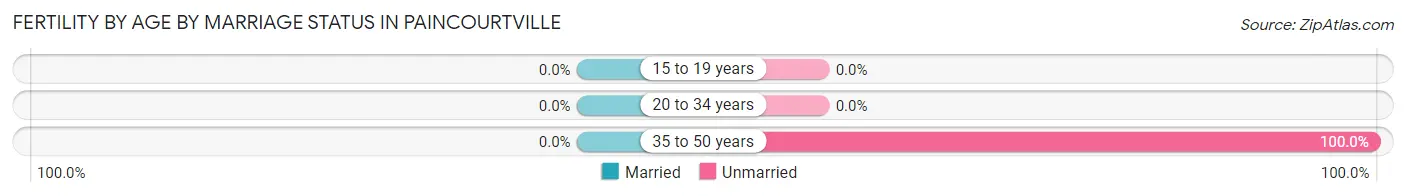
| Age Bracket | Married | Unmarried |
| 15 to 19 years | 0 (0.0%) | 0 (0.0%) |
| 20 to 34 years | 0 (0.0%) | 0 (0.0%) |
| 35 to 50 years | 0 (0.0%) | 48 (100.0%) |
| Total | 0 (0.0%) | 48 (100.0%) |
Fertility by Education in Paincourtville
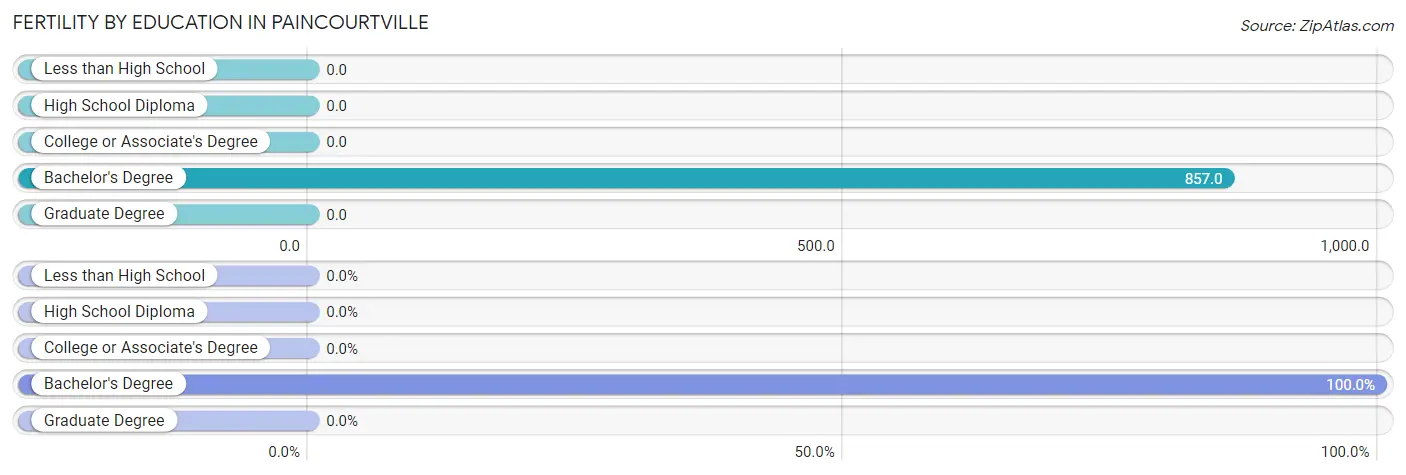
| Educational Attainment | Women with Births | Births / 1,000 Women |
| Less than High School | 0 (0.0%) | 0.0 |
| High School Diploma | 0 (0.0%) | 0.0 |
| College or Associate's Degree | 0 (0.0%) | 0.0 |
| Bachelor's Degree | 48 (100.0%) | 857.0 |
| Graduate Degree | 0 (0.0%) | 0.0 |
| Total | 48 (100.0%) | 109.0 |
Fertility by Education by Marriage Status in Paincourtville
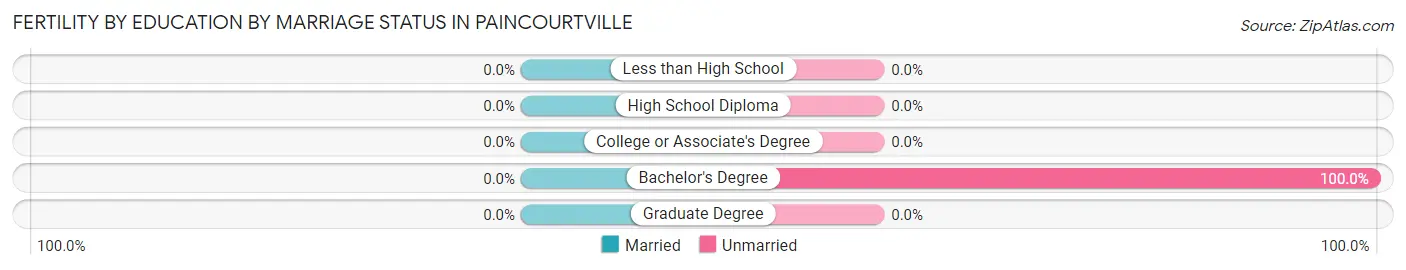
| Educational Attainment | Married | Unmarried |
| Less than High School | 0 (0.0%) | 0 (0.0%) |
| High School Diploma | 0 (0.0%) | 0 (0.0%) |
| College or Associate's Degree | 0 (0.0%) | 0 (0.0%) |
| Bachelor's Degree | 0 (0.0%) | 48 (100.0%) |
| Graduate Degree | 0 (0.0%) | 0 (0.0%) |
| Total | 0 (0.0%) | 48 (100.0%) |
Employment Characteristics in Paincourtville
Employment by Class of Employer in Paincourtville
Among the 704 employed individuals in Paincourtville, private company employees (576 | 81.8%), local government employees (127 | 18.0%), and not-for-profit organizations (1 | 0.1%) make up the most common classes of employment.
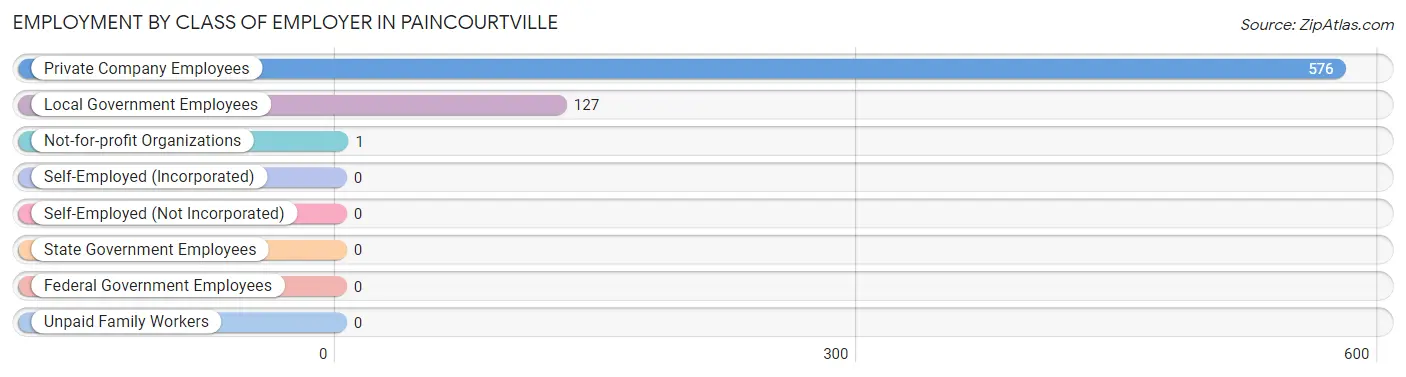
| Employer Class | # Employees | % Employees |
| Private Company Employees | 576 | 81.8% |
| Self-Employed (Incorporated) | 0 | 0.0% |
| Self-Employed (Not Incorporated) | 0 | 0.0% |
| Not-for-profit Organizations | 1 | 0.1% |
| Local Government Employees | 127 | 18.0% |
| State Government Employees | 0 | 0.0% |
| Federal Government Employees | 0 | 0.0% |
| Unpaid Family Workers | 0 | 0.0% |
| Total | 704 | 100.0% |
Employment Status by Age in Paincourtville
According to the labor force statistics for Paincourtville, out of the total population over 16 years of age (933), 80.1% or 747 individuals are in the labor force, with 5.8% or 43 of them unemployed. The age group with the highest labor force participation rate is 20 to 24 years, with 100.0% or 218 individuals in the labor force. Within the labor force, the 20 to 24 years age range has the highest percentage of unemployed individuals, with 14.7% or 32 of them being unemployed.
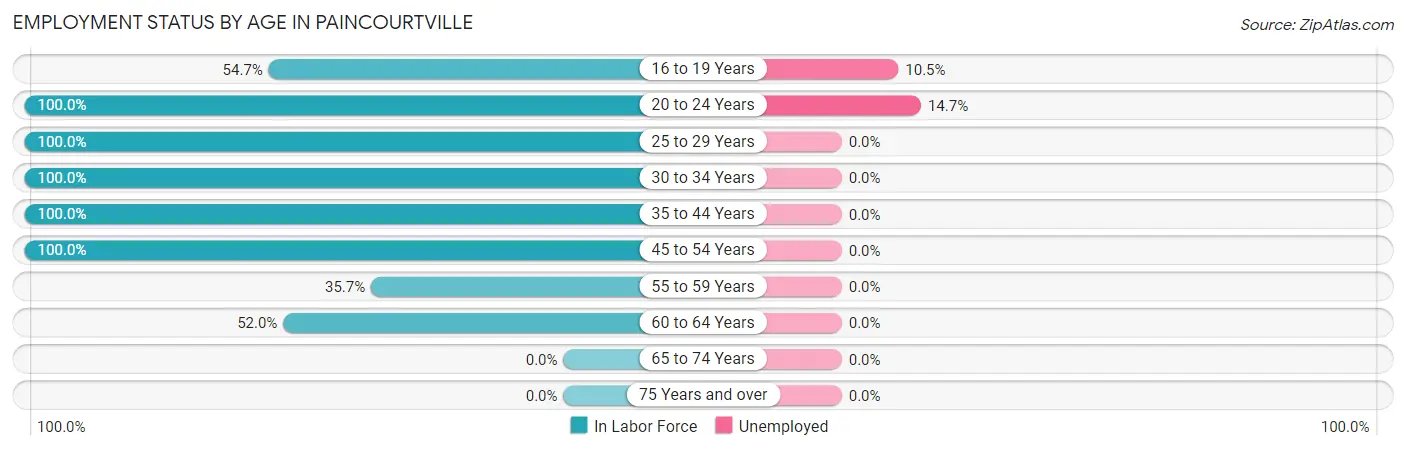
| Age Bracket | In Labor Force | Unemployed |
| 16 to 19 Years | 105 (54.7%) | 11 (10.5%) |
| 20 to 24 Years | 218 (100.0%) | 32 (14.7%) |
| 25 to 29 Years | 58 (100.0%) | 0 (0.0%) |
| 30 to 34 Years | 8 (100.0%) | 0 (0.0%) |
| 35 to 44 Years | 72 (100.0%) | 0 (0.0%) |
| 45 to 54 Years | 240 (100.0%) | 0 (0.0%) |
| 55 to 59 Years | 20 (35.7%) | 0 (0.0%) |
| 60 to 64 Years | 26 (52.0%) | 0 (0.0%) |
| 65 to 74 Years | 0 (0.0%) | 0 (0.0%) |
| 75 Years and over | 0 (0.0%) | 0 (0.0%) |
| Total | 747 (80.1%) | 43 (5.8%) |
Employment Status by Educational Attainment in Paincourtville
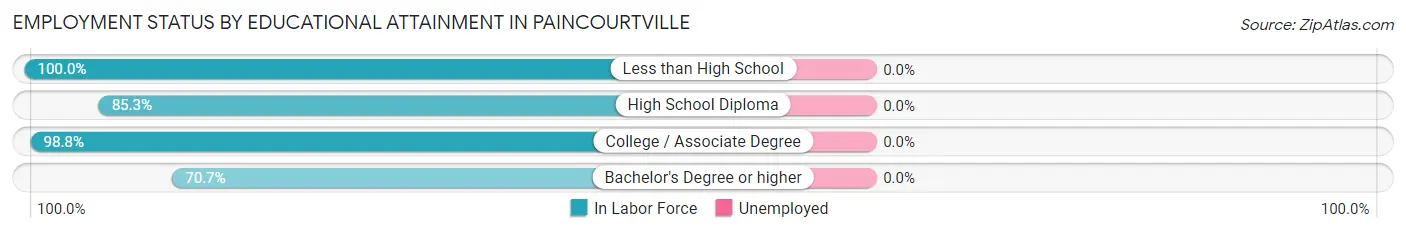
| Educational Attainment | In Labor Force | Unemployed |
| Less than High School | 35 (100.0%) | 0 (0.0%) |
| High School Diploma | 139 (85.3%) | 0 (0.0%) |
| College / Associate Degree | 168 (98.8%) | 0 (0.0%) |
| Bachelor's Degree or higher | 82 (70.7%) | 0 (0.0%) |
| Total | 424 (87.6%) | 0 (0.0%) |
Employment Occupations by Sex in Paincourtville
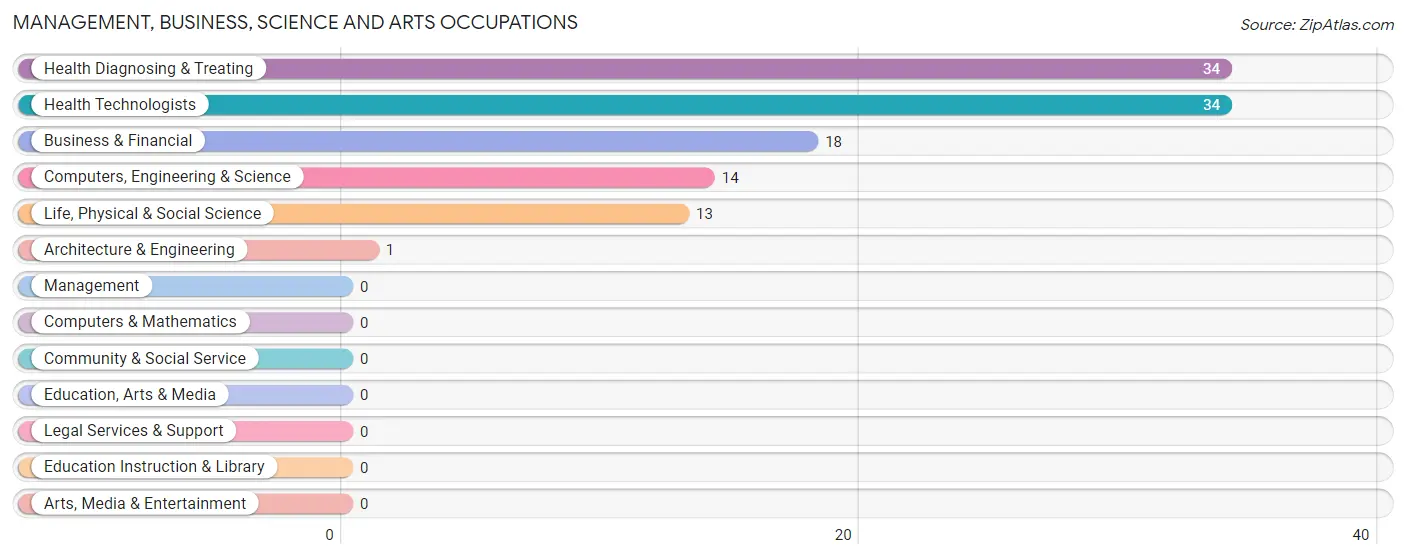
Management, Business, Science and Arts Occupations
The most common Management, Business, Science and Arts occupations in Paincourtville are Health Diagnosing & Treating (34 | 4.8%), Health Technologists (34 | 4.8%), Business & Financial (18 | 2.6%), Computers, Engineering & Science (14 | 2.0%), and Life, Physical & Social Science (13 | 1.8%).
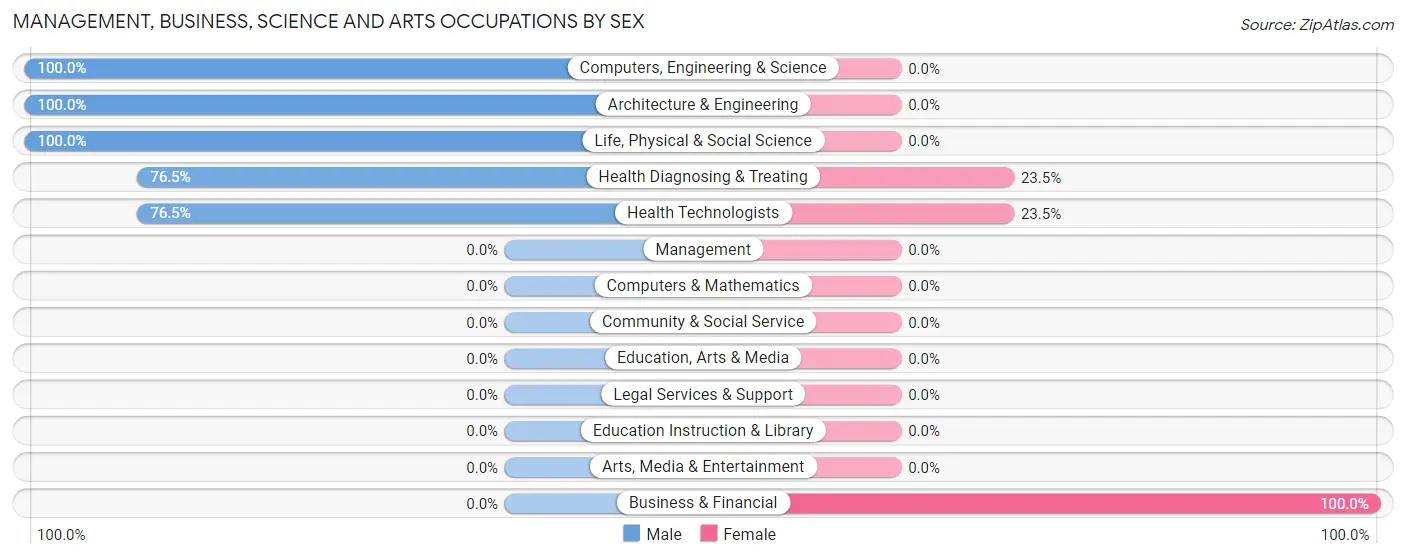
Management, Business, Science and Arts Occupations by Sex
Within the Management, Business, Science and Arts occupations in Paincourtville, the most male-oriented occupations are Computers, Engineering & Science (100.0%), Architecture & Engineering (100.0%), and Life, Physical & Social Science (100.0%), while the most female-oriented occupations are Business & Financial (100.0%), Health Diagnosing & Treating (23.5%), and Health Technologists (23.5%).
| Occupation | Male | Female |
| Management | 0 (0.0%) | 0 (0.0%) |
| Business & Financial | 0 (0.0%) | 18 (100.0%) |
| Computers, Engineering & Science | 14 (100.0%) | 0 (0.0%) |
| Computers & Mathematics | 0 (0.0%) | 0 (0.0%) |
| Architecture & Engineering | 1 (100.0%) | 0 (0.0%) |
| Life, Physical & Social Science | 13 (100.0%) | 0 (0.0%) |
| Community & Social Service | 0 (0.0%) | 0 (0.0%) |
| Education, Arts & Media | 0 (0.0%) | 0 (0.0%) |
| Legal Services & Support | 0 (0.0%) | 0 (0.0%) |
| Education Instruction & Library | 0 (0.0%) | 0 (0.0%) |
| Arts, Media & Entertainment | 0 (0.0%) | 0 (0.0%) |
| Health Diagnosing & Treating | 26 (76.5%) | 8 (23.5%) |
| Health Technologists | 26 (76.5%) | 8 (23.5%) |
| Total (Category) | 40 (60.6%) | 26 (39.4%) |
| Total (Overall) | 171 (24.3%) | 533 (75.7%) |
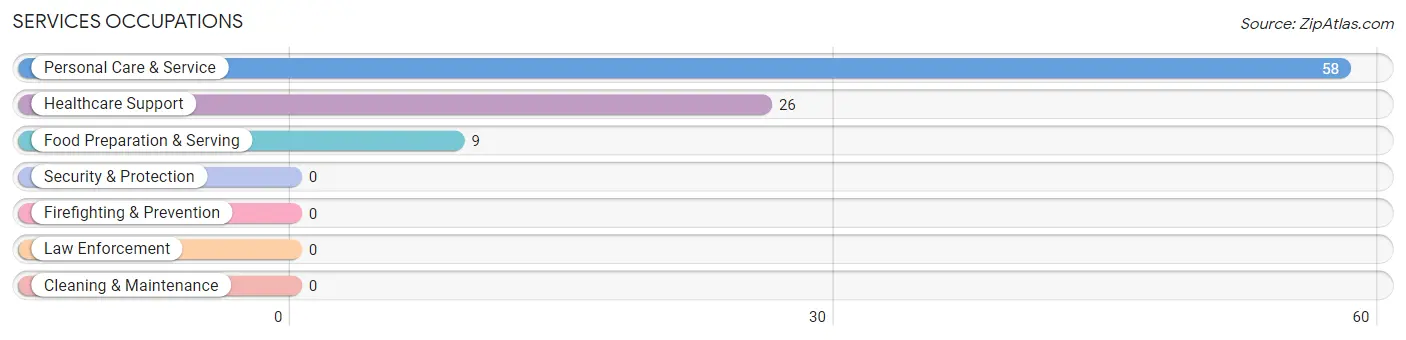
Services Occupations
The most common Services occupations in Paincourtville are Personal Care & Service (58 | 8.2%), Healthcare Support (26 | 3.7%), and Food Preparation & Serving (9 | 1.3%).
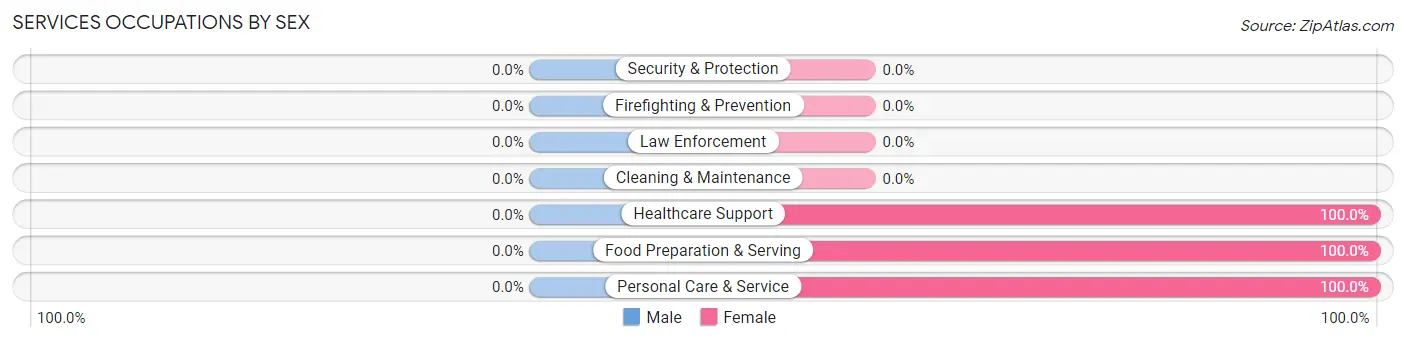
Services Occupations by Sex
| Occupation | Male | Female |
| Healthcare Support | 0 (0.0%) | 26 (100.0%) |
| Security & Protection | 0 (0.0%) | 0 (0.0%) |
| Firefighting & Prevention | 0 (0.0%) | 0 (0.0%) |
| Law Enforcement | 0 (0.0%) | 0 (0.0%) |
| Food Preparation & Serving | 0 (0.0%) | 9 (100.0%) |
| Cleaning & Maintenance | 0 (0.0%) | 0 (0.0%) |
| Personal Care & Service | 0 (0.0%) | 58 (100.0%) |
| Total (Category) | 0 (0.0%) | 93 (100.0%) |
| Total (Overall) | 171 (24.3%) | 533 (75.7%) |
Sales and Office Occupations
The most common Sales and Office occupations in Paincourtville are Sales & Related (220 | 31.2%), and Office & Administration (169 | 24.0%).

Sales and Office Occupations by Sex

| Occupation | Male | Female |
| Sales & Related | 11 (5.0%) | 209 (95.0%) |
| Office & Administration | 35 (20.7%) | 134 (79.3%) |
| Total (Category) | 46 (11.8%) | 343 (88.2%) |
| Total (Overall) | 171 (24.3%) | 533 (75.7%) |
Natural Resources, Construction and Maintenance Occupations
The most common Natural Resources, Construction and Maintenance occupations in Paincourtville are , and Installation, Maintenance & Repair (14 | 2.0%).

Natural Resources, Construction and Maintenance Occupations by Sex

| Occupation | Male | Female |
| Farming, Fishing & Forestry | 0 (0.0%) | 0 (0.0%) |
| Construction & Extraction | 0 (0.0%) | 0 (0.0%) |
| Installation, Maintenance & Repair | 14 (100.0%) | 0 (0.0%) |
| Total (Category) | 14 (100.0%) | 0 (0.0%) |
| Total (Overall) | 171 (24.3%) | 533 (75.7%) |
Production, Transportation and Moving Occupations
The most common Production, Transportation and Moving occupations in Paincourtville are Production (71 | 10.1%), and Transportation (71 | 10.1%).
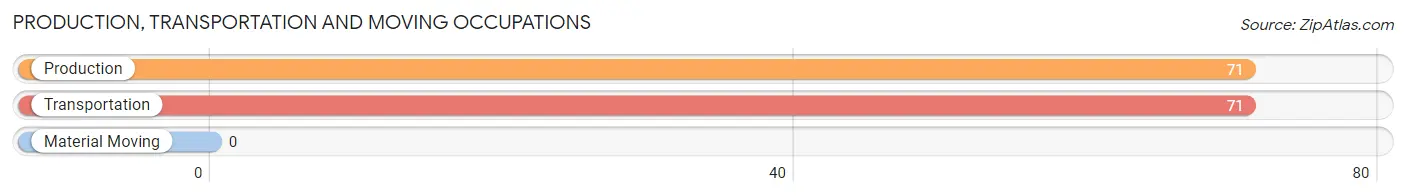
Production, Transportation and Moving Occupations by Sex

| Occupation | Male | Female |
| Production | 71 (100.0%) | 0 (0.0%) |
| Transportation | 0 (0.0%) | 71 (100.0%) |
| Material Moving | 0 (0.0%) | 0 (0.0%) |
| Total (Category) | 71 (50.0%) | 71 (50.0%) |
| Total (Overall) | 171 (24.3%) | 533 (75.7%) |
Employment Industries by Sex in Paincourtville
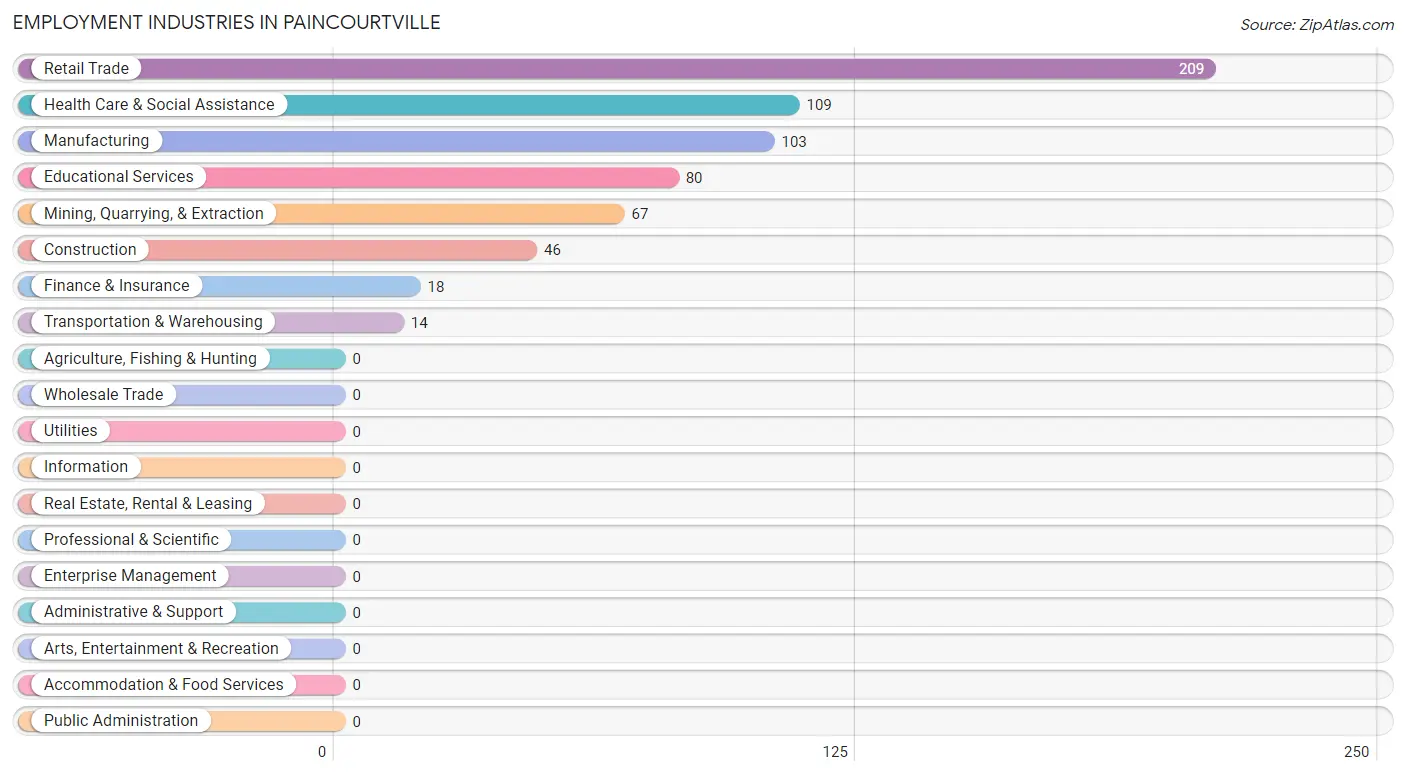
Employment Industries in Paincourtville
The major employment industries in Paincourtville include Retail Trade (209 | 29.7%), Health Care & Social Assistance (109 | 15.5%), Manufacturing (103 | 14.6%), Educational Services (80 | 11.4%), and Mining, Quarrying, & Extraction (67 | 9.5%).
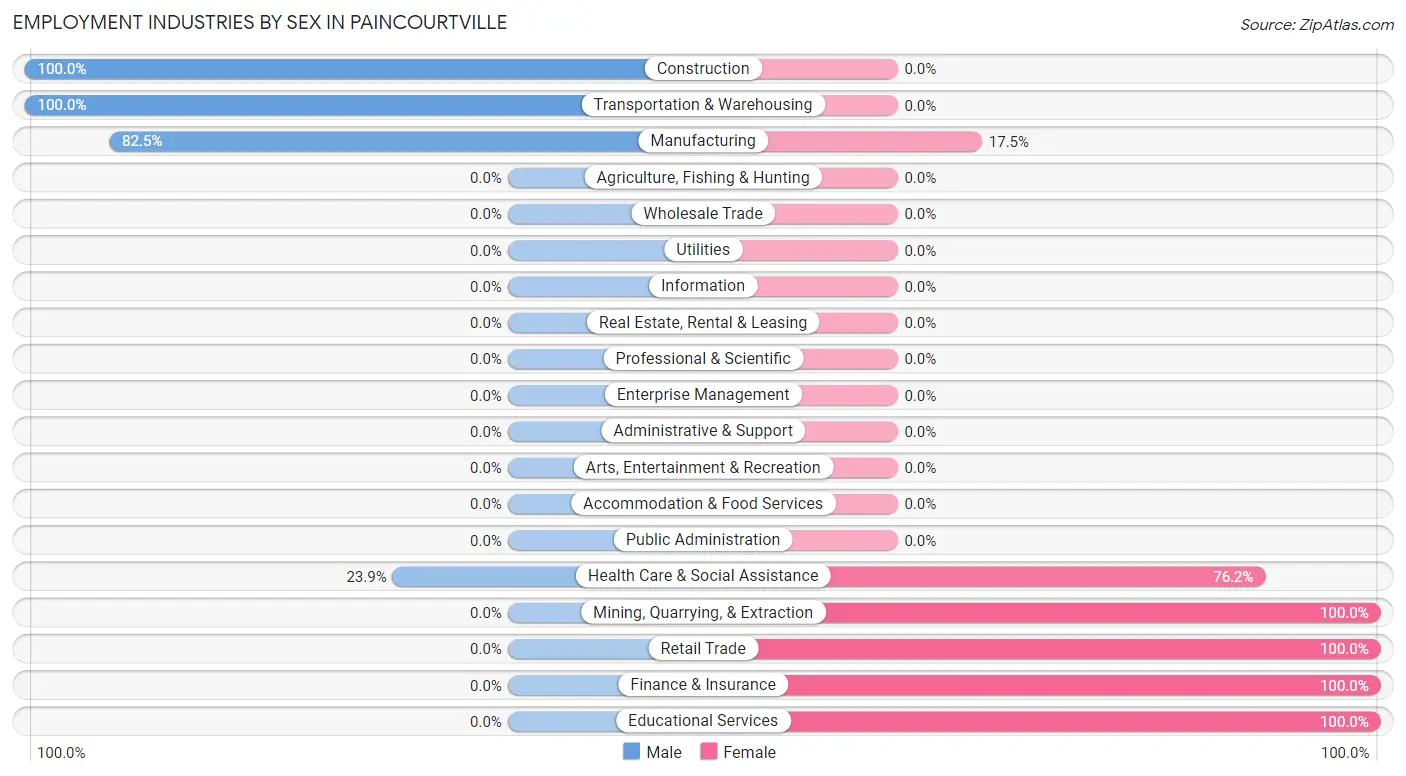
Employment Industries by Sex in Paincourtville
The Paincourtville industries that see more men than women are Construction (100.0%), Transportation & Warehousing (100.0%), and Manufacturing (82.5%), whereas the industries that tend to have a higher number of women are Mining, Quarrying, & Extraction (100.0%), Retail Trade (100.0%), and Finance & Insurance (100.0%).
| Industry | Male | Female |
| Agriculture, Fishing & Hunting | 0 (0.0%) | 0 (0.0%) |
| Mining, Quarrying, & Extraction | 0 (0.0%) | 67 (100.0%) |
| Construction | 46 (100.0%) | 0 (0.0%) |
| Manufacturing | 85 (82.5%) | 18 (17.5%) |
| Wholesale Trade | 0 (0.0%) | 0 (0.0%) |
| Retail Trade | 0 (0.0%) | 209 (100.0%) |
| Transportation & Warehousing | 14 (100.0%) | 0 (0.0%) |
| Utilities | 0 (0.0%) | 0 (0.0%) |
| Information | 0 (0.0%) | 0 (0.0%) |
| Finance & Insurance | 0 (0.0%) | 18 (100.0%) |
| Real Estate, Rental & Leasing | 0 (0.0%) | 0 (0.0%) |
| Professional & Scientific | 0 (0.0%) | 0 (0.0%) |
| Enterprise Management | 0 (0.0%) | 0 (0.0%) |
| Administrative & Support | 0 (0.0%) | 0 (0.0%) |
| Educational Services | 0 (0.0%) | 80 (100.0%) |
| Health Care & Social Assistance | 26 (23.8%) | 83 (76.1%) |
| Arts, Entertainment & Recreation | 0 (0.0%) | 0 (0.0%) |
| Accommodation & Food Services | 0 (0.0%) | 0 (0.0%) |
| Public Administration | 0 (0.0%) | 0 (0.0%) |
| Total | 171 (24.3%) | 533 (75.7%) |
Education in Paincourtville
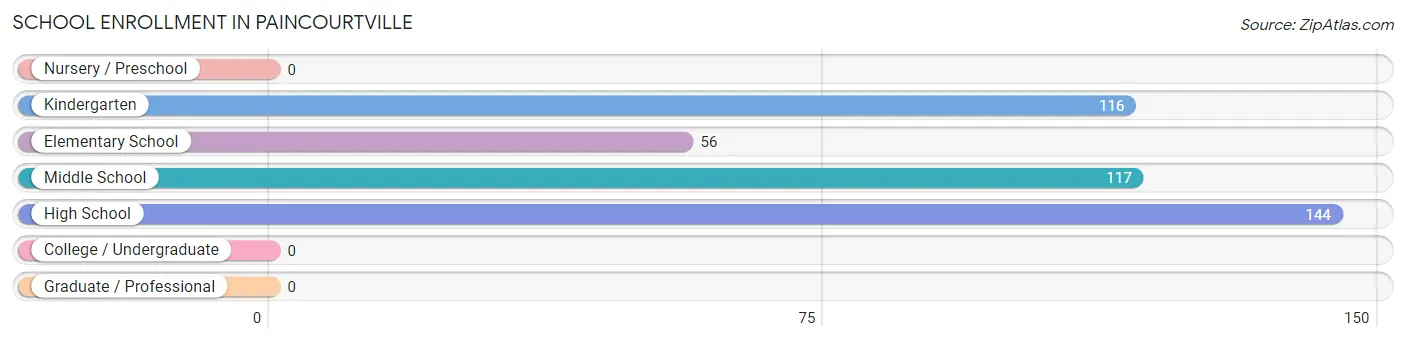
School Enrollment in Paincourtville
The most common levels of schooling among the 433 students in Paincourtville are high school (144 | 33.3%), middle school (117 | 27.0%), and kindergarten (116 | 26.8%).
| School Level | # Students | % Students |
| Nursery / Preschool | 0 | 0.0% |
| Kindergarten | 116 | 26.8% |
| Elementary School | 56 | 12.9% |
| Middle School | 117 | 27.0% |
| High School | 144 | 33.3% |
| College / Undergraduate | 0 | 0.0% |
| Graduate / Professional | 0 | 0.0% |
| Total | 433 | 100.0% |
School Enrollment by Age by Funding Source in Paincourtville
Out of a total of 433 students who are enrolled in schools in Paincourtville, 16 (3.7%) attend a private institution, while the remaining 417 (96.3%) are enrolled in public schools. The age group of 10 to 14 year olds has the highest likelihood of being enrolled in private schools, with 12 (10.3% in the age bracket) enrolled. Conversely, the age group of 3 to 4 year olds has the lowest likelihood of being enrolled in a private school, with 114 (100.0% in the age bracket) attending a public institution.
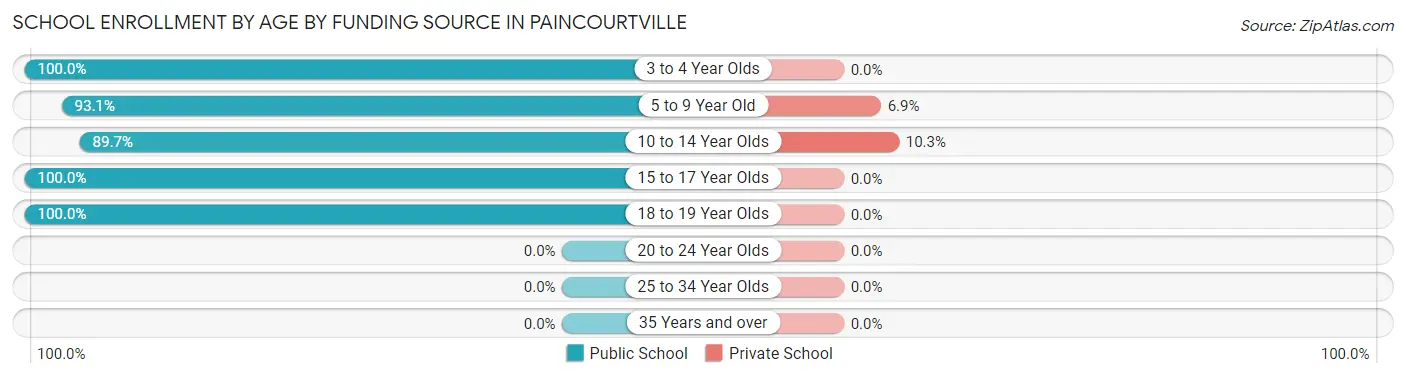
| Age Bracket | Public School | Private School |
| 3 to 4 Year Olds | 114 (100.0%) | 0 (0.0%) |
| 5 to 9 Year Old | 54 (93.1%) | 4 (6.9%) |
| 10 to 14 Year Olds | 105 (89.7%) | 12 (10.3%) |
| 15 to 17 Year Olds | 57 (100.0%) | 0 (0.0%) |
| 18 to 19 Year Olds | 87 (100.0%) | 0 (0.0%) |
| 20 to 24 Year Olds | 0 (0.0%) | 0 (0.0%) |
| 25 to 34 Year Olds | 0 (0.0%) | 0 (0.0%) |
| 35 Years and over | 0 (0.0%) | 0 (0.0%) |
| Total | 417 (96.3%) | 16 (3.7%) |
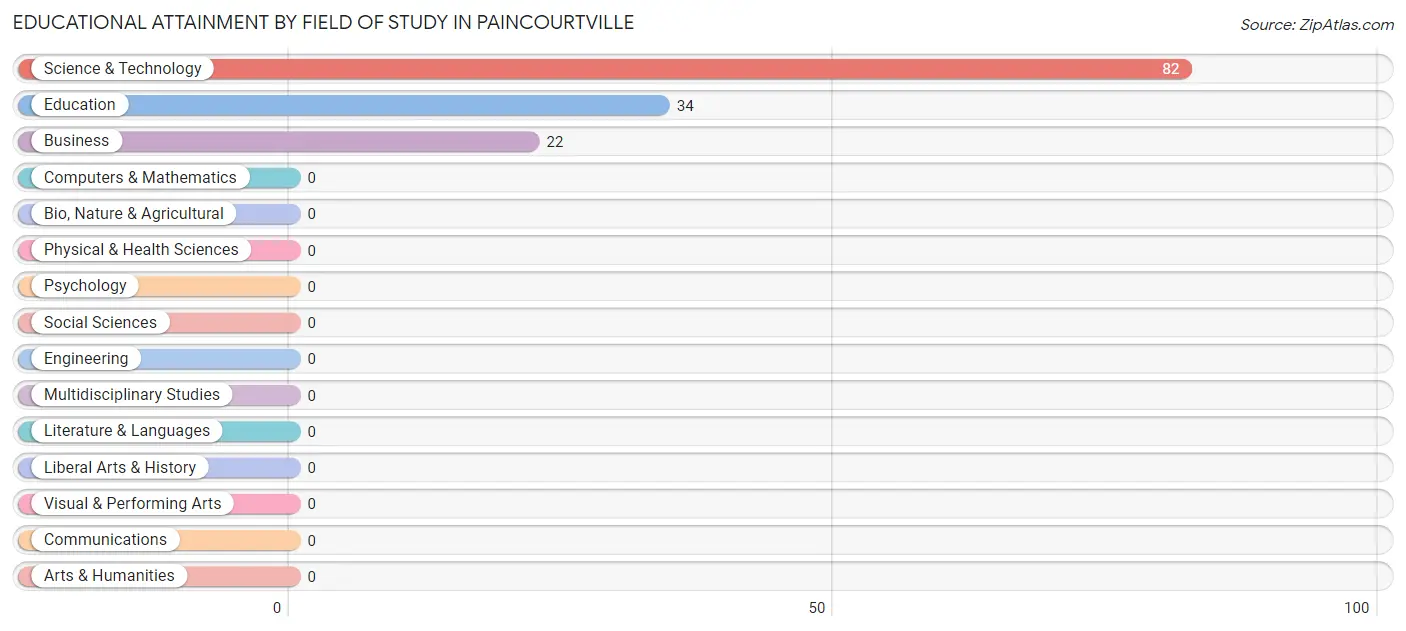
Educational Attainment by Field of Study in Paincourtville
Science & technology (82 | 59.4%), education (34 | 24.6%), and business (22 | 15.9%) are the most common fields of study among 138 individuals in Paincourtville who have obtained a bachelor's degree or higher.
| Field of Study | # Graduates | % Graduates |
| Computers & Mathematics | 0 | 0.0% |
| Bio, Nature & Agricultural | 0 | 0.0% |
| Physical & Health Sciences | 0 | 0.0% |
| Psychology | 0 | 0.0% |
| Social Sciences | 0 | 0.0% |
| Engineering | 0 | 0.0% |
| Multidisciplinary Studies | 0 | 0.0% |
| Science & Technology | 82 | 59.4% |
| Business | 22 | 15.9% |
| Education | 34 | 24.6% |
| Literature & Languages | 0 | 0.0% |
| Liberal Arts & History | 0 | 0.0% |
| Visual & Performing Arts | 0 | 0.0% |
| Communications | 0 | 0.0% |
| Arts & Humanities | 0 | 0.0% |
| Total | 138 | 100.0% |
Transportation & Commute in Paincourtville
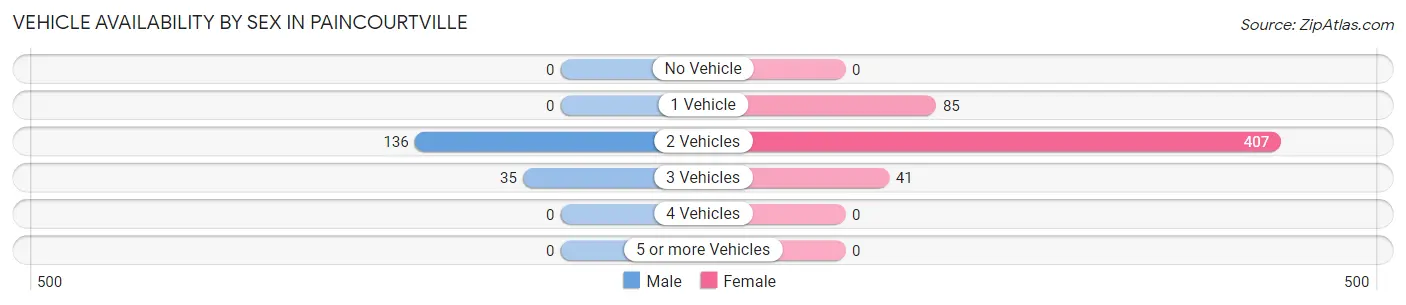
Vehicle Availability by Sex in Paincourtville
The most prevalent vehicle ownership categories in Paincourtville are males with 2 vehicles (136, accounting for 79.5%) and females with 2 vehicles (407, making up 25.5%).
| Vehicles Available | Male | Female |
| No Vehicle | 0 (0.0%) | 0 (0.0%) |
| 1 Vehicle | 0 (0.0%) | 85 (16.0%) |
| 2 Vehicles | 136 (79.5%) | 407 (76.4%) |
| 3 Vehicles | 35 (20.5%) | 41 (7.7%) |
| 4 Vehicles | 0 (0.0%) | 0 (0.0%) |
| 5 or more Vehicles | 0 (0.0%) | 0 (0.0%) |
| Total | 171 (100.0%) | 533 (100.0%) |
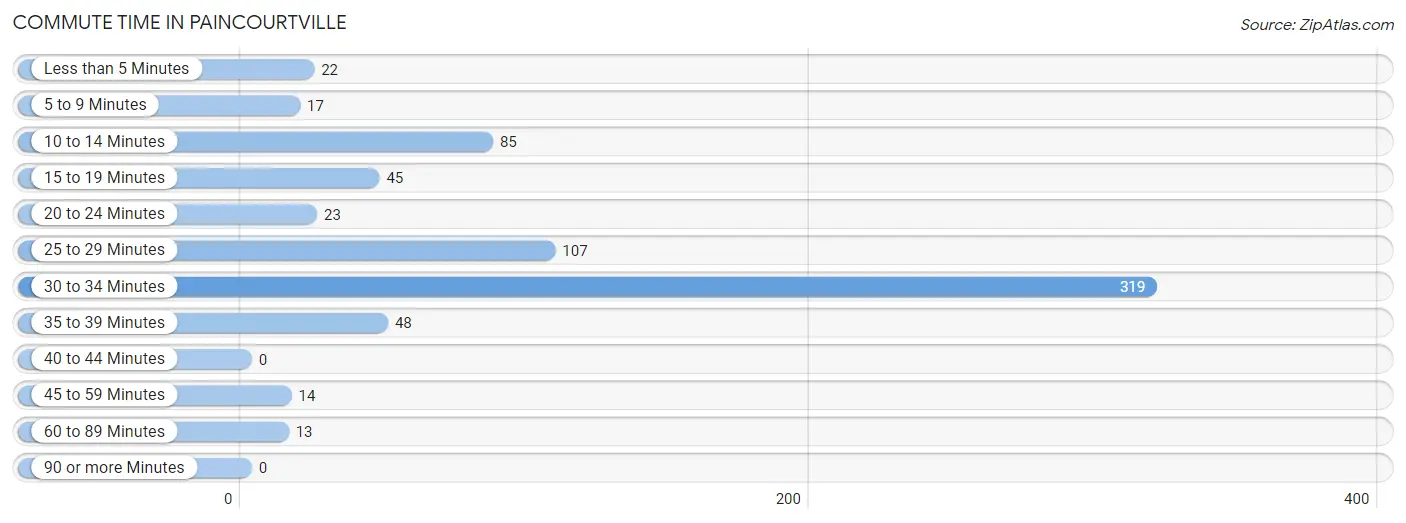
Commute Time in Paincourtville
The most frequently occuring commute durations in Paincourtville are 30 to 34 minutes (319 commuters, 46.0%), 25 to 29 minutes (107 commuters, 15.4%), and 10 to 14 minutes (85 commuters, 12.3%).
| Commute Time | # Commuters | % Commuters |
| Less than 5 Minutes | 22 | 3.2% |
| 5 to 9 Minutes | 17 | 2.5% |
| 10 to 14 Minutes | 85 | 12.3% |
| 15 to 19 Minutes | 45 | 6.5% |
| 20 to 24 Minutes | 23 | 3.3% |
| 25 to 29 Minutes | 107 | 15.4% |
| 30 to 34 Minutes | 319 | 46.0% |
| 35 to 39 Minutes | 48 | 6.9% |
| 40 to 44 Minutes | 0 | 0.0% |
| 45 to 59 Minutes | 14 | 2.0% |
| 60 to 89 Minutes | 13 | 1.9% |
| 90 or more Minutes | 0 | 0.0% |
Commute Time by Sex in Paincourtville
The most common commute times in Paincourtville are 25 to 29 minutes (107 commuters, 66.9%) for males and 30 to 34 minutes (315 commuters, 59.1%) for females.
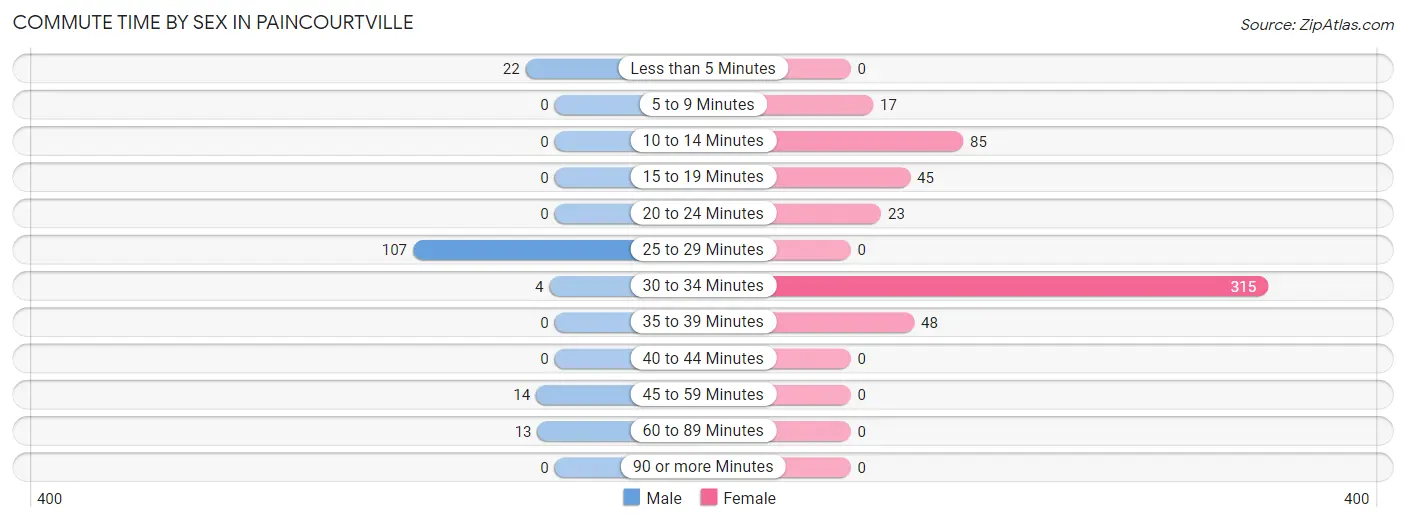
| Commute Time | Male | Female |
| Less than 5 Minutes | 22 (13.8%) | 0 (0.0%) |
| 5 to 9 Minutes | 0 (0.0%) | 17 (3.2%) |
| 10 to 14 Minutes | 0 (0.0%) | 85 (16.0%) |
| 15 to 19 Minutes | 0 (0.0%) | 45 (8.4%) |
| 20 to 24 Minutes | 0 (0.0%) | 23 (4.3%) |
| 25 to 29 Minutes | 107 (66.9%) | 0 (0.0%) |
| 30 to 34 Minutes | 4 (2.5%) | 315 (59.1%) |
| 35 to 39 Minutes | 0 (0.0%) | 48 (9.0%) |
| 40 to 44 Minutes | 0 (0.0%) | 0 (0.0%) |
| 45 to 59 Minutes | 14 (8.7%) | 0 (0.0%) |
| 60 to 89 Minutes | 13 (8.1%) | 0 (0.0%) |
| 90 or more Minutes | 0 (0.0%) | 0 (0.0%) |
Time of Departure to Work by Sex in Paincourtville
The most frequent times of departure to work in Paincourtville are 5:00 AM to 5:29 AM (71, 44.4%) for males and 9:00 AM to 9:59 AM (257, 48.2%) for females.
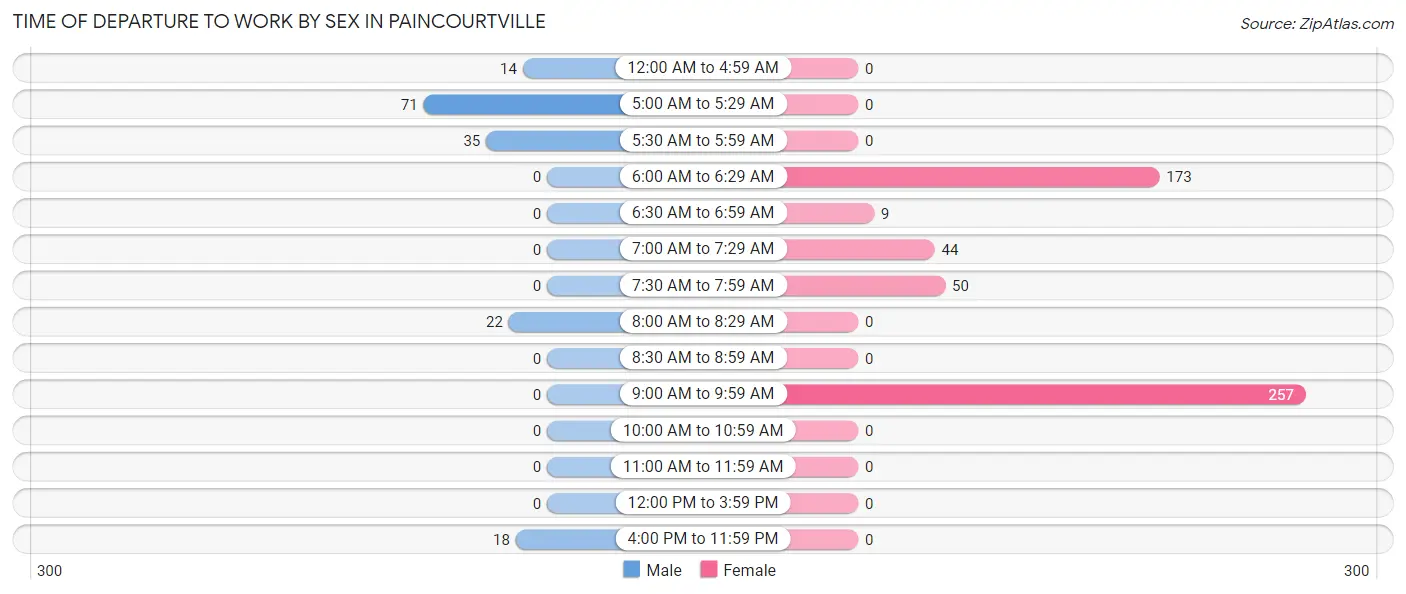
| Time of Departure | Male | Female |
| 12:00 AM to 4:59 AM | 14 (8.7%) | 0 (0.0%) |
| 5:00 AM to 5:29 AM | 71 (44.4%) | 0 (0.0%) |
| 5:30 AM to 5:59 AM | 35 (21.9%) | 0 (0.0%) |
| 6:00 AM to 6:29 AM | 0 (0.0%) | 173 (32.5%) |
| 6:30 AM to 6:59 AM | 0 (0.0%) | 9 (1.7%) |
| 7:00 AM to 7:29 AM | 0 (0.0%) | 44 (8.3%) |
| 7:30 AM to 7:59 AM | 0 (0.0%) | 50 (9.4%) |
| 8:00 AM to 8:29 AM | 22 (13.8%) | 0 (0.0%) |
| 8:30 AM to 8:59 AM | 0 (0.0%) | 0 (0.0%) |
| 9:00 AM to 9:59 AM | 0 (0.0%) | 257 (48.2%) |
| 10:00 AM to 10:59 AM | 0 (0.0%) | 0 (0.0%) |
| 11:00 AM to 11:59 AM | 0 (0.0%) | 0 (0.0%) |
| 12:00 PM to 3:59 PM | 0 (0.0%) | 0 (0.0%) |
| 4:00 PM to 11:59 PM | 18 (11.3%) | 0 (0.0%) |
| Total | 160 (100.0%) | 533 (100.0%) |
Housing Occupancy in Paincourtville
Occupancy by Ownership in Paincourtville
Of the total 395 dwellings in Paincourtville, owner-occupied units account for 231 (58.5%), while renter-occupied units make up 164 (41.5%).
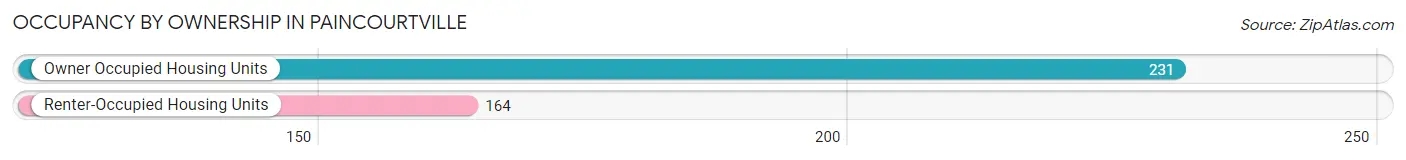
| Occupancy | # Housing Units | % Housing Units |
| Owner Occupied Housing Units | 231 | 58.5% |
| Renter-Occupied Housing Units | 164 | 41.5% |
| Total Occupied Housing Units | 395 | 100.0% |
Occupancy by Household Size in Paincourtville
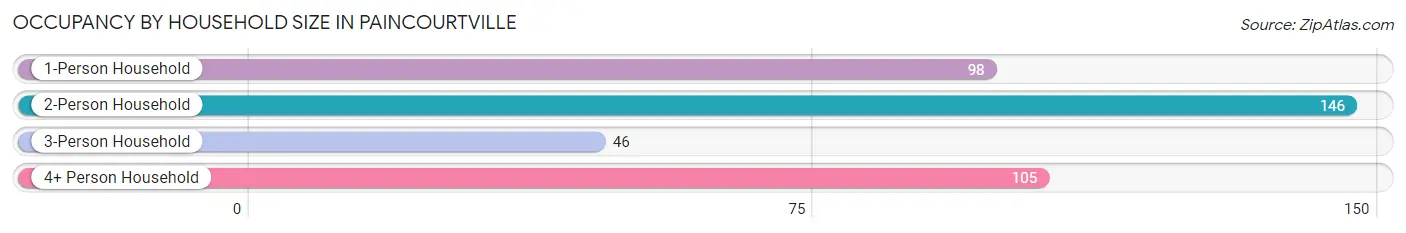
| Household Size | # Housing Units | % Housing Units |
| 1-Person Household | 98 | 24.8% |
| 2-Person Household | 146 | 37.0% |
| 3-Person Household | 46 | 11.7% |
| 4+ Person Household | 105 | 26.6% |
| Total Housing Units | 395 | 100.0% |
Occupancy by Ownership by Household Size in Paincourtville
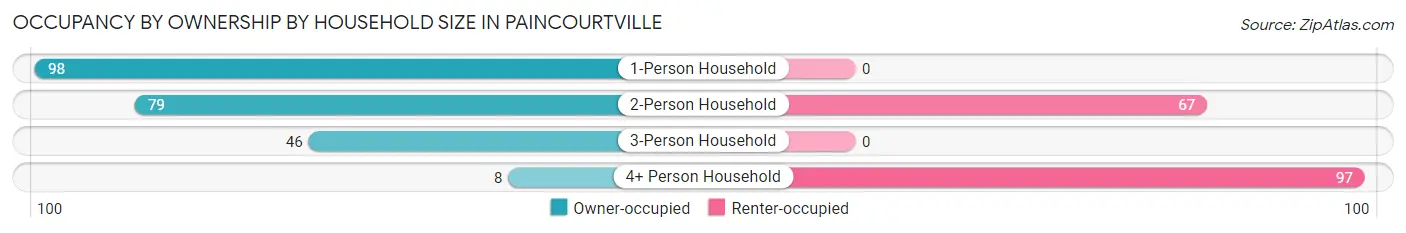
| Household Size | Owner-occupied | Renter-occupied |
| 1-Person Household | 98 (100.0%) | 0 (0.0%) |
| 2-Person Household | 79 (54.1%) | 67 (45.9%) |
| 3-Person Household | 46 (100.0%) | 0 (0.0%) |
| 4+ Person Household | 8 (7.6%) | 97 (92.4%) |
| Total Housing Units | 231 (58.5%) | 164 (41.5%) |
Occupancy by Educational Attainment in Paincourtville
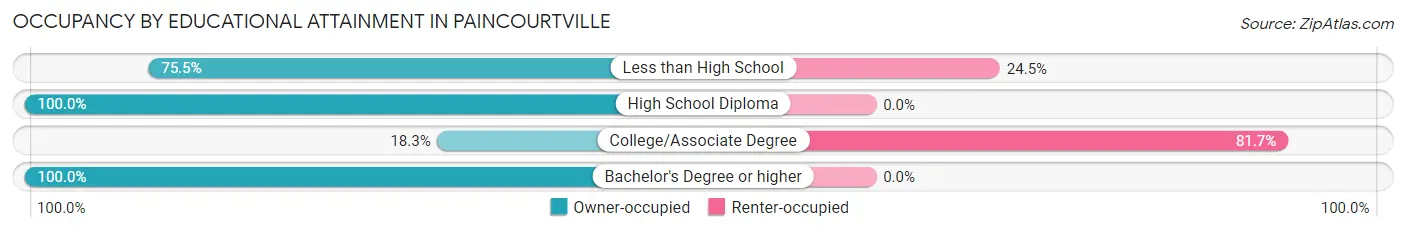
| Household Size | Owner-occupied | Renter-occupied |
| Less than High School | 80 (75.5%) | 26 (24.5%) |
| High School Diploma | 56 (100.0%) | 0 (0.0%) |
| College/Associate Degree | 31 (18.3%) | 138 (81.7%) |
| Bachelor's Degree or higher | 64 (100.0%) | 0 (0.0%) |
Occupancy by Age of Householder in Paincourtville
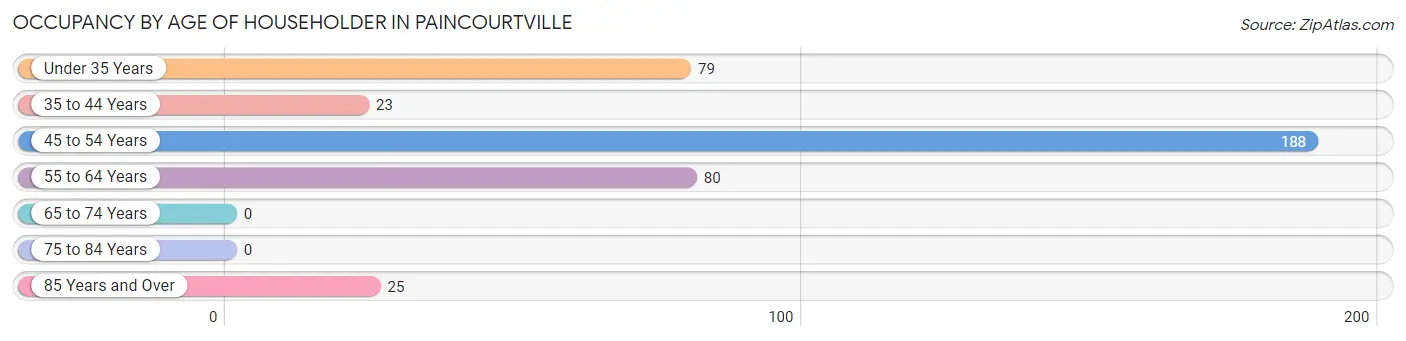
| Age Bracket | # Households | % Households |
| Under 35 Years | 79 | 20.0% |
| 35 to 44 Years | 23 | 5.8% |
| 45 to 54 Years | 188 | 47.6% |
| 55 to 64 Years | 80 | 20.3% |
| 65 to 74 Years | 0 | 0.0% |
| 75 to 84 Years | 0 | 0.0% |
| 85 Years and Over | 25 | 6.3% |
| Total | 395 | 100.0% |
Housing Finances in Paincourtville
Median Income by Occupancy in Paincourtville
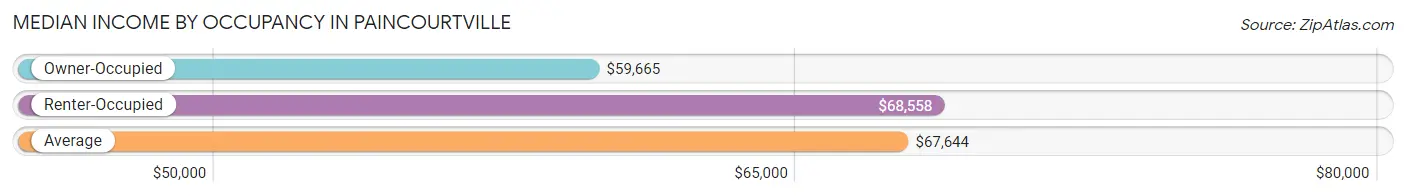
| Occupancy Type | # Households | Median Income |
| Owner-Occupied | 231 (58.5%) | $59,665 |
| Renter-Occupied | 164 (41.5%) | $68,558 |
| Average | 395 (100.0%) | $67,644 |
Occupancy by Householder Income Bracket in Paincourtville
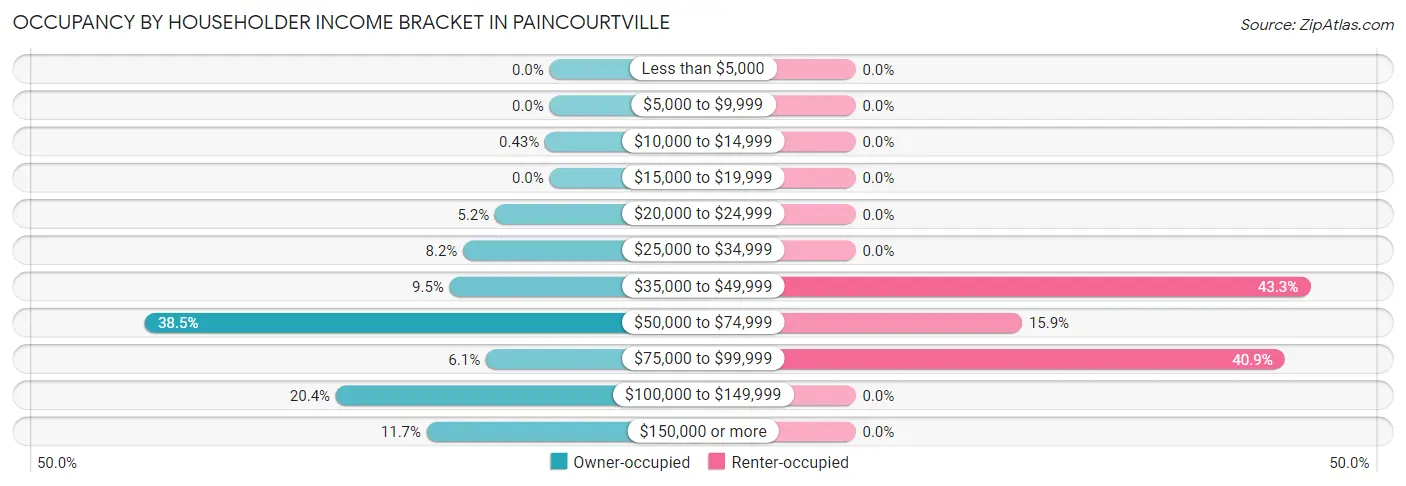
| Income Bracket | Owner-occupied | Renter-occupied |
| Less than $5,000 | 0 (0.0%) | 0 (0.0%) |
| $5,000 to $9,999 | 0 (0.0%) | 0 (0.0%) |
| $10,000 to $14,999 | 1 (0.4%) | 0 (0.0%) |
| $15,000 to $19,999 | 0 (0.0%) | 0 (0.0%) |
| $20,000 to $24,999 | 12 (5.2%) | 0 (0.0%) |
| $25,000 to $34,999 | 19 (8.2%) | 0 (0.0%) |
| $35,000 to $49,999 | 22 (9.5%) | 71 (43.3%) |
| $50,000 to $74,999 | 89 (38.5%) | 26 (15.9%) |
| $75,000 to $99,999 | 14 (6.1%) | 67 (40.8%) |
| $100,000 to $149,999 | 47 (20.3%) | 0 (0.0%) |
| $150,000 or more | 27 (11.7%) | 0 (0.0%) |
| Total | 231 (100.0%) | 164 (100.0%) |
Monthly Housing Cost Tiers in Paincourtville
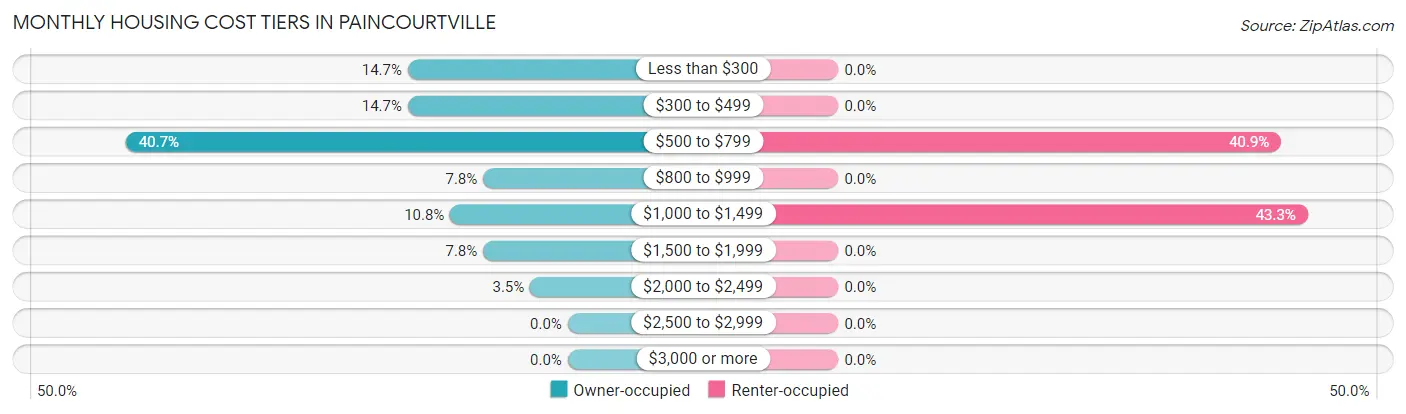
| Monthly Cost | Owner-occupied | Renter-occupied |
| Less than $300 | 34 (14.7%) | 0 (0.0%) |
| $300 to $499 | 34 (14.7%) | 0 (0.0%) |
| $500 to $799 | 94 (40.7%) | 67 (40.8%) |
| $800 to $999 | 18 (7.8%) | 0 (0.0%) |
| $1,000 to $1,499 | 25 (10.8%) | 71 (43.3%) |
| $1,500 to $1,999 | 18 (7.8%) | 0 (0.0%) |
| $2,000 to $2,499 | 8 (3.5%) | 0 (0.0%) |
| $2,500 to $2,999 | 0 (0.0%) | 0 (0.0%) |
| $3,000 or more | 0 (0.0%) | 0 (0.0%) |
| Total | 231 (100.0%) | 164 (100.0%) |
Physical Housing Characteristics in Paincourtville
Housing Structures in Paincourtville
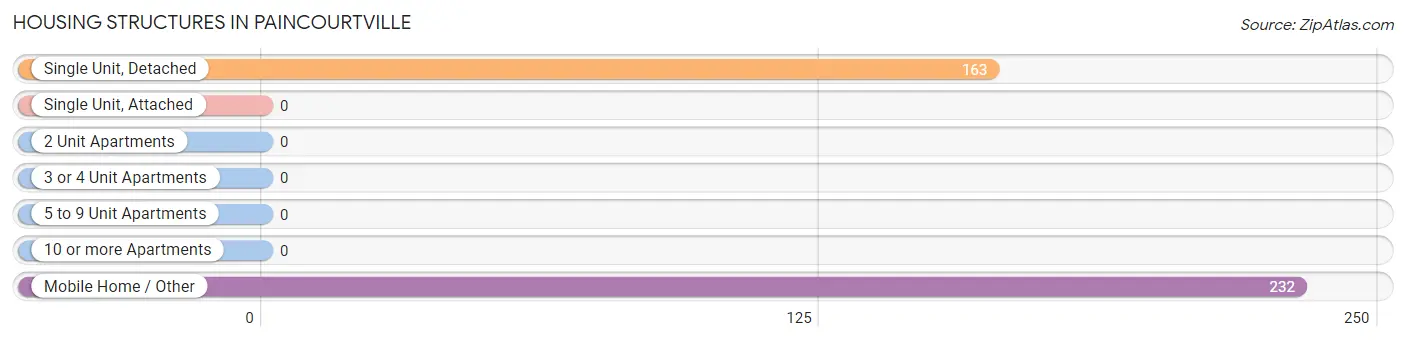
| Structure Type | # Housing Units | % Housing Units |
| Single Unit, Detached | 163 | 41.3% |
| Single Unit, Attached | 0 | 0.0% |
| 2 Unit Apartments | 0 | 0.0% |
| 3 or 4 Unit Apartments | 0 | 0.0% |
| 5 to 9 Unit Apartments | 0 | 0.0% |
| 10 or more Apartments | 0 | 0.0% |
| Mobile Home / Other | 232 | 58.7% |
| Total | 395 | 100.0% |
Housing Structures by Occupancy in Paincourtville
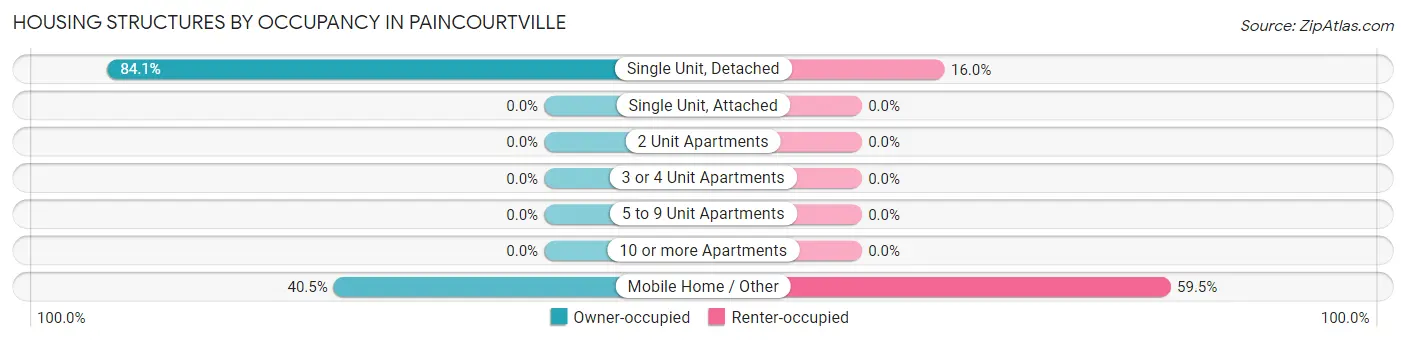
| Structure Type | Owner-occupied | Renter-occupied |
| Single Unit, Detached | 137 (84.1%) | 26 (16.0%) |
| Single Unit, Attached | 0 (0.0%) | 0 (0.0%) |
| 2 Unit Apartments | 0 (0.0%) | 0 (0.0%) |
| 3 or 4 Unit Apartments | 0 (0.0%) | 0 (0.0%) |
| 5 to 9 Unit Apartments | 0 (0.0%) | 0 (0.0%) |
| 10 or more Apartments | 0 (0.0%) | 0 (0.0%) |
| Mobile Home / Other | 94 (40.5%) | 138 (59.5%) |
| Total | 231 (58.5%) | 164 (41.5%) |
Housing Structures by Number of Rooms in Paincourtville
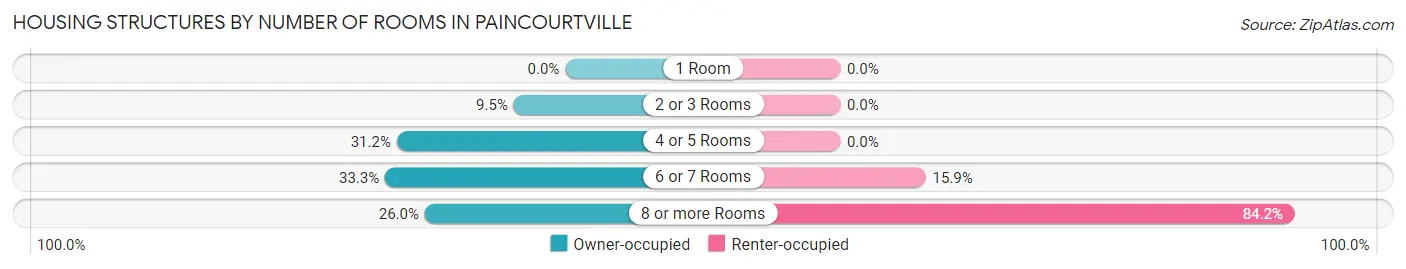
| Number of Rooms | Owner-occupied | Renter-occupied |
| 1 Room | 0 (0.0%) | 0 (0.0%) |
| 2 or 3 Rooms | 22 (9.5%) | 0 (0.0%) |
| 4 or 5 Rooms | 72 (31.2%) | 0 (0.0%) |
| 6 or 7 Rooms | 77 (33.3%) | 26 (15.9%) |
| 8 or more Rooms | 60 (26.0%) | 138 (84.2%) |
| Total | 231 (100.0%) | 164 (100.0%) |
Housing Structure by Heating Type in Paincourtville
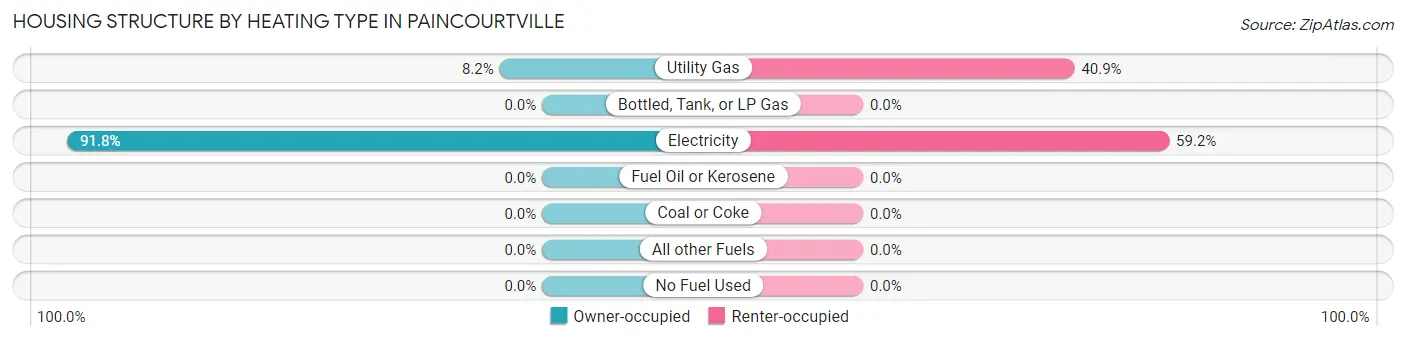
| Heating Type | Owner-occupied | Renter-occupied |
| Utility Gas | 19 (8.2%) | 67 (40.8%) |
| Bottled, Tank, or LP Gas | 0 (0.0%) | 0 (0.0%) |
| Electricity | 212 (91.8%) | 97 (59.2%) |
| Fuel Oil or Kerosene | 0 (0.0%) | 0 (0.0%) |
| Coal or Coke | 0 (0.0%) | 0 (0.0%) |
| All other Fuels | 0 (0.0%) | 0 (0.0%) |
| No Fuel Used | 0 (0.0%) | 0 (0.0%) |
| Total | 231 (100.0%) | 164 (100.0%) |
Household Vehicle Usage in Paincourtville
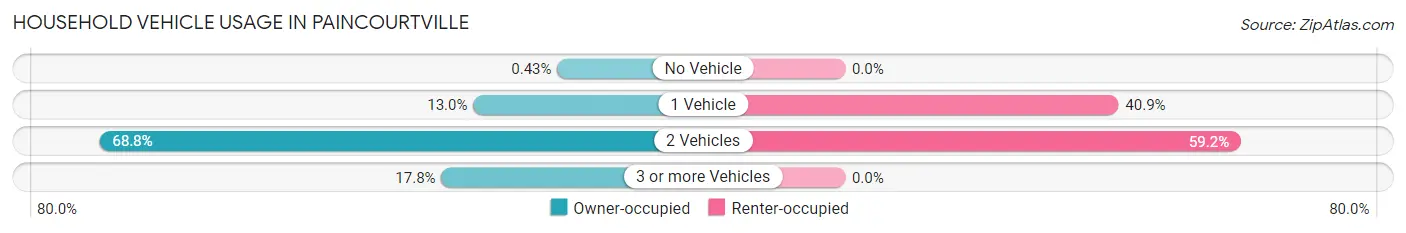
| Vehicles per Household | Owner-occupied | Renter-occupied |
| No Vehicle | 1 (0.4%) | 0 (0.0%) |
| 1 Vehicle | 30 (13.0%) | 67 (40.8%) |
| 2 Vehicles | 159 (68.8%) | 97 (59.2%) |
| 3 or more Vehicles | 41 (17.7%) | 0 (0.0%) |
| Total | 231 (100.0%) | 164 (100.0%) |
Real Estate & Mortgages in Paincourtville
Real Estate and Mortgage Overview in Paincourtville
| Characteristic | Without Mortgage | With Mortgage |
| Housing Units | 161 | 70 |
| Median Property Value | - | - |
| Median Household Income | $58,820 | $27 |
| Monthly Housing Costs | $518 | $0 |
| Real Estate Taxes | - | - |
Property Value by Mortgage Status in Paincourtville
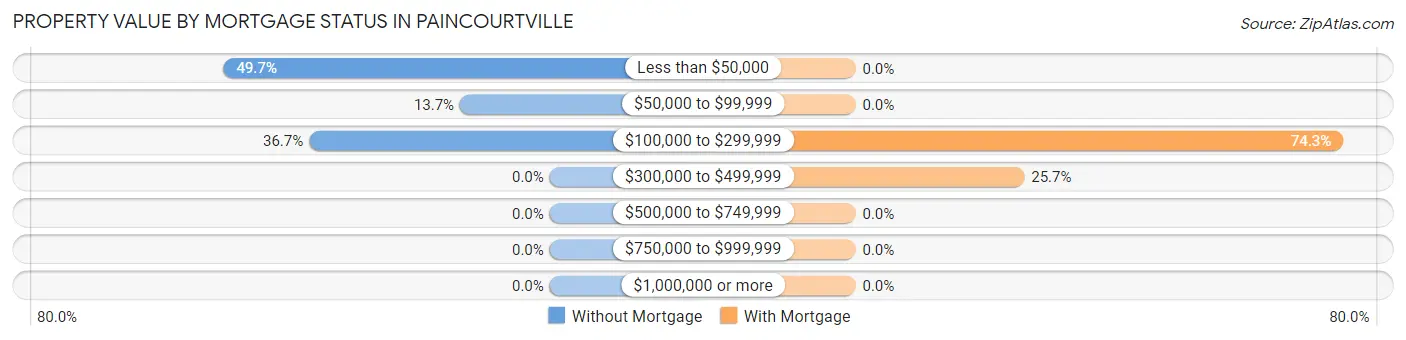
| Property Value | Without Mortgage | With Mortgage |
| Less than $50,000 | 80 (49.7%) | 0 (0.0%) |
| $50,000 to $99,999 | 22 (13.7%) | 0 (0.0%) |
| $100,000 to $299,999 | 59 (36.6%) | 52 (74.3%) |
| $300,000 to $499,999 | 0 (0.0%) | 18 (25.7%) |
| $500,000 to $749,999 | 0 (0.0%) | 0 (0.0%) |
| $750,000 to $999,999 | 0 (0.0%) | 0 (0.0%) |
| $1,000,000 or more | 0 (0.0%) | 0 (0.0%) |
| Total | 161 (100.0%) | 70 (100.0%) |
Household Income by Mortgage Status in Paincourtville
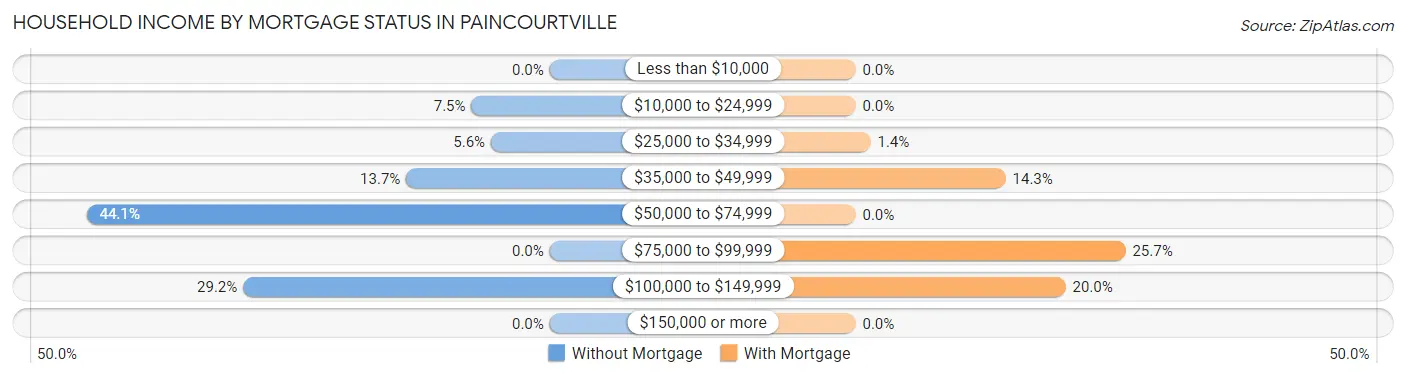
| Household Income | Without Mortgage | With Mortgage |
| Less than $10,000 | 0 (0.0%) | 0 (0.0%) |
| $10,000 to $24,999 | 12 (7.4%) | 0 (0.0%) |
| $25,000 to $34,999 | 9 (5.6%) | 1 (1.4%) |
| $35,000 to $49,999 | 22 (13.7%) | 10 (14.3%) |
| $50,000 to $74,999 | 71 (44.1%) | 0 (0.0%) |
| $75,000 to $99,999 | 0 (0.0%) | 18 (25.7%) |
| $100,000 to $149,999 | 47 (29.2%) | 14 (20.0%) |
| $150,000 or more | 0 (0.0%) | 0 (0.0%) |
| Total | 161 (100.0%) | 70 (100.0%) |
Property Value to Household Income Ratio in Paincourtville
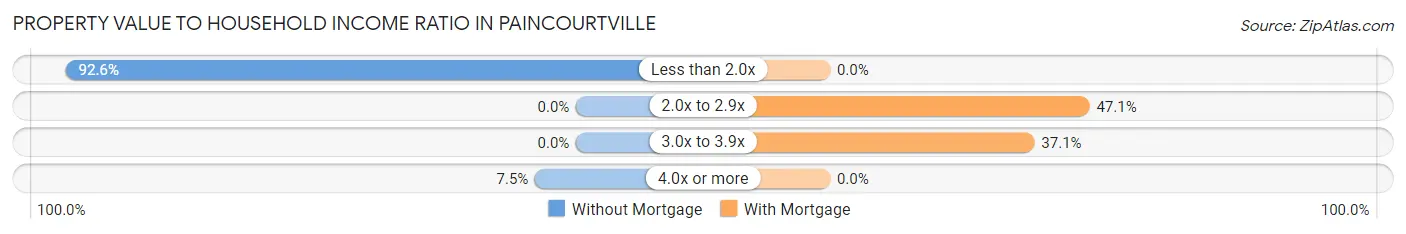
| Value-to-Income Ratio | Without Mortgage | With Mortgage |
| Less than 2.0x | 149 (92.5%) | 0 (0.0%) |
| 2.0x to 2.9x | 0 (0.0%) | 33 (47.1%) |
| 3.0x to 3.9x | 0 (0.0%) | 26 (37.1%) |
| 4.0x or more | 12 (7.4%) | 0 (0.0%) |
| Total | 161 (100.0%) | 70 (100.0%) |
Real Estate Taxes by Mortgage Status in Paincourtville
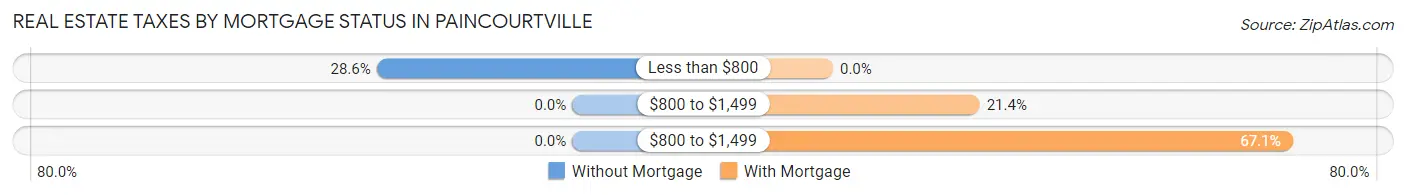
| Property Taxes | Without Mortgage | With Mortgage |
| Less than $800 | 46 (28.6%) | 0 (0.0%) |
| $800 to $1,499 | 0 (0.0%) | 15 (21.4%) |
| $800 to $1,499 | 0 (0.0%) | 47 (67.1%) |
| Total | 161 (100.0%) | 70 (100.0%) |
Health & Disability in Paincourtville
Health Insurance Coverage by Age in Paincourtville
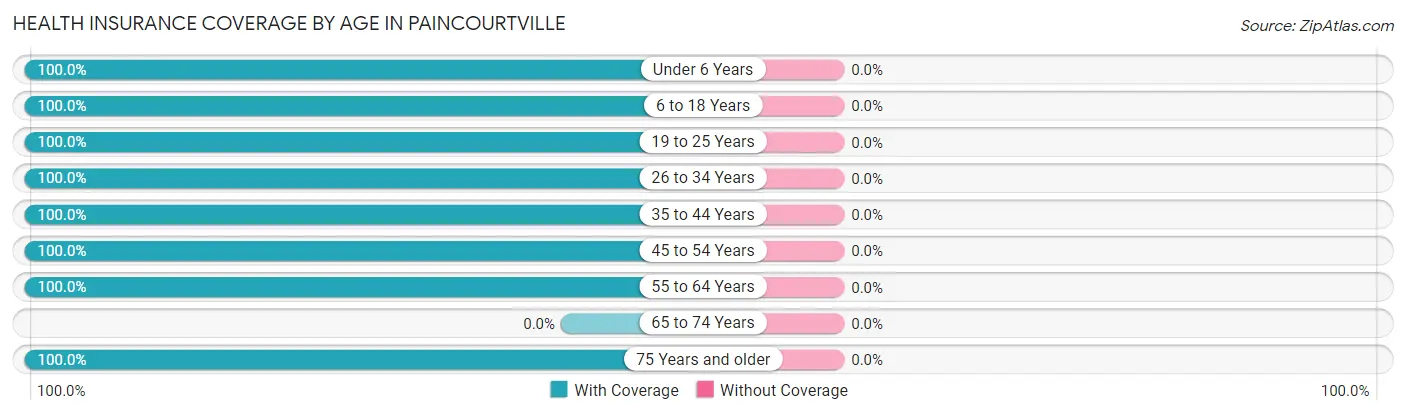
| Age Bracket | With Coverage | Without Coverage |
| Under 6 Years | 187 (100.0%) | 0 (0.0%) |
| 6 to 18 Years | 330 (100.0%) | 0 (0.0%) |
| 19 to 25 Years | 289 (100.0%) | 0 (0.0%) |
| 26 to 34 Years | 66 (100.0%) | 0 (0.0%) |
| 35 to 44 Years | 72 (100.0%) | 0 (0.0%) |
| 45 to 54 Years | 240 (100.0%) | 0 (0.0%) |
| 55 to 64 Years | 106 (100.0%) | 0 (0.0%) |
| 65 to 74 Years | 0 (0.0%) | 0 (0.0%) |
| 75 Years and older | 39 (100.0%) | 0 (0.0%) |
| Total | 1,329 (100.0%) | 0 (0.0%) |
Health Insurance Coverage by Citizenship Status in Paincourtville

| Citizenship Status | With Coverage | Without Coverage |
| Native Born | 187 (100.0%) | 0 (0.0%) |
| Foreign Born, Citizen | 330 (100.0%) | 0 (0.0%) |
| Foreign Born, not a Citizen | 289 (100.0%) | 0 (0.0%) |
Health Insurance Coverage by Household Income in Paincourtville
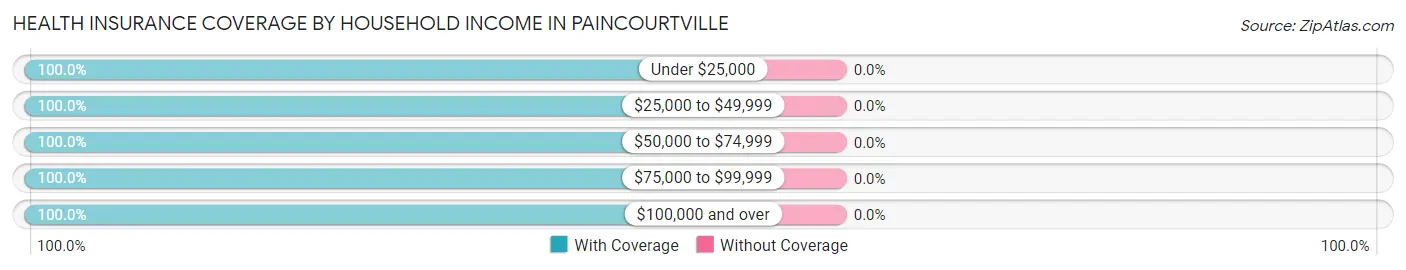
| Household Income | With Coverage | Without Coverage |
| Under $25,000 | 13 (100.0%) | 0 (0.0%) |
| $25,000 to $49,999 | 615 (100.0%) | 0 (0.0%) |
| $50,000 to $74,999 | 417 (100.0%) | 0 (0.0%) |
| $75,000 to $99,999 | 115 (100.0%) | 0 (0.0%) |
| $100,000 and over | 167 (100.0%) | 0 (0.0%) |
Public vs Private Health Insurance Coverage by Age in Paincourtville
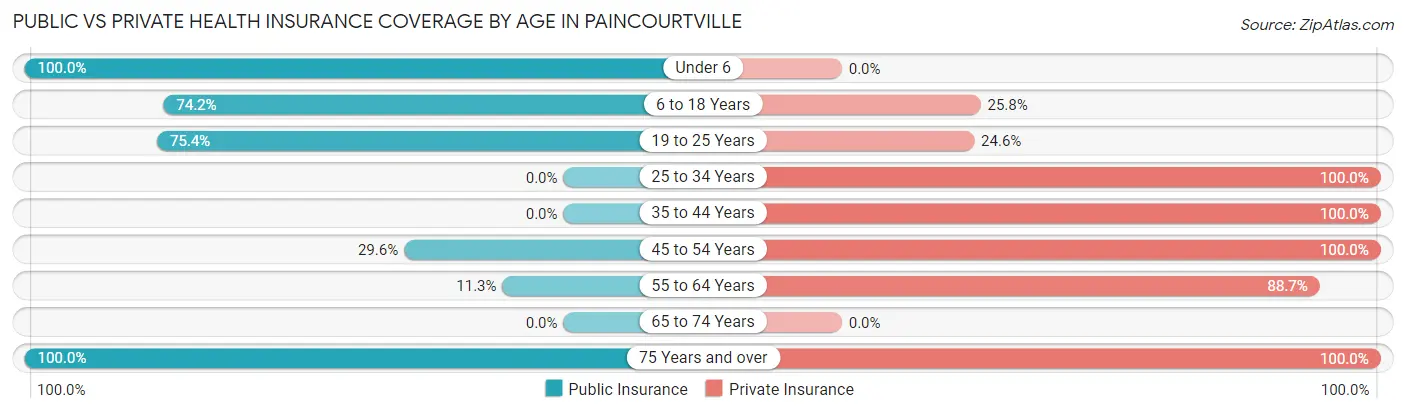
| Age Bracket | Public Insurance | Private Insurance |
| Under 6 | 187 (100.0%) | 0 (0.0%) |
| 6 to 18 Years | 245 (74.2%) | 85 (25.8%) |
| 19 to 25 Years | 218 (75.4%) | 71 (24.6%) |
| 25 to 34 Years | 0 (0.0%) | 66 (100.0%) |
| 35 to 44 Years | 0 (0.0%) | 72 (100.0%) |
| 45 to 54 Years | 71 (29.6%) | 240 (100.0%) |
| 55 to 64 Years | 12 (11.3%) | 94 (88.7%) |
| 65 to 74 Years | 0 (0.0%) | 0 (0.0%) |
| 75 Years and over | 39 (100.0%) | 39 (100.0%) |
| Total | 772 (58.1%) | 667 (50.2%) |
Disability Status by Sex by Age in Paincourtville
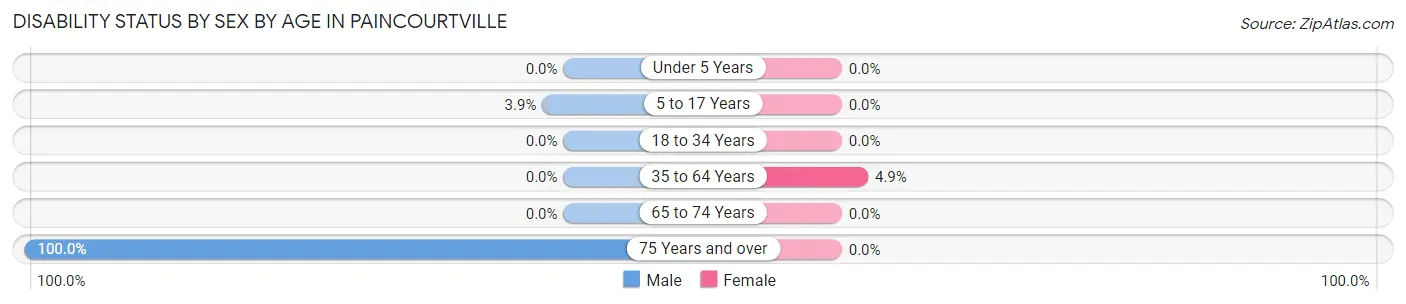
| Age Bracket | Male | Female |
| Under 5 Years | 0 (0.0%) | 0 (0.0%) |
| 5 to 17 Years | 2 (3.9%) | 0 (0.0%) |
| 18 to 34 Years | 0 (0.0%) | 0 (0.0%) |
| 35 to 64 Years | 0 (0.0%) | 15 (4.9%) |
| 65 to 74 Years | 0 (0.0%) | 0 (0.0%) |
| 75 Years and over | 14 (100.0%) | 0 (0.0%) |
Disability Class by Sex by Age in Paincourtville
Disability Class: Hearing Difficulty
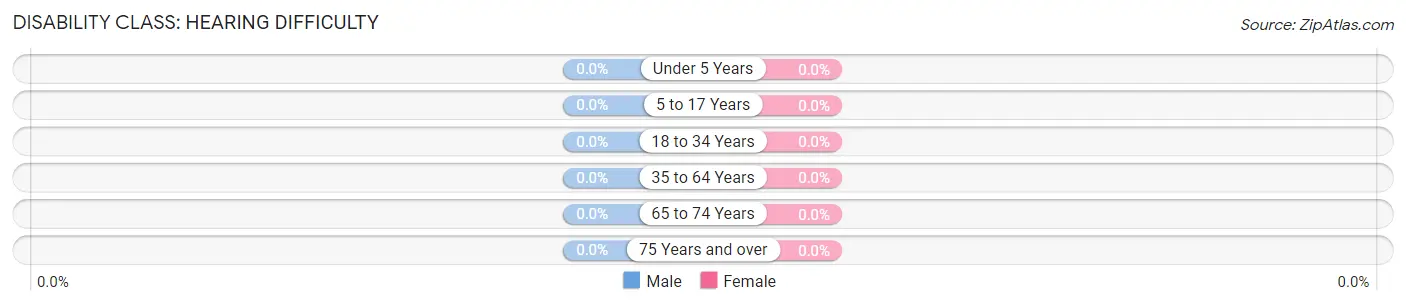
| Age Bracket | Male | Female |
| Under 5 Years | 0 (0.0%) | 0 (0.0%) |
| 5 to 17 Years | 0 (0.0%) | 0 (0.0%) |
| 18 to 34 Years | 0 (0.0%) | 0 (0.0%) |
| 35 to 64 Years | 0 (0.0%) | 0 (0.0%) |
| 65 to 74 Years | 0 (0.0%) | 0 (0.0%) |
| 75 Years and over | 0 (0.0%) | 0 (0.0%) |
Disability Class: Vision Difficulty
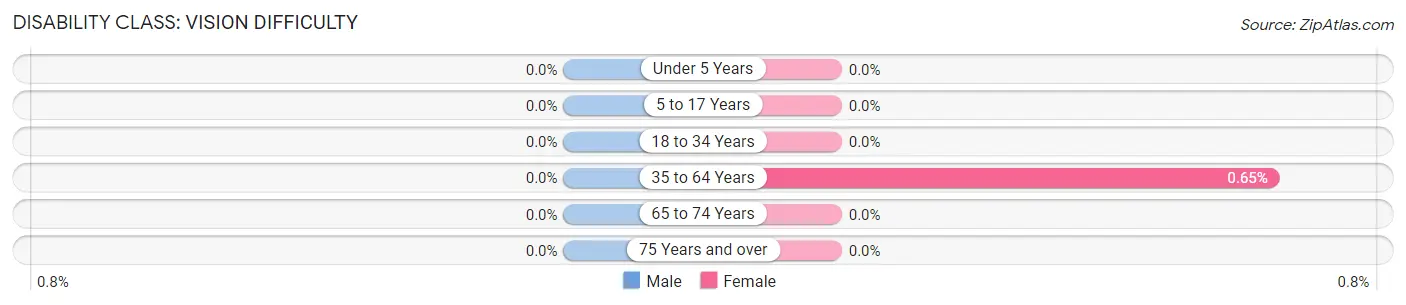
| Age Bracket | Male | Female |
| Under 5 Years | 0 (0.0%) | 0 (0.0%) |
| 5 to 17 Years | 0 (0.0%) | 0 (0.0%) |
| 18 to 34 Years | 0 (0.0%) | 0 (0.0%) |
| 35 to 64 Years | 0 (0.0%) | 2 (0.6%) |
| 65 to 74 Years | 0 (0.0%) | 0 (0.0%) |
| 75 Years and over | 0 (0.0%) | 0 (0.0%) |
Disability Class: Cognitive Difficulty
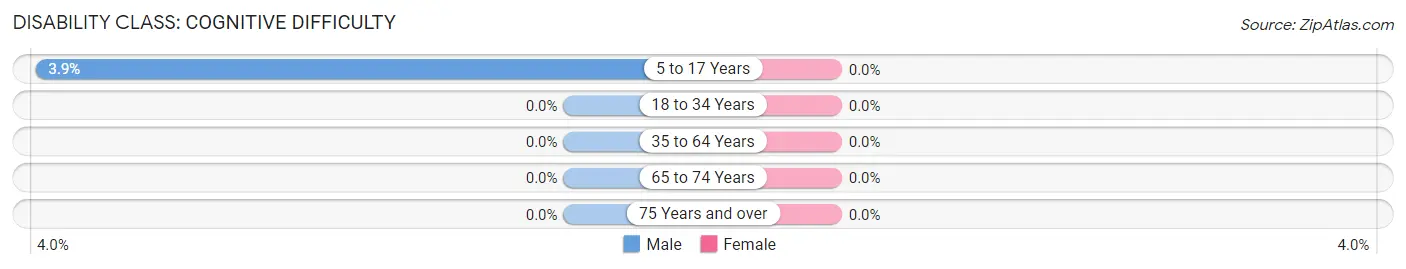
| Age Bracket | Male | Female |
| 5 to 17 Years | 2 (3.9%) | 0 (0.0%) |
| 18 to 34 Years | 0 (0.0%) | 0 (0.0%) |
| 35 to 64 Years | 0 (0.0%) | 0 (0.0%) |
| 65 to 74 Years | 0 (0.0%) | 0 (0.0%) |
| 75 Years and over | 0 (0.0%) | 0 (0.0%) |
Disability Class: Ambulatory Difficulty

| Age Bracket | Male | Female |
| 5 to 17 Years | 0 (0.0%) | 0 (0.0%) |
| 18 to 34 Years | 0 (0.0%) | 0 (0.0%) |
| 35 to 64 Years | 0 (0.0%) | 15 (4.9%) |
| 65 to 74 Years | 0 (0.0%) | 0 (0.0%) |
| 75 Years and over | 14 (100.0%) | 0 (0.0%) |
Disability Class: Self-Care Difficulty
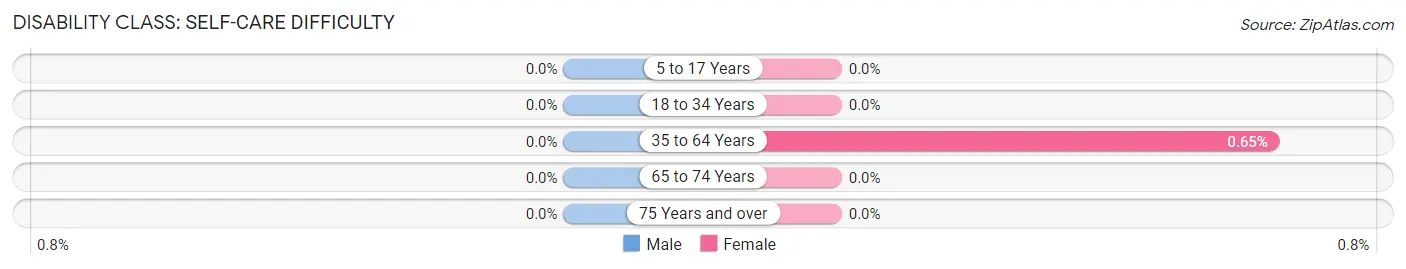
| Age Bracket | Male | Female |
| 5 to 17 Years | 0 (0.0%) | 0 (0.0%) |
| 18 to 34 Years | 0 (0.0%) | 0 (0.0%) |
| 35 to 64 Years | 0 (0.0%) | 2 (0.6%) |
| 65 to 74 Years | 0 (0.0%) | 0 (0.0%) |
| 75 Years and over | 0 (0.0%) | 0 (0.0%) |
Technology Access in Paincourtville
Computing Device Access in Paincourtville
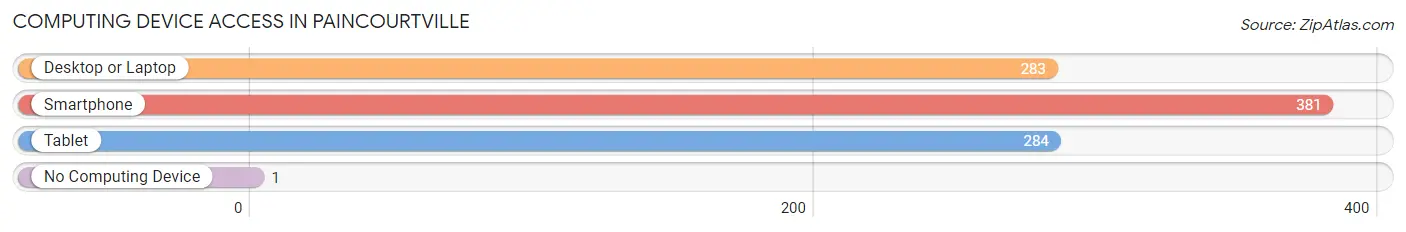
| Device Type | # Households | % Households |
| Desktop or Laptop | 283 | 71.7% |
| Smartphone | 381 | 96.5% |
| Tablet | 284 | 71.9% |
| No Computing Device | 1 | 0.3% |
| Total | 395 | 100.0% |
Internet Access in Paincourtville
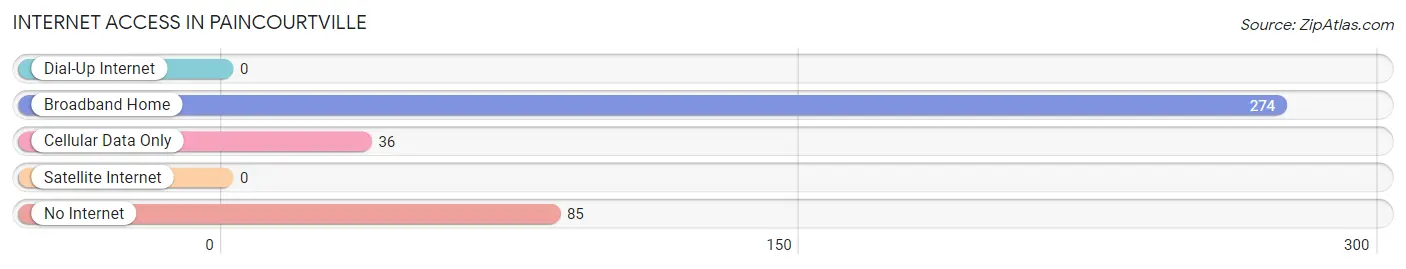
| Internet Type | # Households | % Households |
| Dial-Up Internet | 0 | 0.0% |
| Broadband Home | 274 | 69.4% |
| Cellular Data Only | 36 | 9.1% |
| Satellite Internet | 0 | 0.0% |
| No Internet | 85 | 21.5% |
| Total | 395 | 100.0% |
Paincourtville Summary
History
Paincourtville is a small unincorporated community located in Ascension Parish, Louisiana. It is situated on the east bank of the Mississippi River, about 25 miles south of Baton Rouge. The area was first settled in the early 1800s by French-speaking Acadian settlers, who named the area Paincourtville, meaning “short court” in French. The area was originally part of the Spanish colonial province of Louisiana, and was later part of the United States after the Louisiana Purchase in 1803.
The area was largely agricultural, with sugar cane and cotton being the main crops. The area was also home to a number of small businesses, including a sawmill, a gristmill, and a general store. The area was also home to a number of churches, including the St. Joseph Catholic Church, which was established in 1845.
In the late 19th century, the area began to experience a period of growth and development. The area was connected to the rest of the state by the New Orleans, Mobile and Texas Railroad, which was completed in 1883. This allowed for the transportation of goods and people to and from the area. The area also saw the construction of a number of new businesses, including a cotton gin, a blacksmith shop, and a hotel.
In the early 20th century, the area continued to experience growth and development. The area was connected to the rest of the state by the Louisiana Highway 1, which was completed in 1925. This allowed for the transportation of goods and people to and from the area. The area also saw the construction of a number of new businesses, including a bank, a post office, and a movie theater.
Geography
Paincourtville is located in Ascension Parish, Louisiana, on the east bank of the Mississippi River. The area is situated about 25 miles south of Baton Rouge. The area is largely rural, with the majority of the land being used for agricultural purposes. The area is also home to a number of small businesses, including a sawmill, a gristmill, and a general store.
The area is characterized by flat terrain, with the highest point being just over 100 feet above sea level. The area is also home to a number of small streams and creeks, including Bayou Lafourche, Bayou Grosse Tete, and Bayou Teche. The area is also home to a number of wildlife species, including white-tailed deer, wild turkey, and various species of waterfowl.
Economy
The economy of Paincourtville is largely based on agriculture. The area is home to a number of farms, which produce a variety of crops, including sugar cane, cotton, corn, soybeans, and rice. The area is also home to a number of small businesses, including a sawmill, a gristmill, and a general store.
The area is also home to a number of manufacturing businesses, including a cotton gin, a blacksmith shop, and a hotel. The area is also home to a number of service businesses, including a bank, a post office, and a movie theater.
Demographics
As of the 2010 census, the population of Paincourtville was 1,845. The population is largely white (90.2%), with a small percentage of African Americans (7.2%) and Hispanics (2.6%). The median household income is $45,000, and the median age is 38. The area is largely rural, with the majority of the population living in small towns and villages.
Common Questions
What is Per Capita Income in Paincourtville?
Per Capita income in Paincourtville is $24,012.
What is the Median Family Income in Paincourtville?
Median Family Income in Paincourtville is $71,458.
What is the Median Household income in Paincourtville?
Median Household Income in Paincourtville is $67,644.
What is Income or Wage Gap in Paincourtville?
Income or Wage Gap in Paincourtville is 71.4%.
Women in Paincourtville earn 28.6 cents for every dollar earned by a man.
What is Inequality or Gini Index in Paincourtville?
Inequality or Gini Index in Paincourtville is 0.25.
What is the Total Population of Paincourtville?
Total Population of Paincourtville is 1,329.
What is the Total Male Population of Paincourtville?
Total Male Population of Paincourtville is 417.
What is the Total Female Population of Paincourtville?
Total Female Population of Paincourtville is 912.
What is the Ratio of Males per 100 Females in Paincourtville?
There are 45.72 Males per 100 Females in Paincourtville.
What is the Ratio of Females per 100 Males in Paincourtville?
There are 218.71 Females per 100 Males in Paincourtville.
What is the Median Population Age in Paincourtville?
Median Population Age in Paincourtville is 23.2 Years.
What is the Average Family Size in Paincourtville
Average Family Size in Paincourtville is 4.1 People.
What is the Average Household Size in Paincourtville
Average Household Size in Paincourtville is 3.4 People.
How Large is the Labor Force in Paincourtville?
There are 747 People in the Labor Forcein in Paincourtville.
What is the Percentage of People in the Labor Force in Paincourtville?
80.1% of People are in the Labor Force in Paincourtville.
What is the Unemployment Rate in Paincourtville?
Unemployment Rate in Paincourtville is 5.8%.