Pine Lakes Addition, SD Map & Demographics
Pine Lakes Addition Map
Pine Lakes Addition Overview
$93,089
PER CAPITA INCOME
$183,750
AVG FAMILY INCOME
$182,941
AVG HOUSEHOLD INCOME
47.7%
WAGE / INCOME GAP [ % ]
52.3¢/ $1
WAGE / INCOME GAP [ $ ]
0.41
INEQUALITY / GINI INDEX
285
TOTAL POPULATION
131
MALE POPULATION
154
FEMALE POPULATION
85.06
MALES / 100 FEMALES
117.56
FEMALES / 100 MALES
41.9
MEDIAN AGE
2.9
AVG FAMILY SIZE
2.6
AVG HOUSEHOLD SIZE
174
LABOR FORCE [ PEOPLE ]
84.5%
PERCENT IN LABOR FORCE
Income in Pine Lakes Addition
Income Overview in Pine Lakes Addition
Per Capita Income in Pine Lakes Addition is $93,089, while median incomes of families and households are $183,750 and $182,941 respectively.
| Characteristic | Number | Measure |
| Per Capita Income | 285 | $93,089 |
| Median Family Income | 91 | $183,750 |
| Mean Family Income | 91 | $266,269 |
| Median Household Income | 110 | $182,941 |
| Mean Household Income | 110 | $235,205 |
| Income Deficit | 91 | $0 |
| Wage / Income Gap (%) | 285 | 47.73% |
| Wage / Income Gap ($) | 285 | 52.27¢ per $1 |
| Gini / Inequality Index | 285 | 0.41 |
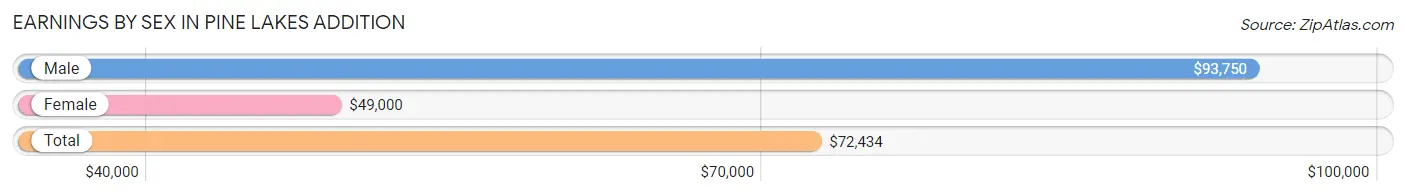
Earnings by Sex in Pine Lakes Addition
Average Earnings in Pine Lakes Addition are $72,434, $93,750 for men and $49,000 for women, a difference of 47.7%.
| Sex | Number | Average Earnings |
| Male | 103 (56.9%) | $93,750 |
| Female | 78 (43.1%) | $49,000 |
| Total | 181 (100.0%) | $72,434 |
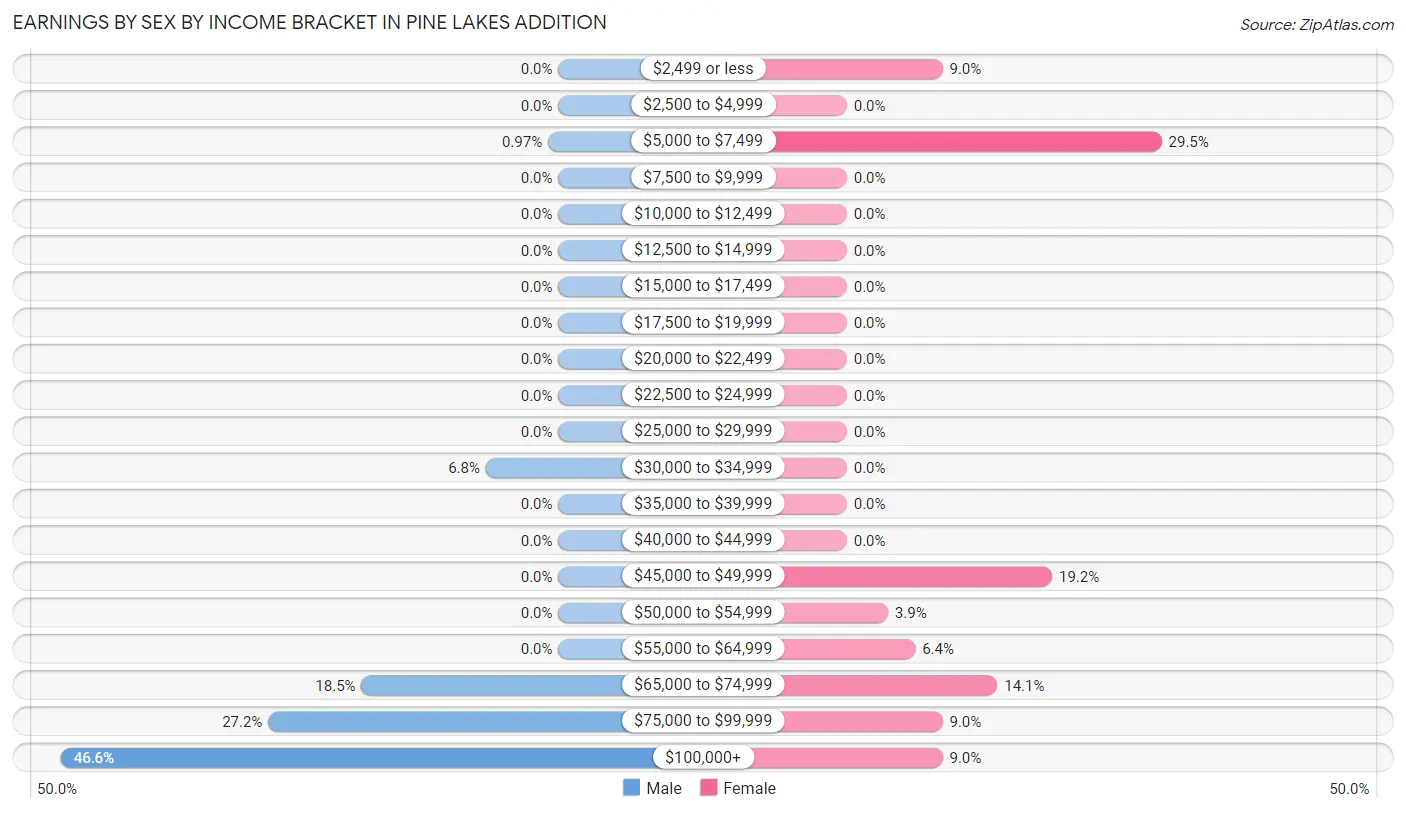
Earnings by Sex by Income Bracket in Pine Lakes Addition
The most common earnings brackets in Pine Lakes Addition are $100,000+ for men (48 | 46.6%) and $5,000 to $7,499 for women (23 | 29.5%).
| Income | Male | Female |
| $2,499 or less | 0 (0.0%) | 7 (9.0%) |
| $2,500 to $4,999 | 0 (0.0%) | 0 (0.0%) |
| $5,000 to $7,499 | 1 (1.0%) | 23 (29.5%) |
| $7,500 to $9,999 | 0 (0.0%) | 0 (0.0%) |
| $10,000 to $12,499 | 0 (0.0%) | 0 (0.0%) |
| $12,500 to $14,999 | 0 (0.0%) | 0 (0.0%) |
| $15,000 to $17,499 | 0 (0.0%) | 0 (0.0%) |
| $17,500 to $19,999 | 0 (0.0%) | 0 (0.0%) |
| $20,000 to $22,499 | 0 (0.0%) | 0 (0.0%) |
| $22,500 to $24,999 | 0 (0.0%) | 0 (0.0%) |
| $25,000 to $29,999 | 0 (0.0%) | 0 (0.0%) |
| $30,000 to $34,999 | 7 (6.8%) | 0 (0.0%) |
| $35,000 to $39,999 | 0 (0.0%) | 0 (0.0%) |
| $40,000 to $44,999 | 0 (0.0%) | 0 (0.0%) |
| $45,000 to $49,999 | 0 (0.0%) | 15 (19.2%) |
| $50,000 to $54,999 | 0 (0.0%) | 3 (3.8%) |
| $55,000 to $64,999 | 0 (0.0%) | 5 (6.4%) |
| $65,000 to $74,999 | 19 (18.4%) | 11 (14.1%) |
| $75,000 to $99,999 | 28 (27.2%) | 7 (9.0%) |
| $100,000+ | 48 (46.6%) | 7 (9.0%) |
| Total | 103 (100.0%) | 78 (100.0%) |
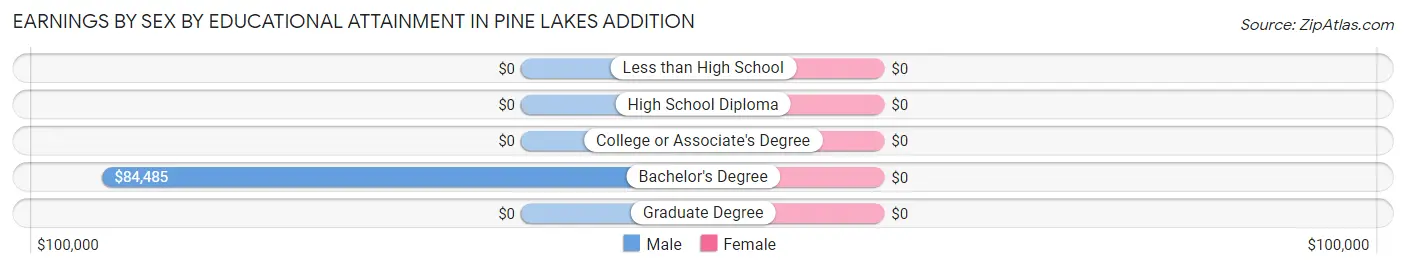
Earnings by Sex by Educational Attainment in Pine Lakes Addition
| Educational Attainment | Male Income | Female Income |
| Less than High School | - | - |
| High School Diploma | - | - |
| College or Associate's Degree | - | - |
| Bachelor's Degree | $84,485 | $0 |
| Graduate Degree | - | - |
| Total | $93,750 | $49,000 |
Family Income in Pine Lakes Addition
Family Income Brackets in Pine Lakes Addition
According to the Pine Lakes Addition family income data, there are 37 families falling into the $150,000 to $199,999 income range, which is the most common income bracket and makes up 40.7% of all families.
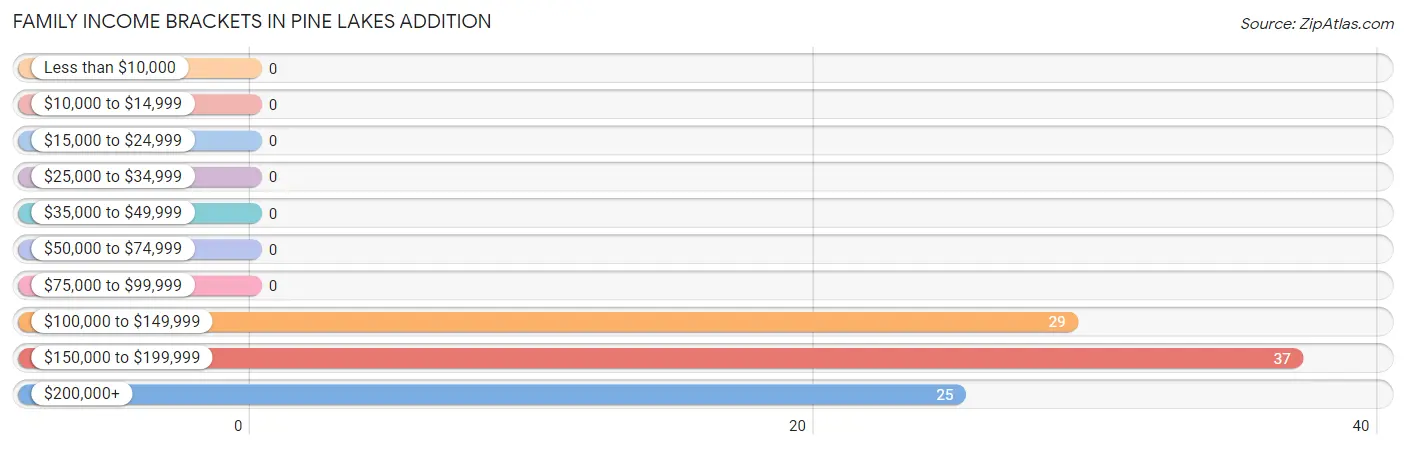
| Income Bracket | # Families | % Families |
| Less than $10,000 | 0 | 0.0% |
| $10,000 to $14,999 | 0 | 0.0% |
| $15,000 to $24,999 | 0 | 0.0% |
| $25,000 to $34,999 | 0 | 0.0% |
| $35,000 to $49,999 | 0 | 0.0% |
| $50,000 to $74,999 | 0 | 0.0% |
| $75,000 to $99,999 | 0 | 0.0% |
| $100,000 to $149,999 | 29 | 31.9% |
| $150,000 to $199,999 | 37 | 40.7% |
| $200,000+ | 25 | 27.5% |
Family Income by Famaliy Size in Pine Lakes Addition
2-person families (67 | 73.6%) account for the highest median family income in Pine Lakes Addition with $183,456 per family, while 2-person families (67 | 73.6%) have the highest median income of $91,728 per family member.
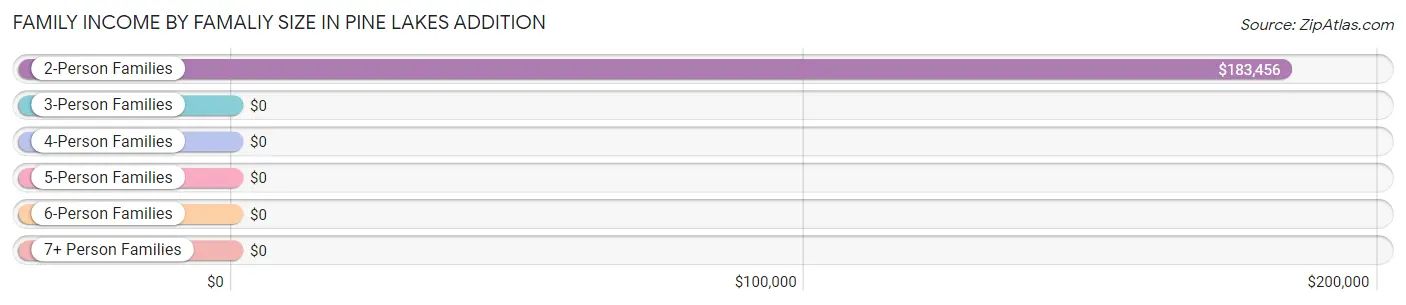
| Income Bracket | # Families | Median Income |
| 2-Person Families | 67 (73.6%) | $183,456 |
| 3-Person Families | 3 (3.3%) | $0 |
| 4-Person Families | 0 (0.0%) | $0 |
| 5-Person Families | 14 (15.4%) | $0 |
| 6-Person Families | 7 (7.7%) | $0 |
| 7+ Person Families | 0 (0.0%) | $0 |
| Total | 91 (100.0%) | $183,750 |
Family Income by Number of Earners in Pine Lakes Addition
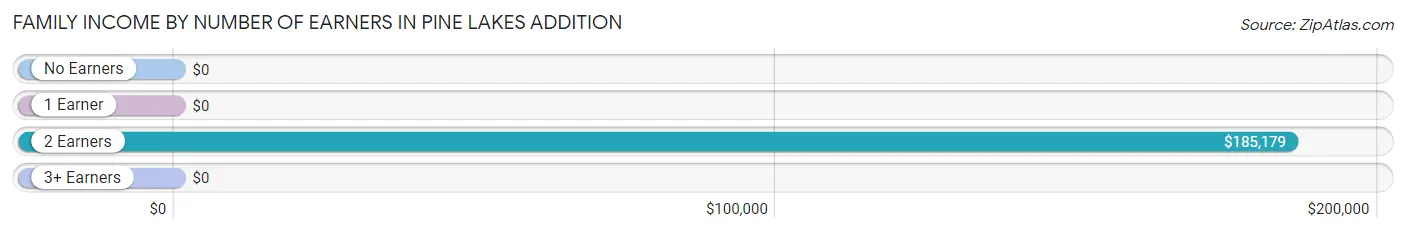
| Number of Earners | # Families | Median Income |
| No Earners | 0 (0.0%) | $0 |
| 1 Earner | 28 (30.8%) | $0 |
| 2 Earners | 63 (69.2%) | $185,179 |
| 3+ Earners | 0 (0.0%) | $0 |
| Total | 91 (100.0%) | $183,750 |
Household Income in Pine Lakes Addition
Household Income Brackets in Pine Lakes Addition
With 41 households falling in the category, the $150,000 to $199,999 income range is the most frequent in Pine Lakes Addition, accounting for 37.3% of all households.
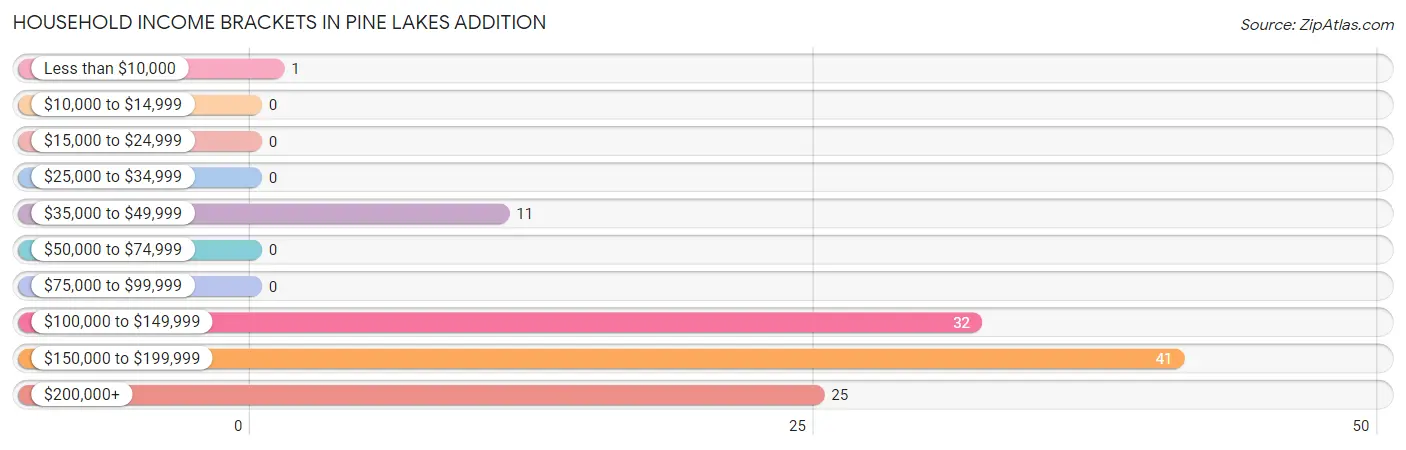
| Income Bracket | # Households | % Households |
| Less than $10,000 | 1 | 0.9% |
| $10,000 to $14,999 | 0 | 0.0% |
| $15,000 to $24,999 | 0 | 0.0% |
| $25,000 to $34,999 | 0 | 0.0% |
| $35,000 to $49,999 | 11 | 10.0% |
| $50,000 to $74,999 | 0 | 0.0% |
| $75,000 to $99,999 | 0 | 0.0% |
| $100,000 to $149,999 | 32 | 29.1% |
| $150,000 to $199,999 | 41 | 37.3% |
| $200,000+ | 25 | 22.7% |
Household Income by Householder Age in Pine Lakes Addition
The median household income in Pine Lakes Addition is $182,941, with the highest median household income of $183,529 found in the 45 to 64 years age bracket for the primary householder. A total of 66 households (60.0%) fall into this category.
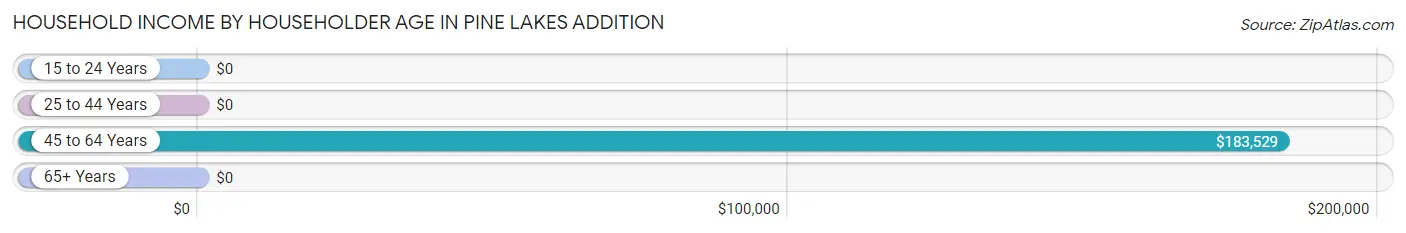
| Income Bracket | # Households | Median Income |
| 15 to 24 Years | 0 (0.0%) | $0 |
| 25 to 44 Years | 29 (26.4%) | $0 |
| 45 to 64 Years | 66 (60.0%) | $183,529 |
| 65+ Years | 15 (13.6%) | $0 |
| Total | 110 (100.0%) | $182,941 |
Poverty in Pine Lakes Addition
Income Below Poverty by Sex and Age in Pine Lakes Addition
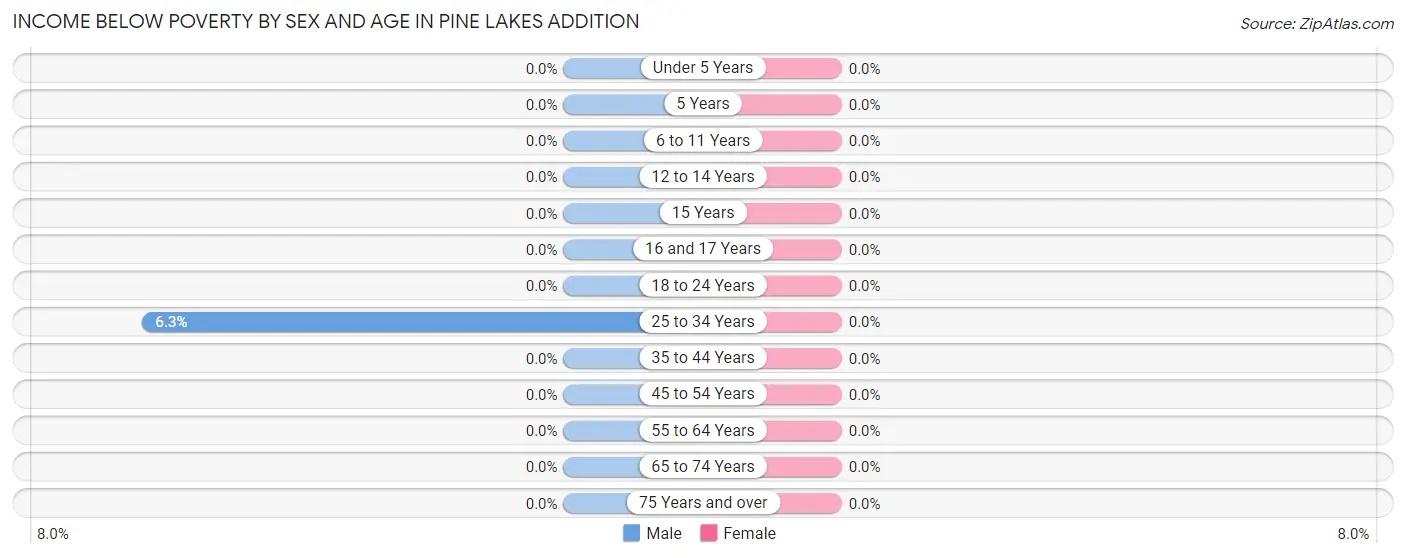
| Age Bracket | Male | Female |
| Under 5 Years | 0 (0.0%) | 0 (0.0%) |
| 5 Years | 0 (0.0%) | 0 (0.0%) |
| 6 to 11 Years | 0 (0.0%) | 0 (0.0%) |
| 12 to 14 Years | 0 (0.0%) | 0 (0.0%) |
| 15 Years | 0 (0.0%) | 0 (0.0%) |
| 16 and 17 Years | 0 (0.0%) | 0 (0.0%) |
| 18 to 24 Years | 0 (0.0%) | 0 (0.0%) |
| 25 to 34 Years | 1 (6.2%) | 0 (0.0%) |
| 35 to 44 Years | 0 (0.0%) | 0 (0.0%) |
| 45 to 54 Years | 0 (0.0%) | 0 (0.0%) |
| 55 to 64 Years | 0 (0.0%) | 0 (0.0%) |
| 65 to 74 Years | 0 (0.0%) | 0 (0.0%) |
| 75 Years and over | 0 (0.0%) | 0 (0.0%) |
| Total | 1 (0.8%) | 0 (0.0%) |
Income Above Poverty by Sex and Age in Pine Lakes Addition
According to the poverty statistics in Pine Lakes Addition, males aged 6 to 11 years and females aged under 5 years are the age groups that are most secure financially, with 100.0% of males and 100.0% of females in these age groups living above the poverty line.
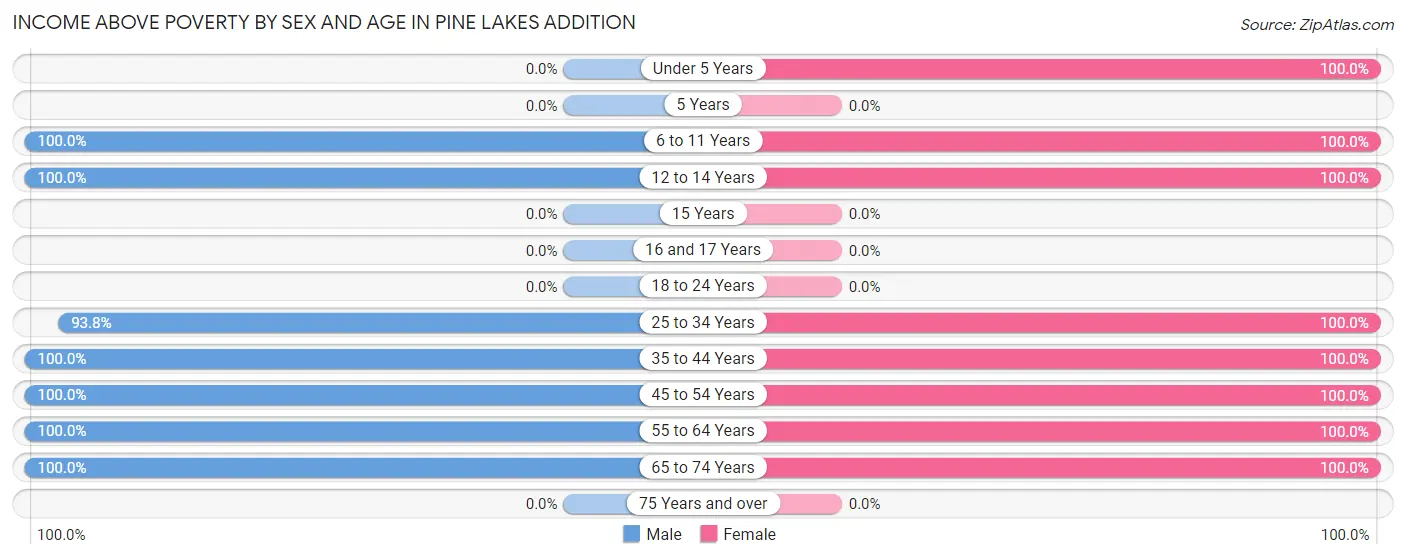
| Age Bracket | Male | Female |
| Under 5 Years | 0 (0.0%) | 11 (100.0%) |
| 5 Years | 0 (0.0%) | 0 (0.0%) |
| 6 to 11 Years | 14 (100.0%) | 32 (100.0%) |
| 12 to 14 Years | 14 (100.0%) | 8 (100.0%) |
| 15 Years | 0 (0.0%) | 0 (0.0%) |
| 16 and 17 Years | 0 (0.0%) | 0 (0.0%) |
| 18 to 24 Years | 0 (0.0%) | 0 (0.0%) |
| 25 to 34 Years | 15 (93.8%) | 19 (100.0%) |
| 35 to 44 Years | 15 (100.0%) | 14 (100.0%) |
| 45 to 54 Years | 15 (100.0%) | 11 (100.0%) |
| 55 to 64 Years | 42 (100.0%) | 45 (100.0%) |
| 65 to 74 Years | 15 (100.0%) | 14 (100.0%) |
| 75 Years and over | 0 (0.0%) | 0 (0.0%) |
| Total | 130 (99.2%) | 154 (100.0%) |
Income Below Poverty Among Married-Couple Families in Pine Lakes Addition
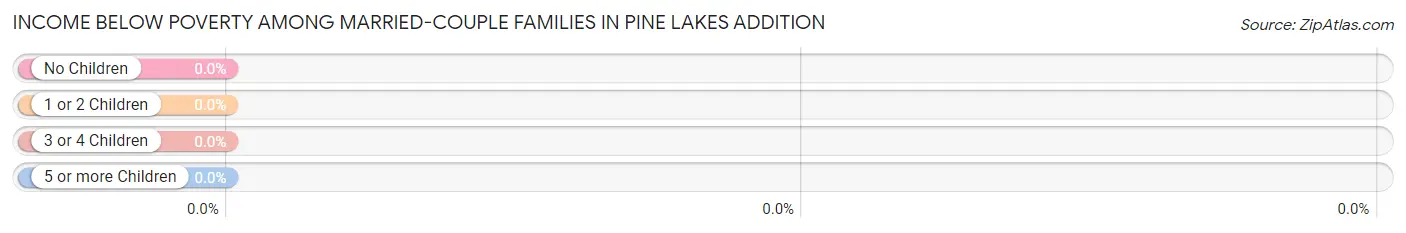
| Children | Above Poverty | Below Poverty |
| No Children | 67 (100.0%) | 0 (0.0%) |
| 1 or 2 Children | 3 (100.0%) | 0 (0.0%) |
| 3 or 4 Children | 21 (100.0%) | 0 (0.0%) |
| 5 or more Children | 0 (0.0%) | 0 (0.0%) |
| Total | 91 (100.0%) | 0 (0.0%) |
Income Below Poverty Among Single-Parent Households in Pine Lakes Addition
| Children | Single Father | Single Mother |
| No Children | 0 (0.0%) | 0 (0.0%) |
| 1 or 2 Children | 0 (0.0%) | 0 (0.0%) |
| 3 or 4 Children | 0 (0.0%) | 0 (0.0%) |
| 5 or more Children | 0 (0.0%) | 0 (0.0%) |
| Total | 0 (0.0%) | 0 (0.0%) |
Income Below Poverty Among Married-Couple vs Single-Parent Households in Pine Lakes Addition
| Children | Married-Couple Families | Single-Parent Households |
| No Children | 0 (0.0%) | 0 (0.0%) |
| 1 or 2 Children | 0 (0.0%) | 0 (0.0%) |
| 3 or 4 Children | 0 (0.0%) | 0 (0.0%) |
| 5 or more Children | 0 (0.0%) | 0 (0.0%) |
| Total | 0 (0.0%) | 0 (0.0%) |
Race in Pine Lakes Addition
The most populous races in Pine Lakes Addition are , and White / Caucasian (285 | 100.0%).
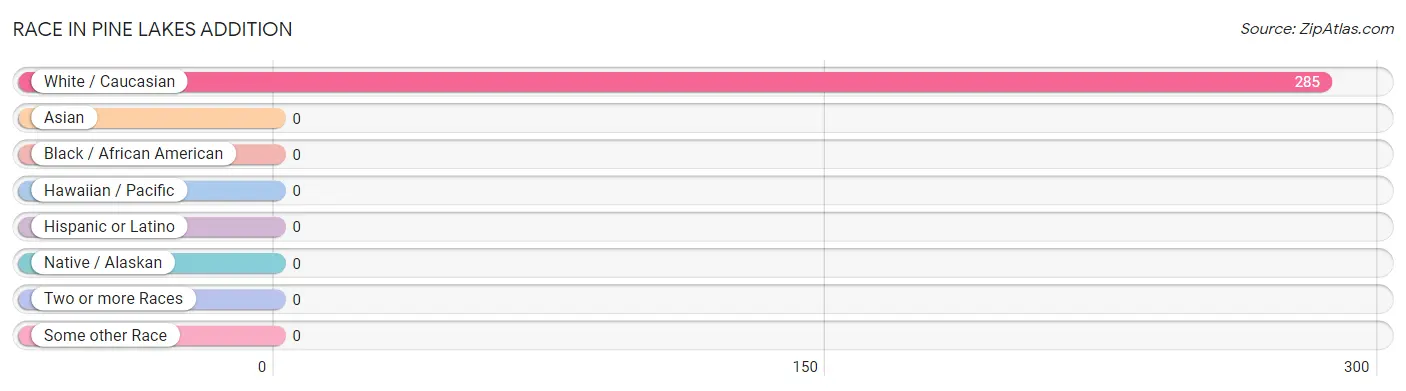
| Race | # Population | % Population |
| Asian | 0 | 0.0% |
| Black / African American | 0 | 0.0% |
| Hawaiian / Pacific | 0 | 0.0% |
| Hispanic or Latino | 0 | 0.0% |
| Native / Alaskan | 0 | 0.0% |
| White / Caucasian | 285 | 100.0% |
| Two or more Races | 0 | 0.0% |
| Some other Race | 0 | 0.0% |
| Total | 285 | 100.0% |
Ancestry in Pine Lakes Addition
The most populous ancestries reported in Pine Lakes Addition are German (138 | 48.4%), Norwegian (42 | 14.7%), American (38 | 13.3%), French (34 | 11.9%), and English (27 | 9.5%), together accounting for 97.9% of all Pine Lakes Addition residents.
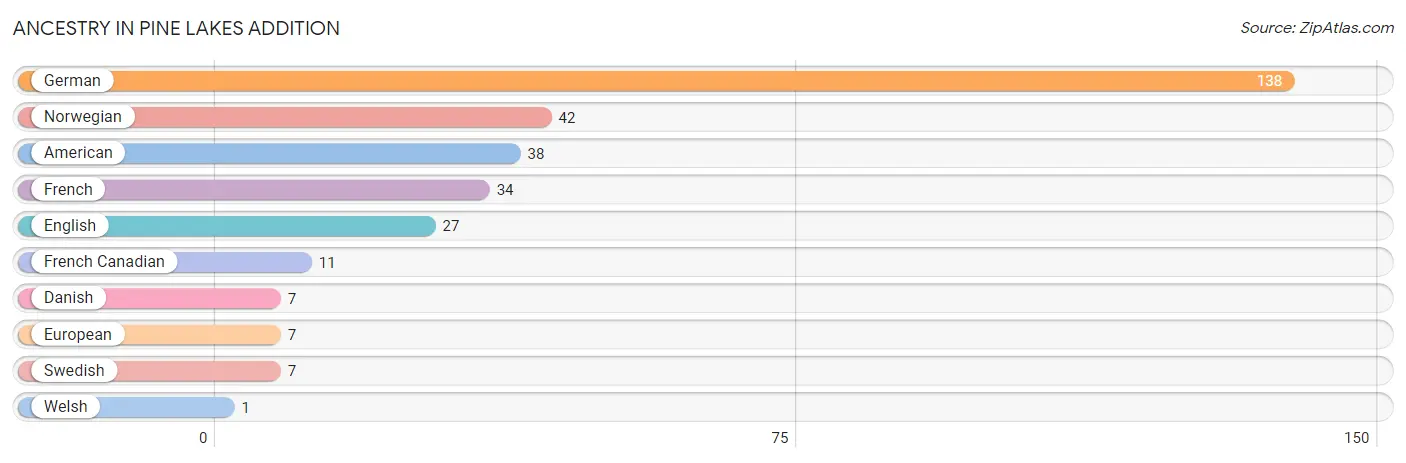
| Ancestry | # Population | % Population |
| American | 38 | 13.3% |
| Danish | 7 | 2.5% |
| English | 27 | 9.5% |
| European | 7 | 2.5% |
| French | 34 | 11.9% |
| French Canadian | 11 | 3.9% |
| German | 138 | 48.4% |
| Norwegian | 42 | 14.7% |
| Swedish | 7 | 2.5% |
| Welsh | 1 | 0.4% | View All 10 Rows |
Immigrants in Pine Lakes Addition

| Immigration Origin | # Population | % Population | View All 0 Rows |
Sex and Age in Pine Lakes Addition
Sex and Age in Pine Lakes Addition
The most populous age groups in Pine Lakes Addition are 55 to 59 Years (25 | 19.1%) for men and 5 to 9 Years (32 | 20.8%) for women.
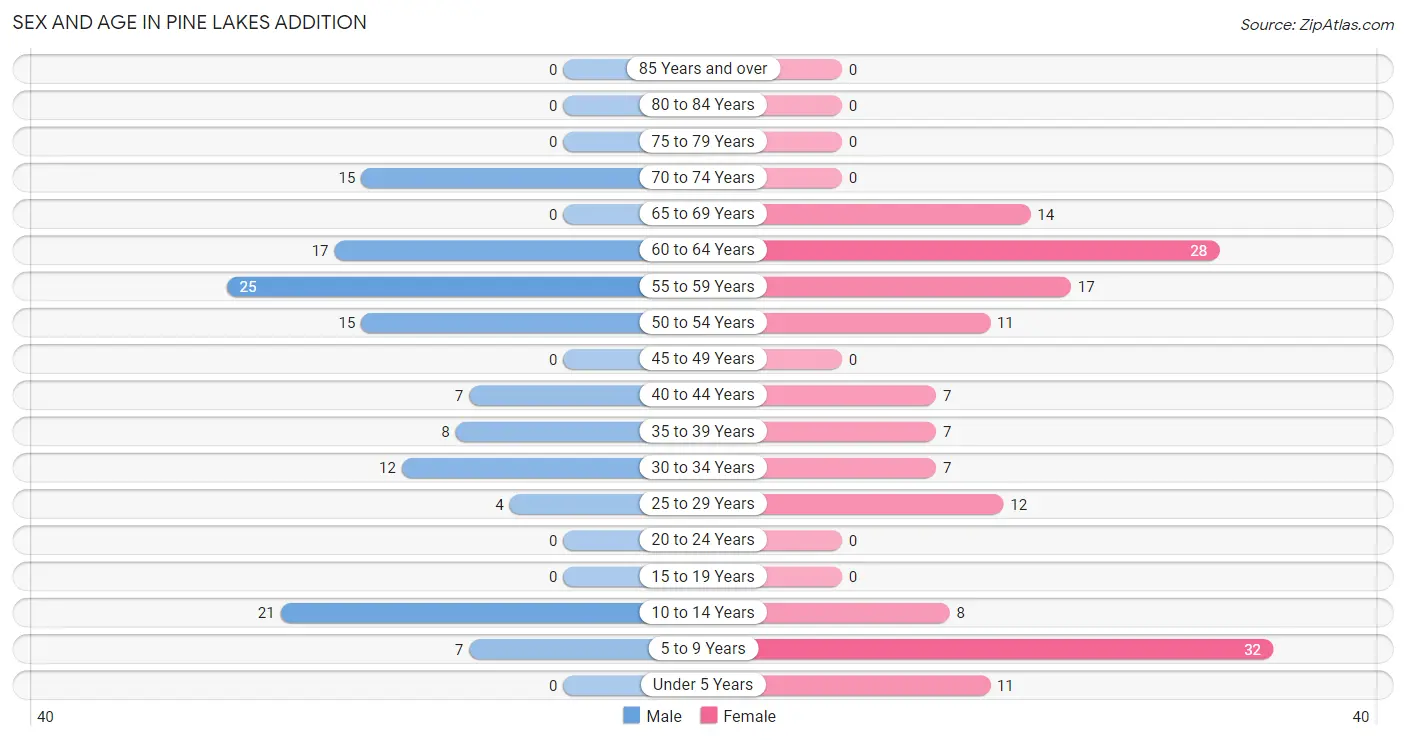
| Age Bracket | Male | Female |
| Under 5 Years | 0 (0.0%) | 11 (7.1%) |
| 5 to 9 Years | 7 (5.3%) | 32 (20.8%) |
| 10 to 14 Years | 21 (16.0%) | 8 (5.2%) |
| 15 to 19 Years | 0 (0.0%) | 0 (0.0%) |
| 20 to 24 Years | 0 (0.0%) | 0 (0.0%) |
| 25 to 29 Years | 4 (3.0%) | 12 (7.8%) |
| 30 to 34 Years | 12 (9.2%) | 7 (4.5%) |
| 35 to 39 Years | 8 (6.1%) | 7 (4.5%) |
| 40 to 44 Years | 7 (5.3%) | 7 (4.5%) |
| 45 to 49 Years | 0 (0.0%) | 0 (0.0%) |
| 50 to 54 Years | 15 (11.5%) | 11 (7.1%) |
| 55 to 59 Years | 25 (19.1%) | 17 (11.0%) |
| 60 to 64 Years | 17 (13.0%) | 28 (18.2%) |
| 65 to 69 Years | 0 (0.0%) | 14 (9.1%) |
| 70 to 74 Years | 15 (11.5%) | 0 (0.0%) |
| 75 to 79 Years | 0 (0.0%) | 0 (0.0%) |
| 80 to 84 Years | 0 (0.0%) | 0 (0.0%) |
| 85 Years and over | 0 (0.0%) | 0 (0.0%) |
| Total | 131 (100.0%) | 154 (100.0%) |
Families and Households in Pine Lakes Addition
Median Family Size in Pine Lakes Addition
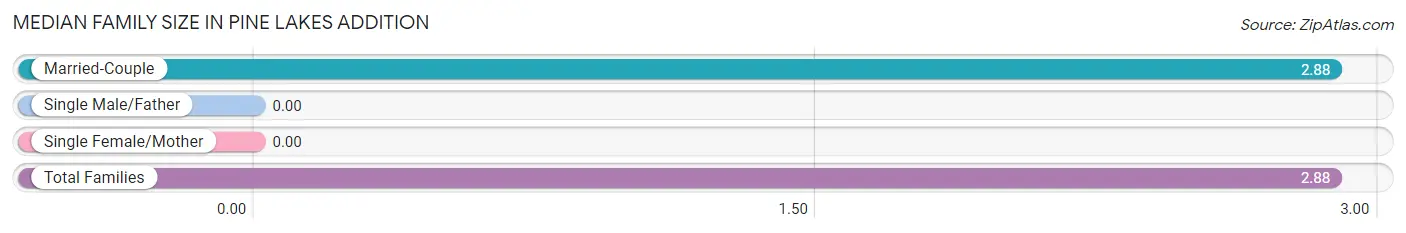
| Family Type | # Families | Family Size |
| Married-Couple | 91 (100.0%) | 2.88 |
| Single Male/Father | 0 (0.0%) | - |
| Single Female/Mother | 0 (0.0%) | - |
| Total Families | 91 (100.0%) | 2.88 |
Median Household Size in Pine Lakes Addition
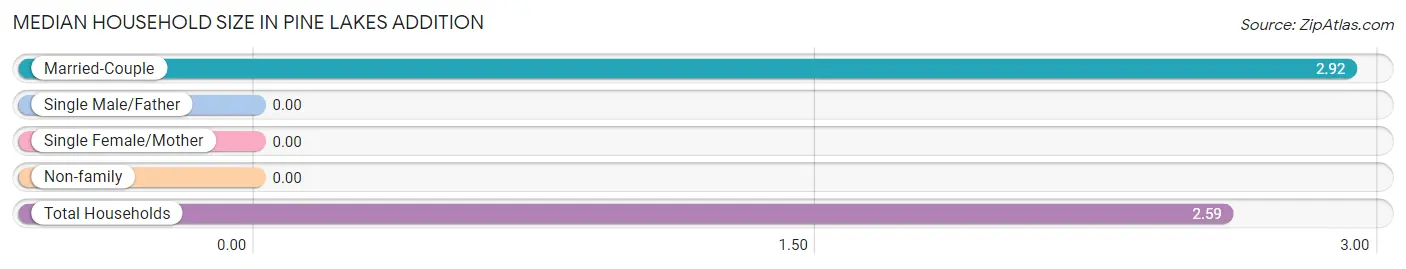
| Household Type | # Households | Household Size |
| Married-Couple | 91 (82.7%) | 2.92 |
| Single Male/Father | 0 (0.0%) | - |
| Single Female/Mother | 0 (0.0%) | - |
| Non-family | 19 (17.3%) | - |
| Total Households | 110 (100.0%) | 2.59 |
Household Size by Marriage Status in Pine Lakes Addition
Out of a total of 110 households in Pine Lakes Addition, 91 (82.7%) are family households, while 19 (17.3%) are nonfamily households. The most numerous type of family households are 2-person households, comprising 63, and the most common type of nonfamily households are 1-person households, comprising 19.
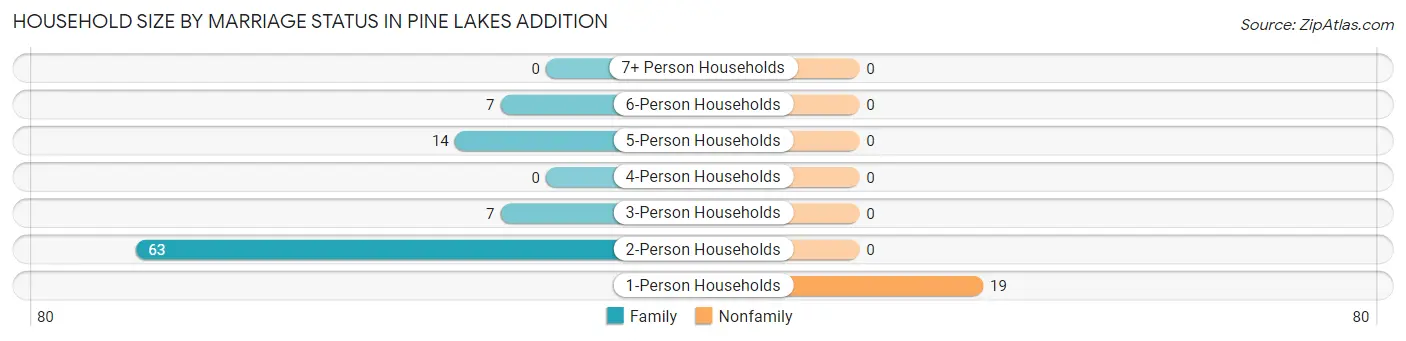
| Household Size | Family Households | Nonfamily Households |
| 1-Person Households | - | 19 (17.3%) |
| 2-Person Households | 63 (57.3%) | 0 (0.0%) |
| 3-Person Households | 7 (6.4%) | 0 (0.0%) |
| 4-Person Households | 0 (0.0%) | 0 (0.0%) |
| 5-Person Households | 14 (12.7%) | 0 (0.0%) |
| 6-Person Households | 7 (6.4%) | 0 (0.0%) |
| 7+ Person Households | 0 (0.0%) | 0 (0.0%) |
| Total | 91 (82.7%) | 19 (17.3%) |
Female Fertility in Pine Lakes Addition
Fertility by Age in Pine Lakes Addition
Average fertility rate in Pine Lakes Addition is 212.0 births per 1,000 women. Women in the age bracket of 20 to 34 years have the highest fertility rate with 368.0 births per 1,000 women. Women in the age bracket of 20 to 34 years acount for 100.0% of all women with births.
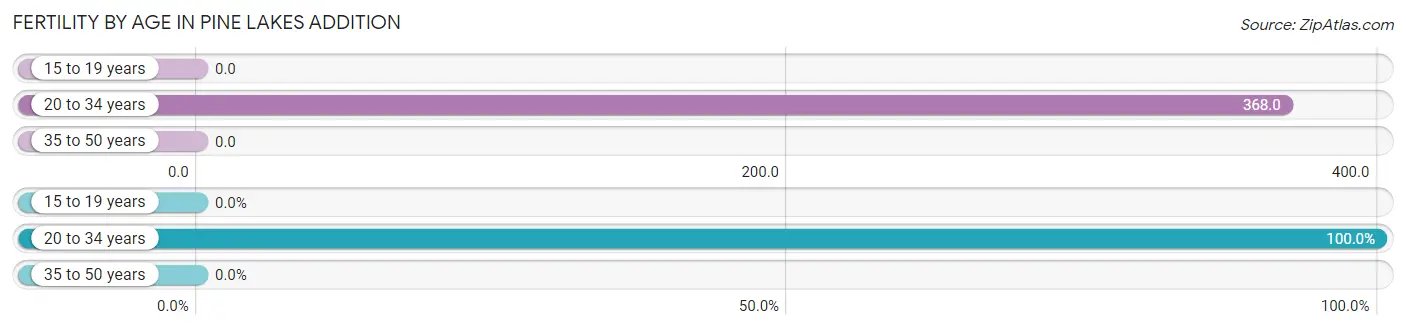
| Age Bracket | Women with Births | Births / 1,000 Women |
| 15 to 19 years | 0 (0.0%) | 0.0 |
| 20 to 34 years | 7 (100.0%) | 368.0 |
| 35 to 50 years | 0 (0.0%) | 0.0 |
| Total | 7 (100.0%) | 212.0 |
Fertility by Age by Marriage Status in Pine Lakes Addition
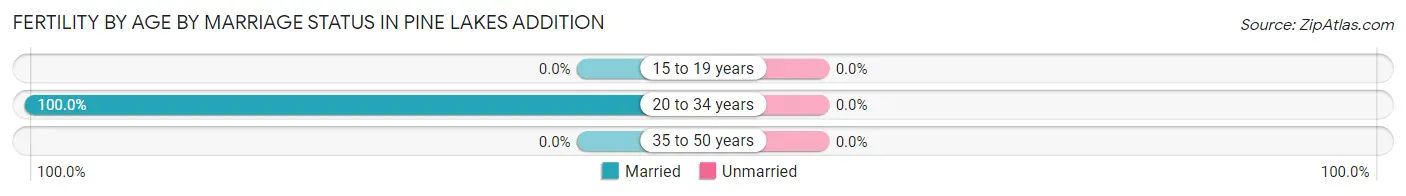
| Age Bracket | Married | Unmarried |
| 15 to 19 years | 0 (0.0%) | 0 (0.0%) |
| 20 to 34 years | 7 (100.0%) | 0 (0.0%) |
| 35 to 50 years | 0 (0.0%) | 0 (0.0%) |
| Total | 7 (100.0%) | 0 (0.0%) |
Fertility by Education in Pine Lakes Addition
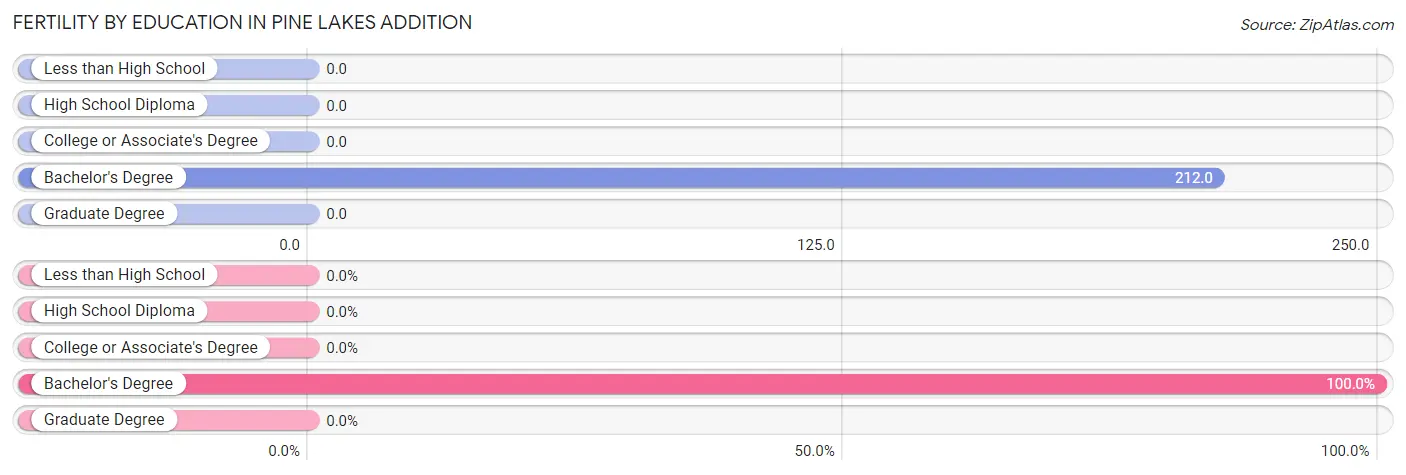
| Educational Attainment | Women with Births | Births / 1,000 Women |
| Less than High School | 0 (0.0%) | 0.0 |
| High School Diploma | 0 (0.0%) | 0.0 |
| College or Associate's Degree | 0 (0.0%) | 0.0 |
| Bachelor's Degree | 7 (100.0%) | 212.0 |
| Graduate Degree | 0 (0.0%) | 0.0 |
| Total | 7 (100.0%) | 212.0 |
Fertility by Education by Marriage Status in Pine Lakes Addition
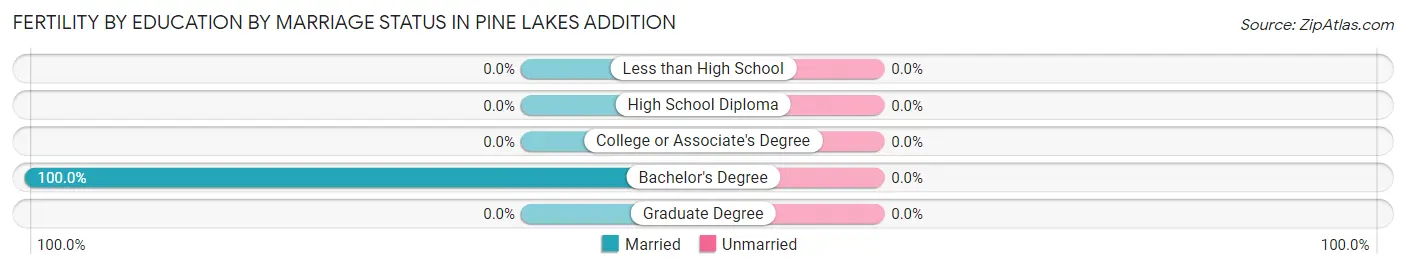
| Educational Attainment | Married | Unmarried |
| Less than High School | 0 (0.0%) | 0 (0.0%) |
| High School Diploma | 0 (0.0%) | 0 (0.0%) |
| College or Associate's Degree | 0 (0.0%) | 0 (0.0%) |
| Bachelor's Degree | 7 (100.0%) | 0 (0.0%) |
| Graduate Degree | 0 (0.0%) | 0 (0.0%) |
| Total | 7 (100.0%) | 0 (0.0%) |
Employment Characteristics in Pine Lakes Addition
Employment by Class of Employer in Pine Lakes Addition
Among the 174 employed individuals in Pine Lakes Addition, private company employees (86 | 49.4%), not-for-profit organizations (42 | 24.1%), and self-employed (incorporated) (33 | 19.0%) make up the most common classes of employment.
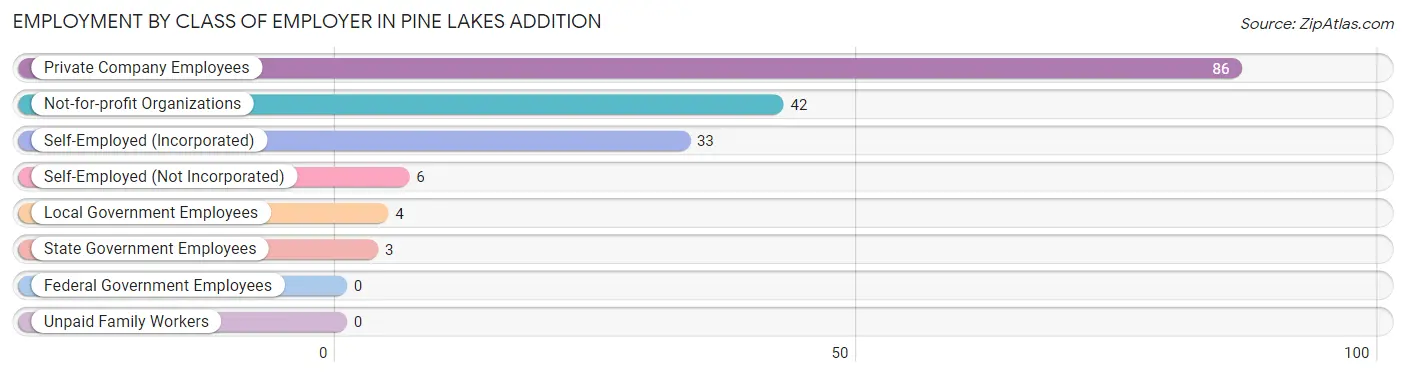
| Employer Class | # Employees | % Employees |
| Private Company Employees | 86 | 49.4% |
| Self-Employed (Incorporated) | 33 | 19.0% |
| Self-Employed (Not Incorporated) | 6 | 3.5% |
| Not-for-profit Organizations | 42 | 24.1% |
| Local Government Employees | 4 | 2.3% |
| State Government Employees | 3 | 1.7% |
| Federal Government Employees | 0 | 0.0% |
| Unpaid Family Workers | 0 | 0.0% |
| Total | 174 | 100.0% |
Employment Status by Age in Pine Lakes Addition
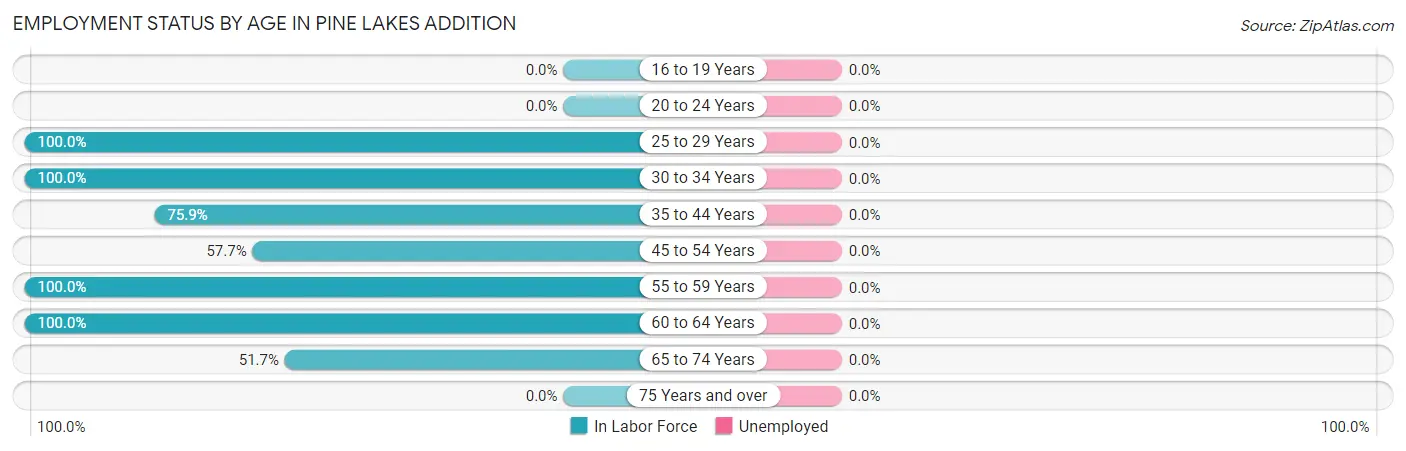
| Age Bracket | In Labor Force | Unemployed |
| 16 to 19 Years | 0 (0.0%) | 0 (0.0%) |
| 20 to 24 Years | 0 (0.0%) | 0 (0.0%) |
| 25 to 29 Years | 16 (100.0%) | 0 (0.0%) |
| 30 to 34 Years | 19 (100.0%) | 0 (0.0%) |
| 35 to 44 Years | 22 (75.9%) | 0 (0.0%) |
| 45 to 54 Years | 15 (57.7%) | 0 (0.0%) |
| 55 to 59 Years | 42 (100.0%) | 0 (0.0%) |
| 60 to 64 Years | 45 (100.0%) | 0 (0.0%) |
| 65 to 74 Years | 15 (51.7%) | 0 (0.0%) |
| 75 Years and over | 0 (0.0%) | 0 (0.0%) |
| Total | 174 (84.5%) | 0 (0.0%) |
Employment Status by Educational Attainment in Pine Lakes Addition
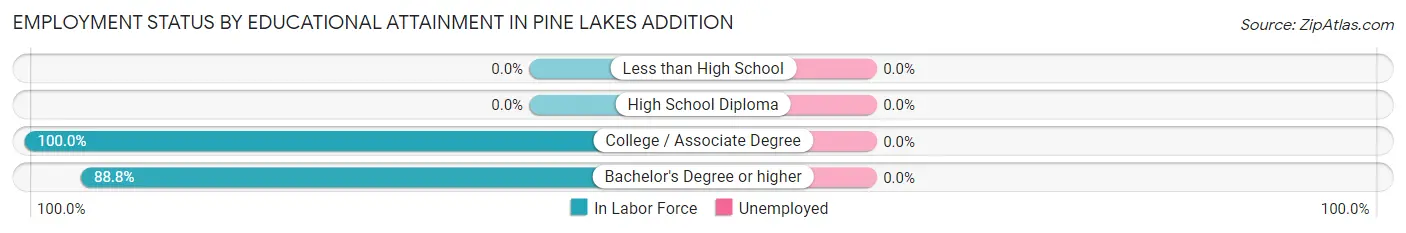
| Educational Attainment | In Labor Force | Unemployed |
| Less than High School | 0 (0.0%) | 0 (0.0%) |
| High School Diploma | 0 (0.0%) | 0 (0.0%) |
| College / Associate Degree | 17 (100.0%) | 0 (0.0%) |
| Bachelor's Degree or higher | 142 (88.8%) | 0 (0.0%) |
| Total | 159 (89.8%) | 0 (0.0%) |
Employment Occupations by Sex in Pine Lakes Addition
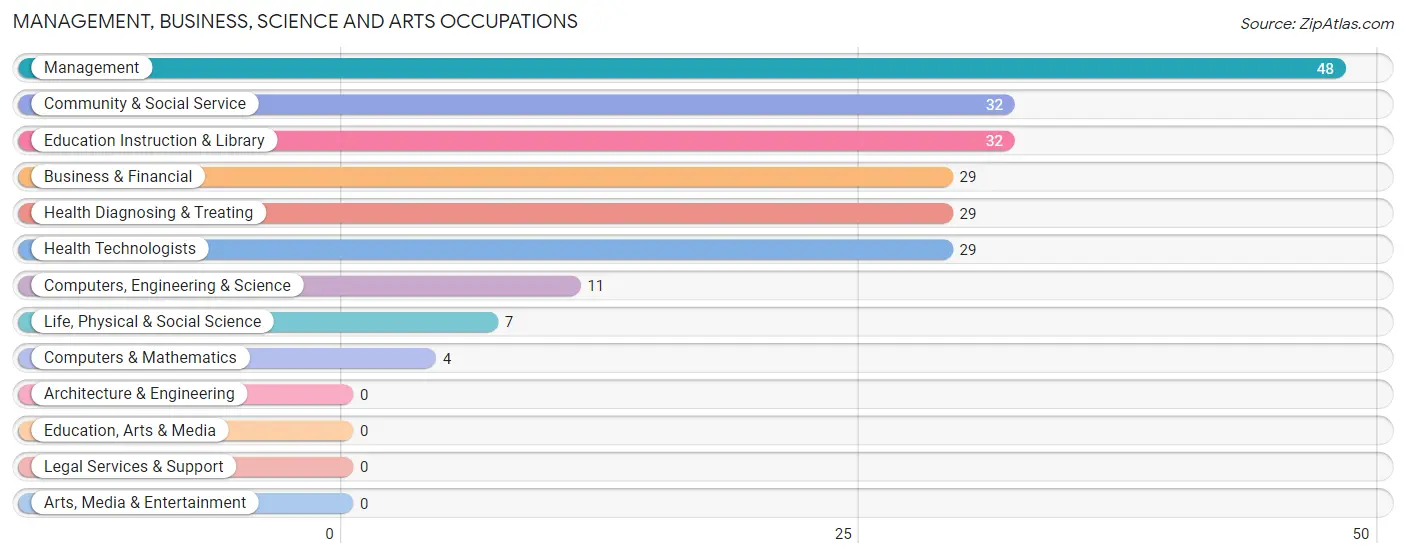
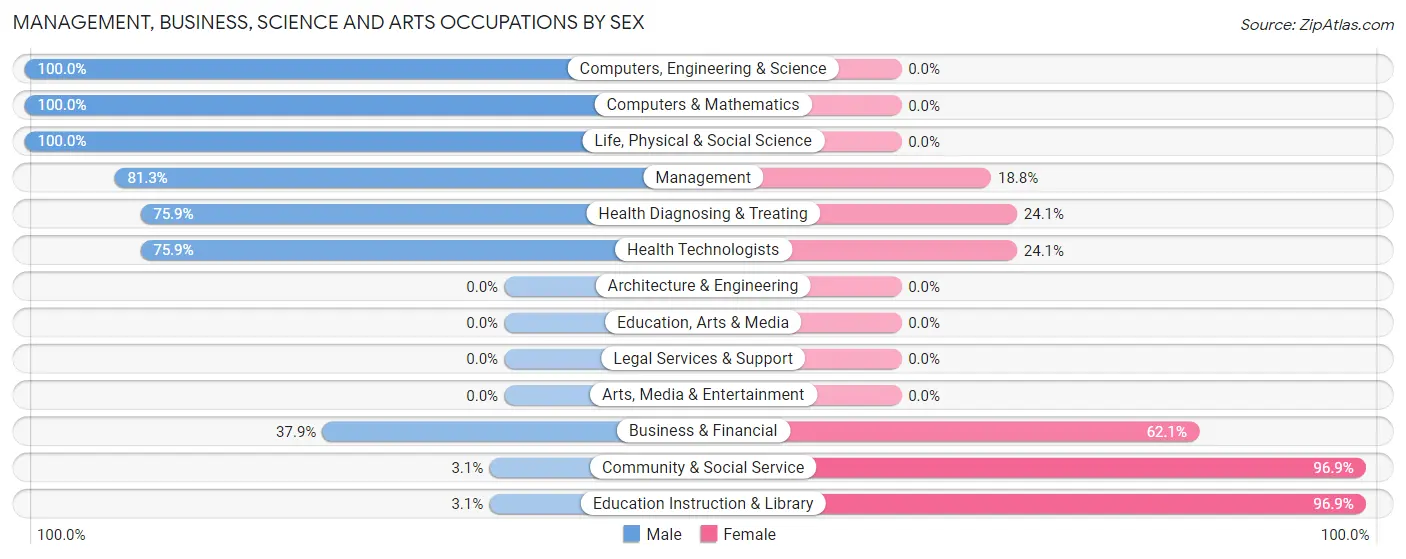
Management, Business, Science and Arts Occupations
The most common Management, Business, Science and Arts occupations in Pine Lakes Addition are Management (48 | 27.6%), Community & Social Service (32 | 18.4%), Education Instruction & Library (32 | 18.4%), Business & Financial (29 | 16.7%), and Health Diagnosing & Treating (29 | 16.7%).
Management, Business, Science and Arts Occupations by Sex
Within the Management, Business, Science and Arts occupations in Pine Lakes Addition, the most male-oriented occupations are Computers, Engineering & Science (100.0%), Computers & Mathematics (100.0%), and Life, Physical & Social Science (100.0%), while the most female-oriented occupations are Community & Social Service (96.9%), Education Instruction & Library (96.9%), and Business & Financial (62.1%).
| Occupation | Male | Female |
| Management | 39 (81.2%) | 9 (18.8%) |
| Business & Financial | 11 (37.9%) | 18 (62.1%) |
| Computers, Engineering & Science | 11 (100.0%) | 0 (0.0%) |
| Computers & Mathematics | 4 (100.0%) | 0 (0.0%) |
| Architecture & Engineering | 0 (0.0%) | 0 (0.0%) |
| Life, Physical & Social Science | 7 (100.0%) | 0 (0.0%) |
| Community & Social Service | 1 (3.1%) | 31 (96.9%) |
| Education, Arts & Media | 0 (0.0%) | 0 (0.0%) |
| Legal Services & Support | 0 (0.0%) | 0 (0.0%) |
| Education Instruction & Library | 1 (3.1%) | 31 (96.9%) |
| Arts, Media & Entertainment | 0 (0.0%) | 0 (0.0%) |
| Health Diagnosing & Treating | 22 (75.9%) | 7 (24.1%) |
| Health Technologists | 22 (75.9%) | 7 (24.1%) |
| Total (Category) | 84 (56.4%) | 65 (43.6%) |
| Total (Overall) | 103 (59.2%) | 71 (40.8%) |
Services Occupations
Services Occupations by Sex
| Occupation | Male | Female |
| Healthcare Support | 0 (0.0%) | 0 (0.0%) |
| Security & Protection | 0 (0.0%) | 0 (0.0%) |
| Firefighting & Prevention | 0 (0.0%) | 0 (0.0%) |
| Law Enforcement | 0 (0.0%) | 0 (0.0%) |
| Food Preparation & Serving | 0 (0.0%) | 0 (0.0%) |
| Cleaning & Maintenance | 0 (0.0%) | 0 (0.0%) |
| Personal Care & Service | 0 (0.0%) | 0 (0.0%) |
| Total (Category) | 0 (0.0%) | 0 (0.0%) |
| Total (Overall) | 103 (59.2%) | 71 (40.8%) |
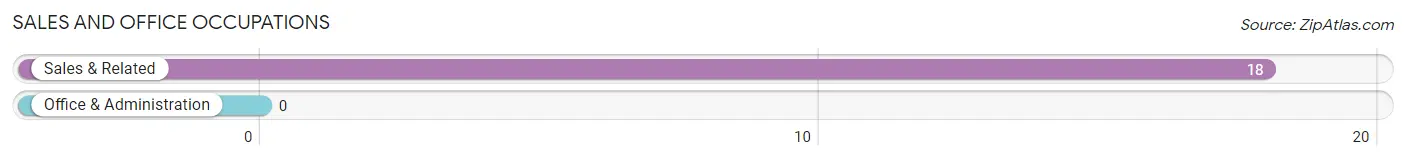
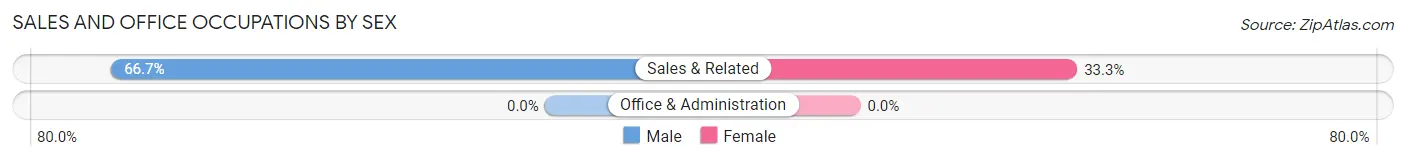
Sales and Office Occupations
The most common Sales and Office occupations in Pine Lakes Addition are , and Sales & Related (18 | 10.3%).
Sales and Office Occupations by Sex
| Occupation | Male | Female |
| Sales & Related | 12 (66.7%) | 6 (33.3%) |
| Office & Administration | 0 (0.0%) | 0 (0.0%) |
| Total (Category) | 12 (66.7%) | 6 (33.3%) |
| Total (Overall) | 103 (59.2%) | 71 (40.8%) |
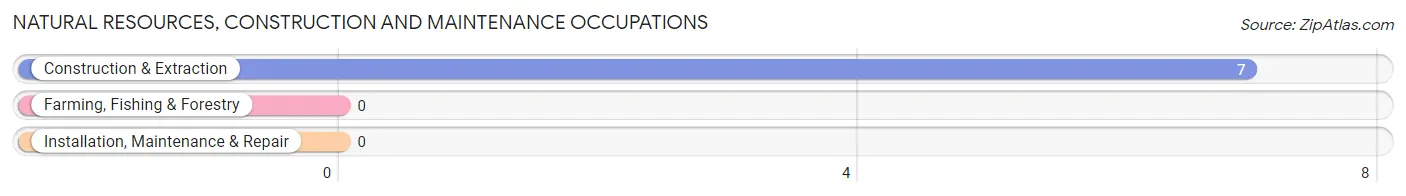
Natural Resources, Construction and Maintenance Occupations
The most common Natural Resources, Construction and Maintenance occupations in Pine Lakes Addition are , and Construction & Extraction (7 | 4.0%).
Natural Resources, Construction and Maintenance Occupations by Sex
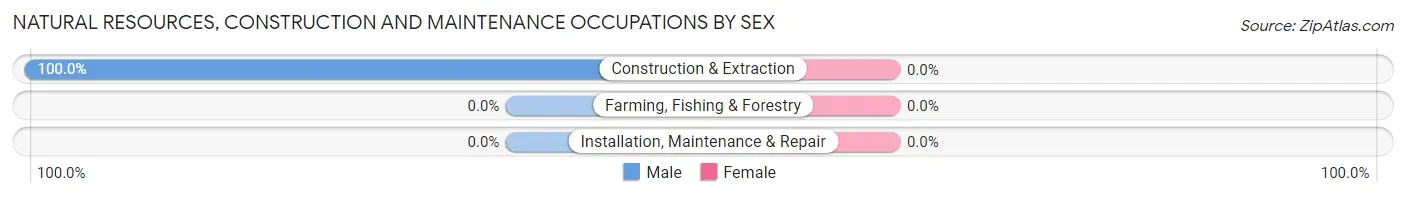
| Occupation | Male | Female |
| Farming, Fishing & Forestry | 0 (0.0%) | 0 (0.0%) |
| Construction & Extraction | 7 (100.0%) | 0 (0.0%) |
| Installation, Maintenance & Repair | 0 (0.0%) | 0 (0.0%) |
| Total (Category) | 7 (100.0%) | 0 (0.0%) |
| Total (Overall) | 103 (59.2%) | 71 (40.8%) |
Production, Transportation and Moving Occupations
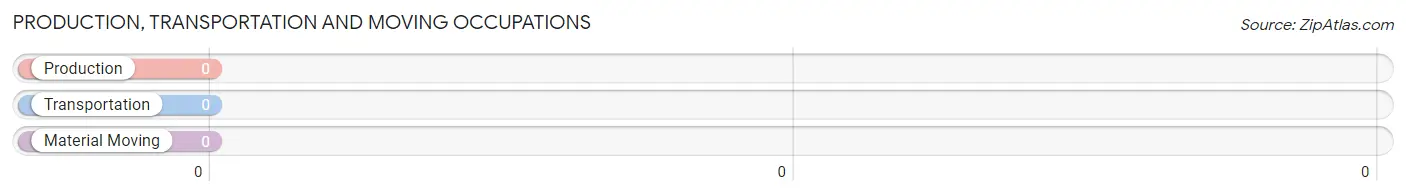
Production, Transportation and Moving Occupations by Sex
| Occupation | Male | Female |
| Production | 0 (0.0%) | 0 (0.0%) |
| Transportation | 0 (0.0%) | 0 (0.0%) |
| Material Moving | 0 (0.0%) | 0 (0.0%) |
| Total (Category) | 0 (0.0%) | 0 (0.0%) |
| Total (Overall) | 103 (59.2%) | 71 (40.8%) |
Employment Industries by Sex in Pine Lakes Addition
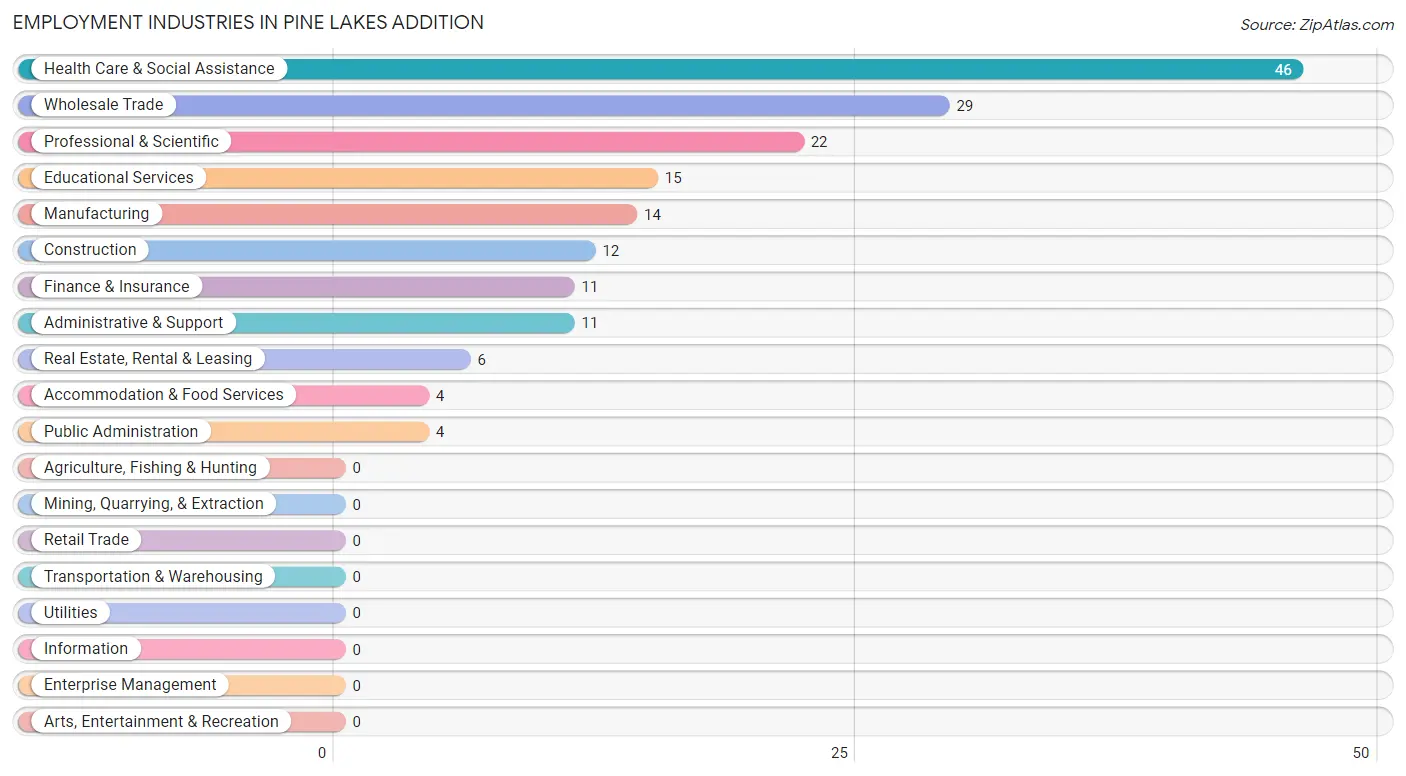
Employment Industries in Pine Lakes Addition
The major employment industries in Pine Lakes Addition include Health Care & Social Assistance (46 | 26.4%), Wholesale Trade (29 | 16.7%), Professional & Scientific (22 | 12.6%), Educational Services (15 | 8.6%), and Manufacturing (14 | 8.1%).
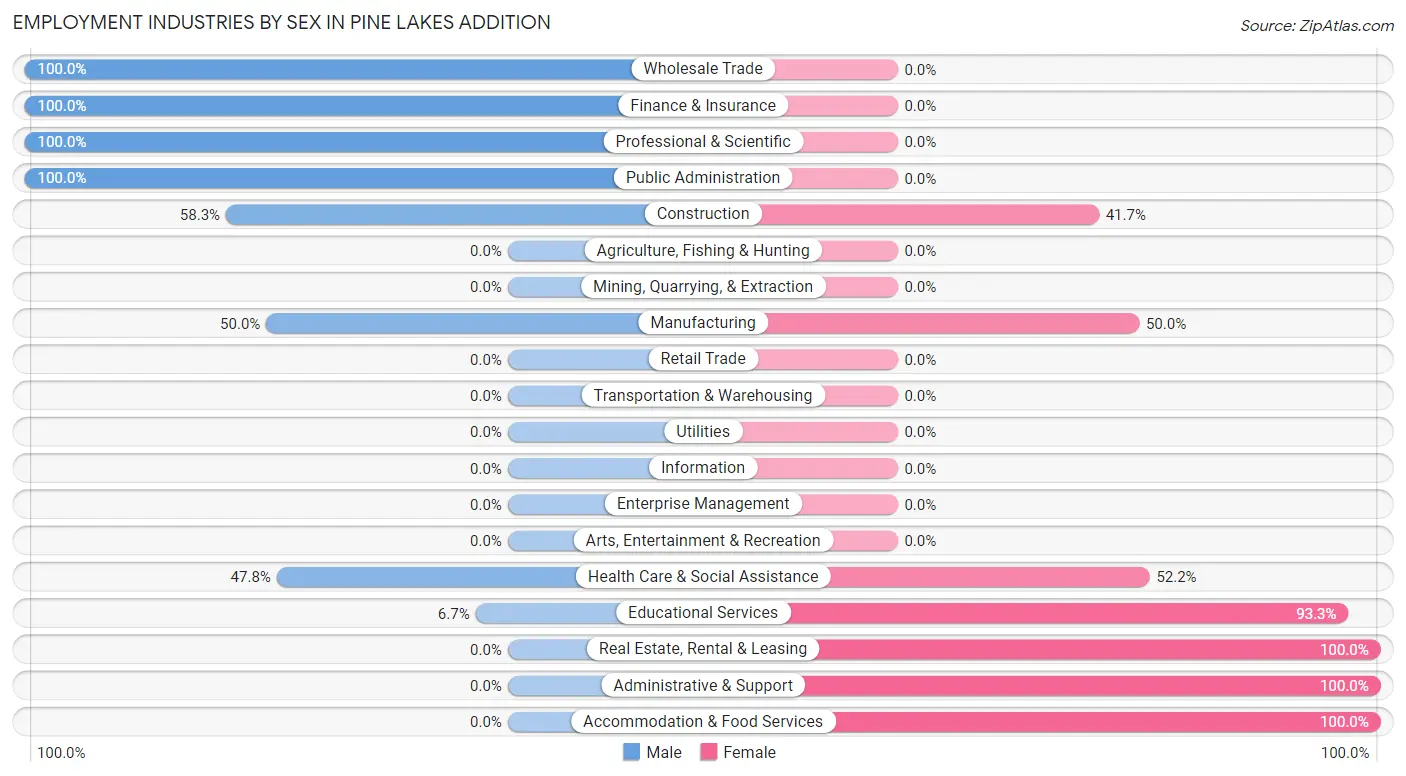
Employment Industries by Sex in Pine Lakes Addition
The Pine Lakes Addition industries that see more men than women are Wholesale Trade (100.0%), Finance & Insurance (100.0%), and Professional & Scientific (100.0%), whereas the industries that tend to have a higher number of women are Real Estate, Rental & Leasing (100.0%), Administrative & Support (100.0%), and Accommodation & Food Services (100.0%).
| Industry | Male | Female |
| Agriculture, Fishing & Hunting | 0 (0.0%) | 0 (0.0%) |
| Mining, Quarrying, & Extraction | 0 (0.0%) | 0 (0.0%) |
| Construction | 7 (58.3%) | 5 (41.7%) |
| Manufacturing | 7 (50.0%) | 7 (50.0%) |
| Wholesale Trade | 29 (100.0%) | 0 (0.0%) |
| Retail Trade | 0 (0.0%) | 0 (0.0%) |
| Transportation & Warehousing | 0 (0.0%) | 0 (0.0%) |
| Utilities | 0 (0.0%) | 0 (0.0%) |
| Information | 0 (0.0%) | 0 (0.0%) |
| Finance & Insurance | 11 (100.0%) | 0 (0.0%) |
| Real Estate, Rental & Leasing | 0 (0.0%) | 6 (100.0%) |
| Professional & Scientific | 22 (100.0%) | 0 (0.0%) |
| Enterprise Management | 0 (0.0%) | 0 (0.0%) |
| Administrative & Support | 0 (0.0%) | 11 (100.0%) |
| Educational Services | 1 (6.7%) | 14 (93.3%) |
| Health Care & Social Assistance | 22 (47.8%) | 24 (52.2%) |
| Arts, Entertainment & Recreation | 0 (0.0%) | 0 (0.0%) |
| Accommodation & Food Services | 0 (0.0%) | 4 (100.0%) |
| Public Administration | 4 (100.0%) | 0 (0.0%) |
| Total | 103 (59.2%) | 71 (40.8%) |
Education in Pine Lakes Addition
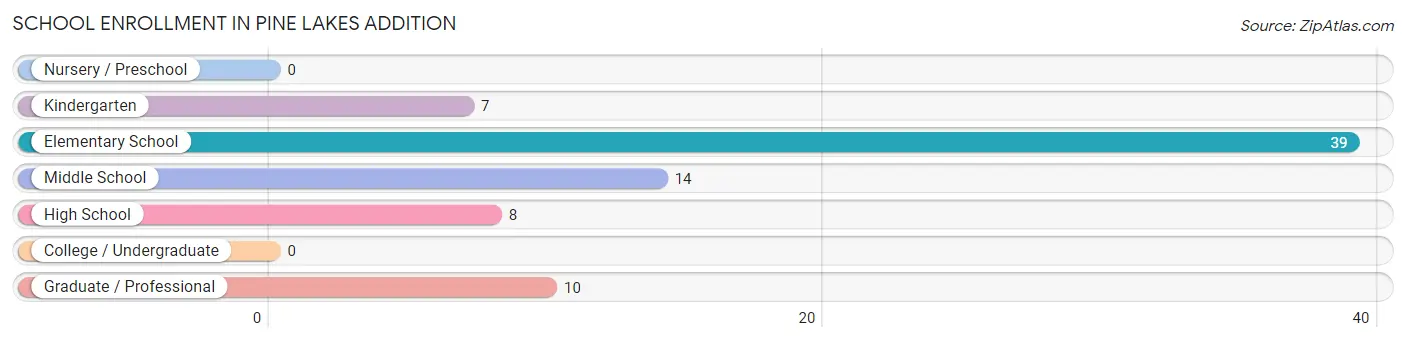
School Enrollment in Pine Lakes Addition
The most common levels of schooling among the 78 students in Pine Lakes Addition are elementary school (39 | 50.0%), middle school (14 | 17.9%), and graduate / professional (10 | 12.8%).
| School Level | # Students | % Students |
| Nursery / Preschool | 0 | 0.0% |
| Kindergarten | 7 | 9.0% |
| Elementary School | 39 | 50.0% |
| Middle School | 14 | 17.9% |
| High School | 8 | 10.3% |
| College / Undergraduate | 0 | 0.0% |
| Graduate / Professional | 10 | 12.8% |
| Total | 78 | 100.0% |
School Enrollment by Age by Funding Source in Pine Lakes Addition
Out of a total of 78 students who are enrolled in schools in Pine Lakes Addition, 24 (30.8%) attend a private institution, while the remaining 54 (69.2%) are enrolled in public schools. The age group of 35 years and over has the highest likelihood of being enrolled in private schools, with 6 (100.0% in the age bracket) enrolled. Conversely, the age group of 5 to 9 year old has the lowest likelihood of being enrolled in a private school, with 31 (79.5% in the age bracket) attending a public institution.
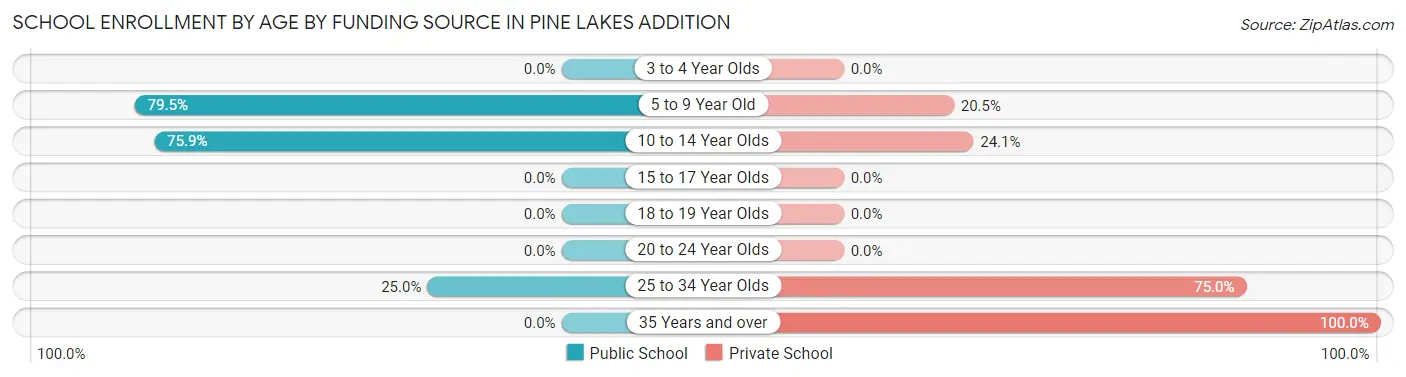
| Age Bracket | Public School | Private School |
| 3 to 4 Year Olds | 0 (0.0%) | 0 (0.0%) |
| 5 to 9 Year Old | 31 (79.5%) | 8 (20.5%) |
| 10 to 14 Year Olds | 22 (75.9%) | 7 (24.1%) |
| 15 to 17 Year Olds | 0 (0.0%) | 0 (0.0%) |
| 18 to 19 Year Olds | 0 (0.0%) | 0 (0.0%) |
| 20 to 24 Year Olds | 0 (0.0%) | 0 (0.0%) |
| 25 to 34 Year Olds | 1 (25.0%) | 3 (75.0%) |
| 35 Years and over | 0 (0.0%) | 6 (100.0%) |
| Total | 54 (69.2%) | 24 (30.8%) |
Educational Attainment by Field of Study in Pine Lakes Addition
Business (50 | 27.5%), education (38 | 20.9%), computers & mathematics (24 | 13.2%), science & technology (22 | 12.1%), and social sciences (15 | 8.2%) are the most common fields of study among 182 individuals in Pine Lakes Addition who have obtained a bachelor's degree or higher.
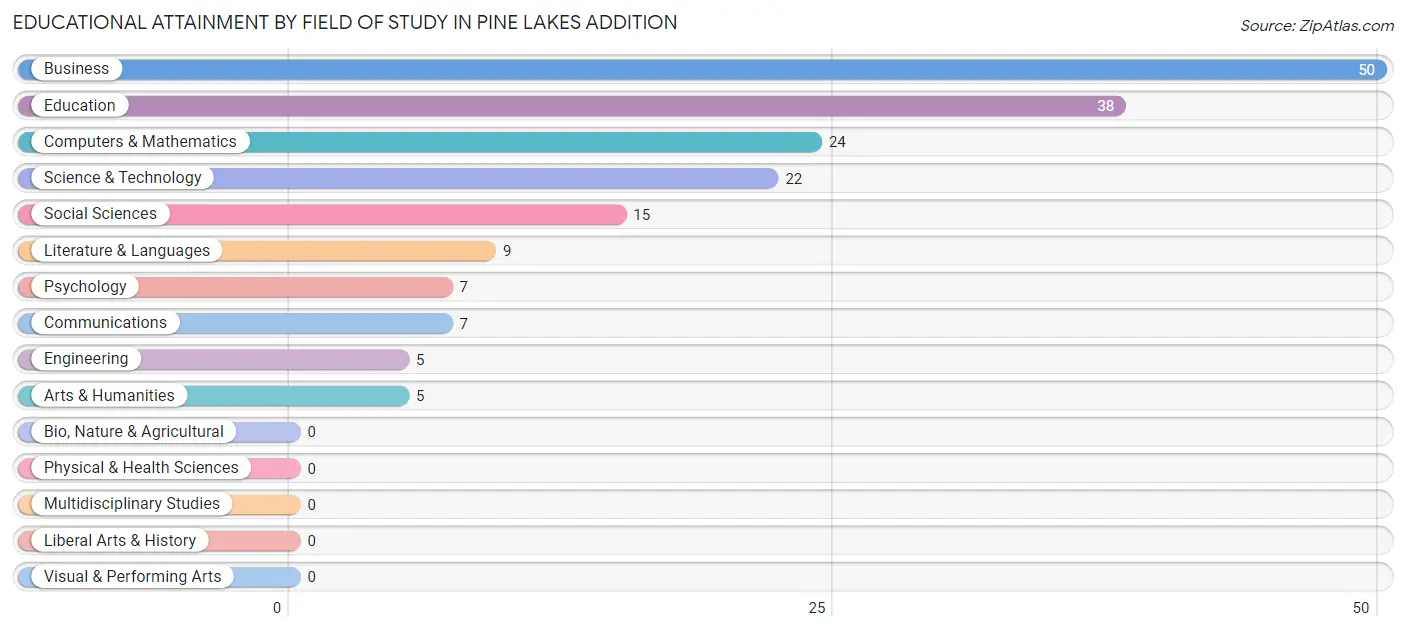
| Field of Study | # Graduates | % Graduates |
| Computers & Mathematics | 24 | 13.2% |
| Bio, Nature & Agricultural | 0 | 0.0% |
| Physical & Health Sciences | 0 | 0.0% |
| Psychology | 7 | 3.8% |
| Social Sciences | 15 | 8.2% |
| Engineering | 5 | 2.8% |
| Multidisciplinary Studies | 0 | 0.0% |
| Science & Technology | 22 | 12.1% |
| Business | 50 | 27.5% |
| Education | 38 | 20.9% |
| Literature & Languages | 9 | 5.0% |
| Liberal Arts & History | 0 | 0.0% |
| Visual & Performing Arts | 0 | 0.0% |
| Communications | 7 | 3.8% |
| Arts & Humanities | 5 | 2.8% |
| Total | 182 | 100.0% |
Transportation & Commute in Pine Lakes Addition
Vehicle Availability by Sex in Pine Lakes Addition
The most prevalent vehicle ownership categories in Pine Lakes Addition are males with 2 vehicles (77, accounting for 74.8%) and females with 2 vehicles (55, making up 108.5%).
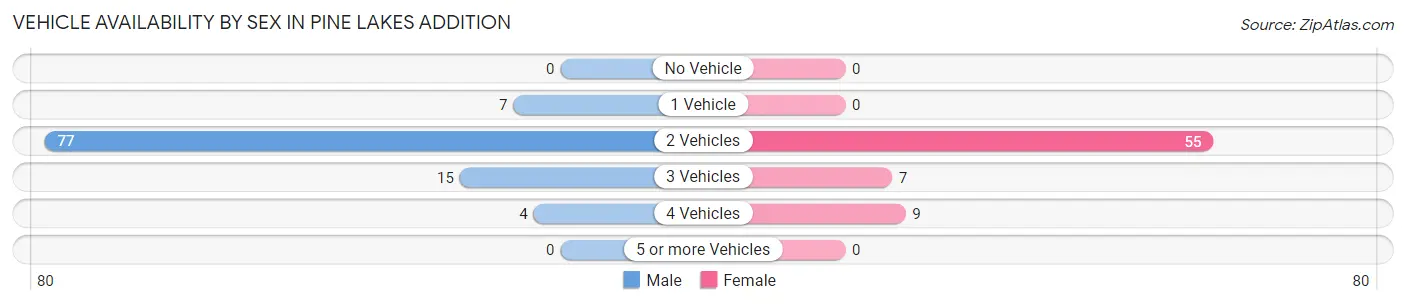
| Vehicles Available | Male | Female |
| No Vehicle | 0 (0.0%) | 0 (0.0%) |
| 1 Vehicle | 7 (6.8%) | 0 (0.0%) |
| 2 Vehicles | 77 (74.8%) | 55 (77.5%) |
| 3 Vehicles | 15 (14.6%) | 7 (9.9%) |
| 4 Vehicles | 4 (3.9%) | 9 (12.7%) |
| 5 or more Vehicles | 0 (0.0%) | 0 (0.0%) |
| Total | 103 (100.0%) | 71 (100.0%) |
Commute Time in Pine Lakes Addition
The most frequently occuring commute durations in Pine Lakes Addition are 15 to 19 minutes (70 commuters, 48.6%), 20 to 24 minutes (36 commuters, 25.0%), and 5 to 9 minutes (17 commuters, 11.8%).
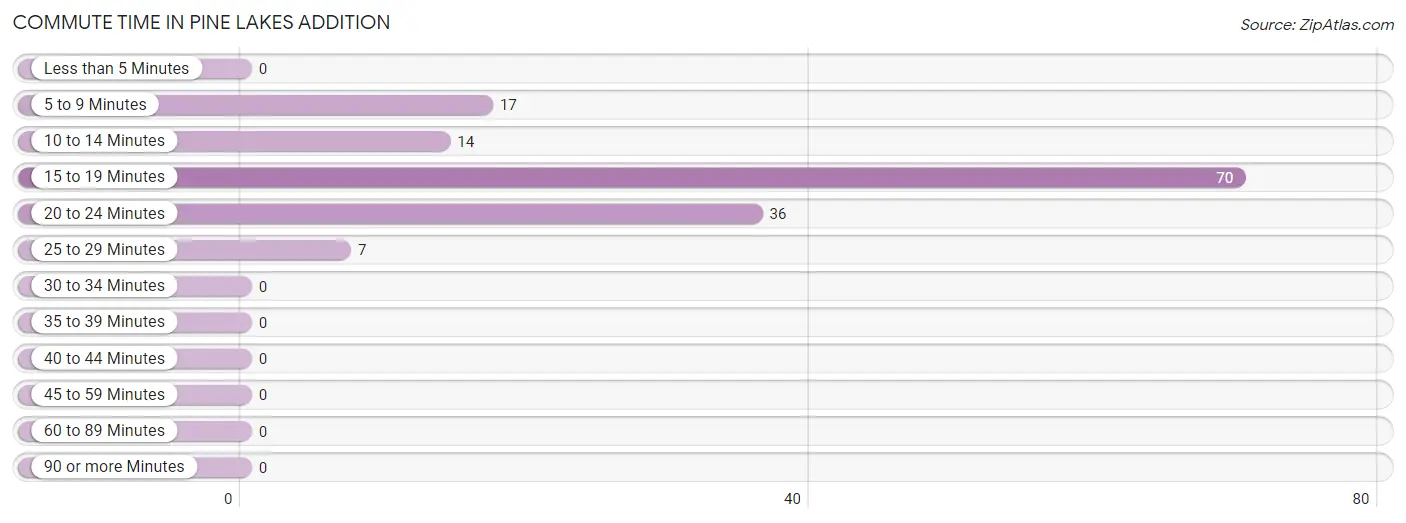
| Commute Time | # Commuters | % Commuters |
| Less than 5 Minutes | 0 | 0.0% |
| 5 to 9 Minutes | 17 | 11.8% |
| 10 to 14 Minutes | 14 | 9.7% |
| 15 to 19 Minutes | 70 | 48.6% |
| 20 to 24 Minutes | 36 | 25.0% |
| 25 to 29 Minutes | 7 | 4.9% |
| 30 to 34 Minutes | 0 | 0.0% |
| 35 to 39 Minutes | 0 | 0.0% |
| 40 to 44 Minutes | 0 | 0.0% |
| 45 to 59 Minutes | 0 | 0.0% |
| 60 to 89 Minutes | 0 | 0.0% |
| 90 or more Minutes | 0 | 0.0% |
Commute Time by Sex in Pine Lakes Addition
The most common commute times in Pine Lakes Addition are 15 to 19 minutes (44 commuters, 60.3%) for males and 15 to 19 minutes (26 commuters, 36.6%) for females.
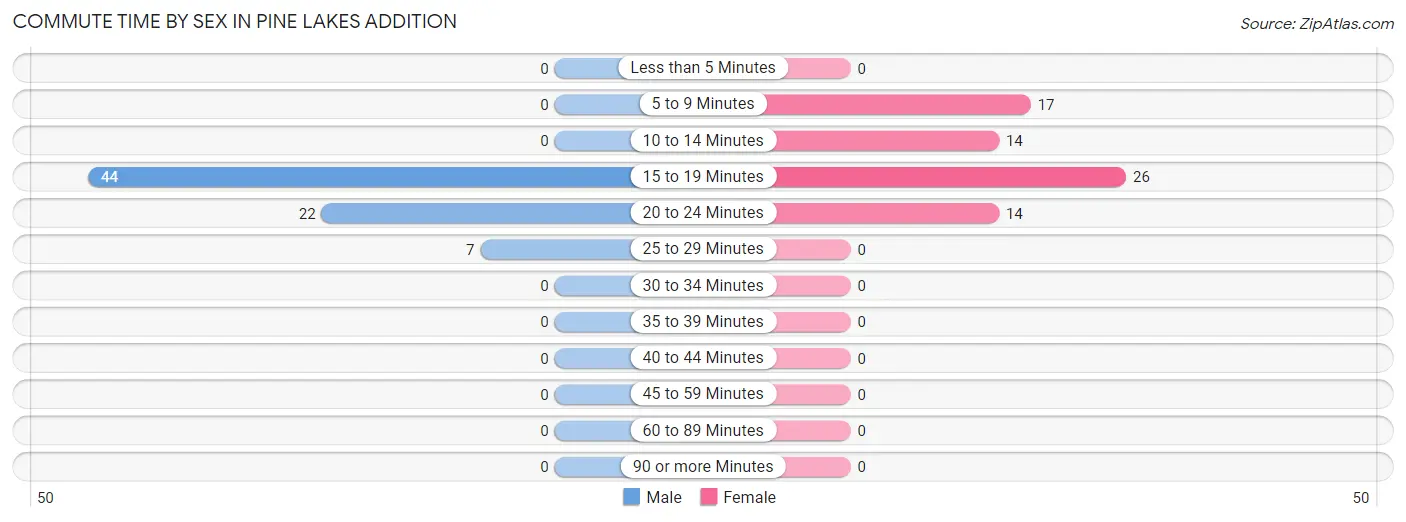
| Commute Time | Male | Female |
| Less than 5 Minutes | 0 (0.0%) | 0 (0.0%) |
| 5 to 9 Minutes | 0 (0.0%) | 17 (23.9%) |
| 10 to 14 Minutes | 0 (0.0%) | 14 (19.7%) |
| 15 to 19 Minutes | 44 (60.3%) | 26 (36.6%) |
| 20 to 24 Minutes | 22 (30.1%) | 14 (19.7%) |
| 25 to 29 Minutes | 7 (9.6%) | 0 (0.0%) |
| 30 to 34 Minutes | 0 (0.0%) | 0 (0.0%) |
| 35 to 39 Minutes | 0 (0.0%) | 0 (0.0%) |
| 40 to 44 Minutes | 0 (0.0%) | 0 (0.0%) |
| 45 to 59 Minutes | 0 (0.0%) | 0 (0.0%) |
| 60 to 89 Minutes | 0 (0.0%) | 0 (0.0%) |
| 90 or more Minutes | 0 (0.0%) | 0 (0.0%) |
Time of Departure to Work by Sex in Pine Lakes Addition
The most frequent times of departure to work in Pine Lakes Addition are 8:00 AM to 8:29 AM (28, 38.4%) for males and 8:00 AM to 8:29 AM (31, 43.7%) for females.
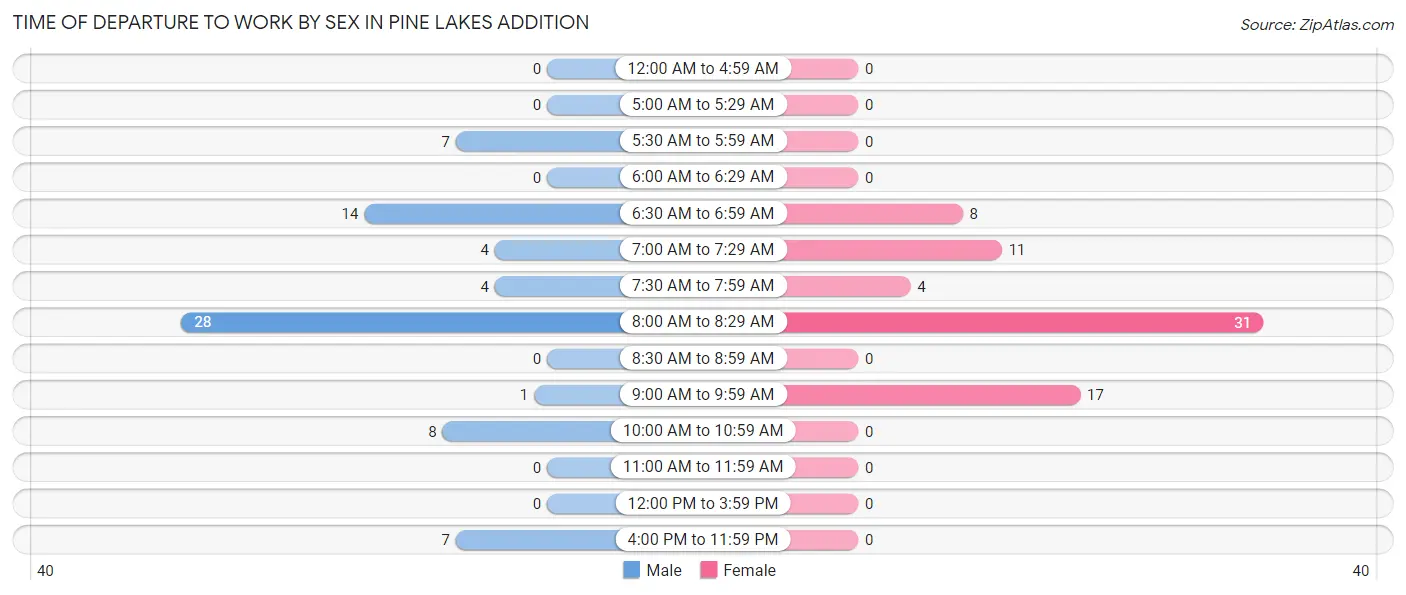
| Time of Departure | Male | Female |
| 12:00 AM to 4:59 AM | 0 (0.0%) | 0 (0.0%) |
| 5:00 AM to 5:29 AM | 0 (0.0%) | 0 (0.0%) |
| 5:30 AM to 5:59 AM | 7 (9.6%) | 0 (0.0%) |
| 6:00 AM to 6:29 AM | 0 (0.0%) | 0 (0.0%) |
| 6:30 AM to 6:59 AM | 14 (19.2%) | 8 (11.3%) |
| 7:00 AM to 7:29 AM | 4 (5.5%) | 11 (15.5%) |
| 7:30 AM to 7:59 AM | 4 (5.5%) | 4 (5.6%) |
| 8:00 AM to 8:29 AM | 28 (38.4%) | 31 (43.7%) |
| 8:30 AM to 8:59 AM | 0 (0.0%) | 0 (0.0%) |
| 9:00 AM to 9:59 AM | 1 (1.4%) | 17 (23.9%) |
| 10:00 AM to 10:59 AM | 8 (11.0%) | 0 (0.0%) |
| 11:00 AM to 11:59 AM | 0 (0.0%) | 0 (0.0%) |
| 12:00 PM to 3:59 PM | 0 (0.0%) | 0 (0.0%) |
| 4:00 PM to 11:59 PM | 7 (9.6%) | 0 (0.0%) |
| Total | 73 (100.0%) | 71 (100.0%) |
Housing Occupancy in Pine Lakes Addition
Occupancy by Ownership in Pine Lakes Addition
Of the total 110 dwellings in Pine Lakes Addition, owner-occupied units account for 110 (100.0%), while renter-occupied units make up 0 (0.0%).
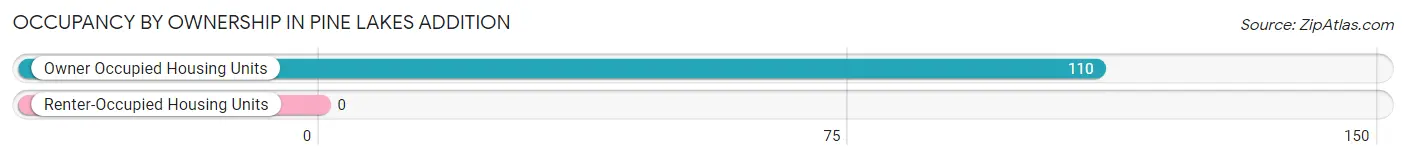
| Occupancy | # Housing Units | % Housing Units |
| Owner Occupied Housing Units | 110 | 100.0% |
| Renter-Occupied Housing Units | 0 | 0.0% |
| Total Occupied Housing Units | 110 | 100.0% |
Occupancy by Household Size in Pine Lakes Addition
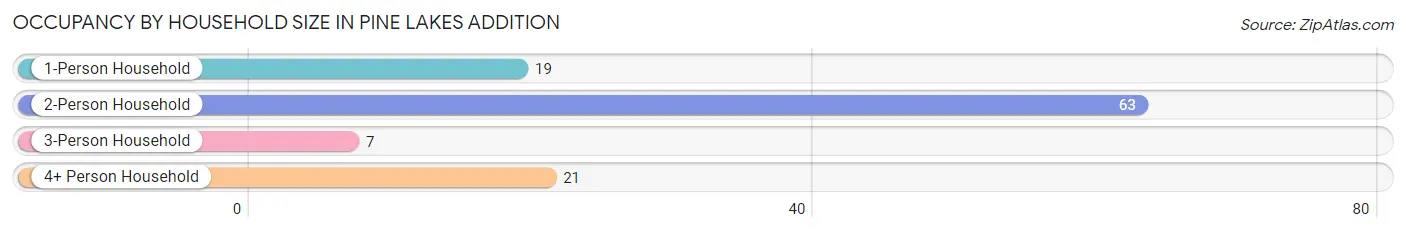
| Household Size | # Housing Units | % Housing Units |
| 1-Person Household | 19 | 17.3% |
| 2-Person Household | 63 | 57.3% |
| 3-Person Household | 7 | 6.4% |
| 4+ Person Household | 21 | 19.1% |
| Total Housing Units | 110 | 100.0% |
Occupancy by Ownership by Household Size in Pine Lakes Addition
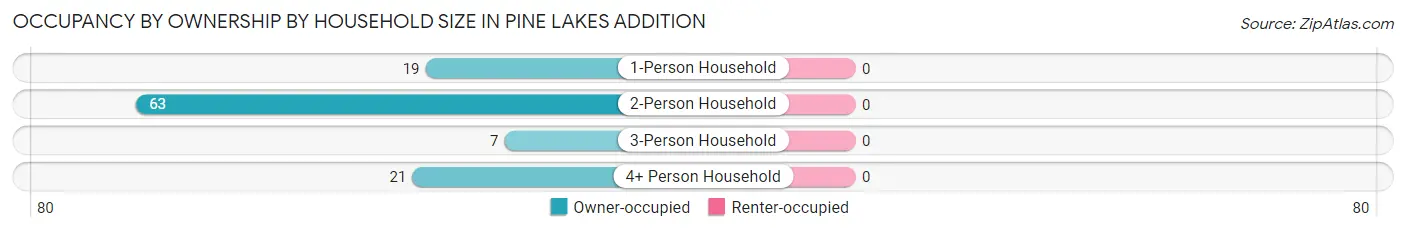
| Household Size | Owner-occupied | Renter-occupied |
| 1-Person Household | 19 (100.0%) | 0 (0.0%) |
| 2-Person Household | 63 (100.0%) | 0 (0.0%) |
| 3-Person Household | 7 (100.0%) | 0 (0.0%) |
| 4+ Person Household | 21 (100.0%) | 0 (0.0%) |
| Total Housing Units | 110 (100.0%) | 0 (0.0%) |
Occupancy by Educational Attainment in Pine Lakes Addition
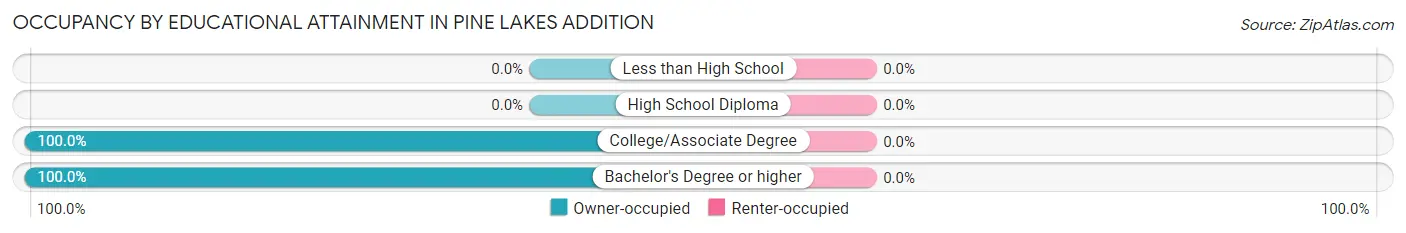
| Household Size | Owner-occupied | Renter-occupied |
| Less than High School | 0 (0.0%) | 0 (0.0%) |
| High School Diploma | 0 (0.0%) | 0 (0.0%) |
| College/Associate Degree | 11 (100.0%) | 0 (0.0%) |
| Bachelor's Degree or higher | 99 (100.0%) | 0 (0.0%) |
Occupancy by Age of Householder in Pine Lakes Addition
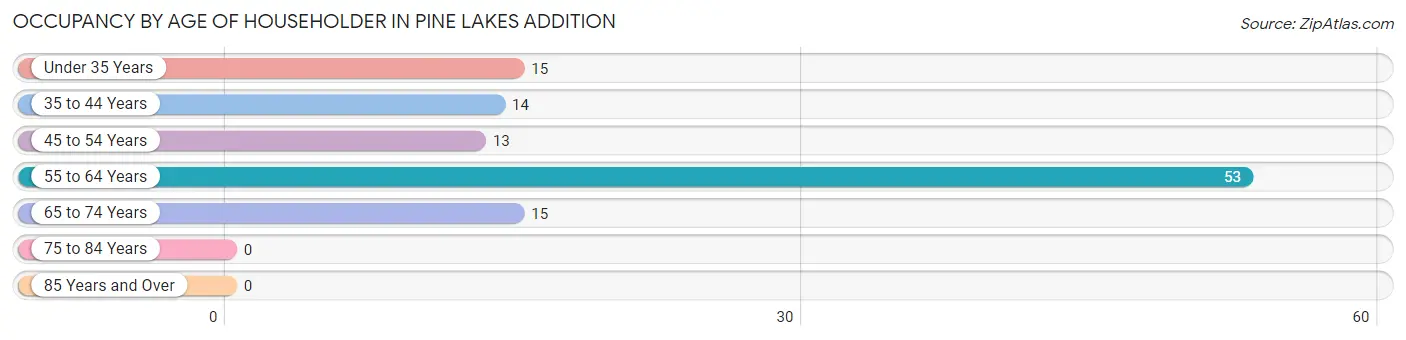
| Age Bracket | # Households | % Households |
| Under 35 Years | 15 | 13.6% |
| 35 to 44 Years | 14 | 12.7% |
| 45 to 54 Years | 13 | 11.8% |
| 55 to 64 Years | 53 | 48.2% |
| 65 to 74 Years | 15 | 13.6% |
| 75 to 84 Years | 0 | 0.0% |
| 85 Years and Over | 0 | 0.0% |
| Total | 110 | 100.0% |
Housing Finances in Pine Lakes Addition
Median Income by Occupancy in Pine Lakes Addition
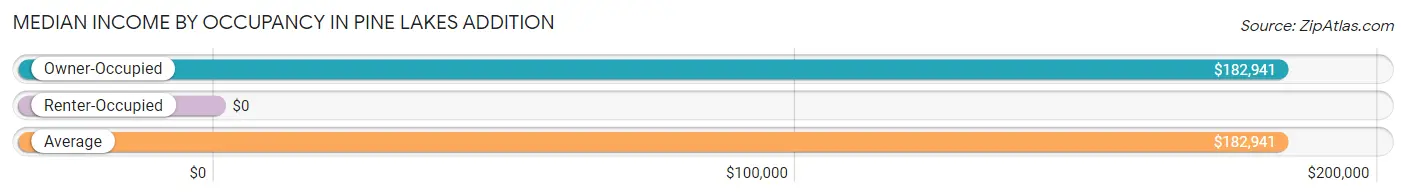
| Occupancy Type | # Households | Median Income |
| Owner-Occupied | 110 (100.0%) | $182,941 |
| Renter-Occupied | 0 (0.0%) | $0 |
| Average | 110 (100.0%) | $182,941 |
Occupancy by Householder Income Bracket in Pine Lakes Addition
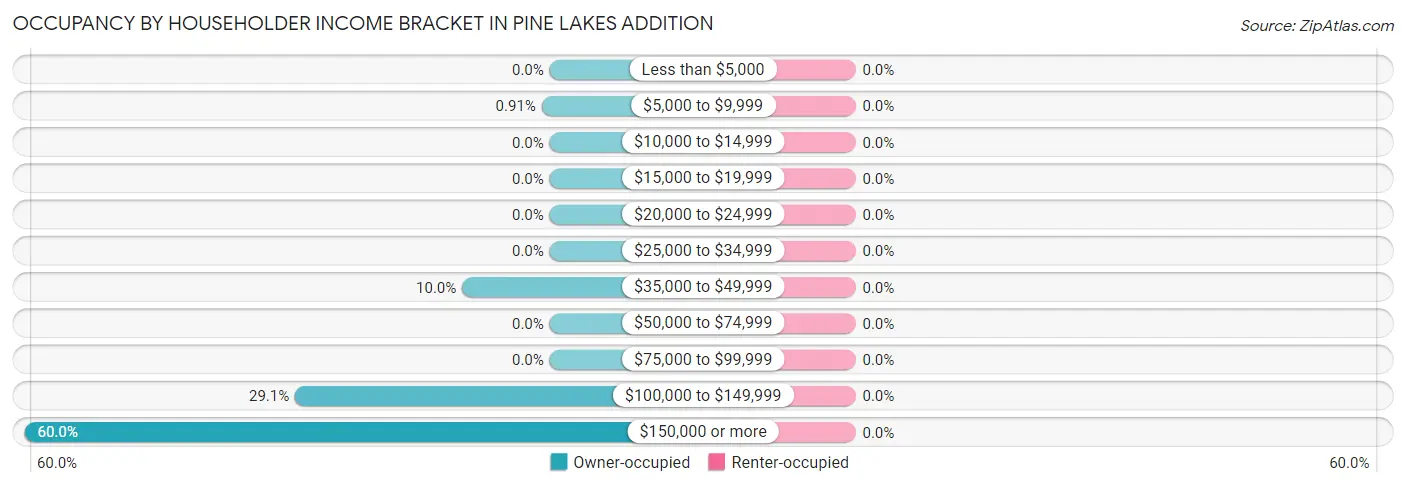
| Income Bracket | Owner-occupied | Renter-occupied |
| Less than $5,000 | 0 (0.0%) | 0 (0.0%) |
| $5,000 to $9,999 | 1 (0.9%) | 0 (0.0%) |
| $10,000 to $14,999 | 0 (0.0%) | 0 (0.0%) |
| $15,000 to $19,999 | 0 (0.0%) | 0 (0.0%) |
| $20,000 to $24,999 | 0 (0.0%) | 0 (0.0%) |
| $25,000 to $34,999 | 0 (0.0%) | 0 (0.0%) |
| $35,000 to $49,999 | 11 (10.0%) | 0 (0.0%) |
| $50,000 to $74,999 | 0 (0.0%) | 0 (0.0%) |
| $75,000 to $99,999 | 0 (0.0%) | 0 (0.0%) |
| $100,000 to $149,999 | 32 (29.1%) | 0 (0.0%) |
| $150,000 or more | 66 (60.0%) | 0 (0.0%) |
| Total | 110 (100.0%) | 0 (0.0%) |
Monthly Housing Cost Tiers in Pine Lakes Addition
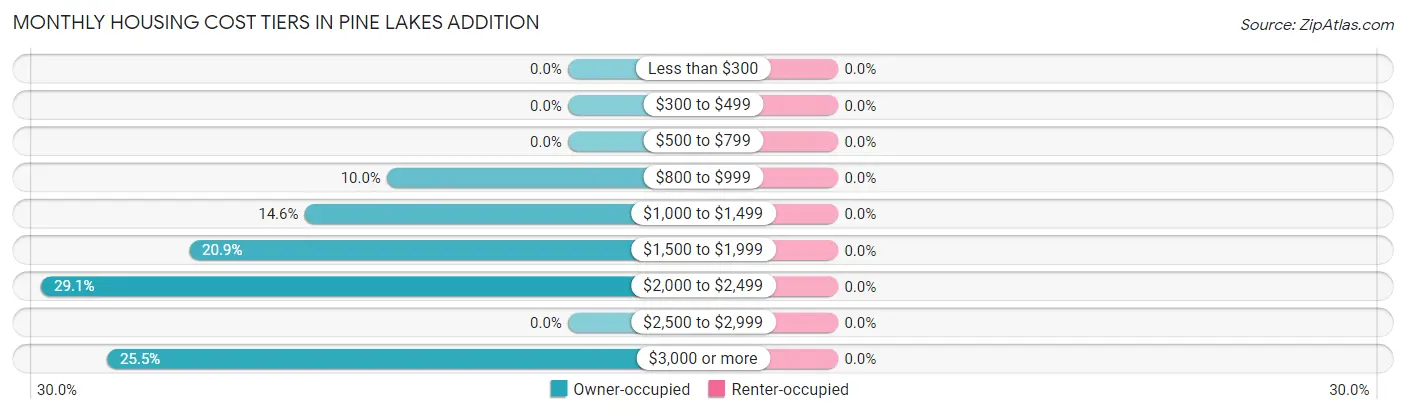
| Monthly Cost | Owner-occupied | Renter-occupied |
| Less than $300 | 0 (0.0%) | 0 (0.0%) |
| $300 to $499 | 0 (0.0%) | 0 (0.0%) |
| $500 to $799 | 0 (0.0%) | 0 (0.0%) |
| $800 to $999 | 11 (10.0%) | 0 (0.0%) |
| $1,000 to $1,499 | 16 (14.5%) | 0 (0.0%) |
| $1,500 to $1,999 | 23 (20.9%) | 0 (0.0%) |
| $2,000 to $2,499 | 32 (29.1%) | 0 (0.0%) |
| $2,500 to $2,999 | 0 (0.0%) | 0 (0.0%) |
| $3,000 or more | 28 (25.5%) | 0 (0.0%) |
| Total | 110 (100.0%) | 0 (0.0%) |
Physical Housing Characteristics in Pine Lakes Addition
Housing Structures in Pine Lakes Addition
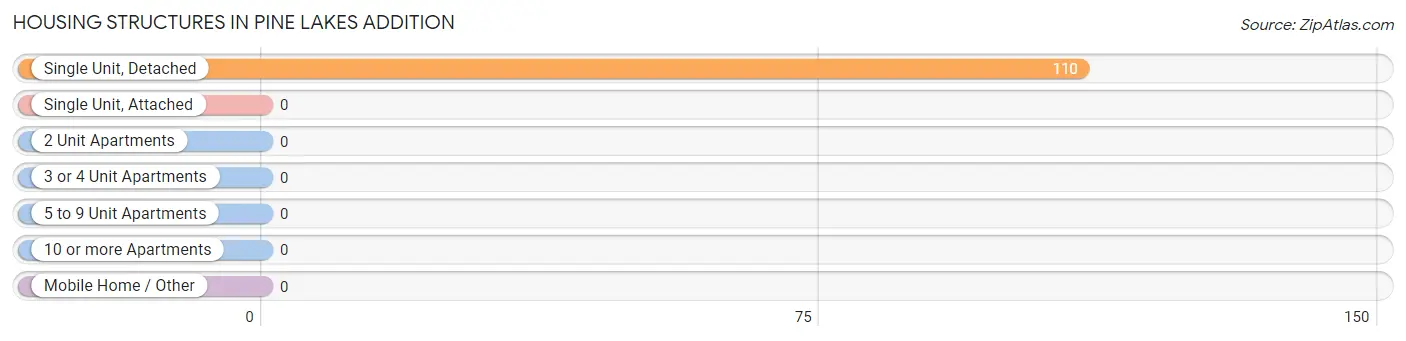
| Structure Type | # Housing Units | % Housing Units |
| Single Unit, Detached | 110 | 100.0% |
| Single Unit, Attached | 0 | 0.0% |
| 2 Unit Apartments | 0 | 0.0% |
| 3 or 4 Unit Apartments | 0 | 0.0% |
| 5 to 9 Unit Apartments | 0 | 0.0% |
| 10 or more Apartments | 0 | 0.0% |
| Mobile Home / Other | 0 | 0.0% |
| Total | 110 | 100.0% |
Housing Structures by Occupancy in Pine Lakes Addition
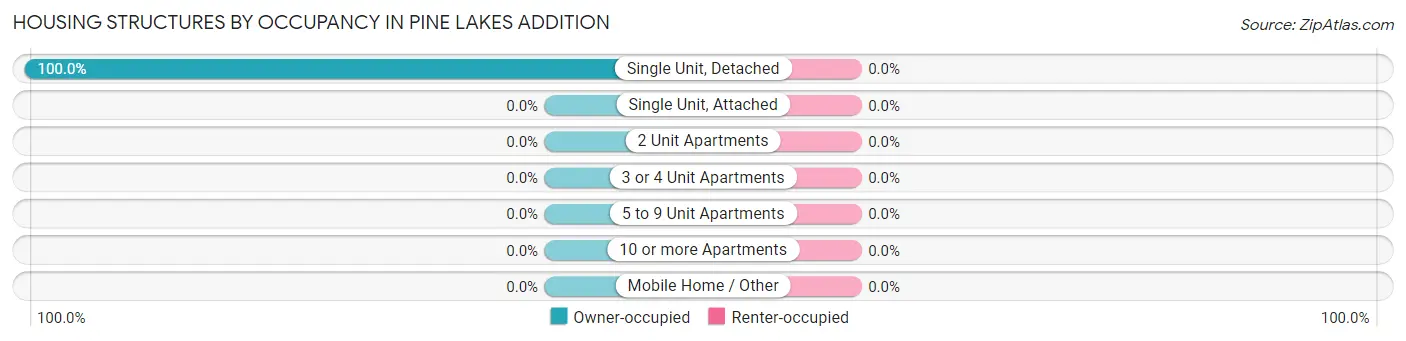
| Structure Type | Owner-occupied | Renter-occupied |
| Single Unit, Detached | 110 (100.0%) | 0 (0.0%) |
| Single Unit, Attached | 0 (0.0%) | 0 (0.0%) |
| 2 Unit Apartments | 0 (0.0%) | 0 (0.0%) |
| 3 or 4 Unit Apartments | 0 (0.0%) | 0 (0.0%) |
| 5 to 9 Unit Apartments | 0 (0.0%) | 0 (0.0%) |
| 10 or more Apartments | 0 (0.0%) | 0 (0.0%) |
| Mobile Home / Other | 0 (0.0%) | 0 (0.0%) |
| Total | 110 (100.0%) | 0 (0.0%) |
Housing Structures by Number of Rooms in Pine Lakes Addition
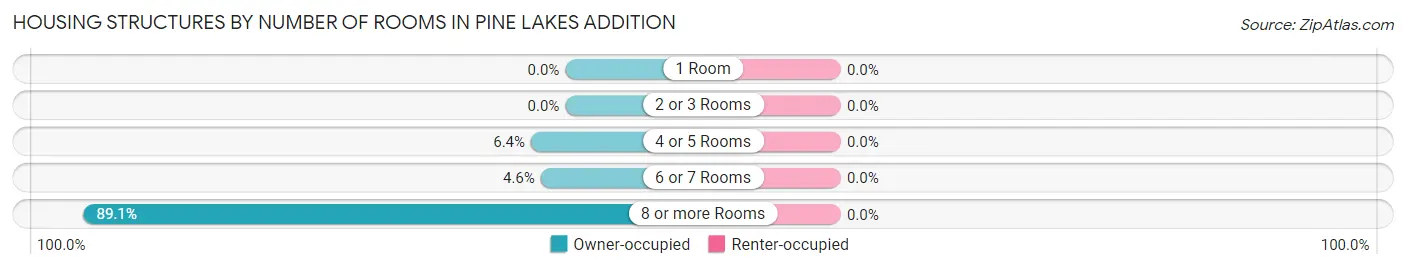
| Number of Rooms | Owner-occupied | Renter-occupied |
| 1 Room | 0 (0.0%) | 0 (0.0%) |
| 2 or 3 Rooms | 0 (0.0%) | 0 (0.0%) |
| 4 or 5 Rooms | 7 (6.4%) | 0 (0.0%) |
| 6 or 7 Rooms | 5 (4.5%) | 0 (0.0%) |
| 8 or more Rooms | 98 (89.1%) | 0 (0.0%) |
| Total | 110 (100.0%) | 0 (0.0%) |
Housing Structure by Heating Type in Pine Lakes Addition
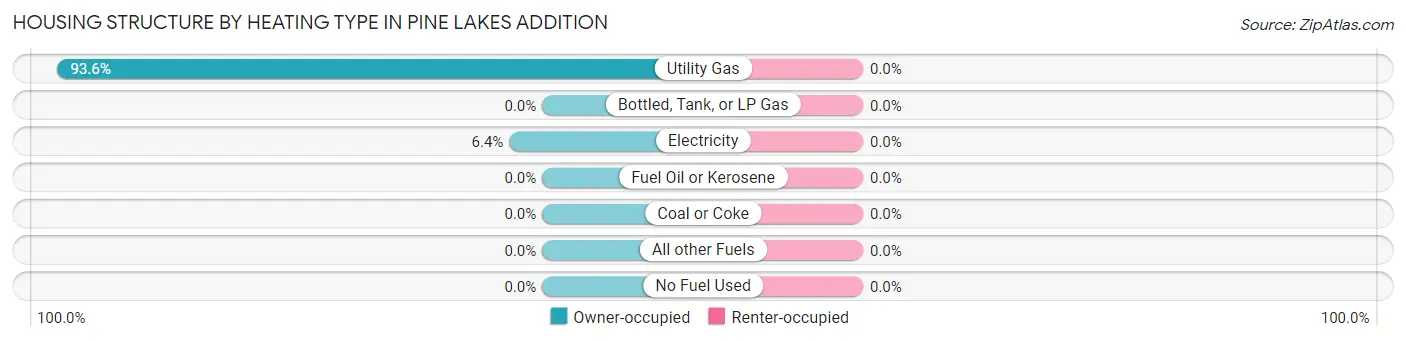
| Heating Type | Owner-occupied | Renter-occupied |
| Utility Gas | 103 (93.6%) | 0 (0.0%) |
| Bottled, Tank, or LP Gas | 0 (0.0%) | 0 (0.0%) |
| Electricity | 7 (6.4%) | 0 (0.0%) |
| Fuel Oil or Kerosene | 0 (0.0%) | 0 (0.0%) |
| Coal or Coke | 0 (0.0%) | 0 (0.0%) |
| All other Fuels | 0 (0.0%) | 0 (0.0%) |
| No Fuel Used | 0 (0.0%) | 0 (0.0%) |
| Total | 110 (100.0%) | 0 (0.0%) |
Household Vehicle Usage in Pine Lakes Addition
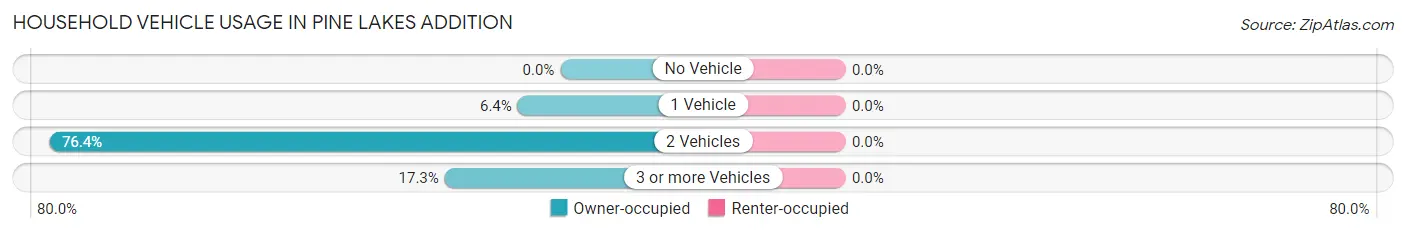
| Vehicles per Household | Owner-occupied | Renter-occupied |
| No Vehicle | 0 (0.0%) | 0 (0.0%) |
| 1 Vehicle | 7 (6.4%) | 0 (0.0%) |
| 2 Vehicles | 84 (76.4%) | 0 (0.0%) |
| 3 or more Vehicles | 19 (17.3%) | 0 (0.0%) |
| Total | 110 (100.0%) | 0 (0.0%) |
Real Estate & Mortgages in Pine Lakes Addition
Real Estate and Mortgage Overview in Pine Lakes Addition
| Characteristic | Without Mortgage | With Mortgage |
| Housing Units | 27 | 83 |
| Median Property Value | $710,900 | $428,900 |
| Median Household Income | - | - |
| Monthly Housing Costs | $1,216 | $28 |
| Real Estate Taxes | $6,534 | $0 |
Property Value by Mortgage Status in Pine Lakes Addition
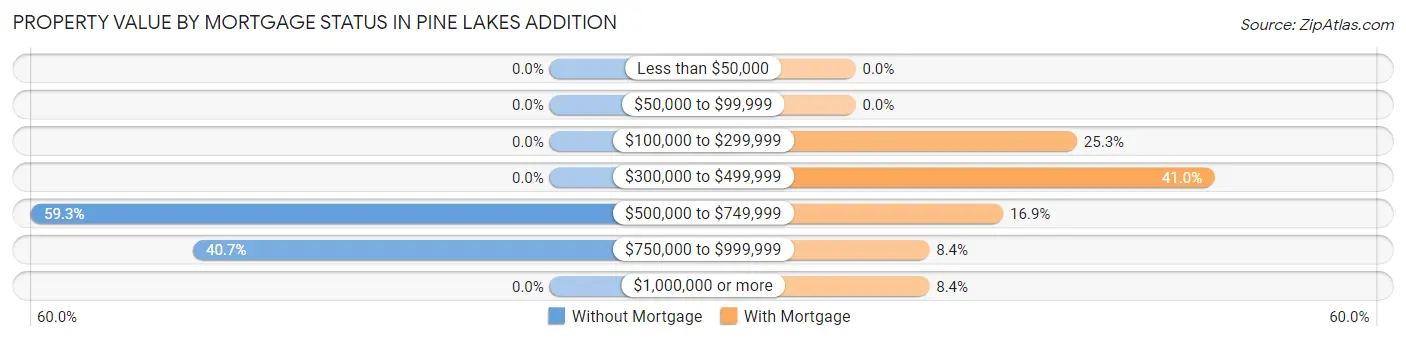
| Property Value | Without Mortgage | With Mortgage |
| Less than $50,000 | 0 (0.0%) | 0 (0.0%) |
| $50,000 to $99,999 | 0 (0.0%) | 0 (0.0%) |
| $100,000 to $299,999 | 0 (0.0%) | 21 (25.3%) |
| $300,000 to $499,999 | 0 (0.0%) | 34 (41.0%) |
| $500,000 to $749,999 | 16 (59.3%) | 14 (16.9%) |
| $750,000 to $999,999 | 11 (40.7%) | 7 (8.4%) |
| $1,000,000 or more | 0 (0.0%) | 7 (8.4%) |
| Total | 27 (100.0%) | 83 (100.0%) |
Household Income by Mortgage Status in Pine Lakes Addition
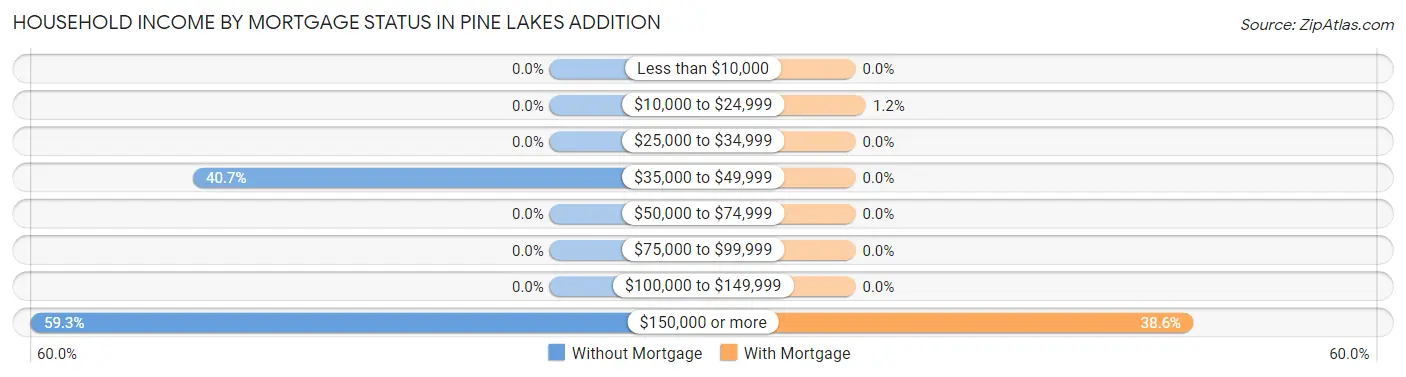
| Household Income | Without Mortgage | With Mortgage |
| Less than $10,000 | 0 (0.0%) | 0 (0.0%) |
| $10,000 to $24,999 | 0 (0.0%) | 1 (1.2%) |
| $25,000 to $34,999 | 0 (0.0%) | 0 (0.0%) |
| $35,000 to $49,999 | 11 (40.7%) | 0 (0.0%) |
| $50,000 to $74,999 | 0 (0.0%) | 0 (0.0%) |
| $75,000 to $99,999 | 0 (0.0%) | 0 (0.0%) |
| $100,000 to $149,999 | 0 (0.0%) | 0 (0.0%) |
| $150,000 or more | 16 (59.3%) | 32 (38.6%) |
| Total | 27 (100.0%) | 83 (100.0%) |
Property Value to Household Income Ratio in Pine Lakes Addition
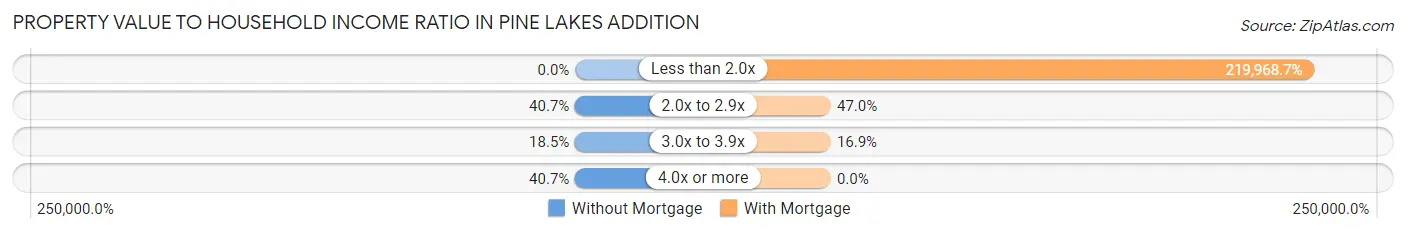
| Value-to-Income Ratio | Without Mortgage | With Mortgage |
| Less than 2.0x | 0 (0.0%) | 182,574 (219,968.7%) |
| 2.0x to 2.9x | 11 (40.7%) | 39 (47.0%) |
| 3.0x to 3.9x | 5 (18.5%) | 14 (16.9%) |
| 4.0x or more | 11 (40.7%) | 0 (0.0%) |
| Total | 27 (100.0%) | 83 (100.0%) |
Real Estate Taxes by Mortgage Status in Pine Lakes Addition
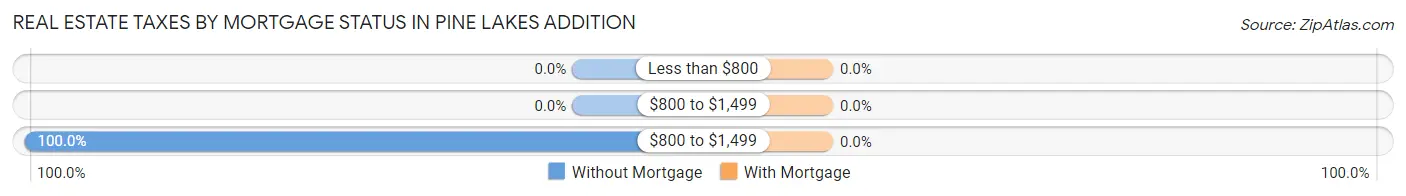
| Property Taxes | Without Mortgage | With Mortgage |
| Less than $800 | 0 (0.0%) | 0 (0.0%) |
| $800 to $1,499 | 0 (0.0%) | 0 (0.0%) |
| $800 to $1,499 | 27 (100.0%) | 0 (0.0%) |
| Total | 27 (100.0%) | 83 (100.0%) |
Health & Disability in Pine Lakes Addition
Health Insurance Coverage by Age in Pine Lakes Addition
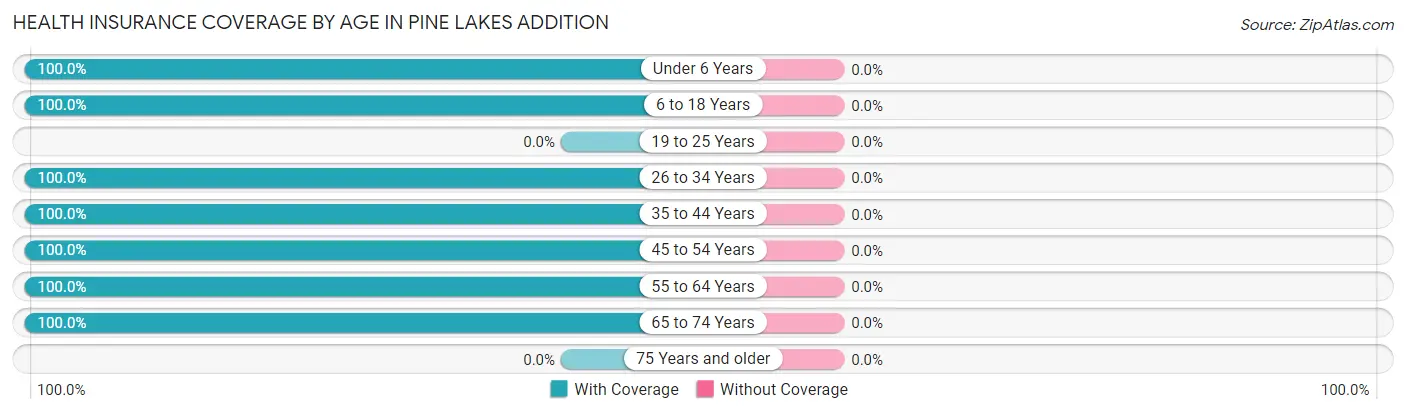
| Age Bracket | With Coverage | Without Coverage |
| Under 6 Years | 11 (100.0%) | 0 (0.0%) |
| 6 to 18 Years | 68 (100.0%) | 0 (0.0%) |
| 19 to 25 Years | 0 (0.0%) | 0 (0.0%) |
| 26 to 34 Years | 35 (100.0%) | 0 (0.0%) |
| 35 to 44 Years | 29 (100.0%) | 0 (0.0%) |
| 45 to 54 Years | 26 (100.0%) | 0 (0.0%) |
| 55 to 64 Years | 87 (100.0%) | 0 (0.0%) |
| 65 to 74 Years | 29 (100.0%) | 0 (0.0%) |
| 75 Years and older | 0 (0.0%) | 0 (0.0%) |
| Total | 285 (100.0%) | 0 (0.0%) |
Health Insurance Coverage by Citizenship Status in Pine Lakes Addition
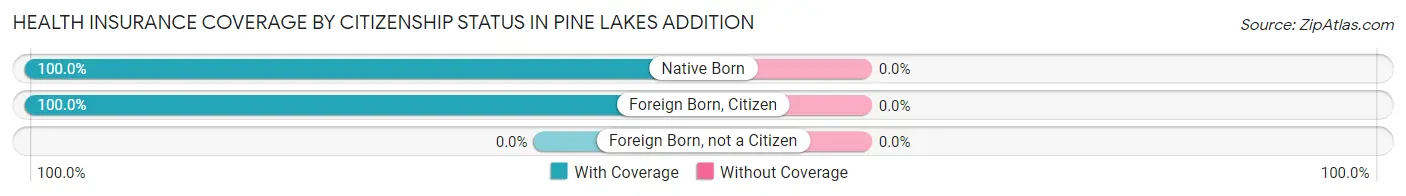
| Citizenship Status | With Coverage | Without Coverage |
| Native Born | 11 (100.0%) | 0 (0.0%) |
| Foreign Born, Citizen | 68 (100.0%) | 0 (0.0%) |
| Foreign Born, not a Citizen | 0 (0.0%) | 0 (0.0%) |
Health Insurance Coverage by Household Income in Pine Lakes Addition
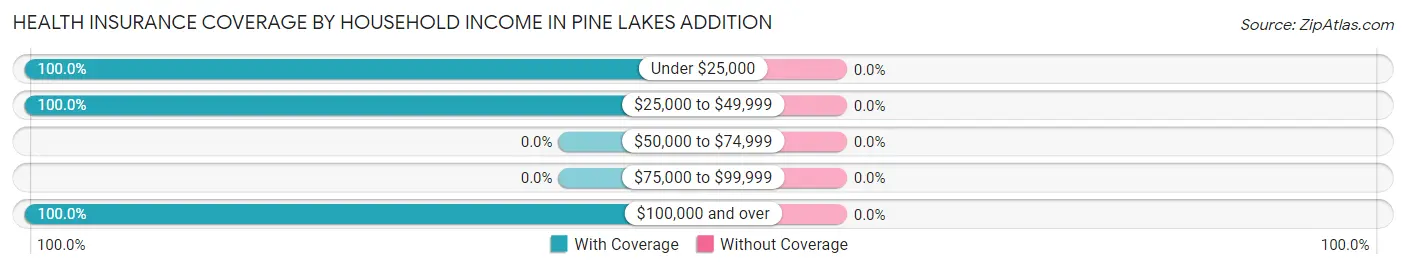
| Household Income | With Coverage | Without Coverage |
| Under $25,000 | 1 (100.0%) | 0 (0.0%) |
| $25,000 to $49,999 | 11 (100.0%) | 0 (0.0%) |
| $50,000 to $74,999 | 0 (0.0%) | 0 (0.0%) |
| $75,000 to $99,999 | 0 (0.0%) | 0 (0.0%) |
| $100,000 and over | 273 (100.0%) | 0 (0.0%) |
Public vs Private Health Insurance Coverage by Age in Pine Lakes Addition
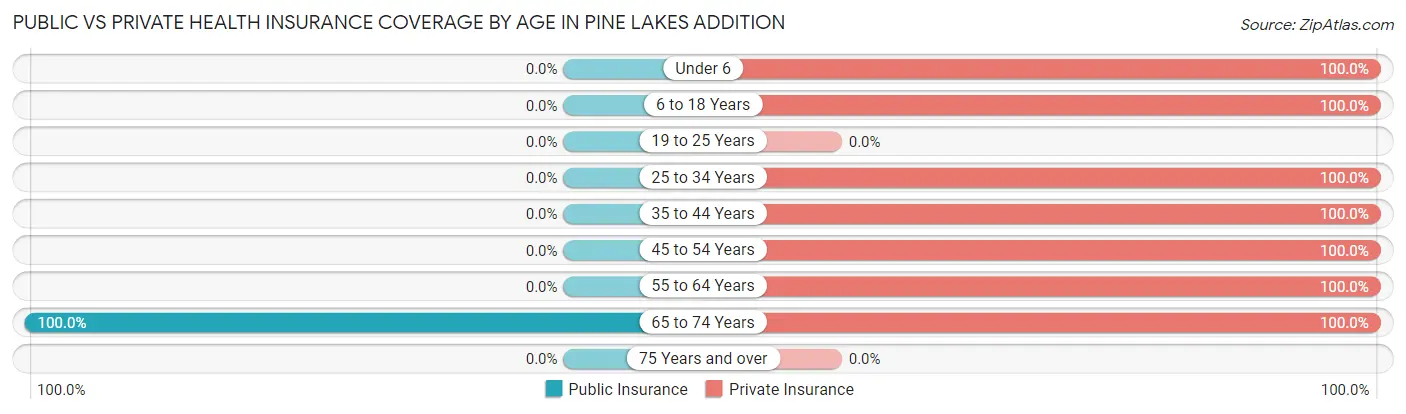
| Age Bracket | Public Insurance | Private Insurance |
| Under 6 | 0 (0.0%) | 11 (100.0%) |
| 6 to 18 Years | 0 (0.0%) | 68 (100.0%) |
| 19 to 25 Years | 0 (0.0%) | 0 (0.0%) |
| 25 to 34 Years | 0 (0.0%) | 35 (100.0%) |
| 35 to 44 Years | 0 (0.0%) | 29 (100.0%) |
| 45 to 54 Years | 0 (0.0%) | 26 (100.0%) |
| 55 to 64 Years | 0 (0.0%) | 87 (100.0%) |
| 65 to 74 Years | 29 (100.0%) | 29 (100.0%) |
| 75 Years and over | 0 (0.0%) | 0 (0.0%) |
| Total | 29 (10.2%) | 285 (100.0%) |
Disability Status by Sex by Age in Pine Lakes Addition
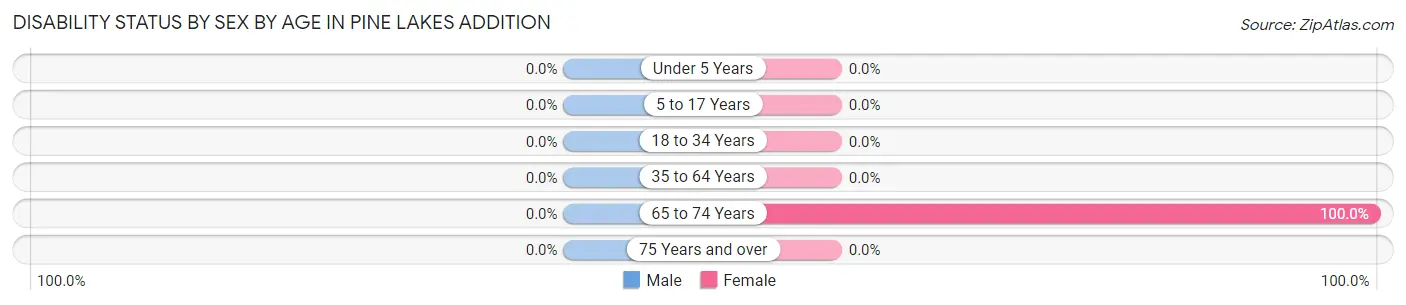
| Age Bracket | Male | Female |
| Under 5 Years | 0 (0.0%) | 0 (0.0%) |
| 5 to 17 Years | 0 (0.0%) | 0 (0.0%) |
| 18 to 34 Years | 0 (0.0%) | 0 (0.0%) |
| 35 to 64 Years | 0 (0.0%) | 0 (0.0%) |
| 65 to 74 Years | 0 (0.0%) | 14 (100.0%) |
| 75 Years and over | 0 (0.0%) | 0 (0.0%) |
Disability Class by Sex by Age in Pine Lakes Addition
Disability Class: Hearing Difficulty
| Age Bracket | Male | Female |
| Under 5 Years | 0 (0.0%) | 0 (0.0%) |
| 5 to 17 Years | 0 (0.0%) | 0 (0.0%) |
| 18 to 34 Years | 0 (0.0%) | 0 (0.0%) |
| 35 to 64 Years | 0 (0.0%) | 0 (0.0%) |
| 65 to 74 Years | 0 (0.0%) | 0 (0.0%) |
| 75 Years and over | 0 (0.0%) | 0 (0.0%) |
Disability Class: Vision Difficulty
| Age Bracket | Male | Female |
| Under 5 Years | 0 (0.0%) | 0 (0.0%) |
| 5 to 17 Years | 0 (0.0%) | 0 (0.0%) |
| 18 to 34 Years | 0 (0.0%) | 0 (0.0%) |
| 35 to 64 Years | 0 (0.0%) | 0 (0.0%) |
| 65 to 74 Years | 0 (0.0%) | 0 (0.0%) |
| 75 Years and over | 0 (0.0%) | 0 (0.0%) |
Disability Class: Cognitive Difficulty
| Age Bracket | Male | Female |
| 5 to 17 Years | 0 (0.0%) | 0 (0.0%) |
| 18 to 34 Years | 0 (0.0%) | 0 (0.0%) |
| 35 to 64 Years | 0 (0.0%) | 0 (0.0%) |
| 65 to 74 Years | 0 (0.0%) | 0 (0.0%) |
| 75 Years and over | 0 (0.0%) | 0 (0.0%) |
Disability Class: Ambulatory Difficulty
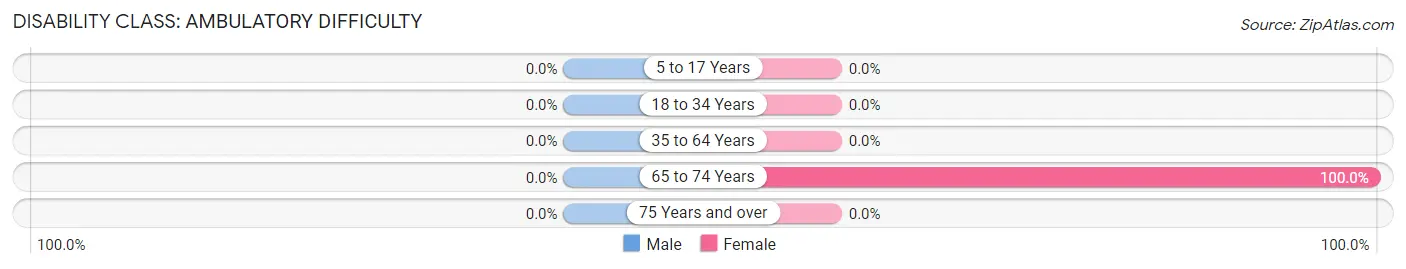
| Age Bracket | Male | Female |
| 5 to 17 Years | 0 (0.0%) | 0 (0.0%) |
| 18 to 34 Years | 0 (0.0%) | 0 (0.0%) |
| 35 to 64 Years | 0 (0.0%) | 0 (0.0%) |
| 65 to 74 Years | 0 (0.0%) | 14 (100.0%) |
| 75 Years and over | 0 (0.0%) | 0 (0.0%) |
Disability Class: Self-Care Difficulty
| Age Bracket | Male | Female |
| 5 to 17 Years | 0 (0.0%) | 0 (0.0%) |
| 18 to 34 Years | 0 (0.0%) | 0 (0.0%) |
| 35 to 64 Years | 0 (0.0%) | 0 (0.0%) |
| 65 to 74 Years | 0 (0.0%) | 0 (0.0%) |
| 75 Years and over | 0 (0.0%) | 0 (0.0%) |
Technology Access in Pine Lakes Addition
Computing Device Access in Pine Lakes Addition
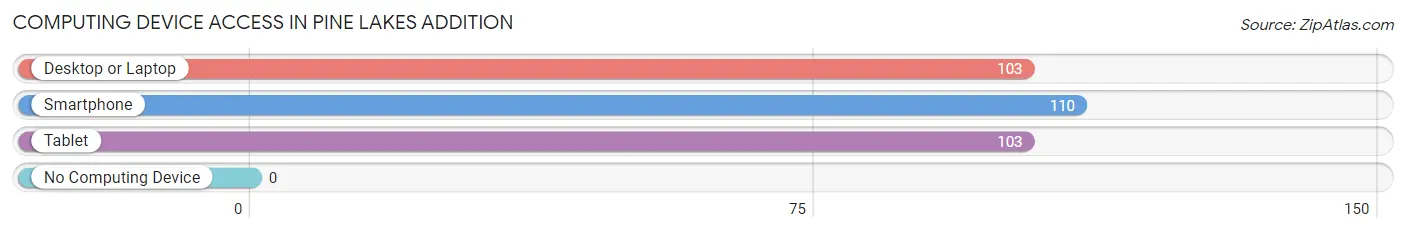
| Device Type | # Households | % Households |
| Desktop or Laptop | 103 | 93.6% |
| Smartphone | 110 | 100.0% |
| Tablet | 103 | 93.6% |
| No Computing Device | 0 | 0.0% |
| Total | 110 | 100.0% |
Internet Access in Pine Lakes Addition
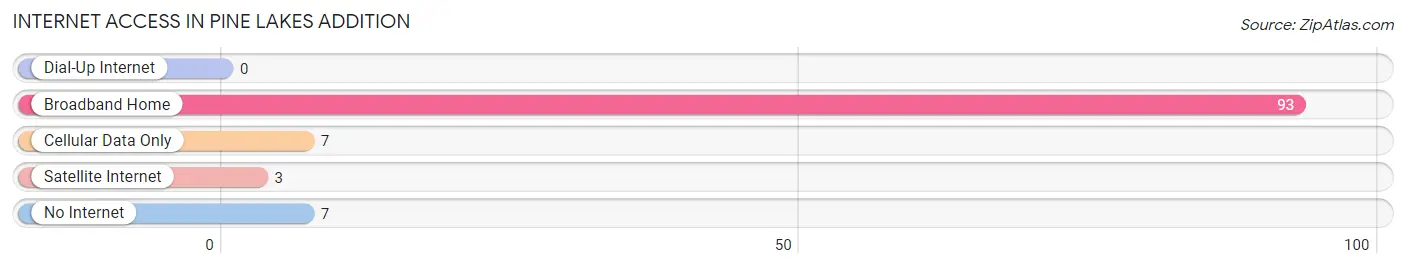
| Internet Type | # Households | % Households |
| Dial-Up Internet | 0 | 0.0% |
| Broadband Home | 93 | 84.6% |
| Cellular Data Only | 7 | 6.4% |
| Satellite Internet | 3 | 2.7% |
| No Internet | 7 | 6.4% |
| Total | 110 | 100.0% |
Pine Lakes Addition Summary
Pine Lakes Addition is a small unincorporated community located in the Black Hills of South Dakota. It is situated in the southwestern corner of Pennington County, approximately 10 miles south of Rapid City. The community is surrounded by the Black Hills National Forest and is home to a variety of wildlife, including deer, elk, and bighorn sheep.
History
The Pine Lakes Addition area was first settled in the late 1800s by homesteaders who were attracted to the area by its abundant natural resources. The area was originally known as the Pine Lakes Ranch, and the first post office was established in 1891. The community was officially incorporated in 1909, and the first school was built in 1910.
The area was primarily used for ranching and logging until the 1950s, when the area began to be developed for recreational use. The area was popular with hunters and fishermen, and the first resort was built in the area in the 1960s. The area has since become a popular destination for camping, hiking, and other outdoor activities.
Geography
Pine Lakes Addition is located in the Black Hills of South Dakota, approximately 10 miles south of Rapid City. The area is surrounded by the Black Hills National Forest and is home to a variety of wildlife, including deer, elk, and bighorn sheep. The area is characterized by rolling hills, pine forests, and numerous lakes and streams.
The climate in the area is generally mild, with hot summers and cold winters. The average annual temperature is around 50 degrees Fahrenheit, and the average annual precipitation is around 20 inches.
Economy
The economy of Pine Lakes Addition is largely based on tourism and recreation. The area is popular with hunters and fishermen, and the area is home to several resorts and campgrounds. The area is also popular with hikers and mountain bikers, and there are several trails in the area.
In addition to tourism and recreation, the area is also home to several small businesses, including a general store, a gas station, and a restaurant. The area is also home to several small farms and ranches.
Demographics
As of the 2010 census, the population of Pine Lakes Addition was 1,072. The population is primarily white (94.3%), with a small percentage of Native American (2.2%) and African American (1.2%) residents. The median household income is $41,250, and the median age is 44.7 years. The area is served by the Pennington County School District.
Common Questions
What is Per Capita Income in Pine Lakes Addition?
Per Capita income in Pine Lakes Addition is $93,089.
What is the Median Family Income in Pine Lakes Addition?
Median Family Income in Pine Lakes Addition is $183,750.
What is the Median Household income in Pine Lakes Addition?
Median Household Income in Pine Lakes Addition is $182,941.
What is Income or Wage Gap in Pine Lakes Addition?
Income or Wage Gap in Pine Lakes Addition is 47.7%.
Women in Pine Lakes Addition earn 52.3 cents for every dollar earned by a man.
What is Inequality or Gini Index in Pine Lakes Addition?
Inequality or Gini Index in Pine Lakes Addition is 0.41.
What is the Total Population of Pine Lakes Addition?
Total Population of Pine Lakes Addition is 285.
What is the Total Male Population of Pine Lakes Addition?
Total Male Population of Pine Lakes Addition is 131.
What is the Total Female Population of Pine Lakes Addition?
Total Female Population of Pine Lakes Addition is 154.
What is the Ratio of Males per 100 Females in Pine Lakes Addition?
There are 85.06 Males per 100 Females in Pine Lakes Addition.
What is the Ratio of Females per 100 Males in Pine Lakes Addition?
There are 117.56 Females per 100 Males in Pine Lakes Addition.
What is the Median Population Age in Pine Lakes Addition?
Median Population Age in Pine Lakes Addition is 41.9 Years.
What is the Average Family Size in Pine Lakes Addition
Average Family Size in Pine Lakes Addition is 2.9 People.
What is the Average Household Size in Pine Lakes Addition
Average Household Size in Pine Lakes Addition is 2.6 People.
How Large is the Labor Force in Pine Lakes Addition?
There are 174 People in the Labor Forcein in Pine Lakes Addition.
What is the Percentage of People in the Labor Force in Pine Lakes Addition?
84.5% of People are in the Labor Force in Pine Lakes Addition.