Halbur, IA Map & Demographics
Halbur Map
Halbur Overview
$33,501
PER CAPITA INCOME
$85,192
AVG FAMILY INCOME
$80,536
AVG HOUSEHOLD INCOME
50.4%
WAGE / INCOME GAP [ % ]
49.6¢/ $1
WAGE / INCOME GAP [ $ ]
0.30
INEQUALITY / GINI INDEX
338
TOTAL POPULATION
177
MALE POPULATION
161
FEMALE POPULATION
109.94
MALES / 100 FEMALES
90.96
FEMALES / 100 MALES
29.6
MEDIAN AGE
3.6
AVG FAMILY SIZE
2.6
AVG HOUSEHOLD SIZE
203
LABOR FORCE [ PEOPLE ]
81.9%
PERCENT IN LABOR FORCE
1.0%
UNEMPLOYMENT RATE
Halbur Zip Codes
Halbur Area Codes
Income in Halbur
Income Overview in Halbur
Per Capita Income in Halbur is $33,501, while median incomes of families and households are $85,192 and $80,536 respectively.
| Characteristic | Number | Measure |
| Per Capita Income | 338 | $33,501 |
| Median Family Income | 78 | $85,192 |
| Mean Family Income | 78 | $77,783 |
| Median Household Income | 129 | $80,536 |
| Mean Household Income | 129 | $88,160 |
| Income Deficit | 78 | $0 |
| Wage / Income Gap (%) | 338 | 50.40% |
| Wage / Income Gap ($) | 338 | 49.60¢ per $1 |
| Gini / Inequality Index | 338 | 0.30 |
Earnings by Sex in Halbur
Average Earnings in Halbur are $45,313, $55,446 for men and $27,500 for women, a difference of 50.4%.
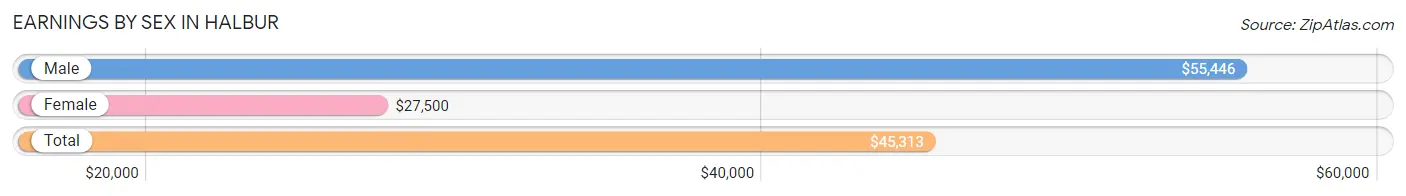
| Sex | Number | Average Earnings |
| Male | 117 (57.1%) | $55,446 |
| Female | 88 (42.9%) | $27,500 |
| Total | 205 (100.0%) | $45,313 |
Earnings by Sex by Income Bracket in Halbur
The most common earnings brackets in Halbur are $55,000 to $64,999 for men (32 | 27.4%) and $22,500 to $24,999 for women (19 | 21.6%).
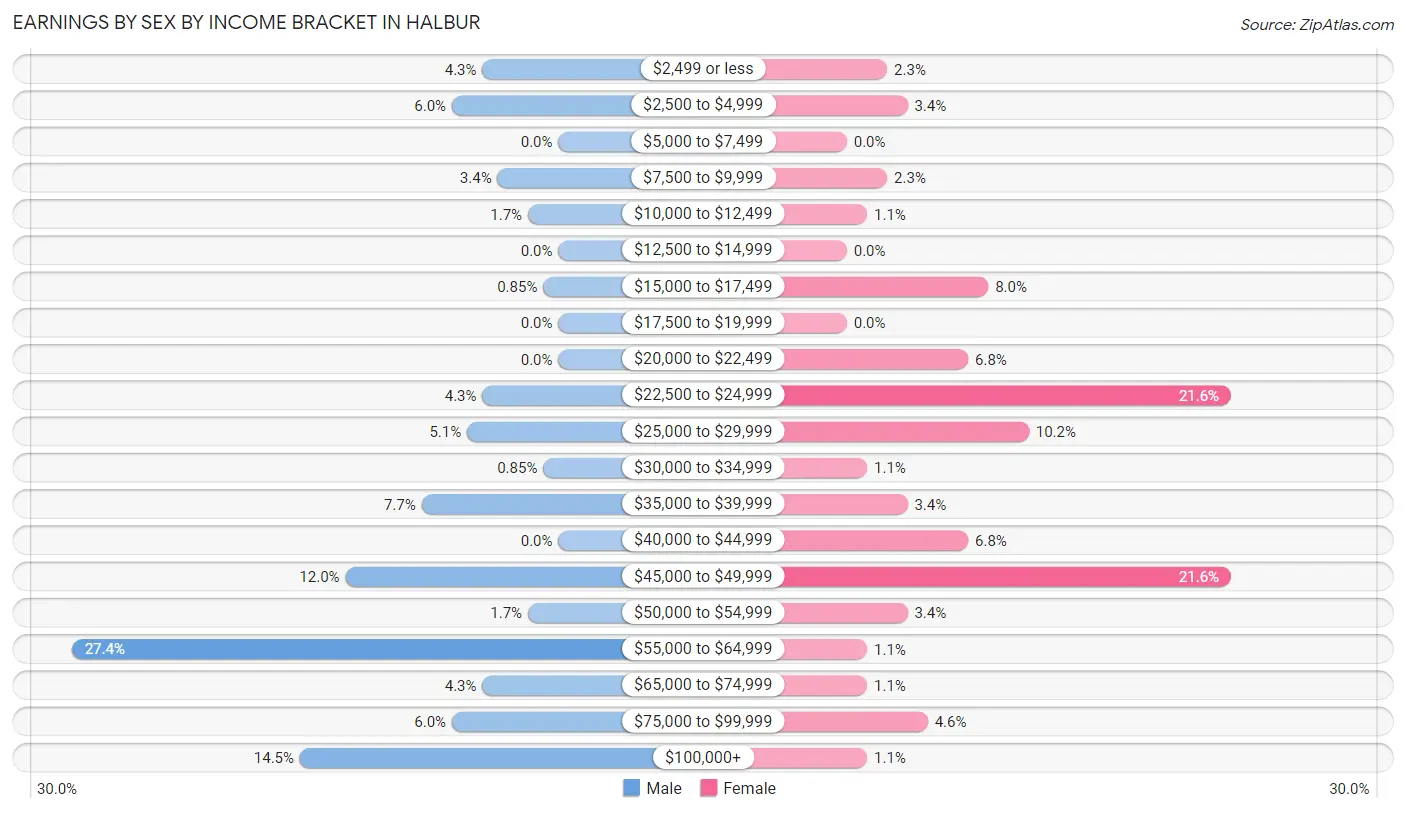
| Income | Male | Female |
| $2,499 or less | 5 (4.3%) | 2 (2.3%) |
| $2,500 to $4,999 | 7 (6.0%) | 3 (3.4%) |
| $5,000 to $7,499 | 0 (0.0%) | 0 (0.0%) |
| $7,500 to $9,999 | 4 (3.4%) | 2 (2.3%) |
| $10,000 to $12,499 | 2 (1.7%) | 1 (1.1%) |
| $12,500 to $14,999 | 0 (0.0%) | 0 (0.0%) |
| $15,000 to $17,499 | 1 (0.9%) | 7 (8.0%) |
| $17,500 to $19,999 | 0 (0.0%) | 0 (0.0%) |
| $20,000 to $22,499 | 0 (0.0%) | 6 (6.8%) |
| $22,500 to $24,999 | 5 (4.3%) | 19 (21.6%) |
| $25,000 to $29,999 | 6 (5.1%) | 9 (10.2%) |
| $30,000 to $34,999 | 1 (0.9%) | 1 (1.1%) |
| $35,000 to $39,999 | 9 (7.7%) | 3 (3.4%) |
| $40,000 to $44,999 | 0 (0.0%) | 6 (6.8%) |
| $45,000 to $49,999 | 14 (12.0%) | 19 (21.6%) |
| $50,000 to $54,999 | 2 (1.7%) | 3 (3.4%) |
| $55,000 to $64,999 | 32 (27.4%) | 1 (1.1%) |
| $65,000 to $74,999 | 5 (4.3%) | 1 (1.1%) |
| $75,000 to $99,999 | 7 (6.0%) | 4 (4.5%) |
| $100,000+ | 17 (14.5%) | 1 (1.1%) |
| Total | 117 (100.0%) | 88 (100.0%) |
Earnings by Sex by Educational Attainment in Halbur
Average earnings in Halbur are $56,964 for men and $37,083 for women, a difference of 34.9%. Men with an educational attainment of bachelor's degree enjoy the highest average annual earnings of $148,309, while those with high school diploma education earn the least with $47,750. Women with an educational attainment of bachelor's degree earn the most with the average annual earnings of $46,417, while those with college or associate's degree education have the smallest earnings of $25,000.
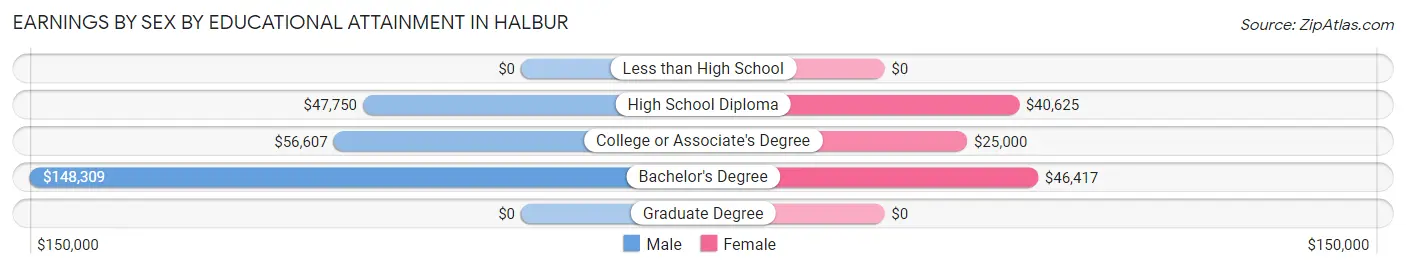
| Educational Attainment | Male Income | Female Income |
| Less than High School | - | - |
| High School Diploma | $47,750 | $40,625 |
| College or Associate's Degree | $56,607 | $25,000 |
| Bachelor's Degree | $148,309 | $46,417 |
| Graduate Degree | - | - |
| Total | $56,964 | $37,083 |
Family Income in Halbur
Family Income Brackets in Halbur
According to the Halbur family income data, there are 29 families falling into the $75,000 to $99,999 income range, which is the most common income bracket and makes up 37.2% of all families.
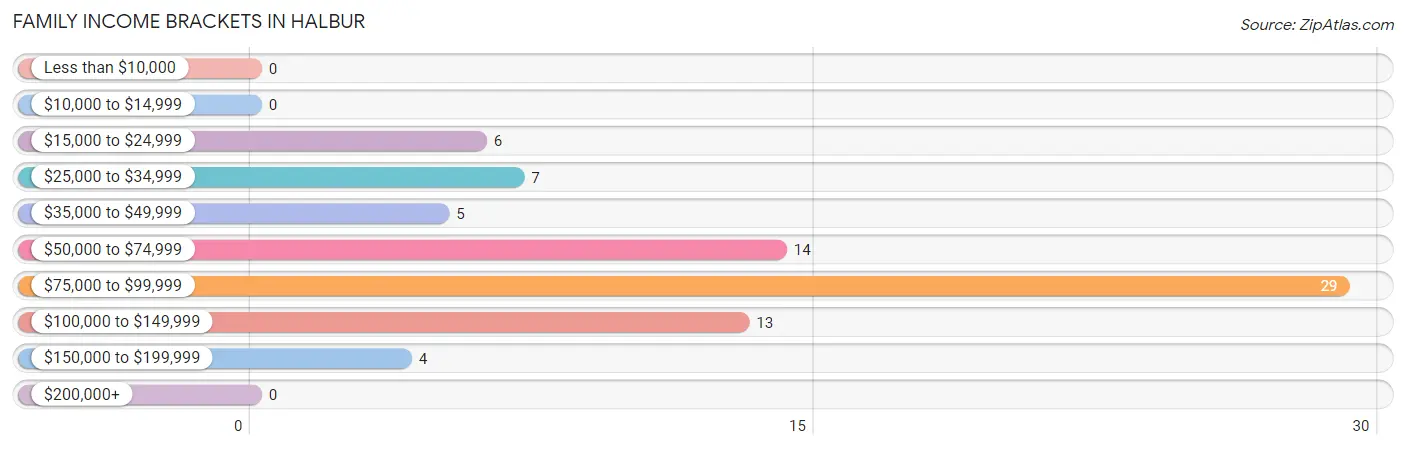
| Income Bracket | # Families | % Families |
| Less than $10,000 | 0 | 0.0% |
| $10,000 to $14,999 | 0 | 0.0% |
| $15,000 to $24,999 | 6 | 7.7% |
| $25,000 to $34,999 | 7 | 9.0% |
| $35,000 to $49,999 | 5 | 6.4% |
| $50,000 to $74,999 | 14 | 17.9% |
| $75,000 to $99,999 | 29 | 37.2% |
| $100,000 to $149,999 | 13 | 16.7% |
| $150,000 to $199,999 | 4 | 5.1% |
| $200,000+ | 0 | 0.0% |
Family Income by Famaliy Size in Halbur
5-person families (21 | 26.9%) account for the highest median family income in Halbur with $86,827 per family, while 2-person families (38 | 48.7%) have the highest median income of $31,875 per family member.
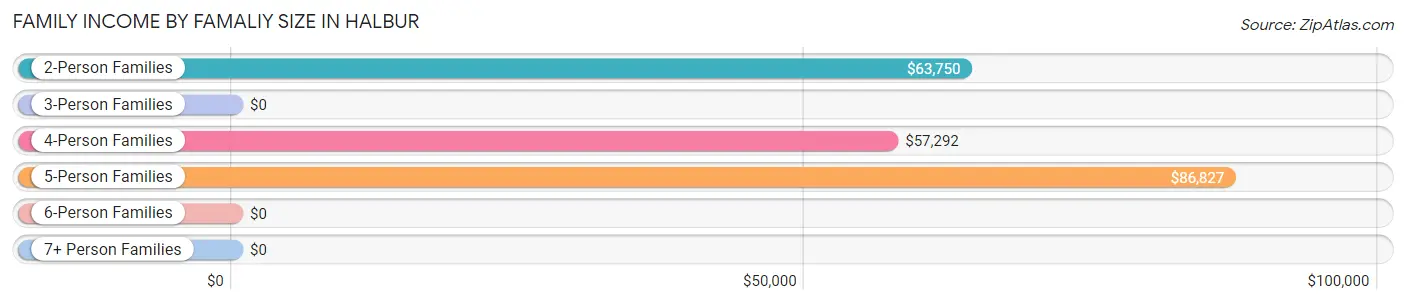
| Income Bracket | # Families | Median Income |
| 2-Person Families | 38 (48.7%) | $63,750 |
| 3-Person Families | 1 (1.3%) | $0 |
| 4-Person Families | 11 (14.1%) | $57,292 |
| 5-Person Families | 21 (26.9%) | $86,827 |
| 6-Person Families | 7 (9.0%) | $0 |
| 7+ Person Families | 0 (0.0%) | $0 |
| Total | 78 (100.0%) | $85,192 |
Family Income by Number of Earners in Halbur
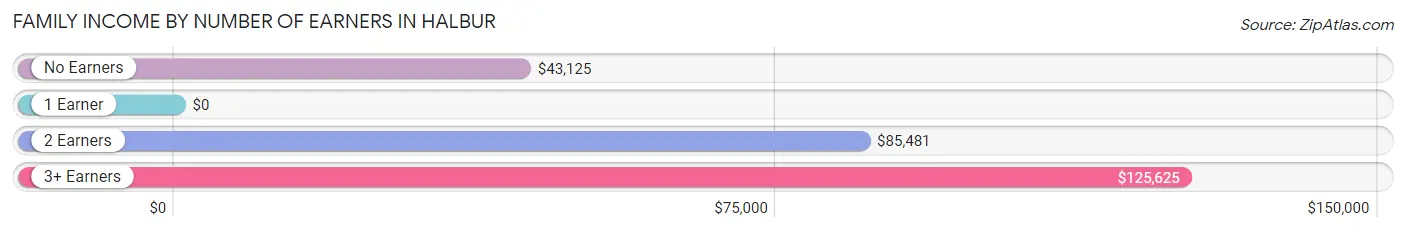
| Number of Earners | # Families | Median Income |
| No Earners | 5 (6.4%) | $43,125 |
| 1 Earner | 18 (23.1%) | $0 |
| 2 Earners | 41 (52.6%) | $85,481 |
| 3+ Earners | 14 (17.9%) | $125,625 |
| Total | 78 (100.0%) | $85,192 |
Household Income in Halbur
Household Income Brackets in Halbur
With 37 households falling in the category, the $75,000 to $99,999 income range is the most frequent in Halbur, accounting for 28.7% of all households. In contrast, only 1 households (0.8%) fall into the less than $10,000 income bracket, making it the least populous group.
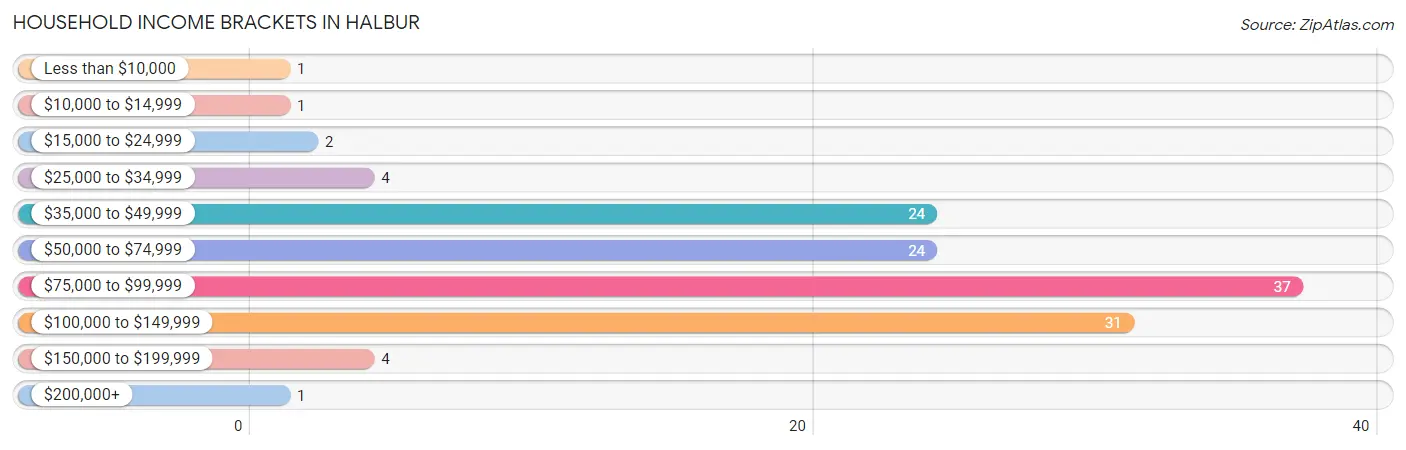
| Income Bracket | # Households | % Households |
| Less than $10,000 | 1 | 0.8% |
| $10,000 to $14,999 | 1 | 0.8% |
| $15,000 to $24,999 | 2 | 1.6% |
| $25,000 to $34,999 | 4 | 3.1% |
| $35,000 to $49,999 | 24 | 18.6% |
| $50,000 to $74,999 | 24 | 18.6% |
| $75,000 to $99,999 | 37 | 28.7% |
| $100,000 to $149,999 | 31 | 24.0% |
| $150,000 to $199,999 | 4 | 3.1% |
| $200,000+ | 1 | 0.8% |
Household Income by Householder Age in Halbur
The median household income in Halbur is $80,536, with the highest median household income of $86,346 found in the 45 to 64 years age bracket for the primary householder. A total of 40 households (31.0%) fall into this category. Meanwhile, the 15 to 24 years age bracket for the primary householder has the lowest median household income of $0, with 8 households (6.2%) in this group.
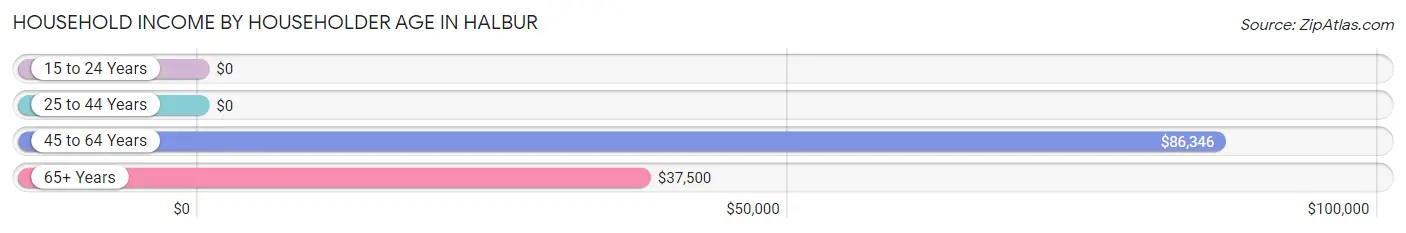
| Income Bracket | # Households | Median Income |
| 15 to 24 Years | 8 (6.2%) | $0 |
| 25 to 44 Years | 67 (51.9%) | $0 |
| 45 to 64 Years | 40 (31.0%) | $86,346 |
| 65+ Years | 14 (10.8%) | $37,500 |
| Total | 129 (100.0%) | $80,536 |
Poverty in Halbur
Income Below Poverty by Sex and Age in Halbur
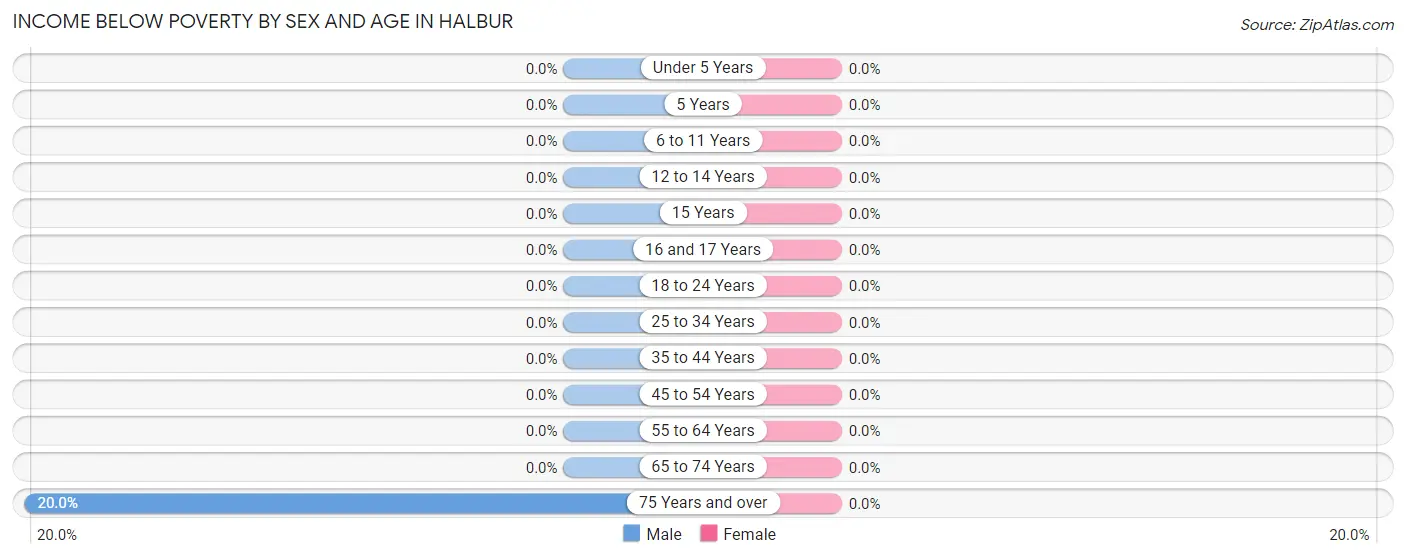
| Age Bracket | Male | Female |
| Under 5 Years | 0 (0.0%) | 0 (0.0%) |
| 5 Years | 0 (0.0%) | 0 (0.0%) |
| 6 to 11 Years | 0 (0.0%) | 0 (0.0%) |
| 12 to 14 Years | 0 (0.0%) | 0 (0.0%) |
| 15 Years | 0 (0.0%) | 0 (0.0%) |
| 16 and 17 Years | 0 (0.0%) | 0 (0.0%) |
| 18 to 24 Years | 0 (0.0%) | 0 (0.0%) |
| 25 to 34 Years | 0 (0.0%) | 0 (0.0%) |
| 35 to 44 Years | 0 (0.0%) | 0 (0.0%) |
| 45 to 54 Years | 0 (0.0%) | 0 (0.0%) |
| 55 to 64 Years | 0 (0.0%) | 0 (0.0%) |
| 65 to 74 Years | 0 (0.0%) | 0 (0.0%) |
| 75 Years and over | 1 (20.0%) | 0 (0.0%) |
| Total | 1 (0.6%) | 0 (0.0%) |
Income Above Poverty by Sex and Age in Halbur
According to the poverty statistics in Halbur, males aged under 5 years and females aged under 5 years are the age groups that are most secure financially, with 100.0% of males and 100.0% of females in these age groups living above the poverty line.
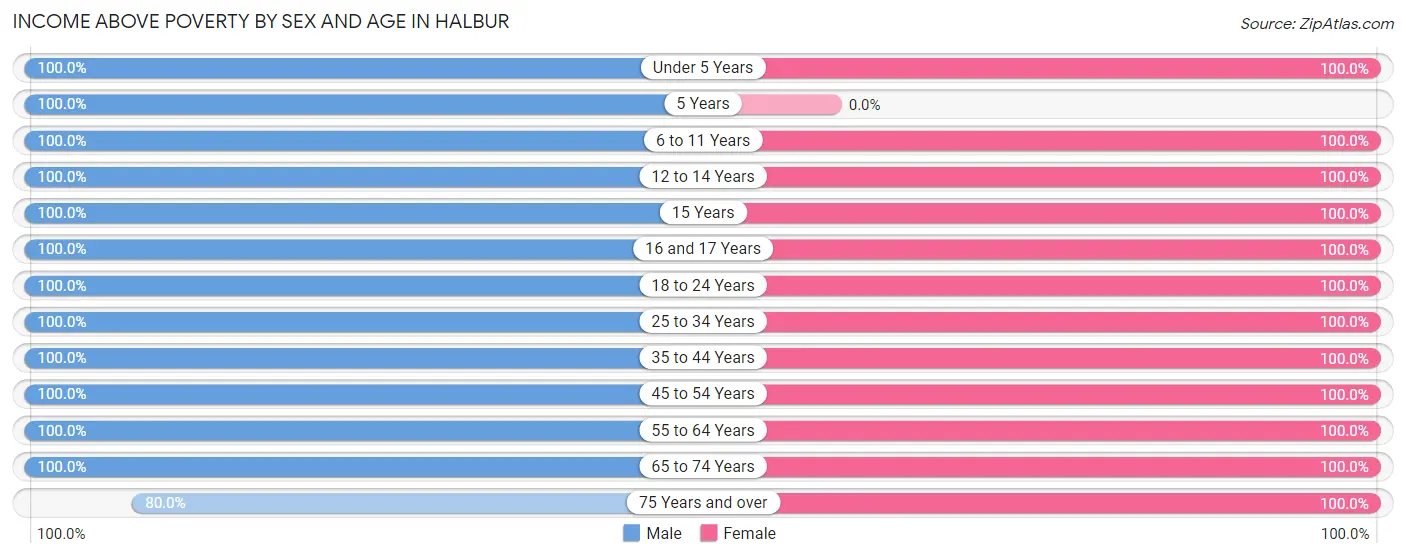
| Age Bracket | Male | Female |
| Under 5 Years | 6 (100.0%) | 1 (100.0%) |
| 5 Years | 1 (100.0%) | 0 (0.0%) |
| 6 to 11 Years | 9 (100.0%) | 7 (100.0%) |
| 12 to 14 Years | 27 (100.0%) | 27 (100.0%) |
| 15 Years | 7 (100.0%) | 5 (100.0%) |
| 16 and 17 Years | 5 (100.0%) | 21 (100.0%) |
| 18 to 24 Years | 12 (100.0%) | 13 (100.0%) |
| 25 to 34 Years | 35 (100.0%) | 21 (100.0%) |
| 35 to 44 Years | 23 (100.0%) | 19 (100.0%) |
| 45 to 54 Years | 25 (100.0%) | 19 (100.0%) |
| 55 to 64 Years | 12 (100.0%) | 22 (100.0%) |
| 65 to 74 Years | 10 (100.0%) | 2 (100.0%) |
| 75 Years and over | 4 (80.0%) | 4 (100.0%) |
| Total | 176 (99.4%) | 161 (100.0%) |
Income Below Poverty Among Married-Couple Families in Halbur
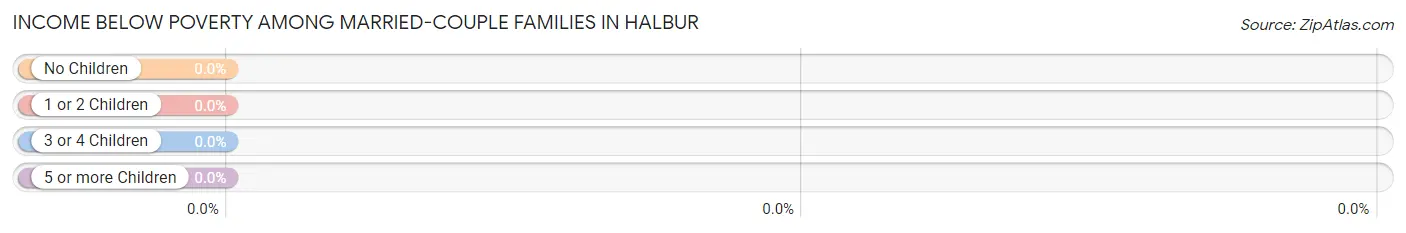
| Children | Above Poverty | Below Poverty |
| No Children | 27 (100.0%) | 0 (0.0%) |
| 1 or 2 Children | 15 (100.0%) | 0 (0.0%) |
| 3 or 4 Children | 24 (100.0%) | 0 (0.0%) |
| 5 or more Children | 0 (0.0%) | 0 (0.0%) |
| Total | 66 (100.0%) | 0 (0.0%) |
Income Below Poverty Among Single-Parent Households in Halbur
| Children | Single Father | Single Mother |
| No Children | 0 (0.0%) | 0 (0.0%) |
| 1 or 2 Children | 0 (0.0%) | 0 (0.0%) |
| 3 or 4 Children | 0 (0.0%) | 0 (0.0%) |
| 5 or more Children | 0 (0.0%) | 0 (0.0%) |
| Total | 0 (0.0%) | 0 (0.0%) |
Income Below Poverty Among Married-Couple vs Single-Parent Households in Halbur
| Children | Married-Couple Families | Single-Parent Households |
| No Children | 0 (0.0%) | 0 (0.0%) |
| 1 or 2 Children | 0 (0.0%) | 0 (0.0%) |
| 3 or 4 Children | 0 (0.0%) | 0 (0.0%) |
| 5 or more Children | 0 (0.0%) | 0 (0.0%) |
| Total | 0 (0.0%) | 0 (0.0%) |
Race in Halbur
The most populous races in Halbur are White / Caucasian (333 | 98.5%), and Two or more Races (5 | 1.5%).
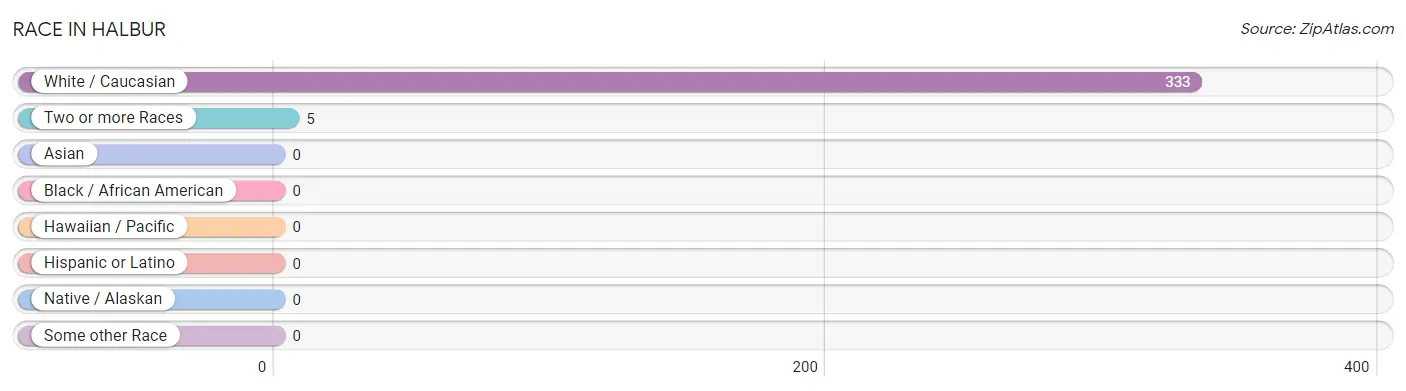
| Race | # Population | % Population |
| Asian | 0 | 0.0% |
| Black / African American | 0 | 0.0% |
| Hawaiian / Pacific | 0 | 0.0% |
| Hispanic or Latino | 0 | 0.0% |
| Native / Alaskan | 0 | 0.0% |
| White / Caucasian | 333 | 98.5% |
| Two or more Races | 5 | 1.5% |
| Some other Race | 0 | 0.0% |
| Total | 338 | 100.0% |
Ancestry in Halbur
The most populous ancestries reported in Halbur are German (156 | 46.2%), Irish (29 | 8.6%), American (23 | 6.8%), English (9 | 2.7%), and European (7 | 2.1%), together accounting for 66.3% of all Halbur residents.
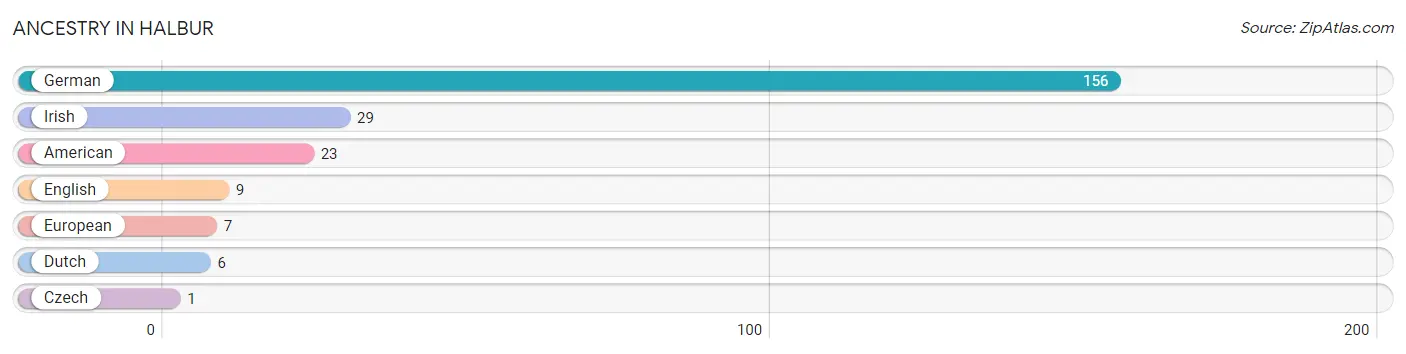
| Ancestry | # Population | % Population |
| American | 23 | 6.8% |
| Czech | 1 | 0.3% |
| Dutch | 6 | 1.8% |
| English | 9 | 2.7% |
| European | 7 | 2.1% |
| German | 156 | 46.2% |
| Irish | 29 | 8.6% | View All 7 Rows |
Immigrants in Halbur

| Immigration Origin | # Population | % Population | View All 0 Rows |
Sex and Age in Halbur
Sex and Age in Halbur
The most populous age groups in Halbur are 25 to 29 Years (33 | 18.6%) for men and 15 to 19 Years (31 | 19.3%) for women.
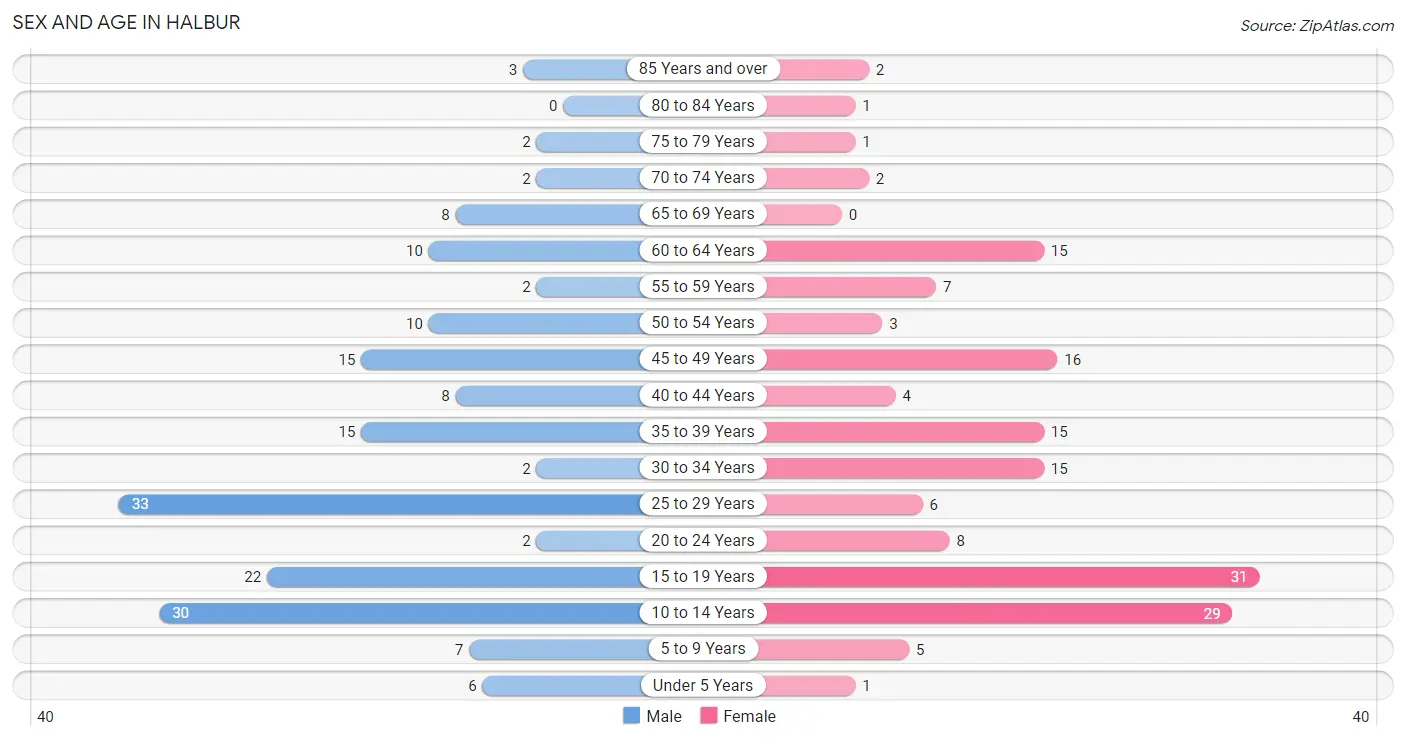
| Age Bracket | Male | Female |
| Under 5 Years | 6 (3.4%) | 1 (0.6%) |
| 5 to 9 Years | 7 (4.0%) | 5 (3.1%) |
| 10 to 14 Years | 30 (17.0%) | 29 (18.0%) |
| 15 to 19 Years | 22 (12.4%) | 31 (19.3%) |
| 20 to 24 Years | 2 (1.1%) | 8 (5.0%) |
| 25 to 29 Years | 33 (18.6%) | 6 (3.7%) |
| 30 to 34 Years | 2 (1.1%) | 15 (9.3%) |
| 35 to 39 Years | 15 (8.5%) | 15 (9.3%) |
| 40 to 44 Years | 8 (4.5%) | 4 (2.5%) |
| 45 to 49 Years | 15 (8.5%) | 16 (9.9%) |
| 50 to 54 Years | 10 (5.7%) | 3 (1.9%) |
| 55 to 59 Years | 2 (1.1%) | 7 (4.3%) |
| 60 to 64 Years | 10 (5.7%) | 15 (9.3%) |
| 65 to 69 Years | 8 (4.5%) | 0 (0.0%) |
| 70 to 74 Years | 2 (1.1%) | 2 (1.2%) |
| 75 to 79 Years | 2 (1.1%) | 1 (0.6%) |
| 80 to 84 Years | 0 (0.0%) | 1 (0.6%) |
| 85 Years and over | 3 (1.7%) | 2 (1.2%) |
| Total | 177 (100.0%) | 161 (100.0%) |
Families and Households in Halbur
Median Family Size in Halbur
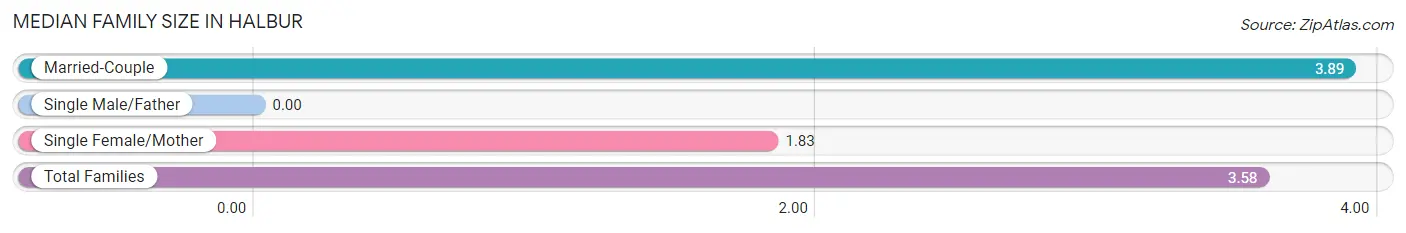
| Family Type | # Families | Family Size |
| Married-Couple | 66 (84.6%) | 3.89 |
| Single Male/Father | 0 (0.0%) | - |
| Single Female/Mother | 12 (15.4%) | 1.83 |
| Total Families | 78 (100.0%) | 3.58 |
Median Household Size in Halbur
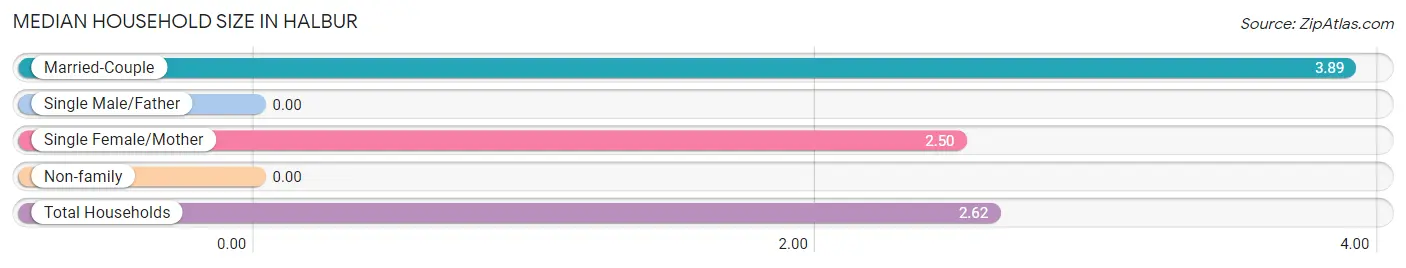
| Household Type | # Households | Household Size |
| Married-Couple | 66 (51.2%) | 3.89 |
| Single Male/Father | 0 (0.0%) | - |
| Single Female/Mother | 12 (9.3%) | 2.50 |
| Non-family | 51 (39.5%) | - |
| Total Households | 129 (100.0%) | 2.62 |
Household Size by Marriage Status in Halbur
Out of a total of 129 households in Halbur, 78 (60.5%) are family households, while 51 (39.5%) are nonfamily households. The most numerous type of family households are 2-person households, comprising 28, and the most common type of nonfamily households are 1-person households, comprising 51.
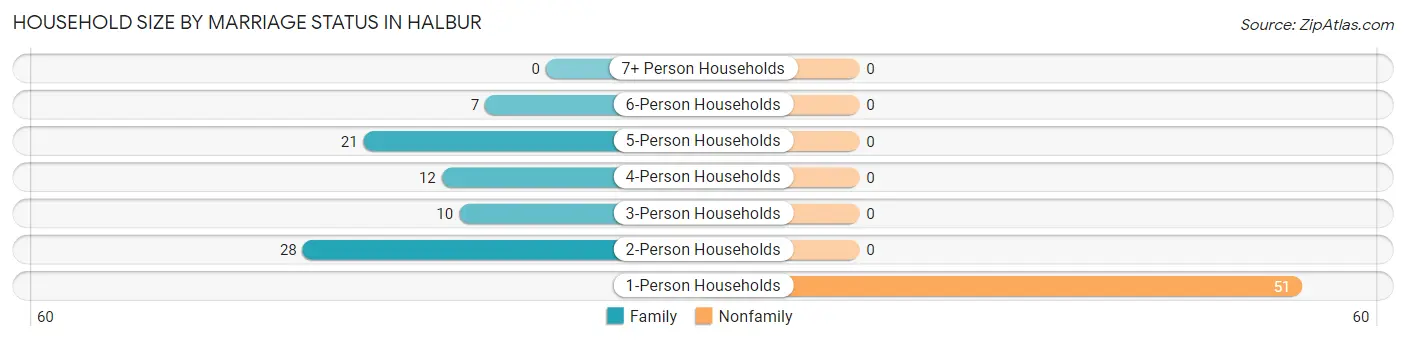
| Household Size | Family Households | Nonfamily Households |
| 1-Person Households | - | 51 (39.5%) |
| 2-Person Households | 28 (21.7%) | 0 (0.0%) |
| 3-Person Households | 10 (7.7%) | 0 (0.0%) |
| 4-Person Households | 12 (9.3%) | 0 (0.0%) |
| 5-Person Households | 21 (16.3%) | 0 (0.0%) |
| 6-Person Households | 7 (5.4%) | 0 (0.0%) |
| 7+ Person Households | 0 (0.0%) | 0 (0.0%) |
| Total | 78 (60.5%) | 51 (39.5%) |
Female Fertility in Halbur
Fertility by Age in Halbur
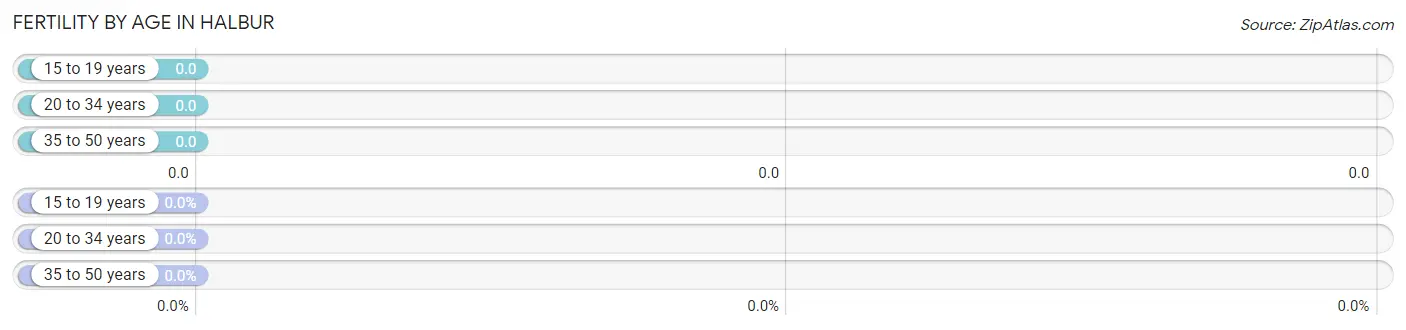
| Age Bracket | Women with Births | Births / 1,000 Women |
| 15 to 19 years | 0 (0.0%) | 0.0 |
| 20 to 34 years | 0 (0.0%) | 0.0 |
| 35 to 50 years | 0 (0.0%) | 0.0 |
| Total | 0 (0.0%) | 0.0 |
Fertility by Age by Marriage Status in Halbur
| Age Bracket | Married | Unmarried |
| 15 to 19 years | 0 (0.0%) | 0 (0.0%) |
| 20 to 34 years | 0 (0.0%) | 0 (0.0%) |
| 35 to 50 years | 0 (0.0%) | 0 (0.0%) |
| Total | 0 (0.0%) | 0 (0.0%) |
Fertility by Education in Halbur
| Educational Attainment | Women with Births | Births / 1,000 Women |
| Less than High School | 0 (0.0%) | 0.0 |
| High School Diploma | 0 (0.0%) | 0.0 |
| College or Associate's Degree | 0 (0.0%) | 0.0 |
| Bachelor's Degree | 0 (0.0%) | 0.0 |
| Graduate Degree | 0 (0.0%) | 0.0 |
| Total | 0 (0.0%) | 0.0 |
Fertility by Education by Marriage Status in Halbur
| Educational Attainment | Married | Unmarried |
| Less than High School | 0 (0.0%) | 0 (0.0%) |
| High School Diploma | 0 (0.0%) | 0 (0.0%) |
| College or Associate's Degree | 0 (0.0%) | 0 (0.0%) |
| Bachelor's Degree | 0 (0.0%) | 0 (0.0%) |
| Graduate Degree | 0 (0.0%) | 0 (0.0%) |
| Total | 0 (0.0%) | 0 (0.0%) |
Employment Characteristics in Halbur
Employment by Class of Employer in Halbur
Among the 200 employed individuals in Halbur, private company employees (138 | 69.0%), self-employed (not incorporated) (23 | 11.5%), and self-employed (incorporated) (14 | 7.0%) make up the most common classes of employment.
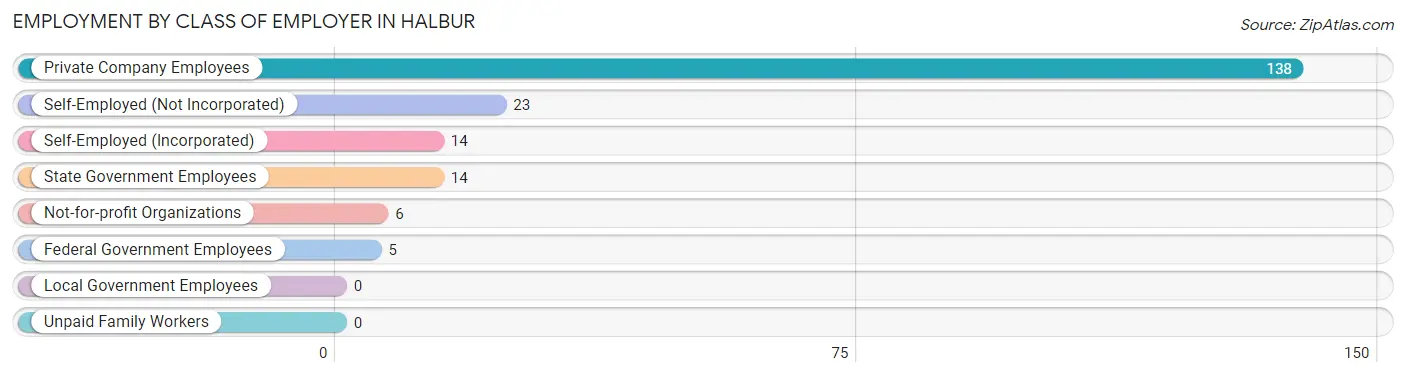
| Employer Class | # Employees | % Employees |
| Private Company Employees | 138 | 69.0% |
| Self-Employed (Incorporated) | 14 | 7.0% |
| Self-Employed (Not Incorporated) | 23 | 11.5% |
| Not-for-profit Organizations | 6 | 3.0% |
| Local Government Employees | 0 | 0.0% |
| State Government Employees | 14 | 7.0% |
| Federal Government Employees | 5 | 2.5% |
| Unpaid Family Workers | 0 | 0.0% |
| Total | 200 | 100.0% |
Employment Status by Age in Halbur
According to the labor force statistics for Halbur, out of the total population over 16 years of age (248), 81.9% or 203 individuals are in the labor force, with 1.0% or 2 of them unemployed. The age group with the highest labor force participation rate is 20 to 24 years, with 100.0% or 10 individuals in the labor force. Within the labor force, the 60 to 64 years age range has the highest percentage of unemployed individuals, with 9.5% or 2 of them being unemployed.
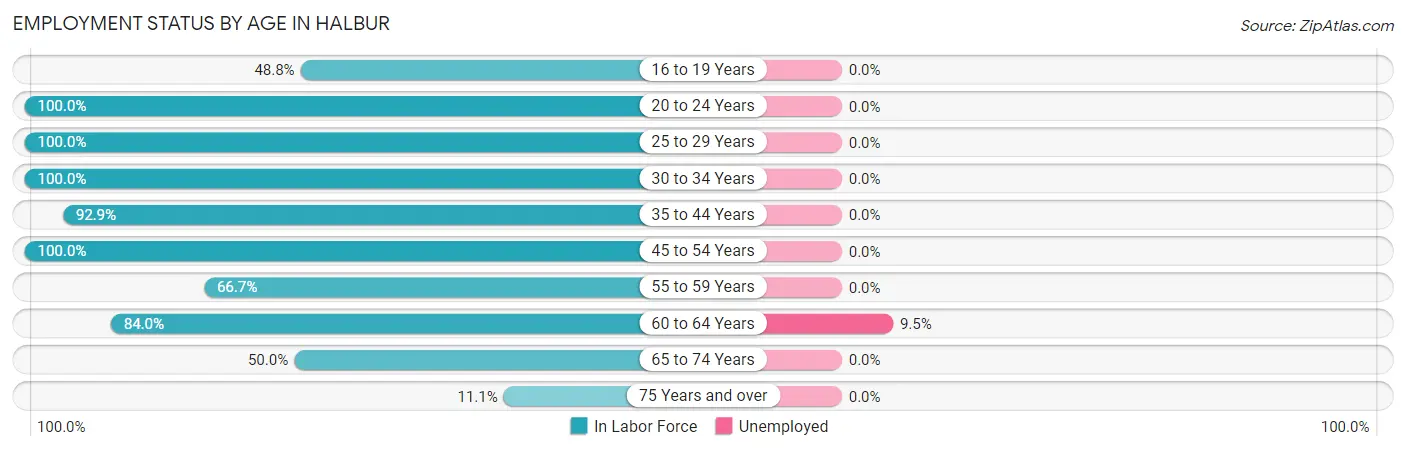
| Age Bracket | In Labor Force | Unemployed |
| 16 to 19 Years | 20 (48.8%) | 0 (0.0%) |
| 20 to 24 Years | 10 (100.0%) | 0 (0.0%) |
| 25 to 29 Years | 39 (100.0%) | 0 (0.0%) |
| 30 to 34 Years | 17 (100.0%) | 0 (0.0%) |
| 35 to 44 Years | 39 (92.9%) | 0 (0.0%) |
| 45 to 54 Years | 44 (100.0%) | 0 (0.0%) |
| 55 to 59 Years | 6 (66.7%) | 0 (0.0%) |
| 60 to 64 Years | 21 (84.0%) | 2 (9.5%) |
| 65 to 74 Years | 6 (50.0%) | 0 (0.0%) |
| 75 Years and over | 1 (11.1%) | 0 (0.0%) |
| Total | 203 (81.9%) | 2 (1.0%) |
Employment Status by Educational Attainment in Halbur
According to labor force statistics for Halbur, 94.3% of individuals (166) out of the total population between 25 and 64 years of age (176) are in the labor force, with 1.2% or 2 of them being unemployed. The group with the highest labor force participation rate are those with the educational attainment of less than high school, with 100.0% or 1 individuals in the labor force. Within the labor force, individuals with college / associate degree education have the highest percentage of unemployment, with 2.4% or 2 of them being unemployed.
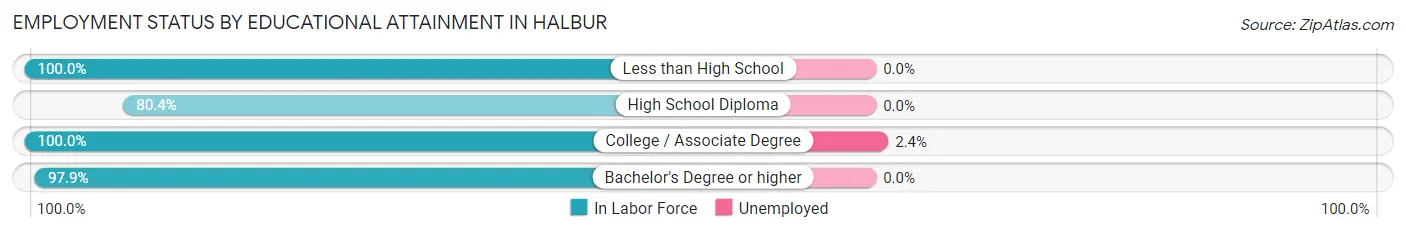
| Educational Attainment | In Labor Force | Unemployed |
| Less than High School | 1 (100.0%) | 0 (0.0%) |
| High School Diploma | 37 (80.4%) | 0 (0.0%) |
| College / Associate Degree | 82 (100.0%) | 2 (2.4%) |
| Bachelor's Degree or higher | 46 (97.9%) | 0 (0.0%) |
| Total | 166 (94.3%) | 2 (1.2%) |
Employment Occupations by Sex in Halbur
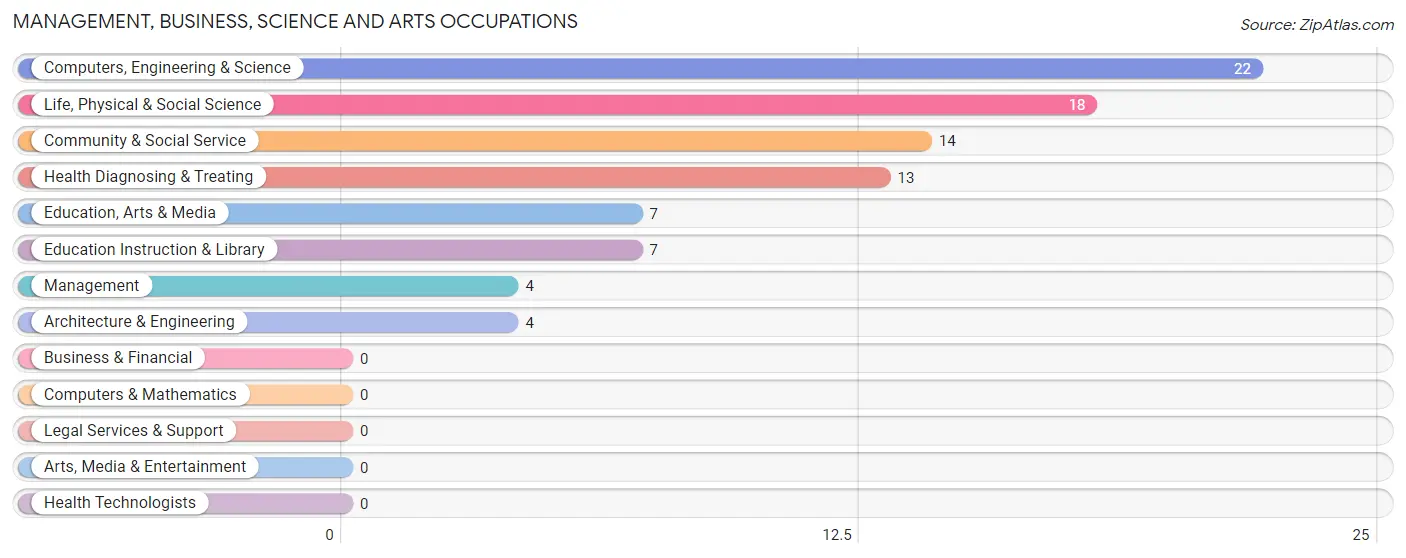
Management, Business, Science and Arts Occupations
The most common Management, Business, Science and Arts occupations in Halbur are Computers, Engineering & Science (22 | 11.0%), Life, Physical & Social Science (18 | 9.0%), Community & Social Service (14 | 7.0%), Health Diagnosing & Treating (13 | 6.5%), and Education, Arts & Media (7 | 3.5%).
Management, Business, Science and Arts Occupations by Sex
Within the Management, Business, Science and Arts occupations in Halbur, the most male-oriented occupations are Management (100.0%), Computers, Engineering & Science (100.0%), and Architecture & Engineering (100.0%), while the most female-oriented occupations are Community & Social Service (100.0%), Education, Arts & Media (100.0%), and Education Instruction & Library (100.0%).
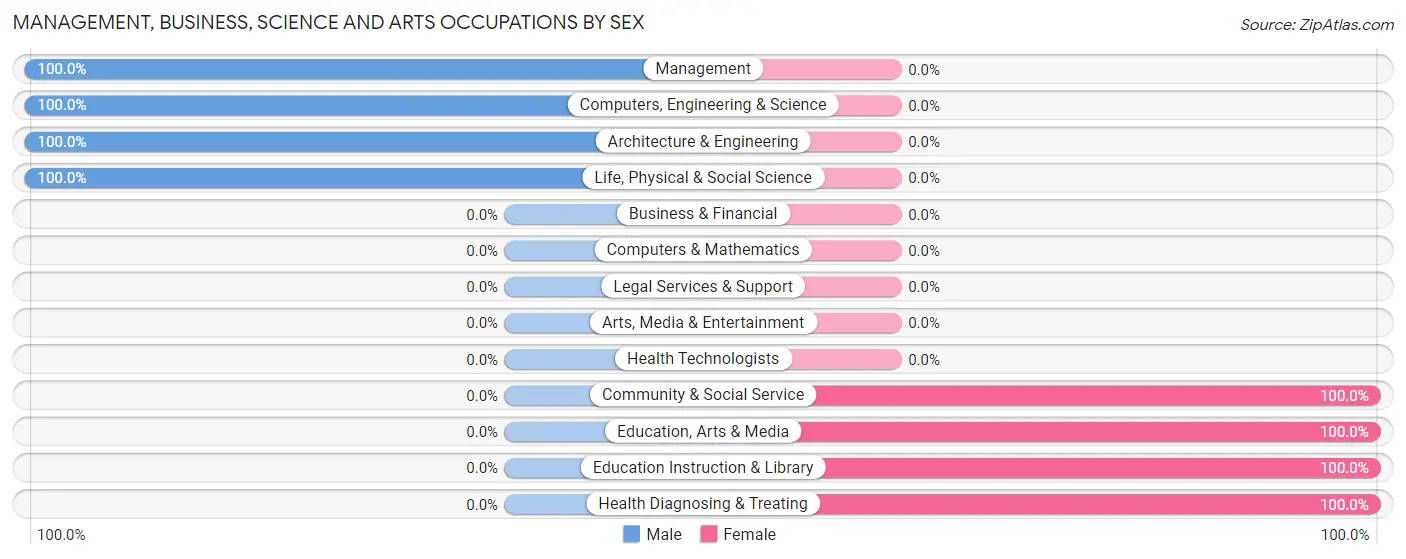
| Occupation | Male | Female |
| Management | 4 (100.0%) | 0 (0.0%) |
| Business & Financial | 0 (0.0%) | 0 (0.0%) |
| Computers, Engineering & Science | 22 (100.0%) | 0 (0.0%) |
| Computers & Mathematics | 0 (0.0%) | 0 (0.0%) |
| Architecture & Engineering | 4 (100.0%) | 0 (0.0%) |
| Life, Physical & Social Science | 18 (100.0%) | 0 (0.0%) |
| Community & Social Service | 0 (0.0%) | 14 (100.0%) |
| Education, Arts & Media | 0 (0.0%) | 7 (100.0%) |
| Legal Services & Support | 0 (0.0%) | 0 (0.0%) |
| Education Instruction & Library | 0 (0.0%) | 7 (100.0%) |
| Arts, Media & Entertainment | 0 (0.0%) | 0 (0.0%) |
| Health Diagnosing & Treating | 0 (0.0%) | 13 (100.0%) |
| Health Technologists | 0 (0.0%) | 0 (0.0%) |
| Total (Category) | 26 (49.1%) | 27 (50.9%) |
| Total (Overall) | 113 (56.2%) | 88 (43.8%) |
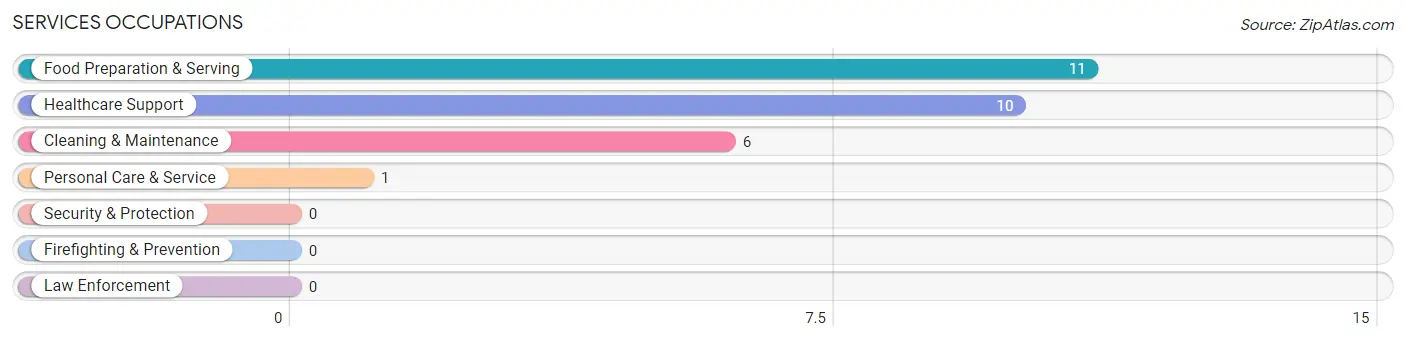
Services Occupations
The most common Services occupations in Halbur are Food Preparation & Serving (11 | 5.5%), Healthcare Support (10 | 5.0%), Cleaning & Maintenance (6 | 3.0%), and Personal Care & Service (1 | 0.5%).
Services Occupations by Sex
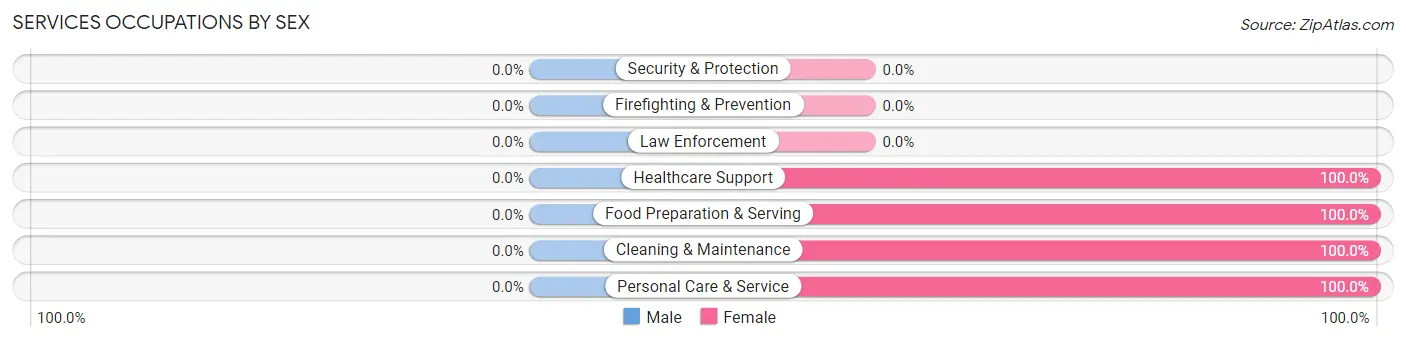
| Occupation | Male | Female |
| Healthcare Support | 0 (0.0%) | 10 (100.0%) |
| Security & Protection | 0 (0.0%) | 0 (0.0%) |
| Firefighting & Prevention | 0 (0.0%) | 0 (0.0%) |
| Law Enforcement | 0 (0.0%) | 0 (0.0%) |
| Food Preparation & Serving | 0 (0.0%) | 11 (100.0%) |
| Cleaning & Maintenance | 0 (0.0%) | 6 (100.0%) |
| Personal Care & Service | 0 (0.0%) | 1 (100.0%) |
| Total (Category) | 0 (0.0%) | 28 (100.0%) |
| Total (Overall) | 113 (56.2%) | 88 (43.8%) |
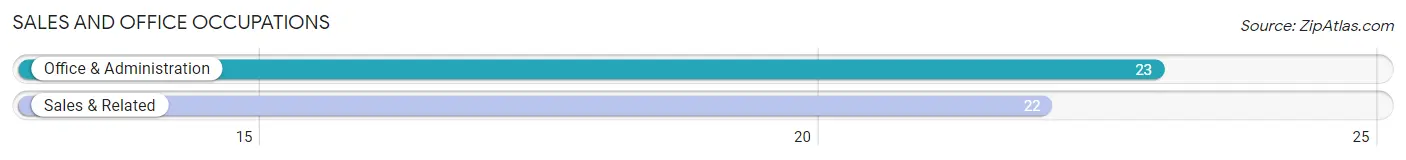
Sales and Office Occupations
The most common Sales and Office occupations in Halbur are Office & Administration (23 | 11.4%), and Sales & Related (22 | 11.0%).
Sales and Office Occupations by Sex
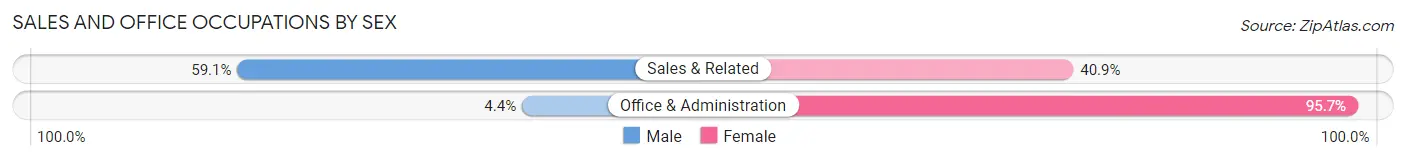
| Occupation | Male | Female |
| Sales & Related | 13 (59.1%) | 9 (40.9%) |
| Office & Administration | 1 (4.3%) | 22 (95.7%) |
| Total (Category) | 14 (31.1%) | 31 (68.9%) |
| Total (Overall) | 113 (56.2%) | 88 (43.8%) |
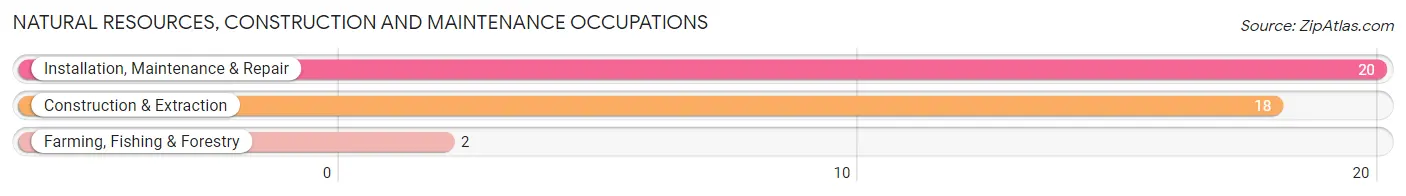
Natural Resources, Construction and Maintenance Occupations
The most common Natural Resources, Construction and Maintenance occupations in Halbur are Installation, Maintenance & Repair (20 | 10.0%), Construction & Extraction (18 | 9.0%), and Farming, Fishing & Forestry (2 | 1.0%).
Natural Resources, Construction and Maintenance Occupations by Sex
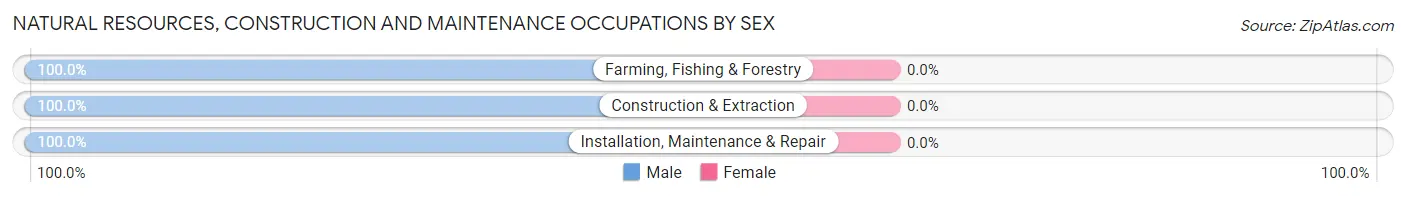
| Occupation | Male | Female |
| Farming, Fishing & Forestry | 2 (100.0%) | 0 (0.0%) |
| Construction & Extraction | 18 (100.0%) | 0 (0.0%) |
| Installation, Maintenance & Repair | 20 (100.0%) | 0 (0.0%) |
| Total (Category) | 40 (100.0%) | 0 (0.0%) |
| Total (Overall) | 113 (56.2%) | 88 (43.8%) |
Production, Transportation and Moving Occupations
The most common Production, Transportation and Moving occupations in Halbur are Production (18 | 9.0%), Material Moving (10 | 5.0%), and Transportation (7 | 3.5%).
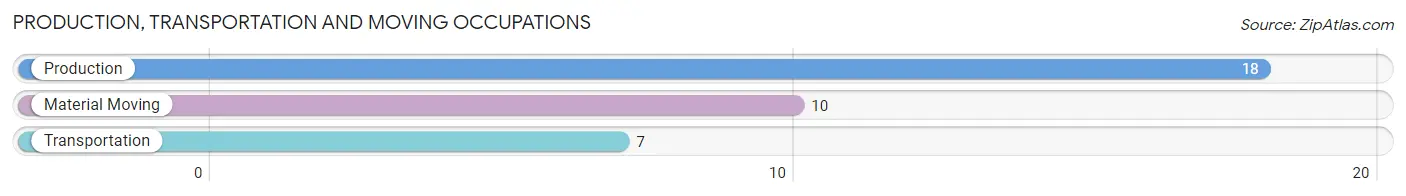
Production, Transportation and Moving Occupations by Sex
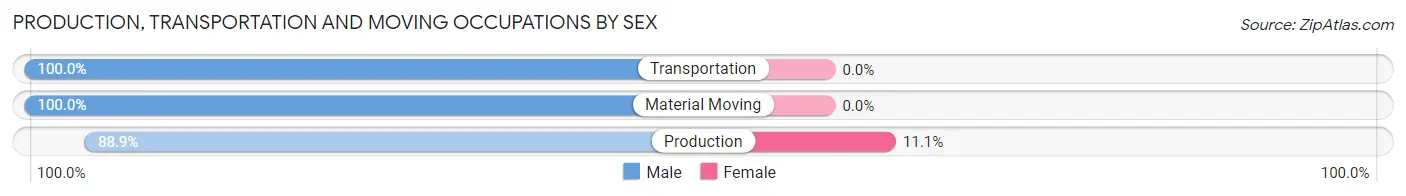
| Occupation | Male | Female |
| Production | 16 (88.9%) | 2 (11.1%) |
| Transportation | 7 (100.0%) | 0 (0.0%) |
| Material Moving | 10 (100.0%) | 0 (0.0%) |
| Total (Category) | 33 (94.3%) | 2 (5.7%) |
| Total (Overall) | 113 (56.2%) | 88 (43.8%) |
Employment Industries by Sex in Halbur
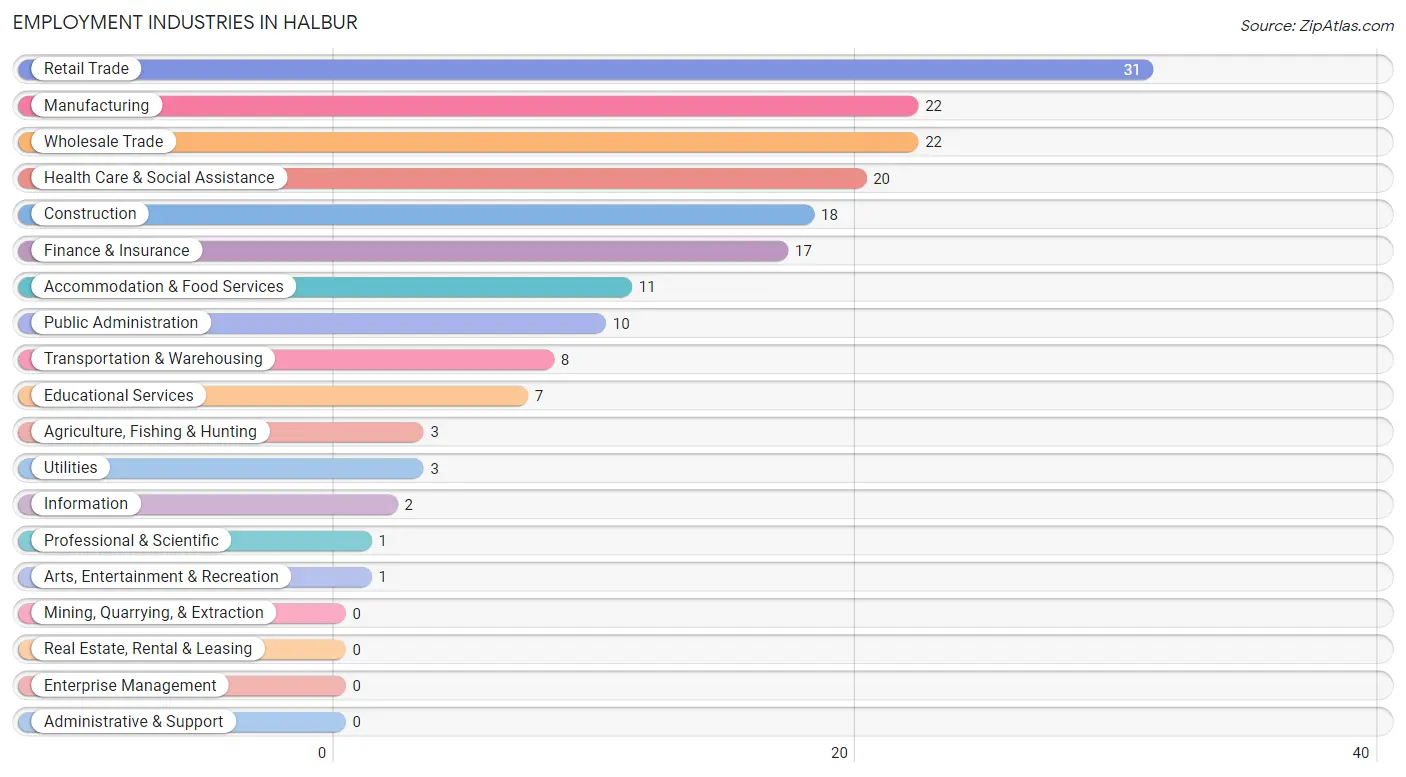
Employment Industries in Halbur
The major employment industries in Halbur include Retail Trade (31 | 15.4%), Manufacturing (22 | 11.0%), Wholesale Trade (22 | 11.0%), Health Care & Social Assistance (20 | 10.0%), and Construction (18 | 9.0%).
Employment Industries by Sex in Halbur
The Halbur industries that see more men than women are Agriculture, Fishing & Hunting (100.0%), Utilities (100.0%), and Information (100.0%), whereas the industries that tend to have a higher number of women are Educational Services (100.0%), Health Care & Social Assistance (100.0%), and Arts, Entertainment & Recreation (100.0%).
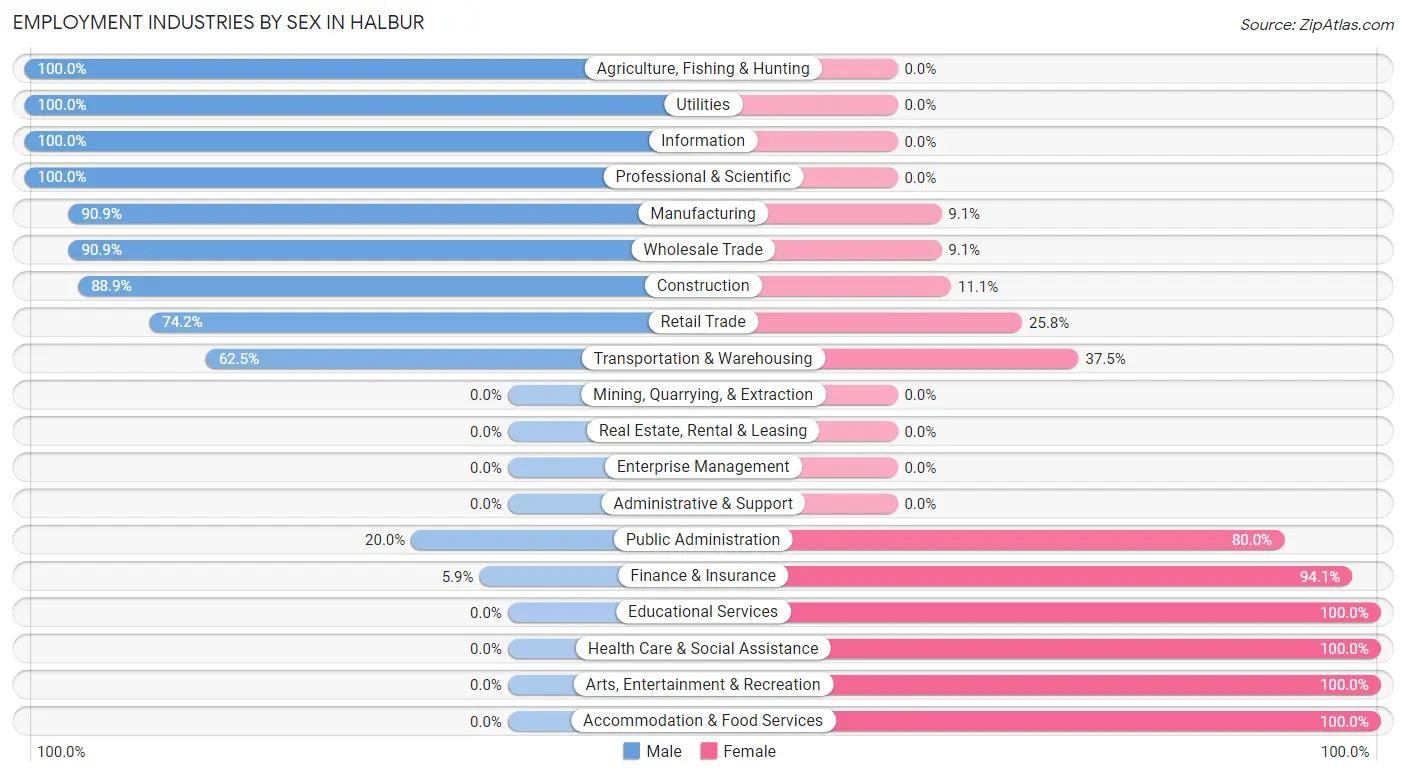
| Industry | Male | Female |
| Agriculture, Fishing & Hunting | 3 (100.0%) | 0 (0.0%) |
| Mining, Quarrying, & Extraction | 0 (0.0%) | 0 (0.0%) |
| Construction | 16 (88.9%) | 2 (11.1%) |
| Manufacturing | 20 (90.9%) | 2 (9.1%) |
| Wholesale Trade | 20 (90.9%) | 2 (9.1%) |
| Retail Trade | 23 (74.2%) | 8 (25.8%) |
| Transportation & Warehousing | 5 (62.5%) | 3 (37.5%) |
| Utilities | 3 (100.0%) | 0 (0.0%) |
| Information | 2 (100.0%) | 0 (0.0%) |
| Finance & Insurance | 1 (5.9%) | 16 (94.1%) |
| Real Estate, Rental & Leasing | 0 (0.0%) | 0 (0.0%) |
| Professional & Scientific | 1 (100.0%) | 0 (0.0%) |
| Enterprise Management | 0 (0.0%) | 0 (0.0%) |
| Administrative & Support | 0 (0.0%) | 0 (0.0%) |
| Educational Services | 0 (0.0%) | 7 (100.0%) |
| Health Care & Social Assistance | 0 (0.0%) | 20 (100.0%) |
| Arts, Entertainment & Recreation | 0 (0.0%) | 1 (100.0%) |
| Accommodation & Food Services | 0 (0.0%) | 11 (100.0%) |
| Public Administration | 2 (20.0%) | 8 (80.0%) |
| Total | 113 (56.2%) | 88 (43.8%) |
Education in Halbur
School Enrollment in Halbur
The most common levels of schooling among the 138 students in Halbur are middle school (56 | 40.6%), high school (53 | 38.4%), and elementary school (14 | 10.1%).
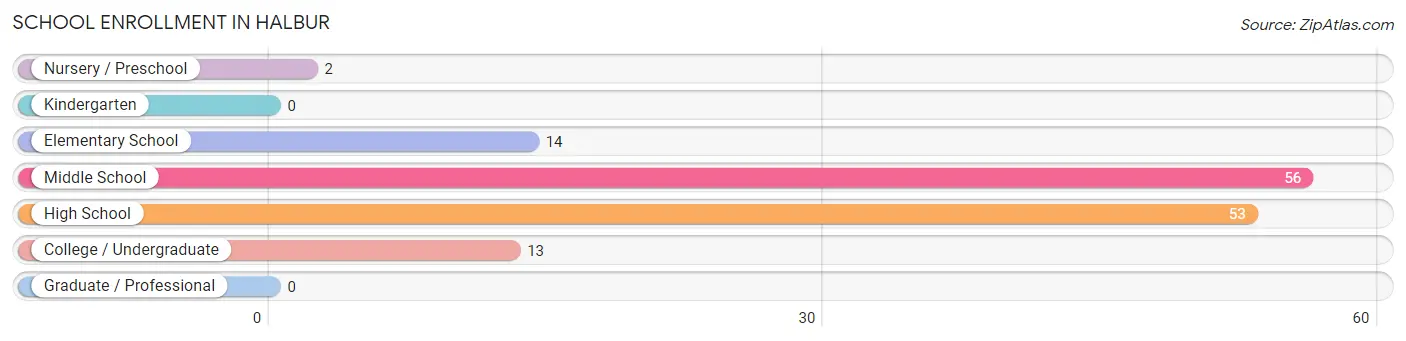
| School Level | # Students | % Students |
| Nursery / Preschool | 2 | 1.5% |
| Kindergarten | 0 | 0.0% |
| Elementary School | 14 | 10.1% |
| Middle School | 56 | 40.6% |
| High School | 53 | 38.4% |
| College / Undergraduate | 13 | 9.4% |
| Graduate / Professional | 0 | 0.0% |
| Total | 138 | 100.0% |
School Enrollment by Age by Funding Source in Halbur
Out of a total of 138 students who are enrolled in schools in Halbur, 55 (39.9%) attend a private institution, while the remaining 83 (60.1%) are enrolled in public schools. The age group of 3 to 4 year olds has the highest likelihood of being enrolled in private schools, with 1 (100.0% in the age bracket) enrolled. Conversely, the age group of 25 to 34 year olds has the lowest likelihood of being enrolled in a private school, with 13 (100.0% in the age bracket) attending a public institution.
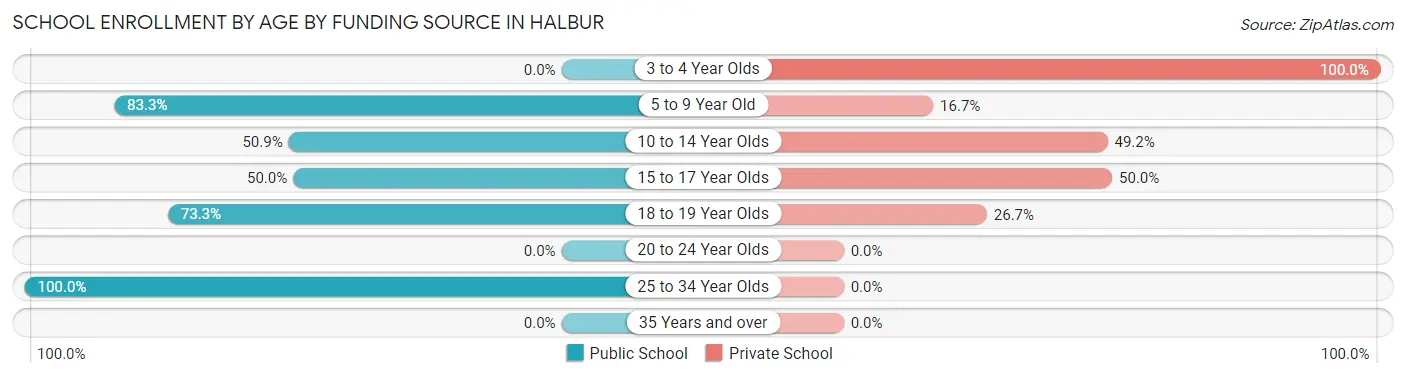
| Age Bracket | Public School | Private School |
| 3 to 4 Year Olds | 0 (0.0%) | 1 (100.0%) |
| 5 to 9 Year Old | 10 (83.3%) | 2 (16.7%) |
| 10 to 14 Year Olds | 30 (50.8%) | 29 (49.1%) |
| 15 to 17 Year Olds | 19 (50.0%) | 19 (50.0%) |
| 18 to 19 Year Olds | 11 (73.3%) | 4 (26.7%) |
| 20 to 24 Year Olds | 0 (0.0%) | 0 (0.0%) |
| 25 to 34 Year Olds | 13 (100.0%) | 0 (0.0%) |
| 35 Years and over | 0 (0.0%) | 0 (0.0%) |
| Total | 83 (60.1%) | 55 (39.9%) |
Educational Attainment by Field of Study in Halbur
Bio, nature & agricultural (31 | 57.4%), psychology (5 | 9.3%), social sciences (5 | 9.3%), science & technology (5 | 9.3%), and education (5 | 9.3%) are the most common fields of study among 54 individuals in Halbur who have obtained a bachelor's degree or higher.
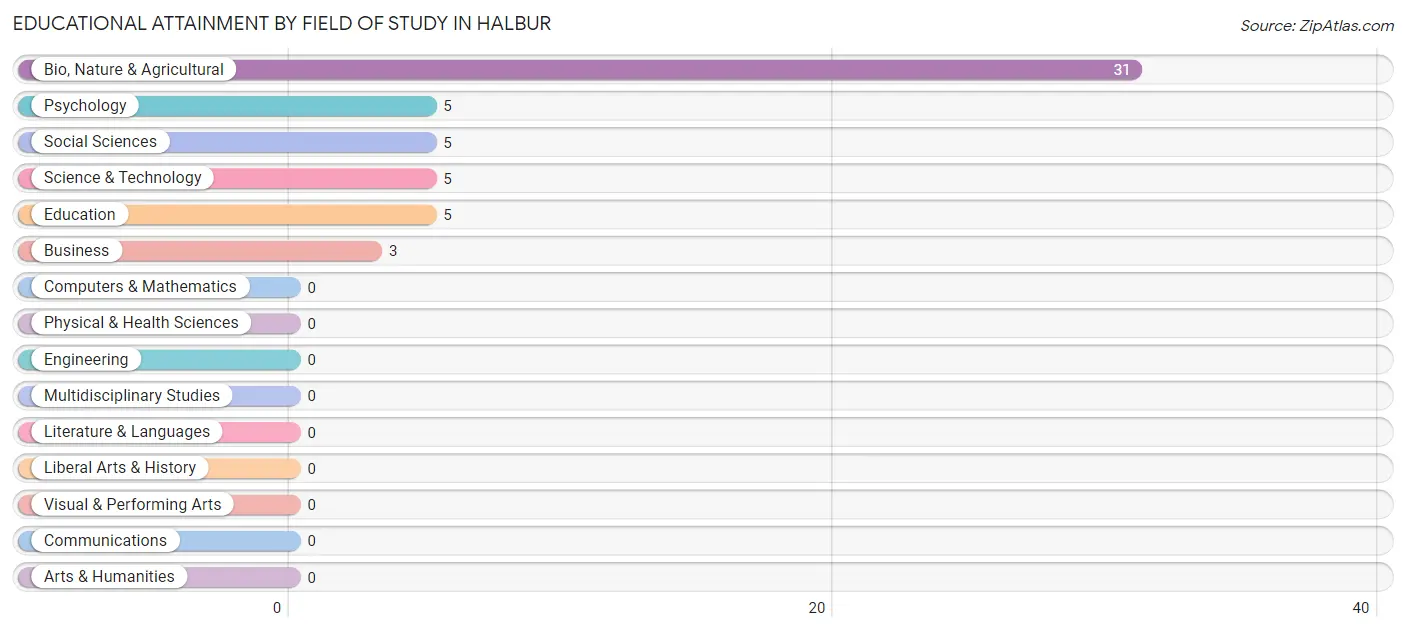
| Field of Study | # Graduates | % Graduates |
| Computers & Mathematics | 0 | 0.0% |
| Bio, Nature & Agricultural | 31 | 57.4% |
| Physical & Health Sciences | 0 | 0.0% |
| Psychology | 5 | 9.3% |
| Social Sciences | 5 | 9.3% |
| Engineering | 0 | 0.0% |
| Multidisciplinary Studies | 0 | 0.0% |
| Science & Technology | 5 | 9.3% |
| Business | 3 | 5.6% |
| Education | 5 | 9.3% |
| Literature & Languages | 0 | 0.0% |
| Liberal Arts & History | 0 | 0.0% |
| Visual & Performing Arts | 0 | 0.0% |
| Communications | 0 | 0.0% |
| Arts & Humanities | 0 | 0.0% |
| Total | 54 | 100.0% |
Transportation & Commute in Halbur
Vehicle Availability by Sex in Halbur
The most prevalent vehicle ownership categories in Halbur are males with 1 vehicle (32, accounting for 28.6%) and females with 1 vehicle (7, making up 36.4%).
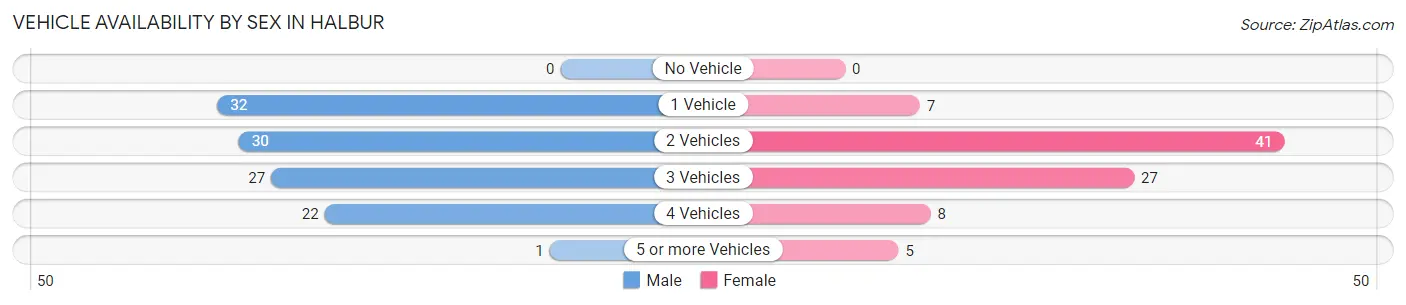
| Vehicles Available | Male | Female |
| No Vehicle | 0 (0.0%) | 0 (0.0%) |
| 1 Vehicle | 32 (28.6%) | 7 (8.0%) |
| 2 Vehicles | 30 (26.8%) | 41 (46.6%) |
| 3 Vehicles | 27 (24.1%) | 27 (30.7%) |
| 4 Vehicles | 22 (19.6%) | 8 (9.1%) |
| 5 or more Vehicles | 1 (0.9%) | 5 (5.7%) |
| Total | 112 (100.0%) | 88 (100.0%) |
Commute Time in Halbur
The most frequently occuring commute durations in Halbur are 15 to 19 minutes (73 commuters, 37.4%), 20 to 24 minutes (44 commuters, 22.6%), and 10 to 14 minutes (28 commuters, 14.4%).
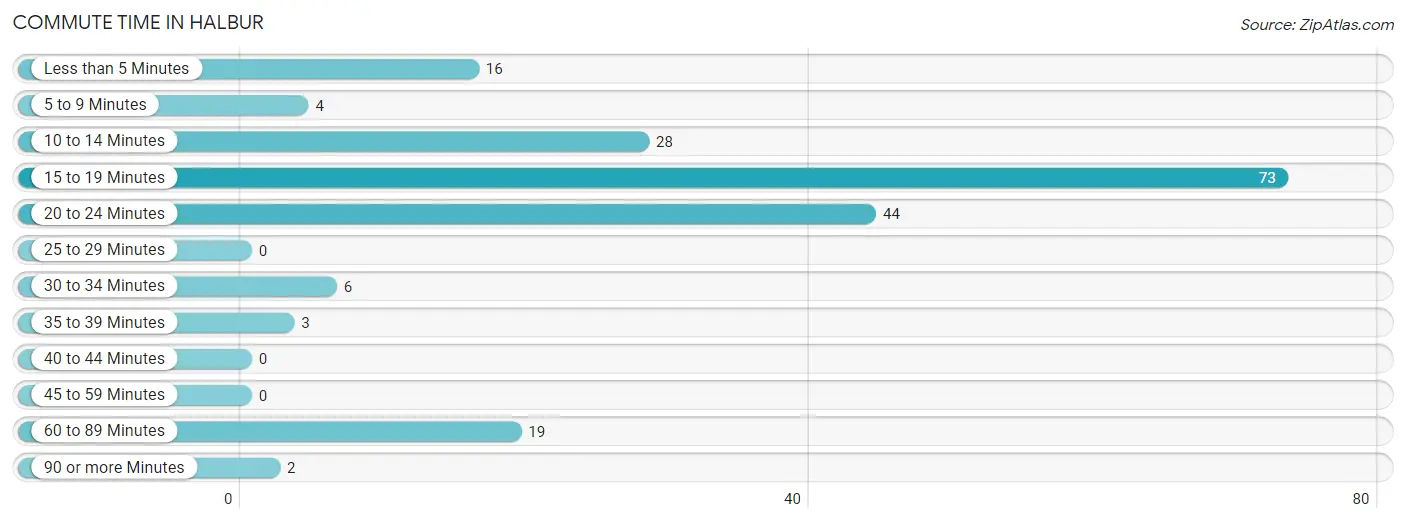
| Commute Time | # Commuters | % Commuters |
| Less than 5 Minutes | 16 | 8.2% |
| 5 to 9 Minutes | 4 | 2.1% |
| 10 to 14 Minutes | 28 | 14.4% |
| 15 to 19 Minutes | 73 | 37.4% |
| 20 to 24 Minutes | 44 | 22.6% |
| 25 to 29 Minutes | 0 | 0.0% |
| 30 to 34 Minutes | 6 | 3.1% |
| 35 to 39 Minutes | 3 | 1.5% |
| 40 to 44 Minutes | 0 | 0.0% |
| 45 to 59 Minutes | 0 | 0.0% |
| 60 to 89 Minutes | 19 | 9.7% |
| 90 or more Minutes | 2 | 1.0% |
Commute Time by Sex in Halbur
The most common commute times in Halbur are 20 to 24 minutes (30 commuters, 27.0%) for males and 15 to 19 minutes (56 commuters, 66.7%) for females.
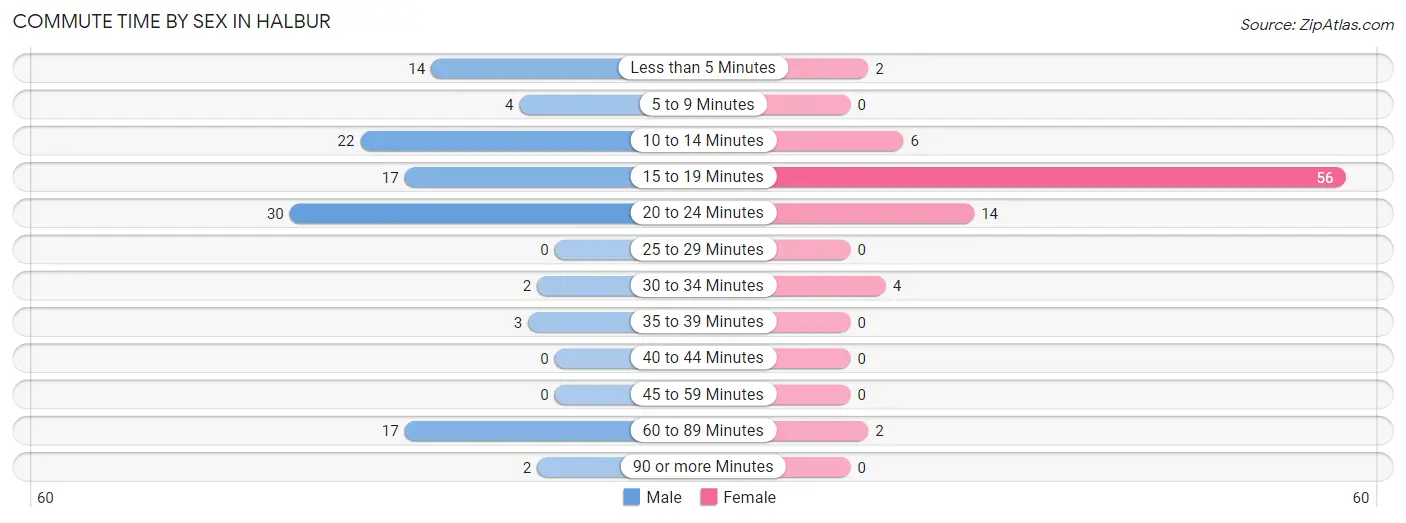
| Commute Time | Male | Female |
| Less than 5 Minutes | 14 (12.6%) | 2 (2.4%) |
| 5 to 9 Minutes | 4 (3.6%) | 0 (0.0%) |
| 10 to 14 Minutes | 22 (19.8%) | 6 (7.1%) |
| 15 to 19 Minutes | 17 (15.3%) | 56 (66.7%) |
| 20 to 24 Minutes | 30 (27.0%) | 14 (16.7%) |
| 25 to 29 Minutes | 0 (0.0%) | 0 (0.0%) |
| 30 to 34 Minutes | 2 (1.8%) | 4 (4.8%) |
| 35 to 39 Minutes | 3 (2.7%) | 0 (0.0%) |
| 40 to 44 Minutes | 0 (0.0%) | 0 (0.0%) |
| 45 to 59 Minutes | 0 (0.0%) | 0 (0.0%) |
| 60 to 89 Minutes | 17 (15.3%) | 2 (2.4%) |
| 90 or more Minutes | 2 (1.8%) | 0 (0.0%) |
Time of Departure to Work by Sex in Halbur
The most frequent times of departure to work in Halbur are 7:30 AM to 7:59 AM (30, 27.0%) for males and 7:30 AM to 7:59 AM (26, 30.9%) for females.
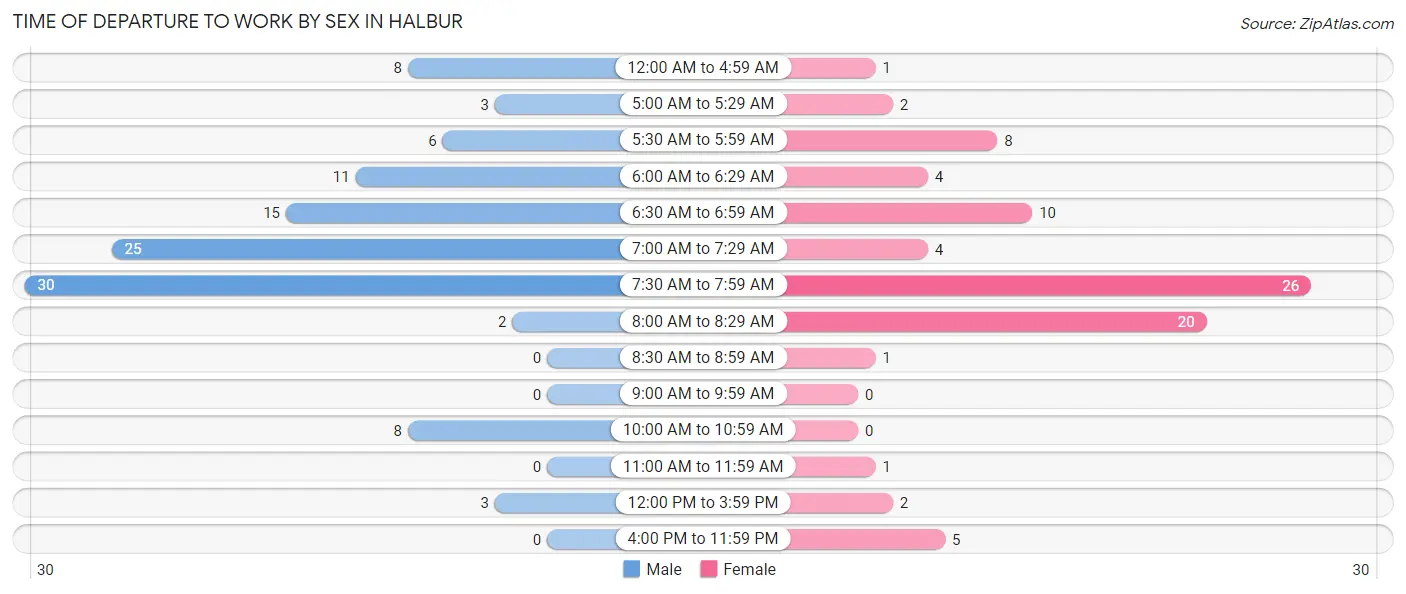
| Time of Departure | Male | Female |
| 12:00 AM to 4:59 AM | 8 (7.2%) | 1 (1.2%) |
| 5:00 AM to 5:29 AM | 3 (2.7%) | 2 (2.4%) |
| 5:30 AM to 5:59 AM | 6 (5.4%) | 8 (9.5%) |
| 6:00 AM to 6:29 AM | 11 (9.9%) | 4 (4.8%) |
| 6:30 AM to 6:59 AM | 15 (13.5%) | 10 (11.9%) |
| 7:00 AM to 7:29 AM | 25 (22.5%) | 4 (4.8%) |
| 7:30 AM to 7:59 AM | 30 (27.0%) | 26 (30.9%) |
| 8:00 AM to 8:29 AM | 2 (1.8%) | 20 (23.8%) |
| 8:30 AM to 8:59 AM | 0 (0.0%) | 1 (1.2%) |
| 9:00 AM to 9:59 AM | 0 (0.0%) | 0 (0.0%) |
| 10:00 AM to 10:59 AM | 8 (7.2%) | 0 (0.0%) |
| 11:00 AM to 11:59 AM | 0 (0.0%) | 1 (1.2%) |
| 12:00 PM to 3:59 PM | 3 (2.7%) | 2 (2.4%) |
| 4:00 PM to 11:59 PM | 0 (0.0%) | 5 (5.9%) |
| Total | 111 (100.0%) | 84 (100.0%) |
Housing Occupancy in Halbur
Occupancy by Ownership in Halbur
Of the total 129 dwellings in Halbur, owner-occupied units account for 127 (98.5%), while renter-occupied units make up 2 (1.5%).
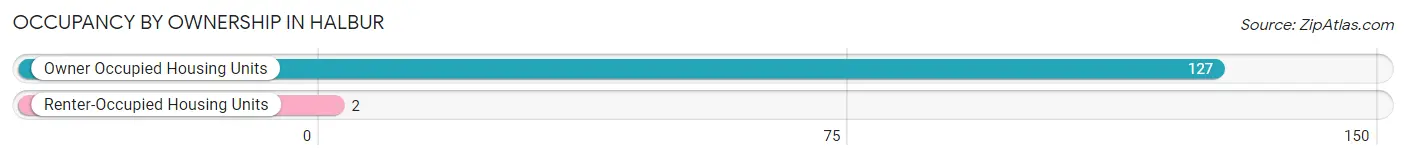
| Occupancy | # Housing Units | % Housing Units |
| Owner Occupied Housing Units | 127 | 98.5% |
| Renter-Occupied Housing Units | 2 | 1.5% |
| Total Occupied Housing Units | 129 | 100.0% |
Occupancy by Household Size in Halbur
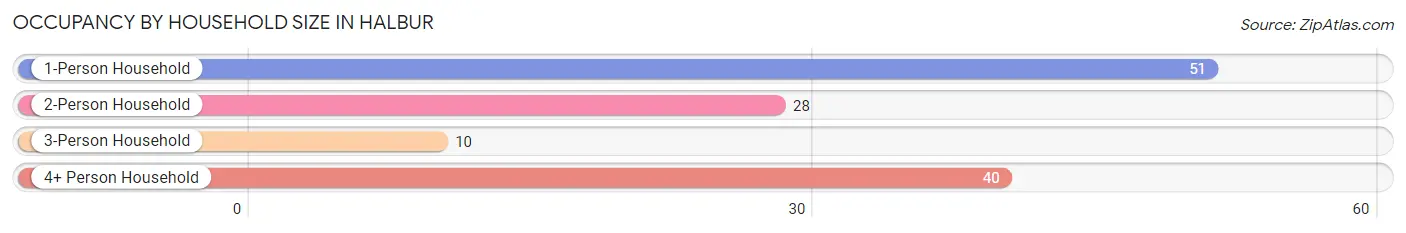
| Household Size | # Housing Units | % Housing Units |
| 1-Person Household | 51 | 39.5% |
| 2-Person Household | 28 | 21.7% |
| 3-Person Household | 10 | 7.7% |
| 4+ Person Household | 40 | 31.0% |
| Total Housing Units | 129 | 100.0% |
Occupancy by Ownership by Household Size in Halbur
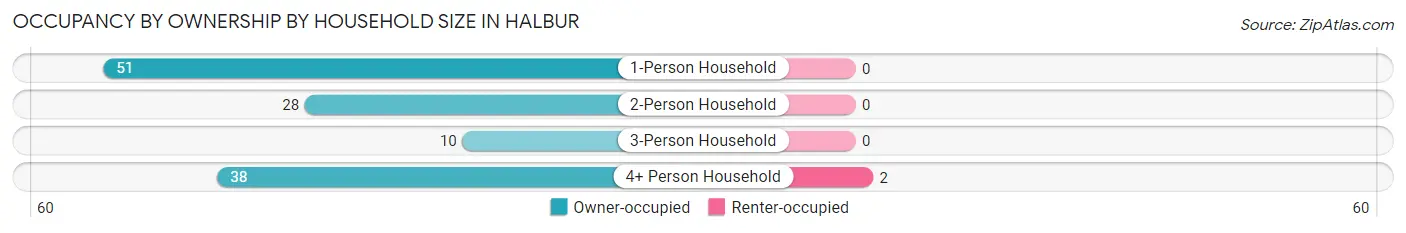
| Household Size | Owner-occupied | Renter-occupied |
| 1-Person Household | 51 (100.0%) | 0 (0.0%) |
| 2-Person Household | 28 (100.0%) | 0 (0.0%) |
| 3-Person Household | 10 (100.0%) | 0 (0.0%) |
| 4+ Person Household | 38 (95.0%) | 2 (5.0%) |
| Total Housing Units | 127 (98.5%) | 2 (1.5%) |
Occupancy by Educational Attainment in Halbur
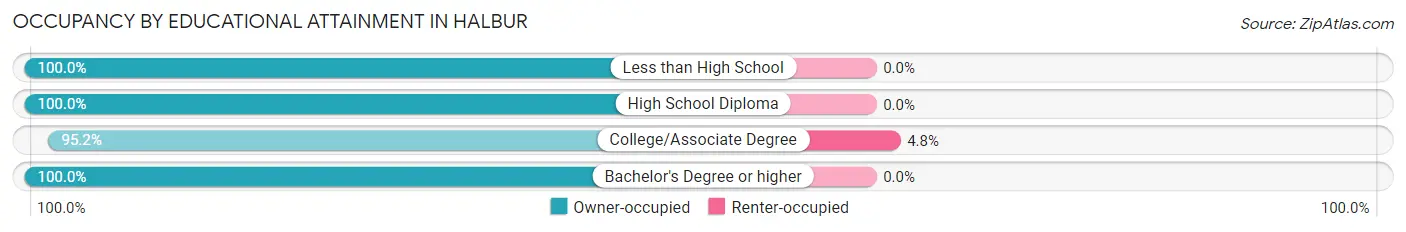
| Household Size | Owner-occupied | Renter-occupied |
| Less than High School | 3 (100.0%) | 0 (0.0%) |
| High School Diploma | 38 (100.0%) | 0 (0.0%) |
| College/Associate Degree | 40 (95.2%) | 2 (4.8%) |
| Bachelor's Degree or higher | 46 (100.0%) | 0 (0.0%) |
Occupancy by Age of Householder in Halbur
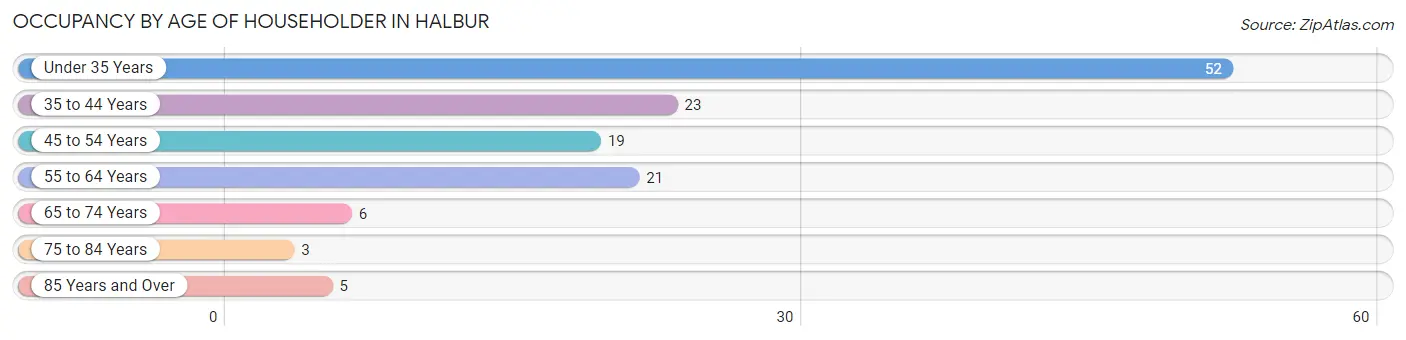
| Age Bracket | # Households | % Households |
| Under 35 Years | 52 | 40.3% |
| 35 to 44 Years | 23 | 17.8% |
| 45 to 54 Years | 19 | 14.7% |
| 55 to 64 Years | 21 | 16.3% |
| 65 to 74 Years | 6 | 4.6% |
| 75 to 84 Years | 3 | 2.3% |
| 85 Years and Over | 5 | 3.9% |
| Total | 129 | 100.0% |
Housing Finances in Halbur
Median Income by Occupancy in Halbur
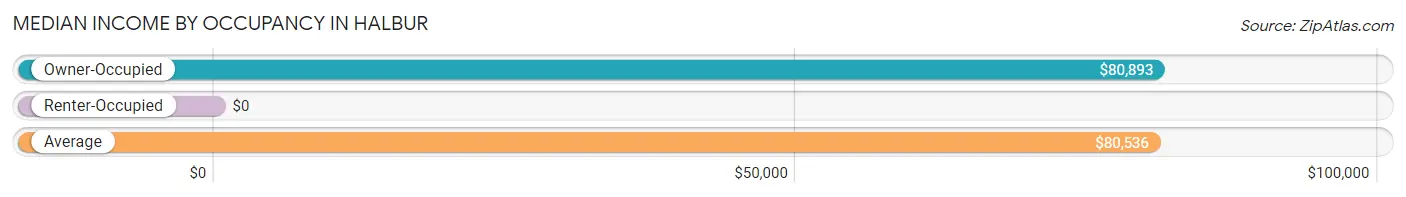
| Occupancy Type | # Households | Median Income |
| Owner-Occupied | 127 (98.5%) | $80,893 |
| Renter-Occupied | 2 (1.5%) | $0 |
| Average | 129 (100.0%) | $80,536 |
Occupancy by Householder Income Bracket in Halbur
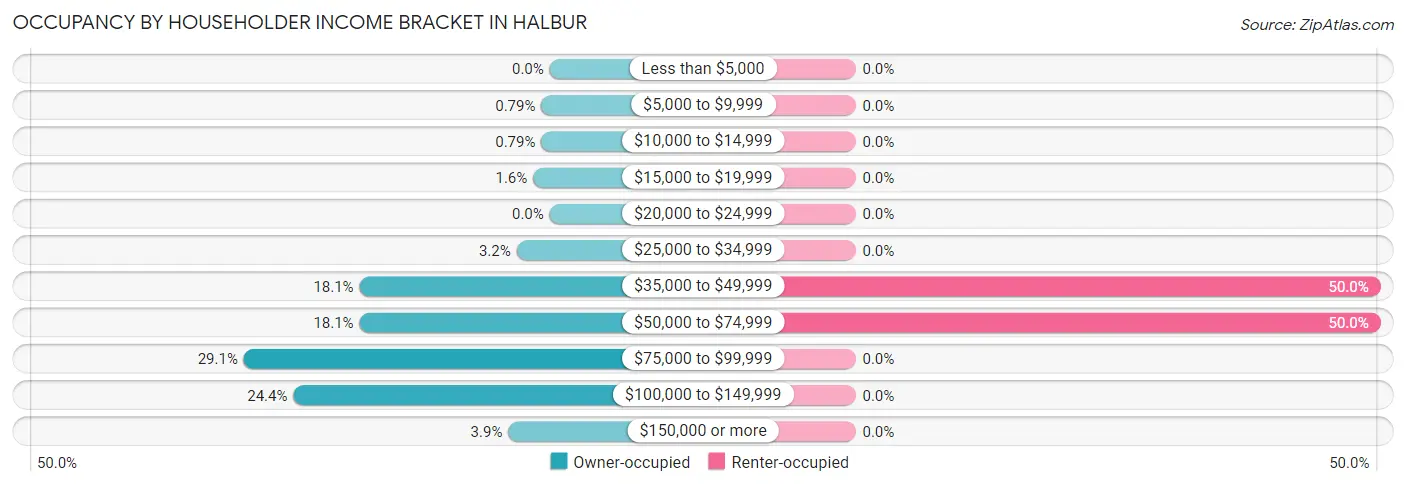
| Income Bracket | Owner-occupied | Renter-occupied |
| Less than $5,000 | 0 (0.0%) | 0 (0.0%) |
| $5,000 to $9,999 | 1 (0.8%) | 0 (0.0%) |
| $10,000 to $14,999 | 1 (0.8%) | 0 (0.0%) |
| $15,000 to $19,999 | 2 (1.6%) | 0 (0.0%) |
| $20,000 to $24,999 | 0 (0.0%) | 0 (0.0%) |
| $25,000 to $34,999 | 4 (3.2%) | 0 (0.0%) |
| $35,000 to $49,999 | 23 (18.1%) | 1 (50.0%) |
| $50,000 to $74,999 | 23 (18.1%) | 1 (50.0%) |
| $75,000 to $99,999 | 37 (29.1%) | 0 (0.0%) |
| $100,000 to $149,999 | 31 (24.4%) | 0 (0.0%) |
| $150,000 or more | 5 (3.9%) | 0 (0.0%) |
| Total | 127 (100.0%) | 2 (100.0%) |
Monthly Housing Cost Tiers in Halbur
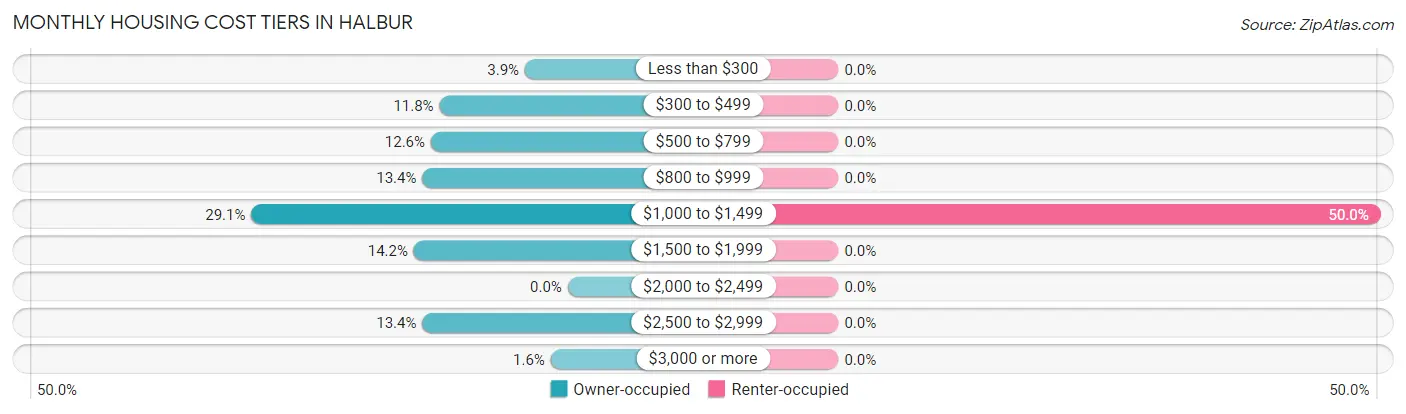
| Monthly Cost | Owner-occupied | Renter-occupied |
| Less than $300 | 5 (3.9%) | 0 (0.0%) |
| $300 to $499 | 15 (11.8%) | 0 (0.0%) |
| $500 to $799 | 16 (12.6%) | 0 (0.0%) |
| $800 to $999 | 17 (13.4%) | 0 (0.0%) |
| $1,000 to $1,499 | 37 (29.1%) | 1 (50.0%) |
| $1,500 to $1,999 | 18 (14.2%) | 0 (0.0%) |
| $2,000 to $2,499 | 0 (0.0%) | 0 (0.0%) |
| $2,500 to $2,999 | 17 (13.4%) | 0 (0.0%) |
| $3,000 or more | 2 (1.6%) | 0 (0.0%) |
| Total | 127 (100.0%) | 2 (100.0%) |
Physical Housing Characteristics in Halbur
Housing Structures in Halbur
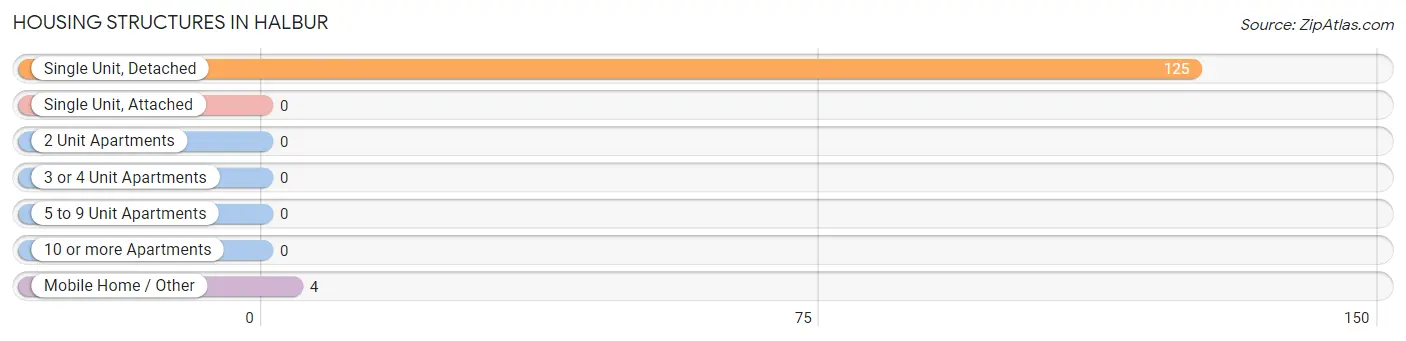
| Structure Type | # Housing Units | % Housing Units |
| Single Unit, Detached | 125 | 96.9% |
| Single Unit, Attached | 0 | 0.0% |
| 2 Unit Apartments | 0 | 0.0% |
| 3 or 4 Unit Apartments | 0 | 0.0% |
| 5 to 9 Unit Apartments | 0 | 0.0% |
| 10 or more Apartments | 0 | 0.0% |
| Mobile Home / Other | 4 | 3.1% |
| Total | 129 | 100.0% |
Housing Structures by Occupancy in Halbur
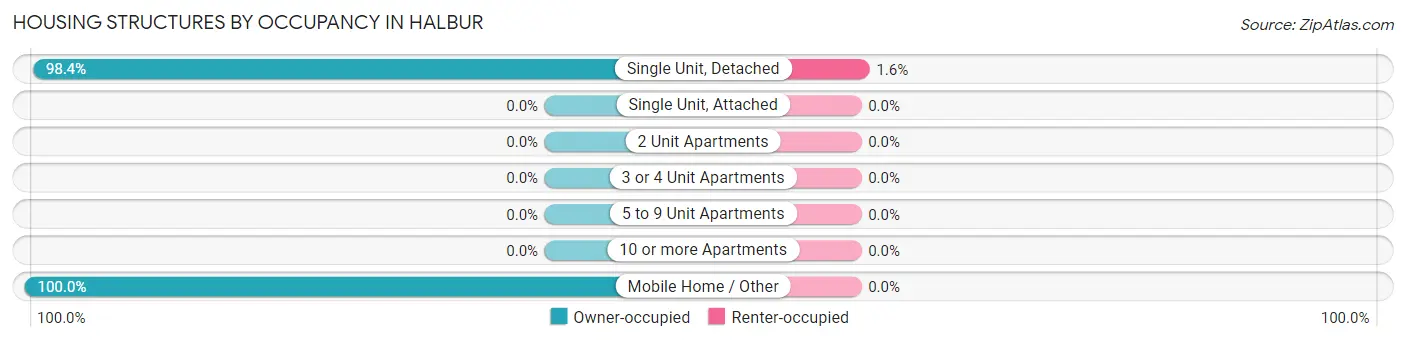
| Structure Type | Owner-occupied | Renter-occupied |
| Single Unit, Detached | 123 (98.4%) | 2 (1.6%) |
| Single Unit, Attached | 0 (0.0%) | 0 (0.0%) |
| 2 Unit Apartments | 0 (0.0%) | 0 (0.0%) |
| 3 or 4 Unit Apartments | 0 (0.0%) | 0 (0.0%) |
| 5 to 9 Unit Apartments | 0 (0.0%) | 0 (0.0%) |
| 10 or more Apartments | 0 (0.0%) | 0 (0.0%) |
| Mobile Home / Other | 4 (100.0%) | 0 (0.0%) |
| Total | 127 (98.5%) | 2 (1.5%) |
Housing Structures by Number of Rooms in Halbur
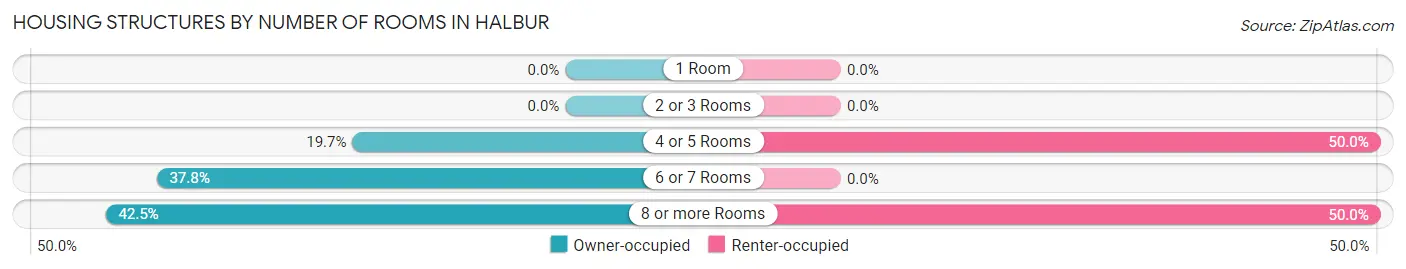
| Number of Rooms | Owner-occupied | Renter-occupied |
| 1 Room | 0 (0.0%) | 0 (0.0%) |
| 2 or 3 Rooms | 0 (0.0%) | 0 (0.0%) |
| 4 or 5 Rooms | 25 (19.7%) | 1 (50.0%) |
| 6 or 7 Rooms | 48 (37.8%) | 0 (0.0%) |
| 8 or more Rooms | 54 (42.5%) | 1 (50.0%) |
| Total | 127 (100.0%) | 2 (100.0%) |
Housing Structure by Heating Type in Halbur
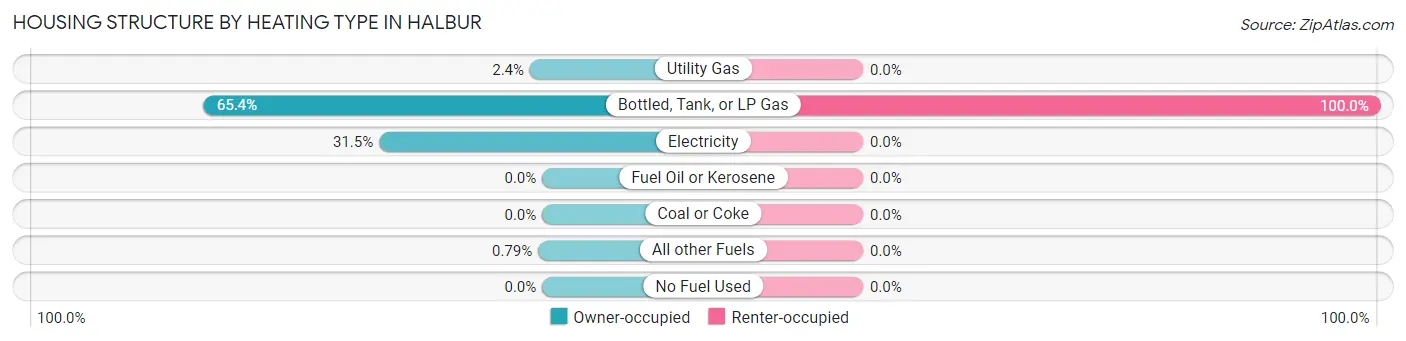
| Heating Type | Owner-occupied | Renter-occupied |
| Utility Gas | 3 (2.4%) | 0 (0.0%) |
| Bottled, Tank, or LP Gas | 83 (65.3%) | 2 (100.0%) |
| Electricity | 40 (31.5%) | 0 (0.0%) |
| Fuel Oil or Kerosene | 0 (0.0%) | 0 (0.0%) |
| Coal or Coke | 0 (0.0%) | 0 (0.0%) |
| All other Fuels | 1 (0.8%) | 0 (0.0%) |
| No Fuel Used | 0 (0.0%) | 0 (0.0%) |
| Total | 127 (100.0%) | 2 (100.0%) |
Household Vehicle Usage in Halbur
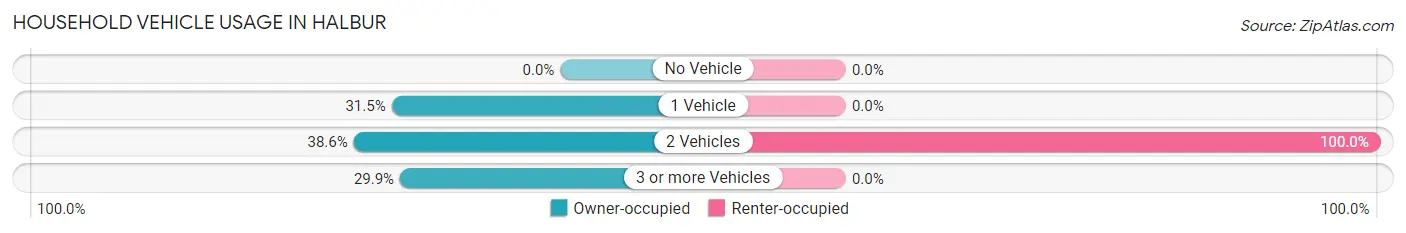
| Vehicles per Household | Owner-occupied | Renter-occupied |
| No Vehicle | 0 (0.0%) | 0 (0.0%) |
| 1 Vehicle | 40 (31.5%) | 0 (0.0%) |
| 2 Vehicles | 49 (38.6%) | 2 (100.0%) |
| 3 or more Vehicles | 38 (29.9%) | 0 (0.0%) |
| Total | 127 (100.0%) | 2 (100.0%) |
Real Estate & Mortgages in Halbur
Real Estate and Mortgage Overview in Halbur
| Characteristic | Without Mortgage | With Mortgage |
| Housing Units | 28 | 99 |
| Median Property Value | $150,000 | $139,900 |
| Median Household Income | $56,250 | $4 |
| Monthly Housing Costs | $375 | $2 |
| Real Estate Taxes | $1,318 | $0 |
Property Value by Mortgage Status in Halbur
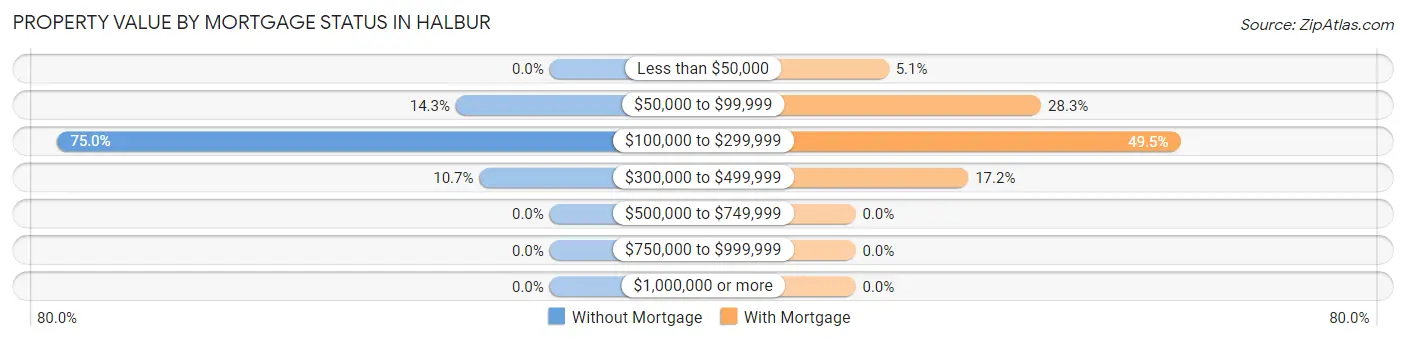
| Property Value | Without Mortgage | With Mortgage |
| Less than $50,000 | 0 (0.0%) | 5 (5.1%) |
| $50,000 to $99,999 | 4 (14.3%) | 28 (28.3%) |
| $100,000 to $299,999 | 21 (75.0%) | 49 (49.5%) |
| $300,000 to $499,999 | 3 (10.7%) | 17 (17.2%) |
| $500,000 to $749,999 | 0 (0.0%) | 0 (0.0%) |
| $750,000 to $999,999 | 0 (0.0%) | 0 (0.0%) |
| $1,000,000 or more | 0 (0.0%) | 0 (0.0%) |
| Total | 28 (100.0%) | 99 (100.0%) |
Household Income by Mortgage Status in Halbur
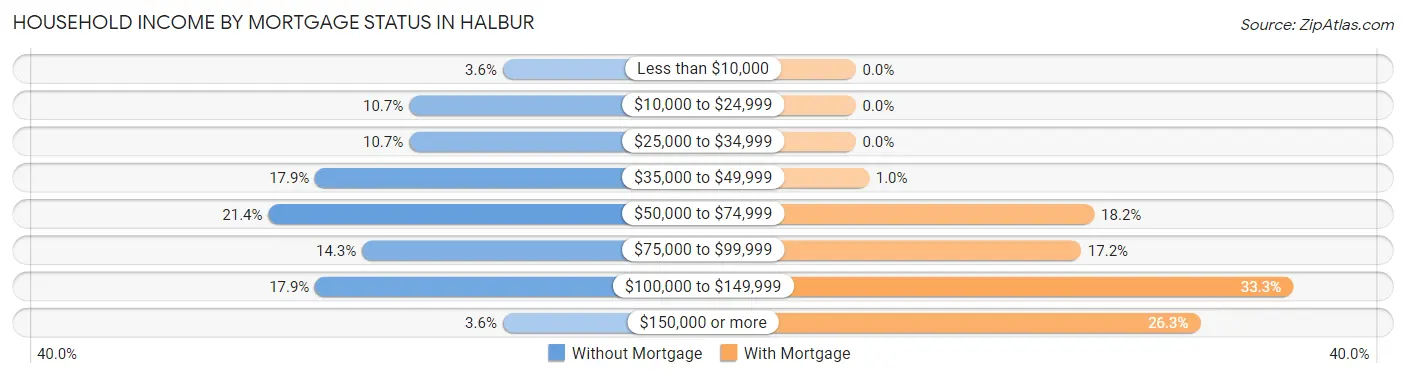
| Household Income | Without Mortgage | With Mortgage |
| Less than $10,000 | 1 (3.6%) | 0 (0.0%) |
| $10,000 to $24,999 | 3 (10.7%) | 0 (0.0%) |
| $25,000 to $34,999 | 3 (10.7%) | 0 (0.0%) |
| $35,000 to $49,999 | 5 (17.9%) | 1 (1.0%) |
| $50,000 to $74,999 | 6 (21.4%) | 18 (18.2%) |
| $75,000 to $99,999 | 4 (14.3%) | 17 (17.2%) |
| $100,000 to $149,999 | 5 (17.9%) | 33 (33.3%) |
| $150,000 or more | 1 (3.6%) | 26 (26.3%) |
| Total | 28 (100.0%) | 99 (100.0%) |
Property Value to Household Income Ratio in Halbur
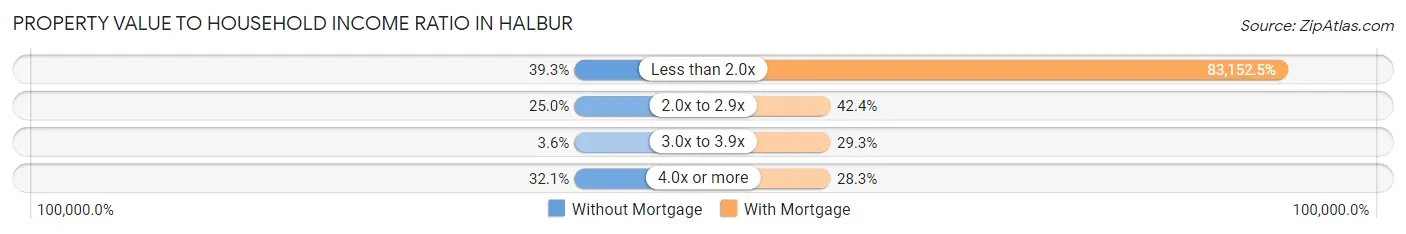
| Value-to-Income Ratio | Without Mortgage | With Mortgage |
| Less than 2.0x | 11 (39.3%) | 82,321 (83,152.5%) |
| 2.0x to 2.9x | 7 (25.0%) | 42 (42.4%) |
| 3.0x to 3.9x | 1 (3.6%) | 29 (29.3%) |
| 4.0x or more | 9 (32.1%) | 28 (28.3%) |
| Total | 28 (100.0%) | 99 (100.0%) |
Real Estate Taxes by Mortgage Status in Halbur
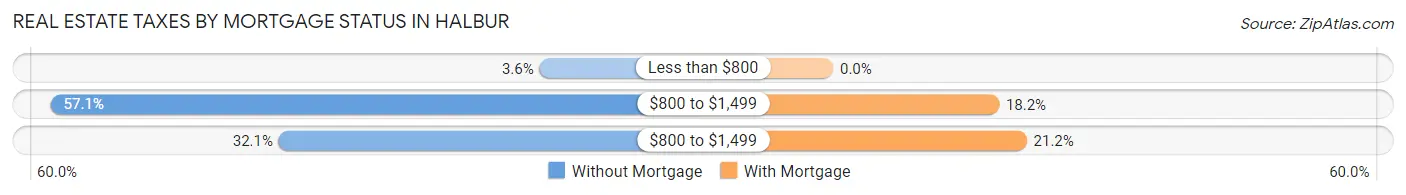
| Property Taxes | Without Mortgage | With Mortgage |
| Less than $800 | 1 (3.6%) | 0 (0.0%) |
| $800 to $1,499 | 16 (57.1%) | 18 (18.2%) |
| $800 to $1,499 | 9 (32.1%) | 21 (21.2%) |
| Total | 28 (100.0%) | 99 (100.0%) |
Health & Disability in Halbur
Health Insurance Coverage by Age in Halbur
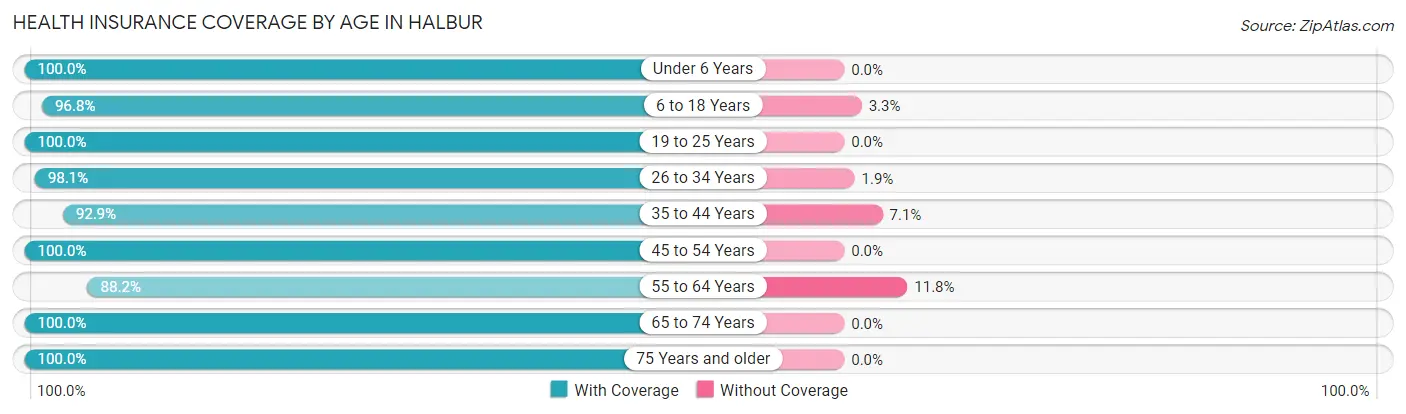
| Age Bracket | With Coverage | Without Coverage |
| Under 6 Years | 8 (100.0%) | 0 (0.0%) |
| 6 to 18 Years | 119 (96.8%) | 4 (3.3%) |
| 19 to 25 Years | 14 (100.0%) | 0 (0.0%) |
| 26 to 34 Years | 51 (98.1%) | 1 (1.9%) |
| 35 to 44 Years | 39 (92.9%) | 3 (7.1%) |
| 45 to 54 Years | 44 (100.0%) | 0 (0.0%) |
| 55 to 64 Years | 30 (88.2%) | 4 (11.8%) |
| 65 to 74 Years | 12 (100.0%) | 0 (0.0%) |
| 75 Years and older | 9 (100.0%) | 0 (0.0%) |
| Total | 326 (96.5%) | 12 (3.5%) |
Health Insurance Coverage by Citizenship Status in Halbur
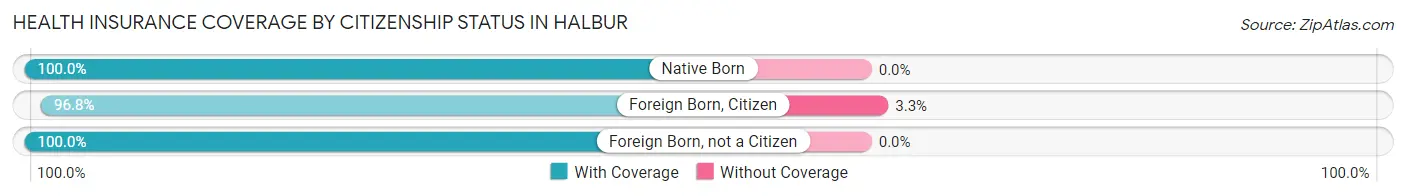
| Citizenship Status | With Coverage | Without Coverage |
| Native Born | 8 (100.0%) | 0 (0.0%) |
| Foreign Born, Citizen | 119 (96.8%) | 4 (3.3%) |
| Foreign Born, not a Citizen | 14 (100.0%) | 0 (0.0%) |
Health Insurance Coverage by Household Income in Halbur
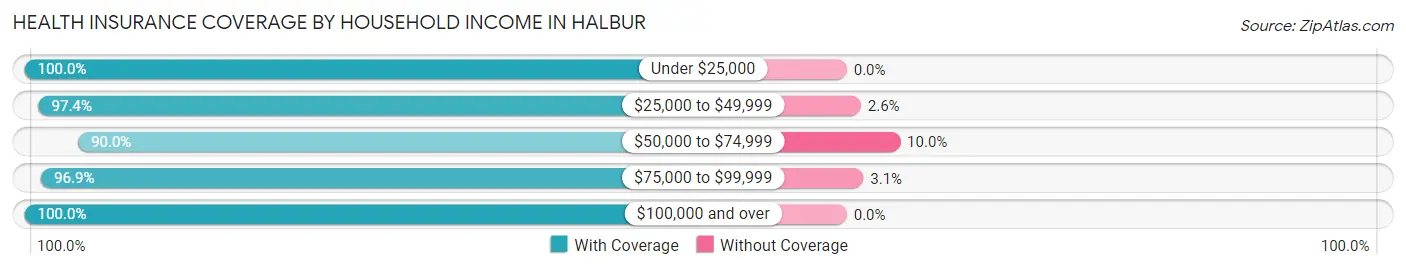
| Household Income | With Coverage | Without Coverage |
| Under $25,000 | 4 (100.0%) | 0 (0.0%) |
| $25,000 to $49,999 | 37 (97.4%) | 1 (2.6%) |
| $50,000 to $74,999 | 63 (90.0%) | 7 (10.0%) |
| $75,000 to $99,999 | 125 (96.9%) | 4 (3.1%) |
| $100,000 and over | 97 (100.0%) | 0 (0.0%) |
Public vs Private Health Insurance Coverage by Age in Halbur
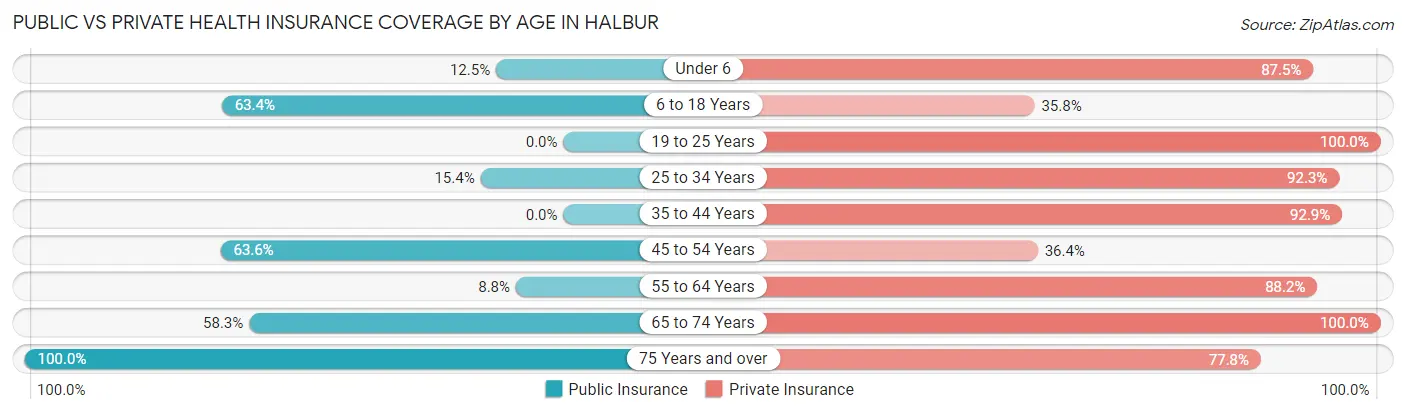
| Age Bracket | Public Insurance | Private Insurance |
| Under 6 | 1 (12.5%) | 7 (87.5%) |
| 6 to 18 Years | 78 (63.4%) | 44 (35.8%) |
| 19 to 25 Years | 0 (0.0%) | 14 (100.0%) |
| 25 to 34 Years | 8 (15.4%) | 48 (92.3%) |
| 35 to 44 Years | 0 (0.0%) | 39 (92.9%) |
| 45 to 54 Years | 28 (63.6%) | 16 (36.4%) |
| 55 to 64 Years | 3 (8.8%) | 30 (88.2%) |
| 65 to 74 Years | 7 (58.3%) | 12 (100.0%) |
| 75 Years and over | 9 (100.0%) | 7 (77.8%) |
| Total | 134 (39.6%) | 217 (64.2%) |
Disability Status by Sex by Age in Halbur
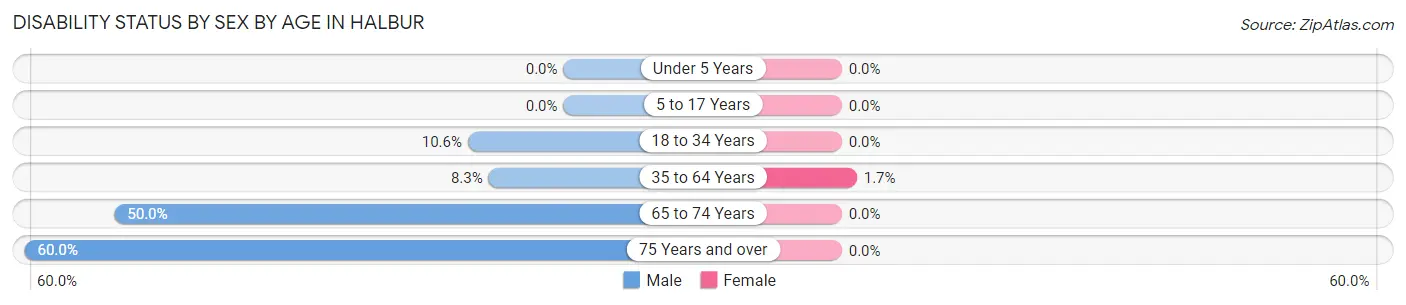
| Age Bracket | Male | Female |
| Under 5 Years | 0 (0.0%) | 0 (0.0%) |
| 5 to 17 Years | 0 (0.0%) | 0 (0.0%) |
| 18 to 34 Years | 5 (10.6%) | 0 (0.0%) |
| 35 to 64 Years | 5 (8.3%) | 1 (1.7%) |
| 65 to 74 Years | 5 (50.0%) | 0 (0.0%) |
| 75 Years and over | 3 (60.0%) | 0 (0.0%) |
Disability Class by Sex by Age in Halbur
Disability Class: Hearing Difficulty
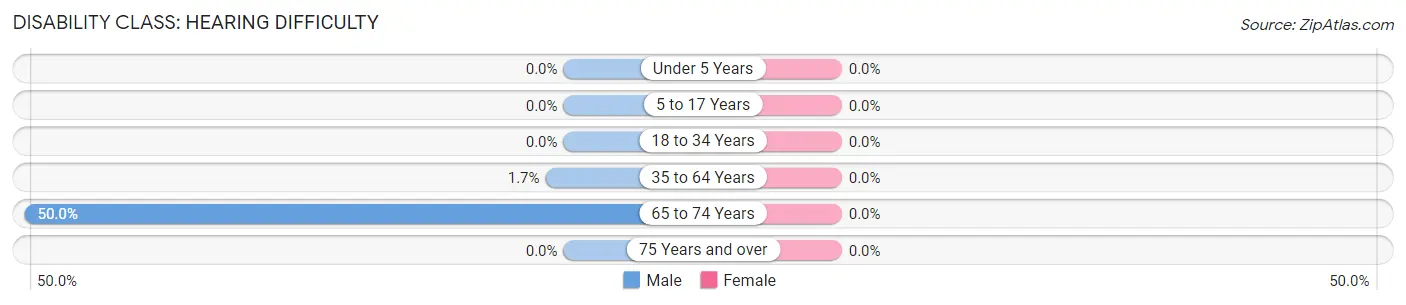
| Age Bracket | Male | Female |
| Under 5 Years | 0 (0.0%) | 0 (0.0%) |
| 5 to 17 Years | 0 (0.0%) | 0 (0.0%) |
| 18 to 34 Years | 0 (0.0%) | 0 (0.0%) |
| 35 to 64 Years | 1 (1.7%) | 0 (0.0%) |
| 65 to 74 Years | 5 (50.0%) | 0 (0.0%) |
| 75 Years and over | 0 (0.0%) | 0 (0.0%) |
Disability Class: Vision Difficulty
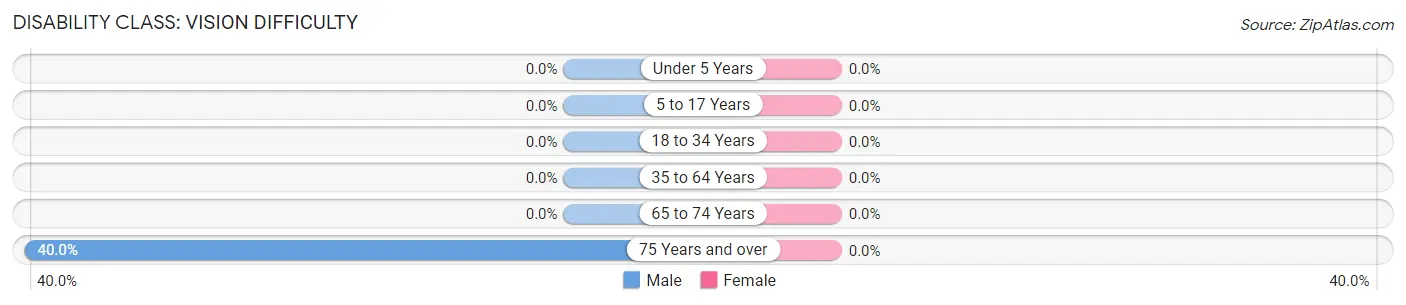
| Age Bracket | Male | Female |
| Under 5 Years | 0 (0.0%) | 0 (0.0%) |
| 5 to 17 Years | 0 (0.0%) | 0 (0.0%) |
| 18 to 34 Years | 0 (0.0%) | 0 (0.0%) |
| 35 to 64 Years | 0 (0.0%) | 0 (0.0%) |
| 65 to 74 Years | 0 (0.0%) | 0 (0.0%) |
| 75 Years and over | 2 (40.0%) | 0 (0.0%) |
Disability Class: Cognitive Difficulty
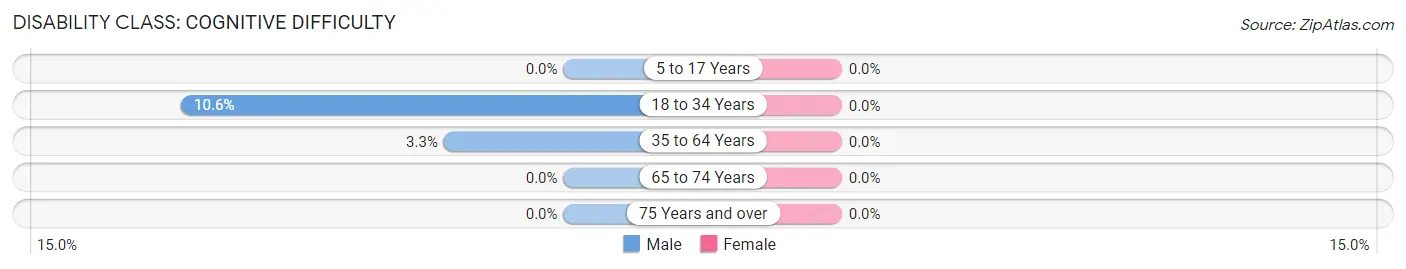
| Age Bracket | Male | Female |
| 5 to 17 Years | 0 (0.0%) | 0 (0.0%) |
| 18 to 34 Years | 5 (10.6%) | 0 (0.0%) |
| 35 to 64 Years | 2 (3.3%) | 0 (0.0%) |
| 65 to 74 Years | 0 (0.0%) | 0 (0.0%) |
| 75 Years and over | 0 (0.0%) | 0 (0.0%) |
Disability Class: Ambulatory Difficulty
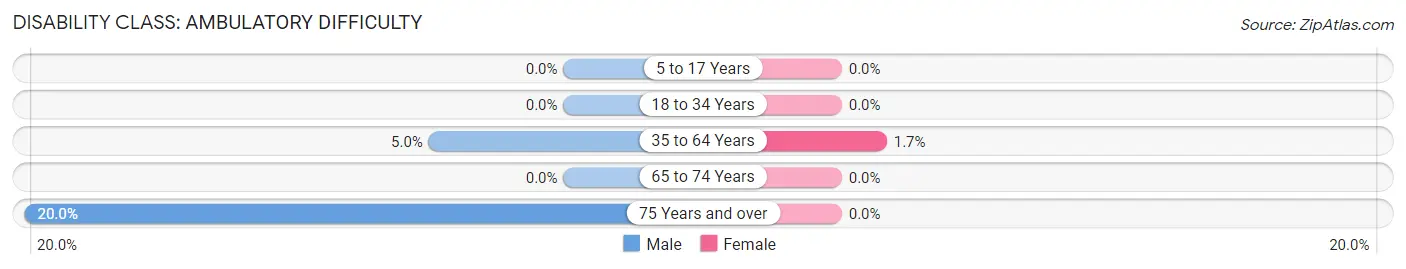
| Age Bracket | Male | Female |
| 5 to 17 Years | 0 (0.0%) | 0 (0.0%) |
| 18 to 34 Years | 0 (0.0%) | 0 (0.0%) |
| 35 to 64 Years | 3 (5.0%) | 1 (1.7%) |
| 65 to 74 Years | 0 (0.0%) | 0 (0.0%) |
| 75 Years and over | 1 (20.0%) | 0 (0.0%) |
Disability Class: Self-Care Difficulty
| Age Bracket | Male | Female |
| 5 to 17 Years | 0 (0.0%) | 0 (0.0%) |
| 18 to 34 Years | 0 (0.0%) | 0 (0.0%) |
| 35 to 64 Years | 0 (0.0%) | 0 (0.0%) |
| 65 to 74 Years | 0 (0.0%) | 0 (0.0%) |
| 75 Years and over | 0 (0.0%) | 0 (0.0%) |
Technology Access in Halbur
Computing Device Access in Halbur
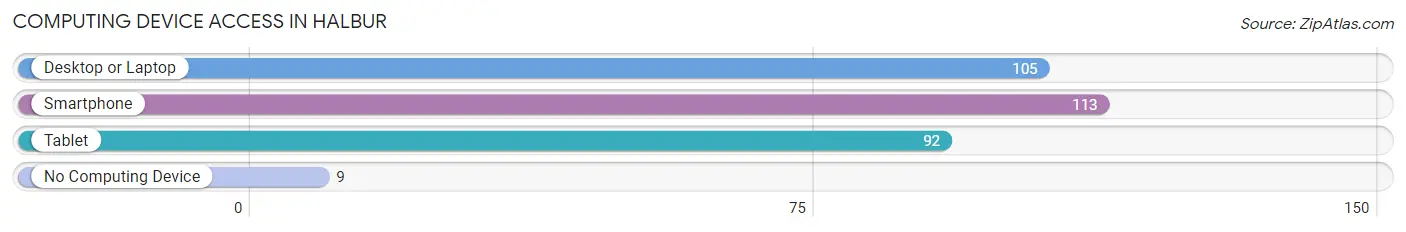
| Device Type | # Households | % Households |
| Desktop or Laptop | 105 | 81.4% |
| Smartphone | 113 | 87.6% |
| Tablet | 92 | 71.3% |
| No Computing Device | 9 | 7.0% |
| Total | 129 | 100.0% |
Internet Access in Halbur
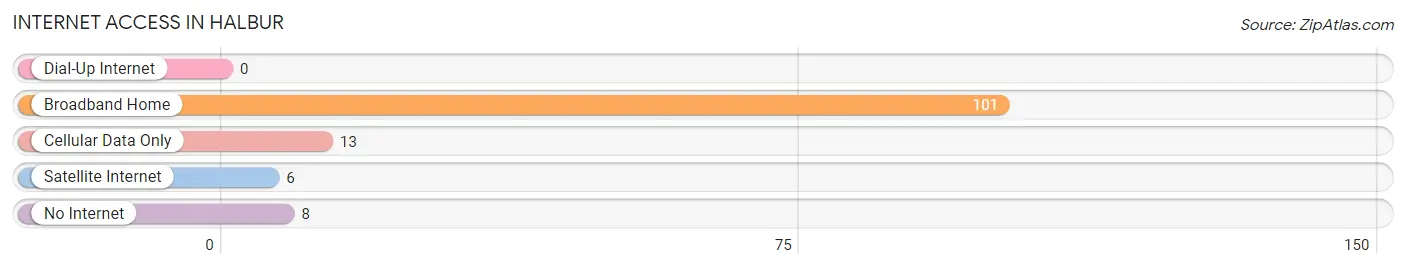
| Internet Type | # Households | % Households |
| Dial-Up Internet | 0 | 0.0% |
| Broadband Home | 101 | 78.3% |
| Cellular Data Only | 13 | 10.1% |
| Satellite Internet | 6 | 4.6% |
| No Internet | 8 | 6.2% |
| Total | 129 | 100.0% |
Halbur Summary
Halbur, Iowa is a small town located in the southwestern part of the state, in Carroll County. It is situated along the Middle Raccoon River, and is home to a population of just over 500 people. The town was founded in 1881, and was named after a local family who had settled in the area.
Geography
Halbur is located in the rolling hills of southwestern Iowa, and is situated along the Middle Raccoon River. The town is located at an elevation of 1,068 feet above sea level. The town is located in the Central Time Zone, and is about an hour and a half drive from Des Moines, the state capital. The town is surrounded by farmland, and is home to a variety of wildlife, including deer, wild turkeys, and other small game.
Economy
The economy of Halbur is largely based on agriculture. The town is home to several farms, and the surrounding area is used for growing corn, soybeans, and other crops. The town also has a few small businesses, including a grocery store, a hardware store, and a few restaurants. The town is also home to a few manufacturing companies, which produce a variety of products, including furniture, clothing, and other items.
Demographics
As of the 2010 census, the population of Halbur was 514 people. The racial makeup of the town was 97.3% White, 0.2% African American, 0.2% Native American, 0.4% Asian, 0.2% from other races, and 1.9% from two or more races. The median household income in Halbur was $45,000, and the median family income was $50,000. The per capita income in Halbur was $20,000.
History
Halbur was founded in 1881 by a group of settlers from Germany. The town was named after a local family who had settled in the area. The town was originally a farming community, and the surrounding area was used for growing corn, soybeans, and other crops. The town was also home to a few small businesses, including a grocery store, a hardware store, and a few restaurants.
In the early 1900s, Halbur was home to a large number of German immigrants, and the town was known for its German culture and traditions. The town was also home to a number of churches, including the St. John's Lutheran Church, which was founded in 1883.
In the late 20th century, Halbur began to experience a decline in population, as many of the town's residents moved away in search of better job opportunities. However, the town has seen a resurgence in recent years, as more people have moved to the area in search of a rural lifestyle.
Today, Halbur is a small town with a population of just over 500 people. The town is home to a variety of businesses, including a grocery store, a hardware store, and a few restaurants. The town is also home to a number of churches, and is known for its German culture and traditions.
Common Questions
What is Per Capita Income in Halbur?
Per Capita income in Halbur is $33,501.
What is the Median Family Income in Halbur?
Median Family Income in Halbur is $85,192.
What is the Median Household income in Halbur?
Median Household Income in Halbur is $80,536.
What is Income or Wage Gap in Halbur?
Income or Wage Gap in Halbur is 50.4%.
Women in Halbur earn 49.6 cents for every dollar earned by a man.
What is Inequality or Gini Index in Halbur?
Inequality or Gini Index in Halbur is 0.30.
What is the Total Population of Halbur?
Total Population of Halbur is 338.
What is the Total Male Population of Halbur?
Total Male Population of Halbur is 177.
What is the Total Female Population of Halbur?
Total Female Population of Halbur is 161.
What is the Ratio of Males per 100 Females in Halbur?
There are 109.94 Males per 100 Females in Halbur.
What is the Ratio of Females per 100 Males in Halbur?
There are 90.96 Females per 100 Males in Halbur.
What is the Median Population Age in Halbur?
Median Population Age in Halbur is 29.6 Years.
What is the Average Family Size in Halbur
Average Family Size in Halbur is 3.6 People.
What is the Average Household Size in Halbur
Average Household Size in Halbur is 2.6 People.
How Large is the Labor Force in Halbur?
There are 203 People in the Labor Forcein in Halbur.
What is the Percentage of People in the Labor Force in Halbur?
81.9% of People are in the Labor Force in Halbur.
What is the Unemployment Rate in Halbur?
Unemployment Rate in Halbur is 1.0%.