Bowdoinham, ME Map & Demographics
Bowdoinham Map
Bowdoinham Overview
$35,131
PER CAPITA INCOME
$89,647
AVG FAMILY INCOME
$88,590
AVG HOUSEHOLD INCOME
26.1%
WAGE / INCOME GAP [ % ]
73.9¢/ $1
WAGE / INCOME GAP [ $ ]
0.31
INEQUALITY / GINI INDEX
766
TOTAL POPULATION
384
MALE POPULATION
382
FEMALE POPULATION
100.52
MALES / 100 FEMALES
99.48
FEMALES / 100 MALES
43.0
MEDIAN AGE
3.1
AVG FAMILY SIZE
2.8
AVG HOUSEHOLD SIZE
368
LABOR FORCE [ PEOPLE ]
78.0%
PERCENT IN LABOR FORCE
0.5%
UNEMPLOYMENT RATE
Bowdoinham Zip Codes
Bowdoinham Area Codes
Income in Bowdoinham
Income Overview in Bowdoinham
Per Capita Income in Bowdoinham is $35,131, while median incomes of families and households are $89,647 and $88,590 respectively.
| Characteristic | Number | Measure |
| Per Capita Income | 766 | $35,131 |
| Median Family Income | 237 | $89,647 |
| Mean Family Income | 237 | $99,051 |
| Median Household Income | 270 | $88,590 |
| Mean Household Income | 270 | $94,291 |
| Income Deficit | 237 | $0 |
| Wage / Income Gap (%) | 766 | 26.09% |
| Wage / Income Gap ($) | 766 | 73.91¢ per $1 |
| Gini / Inequality Index | 766 | 0.31 |
Earnings by Sex in Bowdoinham
Average Earnings in Bowdoinham are $53,603, $71,583 for men and $52,904 for women, a difference of 26.1%.
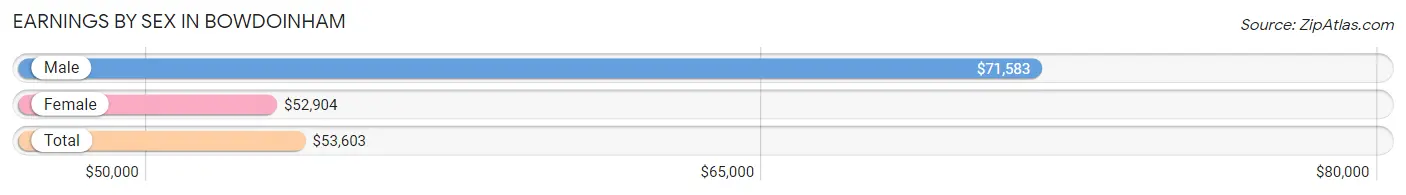
| Sex | Number | Average Earnings |
| Male | 217 (57.4%) | $71,583 |
| Female | 161 (42.6%) | $52,904 |
| Total | 378 (100.0%) | $53,603 |
Earnings by Sex by Income Bracket in Bowdoinham
The most common earnings brackets in Bowdoinham are $75,000 to $99,999 for men (59 | 27.2%) and $30,000 to $34,999 for women (34 | 21.1%).
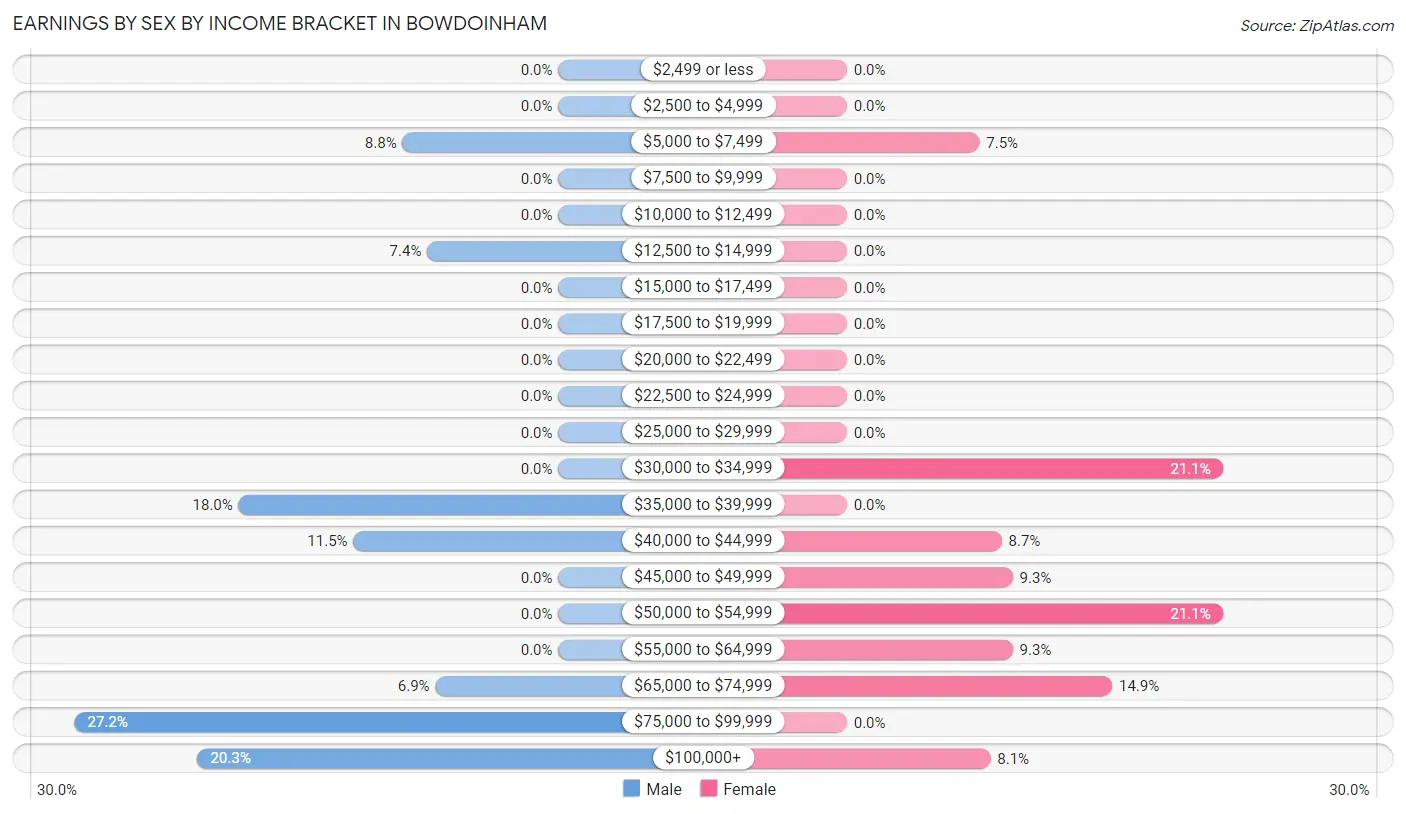
| Income | Male | Female |
| $2,499 or less | 0 (0.0%) | 0 (0.0%) |
| $2,500 to $4,999 | 0 (0.0%) | 0 (0.0%) |
| $5,000 to $7,499 | 19 (8.8%) | 12 (7.4%) |
| $7,500 to $9,999 | 0 (0.0%) | 0 (0.0%) |
| $10,000 to $12,499 | 0 (0.0%) | 0 (0.0%) |
| $12,500 to $14,999 | 16 (7.4%) | 0 (0.0%) |
| $15,000 to $17,499 | 0 (0.0%) | 0 (0.0%) |
| $17,500 to $19,999 | 0 (0.0%) | 0 (0.0%) |
| $20,000 to $22,499 | 0 (0.0%) | 0 (0.0%) |
| $22,500 to $24,999 | 0 (0.0%) | 0 (0.0%) |
| $25,000 to $29,999 | 0 (0.0%) | 0 (0.0%) |
| $30,000 to $34,999 | 0 (0.0%) | 34 (21.1%) |
| $35,000 to $39,999 | 39 (18.0%) | 0 (0.0%) |
| $40,000 to $44,999 | 25 (11.5%) | 14 (8.7%) |
| $45,000 to $49,999 | 0 (0.0%) | 15 (9.3%) |
| $50,000 to $54,999 | 0 (0.0%) | 34 (21.1%) |
| $55,000 to $64,999 | 0 (0.0%) | 15 (9.3%) |
| $65,000 to $74,999 | 15 (6.9%) | 24 (14.9%) |
| $75,000 to $99,999 | 59 (27.2%) | 0 (0.0%) |
| $100,000+ | 44 (20.3%) | 13 (8.1%) |
| Total | 217 (100.0%) | 161 (100.0%) |
Earnings by Sex by Educational Attainment in Bowdoinham
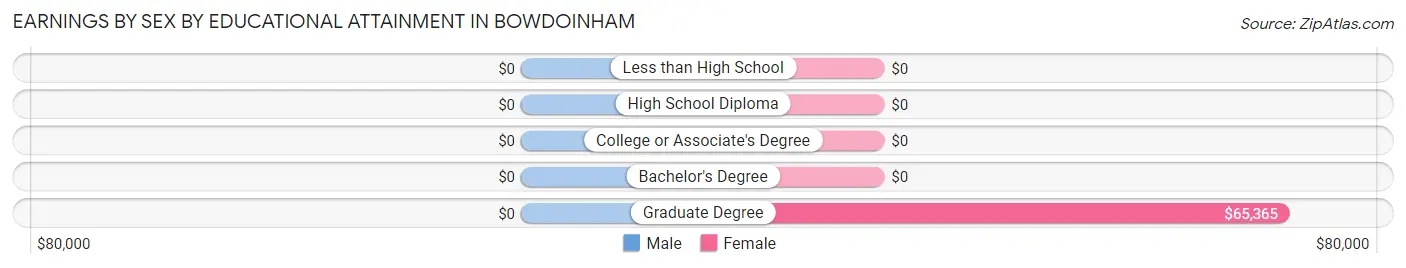
| Educational Attainment | Male Income | Female Income |
| Less than High School | - | - |
| High School Diploma | - | - |
| College or Associate's Degree | - | - |
| Bachelor's Degree | - | - |
| Graduate Degree | - | - |
| Total | $71,583 | $52,904 |
Family Income in Bowdoinham
Family Income Brackets in Bowdoinham
According to the Bowdoinham family income data, there are 89 families falling into the $100,000 to $149,999 income range, which is the most common income bracket and makes up 37.6% of all families.
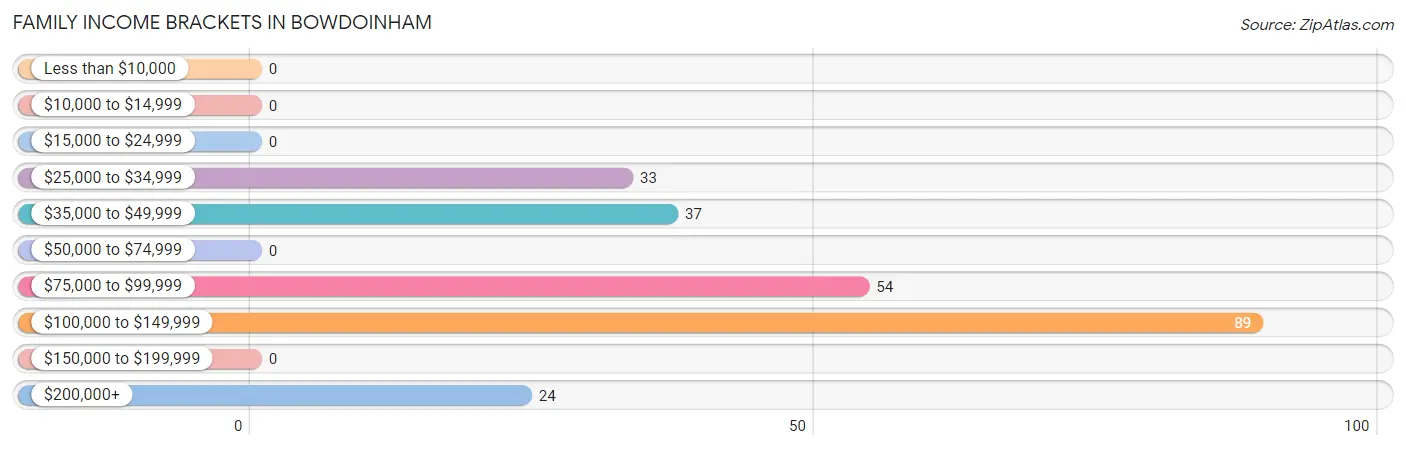
| Income Bracket | # Families | % Families |
| Less than $10,000 | 0 | 0.0% |
| $10,000 to $14,999 | 0 | 0.0% |
| $15,000 to $24,999 | 0 | 0.0% |
| $25,000 to $34,999 | 33 | 13.9% |
| $35,000 to $49,999 | 37 | 15.6% |
| $50,000 to $74,999 | 0 | 0.0% |
| $75,000 to $99,999 | 54 | 22.8% |
| $100,000 to $149,999 | 89 | 37.6% |
| $150,000 to $199,999 | 0 | 0.0% |
| $200,000+ | 24 | 10.1% |
Family Income by Famaliy Size in Bowdoinham
2-person families (126 | 53.2%) account for the highest median family income in Bowdoinham with $95,000 per family, while 2-person families (126 | 53.2%) have the highest median income of $47,500 per family member.
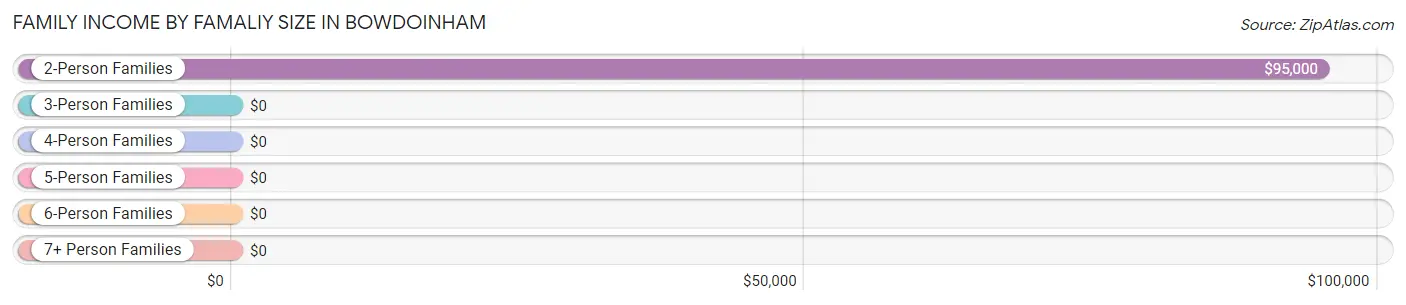
| Income Bracket | # Families | Median Income |
| 2-Person Families | 126 (53.2%) | $95,000 |
| 3-Person Families | 0 (0.0%) | $0 |
| 4-Person Families | 111 (46.8%) | $0 |
| 5-Person Families | 0 (0.0%) | $0 |
| 6-Person Families | 0 (0.0%) | $0 |
| 7+ Person Families | 0 (0.0%) | $0 |
| Total | 237 (100.0%) | $89,647 |
Family Income by Number of Earners in Bowdoinham
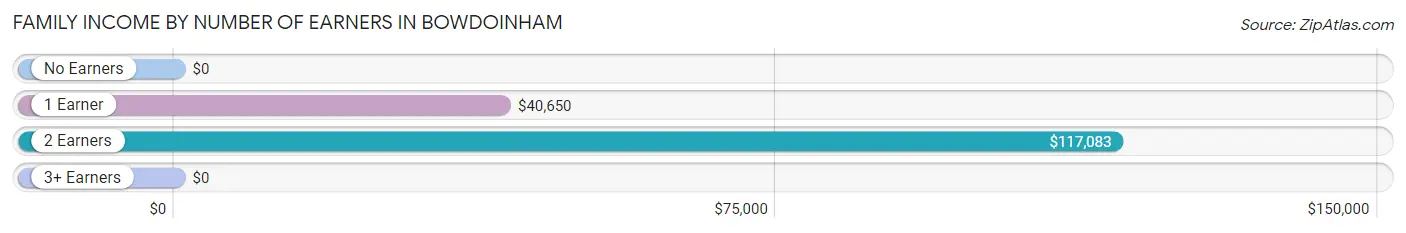
| Number of Earners | # Families | Median Income |
| No Earners | 25 (10.5%) | $0 |
| 1 Earner | 79 (33.3%) | $40,650 |
| 2 Earners | 133 (56.1%) | $117,083 |
| 3+ Earners | 0 (0.0%) | $0 |
| Total | 237 (100.0%) | $89,647 |
Household Income in Bowdoinham
Household Income Brackets in Bowdoinham
With 89 households falling in the category, the $100,000 to $149,999 income range is the most frequent in Bowdoinham, accounting for 33.0% of all households.
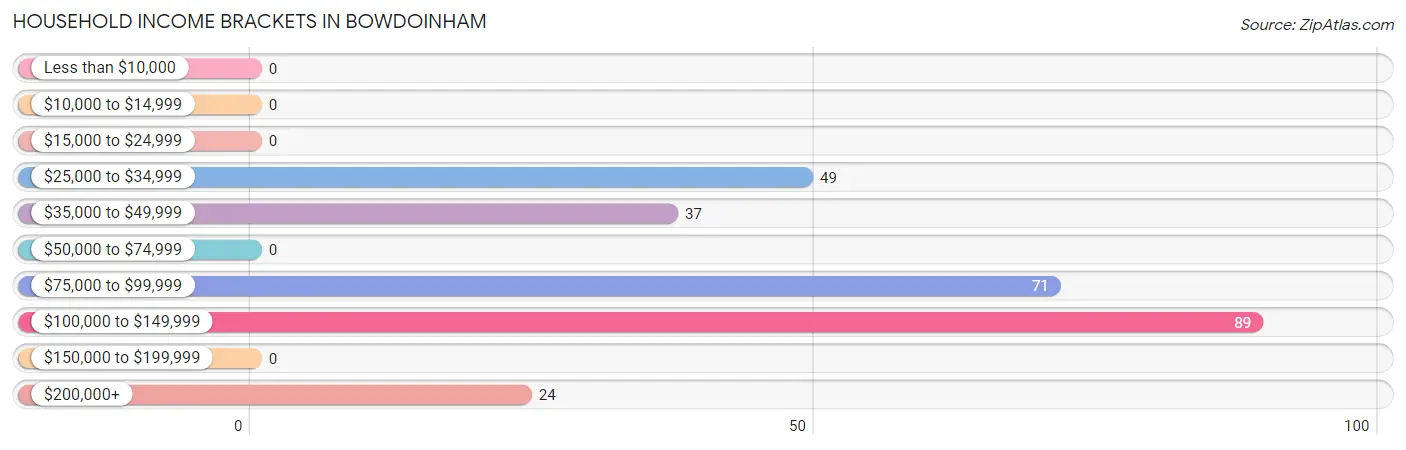
| Income Bracket | # Households | % Households |
| Less than $10,000 | 0 | 0.0% |
| $10,000 to $14,999 | 0 | 0.0% |
| $15,000 to $24,999 | 0 | 0.0% |
| $25,000 to $34,999 | 49 | 18.1% |
| $35,000 to $49,999 | 37 | 13.7% |
| $50,000 to $74,999 | 0 | 0.0% |
| $75,000 to $99,999 | 71 | 26.3% |
| $100,000 to $149,999 | 89 | 33.0% |
| $150,000 to $199,999 | 0 | 0.0% |
| $200,000+ | 24 | 8.9% |
Household Income by Householder Age in Bowdoinham
The median household income in Bowdoinham is $88,590, with the highest median household income of $88,590 found in the 45 to 64 years age bracket for the primary householder. A total of 98 households (36.3%) fall into this category.
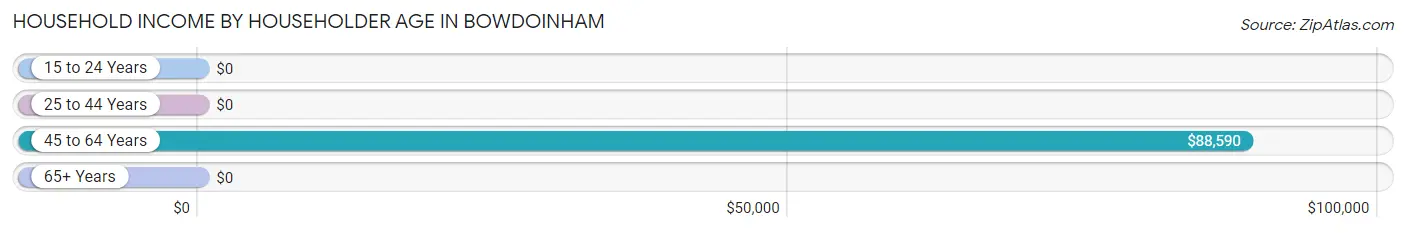
| Income Bracket | # Households | Median Income |
| 15 to 24 Years | 0 (0.0%) | $0 |
| 25 to 44 Years | 98 (36.3%) | $0 |
| 45 to 64 Years | 98 (36.3%) | $88,590 |
| 65+ Years | 74 (27.4%) | $0 |
| Total | 270 (100.0%) | $88,590 |
Poverty in Bowdoinham
Income Below Poverty by Sex and Age in Bowdoinham
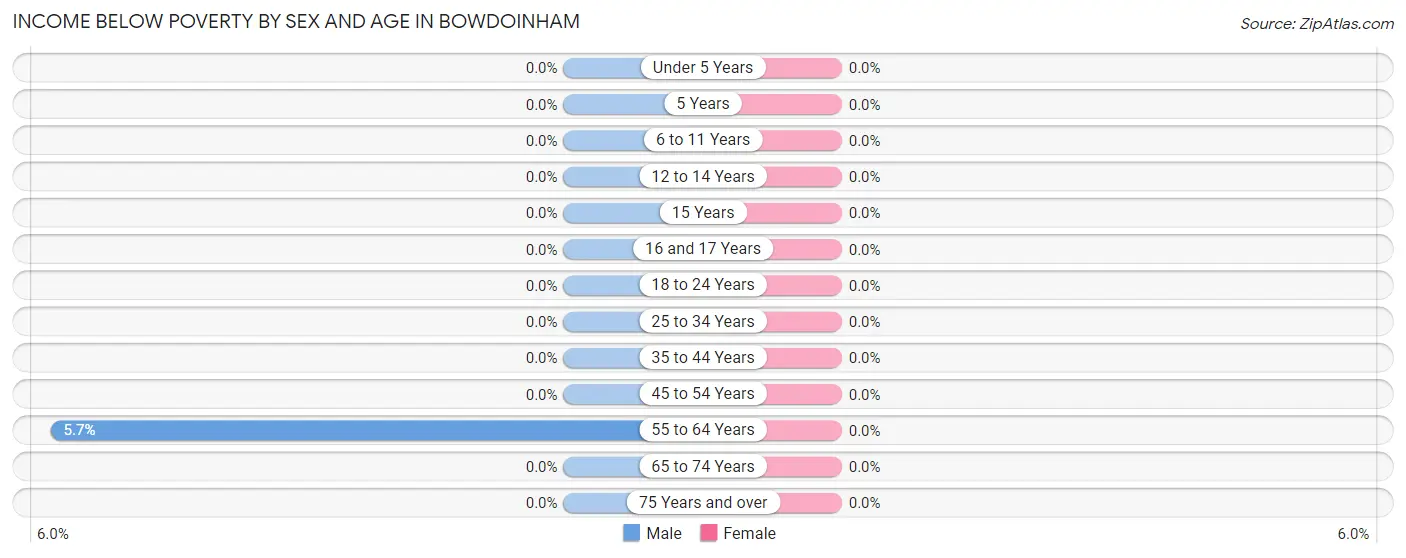
| Age Bracket | Male | Female |
| Under 5 Years | 0 (0.0%) | 0 (0.0%) |
| 5 Years | 0 (0.0%) | 0 (0.0%) |
| 6 to 11 Years | 0 (0.0%) | 0 (0.0%) |
| 12 to 14 Years | 0 (0.0%) | 0 (0.0%) |
| 15 Years | 0 (0.0%) | 0 (0.0%) |
| 16 and 17 Years | 0 (0.0%) | 0 (0.0%) |
| 18 to 24 Years | 0 (0.0%) | 0 (0.0%) |
| 25 to 34 Years | 0 (0.0%) | 0 (0.0%) |
| 35 to 44 Years | 0 (0.0%) | 0 (0.0%) |
| 45 to 54 Years | 0 (0.0%) | 0 (0.0%) |
| 55 to 64 Years | 2 (5.7%) | 0 (0.0%) |
| 65 to 74 Years | 0 (0.0%) | 0 (0.0%) |
| 75 Years and over | 0 (0.0%) | 0 (0.0%) |
| Total | 2 (0.5%) | 0 (0.0%) |
Income Above Poverty by Sex and Age in Bowdoinham
According to the poverty statistics in Bowdoinham, males aged under 5 years and females aged 5 years are the age groups that are most secure financially, with 100.0% of males and 100.0% of females in these age groups living above the poverty line.
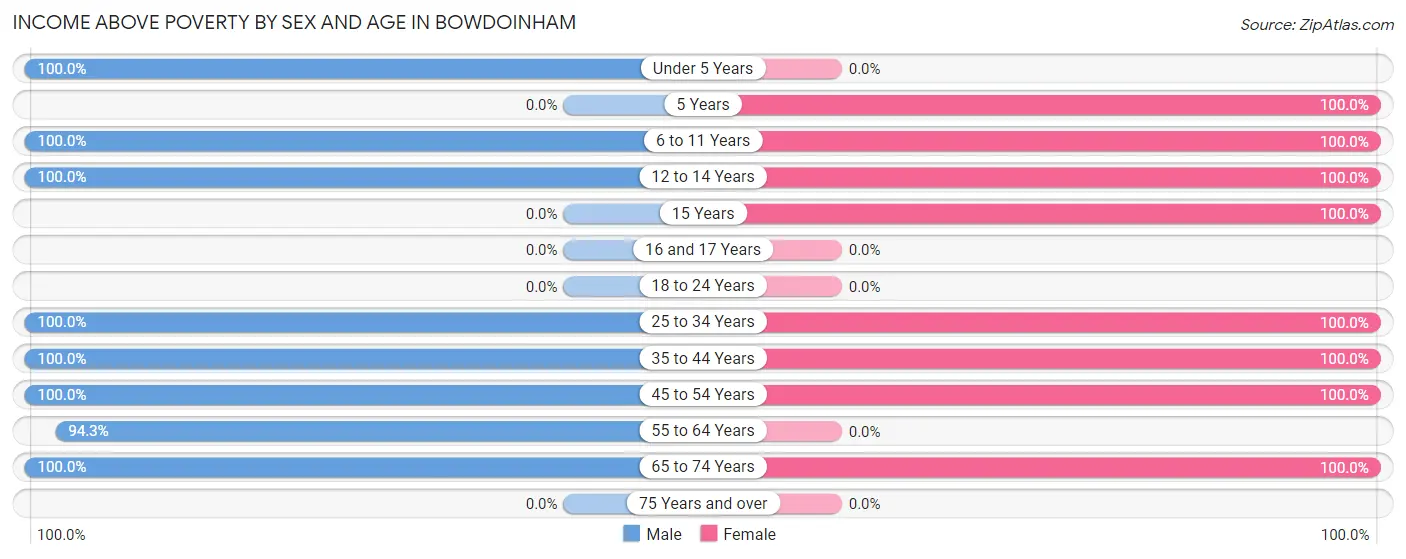
| Age Bracket | Male | Female |
| Under 5 Years | 16 (100.0%) | 0 (0.0%) |
| 5 Years | 0 (0.0%) | 15 (100.0%) |
| 6 to 11 Years | 37 (100.0%) | 73 (100.0%) |
| 12 to 14 Years | 59 (100.0%) | 42 (100.0%) |
| 15 Years | 0 (0.0%) | 52 (100.0%) |
| 16 and 17 Years | 0 (0.0%) | 0 (0.0%) |
| 18 to 24 Years | 0 (0.0%) | 0 (0.0%) |
| 25 to 34 Years | 15 (100.0%) | 15 (100.0%) |
| 35 to 44 Years | 55 (100.0%) | 58 (100.0%) |
| 45 to 54 Years | 78 (100.0%) | 76 (100.0%) |
| 55 to 64 Years | 33 (94.3%) | 0 (0.0%) |
| 65 to 74 Years | 89 (100.0%) | 51 (100.0%) |
| 75 Years and over | 0 (0.0%) | 0 (0.0%) |
| Total | 382 (99.5%) | 382 (100.0%) |
Income Below Poverty Among Married-Couple Families in Bowdoinham
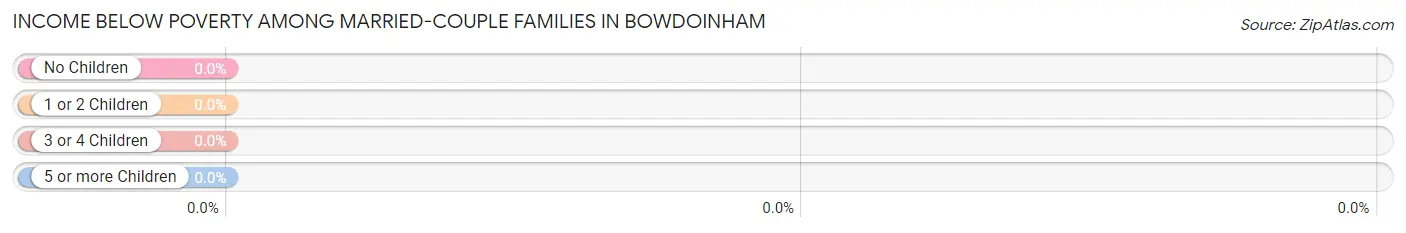
| Children | Above Poverty | Below Poverty |
| No Children | 126 (100.0%) | 0 (0.0%) |
| 1 or 2 Children | 65 (100.0%) | 0 (0.0%) |
| 3 or 4 Children | 0 (0.0%) | 0 (0.0%) |
| 5 or more Children | 0 (0.0%) | 0 (0.0%) |
| Total | 191 (100.0%) | 0 (0.0%) |
Income Below Poverty Among Single-Parent Households in Bowdoinham
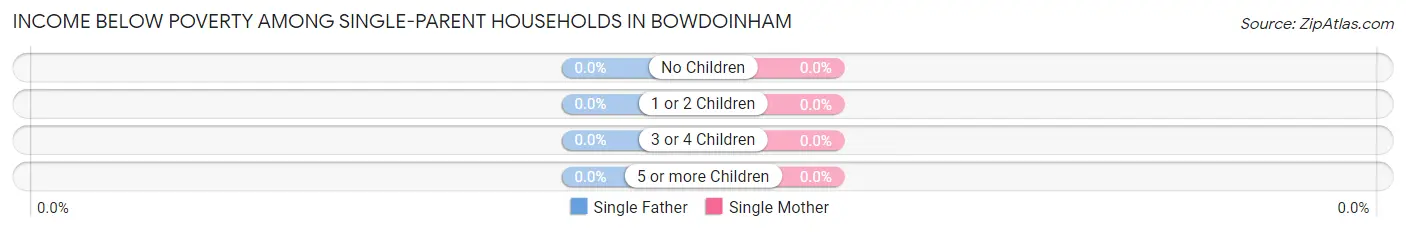
| Children | Single Father | Single Mother |
| No Children | 0 (0.0%) | 0 (0.0%) |
| 1 or 2 Children | 0 (0.0%) | 0 (0.0%) |
| 3 or 4 Children | 0 (0.0%) | 0 (0.0%) |
| 5 or more Children | 0 (0.0%) | 0 (0.0%) |
| Total | 0 (0.0%) | 0 (0.0%) |
Income Below Poverty Among Married-Couple vs Single-Parent Households in Bowdoinham
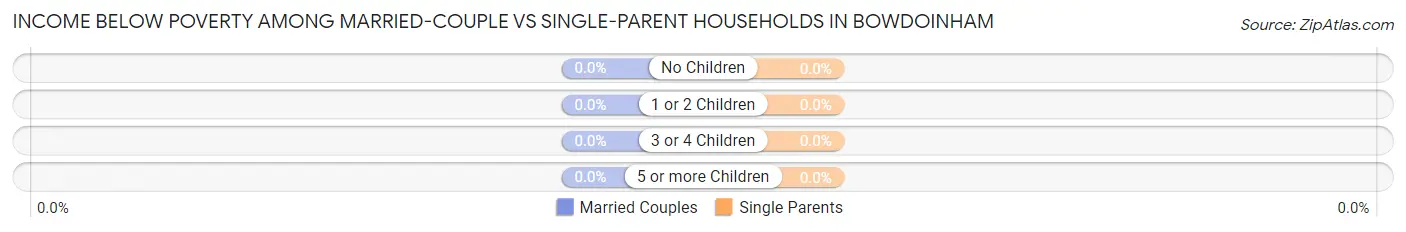
| Children | Married-Couple Families | Single-Parent Households |
| No Children | 0 (0.0%) | 0 (0.0%) |
| 1 or 2 Children | 0 (0.0%) | 0 (0.0%) |
| 3 or 4 Children | 0 (0.0%) | 0 (0.0%) |
| 5 or more Children | 0 (0.0%) | 0 (0.0%) |
| Total | 0 (0.0%) | 0 (0.0%) |
Race in Bowdoinham
The most populous races in Bowdoinham are White / Caucasian (698 | 91.1%), Black / African American (43 | 5.6%), and Two or more Races (20 | 2.6%).
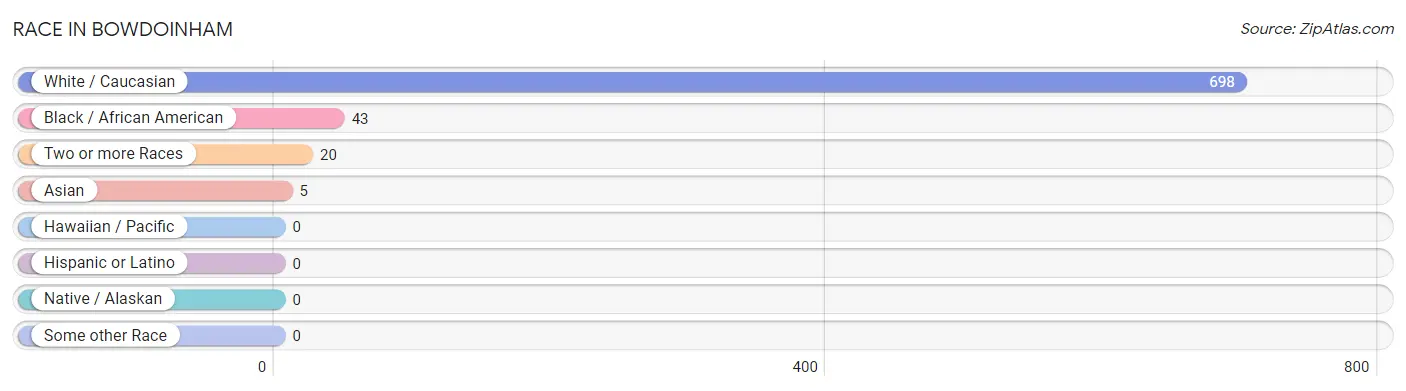
| Race | # Population | % Population |
| Asian | 5 | 0.6% |
| Black / African American | 43 | 5.6% |
| Hawaiian / Pacific | 0 | 0.0% |
| Hispanic or Latino | 0 | 0.0% |
| Native / Alaskan | 0 | 0.0% |
| White / Caucasian | 698 | 91.1% |
| Two or more Races | 20 | 2.6% |
| Some other Race | 0 | 0.0% |
| Total | 766 | 100.0% |
Ancestry in Bowdoinham
The most populous ancestries reported in Bowdoinham are Irish (129 | 16.8%), French (98 | 12.8%), French Canadian (91 | 11.9%), English (82 | 10.7%), and Polish (77 | 10.1%), together accounting for 62.3% of all Bowdoinham residents.
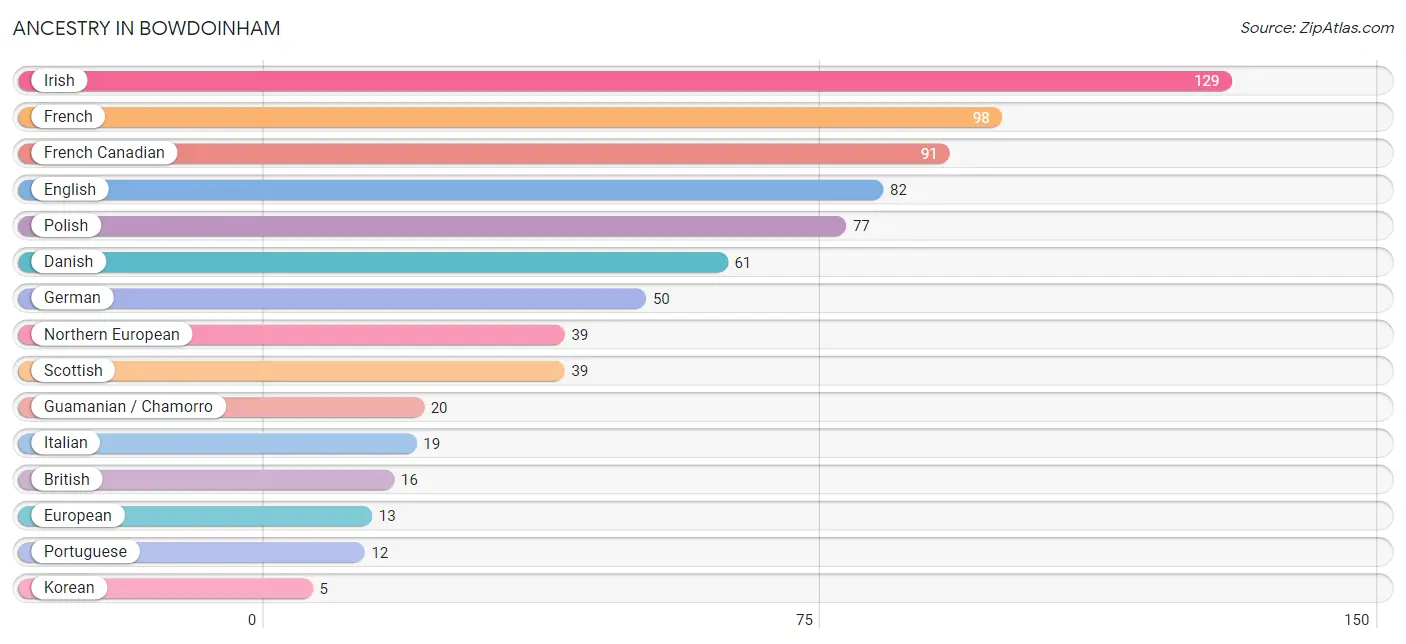
| Ancestry | # Population | % Population |
| British | 16 | 2.1% |
| Danish | 61 | 8.0% |
| English | 82 | 10.7% |
| European | 13 | 1.7% |
| French | 98 | 12.8% |
| French Canadian | 91 | 11.9% |
| German | 50 | 6.5% |
| Guamanian / Chamorro | 20 | 2.6% |
| Irish | 129 | 16.8% |
| Italian | 19 | 2.5% |
| Korean | 5 | 0.6% |
| Northern European | 39 | 5.1% |
| Polish | 77 | 10.1% |
| Portuguese | 12 | 1.6% |
| Scottish | 39 | 5.1% | View All 15 Rows |
Immigrants in Bowdoinham
The most numerous immigrant groups reported in Bowdoinham came from Asia (5 | 0.6%), Philippines (5 | 0.6%), and South Eastern Asia (5 | 0.6%), together accounting for 1.9% of all Bowdoinham residents.
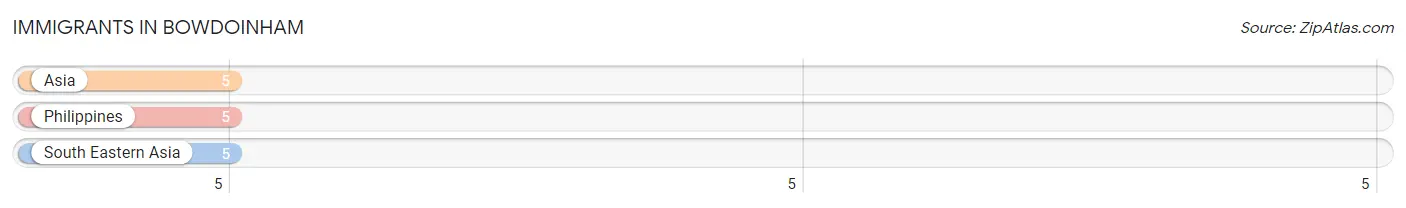
| Immigration Origin | # Population | % Population |
| Asia | 5 | 0.6% |
| Philippines | 5 | 0.6% |
| South Eastern Asia | 5 | 0.6% | View All 3 Rows |
Sex and Age in Bowdoinham
Sex and Age in Bowdoinham
The most populous age groups in Bowdoinham are 10 to 14 Years (96 | 25.0%) for men and 5 to 9 Years (88 | 23.0%) for women.
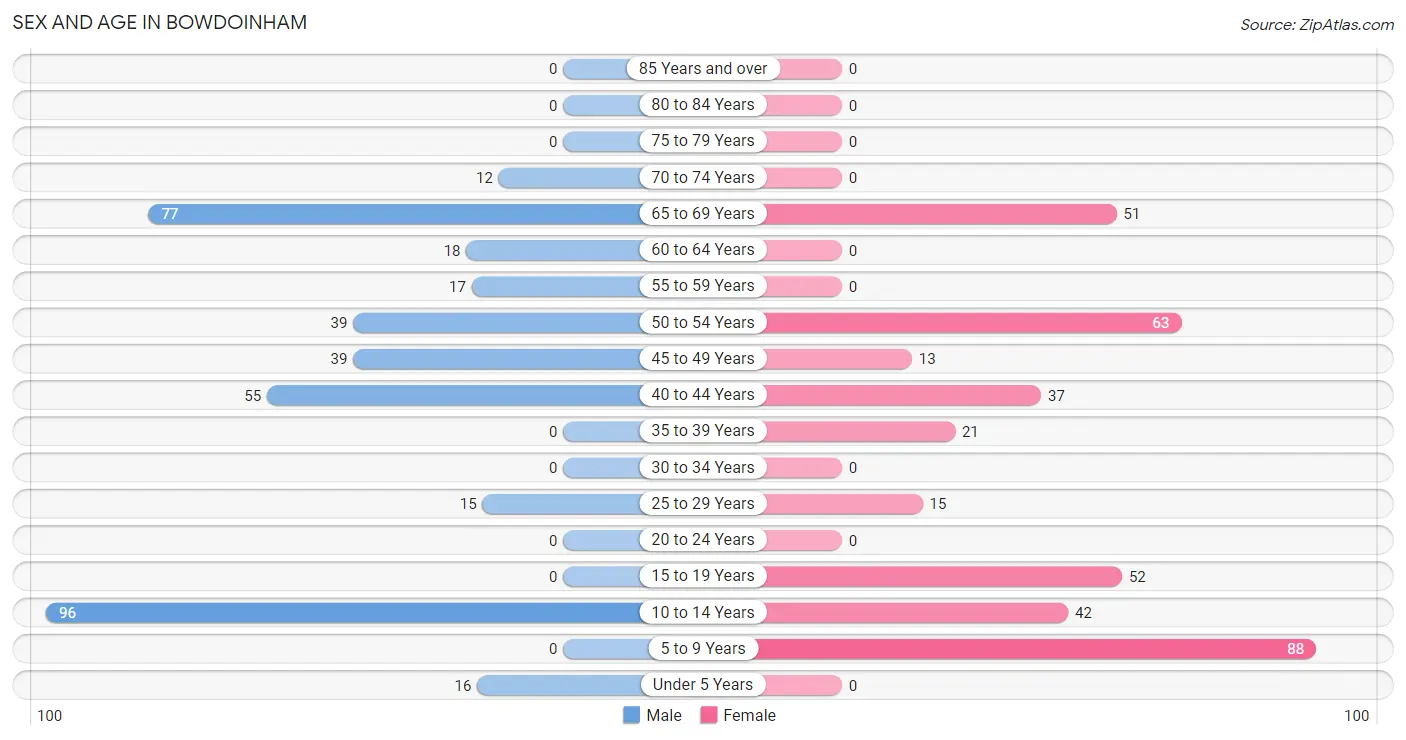
| Age Bracket | Male | Female |
| Under 5 Years | 16 (4.2%) | 0 (0.0%) |
| 5 to 9 Years | 0 (0.0%) | 88 (23.0%) |
| 10 to 14 Years | 96 (25.0%) | 42 (11.0%) |
| 15 to 19 Years | 0 (0.0%) | 52 (13.6%) |
| 20 to 24 Years | 0 (0.0%) | 0 (0.0%) |
| 25 to 29 Years | 15 (3.9%) | 15 (3.9%) |
| 30 to 34 Years | 0 (0.0%) | 0 (0.0%) |
| 35 to 39 Years | 0 (0.0%) | 21 (5.5%) |
| 40 to 44 Years | 55 (14.3%) | 37 (9.7%) |
| 45 to 49 Years | 39 (10.2%) | 13 (3.4%) |
| 50 to 54 Years | 39 (10.2%) | 63 (16.5%) |
| 55 to 59 Years | 17 (4.4%) | 0 (0.0%) |
| 60 to 64 Years | 18 (4.7%) | 0 (0.0%) |
| 65 to 69 Years | 77 (20.1%) | 51 (13.4%) |
| 70 to 74 Years | 12 (3.1%) | 0 (0.0%) |
| 75 to 79 Years | 0 (0.0%) | 0 (0.0%) |
| 80 to 84 Years | 0 (0.0%) | 0 (0.0%) |
| 85 Years and over | 0 (0.0%) | 0 (0.0%) |
| Total | 384 (100.0%) | 382 (100.0%) |
Families and Households in Bowdoinham
Median Family Size in Bowdoinham
The median family size in Bowdoinham is 3.08 persons per family, with single female/mother families (21 | 8.9%) accounting for the largest median family size of 3.81 persons per family. On the other hand, married-couple families (191 | 80.6%) represent the smallest median family size with 2.92 persons per family.
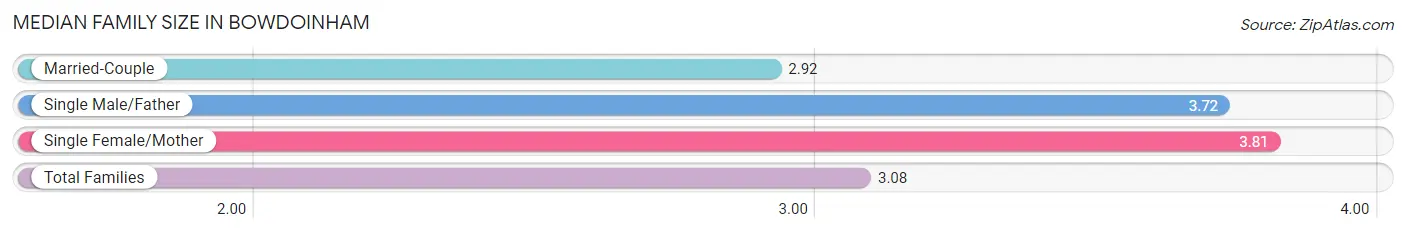
| Family Type | # Families | Family Size |
| Married-Couple | 191 (80.6%) | 2.92 |
| Single Male/Father | 25 (10.5%) | 3.72 |
| Single Female/Mother | 21 (8.9%) | 3.81 |
| Total Families | 237 (100.0%) | 3.08 |
Median Household Size in Bowdoinham

| Household Type | # Households | Household Size |
| Married-Couple | 191 (70.7%) | 2.92 |
| Single Male/Father | 25 (9.3%) | 3.72 |
| Single Female/Mother | 21 (7.8%) | 3.81 |
| Non-family | 33 (12.2%) | - |
| Total Households | 270 (100.0%) | 2.83 |
Household Size by Marriage Status in Bowdoinham
Out of a total of 270 households in Bowdoinham, 237 (87.8%) are family households, while 33 (12.2%) are nonfamily households. The most numerous type of family households are 2-person households, comprising 126, and the most common type of nonfamily households are 1-person households, comprising 33.
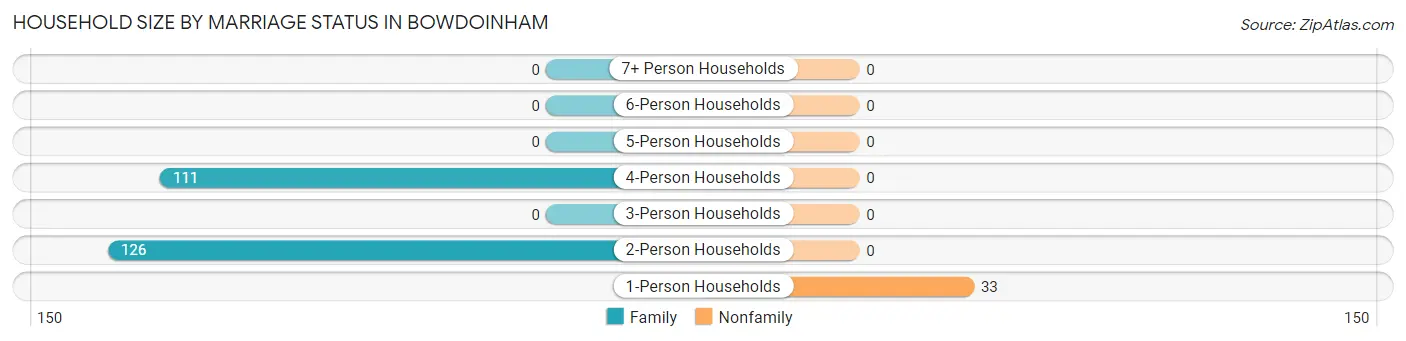
| Household Size | Family Households | Nonfamily Households |
| 1-Person Households | - | 33 (12.2%) |
| 2-Person Households | 126 (46.7%) | 0 (0.0%) |
| 3-Person Households | 0 (0.0%) | 0 (0.0%) |
| 4-Person Households | 111 (41.1%) | 0 (0.0%) |
| 5-Person Households | 0 (0.0%) | 0 (0.0%) |
| 6-Person Households | 0 (0.0%) | 0 (0.0%) |
| 7+ Person Households | 0 (0.0%) | 0 (0.0%) |
| Total | 237 (87.8%) | 33 (12.2%) |
Female Fertility in Bowdoinham
Fertility by Age in Bowdoinham
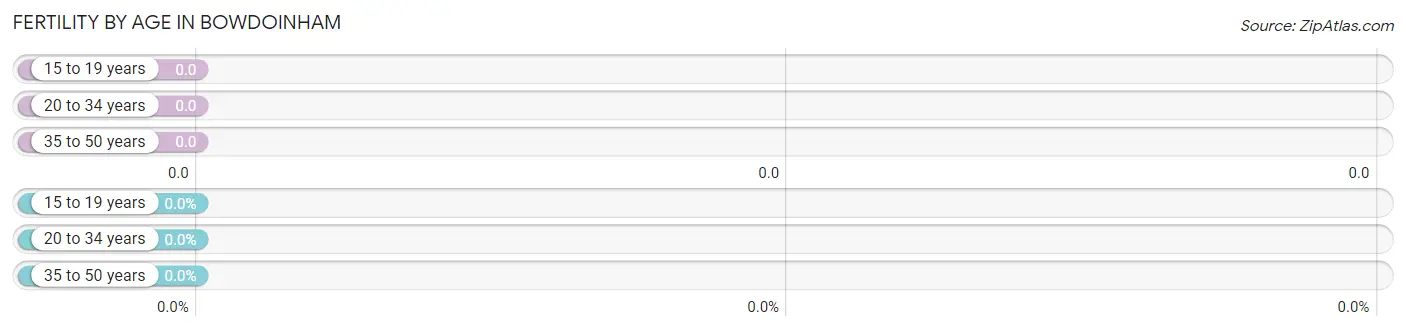
| Age Bracket | Women with Births | Births / 1,000 Women |
| 15 to 19 years | 0 (0.0%) | 0.0 |
| 20 to 34 years | 0 (0.0%) | 0.0 |
| 35 to 50 years | 0 (0.0%) | 0.0 |
| Total | 0 (0.0%) | 0.0 |
Fertility by Age by Marriage Status in Bowdoinham
| Age Bracket | Married | Unmarried |
| 15 to 19 years | 0 (0.0%) | 0 (0.0%) |
| 20 to 34 years | 0 (0.0%) | 0 (0.0%) |
| 35 to 50 years | 0 (0.0%) | 0 (0.0%) |
| Total | 0 (0.0%) | 0 (0.0%) |
Fertility by Education in Bowdoinham
| Educational Attainment | Women with Births | Births / 1,000 Women |
| Less than High School | 0 (0.0%) | 0.0 |
| High School Diploma | 0 (0.0%) | 0.0 |
| College or Associate's Degree | 0 (0.0%) | 0.0 |
| Bachelor's Degree | 0 (0.0%) | 0.0 |
| Graduate Degree | 0 (0.0%) | 0.0 |
| Total | 0 (0.0%) | 0.0 |
Fertility by Education by Marriage Status in Bowdoinham
| Educational Attainment | Married | Unmarried |
| Less than High School | 0 (0.0%) | 0 (0.0%) |
| High School Diploma | 0 (0.0%) | 0 (0.0%) |
| College or Associate's Degree | 0 (0.0%) | 0 (0.0%) |
| Bachelor's Degree | 0 (0.0%) | 0 (0.0%) |
| Graduate Degree | 0 (0.0%) | 0 (0.0%) |
| Total | 0 (0.0%) | 0 (0.0%) |
Employment Characteristics in Bowdoinham
Employment by Class of Employer in Bowdoinham
Among the 366 employed individuals in Bowdoinham, private company employees (145 | 39.6%), not-for-profit organizations (85 | 23.2%), and local government employees (80 | 21.9%) make up the most common classes of employment.
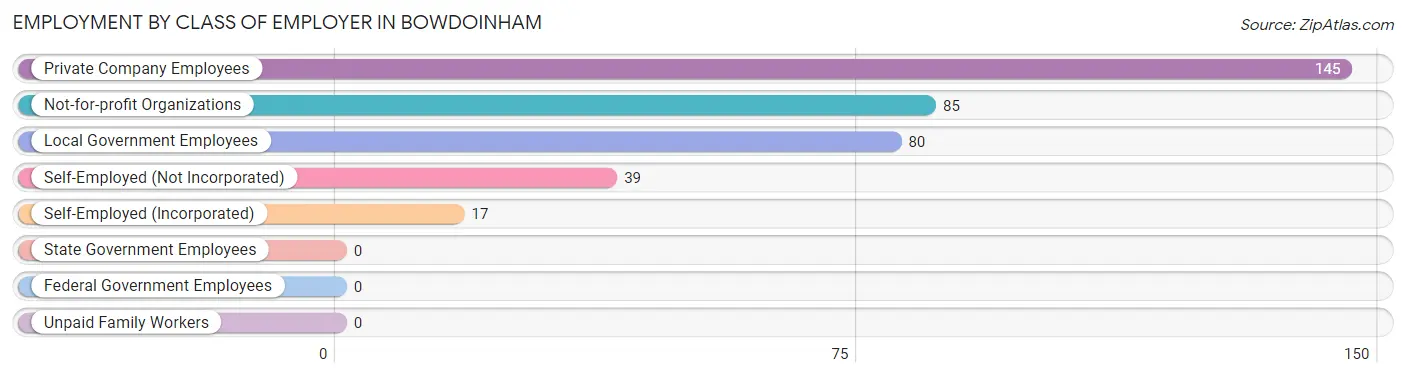
| Employer Class | # Employees | % Employees |
| Private Company Employees | 145 | 39.6% |
| Self-Employed (Incorporated) | 17 | 4.6% |
| Self-Employed (Not Incorporated) | 39 | 10.7% |
| Not-for-profit Organizations | 85 | 23.2% |
| Local Government Employees | 80 | 21.9% |
| State Government Employees | 0 | 0.0% |
| Federal Government Employees | 0 | 0.0% |
| Unpaid Family Workers | 0 | 0.0% |
| Total | 366 | 100.0% |
Employment Status by Age in Bowdoinham
According to the labor force statistics for Bowdoinham, out of the total population over 16 years of age (472), 78.0% or 368 individuals are in the labor force, with 0.5% or 2 of them unemployed. The age group with the highest labor force participation rate is 25 to 29 years, with 100.0% or 30 individuals in the labor force. Within the labor force, the 60 to 64 years age range has the highest percentage of unemployed individuals, with 11.1% or 2 of them being unemployed.
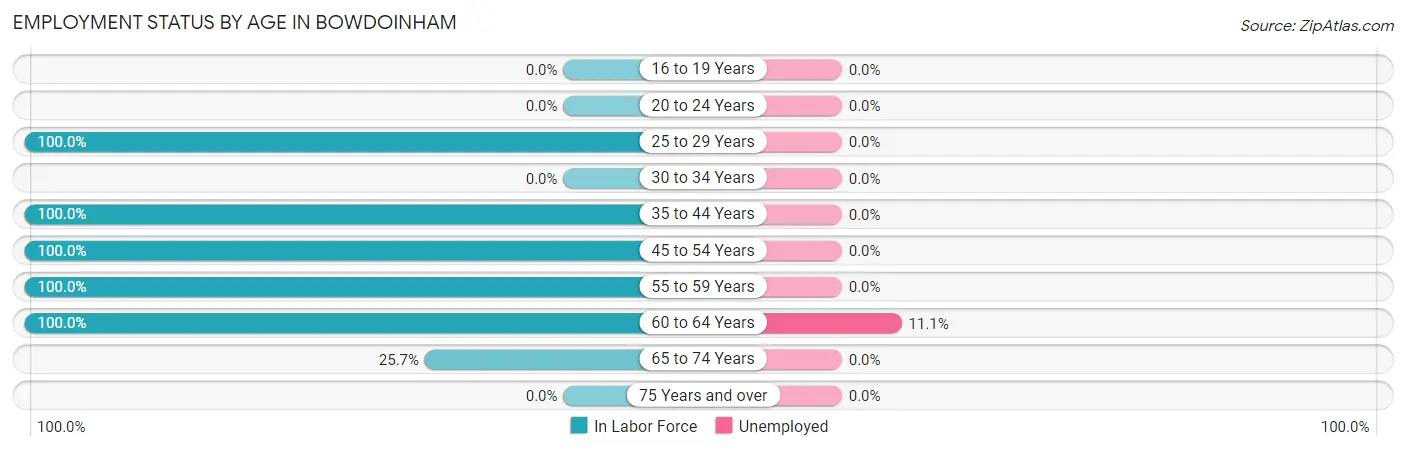
| Age Bracket | In Labor Force | Unemployed |
| 16 to 19 Years | 0 (0.0%) | 0 (0.0%) |
| 20 to 24 Years | 0 (0.0%) | 0 (0.0%) |
| 25 to 29 Years | 30 (100.0%) | 0 (0.0%) |
| 30 to 34 Years | 0 (0.0%) | 0 (0.0%) |
| 35 to 44 Years | 113 (100.0%) | 0 (0.0%) |
| 45 to 54 Years | 154 (100.0%) | 0 (0.0%) |
| 55 to 59 Years | 17 (100.0%) | 0 (0.0%) |
| 60 to 64 Years | 18 (100.0%) | 2 (11.1%) |
| 65 to 74 Years | 36 (25.7%) | 0 (0.0%) |
| 75 Years and over | 0 (0.0%) | 0 (0.0%) |
| Total | 368 (78.0%) | 2 (0.5%) |
Employment Status by Educational Attainment in Bowdoinham
According to labor force statistics for Bowdoinham, 100.0% of individuals (332) out of the total population between 25 and 64 years of age (332) are in the labor force, with 0.6% or 2 of them being unemployed. The group with the highest labor force participation rate are those with the educational attainment of high school diploma, with 100.0% or 82 individuals in the labor force. Within the labor force, individuals with high school diploma education have the highest percentage of unemployment, with 2.4% or 2 of them being unemployed.
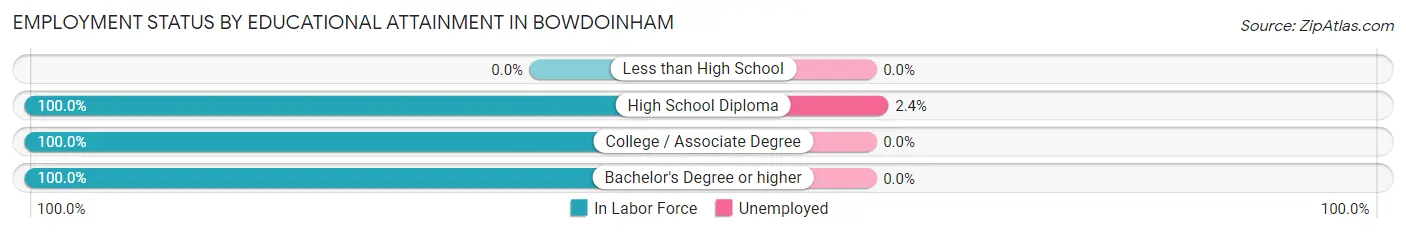
| Educational Attainment | In Labor Force | Unemployed |
| Less than High School | 0 (0.0%) | 0 (0.0%) |
| High School Diploma | 82 (100.0%) | 2 (2.4%) |
| College / Associate Degree | 13 (100.0%) | 0 (0.0%) |
| Bachelor's Degree or higher | 237 (100.0%) | 0 (0.0%) |
| Total | 332 (100.0%) | 2 (0.6%) |
Employment Occupations by Sex in Bowdoinham
Management, Business, Science and Arts Occupations
The most common Management, Business, Science and Arts occupations in Bowdoinham are Community & Social Service (95 | 26.0%), Health Diagnosing & Treating (76 | 20.8%), Health Technologists (76 | 20.8%), Education Instruction & Library (63 | 17.2%), and Management (34 | 9.3%).
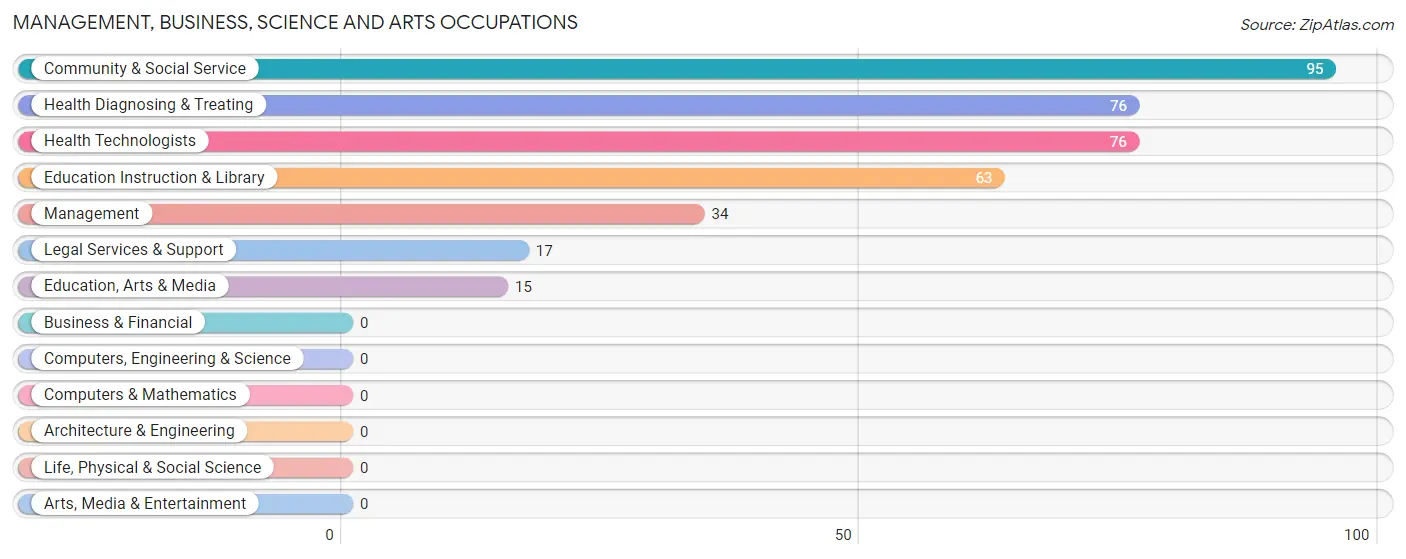
Management, Business, Science and Arts Occupations by Sex
Within the Management, Business, Science and Arts occupations in Bowdoinham, the most male-oriented occupations are Legal Services & Support (100.0%), Management (55.9%), and Health Diagnosing & Treating (51.3%), while the most female-oriented occupations are Education, Arts & Media (100.0%), Education Instruction & Library (74.6%), and Community & Social Service (65.3%).
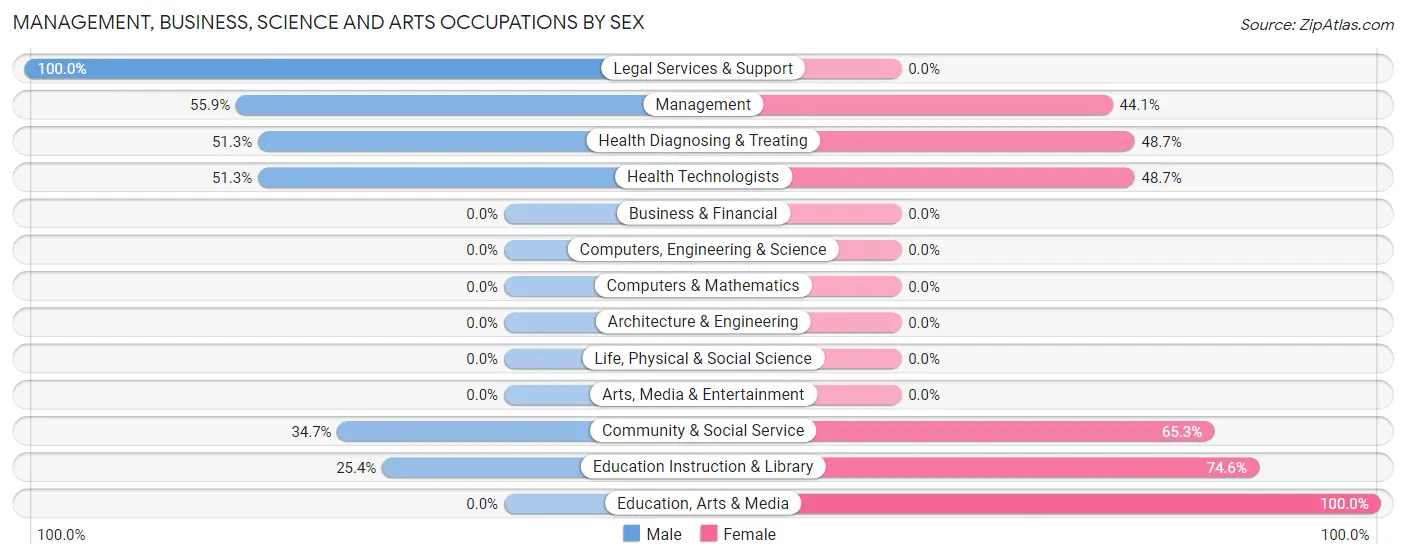
| Occupation | Male | Female |
| Management | 19 (55.9%) | 15 (44.1%) |
| Business & Financial | 0 (0.0%) | 0 (0.0%) |
| Computers, Engineering & Science | 0 (0.0%) | 0 (0.0%) |
| Computers & Mathematics | 0 (0.0%) | 0 (0.0%) |
| Architecture & Engineering | 0 (0.0%) | 0 (0.0%) |
| Life, Physical & Social Science | 0 (0.0%) | 0 (0.0%) |
| Community & Social Service | 33 (34.7%) | 62 (65.3%) |
| Education, Arts & Media | 0 (0.0%) | 15 (100.0%) |
| Legal Services & Support | 17 (100.0%) | 0 (0.0%) |
| Education Instruction & Library | 16 (25.4%) | 47 (74.6%) |
| Arts, Media & Entertainment | 0 (0.0%) | 0 (0.0%) |
| Health Diagnosing & Treating | 39 (51.3%) | 37 (48.7%) |
| Health Technologists | 39 (51.3%) | 37 (48.7%) |
| Total (Category) | 91 (44.4%) | 114 (55.6%) |
| Total (Overall) | 217 (59.3%) | 149 (40.7%) |
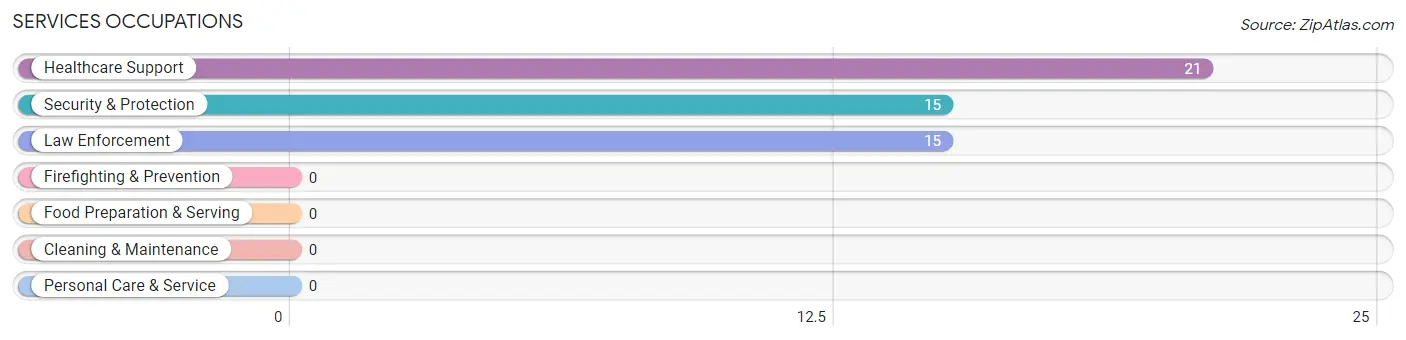
Services Occupations
The most common Services occupations in Bowdoinham are Healthcare Support (21 | 5.7%), Security & Protection (15 | 4.1%), and Law Enforcement (15 | 4.1%).
Services Occupations by Sex
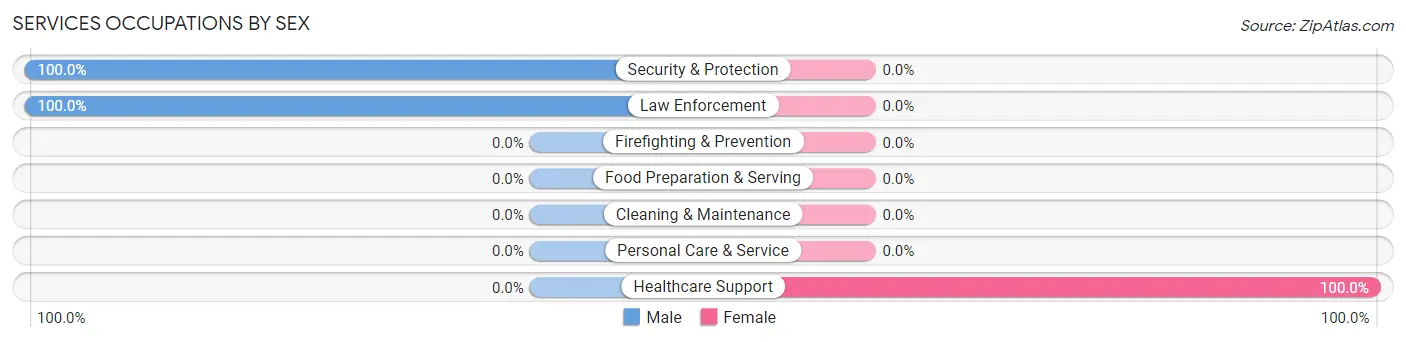
| Occupation | Male | Female |
| Healthcare Support | 0 (0.0%) | 21 (100.0%) |
| Security & Protection | 15 (100.0%) | 0 (0.0%) |
| Firefighting & Prevention | 0 (0.0%) | 0 (0.0%) |
| Law Enforcement | 15 (100.0%) | 0 (0.0%) |
| Food Preparation & Serving | 0 (0.0%) | 0 (0.0%) |
| Cleaning & Maintenance | 0 (0.0%) | 0 (0.0%) |
| Personal Care & Service | 0 (0.0%) | 0 (0.0%) |
| Total (Category) | 15 (41.7%) | 21 (58.3%) |
| Total (Overall) | 217 (59.3%) | 149 (40.7%) |
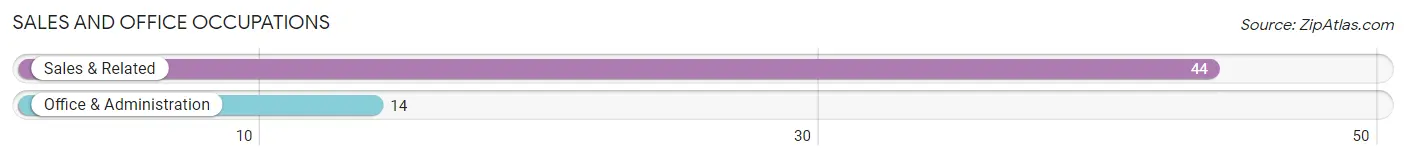
Sales and Office Occupations
The most common Sales and Office occupations in Bowdoinham are Sales & Related (44 | 12.0%), and Office & Administration (14 | 3.8%).
Sales and Office Occupations by Sex
| Occupation | Male | Female |
| Sales & Related | 44 (100.0%) | 0 (0.0%) |
| Office & Administration | 0 (0.0%) | 14 (100.0%) |
| Total (Category) | 44 (75.9%) | 14 (24.1%) |
| Total (Overall) | 217 (59.3%) | 149 (40.7%) |
Natural Resources, Construction and Maintenance Occupations
The most common Natural Resources, Construction and Maintenance occupations in Bowdoinham are , and Construction & Extraction (22 | 6.0%).
Natural Resources, Construction and Maintenance Occupations by Sex
| Occupation | Male | Female |
| Farming, Fishing & Forestry | 0 (0.0%) | 0 (0.0%) |
| Construction & Extraction | 22 (100.0%) | 0 (0.0%) |
| Installation, Maintenance & Repair | 0 (0.0%) | 0 (0.0%) |
| Total (Category) | 22 (100.0%) | 0 (0.0%) |
| Total (Overall) | 217 (59.3%) | 149 (40.7%) |
Production, Transportation and Moving Occupations
The most common Production, Transportation and Moving occupations in Bowdoinham are , and Production (45 | 12.3%).
Production, Transportation and Moving Occupations by Sex
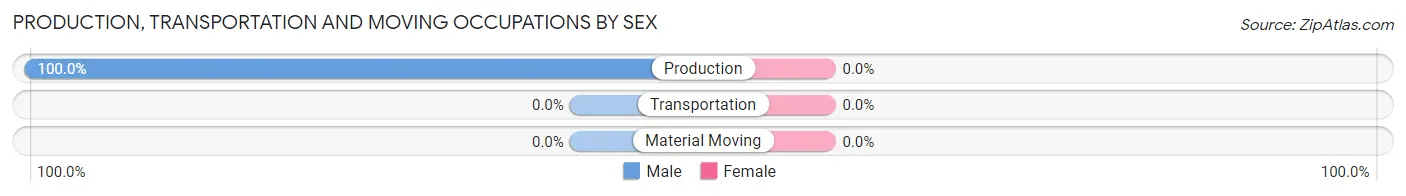
| Occupation | Male | Female |
| Production | 45 (100.0%) | 0 (0.0%) |
| Transportation | 0 (0.0%) | 0 (0.0%) |
| Material Moving | 0 (0.0%) | 0 (0.0%) |
| Total (Category) | 45 (100.0%) | 0 (0.0%) |
| Total (Overall) | 217 (59.3%) | 149 (40.7%) |
Employment Industries by Sex in Bowdoinham
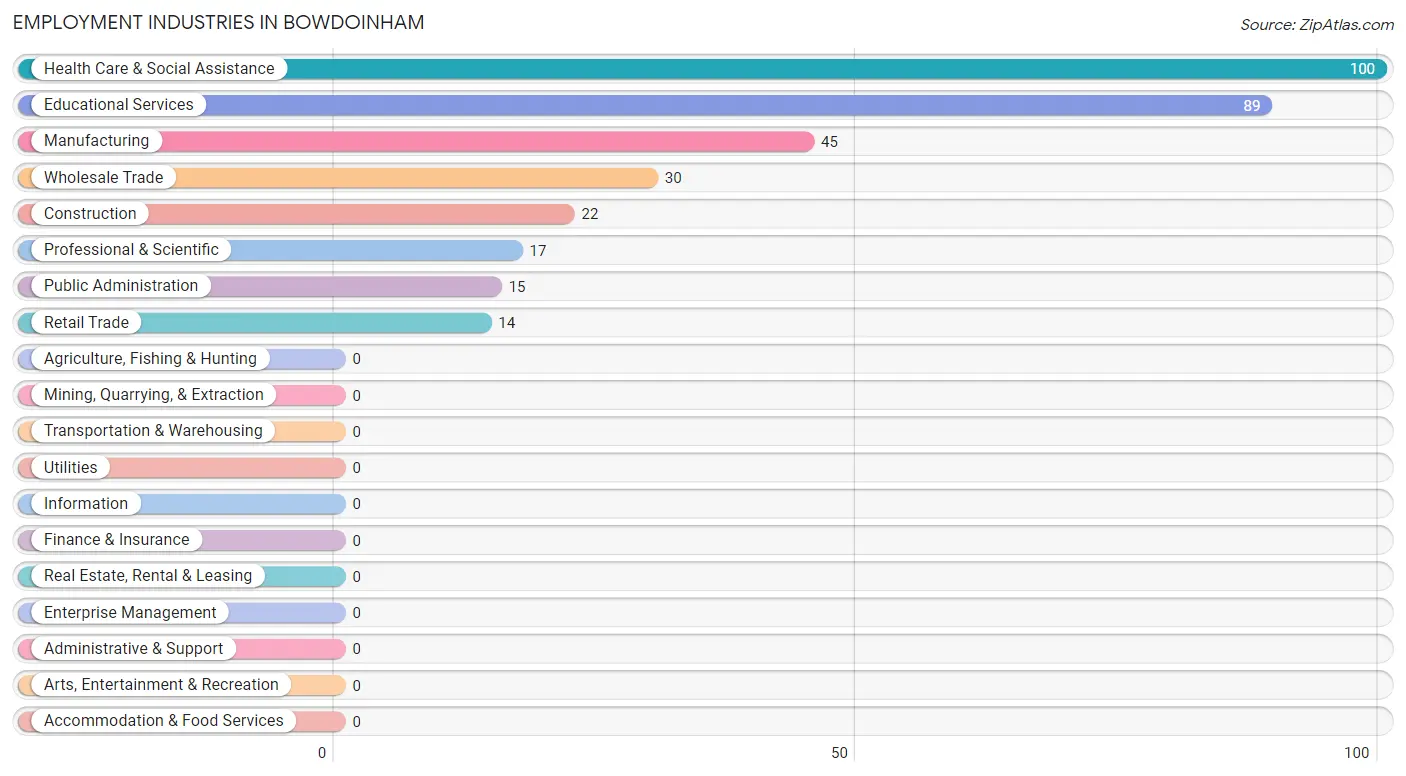
Employment Industries in Bowdoinham
The major employment industries in Bowdoinham include Health Care & Social Assistance (100 | 27.3%), Educational Services (89 | 24.3%), Manufacturing (45 | 12.3%), Wholesale Trade (30 | 8.2%), and Construction (22 | 6.0%).
Employment Industries by Sex in Bowdoinham
The Bowdoinham industries that see more men than women are Construction (100.0%), Manufacturing (100.0%), and Wholesale Trade (100.0%), whereas the industries that tend to have a higher number of women are Educational Services (82.0%), and Health Care & Social Assistance (61.0%).
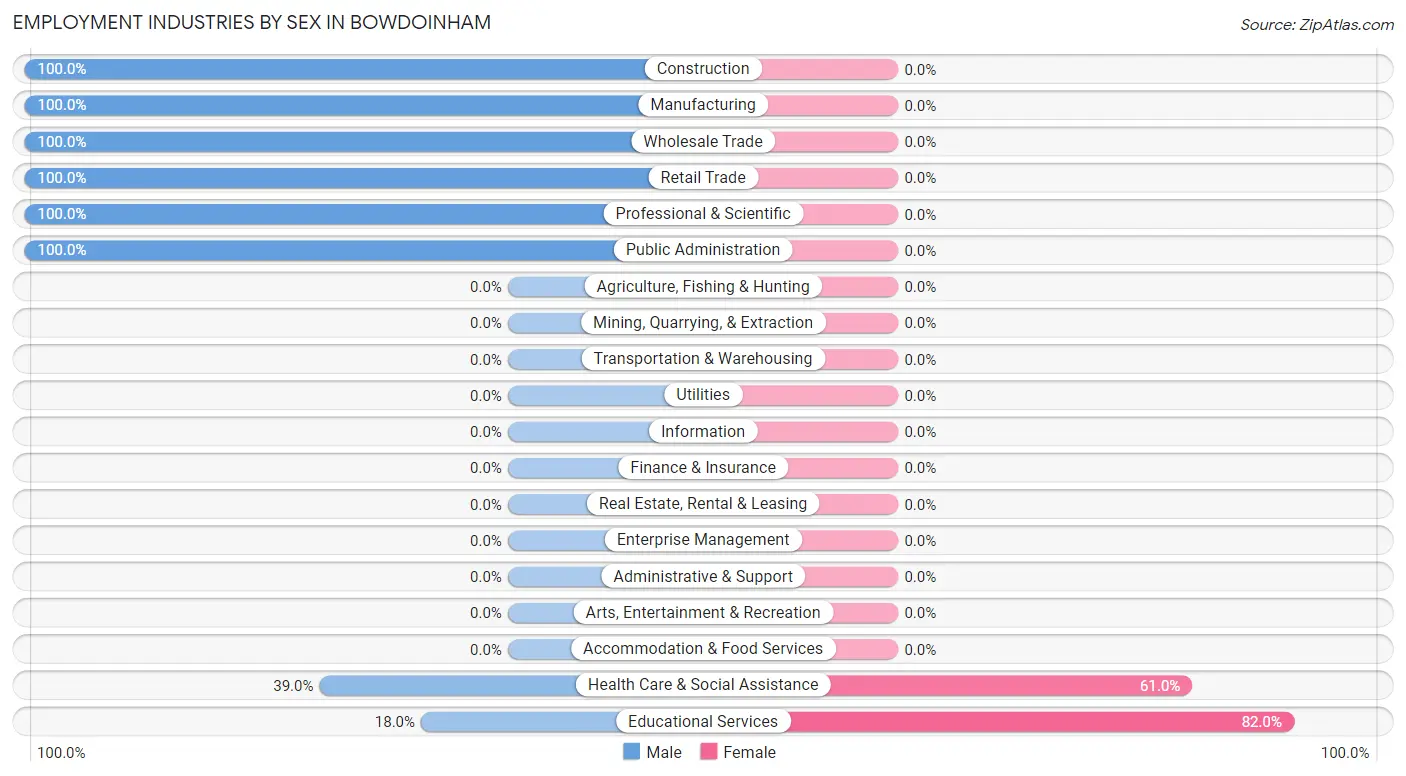
| Industry | Male | Female |
| Agriculture, Fishing & Hunting | 0 (0.0%) | 0 (0.0%) |
| Mining, Quarrying, & Extraction | 0 (0.0%) | 0 (0.0%) |
| Construction | 22 (100.0%) | 0 (0.0%) |
| Manufacturing | 45 (100.0%) | 0 (0.0%) |
| Wholesale Trade | 30 (100.0%) | 0 (0.0%) |
| Retail Trade | 14 (100.0%) | 0 (0.0%) |
| Transportation & Warehousing | 0 (0.0%) | 0 (0.0%) |
| Utilities | 0 (0.0%) | 0 (0.0%) |
| Information | 0 (0.0%) | 0 (0.0%) |
| Finance & Insurance | 0 (0.0%) | 0 (0.0%) |
| Real Estate, Rental & Leasing | 0 (0.0%) | 0 (0.0%) |
| Professional & Scientific | 17 (100.0%) | 0 (0.0%) |
| Enterprise Management | 0 (0.0%) | 0 (0.0%) |
| Administrative & Support | 0 (0.0%) | 0 (0.0%) |
| Educational Services | 16 (18.0%) | 73 (82.0%) |
| Health Care & Social Assistance | 39 (39.0%) | 61 (61.0%) |
| Arts, Entertainment & Recreation | 0 (0.0%) | 0 (0.0%) |
| Accommodation & Food Services | 0 (0.0%) | 0 (0.0%) |
| Public Administration | 15 (100.0%) | 0 (0.0%) |
| Total | 217 (59.3%) | 149 (40.7%) |
Education in Bowdoinham
School Enrollment in Bowdoinham
The most common levels of schooling among the 278 students in Bowdoinham are middle school (142 | 51.1%), elementary school (73 | 26.3%), and high school (48 | 17.3%).
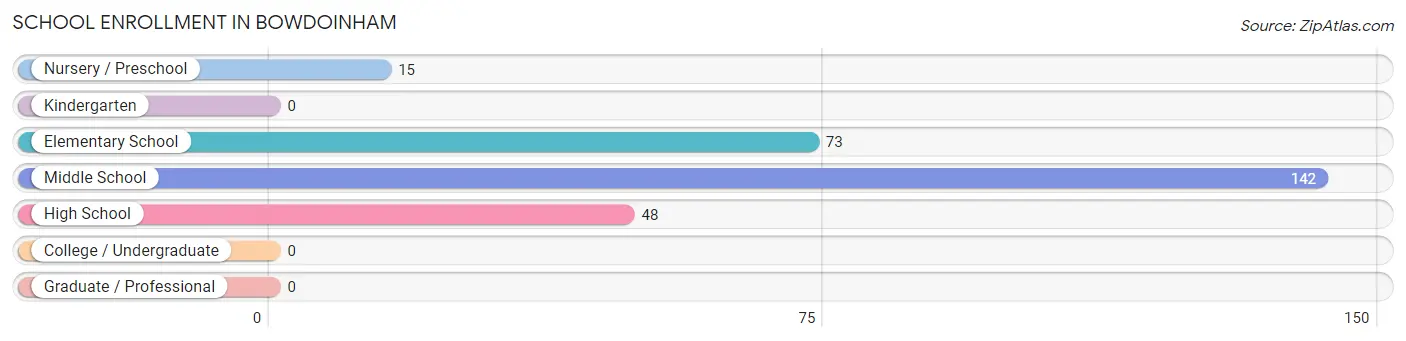
| School Level | # Students | % Students |
| Nursery / Preschool | 15 | 5.4% |
| Kindergarten | 0 | 0.0% |
| Elementary School | 73 | 26.3% |
| Middle School | 142 | 51.1% |
| High School | 48 | 17.3% |
| College / Undergraduate | 0 | 0.0% |
| Graduate / Professional | 0 | 0.0% |
| Total | 278 | 100.0% |
School Enrollment by Age by Funding Source in Bowdoinham
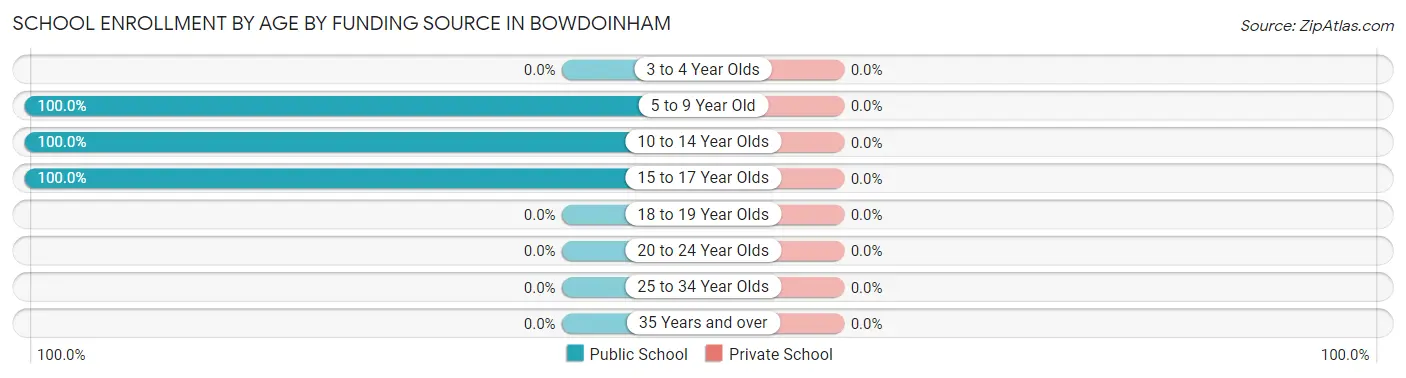
| Age Bracket | Public School | Private School |
| 3 to 4 Year Olds | 0 (0.0%) | 0 (0.0%) |
| 5 to 9 Year Old | 88 (100.0%) | 0 (0.0%) |
| 10 to 14 Year Olds | 138 (100.0%) | 0 (0.0%) |
| 15 to 17 Year Olds | 52 (100.0%) | 0 (0.0%) |
| 18 to 19 Year Olds | 0 (0.0%) | 0 (0.0%) |
| 20 to 24 Year Olds | 0 (0.0%) | 0 (0.0%) |
| 25 to 34 Year Olds | 0 (0.0%) | 0 (0.0%) |
| 35 Years and over | 0 (0.0%) | 0 (0.0%) |
| Total | 278 (100.0%) | 0 (0.0%) |
Educational Attainment by Field of Study in Bowdoinham
Education (58 | 17.8%), literature & languages (45 | 13.8%), arts & humanities (45 | 13.8%), bio, nature & agricultural (43 | 13.2%), and science & technology (39 | 12.0%) are the most common fields of study among 326 individuals in Bowdoinham who have obtained a bachelor's degree or higher.
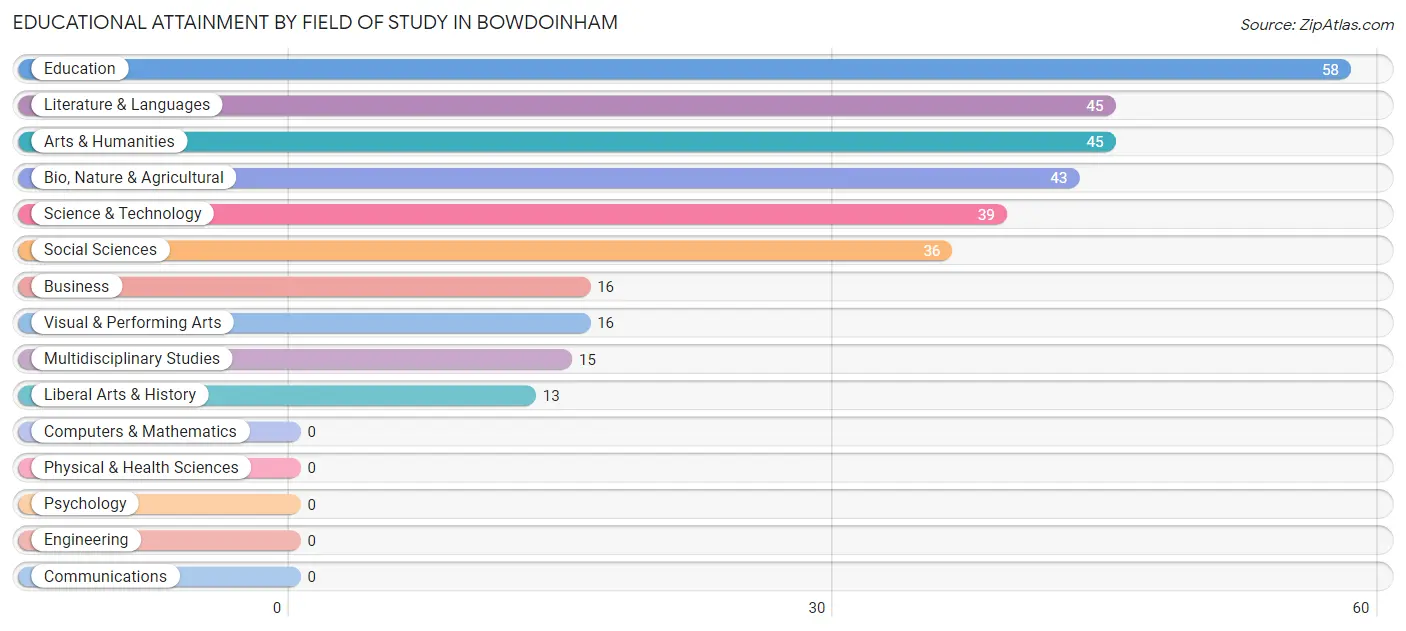
| Field of Study | # Graduates | % Graduates |
| Computers & Mathematics | 0 | 0.0% |
| Bio, Nature & Agricultural | 43 | 13.2% |
| Physical & Health Sciences | 0 | 0.0% |
| Psychology | 0 | 0.0% |
| Social Sciences | 36 | 11.0% |
| Engineering | 0 | 0.0% |
| Multidisciplinary Studies | 15 | 4.6% |
| Science & Technology | 39 | 12.0% |
| Business | 16 | 4.9% |
| Education | 58 | 17.8% |
| Literature & Languages | 45 | 13.8% |
| Liberal Arts & History | 13 | 4.0% |
| Visual & Performing Arts | 16 | 4.9% |
| Communications | 0 | 0.0% |
| Arts & Humanities | 45 | 13.8% |
| Total | 326 | 100.0% |
Transportation & Commute in Bowdoinham
Vehicle Availability by Sex in Bowdoinham
The most prevalent vehicle ownership categories in Bowdoinham are males with 2 vehicles (134, accounting for 61.8%) and females with 2 vehicles (81, making up 89.9%).
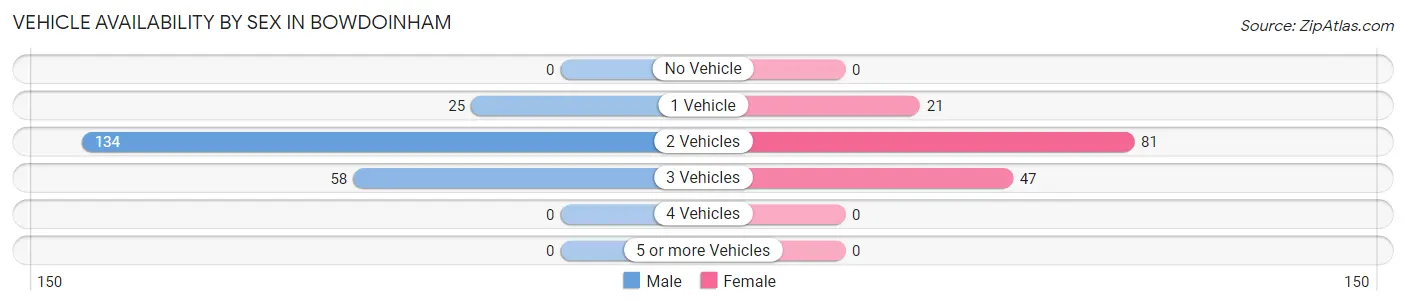
| Vehicles Available | Male | Female |
| No Vehicle | 0 (0.0%) | 0 (0.0%) |
| 1 Vehicle | 25 (11.5%) | 21 (14.1%) |
| 2 Vehicles | 134 (61.8%) | 81 (54.4%) |
| 3 Vehicles | 58 (26.7%) | 47 (31.5%) |
| 4 Vehicles | 0 (0.0%) | 0 (0.0%) |
| 5 or more Vehicles | 0 (0.0%) | 0 (0.0%) |
| Total | 217 (100.0%) | 149 (100.0%) |
Commute Time in Bowdoinham
The most frequently occuring commute durations in Bowdoinham are 15 to 19 minutes (62 commuters, 17.8%), 25 to 29 minutes (54 commuters, 15.5%), and 20 to 24 minutes (50 commuters, 14.3%).

| Commute Time | # Commuters | % Commuters |
| Less than 5 Minutes | 0 | 0.0% |
| 5 to 9 Minutes | 0 | 0.0% |
| 10 to 14 Minutes | 0 | 0.0% |
| 15 to 19 Minutes | 62 | 17.8% |
| 20 to 24 Minutes | 50 | 14.3% |
| 25 to 29 Minutes | 54 | 15.5% |
| 30 to 34 Minutes | 45 | 12.9% |
| 35 to 39 Minutes | 37 | 10.6% |
| 40 to 44 Minutes | 15 | 4.3% |
| 45 to 59 Minutes | 14 | 4.0% |
| 60 to 89 Minutes | 39 | 11.2% |
| 90 or more Minutes | 33 | 9.5% |
Commute Time by Sex in Bowdoinham
The most common commute times in Bowdoinham are 30 to 34 minutes (45 commuters, 22.5%) for males and 15 to 19 minutes (37 commuters, 24.8%) for females.
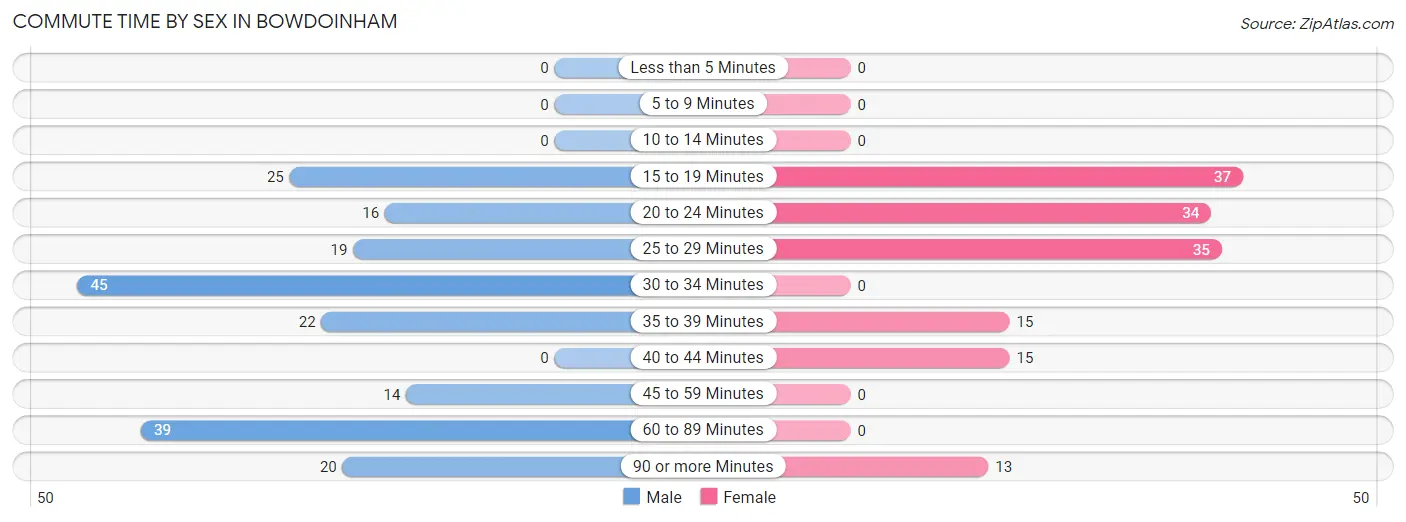
| Commute Time | Male | Female |
| Less than 5 Minutes | 0 (0.0%) | 0 (0.0%) |
| 5 to 9 Minutes | 0 (0.0%) | 0 (0.0%) |
| 10 to 14 Minutes | 0 (0.0%) | 0 (0.0%) |
| 15 to 19 Minutes | 25 (12.5%) | 37 (24.8%) |
| 20 to 24 Minutes | 16 (8.0%) | 34 (22.8%) |
| 25 to 29 Minutes | 19 (9.5%) | 35 (23.5%) |
| 30 to 34 Minutes | 45 (22.5%) | 0 (0.0%) |
| 35 to 39 Minutes | 22 (11.0%) | 15 (10.1%) |
| 40 to 44 Minutes | 0 (0.0%) | 15 (10.1%) |
| 45 to 59 Minutes | 14 (7.0%) | 0 (0.0%) |
| 60 to 89 Minutes | 39 (19.5%) | 0 (0.0%) |
| 90 or more Minutes | 20 (10.0%) | 13 (8.7%) |
Time of Departure to Work by Sex in Bowdoinham
The most frequent times of departure to work in Bowdoinham are 6:30 AM to 6:59 AM (54, 27.0%) for males and 7:00 AM to 7:29 AM (37, 24.8%) for females.
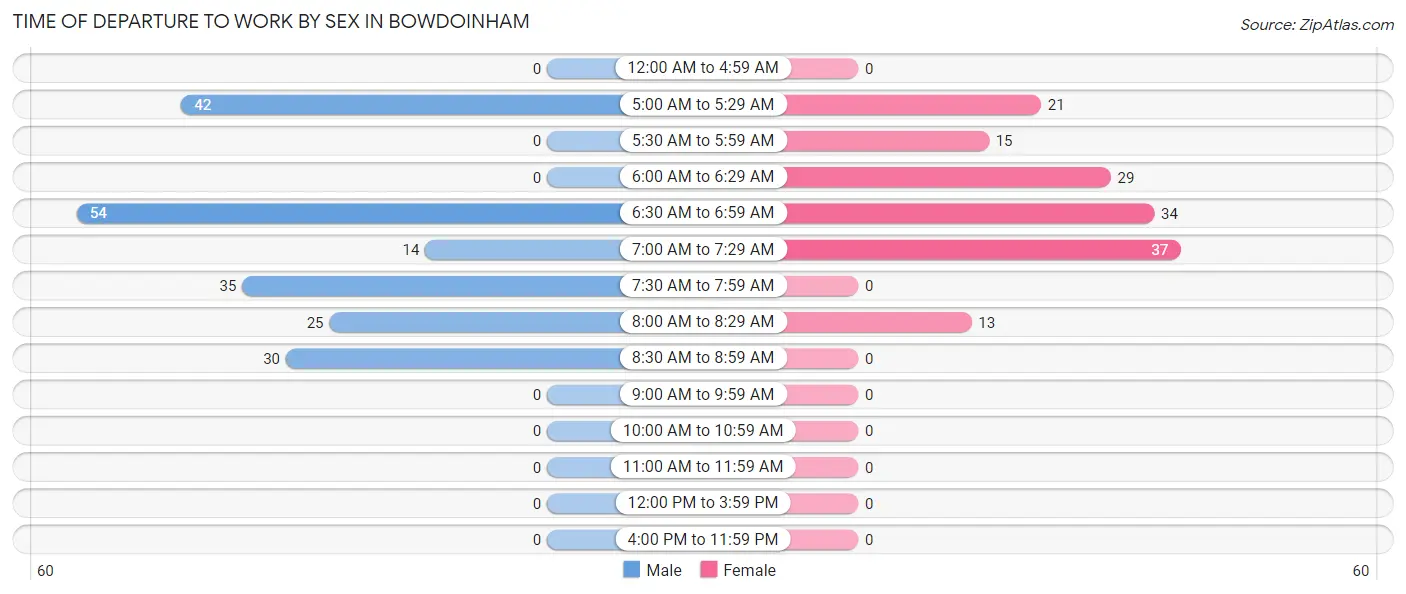
| Time of Departure | Male | Female |
| 12:00 AM to 4:59 AM | 0 (0.0%) | 0 (0.0%) |
| 5:00 AM to 5:29 AM | 42 (21.0%) | 21 (14.1%) |
| 5:30 AM to 5:59 AM | 0 (0.0%) | 15 (10.1%) |
| 6:00 AM to 6:29 AM | 0 (0.0%) | 29 (19.5%) |
| 6:30 AM to 6:59 AM | 54 (27.0%) | 34 (22.8%) |
| 7:00 AM to 7:29 AM | 14 (7.0%) | 37 (24.8%) |
| 7:30 AM to 7:59 AM | 35 (17.5%) | 0 (0.0%) |
| 8:00 AM to 8:29 AM | 25 (12.5%) | 13 (8.7%) |
| 8:30 AM to 8:59 AM | 30 (15.0%) | 0 (0.0%) |
| 9:00 AM to 9:59 AM | 0 (0.0%) | 0 (0.0%) |
| 10:00 AM to 10:59 AM | 0 (0.0%) | 0 (0.0%) |
| 11:00 AM to 11:59 AM | 0 (0.0%) | 0 (0.0%) |
| 12:00 PM to 3:59 PM | 0 (0.0%) | 0 (0.0%) |
| 4:00 PM to 11:59 PM | 0 (0.0%) | 0 (0.0%) |
| Total | 200 (100.0%) | 149 (100.0%) |
Housing Occupancy in Bowdoinham
Occupancy by Ownership in Bowdoinham
Of the total 270 dwellings in Bowdoinham, owner-occupied units account for 249 (92.2%), while renter-occupied units make up 21 (7.8%).
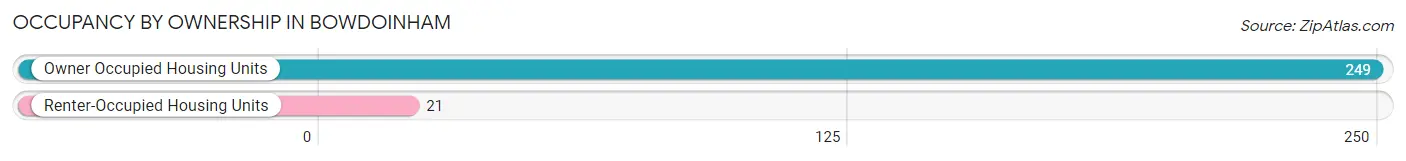
| Occupancy | # Housing Units | % Housing Units |
| Owner Occupied Housing Units | 249 | 92.2% |
| Renter-Occupied Housing Units | 21 | 7.8% |
| Total Occupied Housing Units | 270 | 100.0% |
Occupancy by Household Size in Bowdoinham
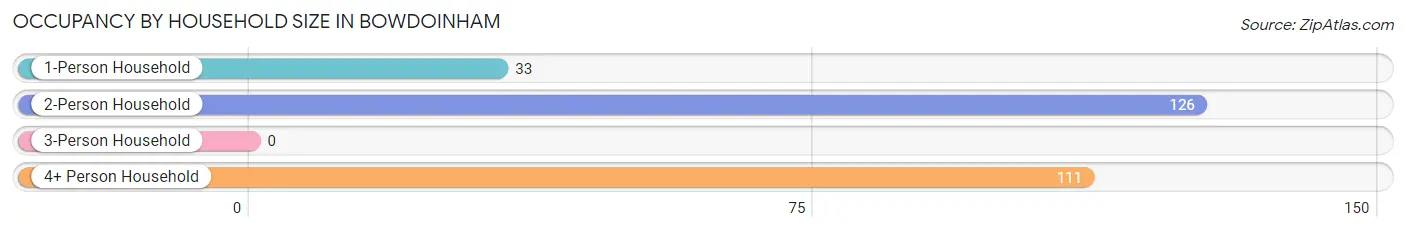
| Household Size | # Housing Units | % Housing Units |
| 1-Person Household | 33 | 12.2% |
| 2-Person Household | 126 | 46.7% |
| 3-Person Household | 0 | 0.0% |
| 4+ Person Household | 111 | 41.1% |
| Total Housing Units | 270 | 100.0% |
Occupancy by Ownership by Household Size in Bowdoinham
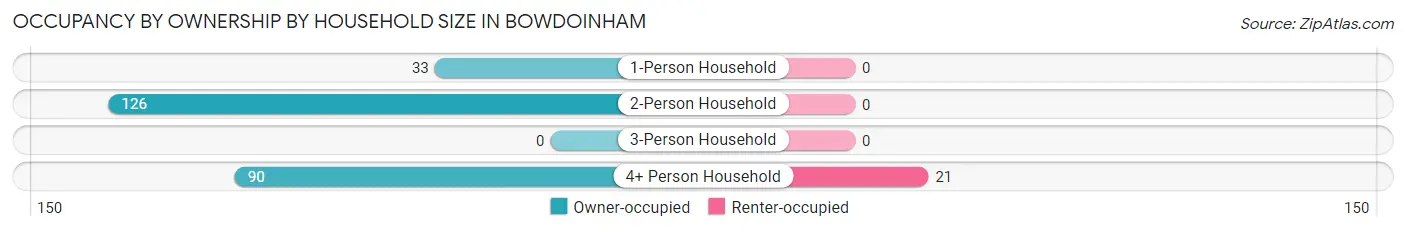
| Household Size | Owner-occupied | Renter-occupied |
| 1-Person Household | 33 (100.0%) | 0 (0.0%) |
| 2-Person Household | 126 (100.0%) | 0 (0.0%) |
| 3-Person Household | 0 (0.0%) | 0 (0.0%) |
| 4+ Person Household | 90 (81.1%) | 21 (18.9%) |
| Total Housing Units | 249 (92.2%) | 21 (7.8%) |
Occupancy by Educational Attainment in Bowdoinham
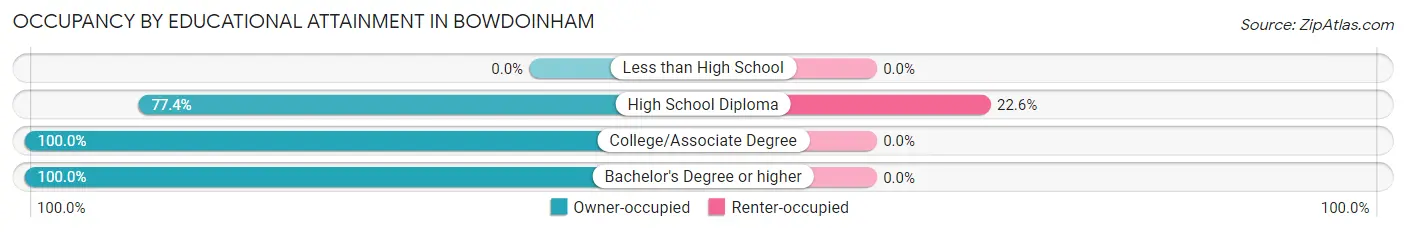
| Household Size | Owner-occupied | Renter-occupied |
| Less than High School | 0 (0.0%) | 0 (0.0%) |
| High School Diploma | 72 (77.4%) | 21 (22.6%) |
| College/Associate Degree | 25 (100.0%) | 0 (0.0%) |
| Bachelor's Degree or higher | 152 (100.0%) | 0 (0.0%) |
Occupancy by Age of Householder in Bowdoinham
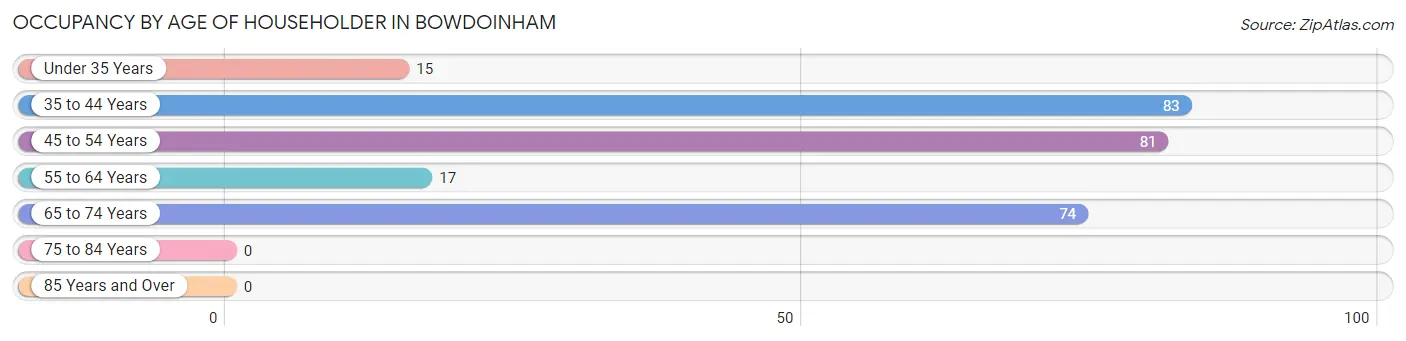
| Age Bracket | # Households | % Households |
| Under 35 Years | 15 | 5.6% |
| 35 to 44 Years | 83 | 30.7% |
| 45 to 54 Years | 81 | 30.0% |
| 55 to 64 Years | 17 | 6.3% |
| 65 to 74 Years | 74 | 27.4% |
| 75 to 84 Years | 0 | 0.0% |
| 85 Years and Over | 0 | 0.0% |
| Total | 270 | 100.0% |
Housing Finances in Bowdoinham
Median Income by Occupancy in Bowdoinham
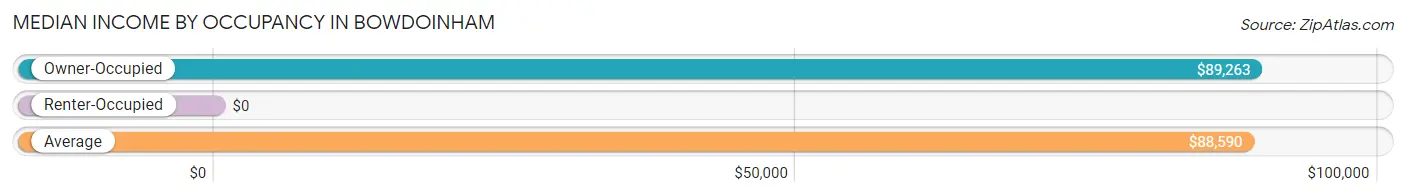
| Occupancy Type | # Households | Median Income |
| Owner-Occupied | 249 (92.2%) | $89,263 |
| Renter-Occupied | 21 (7.8%) | $0 |
| Average | 270 (100.0%) | $88,590 |
Occupancy by Householder Income Bracket in Bowdoinham
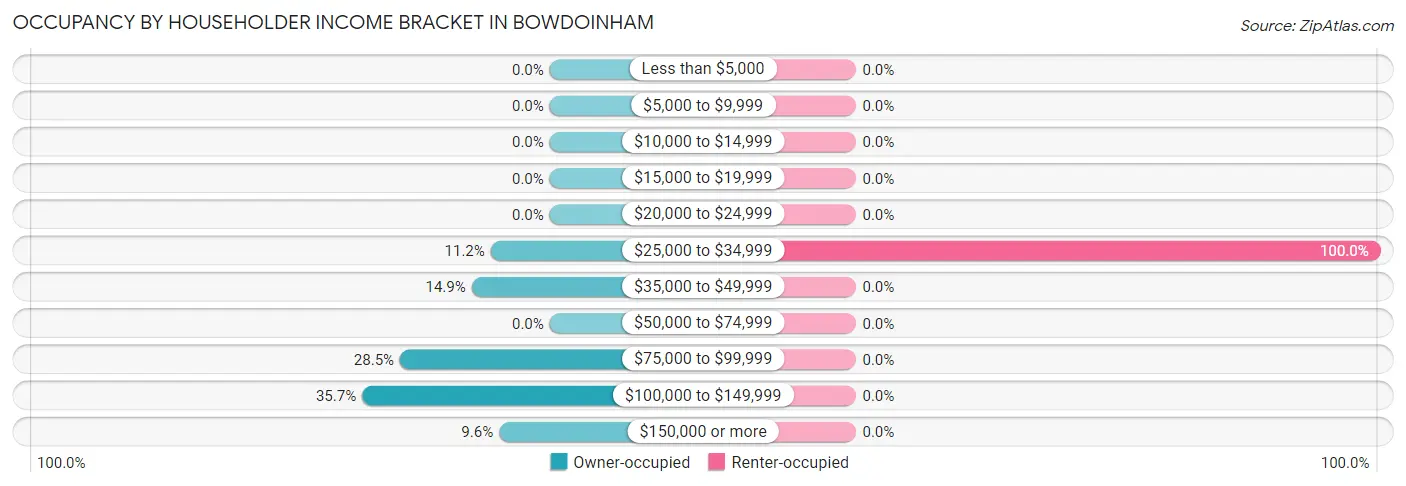
| Income Bracket | Owner-occupied | Renter-occupied |
| Less than $5,000 | 0 (0.0%) | 0 (0.0%) |
| $5,000 to $9,999 | 0 (0.0%) | 0 (0.0%) |
| $10,000 to $14,999 | 0 (0.0%) | 0 (0.0%) |
| $15,000 to $19,999 | 0 (0.0%) | 0 (0.0%) |
| $20,000 to $24,999 | 0 (0.0%) | 0 (0.0%) |
| $25,000 to $34,999 | 28 (11.2%) | 21 (100.0%) |
| $35,000 to $49,999 | 37 (14.9%) | 0 (0.0%) |
| $50,000 to $74,999 | 0 (0.0%) | 0 (0.0%) |
| $75,000 to $99,999 | 71 (28.5%) | 0 (0.0%) |
| $100,000 to $149,999 | 89 (35.7%) | 0 (0.0%) |
| $150,000 or more | 24 (9.6%) | 0 (0.0%) |
| Total | 249 (100.0%) | 21 (100.0%) |
Monthly Housing Cost Tiers in Bowdoinham
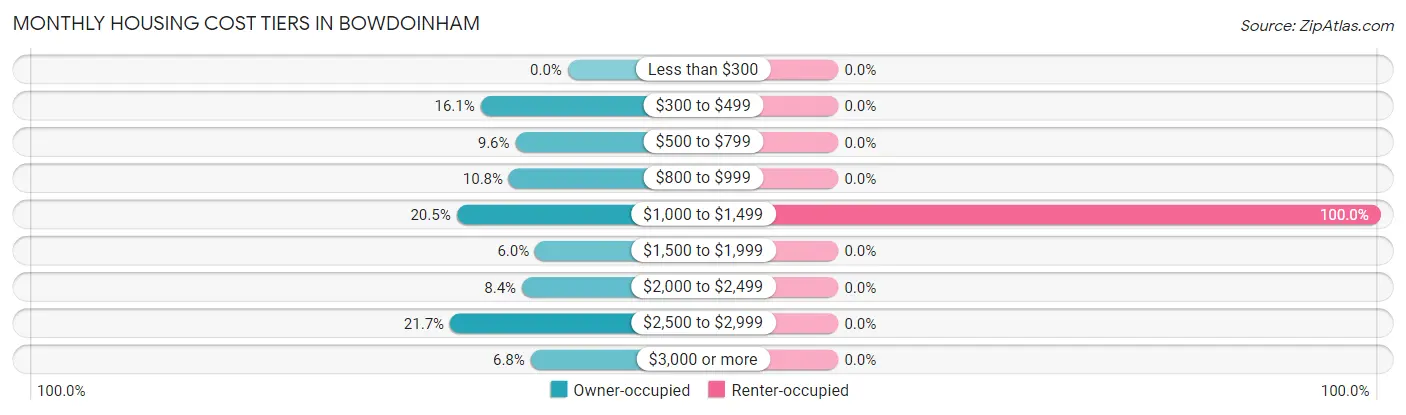
| Monthly Cost | Owner-occupied | Renter-occupied |
| Less than $300 | 0 (0.0%) | 0 (0.0%) |
| $300 to $499 | 40 (16.1%) | 0 (0.0%) |
| $500 to $799 | 24 (9.6%) | 0 (0.0%) |
| $800 to $999 | 27 (10.8%) | 0 (0.0%) |
| $1,000 to $1,499 | 51 (20.5%) | 21 (100.0%) |
| $1,500 to $1,999 | 15 (6.0%) | 0 (0.0%) |
| $2,000 to $2,499 | 21 (8.4%) | 0 (0.0%) |
| $2,500 to $2,999 | 54 (21.7%) | 0 (0.0%) |
| $3,000 or more | 17 (6.8%) | 0 (0.0%) |
| Total | 249 (100.0%) | 21 (100.0%) |
Physical Housing Characteristics in Bowdoinham
Housing Structures in Bowdoinham
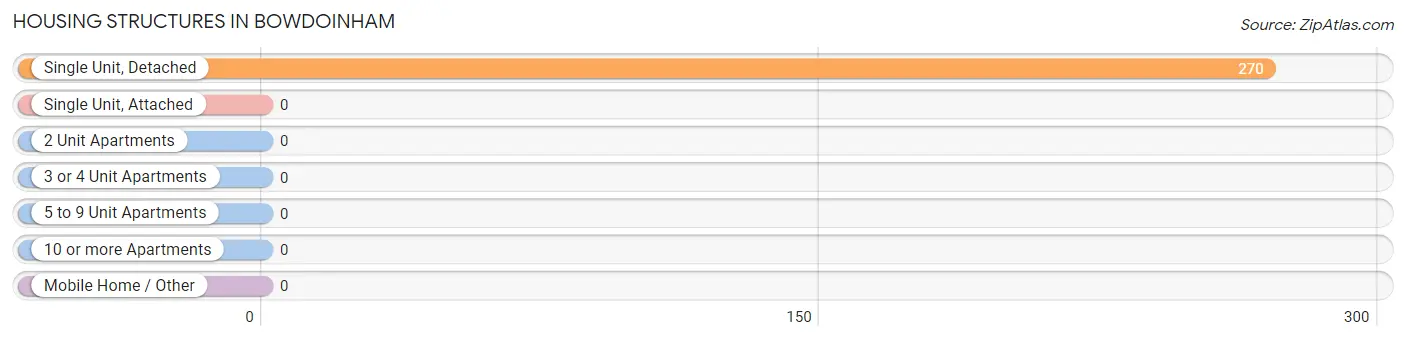
| Structure Type | # Housing Units | % Housing Units |
| Single Unit, Detached | 270 | 100.0% |
| Single Unit, Attached | 0 | 0.0% |
| 2 Unit Apartments | 0 | 0.0% |
| 3 or 4 Unit Apartments | 0 | 0.0% |
| 5 to 9 Unit Apartments | 0 | 0.0% |
| 10 or more Apartments | 0 | 0.0% |
| Mobile Home / Other | 0 | 0.0% |
| Total | 270 | 100.0% |
Housing Structures by Occupancy in Bowdoinham
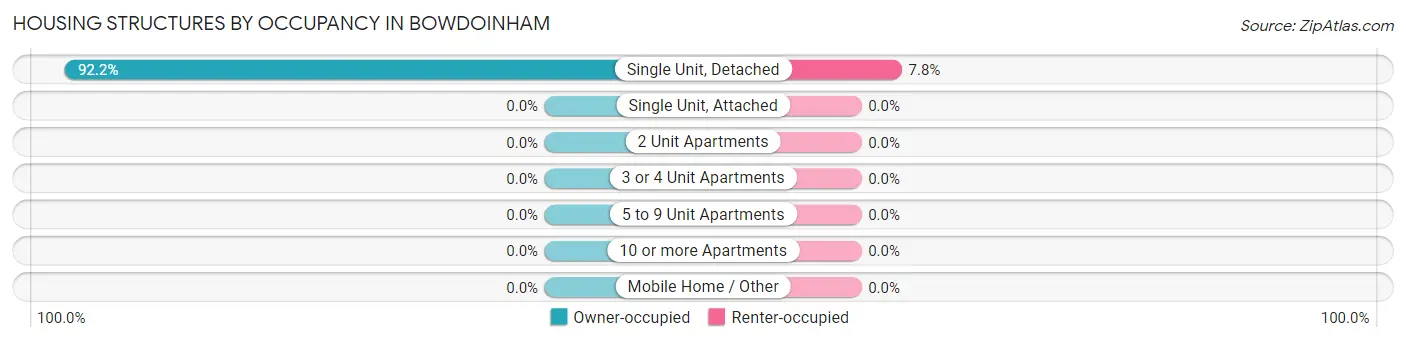
| Structure Type | Owner-occupied | Renter-occupied |
| Single Unit, Detached | 249 (92.2%) | 21 (7.8%) |
| Single Unit, Attached | 0 (0.0%) | 0 (0.0%) |
| 2 Unit Apartments | 0 (0.0%) | 0 (0.0%) |
| 3 or 4 Unit Apartments | 0 (0.0%) | 0 (0.0%) |
| 5 to 9 Unit Apartments | 0 (0.0%) | 0 (0.0%) |
| 10 or more Apartments | 0 (0.0%) | 0 (0.0%) |
| Mobile Home / Other | 0 (0.0%) | 0 (0.0%) |
| Total | 249 (92.2%) | 21 (7.8%) |
Housing Structures by Number of Rooms in Bowdoinham
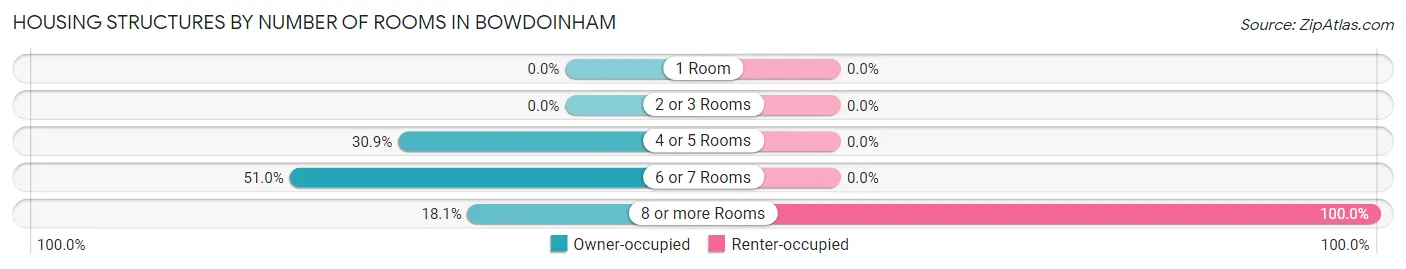
| Number of Rooms | Owner-occupied | Renter-occupied |
| 1 Room | 0 (0.0%) | 0 (0.0%) |
| 2 or 3 Rooms | 0 (0.0%) | 0 (0.0%) |
| 4 or 5 Rooms | 77 (30.9%) | 0 (0.0%) |
| 6 or 7 Rooms | 127 (51.0%) | 0 (0.0%) |
| 8 or more Rooms | 45 (18.1%) | 21 (100.0%) |
| Total | 249 (100.0%) | 21 (100.0%) |
Housing Structure by Heating Type in Bowdoinham
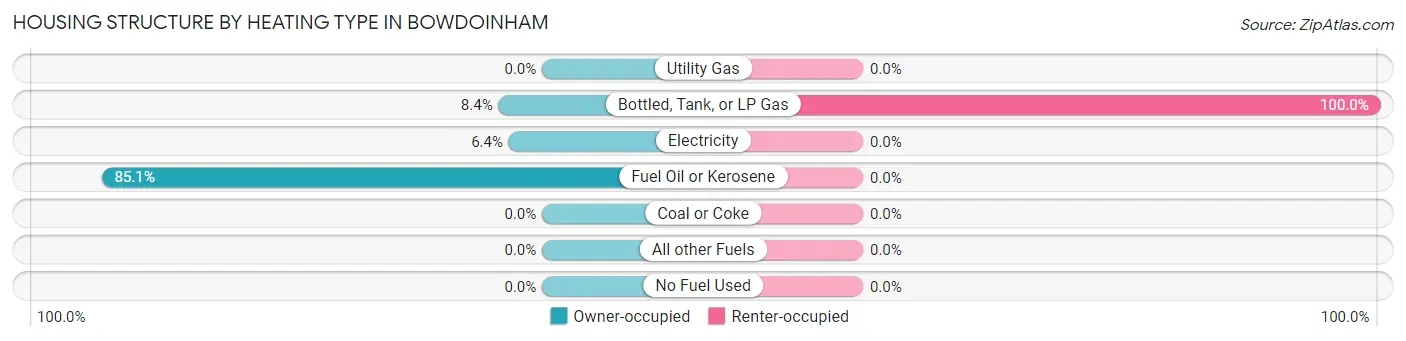
| Heating Type | Owner-occupied | Renter-occupied |
| Utility Gas | 0 (0.0%) | 0 (0.0%) |
| Bottled, Tank, or LP Gas | 21 (8.4%) | 21 (100.0%) |
| Electricity | 16 (6.4%) | 0 (0.0%) |
| Fuel Oil or Kerosene | 212 (85.1%) | 0 (0.0%) |
| Coal or Coke | 0 (0.0%) | 0 (0.0%) |
| All other Fuels | 0 (0.0%) | 0 (0.0%) |
| No Fuel Used | 0 (0.0%) | 0 (0.0%) |
| Total | 249 (100.0%) | 21 (100.0%) |
Household Vehicle Usage in Bowdoinham
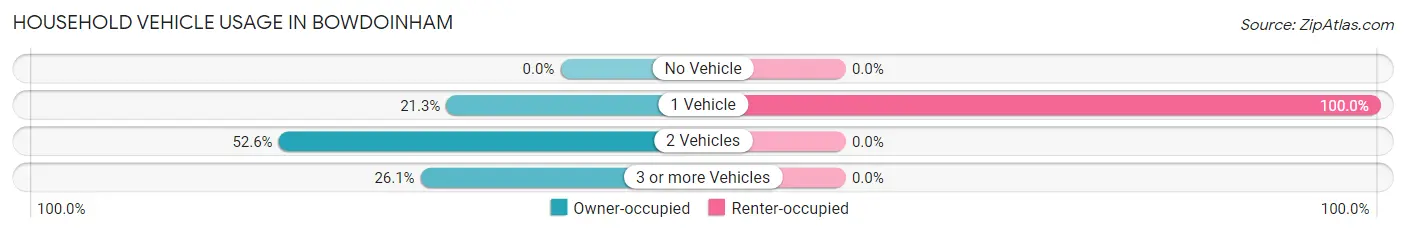
| Vehicles per Household | Owner-occupied | Renter-occupied |
| No Vehicle | 0 (0.0%) | 0 (0.0%) |
| 1 Vehicle | 53 (21.3%) | 21 (100.0%) |
| 2 Vehicles | 131 (52.6%) | 0 (0.0%) |
| 3 or more Vehicles | 65 (26.1%) | 0 (0.0%) |
| Total | 249 (100.0%) | 21 (100.0%) |
Real Estate & Mortgages in Bowdoinham
Real Estate and Mortgage Overview in Bowdoinham
| Characteristic | Without Mortgage | With Mortgage |
| Housing Units | 91 | 158 |
| Median Property Value | $261,500 | $285,700 |
| Median Household Income | - | - |
| Monthly Housing Costs | $523 | $17 |
| Real Estate Taxes | $2,229 | $0 |
Property Value by Mortgage Status in Bowdoinham
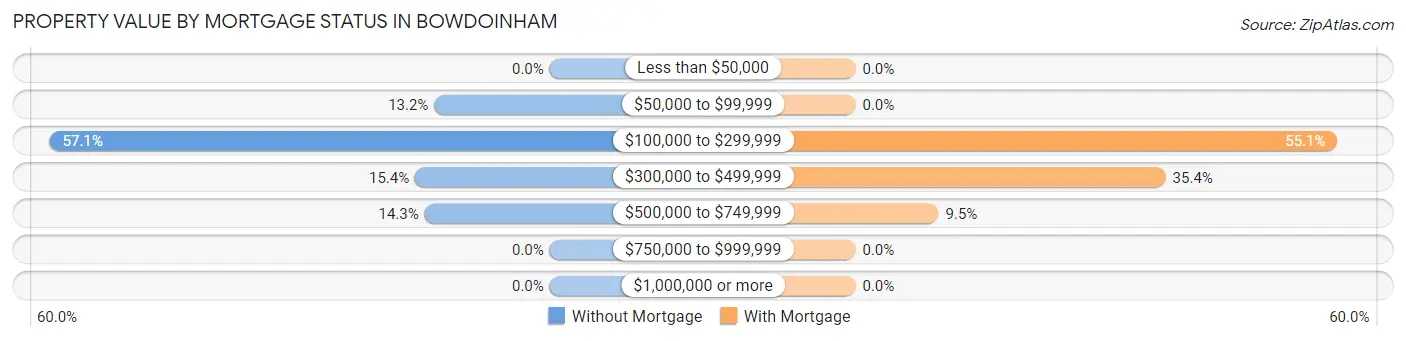
| Property Value | Without Mortgage | With Mortgage |
| Less than $50,000 | 0 (0.0%) | 0 (0.0%) |
| $50,000 to $99,999 | 12 (13.2%) | 0 (0.0%) |
| $100,000 to $299,999 | 52 (57.1%) | 87 (55.1%) |
| $300,000 to $499,999 | 14 (15.4%) | 56 (35.4%) |
| $500,000 to $749,999 | 13 (14.3%) | 15 (9.5%) |
| $750,000 to $999,999 | 0 (0.0%) | 0 (0.0%) |
| $1,000,000 or more | 0 (0.0%) | 0 (0.0%) |
| Total | 91 (100.0%) | 158 (100.0%) |
Household Income by Mortgage Status in Bowdoinham
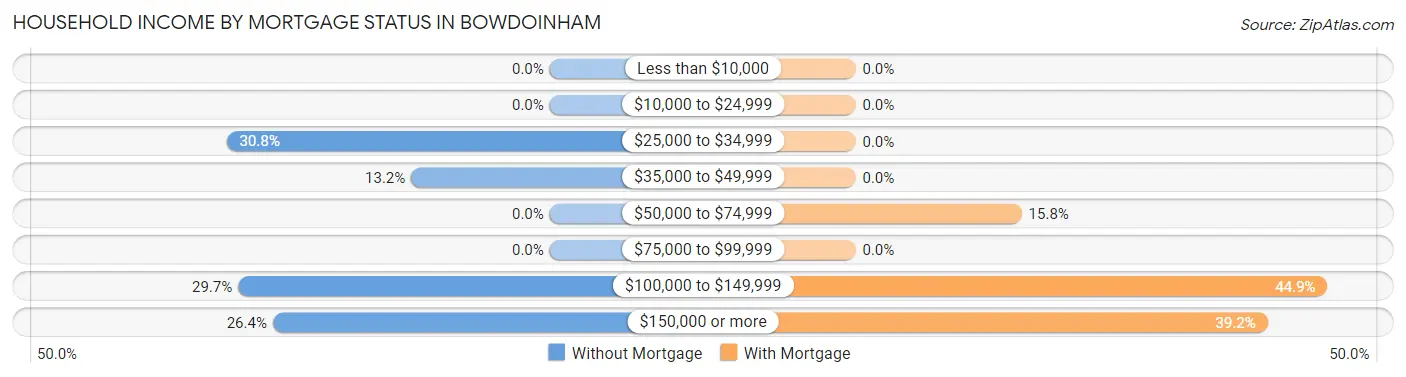
| Household Income | Without Mortgage | With Mortgage |
| Less than $10,000 | 0 (0.0%) | 0 (0.0%) |
| $10,000 to $24,999 | 0 (0.0%) | 0 (0.0%) |
| $25,000 to $34,999 | 28 (30.8%) | 0 (0.0%) |
| $35,000 to $49,999 | 12 (13.2%) | 0 (0.0%) |
| $50,000 to $74,999 | 0 (0.0%) | 25 (15.8%) |
| $75,000 to $99,999 | 0 (0.0%) | 0 (0.0%) |
| $100,000 to $149,999 | 27 (29.7%) | 71 (44.9%) |
| $150,000 or more | 24 (26.4%) | 62 (39.2%) |
| Total | 91 (100.0%) | 158 (100.0%) |
Property Value to Household Income Ratio in Bowdoinham
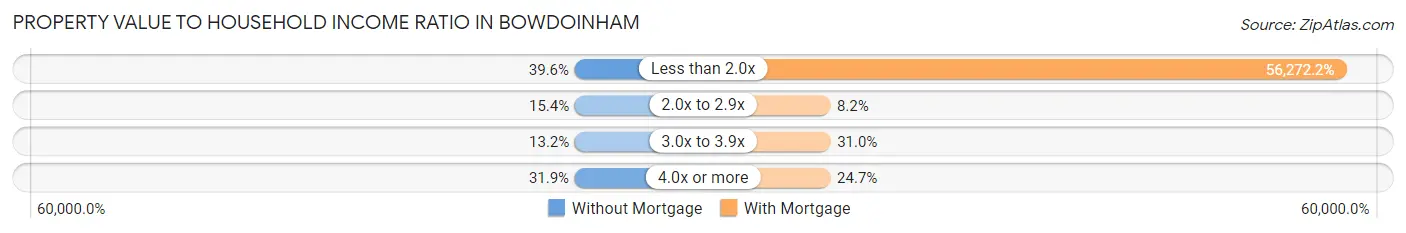
| Value-to-Income Ratio | Without Mortgage | With Mortgage |
| Less than 2.0x | 36 (39.6%) | 88,910 (56,272.1%) |
| 2.0x to 2.9x | 14 (15.4%) | 13 (8.2%) |
| 3.0x to 3.9x | 12 (13.2%) | 49 (31.0%) |
| 4.0x or more | 29 (31.9%) | 39 (24.7%) |
| Total | 91 (100.0%) | 158 (100.0%) |
Real Estate Taxes by Mortgage Status in Bowdoinham
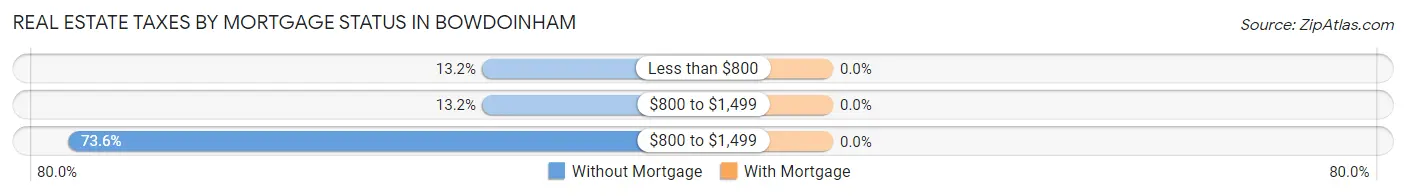
| Property Taxes | Without Mortgage | With Mortgage |
| Less than $800 | 12 (13.2%) | 0 (0.0%) |
| $800 to $1,499 | 12 (13.2%) | 0 (0.0%) |
| $800 to $1,499 | 67 (73.6%) | 0 (0.0%) |
| Total | 91 (100.0%) | 158 (100.0%) |
Health & Disability in Bowdoinham
Health Insurance Coverage by Age in Bowdoinham
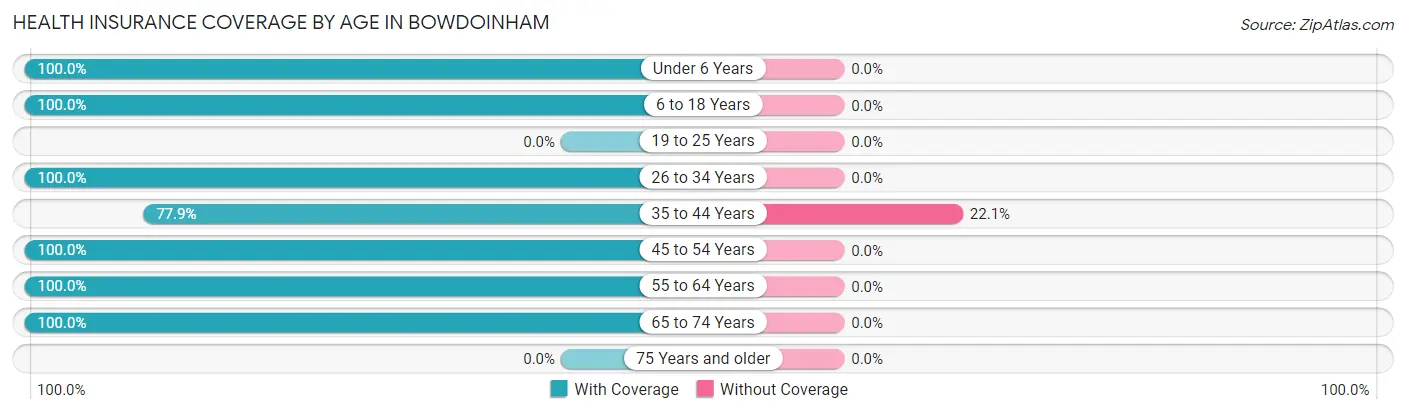
| Age Bracket | With Coverage | Without Coverage |
| Under 6 Years | 31 (100.0%) | 0 (0.0%) |
| 6 to 18 Years | 263 (100.0%) | 0 (0.0%) |
| 19 to 25 Years | 0 (0.0%) | 0 (0.0%) |
| 26 to 34 Years | 30 (100.0%) | 0 (0.0%) |
| 35 to 44 Years | 88 (77.9%) | 25 (22.1%) |
| 45 to 54 Years | 154 (100.0%) | 0 (0.0%) |
| 55 to 64 Years | 35 (100.0%) | 0 (0.0%) |
| 65 to 74 Years | 140 (100.0%) | 0 (0.0%) |
| 75 Years and older | 0 (0.0%) | 0 (0.0%) |
| Total | 741 (96.7%) | 25 (3.3%) |
Health Insurance Coverage by Citizenship Status in Bowdoinham

| Citizenship Status | With Coverage | Without Coverage |
| Native Born | 31 (100.0%) | 0 (0.0%) |
| Foreign Born, Citizen | 263 (100.0%) | 0 (0.0%) |
| Foreign Born, not a Citizen | 0 (0.0%) | 0 (0.0%) |
Health Insurance Coverage by Household Income in Bowdoinham
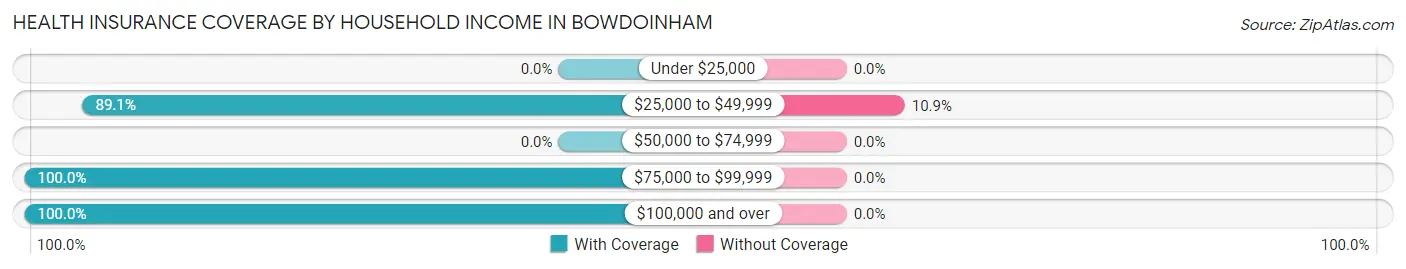
| Household Income | With Coverage | Without Coverage |
| Under $25,000 | 0 (0.0%) | 0 (0.0%) |
| $25,000 to $49,999 | 205 (89.1%) | 25 (10.9%) |
| $50,000 to $74,999 | 0 (0.0%) | 0 (0.0%) |
| $75,000 to $99,999 | 167 (100.0%) | 0 (0.0%) |
| $100,000 and over | 367 (100.0%) | 0 (0.0%) |
Public vs Private Health Insurance Coverage by Age in Bowdoinham
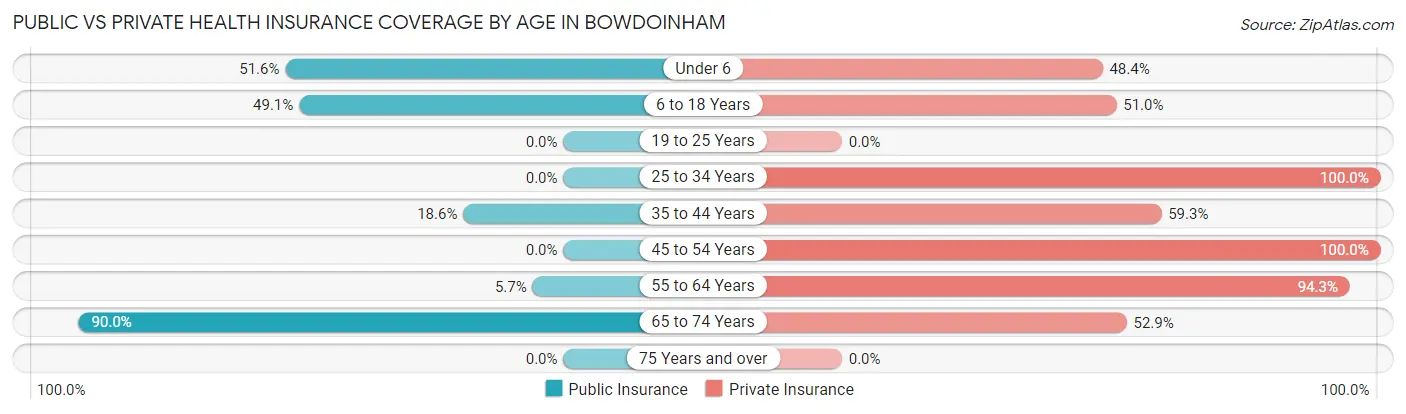
| Age Bracket | Public Insurance | Private Insurance |
| Under 6 | 16 (51.6%) | 15 (48.4%) |
| 6 to 18 Years | 129 (49.0%) | 134 (50.9%) |
| 19 to 25 Years | 0 (0.0%) | 0 (0.0%) |
| 25 to 34 Years | 0 (0.0%) | 30 (100.0%) |
| 35 to 44 Years | 21 (18.6%) | 67 (59.3%) |
| 45 to 54 Years | 0 (0.0%) | 154 (100.0%) |
| 55 to 64 Years | 2 (5.7%) | 33 (94.3%) |
| 65 to 74 Years | 126 (90.0%) | 74 (52.9%) |
| 75 Years and over | 0 (0.0%) | 0 (0.0%) |
| Total | 294 (38.4%) | 507 (66.2%) |
Disability Status by Sex by Age in Bowdoinham
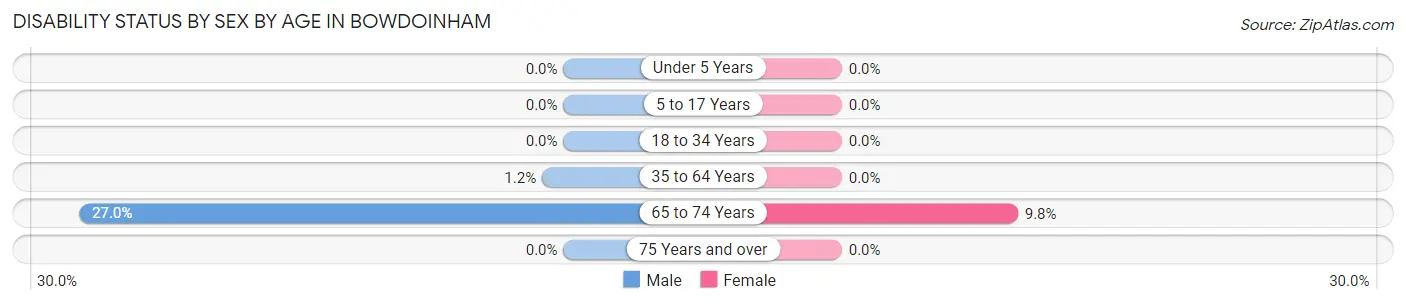
| Age Bracket | Male | Female |
| Under 5 Years | 0 (0.0%) | 0 (0.0%) |
| 5 to 17 Years | 0 (0.0%) | 0 (0.0%) |
| 18 to 34 Years | 0 (0.0%) | 0 (0.0%) |
| 35 to 64 Years | 2 (1.2%) | 0 (0.0%) |
| 65 to 74 Years | 24 (27.0%) | 5 (9.8%) |
| 75 Years and over | 0 (0.0%) | 0 (0.0%) |
Disability Class by Sex by Age in Bowdoinham
Disability Class: Hearing Difficulty
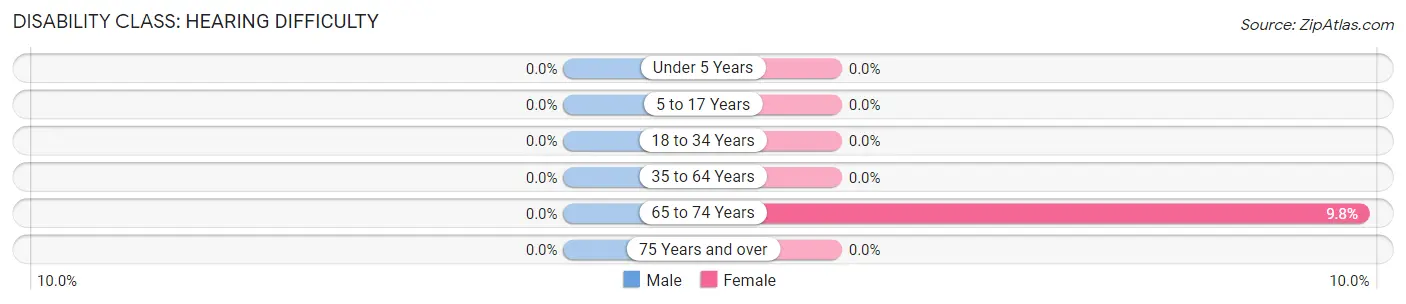
| Age Bracket | Male | Female |
| Under 5 Years | 0 (0.0%) | 0 (0.0%) |
| 5 to 17 Years | 0 (0.0%) | 0 (0.0%) |
| 18 to 34 Years | 0 (0.0%) | 0 (0.0%) |
| 35 to 64 Years | 0 (0.0%) | 0 (0.0%) |
| 65 to 74 Years | 0 (0.0%) | 5 (9.8%) |
| 75 Years and over | 0 (0.0%) | 0 (0.0%) |
Disability Class: Vision Difficulty
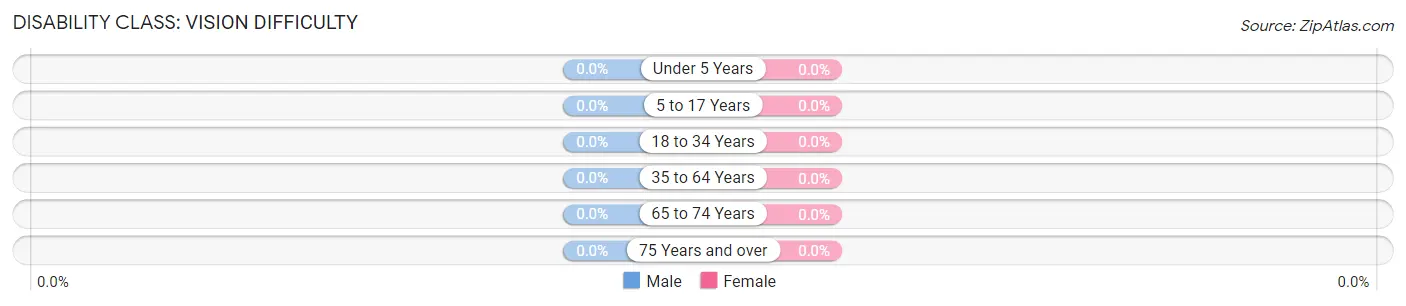
| Age Bracket | Male | Female |
| Under 5 Years | 0 (0.0%) | 0 (0.0%) |
| 5 to 17 Years | 0 (0.0%) | 0 (0.0%) |
| 18 to 34 Years | 0 (0.0%) | 0 (0.0%) |
| 35 to 64 Years | 0 (0.0%) | 0 (0.0%) |
| 65 to 74 Years | 0 (0.0%) | 0 (0.0%) |
| 75 Years and over | 0 (0.0%) | 0 (0.0%) |
Disability Class: Cognitive Difficulty
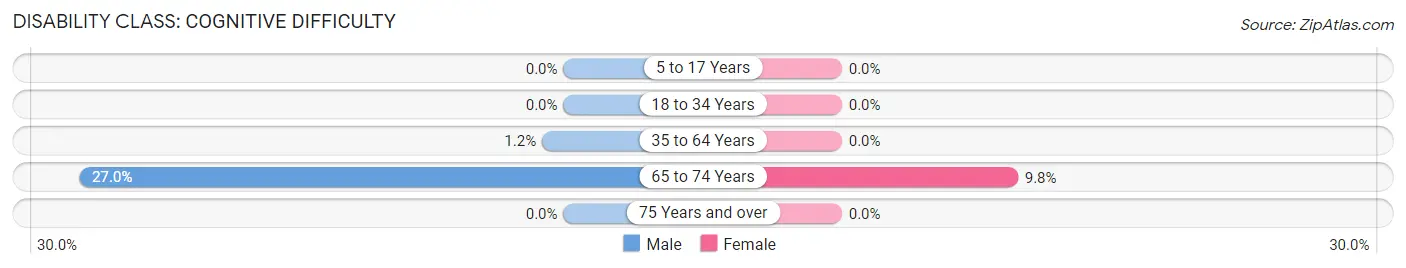
| Age Bracket | Male | Female |
| 5 to 17 Years | 0 (0.0%) | 0 (0.0%) |
| 18 to 34 Years | 0 (0.0%) | 0 (0.0%) |
| 35 to 64 Years | 2 (1.2%) | 0 (0.0%) |
| 65 to 74 Years | 24 (27.0%) | 5 (9.8%) |
| 75 Years and over | 0 (0.0%) | 0 (0.0%) |
Disability Class: Ambulatory Difficulty
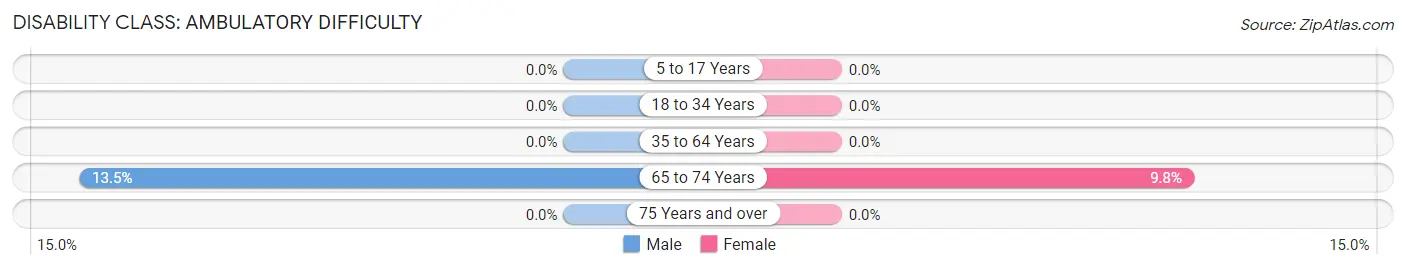
| Age Bracket | Male | Female |
| 5 to 17 Years | 0 (0.0%) | 0 (0.0%) |
| 18 to 34 Years | 0 (0.0%) | 0 (0.0%) |
| 35 to 64 Years | 0 (0.0%) | 0 (0.0%) |
| 65 to 74 Years | 12 (13.5%) | 5 (9.8%) |
| 75 Years and over | 0 (0.0%) | 0 (0.0%) |
Disability Class: Self-Care Difficulty
| Age Bracket | Male | Female |
| 5 to 17 Years | 0 (0.0%) | 0 (0.0%) |
| 18 to 34 Years | 0 (0.0%) | 0 (0.0%) |
| 35 to 64 Years | 0 (0.0%) | 0 (0.0%) |
| 65 to 74 Years | 0 (0.0%) | 0 (0.0%) |
| 75 Years and over | 0 (0.0%) | 0 (0.0%) |
Technology Access in Bowdoinham
Computing Device Access in Bowdoinham
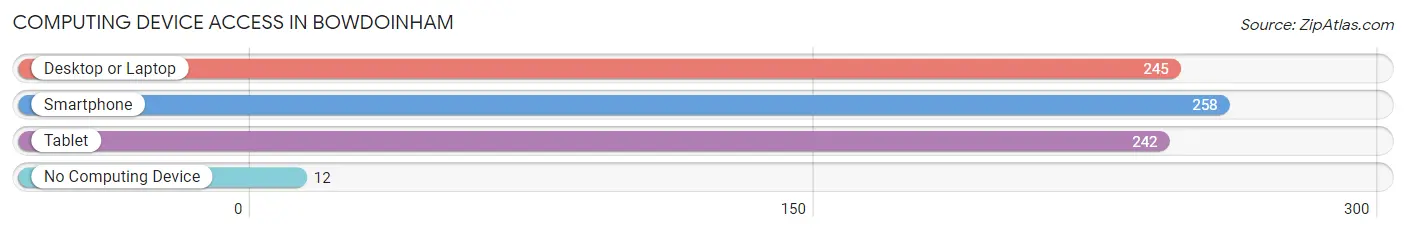
| Device Type | # Households | % Households |
| Desktop or Laptop | 245 | 90.7% |
| Smartphone | 258 | 95.6% |
| Tablet | 242 | 89.6% |
| No Computing Device | 12 | 4.4% |
| Total | 270 | 100.0% |
Internet Access in Bowdoinham
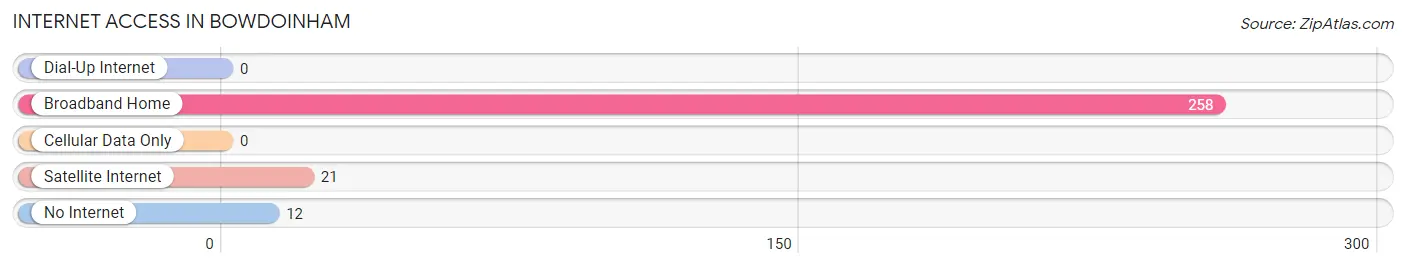
| Internet Type | # Households | % Households |
| Dial-Up Internet | 0 | 0.0% |
| Broadband Home | 258 | 95.6% |
| Cellular Data Only | 0 | 0.0% |
| Satellite Internet | 21 | 7.8% |
| No Internet | 12 | 4.4% |
| Total | 270 | 100.0% |
Bowdoinham Summary
Bowdoinham, Maine is a small town located in Sagadahoc County, in the Midcoast region of the state. It is situated on the banks of the Kennebec River, about 15 miles east of the state capital of Augusta. The town has a population of 2,717 people, according to the 2010 census.
History
The area that is now Bowdoinham was first settled in 1762 by a group of settlers from the Plymouth Colony. The town was incorporated in 1762 and named after James Bowdoin, a prominent Boston merchant and politician. The town was an important port on the Kennebec River, and was home to a number of shipbuilding and lumbering operations. In the 19th century, the town was a center of the ice trade, with ice harvested from the river and shipped to Boston and other cities.
Geography
Bowdoinham is located in the Midcoast region of Maine, about 15 miles east of the state capital of Augusta. The town is situated on the banks of the Kennebec River, and is bordered by the towns of Richmond to the north, Topsham to the east, and Dresden to the south. The town has a total area of 16.2 square miles, of which 15.7 square miles is land and 0.5 square miles is water.
Economy
Bowdoinham’s economy is largely based on agriculture and fishing. The town is home to several farms, including the Bowdoinham Community Farm, which produces a variety of vegetables, fruits, and herbs. The town is also home to several seafood processing plants, which process and package lobster, clams, and other seafood for sale.
Demographics
According to the 2010 census, the population of Bowdoinham was 2,717 people. The racial makeup of the town was 97.2% White, 0.7% African American, 0.3% Native American, 0.3% Asian, 0.2% from other races, and 1.5% from two or more races. The median household income was $41,944, and the median family income was $50,917. The per capita income was $20,945.
Conclusion
Bowdoinham, Maine is a small town located in Sagadahoc County, in the Midcoast region of the state. It is situated on the banks of the Kennebec River, about 15 miles east of the state capital of Augusta. The town has a population of 2,717 people, according to the 2010 census. The town’s economy is largely based on agriculture and fishing, and the town is home to several farms and seafood processing plants. The racial makeup of the town is 97.2% White, 0.7% African American, 0.3% Native American, 0.3% Asian, 0.2% from other races, and 1.5% from two or more races. The median household income was $41,944, and the median family income was $50,917. The per capita income was $20,945.
Common Questions
What is Per Capita Income in Bowdoinham?
Per Capita income in Bowdoinham is $35,131.
What is the Median Family Income in Bowdoinham?
Median Family Income in Bowdoinham is $89,647.
What is the Median Household income in Bowdoinham?
Median Household Income in Bowdoinham is $88,590.
What is Income or Wage Gap in Bowdoinham?
Income or Wage Gap in Bowdoinham is 26.1%.
Women in Bowdoinham earn 73.9 cents for every dollar earned by a man.
What is Inequality or Gini Index in Bowdoinham?
Inequality or Gini Index in Bowdoinham is 0.31.
What is the Total Population of Bowdoinham?
Total Population of Bowdoinham is 766.
What is the Total Male Population of Bowdoinham?
Total Male Population of Bowdoinham is 384.
What is the Total Female Population of Bowdoinham?
Total Female Population of Bowdoinham is 382.
What is the Ratio of Males per 100 Females in Bowdoinham?
There are 100.52 Males per 100 Females in Bowdoinham.
What is the Ratio of Females per 100 Males in Bowdoinham?
There are 99.48 Females per 100 Males in Bowdoinham.
What is the Median Population Age in Bowdoinham?
Median Population Age in Bowdoinham is 43.0 Years.
What is the Average Family Size in Bowdoinham
Average Family Size in Bowdoinham is 3.1 People.
What is the Average Household Size in Bowdoinham
Average Household Size in Bowdoinham is 2.8 People.
How Large is the Labor Force in Bowdoinham?
There are 368 People in the Labor Forcein in Bowdoinham.
What is the Percentage of People in the Labor Force in Bowdoinham?
78.0% of People are in the Labor Force in Bowdoinham.
What is the Unemployment Rate in Bowdoinham?
Unemployment Rate in Bowdoinham is 0.5%.