Bear Creek, TX Map & Demographics
Bear Creek Map
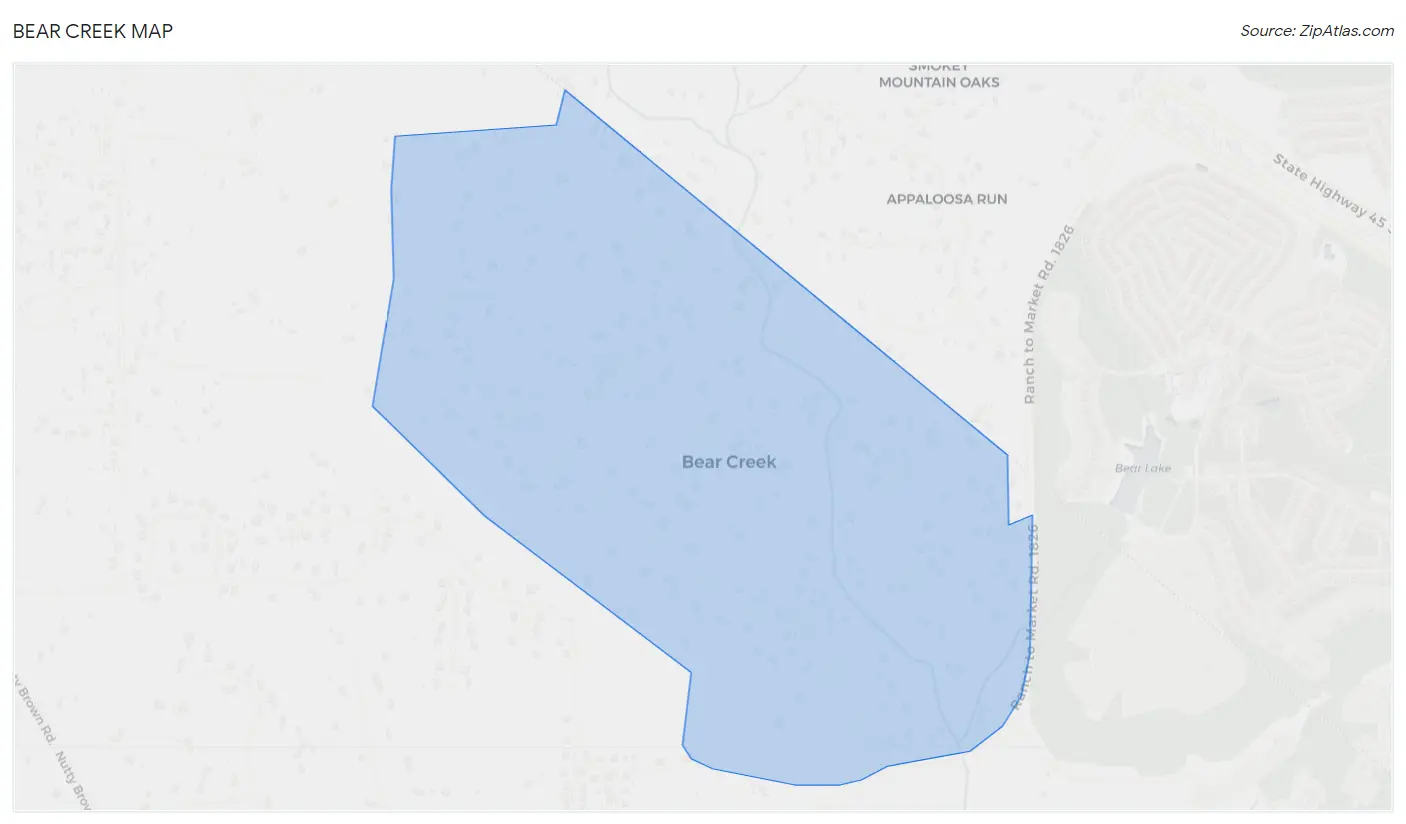
Bear Creek Overview
$62,091
PER CAPITA INCOME
$128,542
AVG FAMILY INCOME
$126,500
AVG HOUSEHOLD INCOME
5.0%
WAGE / INCOME GAP [ % ]
95.0¢/ $1
WAGE / INCOME GAP [ $ ]
0.40
INEQUALITY / GINI INDEX
485
TOTAL POPULATION
212
MALE POPULATION
273
FEMALE POPULATION
77.66
MALES / 100 FEMALES
128.77
FEMALES / 100 MALES
50.1
MEDIAN AGE
2.8
AVG FAMILY SIZE
2.5
AVG HOUSEHOLD SIZE
246
LABOR FORCE [ PEOPLE ]
62.3%
PERCENT IN LABOR FORCE
6.1%
UNEMPLOYMENT RATE
Income in Bear Creek
Income Overview in Bear Creek
Per Capita Income in Bear Creek is $62,091, while median incomes of families and households are $128,542 and $126,500 respectively.
| Characteristic | Number | Measure |
| Per Capita Income | 485 | $62,091 |
| Median Family Income | 157 | $128,542 |
| Mean Family Income | 157 | $161,326 |
| Median Household Income | 194 | $126,500 |
| Mean Household Income | 194 | $151,925 |
| Income Deficit | 157 | $0 |
| Wage / Income Gap (%) | 485 | 4.97% |
| Wage / Income Gap ($) | 485 | 95.03¢ per $1 |
| Gini / Inequality Index | 485 | 0.40 |
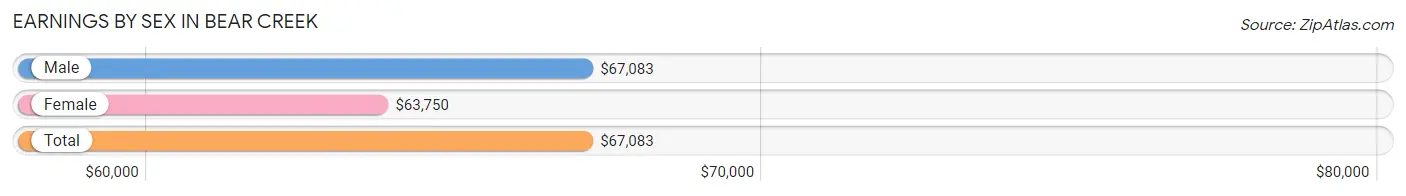
Earnings by Sex in Bear Creek
Average Earnings in Bear Creek are $67,083, $67,083 for men and $63,750 for women, a difference of 5.0%.
| Sex | Number | Average Earnings |
| Male | 134 (53.6%) | $67,083 |
| Female | 116 (46.4%) | $63,750 |
| Total | 250 (100.0%) | $67,083 |
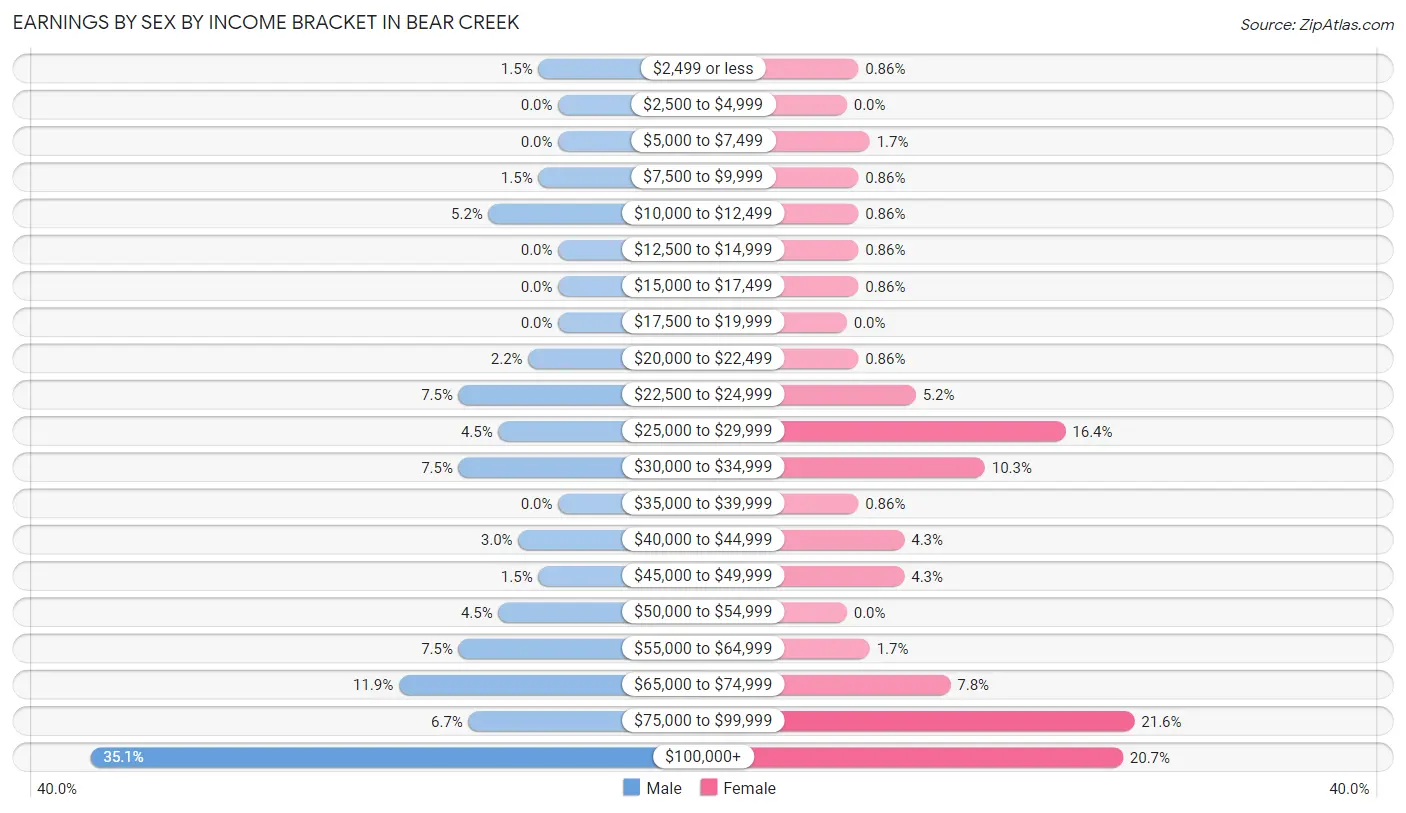
Earnings by Sex by Income Bracket in Bear Creek
The most common earnings brackets in Bear Creek are $100,000+ for men (47 | 35.1%) and $75,000 to $99,999 for women (25 | 21.5%).
| Income | Male | Female |
| $2,499 or less | 2 (1.5%) | 1 (0.9%) |
| $2,500 to $4,999 | 0 (0.0%) | 0 (0.0%) |
| $5,000 to $7,499 | 0 (0.0%) | 2 (1.7%) |
| $7,500 to $9,999 | 2 (1.5%) | 1 (0.9%) |
| $10,000 to $12,499 | 7 (5.2%) | 1 (0.9%) |
| $12,500 to $14,999 | 0 (0.0%) | 1 (0.9%) |
| $15,000 to $17,499 | 0 (0.0%) | 1 (0.9%) |
| $17,500 to $19,999 | 0 (0.0%) | 0 (0.0%) |
| $20,000 to $22,499 | 3 (2.2%) | 1 (0.9%) |
| $22,500 to $24,999 | 10 (7.5%) | 6 (5.2%) |
| $25,000 to $29,999 | 6 (4.5%) | 19 (16.4%) |
| $30,000 to $34,999 | 10 (7.5%) | 12 (10.3%) |
| $35,000 to $39,999 | 0 (0.0%) | 1 (0.9%) |
| $40,000 to $44,999 | 4 (3.0%) | 5 (4.3%) |
| $45,000 to $49,999 | 2 (1.5%) | 5 (4.3%) |
| $50,000 to $54,999 | 6 (4.5%) | 0 (0.0%) |
| $55,000 to $64,999 | 10 (7.5%) | 2 (1.7%) |
| $65,000 to $74,999 | 16 (11.9%) | 9 (7.8%) |
| $75,000 to $99,999 | 9 (6.7%) | 25 (21.5%) |
| $100,000+ | 47 (35.1%) | 24 (20.7%) |
| Total | 134 (100.0%) | 116 (100.0%) |
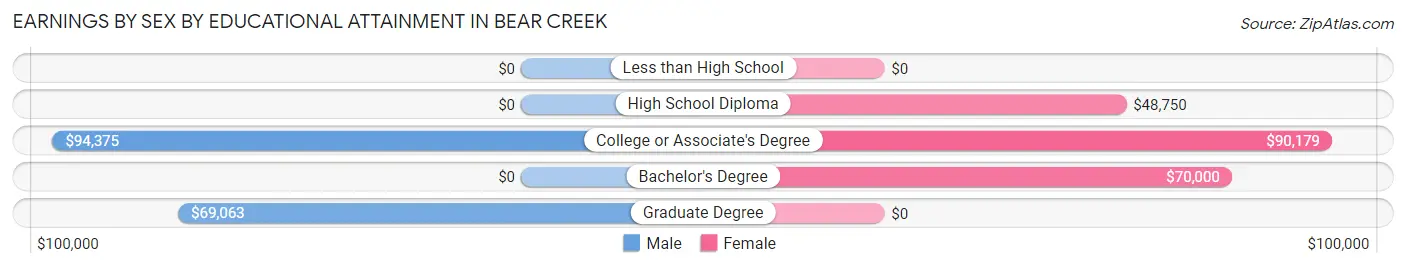
Earnings by Sex by Educational Attainment in Bear Creek
Average earnings in Bear Creek are $67,875 for men and $69,375 for women, a difference of 2.2%. Men with an educational attainment of college or associate's degree enjoy the highest average annual earnings of $94,375, while those with graduate degree education earn the least with $69,063. Women with an educational attainment of college or associate's degree earn the most with the average annual earnings of $90,179, while those with high school diploma education have the smallest earnings of $48,750.
| Educational Attainment | Male Income | Female Income |
| Less than High School | - | - |
| High School Diploma | - | - |
| College or Associate's Degree | $94,375 | $90,179 |
| Bachelor's Degree | - | - |
| Graduate Degree | $69,063 | $0 |
| Total | $67,875 | $69,375 |
Family Income in Bear Creek
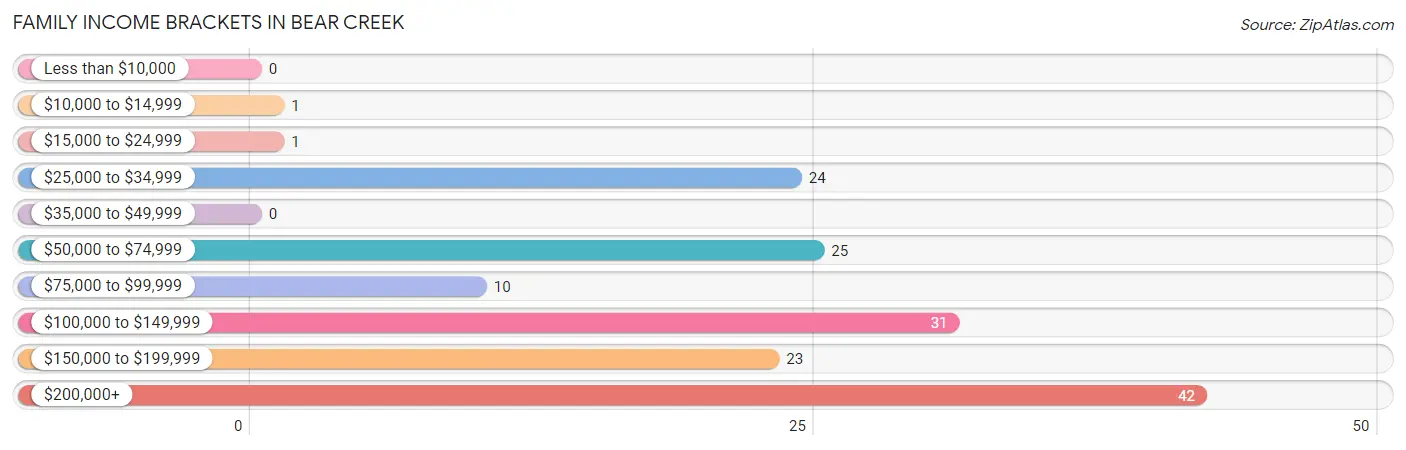
Family Income Brackets in Bear Creek
According to the Bear Creek family income data, there are 42 families falling into the $200,000+ income range, which is the most common income bracket and makes up 26.8% of all families.
| Income Bracket | # Families | % Families |
| Less than $10,000 | 0 | 0.0% |
| $10,000 to $14,999 | 1 | 0.6% |
| $15,000 to $24,999 | 1 | 0.6% |
| $25,000 to $34,999 | 24 | 15.3% |
| $35,000 to $49,999 | 0 | 0.0% |
| $50,000 to $74,999 | 25 | 15.9% |
| $75,000 to $99,999 | 10 | 6.4% |
| $100,000 to $149,999 | 31 | 19.7% |
| $150,000 to $199,999 | 23 | 14.6% |
| $200,000+ | 42 | 26.8% |
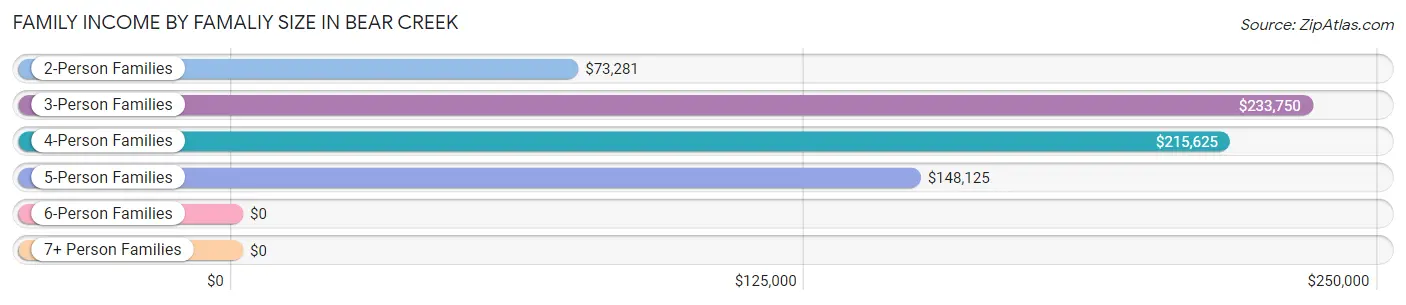
Family Income by Famaliy Size in Bear Creek
3-person families (34 | 21.7%) account for the highest median family income in Bear Creek with $233,750 per family, while 3-person families (34 | 21.7%) have the highest median income of $77,917 per family member.
| Income Bracket | # Families | Median Income |
| 2-Person Families | 89 (56.7%) | $73,281 |
| 3-Person Families | 34 (21.7%) | $233,750 |
| 4-Person Families | 19 (12.1%) | $215,625 |
| 5-Person Families | 15 (9.6%) | $148,125 |
| 6-Person Families | 0 (0.0%) | $0 |
| 7+ Person Families | 0 (0.0%) | $0 |
| Total | 157 (100.0%) | $128,542 |
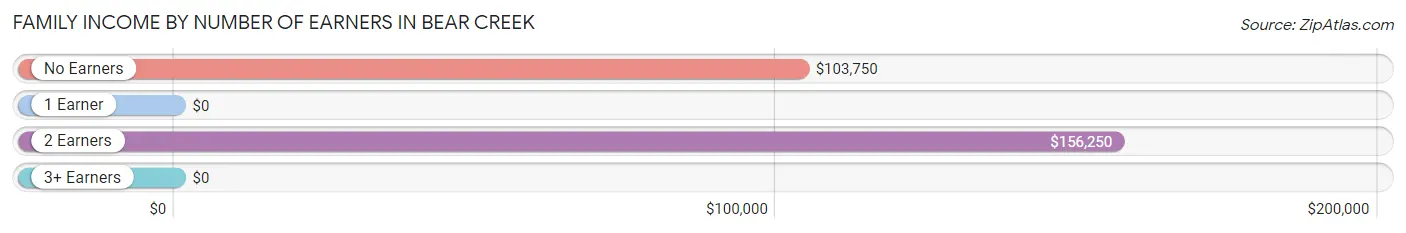
Family Income by Number of Earners in Bear Creek
| Number of Earners | # Families | Median Income |
| No Earners | 19 (12.1%) | $103,750 |
| 1 Earner | 74 (47.1%) | $0 |
| 2 Earners | 61 (38.9%) | $156,250 |
| 3+ Earners | 3 (1.9%) | $0 |
| Total | 157 (100.0%) | $128,542 |
Household Income in Bear Creek
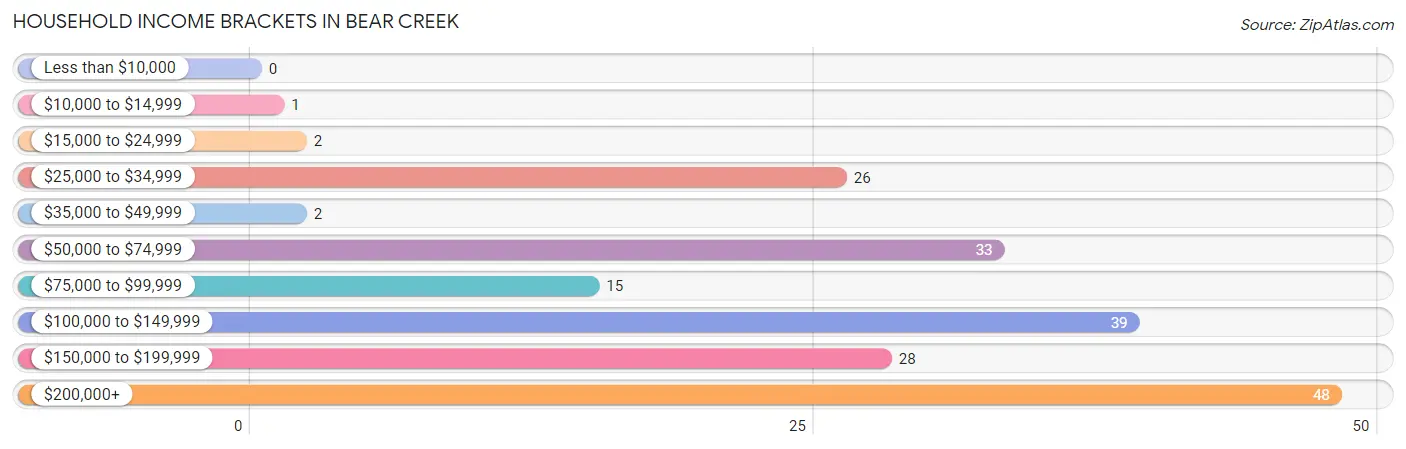
Household Income Brackets in Bear Creek
With 48 households falling in the category, the $200,000+ income range is the most frequent in Bear Creek, accounting for 24.7% of all households.
| Income Bracket | # Households | % Households |
| Less than $10,000 | 0 | 0.0% |
| $10,000 to $14,999 | 1 | 0.5% |
| $15,000 to $24,999 | 2 | 1.0% |
| $25,000 to $34,999 | 26 | 13.4% |
| $35,000 to $49,999 | 2 | 1.0% |
| $50,000 to $74,999 | 33 | 17.0% |
| $75,000 to $99,999 | 15 | 7.7% |
| $100,000 to $149,999 | 39 | 20.1% |
| $150,000 to $199,999 | 28 | 14.4% |
| $200,000+ | 48 | 24.7% |
Household Income by Householder Age in Bear Creek
The median household income in Bear Creek is $126,500, with the highest median household income of $135,417 found in the 45 to 64 years age bracket for the primary householder. A total of 89 households (45.9%) fall into this category.
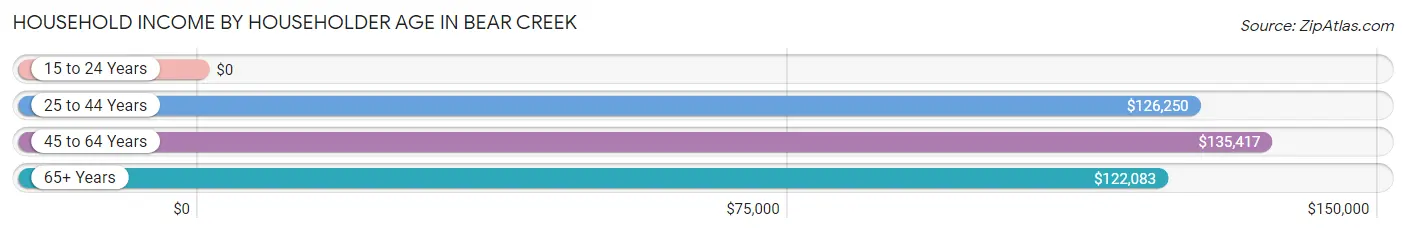
| Income Bracket | # Households | Median Income |
| 15 to 24 Years | 0 (0.0%) | $0 |
| 25 to 44 Years | 48 (24.7%) | $126,250 |
| 45 to 64 Years | 89 (45.9%) | $135,417 |
| 65+ Years | 57 (29.4%) | $122,083 |
| Total | 194 (100.0%) | $126,500 |
Poverty in Bear Creek
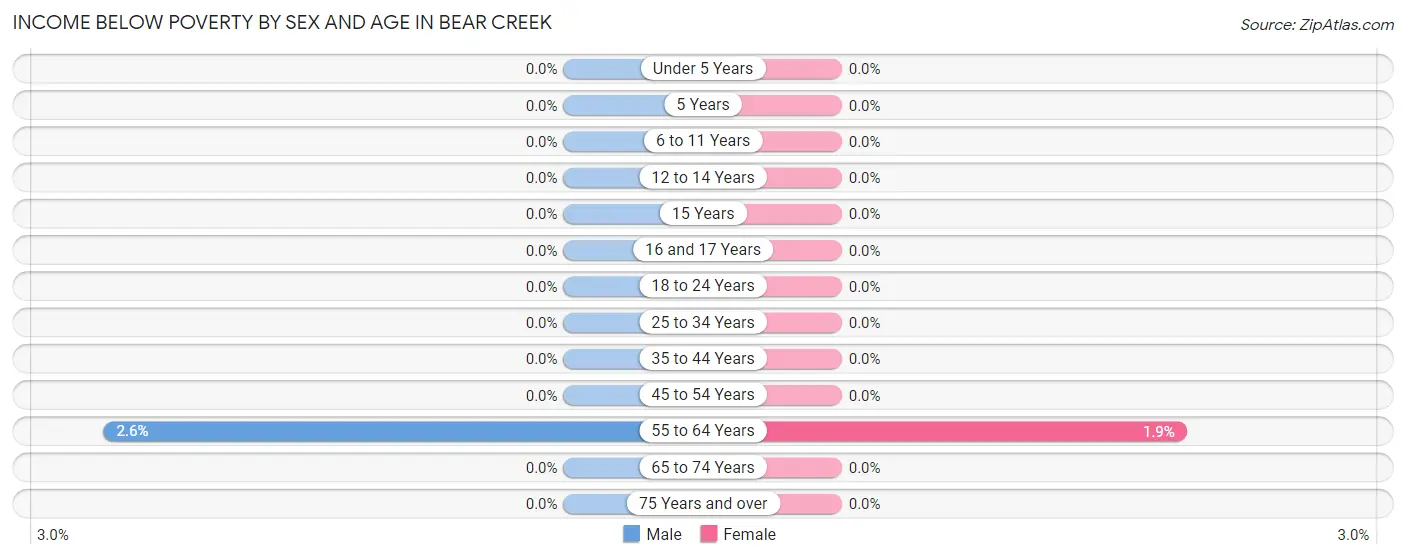
Income Below Poverty by Sex and Age in Bear Creek
With 0.5% poverty level for males and 0.4% for females among the residents of Bear Creek, 55 to 64 year old males and 55 to 64 year old females are the most vulnerable to poverty, with 1 males (2.6%) and 1 females (1.9%) in their respective age groups living below the poverty level.
| Age Bracket | Male | Female |
| Under 5 Years | 0 (0.0%) | 0 (0.0%) |
| 5 Years | 0 (0.0%) | 0 (0.0%) |
| 6 to 11 Years | 0 (0.0%) | 0 (0.0%) |
| 12 to 14 Years | 0 (0.0%) | 0 (0.0%) |
| 15 Years | 0 (0.0%) | 0 (0.0%) |
| 16 and 17 Years | 0 (0.0%) | 0 (0.0%) |
| 18 to 24 Years | 0 (0.0%) | 0 (0.0%) |
| 25 to 34 Years | 0 (0.0%) | 0 (0.0%) |
| 35 to 44 Years | 0 (0.0%) | 0 (0.0%) |
| 45 to 54 Years | 0 (0.0%) | 0 (0.0%) |
| 55 to 64 Years | 1 (2.6%) | 1 (1.9%) |
| 65 to 74 Years | 0 (0.0%) | 0 (0.0%) |
| 75 Years and over | 0 (0.0%) | 0 (0.0%) |
| Total | 1 (0.5%) | 1 (0.4%) |
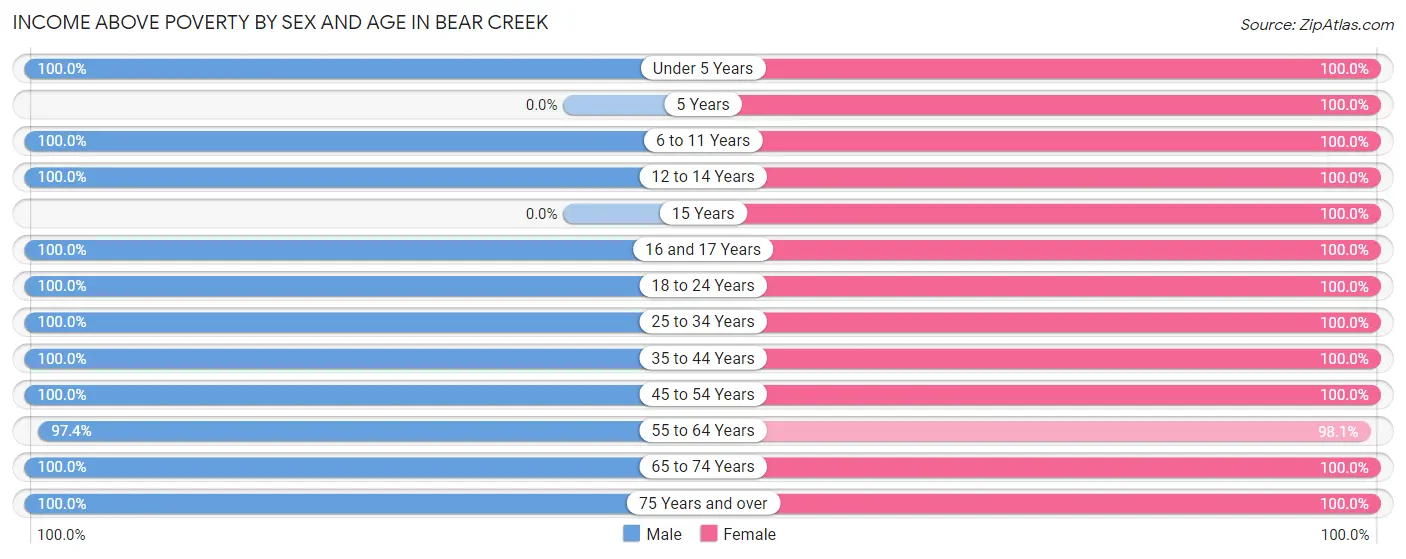
Income Above Poverty by Sex and Age in Bear Creek
According to the poverty statistics in Bear Creek, males aged under 5 years and females aged under 5 years are the age groups that are most secure financially, with 100.0% of males and 100.0% of females in these age groups living above the poverty line.
| Age Bracket | Male | Female |
| Under 5 Years | 3 (100.0%) | 23 (100.0%) |
| 5 Years | 0 (0.0%) | 2 (100.0%) |
| 6 to 11 Years | 9 (100.0%) | 26 (100.0%) |
| 12 to 14 Years | 12 (100.0%) | 4 (100.0%) |
| 15 Years | 0 (0.0%) | 11 (100.0%) |
| 16 and 17 Years | 2 (100.0%) | 17 (100.0%) |
| 18 to 24 Years | 5 (100.0%) | 7 (100.0%) |
| 25 to 34 Years | 12 (100.0%) | 14 (100.0%) |
| 35 to 44 Years | 36 (100.0%) | 26 (100.0%) |
| 45 to 54 Years | 29 (100.0%) | 43 (100.0%) |
| 55 to 64 Years | 38 (97.4%) | 51 (98.1%) |
| 65 to 74 Years | 49 (100.0%) | 39 (100.0%) |
| 75 Years and over | 16 (100.0%) | 9 (100.0%) |
| Total | 211 (99.5%) | 272 (99.6%) |
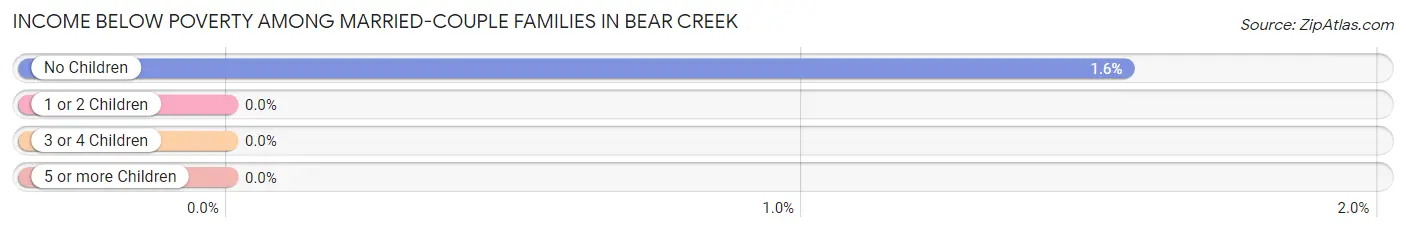
Income Below Poverty Among Married-Couple Families in Bear Creek
The poverty statistics for married-couple families in Bear Creek show that 0.9% or 1 of the total 117 families live below the poverty line. Families with no children have the highest poverty rate of 1.6%, comprising of 1 families. On the other hand, families with 1 or 2 children have the lowest poverty rate of 0.0%, which includes 0 families.
| Children | Above Poverty | Below Poverty |
| No Children | 63 (98.4%) | 1 (1.6%) |
| 1 or 2 Children | 43 (100.0%) | 0 (0.0%) |
| 3 or 4 Children | 10 (100.0%) | 0 (0.0%) |
| 5 or more Children | 0 (0.0%) | 0 (0.0%) |
| Total | 116 (99.2%) | 1 (0.9%) |
Income Below Poverty Among Single-Parent Households in Bear Creek
| Children | Single Father | Single Mother |
| No Children | 0 (0.0%) | 0 (0.0%) |
| 1 or 2 Children | 0 (0.0%) | 0 (0.0%) |
| 3 or 4 Children | 0 (0.0%) | 0 (0.0%) |
| 5 or more Children | 0 (0.0%) | 0 (0.0%) |
| Total | 0 (0.0%) | 0 (0.0%) |
Income Below Poverty Among Married-Couple vs Single-Parent Households in Bear Creek
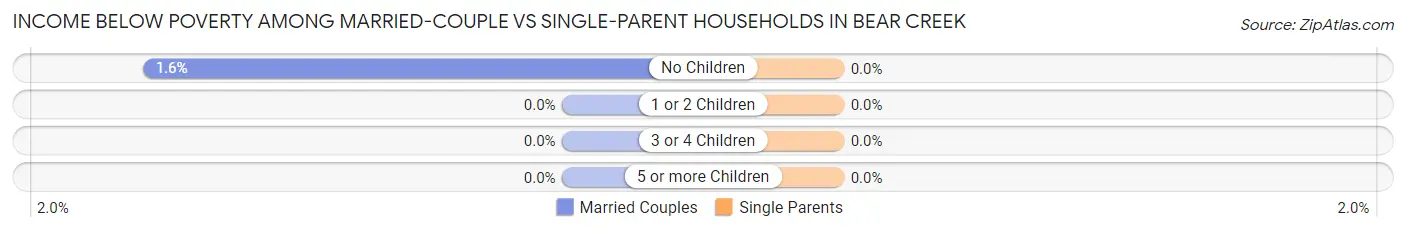
| Children | Married-Couple Families | Single-Parent Households |
| No Children | 1 (1.6%) | 0 (0.0%) |
| 1 or 2 Children | 0 (0.0%) | 0 (0.0%) |
| 3 or 4 Children | 0 (0.0%) | 0 (0.0%) |
| 5 or more Children | 0 (0.0%) | 0 (0.0%) |
| Total | 1 (0.9%) | 0 (0.0%) |
Race in Bear Creek
The most populous races in Bear Creek are White / Caucasian (426 | 87.8%), Hispanic or Latino (51 | 10.5%), and Two or more Races (32 | 6.6%).
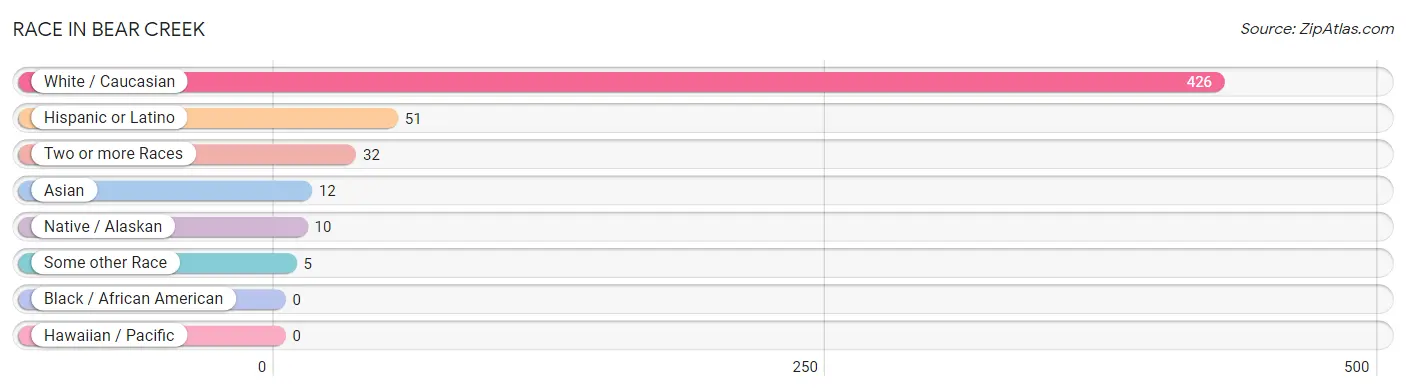
| Race | # Population | % Population |
| Asian | 12 | 2.5% |
| Black / African American | 0 | 0.0% |
| Hawaiian / Pacific | 0 | 0.0% |
| Hispanic or Latino | 51 | 10.5% |
| Native / Alaskan | 10 | 2.1% |
| White / Caucasian | 426 | 87.8% |
| Two or more Races | 32 | 6.6% |
| Some other Race | 5 | 1.0% |
| Total | 485 | 100.0% |
Ancestry in Bear Creek
The most populous ancestries reported in Bear Creek are Irish (71 | 14.6%), English (66 | 13.6%), German (63 | 13.0%), Mexican (37 | 7.6%), and Italian (27 | 5.6%), together accounting for 54.4% of all Bear Creek residents.
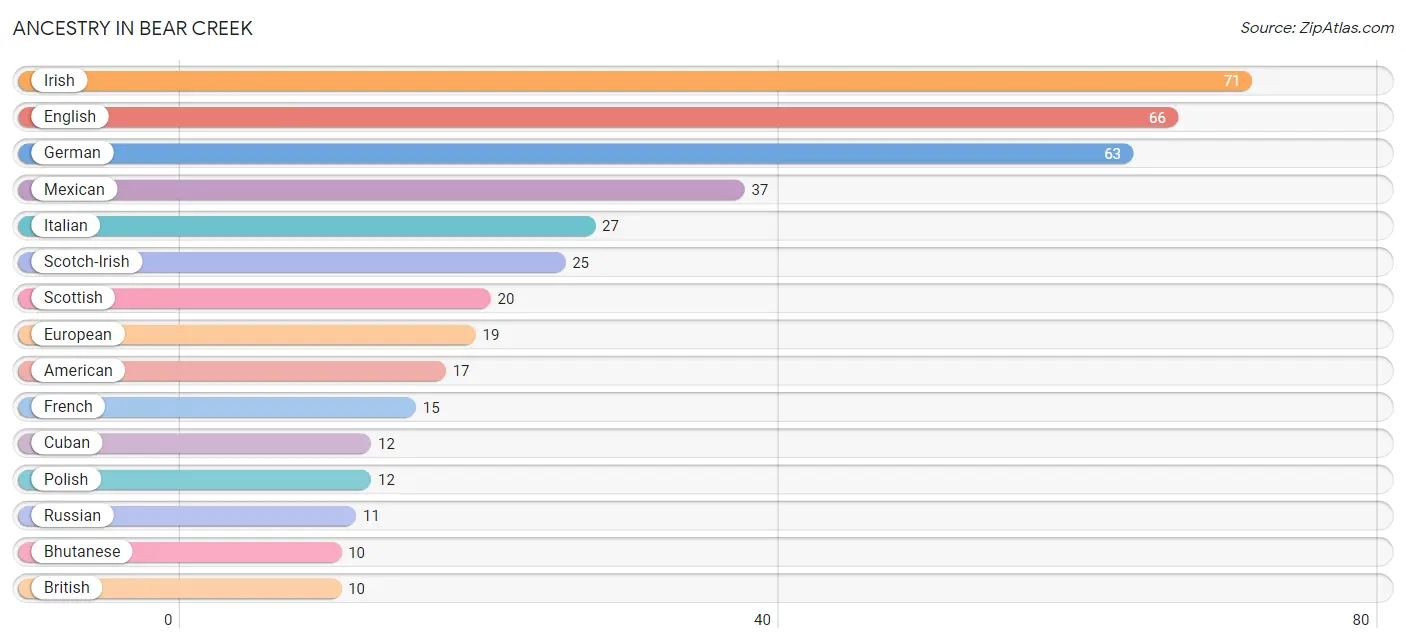
| Ancestry | # Population | % Population |
| American | 17 | 3.5% |
| Austrian | 2 | 0.4% |
| Belgian | 1 | 0.2% |
| Bhutanese | 10 | 2.1% |
| British | 10 | 2.1% |
| Cajun | 5 | 1.0% |
| Celtic | 1 | 0.2% |
| Cherokee | 1 | 0.2% |
| Chickasaw | 2 | 0.4% |
| Cuban | 12 | 2.5% |
| Czech | 1 | 0.2% |
| Czechoslovakian | 1 | 0.2% |
| Dutch | 5 | 1.0% |
| English | 66 | 13.6% |
| European | 19 | 3.9% |
| Finnish | 2 | 0.4% |
| French | 15 | 3.1% |
| German | 63 | 13.0% |
| Greek | 5 | 1.0% |
| Hungarian | 1 | 0.2% |
| Indian (Asian) | 2 | 0.4% |
| Irish | 71 | 14.6% |
| Italian | 27 | 5.6% |
| Korean | 1 | 0.2% |
| Mexican | 37 | 7.6% |
| Norwegian | 1 | 0.2% |
| Pakistani | 3 | 0.6% |
| Polish | 12 | 2.5% |
| Romanian | 6 | 1.2% |
| Russian | 11 | 2.3% |
| Scandinavian | 1 | 0.2% |
| Scotch-Irish | 25 | 5.1% |
| Scottish | 20 | 4.1% |
| Slovak | 1 | 0.2% |
| Slovene | 2 | 0.4% |
| Spaniard | 2 | 0.4% |
| Swiss | 1 | 0.2% |
| Turkish | 2 | 0.4% | View All 38 Rows |
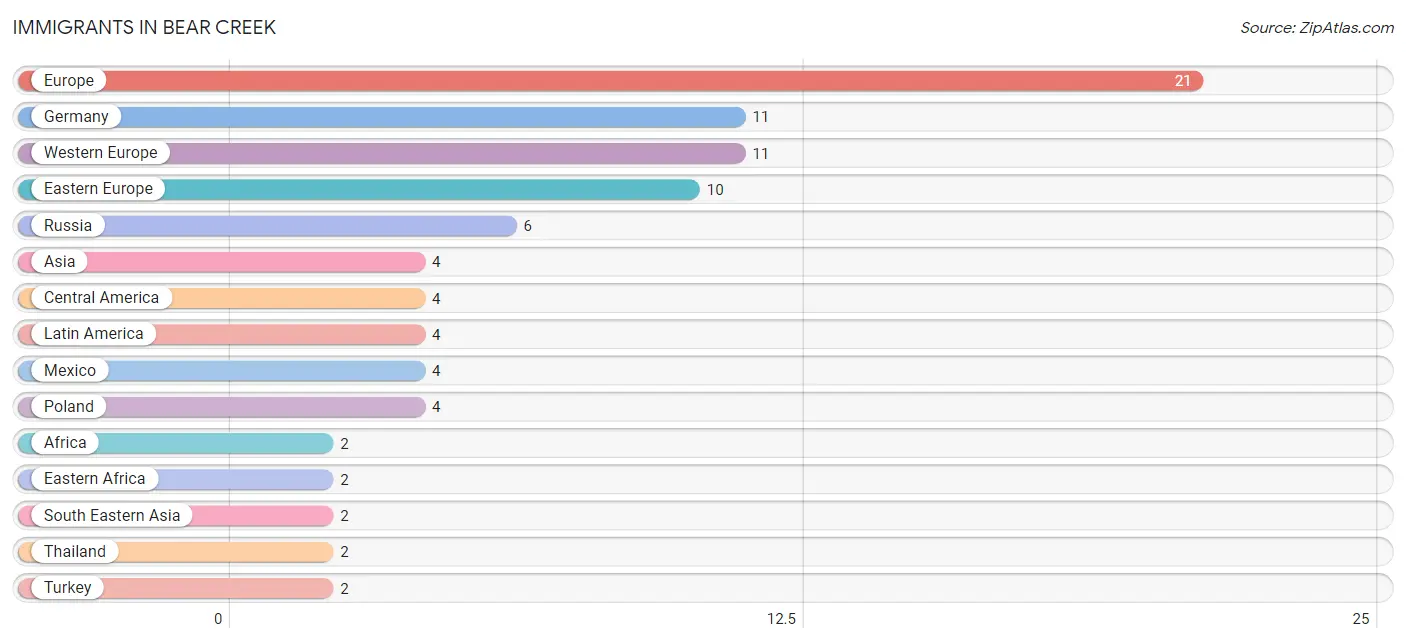
Immigrants in Bear Creek
The most numerous immigrant groups reported in Bear Creek came from Europe (21 | 4.3%), Germany (11 | 2.3%), Western Europe (11 | 2.3%), Eastern Europe (10 | 2.1%), and Russia (6 | 1.2%), together accounting for 12.2% of all Bear Creek residents.
| Immigration Origin | # Population | % Population |
| Africa | 2 | 0.4% |
| Asia | 4 | 0.8% |
| Australia | 1 | 0.2% |
| Central America | 4 | 0.8% |
| Eastern Africa | 2 | 0.4% |
| Eastern Europe | 10 | 2.1% |
| Europe | 21 | 4.3% |
| Germany | 11 | 2.3% |
| Latin America | 4 | 0.8% |
| Mexico | 4 | 0.8% |
| Oceania | 1 | 0.2% |
| Poland | 4 | 0.8% |
| Russia | 6 | 1.2% |
| South Eastern Asia | 2 | 0.4% |
| Thailand | 2 | 0.4% |
| Turkey | 2 | 0.4% |
| Western Asia | 2 | 0.4% |
| Western Europe | 11 | 2.3% |
| Zimbabwe | 2 | 0.4% | View All 19 Rows |
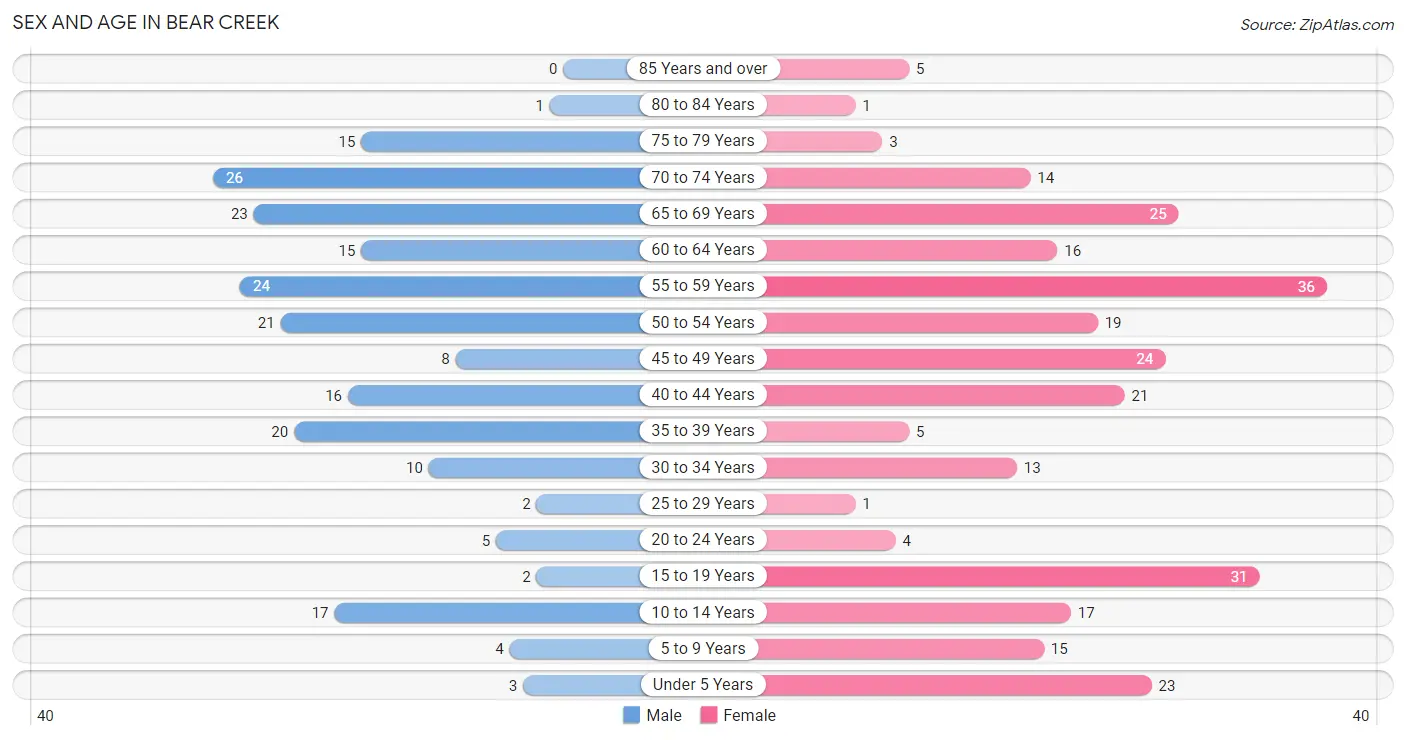
Sex and Age in Bear Creek
Sex and Age in Bear Creek
The most populous age groups in Bear Creek are 70 to 74 Years (26 | 12.3%) for men and 55 to 59 Years (36 | 13.2%) for women.
| Age Bracket | Male | Female |
| Under 5 Years | 3 (1.4%) | 23 (8.4%) |
| 5 to 9 Years | 4 (1.9%) | 15 (5.5%) |
| 10 to 14 Years | 17 (8.0%) | 17 (6.2%) |
| 15 to 19 Years | 2 (0.9%) | 31 (11.4%) |
| 20 to 24 Years | 5 (2.4%) | 4 (1.5%) |
| 25 to 29 Years | 2 (0.9%) | 1 (0.4%) |
| 30 to 34 Years | 10 (4.7%) | 13 (4.8%) |
| 35 to 39 Years | 20 (9.4%) | 5 (1.8%) |
| 40 to 44 Years | 16 (7.5%) | 21 (7.7%) |
| 45 to 49 Years | 8 (3.8%) | 24 (8.8%) |
| 50 to 54 Years | 21 (9.9%) | 19 (7.0%) |
| 55 to 59 Years | 24 (11.3%) | 36 (13.2%) |
| 60 to 64 Years | 15 (7.1%) | 16 (5.9%) |
| 65 to 69 Years | 23 (10.8%) | 25 (9.2%) |
| 70 to 74 Years | 26 (12.3%) | 14 (5.1%) |
| 75 to 79 Years | 15 (7.1%) | 3 (1.1%) |
| 80 to 84 Years | 1 (0.5%) | 1 (0.4%) |
| 85 Years and over | 0 (0.0%) | 5 (1.8%) |
| Total | 212 (100.0%) | 273 (100.0%) |
Families and Households in Bear Creek
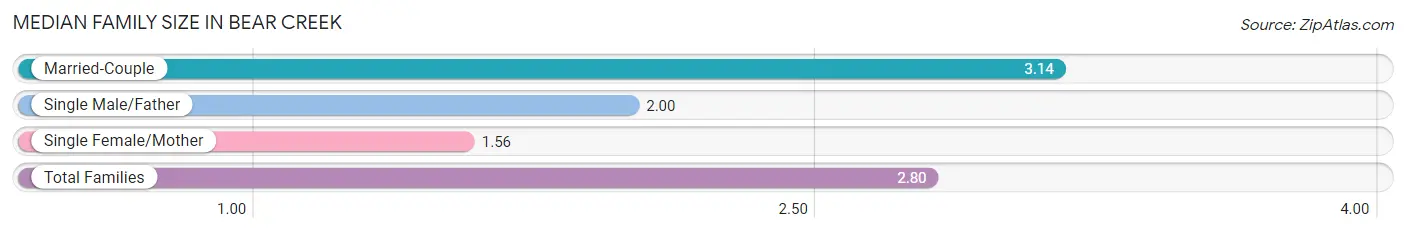
Median Family Size in Bear Creek
The median family size in Bear Creek is 2.80 persons per family, with married-couple families (117 | 74.5%) accounting for the largest median family size of 3.14 persons per family. On the other hand, single female/mother families (18 | 11.5%) represent the smallest median family size with 1.56 persons per family.
| Family Type | # Families | Family Size |
| Married-Couple | 117 (74.5%) | 3.14 |
| Single Male/Father | 22 (14.0%) | 2.00 |
| Single Female/Mother | 18 (11.5%) | 1.56 |
| Total Families | 157 (100.0%) | 2.80 |
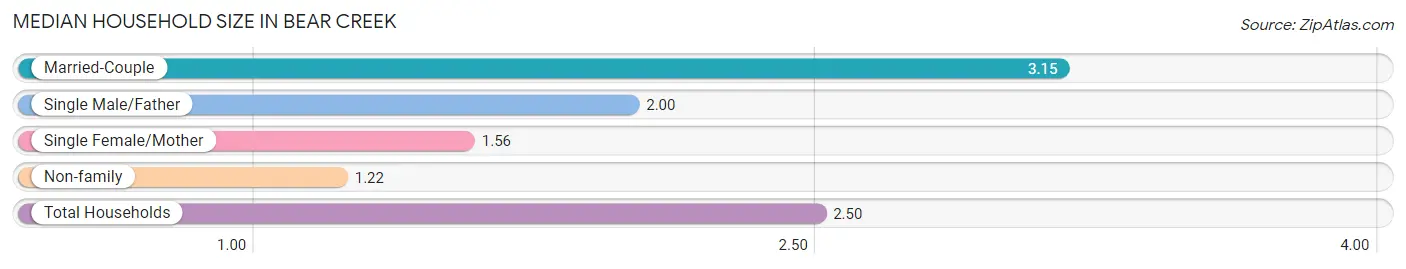
Median Household Size in Bear Creek
The median household size in Bear Creek is 2.50 persons per household, with married-couple households (117 | 60.3%) accounting for the largest median household size of 3.15 persons per household. non-family households (37 | 19.1%) represent the smallest median household size with 1.22 persons per household.
| Household Type | # Households | Household Size |
| Married-Couple | 117 (60.3%) | 3.15 |
| Single Male/Father | 22 (11.3%) | 2.00 |
| Single Female/Mother | 18 (9.3%) | 1.56 |
| Non-family | 37 (19.1%) | 1.22 |
| Total Households | 194 (100.0%) | 2.50 |
Household Size by Marriage Status in Bear Creek
Out of a total of 194 households in Bear Creek, 157 (80.9%) are family households, while 37 (19.1%) are nonfamily households. The most numerous type of family households are 2-person households, comprising 88, and the most common type of nonfamily households are 1-person households, comprising 27.
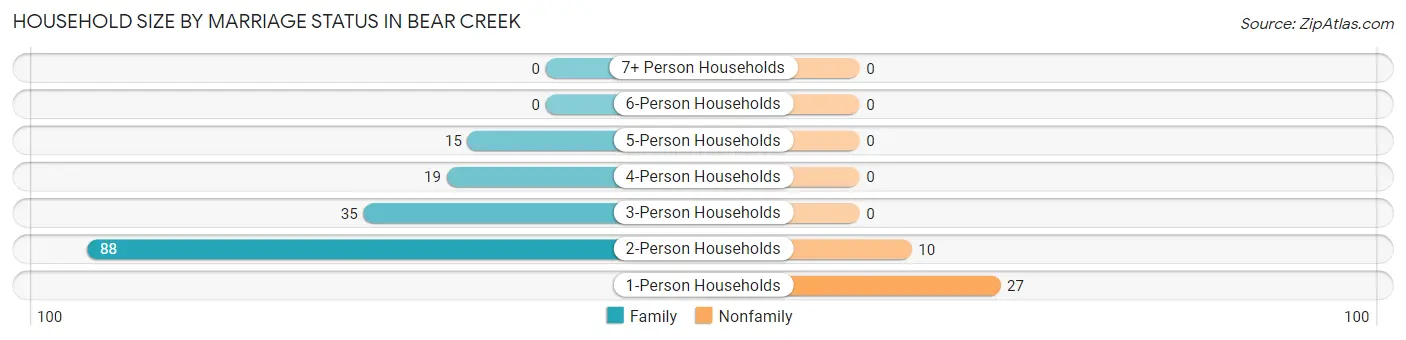
| Household Size | Family Households | Nonfamily Households |
| 1-Person Households | - | 27 (13.9%) |
| 2-Person Households | 88 (45.4%) | 10 (5.1%) |
| 3-Person Households | 35 (18.0%) | 0 (0.0%) |
| 4-Person Households | 19 (9.8%) | 0 (0.0%) |
| 5-Person Households | 15 (7.7%) | 0 (0.0%) |
| 6-Person Households | 0 (0.0%) | 0 (0.0%) |
| 7+ Person Households | 0 (0.0%) | 0 (0.0%) |
| Total | 157 (80.9%) | 37 (19.1%) |
Female Fertility in Bear Creek
Fertility by Age in Bear Creek
Average fertility rate in Bear Creek is 59.0 births per 1,000 women. Women in the age bracket of 35 to 50 years have the highest fertility rate with 115.0 births per 1,000 women. Women in the age bracket of 35 to 50 years acount for 100.0% of all women with births.
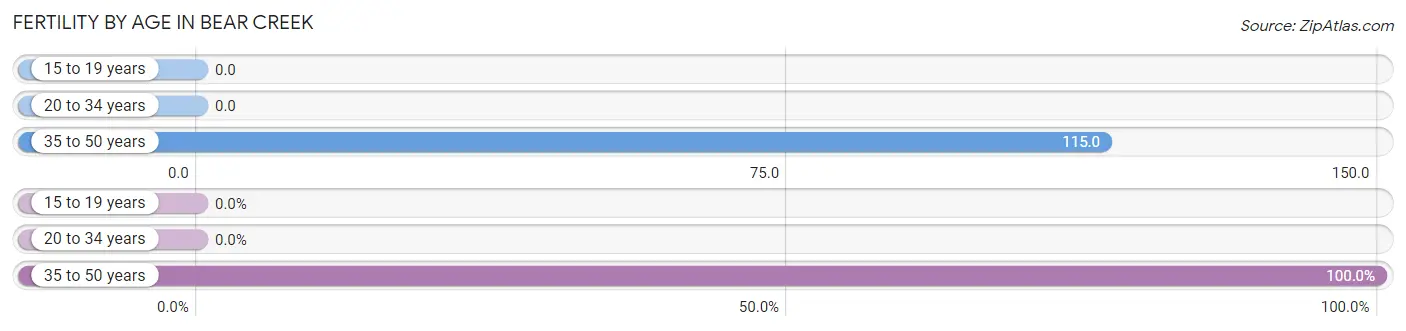
| Age Bracket | Women with Births | Births / 1,000 Women |
| 15 to 19 years | 0 (0.0%) | 0.0 |
| 20 to 34 years | 0 (0.0%) | 0.0 |
| 35 to 50 years | 6 (100.0%) | 115.0 |
| Total | 6 (100.0%) | 59.0 |
Fertility by Age by Marriage Status in Bear Creek
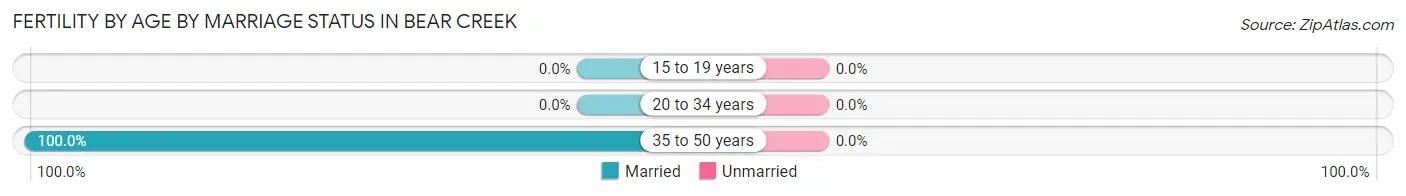
| Age Bracket | Married | Unmarried |
| 15 to 19 years | 0 (0.0%) | 0 (0.0%) |
| 20 to 34 years | 0 (0.0%) | 0 (0.0%) |
| 35 to 50 years | 6 (100.0%) | 0 (0.0%) |
| Total | 6 (100.0%) | 0 (0.0%) |
Fertility by Education in Bear Creek
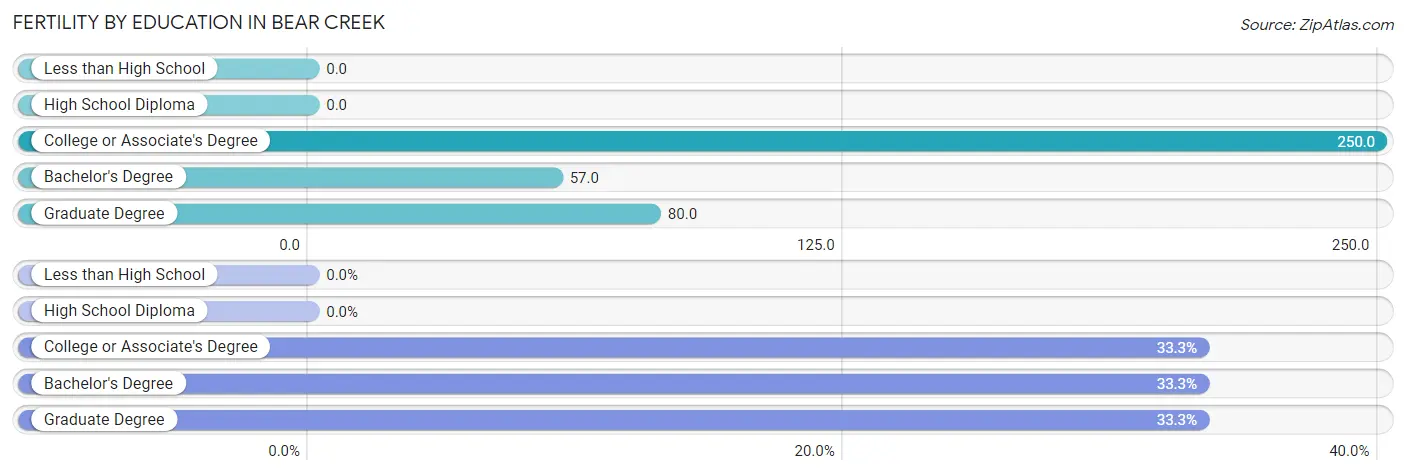
| Educational Attainment | Women with Births | Births / 1,000 Women |
| Less than High School | 0 (0.0%) | 0.0 |
| High School Diploma | 0 (0.0%) | 0.0 |
| College or Associate's Degree | 2 (33.3%) | 250.0 |
| Bachelor's Degree | 2 (33.3%) | 57.0 |
| Graduate Degree | 2 (33.3%) | 80.0 |
| Total | 6 (100.0%) | 59.0 |
Fertility by Education by Marriage Status in Bear Creek
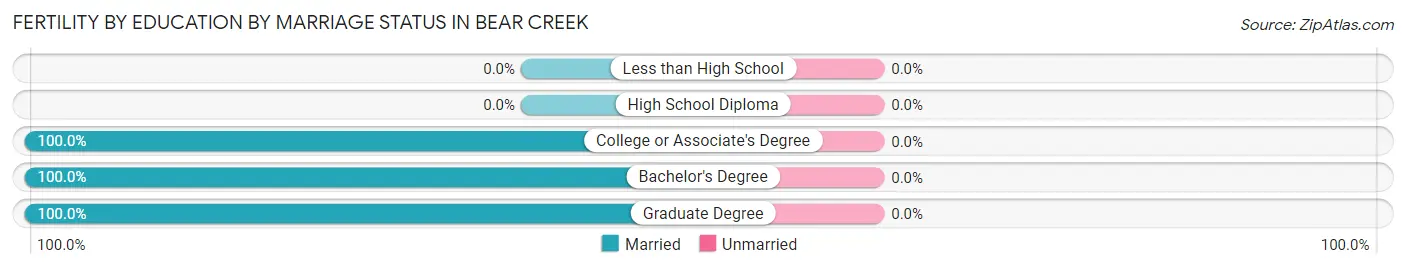
| Educational Attainment | Married | Unmarried |
| Less than High School | 0 (0.0%) | 0 (0.0%) |
| High School Diploma | 0 (0.0%) | 0 (0.0%) |
| College or Associate's Degree | 2 (100.0%) | 0 (0.0%) |
| Bachelor's Degree | 2 (100.0%) | 0 (0.0%) |
| Graduate Degree | 2 (100.0%) | 0 (0.0%) |
| Total | 6 (100.0%) | 0 (0.0%) |
Employment Characteristics in Bear Creek
Employment by Class of Employer in Bear Creek
Among the 215 employed individuals in Bear Creek, private company employees (95 | 44.2%), self-employed (not incorporated) (48 | 22.3%), and self-employed (incorporated) (29 | 13.5%) make up the most common classes of employment.
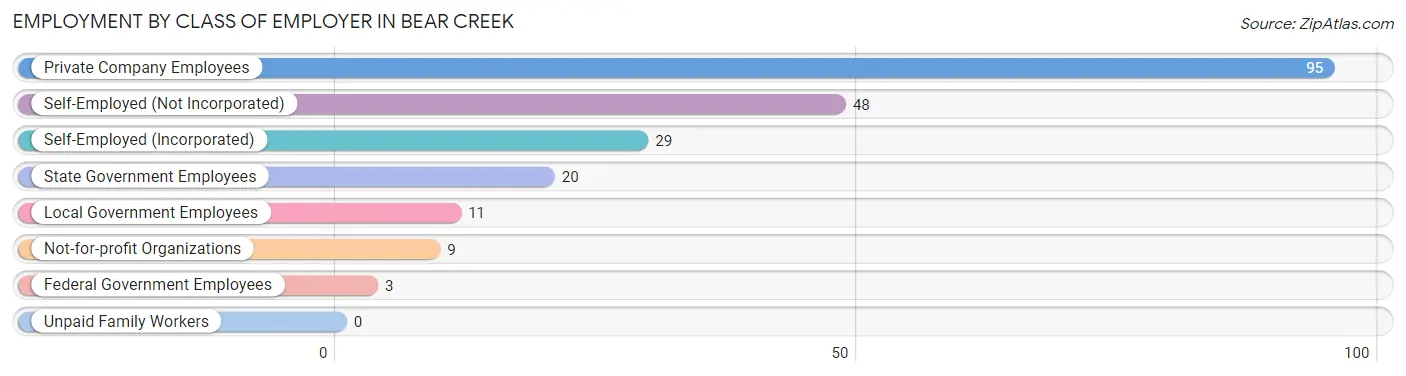
| Employer Class | # Employees | % Employees |
| Private Company Employees | 95 | 44.2% |
| Self-Employed (Incorporated) | 29 | 13.5% |
| Self-Employed (Not Incorporated) | 48 | 22.3% |
| Not-for-profit Organizations | 9 | 4.2% |
| Local Government Employees | 11 | 5.1% |
| State Government Employees | 20 | 9.3% |
| Federal Government Employees | 3 | 1.4% |
| Unpaid Family Workers | 0 | 0.0% |
| Total | 215 | 100.0% |
Employment Status by Age in Bear Creek
According to the labor force statistics for Bear Creek, out of the total population over 16 years of age (395), 62.3% or 246 individuals are in the labor force, with 6.1% or 15 of them unemployed. The age group with the highest labor force participation rate is 25 to 29 years, with 100.0% or 3 individuals in the labor force. Within the labor force, the 20 to 24 years age range has the highest percentage of unemployed individuals, with 40.0% or 2 of them being unemployed.
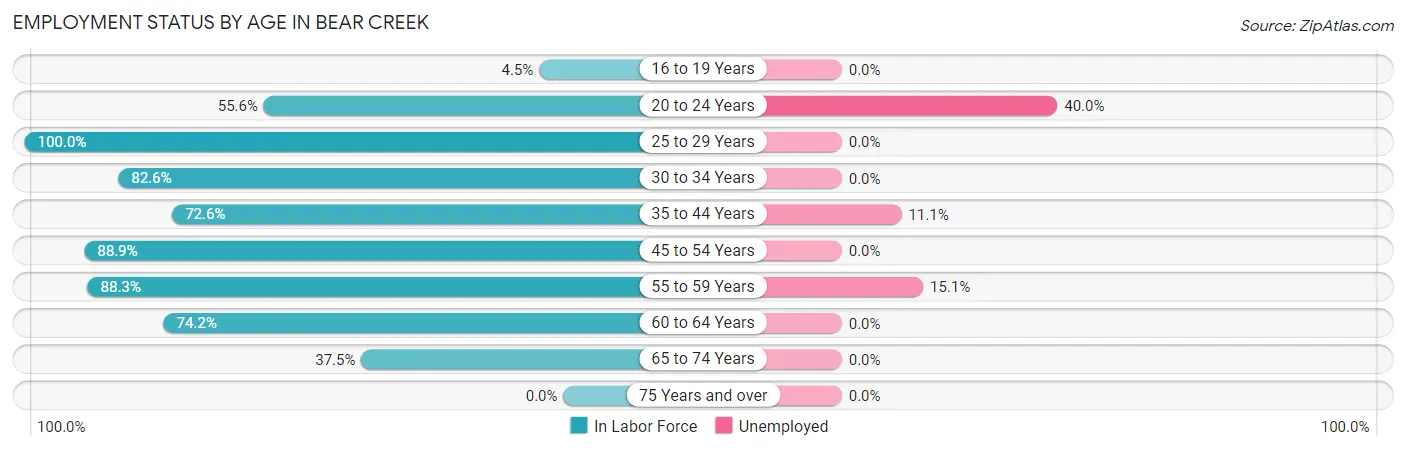
| Age Bracket | In Labor Force | Unemployed |
| 16 to 19 Years | 1 (4.5%) | 0 (0.0%) |
| 20 to 24 Years | 5 (55.6%) | 2 (40.0%) |
| 25 to 29 Years | 3 (100.0%) | 0 (0.0%) |
| 30 to 34 Years | 19 (82.6%) | 0 (0.0%) |
| 35 to 44 Years | 45 (72.6%) | 5 (11.1%) |
| 45 to 54 Years | 64 (88.9%) | 0 (0.0%) |
| 55 to 59 Years | 53 (88.3%) | 8 (15.1%) |
| 60 to 64 Years | 23 (74.2%) | 0 (0.0%) |
| 65 to 74 Years | 33 (37.5%) | 0 (0.0%) |
| 75 Years and over | 0 (0.0%) | 0 (0.0%) |
| Total | 246 (62.3%) | 15 (6.1%) |
Employment Status by Educational Attainment in Bear Creek
According to labor force statistics for Bear Creek, 82.5% of individuals (207) out of the total population between 25 and 64 years of age (251) are in the labor force, with 6.3% or 13 of them being unemployed. The group with the highest labor force participation rate are those with the educational attainment of less than high school, with 100.0% or 3 individuals in the labor force. Within the labor force, individuals with college / associate degree education have the highest percentage of unemployment, with 11.4% or 4 of them being unemployed.
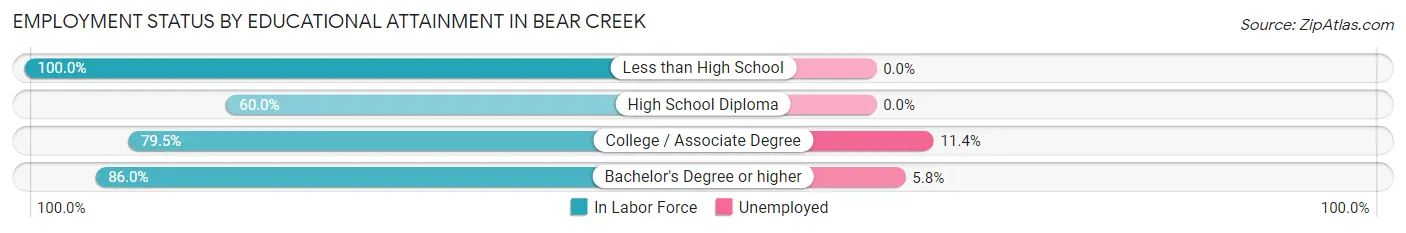
| Educational Attainment | In Labor Force | Unemployed |
| Less than High School | 3 (100.0%) | 0 (0.0%) |
| High School Diploma | 15 (60.0%) | 0 (0.0%) |
| College / Associate Degree | 35 (79.5%) | 5 (11.4%) |
| Bachelor's Degree or higher | 154 (86.0%) | 10 (5.8%) |
| Total | 207 (82.5%) | 16 (6.3%) |
Employment Occupations by Sex in Bear Creek
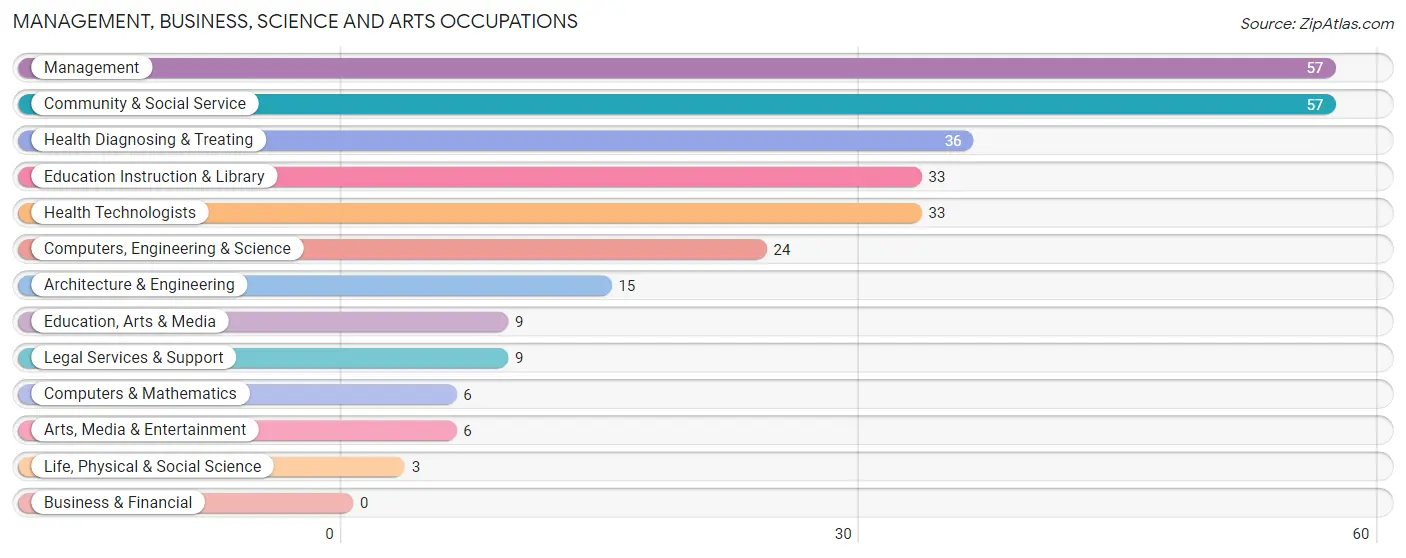
Management, Business, Science and Arts Occupations
The most common Management, Business, Science and Arts occupations in Bear Creek are Management (57 | 24.7%), Community & Social Service (57 | 24.7%), Health Diagnosing & Treating (36 | 15.6%), Education Instruction & Library (33 | 14.3%), and Health Technologists (33 | 14.3%).
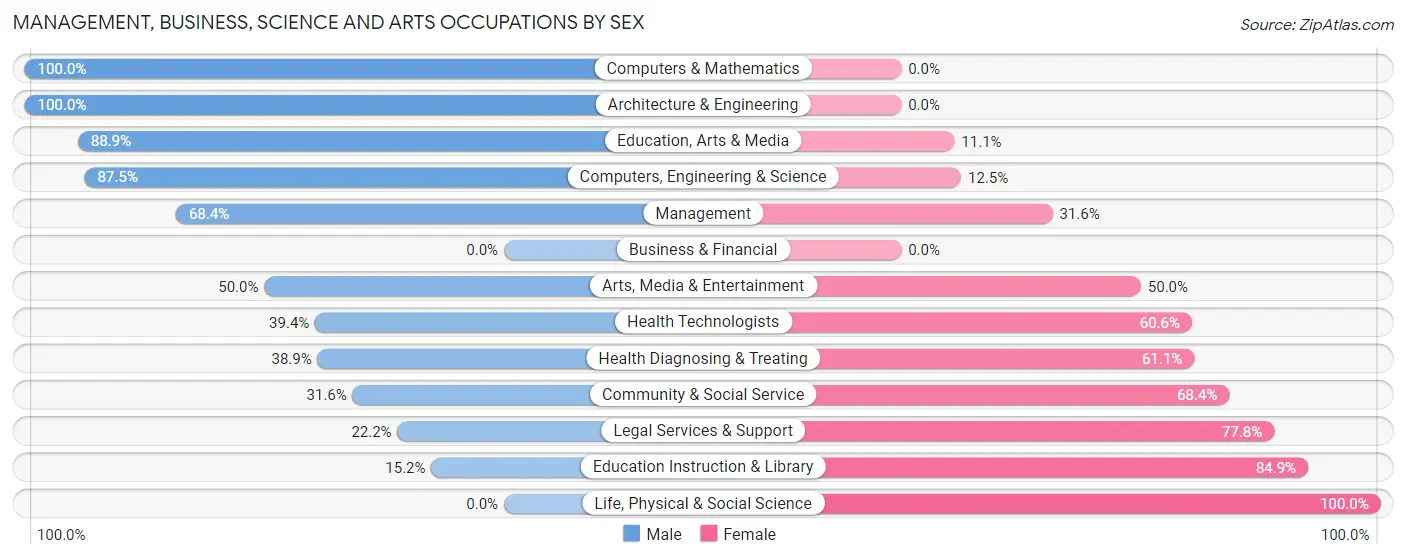
Management, Business, Science and Arts Occupations by Sex
Within the Management, Business, Science and Arts occupations in Bear Creek, the most male-oriented occupations are Computers & Mathematics (100.0%), Architecture & Engineering (100.0%), and Education, Arts & Media (88.9%), while the most female-oriented occupations are Life, Physical & Social Science (100.0%), Education Instruction & Library (84.9%), and Legal Services & Support (77.8%).
| Occupation | Male | Female |
| Management | 39 (68.4%) | 18 (31.6%) |
| Business & Financial | 0 (0.0%) | 0 (0.0%) |
| Computers, Engineering & Science | 21 (87.5%) | 3 (12.5%) |
| Computers & Mathematics | 6 (100.0%) | 0 (0.0%) |
| Architecture & Engineering | 15 (100.0%) | 0 (0.0%) |
| Life, Physical & Social Science | 0 (0.0%) | 3 (100.0%) |
| Community & Social Service | 18 (31.6%) | 39 (68.4%) |
| Education, Arts & Media | 8 (88.9%) | 1 (11.1%) |
| Legal Services & Support | 2 (22.2%) | 7 (77.8%) |
| Education Instruction & Library | 5 (15.1%) | 28 (84.9%) |
| Arts, Media & Entertainment | 3 (50.0%) | 3 (50.0%) |
| Health Diagnosing & Treating | 14 (38.9%) | 22 (61.1%) |
| Health Technologists | 13 (39.4%) | 20 (60.6%) |
| Total (Category) | 92 (52.9%) | 82 (47.1%) |
| Total (Overall) | 121 (52.4%) | 110 (47.6%) |
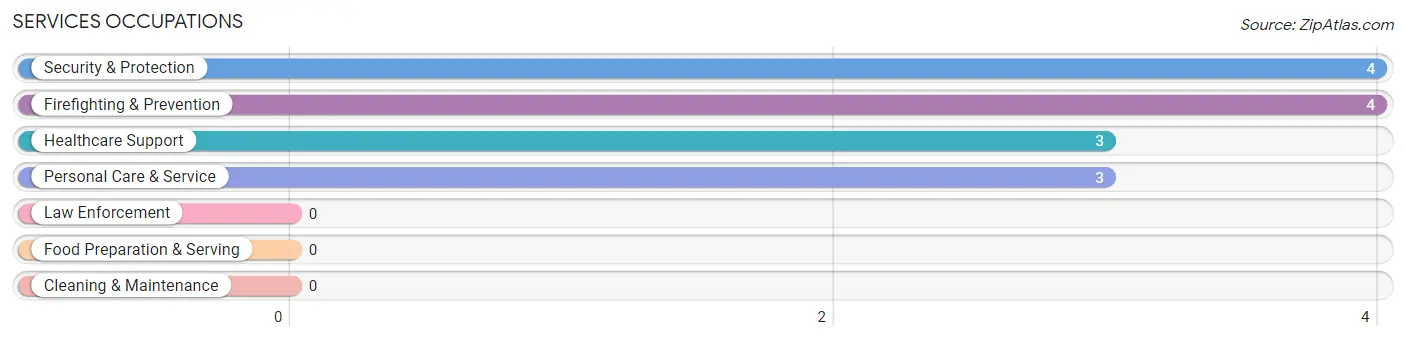
Services Occupations
The most common Services occupations in Bear Creek are Security & Protection (4 | 1.7%), Firefighting & Prevention (4 | 1.7%), Healthcare Support (3 | 1.3%), and Personal Care & Service (3 | 1.3%).
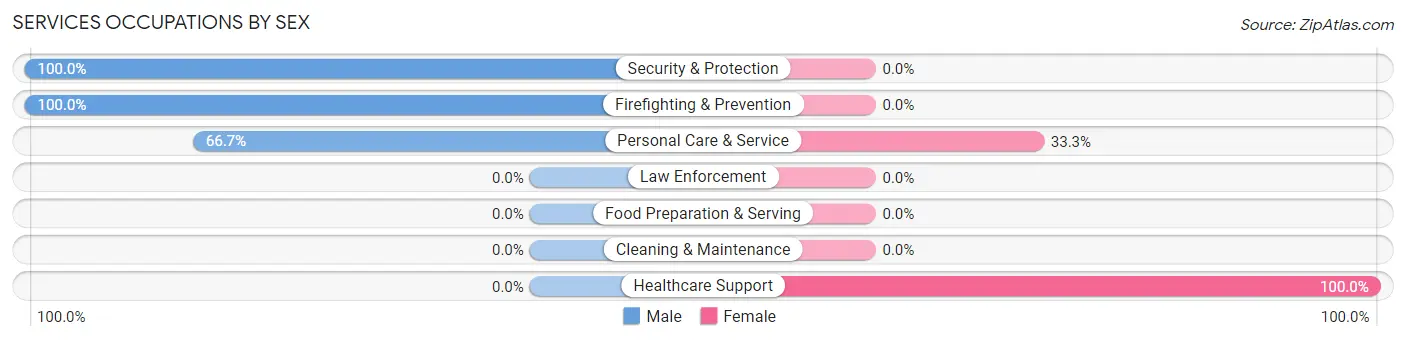
Services Occupations by Sex
Within the Services occupations in Bear Creek, the most male-oriented occupations are Security & Protection (100.0%), Firefighting & Prevention (100.0%), and Personal Care & Service (66.7%), while the most female-oriented occupations are Healthcare Support (100.0%), and Personal Care & Service (33.3%).
| Occupation | Male | Female |
| Healthcare Support | 0 (0.0%) | 3 (100.0%) |
| Security & Protection | 4 (100.0%) | 0 (0.0%) |
| Firefighting & Prevention | 4 (100.0%) | 0 (0.0%) |
| Law Enforcement | 0 (0.0%) | 0 (0.0%) |
| Food Preparation & Serving | 0 (0.0%) | 0 (0.0%) |
| Cleaning & Maintenance | 0 (0.0%) | 0 (0.0%) |
| Personal Care & Service | 2 (66.7%) | 1 (33.3%) |
| Total (Category) | 6 (60.0%) | 4 (40.0%) |
| Total (Overall) | 121 (52.4%) | 110 (47.6%) |
Sales and Office Occupations
The most common Sales and Office occupations in Bear Creek are Sales & Related (23 | 10.0%), and Office & Administration (11 | 4.8%).
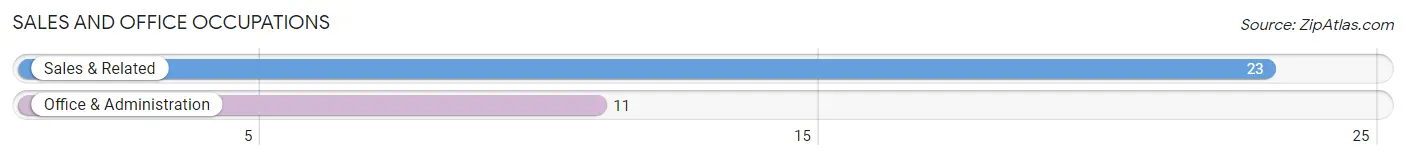
Sales and Office Occupations by Sex
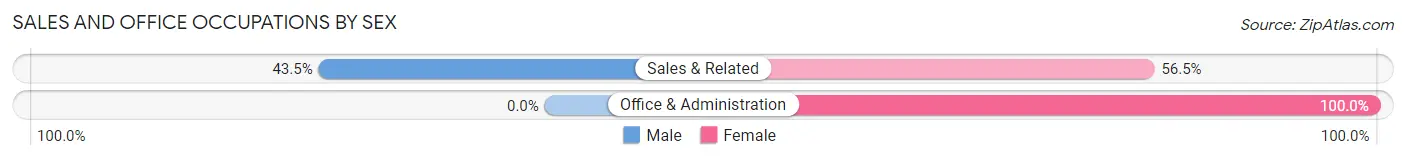
| Occupation | Male | Female |
| Sales & Related | 10 (43.5%) | 13 (56.5%) |
| Office & Administration | 0 (0.0%) | 11 (100.0%) |
| Total (Category) | 10 (29.4%) | 24 (70.6%) |
| Total (Overall) | 121 (52.4%) | 110 (47.6%) |
Natural Resources, Construction and Maintenance Occupations
The most common Natural Resources, Construction and Maintenance occupations in Bear Creek are , and Construction & Extraction (4 | 1.7%).
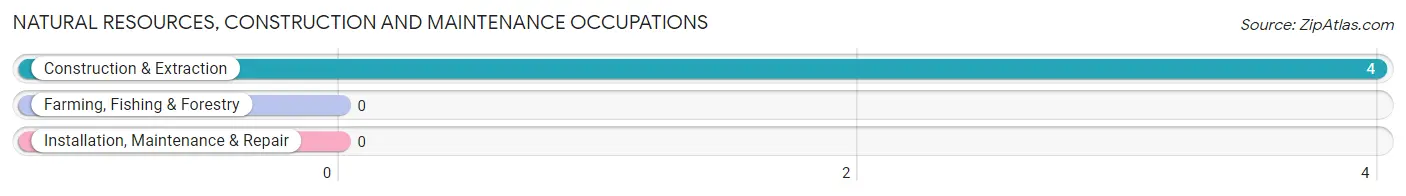
Natural Resources, Construction and Maintenance Occupations by Sex
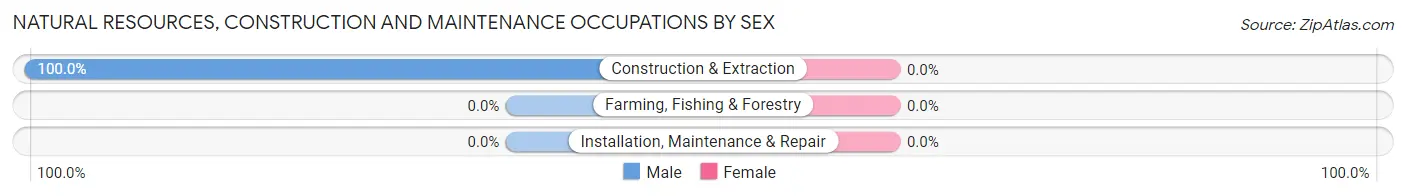
| Occupation | Male | Female |
| Farming, Fishing & Forestry | 0 (0.0%) | 0 (0.0%) |
| Construction & Extraction | 4 (100.0%) | 0 (0.0%) |
| Installation, Maintenance & Repair | 0 (0.0%) | 0 (0.0%) |
| Total (Category) | 4 (100.0%) | 0 (0.0%) |
| Total (Overall) | 121 (52.4%) | 110 (47.6%) |
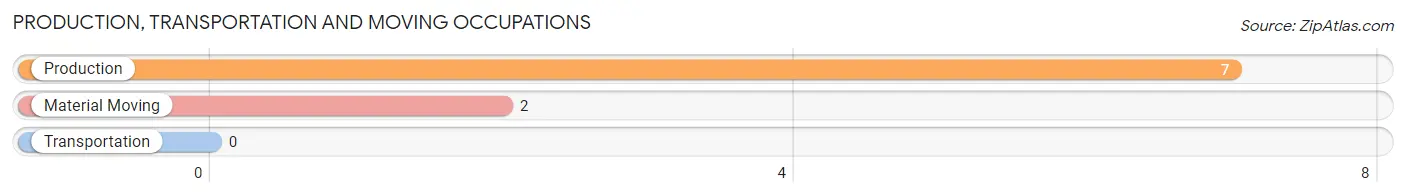
Production, Transportation and Moving Occupations
The most common Production, Transportation and Moving occupations in Bear Creek are Production (7 | 3.0%), and Material Moving (2 | 0.9%).
Production, Transportation and Moving Occupations by Sex
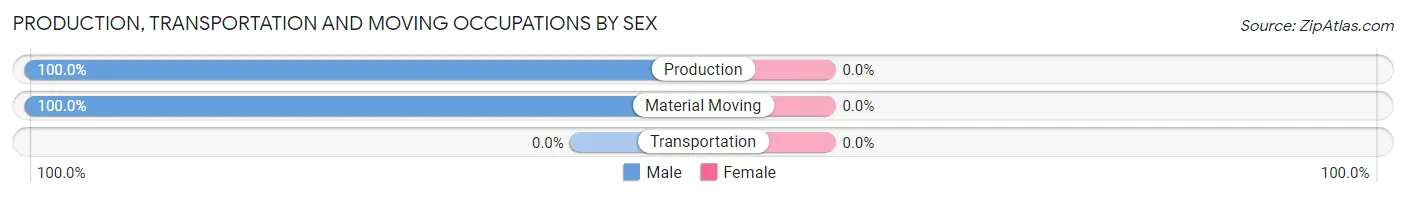
| Occupation | Male | Female |
| Production | 7 (100.0%) | 0 (0.0%) |
| Transportation | 0 (0.0%) | 0 (0.0%) |
| Material Moving | 2 (100.0%) | 0 (0.0%) |
| Total (Category) | 9 (100.0%) | 0 (0.0%) |
| Total (Overall) | 121 (52.4%) | 110 (47.6%) |
Employment Industries by Sex in Bear Creek
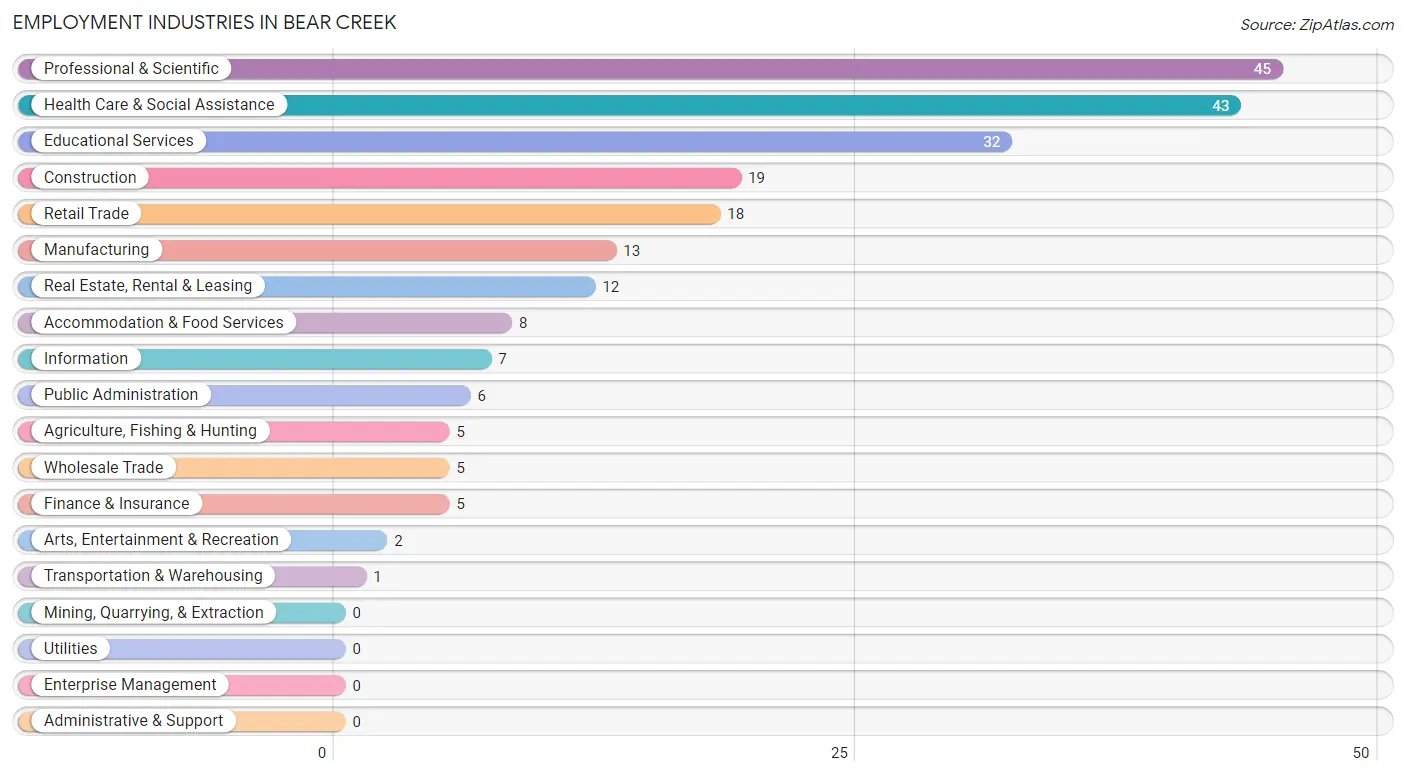
Employment Industries in Bear Creek
The major employment industries in Bear Creek include Professional & Scientific (45 | 19.5%), Health Care & Social Assistance (43 | 18.6%), Educational Services (32 | 13.9%), Construction (19 | 8.2%), and Retail Trade (18 | 7.8%).
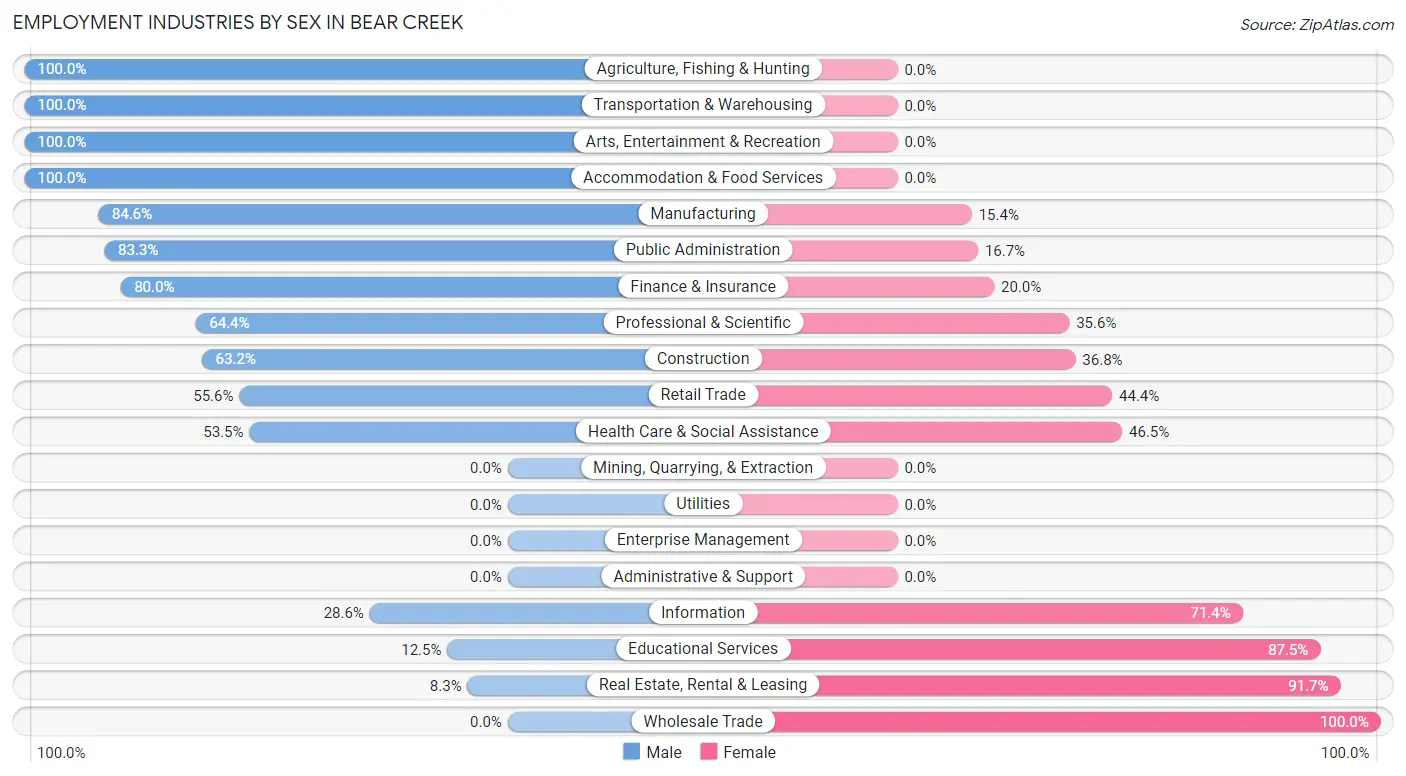
Employment Industries by Sex in Bear Creek
The Bear Creek industries that see more men than women are Agriculture, Fishing & Hunting (100.0%), Transportation & Warehousing (100.0%), and Arts, Entertainment & Recreation (100.0%), whereas the industries that tend to have a higher number of women are Wholesale Trade (100.0%), Real Estate, Rental & Leasing (91.7%), and Educational Services (87.5%).
| Industry | Male | Female |
| Agriculture, Fishing & Hunting | 5 (100.0%) | 0 (0.0%) |
| Mining, Quarrying, & Extraction | 0 (0.0%) | 0 (0.0%) |
| Construction | 12 (63.2%) | 7 (36.8%) |
| Manufacturing | 11 (84.6%) | 2 (15.4%) |
| Wholesale Trade | 0 (0.0%) | 5 (100.0%) |
| Retail Trade | 10 (55.6%) | 8 (44.4%) |
| Transportation & Warehousing | 1 (100.0%) | 0 (0.0%) |
| Utilities | 0 (0.0%) | 0 (0.0%) |
| Information | 2 (28.6%) | 5 (71.4%) |
| Finance & Insurance | 4 (80.0%) | 1 (20.0%) |
| Real Estate, Rental & Leasing | 1 (8.3%) | 11 (91.7%) |
| Professional & Scientific | 29 (64.4%) | 16 (35.6%) |
| Enterprise Management | 0 (0.0%) | 0 (0.0%) |
| Administrative & Support | 0 (0.0%) | 0 (0.0%) |
| Educational Services | 4 (12.5%) | 28 (87.5%) |
| Health Care & Social Assistance | 23 (53.5%) | 20 (46.5%) |
| Arts, Entertainment & Recreation | 2 (100.0%) | 0 (0.0%) |
| Accommodation & Food Services | 8 (100.0%) | 0 (0.0%) |
| Public Administration | 5 (83.3%) | 1 (16.7%) |
| Total | 121 (52.4%) | 110 (47.6%) |
Education in Bear Creek
School Enrollment in Bear Creek
The most common levels of schooling among the 101 students in Bear Creek are high school (36 | 35.6%), elementary school (28 | 27.7%), and middle school (16 | 15.8%).
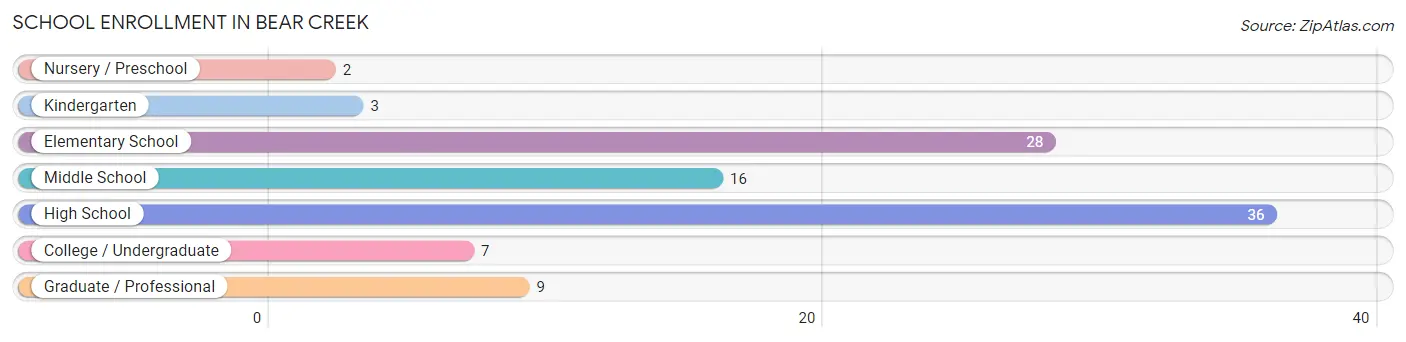
| School Level | # Students | % Students |
| Nursery / Preschool | 2 | 2.0% |
| Kindergarten | 3 | 3.0% |
| Elementary School | 28 | 27.7% |
| Middle School | 16 | 15.8% |
| High School | 36 | 35.6% |
| College / Undergraduate | 7 | 6.9% |
| Graduate / Professional | 9 | 8.9% |
| Total | 101 | 100.0% |
School Enrollment by Age by Funding Source in Bear Creek
Out of a total of 101 students who are enrolled in schools in Bear Creek, 33 (32.7%) attend a private institution, while the remaining 68 (67.3%) are enrolled in public schools. The age group of 3 to 4 year olds has the highest likelihood of being enrolled in private schools, with 2 (100.0% in the age bracket) enrolled. Conversely, the age group of 18 to 19 year olds has the lowest likelihood of being enrolled in a private school, with 2 (100.0% in the age bracket) attending a public institution.
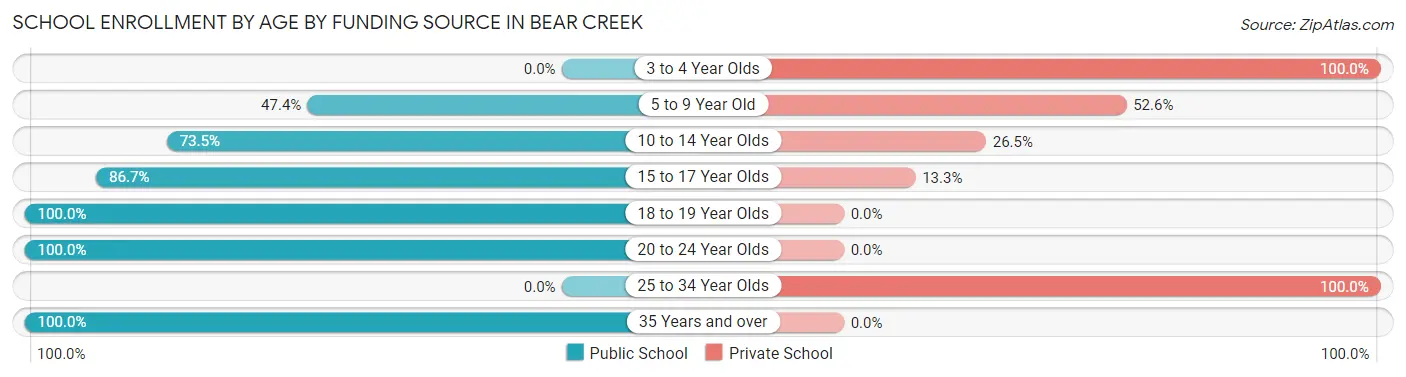
| Age Bracket | Public School | Private School |
| 3 to 4 Year Olds | 0 (0.0%) | 2 (100.0%) |
| 5 to 9 Year Old | 9 (47.4%) | 10 (52.6%) |
| 10 to 14 Year Olds | 25 (73.5%) | 9 (26.5%) |
| 15 to 17 Year Olds | 26 (86.7%) | 4 (13.3%) |
| 18 to 19 Year Olds | 2 (100.0%) | 0 (0.0%) |
| 20 to 24 Year Olds | 1 (100.0%) | 0 (0.0%) |
| 25 to 34 Year Olds | 0 (0.0%) | 8 (100.0%) |
| 35 Years and over | 5 (100.0%) | 0 (0.0%) |
| Total | 68 (67.3%) | 33 (32.7%) |
Educational Attainment by Field of Study in Bear Creek
Social sciences (36 | 13.7%), engineering (31 | 11.8%), visual & performing arts (28 | 10.7%), education (27 | 10.3%), and computers & mathematics (26 | 9.9%) are the most common fields of study among 262 individuals in Bear Creek who have obtained a bachelor's degree or higher.
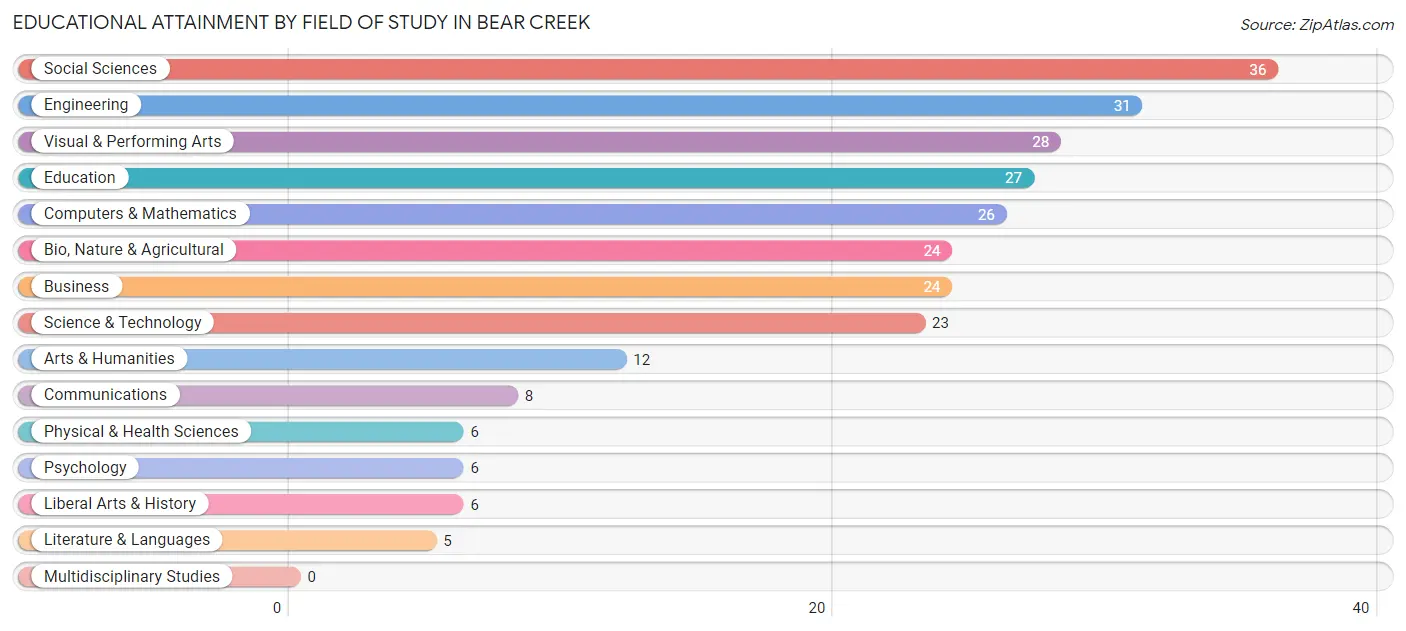
| Field of Study | # Graduates | % Graduates |
| Computers & Mathematics | 26 | 9.9% |
| Bio, Nature & Agricultural | 24 | 9.2% |
| Physical & Health Sciences | 6 | 2.3% |
| Psychology | 6 | 2.3% |
| Social Sciences | 36 | 13.7% |
| Engineering | 31 | 11.8% |
| Multidisciplinary Studies | 0 | 0.0% |
| Science & Technology | 23 | 8.8% |
| Business | 24 | 9.2% |
| Education | 27 | 10.3% |
| Literature & Languages | 5 | 1.9% |
| Liberal Arts & History | 6 | 2.3% |
| Visual & Performing Arts | 28 | 10.7% |
| Communications | 8 | 3.0% |
| Arts & Humanities | 12 | 4.6% |
| Total | 262 | 100.0% |
Transportation & Commute in Bear Creek
Vehicle Availability by Sex in Bear Creek
The most prevalent vehicle ownership categories in Bear Creek are males with 3 vehicles (41, accounting for 36.0%) and females with 3 vehicles (48, making up 40.6%).
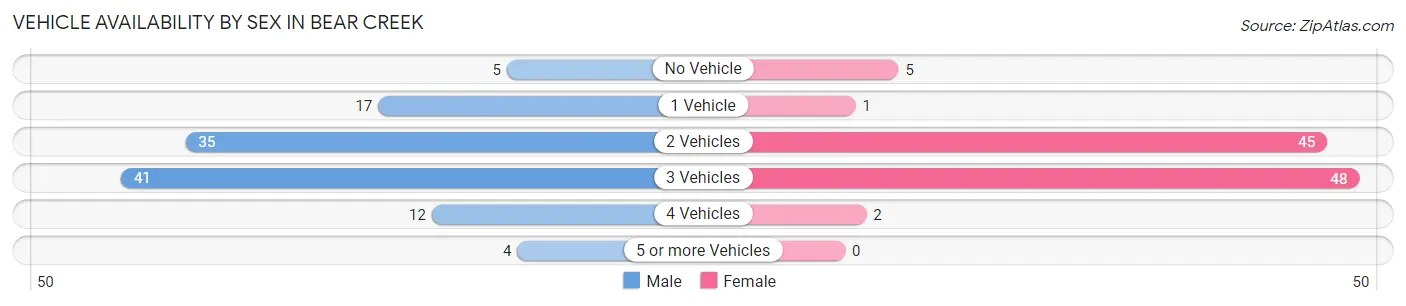
| Vehicles Available | Male | Female |
| No Vehicle | 5 (4.4%) | 5 (5.0%) |
| 1 Vehicle | 17 (14.9%) | 1 (1.0%) |
| 2 Vehicles | 35 (30.7%) | 45 (44.6%) |
| 3 Vehicles | 41 (36.0%) | 48 (47.5%) |
| 4 Vehicles | 12 (10.5%) | 2 (2.0%) |
| 5 or more Vehicles | 4 (3.5%) | 0 (0.0%) |
| Total | 114 (100.0%) | 101 (100.0%) |
Commute Time in Bear Creek
The most frequently occuring commute durations in Bear Creek are 20 to 24 minutes (41 commuters, 28.1%), 30 to 34 minutes (25 commuters, 17.1%), and less than 5 minutes (21 commuters, 14.4%).
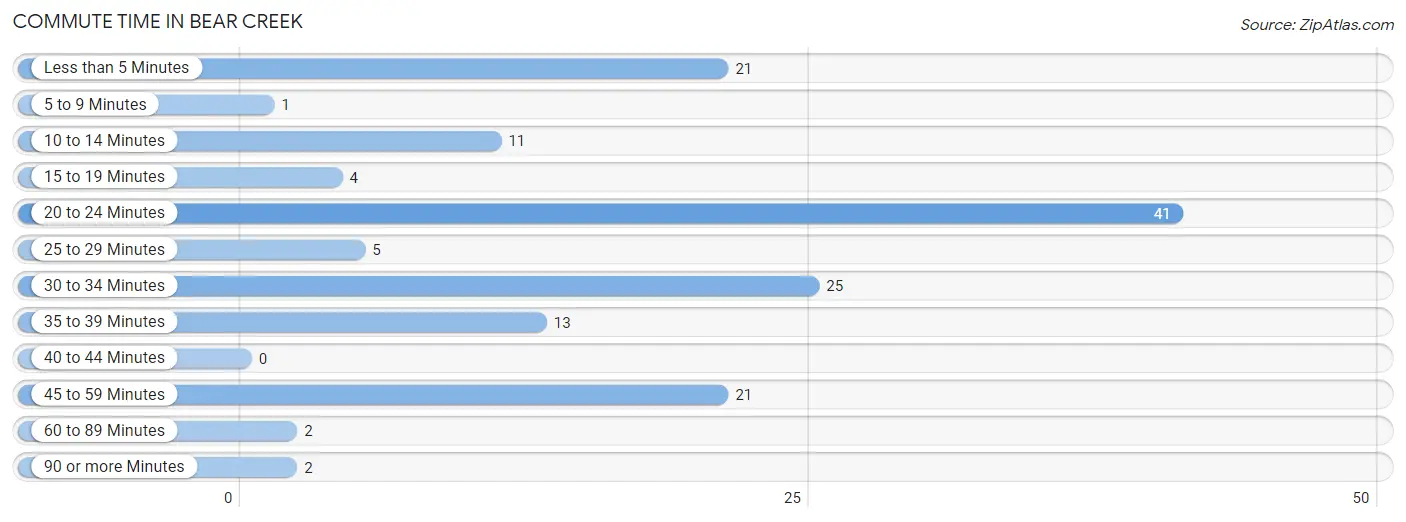
| Commute Time | # Commuters | % Commuters |
| Less than 5 Minutes | 21 | 14.4% |
| 5 to 9 Minutes | 1 | 0.7% |
| 10 to 14 Minutes | 11 | 7.5% |
| 15 to 19 Minutes | 4 | 2.7% |
| 20 to 24 Minutes | 41 | 28.1% |
| 25 to 29 Minutes | 5 | 3.4% |
| 30 to 34 Minutes | 25 | 17.1% |
| 35 to 39 Minutes | 13 | 8.9% |
| 40 to 44 Minutes | 0 | 0.0% |
| 45 to 59 Minutes | 21 | 14.4% |
| 60 to 89 Minutes | 2 | 1.4% |
| 90 or more Minutes | 2 | 1.4% |
Commute Time by Sex in Bear Creek
The most common commute times in Bear Creek are 45 to 59 minutes (19 commuters, 24.7%) for males and 20 to 24 minutes (23 commuters, 33.3%) for females.
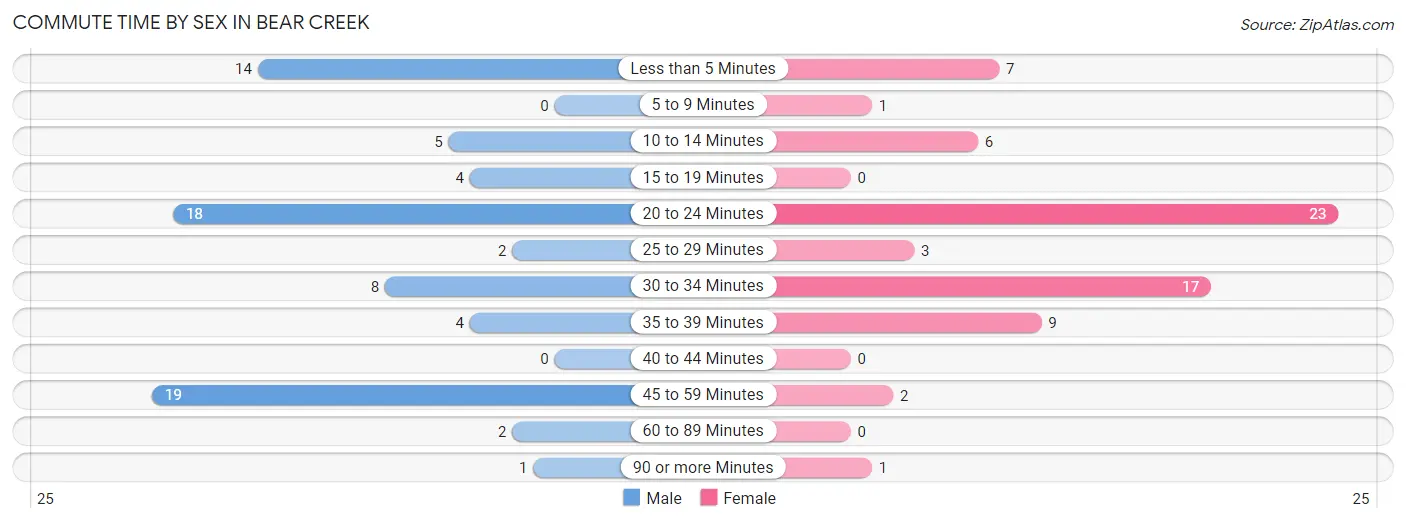
| Commute Time | Male | Female |
| Less than 5 Minutes | 14 (18.2%) | 7 (10.1%) |
| 5 to 9 Minutes | 0 (0.0%) | 1 (1.5%) |
| 10 to 14 Minutes | 5 (6.5%) | 6 (8.7%) |
| 15 to 19 Minutes | 4 (5.2%) | 0 (0.0%) |
| 20 to 24 Minutes | 18 (23.4%) | 23 (33.3%) |
| 25 to 29 Minutes | 2 (2.6%) | 3 (4.3%) |
| 30 to 34 Minutes | 8 (10.4%) | 17 (24.6%) |
| 35 to 39 Minutes | 4 (5.2%) | 9 (13.0%) |
| 40 to 44 Minutes | 0 (0.0%) | 0 (0.0%) |
| 45 to 59 Minutes | 19 (24.7%) | 2 (2.9%) |
| 60 to 89 Minutes | 2 (2.6%) | 0 (0.0%) |
| 90 or more Minutes | 1 (1.3%) | 1 (1.5%) |
Time of Departure to Work by Sex in Bear Creek
The most frequent times of departure to work in Bear Creek are 7:00 AM to 7:29 AM (19, 24.7%) for males and 7:00 AM to 7:29 AM (24, 34.8%) for females.
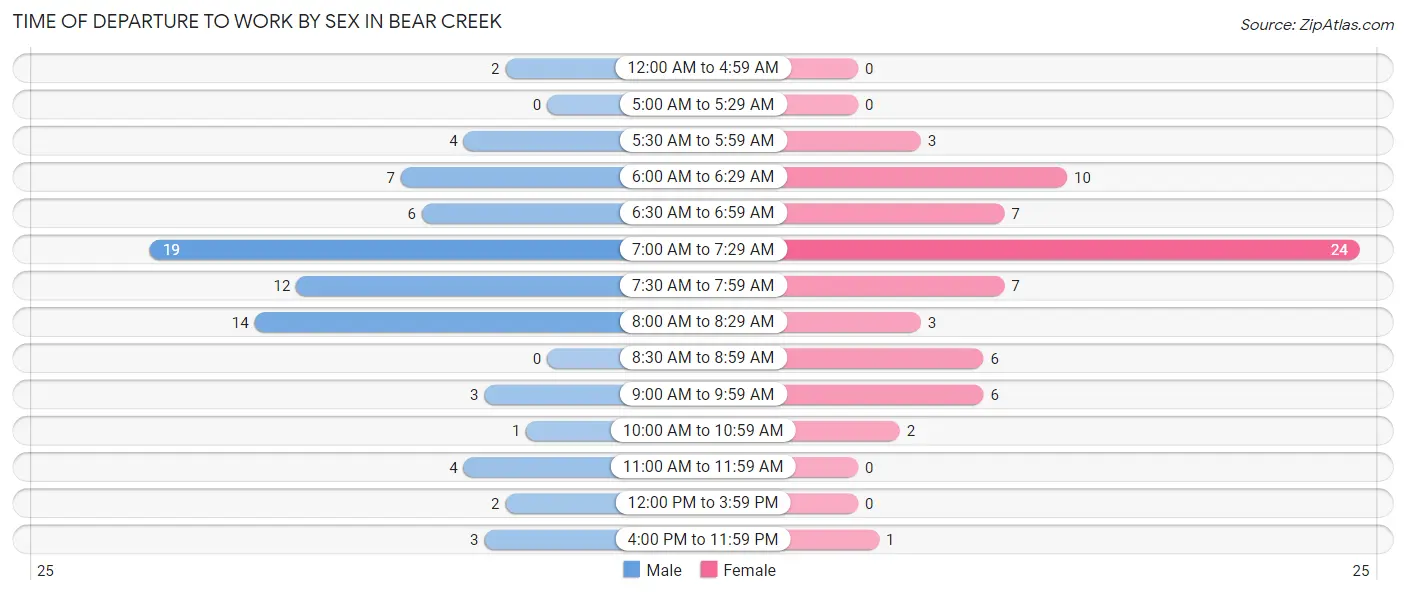
| Time of Departure | Male | Female |
| 12:00 AM to 4:59 AM | 2 (2.6%) | 0 (0.0%) |
| 5:00 AM to 5:29 AM | 0 (0.0%) | 0 (0.0%) |
| 5:30 AM to 5:59 AM | 4 (5.2%) | 3 (4.3%) |
| 6:00 AM to 6:29 AM | 7 (9.1%) | 10 (14.5%) |
| 6:30 AM to 6:59 AM | 6 (7.8%) | 7 (10.1%) |
| 7:00 AM to 7:29 AM | 19 (24.7%) | 24 (34.8%) |
| 7:30 AM to 7:59 AM | 12 (15.6%) | 7 (10.1%) |
| 8:00 AM to 8:29 AM | 14 (18.2%) | 3 (4.3%) |
| 8:30 AM to 8:59 AM | 0 (0.0%) | 6 (8.7%) |
| 9:00 AM to 9:59 AM | 3 (3.9%) | 6 (8.7%) |
| 10:00 AM to 10:59 AM | 1 (1.3%) | 2 (2.9%) |
| 11:00 AM to 11:59 AM | 4 (5.2%) | 0 (0.0%) |
| 12:00 PM to 3:59 PM | 2 (2.6%) | 0 (0.0%) |
| 4:00 PM to 11:59 PM | 3 (3.9%) | 1 (1.5%) |
| Total | 77 (100.0%) | 69 (100.0%) |
Housing Occupancy in Bear Creek
Occupancy by Ownership in Bear Creek
Of the total 194 dwellings in Bear Creek, owner-occupied units account for 187 (96.4%), while renter-occupied units make up 7 (3.6%).
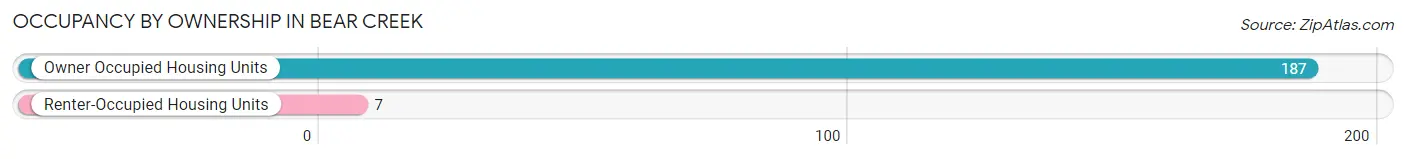
| Occupancy | # Housing Units | % Housing Units |
| Owner Occupied Housing Units | 187 | 96.4% |
| Renter-Occupied Housing Units | 7 | 3.6% |
| Total Occupied Housing Units | 194 | 100.0% |
Occupancy by Household Size in Bear Creek
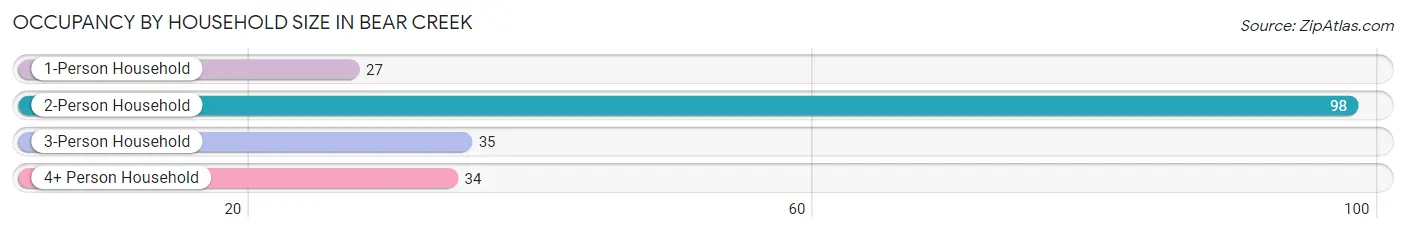
| Household Size | # Housing Units | % Housing Units |
| 1-Person Household | 27 | 13.9% |
| 2-Person Household | 98 | 50.5% |
| 3-Person Household | 35 | 18.0% |
| 4+ Person Household | 34 | 17.5% |
| Total Housing Units | 194 | 100.0% |
Occupancy by Ownership by Household Size in Bear Creek
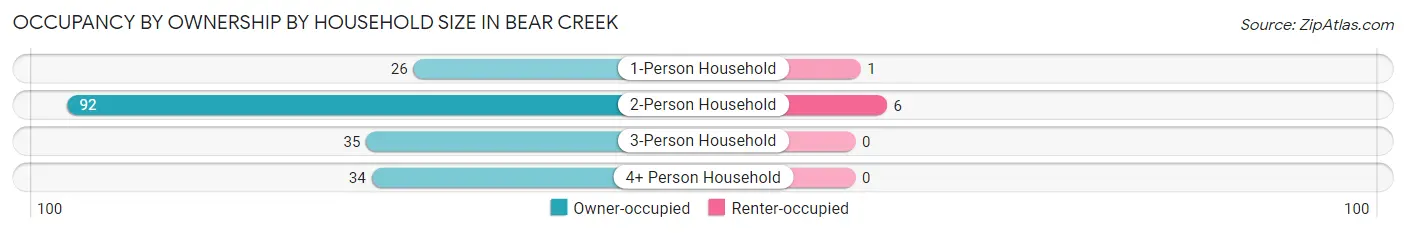
| Household Size | Owner-occupied | Renter-occupied |
| 1-Person Household | 26 (96.3%) | 1 (3.7%) |
| 2-Person Household | 92 (93.9%) | 6 (6.1%) |
| 3-Person Household | 35 (100.0%) | 0 (0.0%) |
| 4+ Person Household | 34 (100.0%) | 0 (0.0%) |
| Total Housing Units | 187 (96.4%) | 7 (3.6%) |
Occupancy by Educational Attainment in Bear Creek
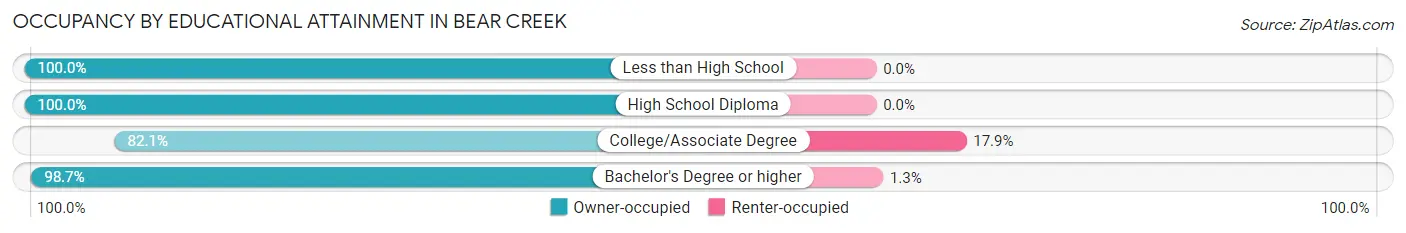
| Household Size | Owner-occupied | Renter-occupied |
| Less than High School | 3 (100.0%) | 0 (0.0%) |
| High School Diploma | 14 (100.0%) | 0 (0.0%) |
| College/Associate Degree | 23 (82.1%) | 5 (17.9%) |
| Bachelor's Degree or higher | 147 (98.7%) | 2 (1.3%) |
Occupancy by Age of Householder in Bear Creek
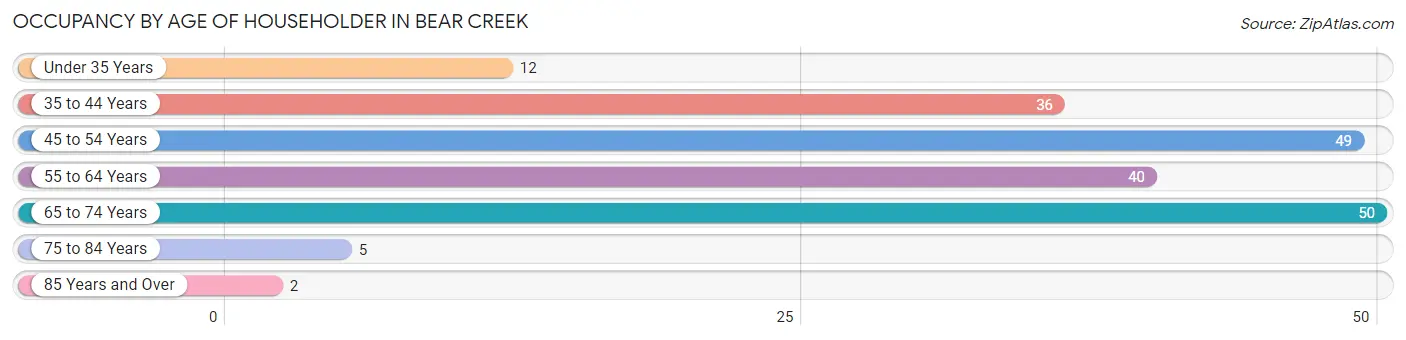
| Age Bracket | # Households | % Households |
| Under 35 Years | 12 | 6.2% |
| 35 to 44 Years | 36 | 18.6% |
| 45 to 54 Years | 49 | 25.3% |
| 55 to 64 Years | 40 | 20.6% |
| 65 to 74 Years | 50 | 25.8% |
| 75 to 84 Years | 5 | 2.6% |
| 85 Years and Over | 2 | 1.0% |
| Total | 194 | 100.0% |
Housing Finances in Bear Creek
Median Income by Occupancy in Bear Creek
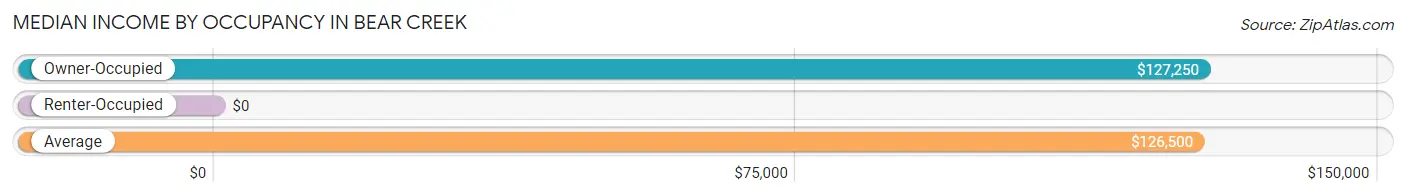
| Occupancy Type | # Households | Median Income |
| Owner-Occupied | 187 (96.4%) | $127,250 |
| Renter-Occupied | 7 (3.6%) | $0 |
| Average | 194 (100.0%) | $126,500 |
Occupancy by Householder Income Bracket in Bear Creek
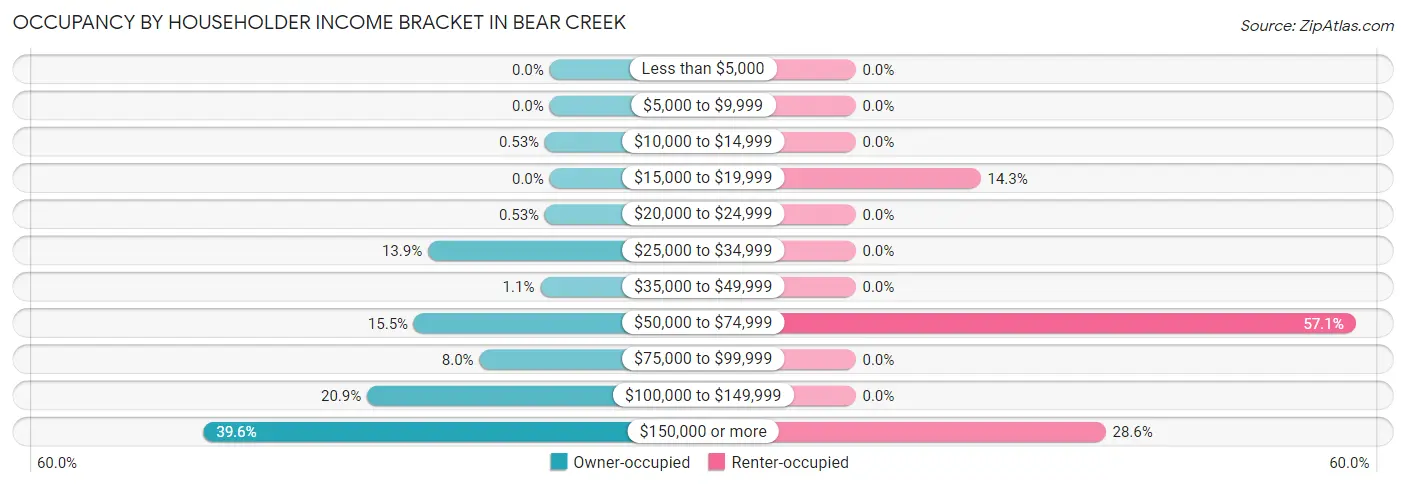
| Income Bracket | Owner-occupied | Renter-occupied |
| Less than $5,000 | 0 (0.0%) | 0 (0.0%) |
| $5,000 to $9,999 | 0 (0.0%) | 0 (0.0%) |
| $10,000 to $14,999 | 1 (0.5%) | 0 (0.0%) |
| $15,000 to $19,999 | 0 (0.0%) | 1 (14.3%) |
| $20,000 to $24,999 | 1 (0.5%) | 0 (0.0%) |
| $25,000 to $34,999 | 26 (13.9%) | 0 (0.0%) |
| $35,000 to $49,999 | 2 (1.1%) | 0 (0.0%) |
| $50,000 to $74,999 | 29 (15.5%) | 4 (57.1%) |
| $75,000 to $99,999 | 15 (8.0%) | 0 (0.0%) |
| $100,000 to $149,999 | 39 (20.9%) | 0 (0.0%) |
| $150,000 or more | 74 (39.6%) | 2 (28.6%) |
| Total | 187 (100.0%) | 7 (100.0%) |
Monthly Housing Cost Tiers in Bear Creek
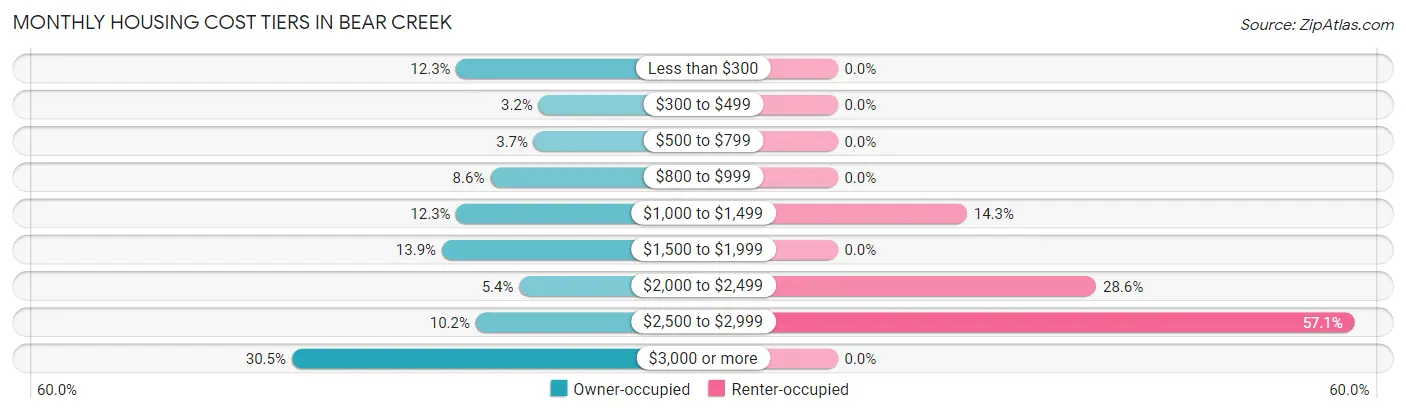
| Monthly Cost | Owner-occupied | Renter-occupied |
| Less than $300 | 23 (12.3%) | 0 (0.0%) |
| $300 to $499 | 6 (3.2%) | 0 (0.0%) |
| $500 to $799 | 7 (3.7%) | 0 (0.0%) |
| $800 to $999 | 16 (8.6%) | 0 (0.0%) |
| $1,000 to $1,499 | 23 (12.3%) | 1 (14.3%) |
| $1,500 to $1,999 | 26 (13.9%) | 0 (0.0%) |
| $2,000 to $2,499 | 10 (5.3%) | 2 (28.6%) |
| $2,500 to $2,999 | 19 (10.2%) | 4 (57.1%) |
| $3,000 or more | 57 (30.5%) | 0 (0.0%) |
| Total | 187 (100.0%) | 7 (100.0%) |
Physical Housing Characteristics in Bear Creek
Housing Structures in Bear Creek
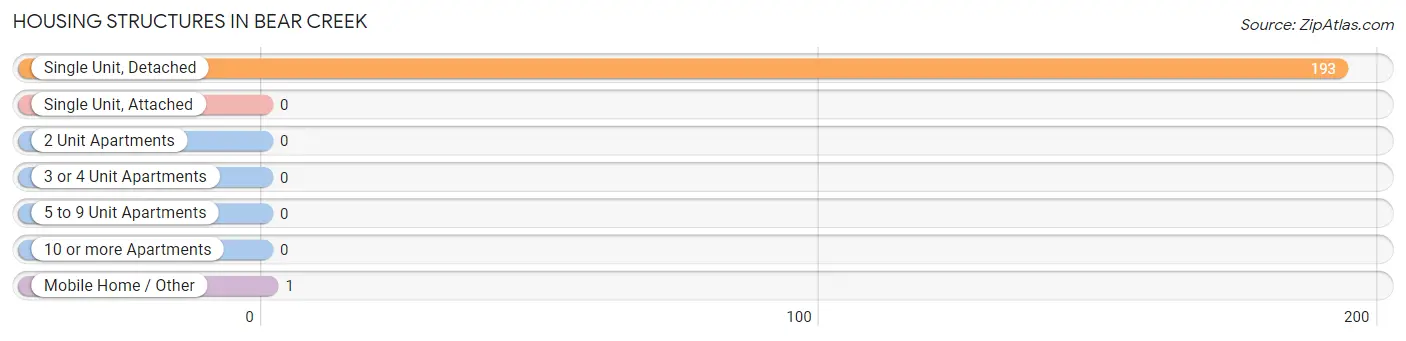
| Structure Type | # Housing Units | % Housing Units |
| Single Unit, Detached | 193 | 99.5% |
| Single Unit, Attached | 0 | 0.0% |
| 2 Unit Apartments | 0 | 0.0% |
| 3 or 4 Unit Apartments | 0 | 0.0% |
| 5 to 9 Unit Apartments | 0 | 0.0% |
| 10 or more Apartments | 0 | 0.0% |
| Mobile Home / Other | 1 | 0.5% |
| Total | 194 | 100.0% |
Housing Structures by Occupancy in Bear Creek
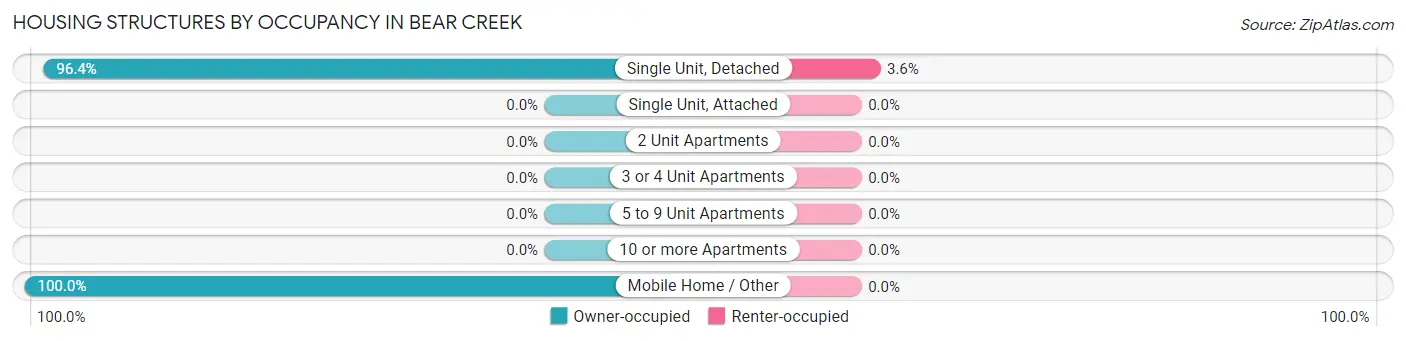
| Structure Type | Owner-occupied | Renter-occupied |
| Single Unit, Detached | 186 (96.4%) | 7 (3.6%) |
| Single Unit, Attached | 0 (0.0%) | 0 (0.0%) |
| 2 Unit Apartments | 0 (0.0%) | 0 (0.0%) |
| 3 or 4 Unit Apartments | 0 (0.0%) | 0 (0.0%) |
| 5 to 9 Unit Apartments | 0 (0.0%) | 0 (0.0%) |
| 10 or more Apartments | 0 (0.0%) | 0 (0.0%) |
| Mobile Home / Other | 1 (100.0%) | 0 (0.0%) |
| Total | 187 (96.4%) | 7 (3.6%) |
Housing Structures by Number of Rooms in Bear Creek
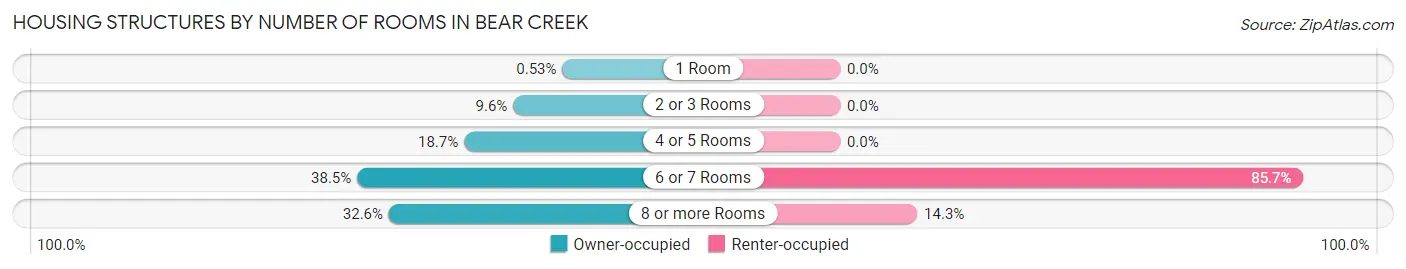
| Number of Rooms | Owner-occupied | Renter-occupied |
| 1 Room | 1 (0.5%) | 0 (0.0%) |
| 2 or 3 Rooms | 18 (9.6%) | 0 (0.0%) |
| 4 or 5 Rooms | 35 (18.7%) | 0 (0.0%) |
| 6 or 7 Rooms | 72 (38.5%) | 6 (85.7%) |
| 8 or more Rooms | 61 (32.6%) | 1 (14.3%) |
| Total | 187 (100.0%) | 7 (100.0%) |
Housing Structure by Heating Type in Bear Creek
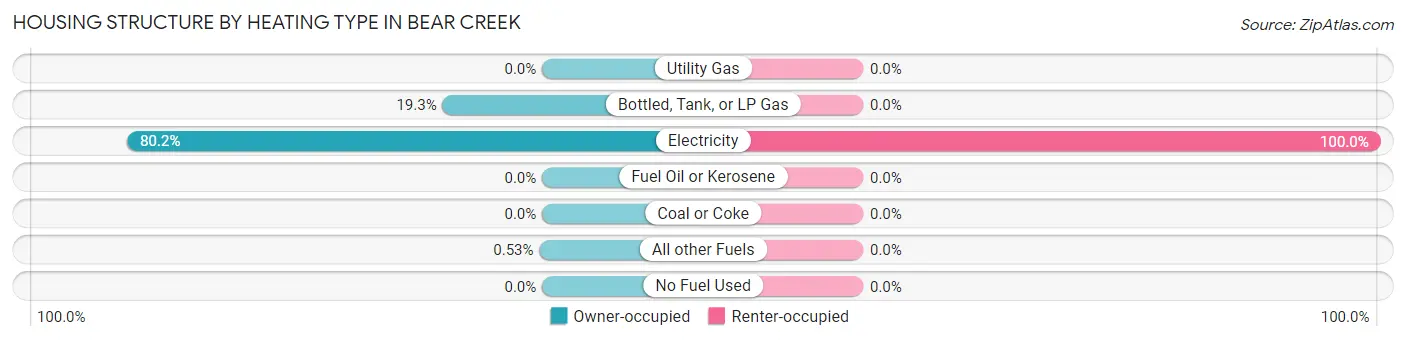
| Heating Type | Owner-occupied | Renter-occupied |
| Utility Gas | 0 (0.0%) | 0 (0.0%) |
| Bottled, Tank, or LP Gas | 36 (19.3%) | 0 (0.0%) |
| Electricity | 150 (80.2%) | 7 (100.0%) |
| Fuel Oil or Kerosene | 0 (0.0%) | 0 (0.0%) |
| Coal or Coke | 0 (0.0%) | 0 (0.0%) |
| All other Fuels | 1 (0.5%) | 0 (0.0%) |
| No Fuel Used | 0 (0.0%) | 0 (0.0%) |
| Total | 187 (100.0%) | 7 (100.0%) |
Household Vehicle Usage in Bear Creek
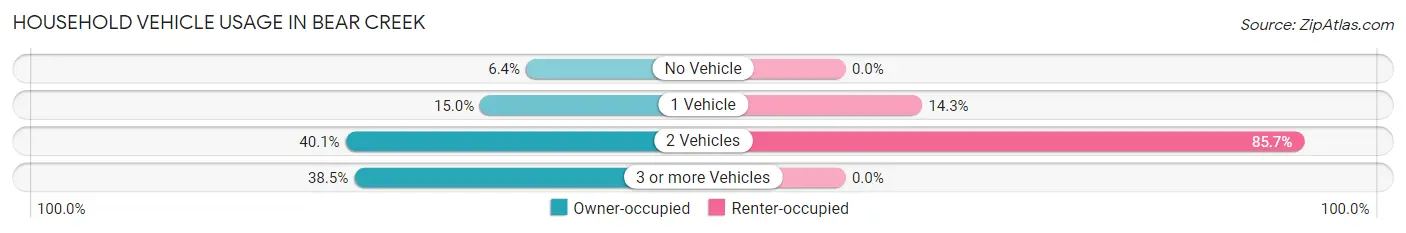
| Vehicles per Household | Owner-occupied | Renter-occupied |
| No Vehicle | 12 (6.4%) | 0 (0.0%) |
| 1 Vehicle | 28 (15.0%) | 1 (14.3%) |
| 2 Vehicles | 75 (40.1%) | 6 (85.7%) |
| 3 or more Vehicles | 72 (38.5%) | 0 (0.0%) |
| Total | 187 (100.0%) | 7 (100.0%) |
Real Estate & Mortgages in Bear Creek
Real Estate and Mortgage Overview in Bear Creek
| Characteristic | Without Mortgage | With Mortgage |
| Housing Units | 75 | 112 |
| Median Property Value | $581,500 | $717,100 |
| Median Household Income | $74,531 | $56 |
| Monthly Housing Costs | $1,003 | $57 |
| Real Estate Taxes | $7,125 | $8 |
Property Value by Mortgage Status in Bear Creek
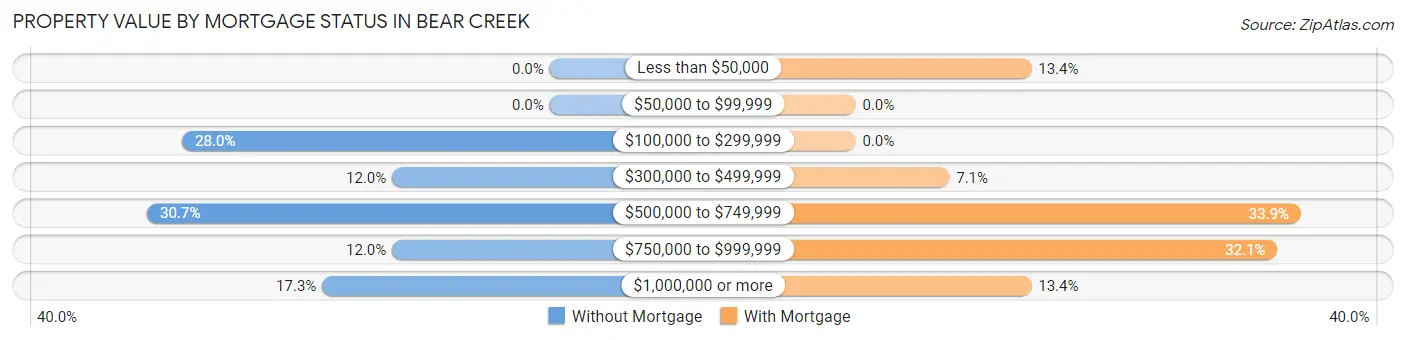
| Property Value | Without Mortgage | With Mortgage |
| Less than $50,000 | 0 (0.0%) | 15 (13.4%) |
| $50,000 to $99,999 | 0 (0.0%) | 0 (0.0%) |
| $100,000 to $299,999 | 21 (28.0%) | 0 (0.0%) |
| $300,000 to $499,999 | 9 (12.0%) | 8 (7.1%) |
| $500,000 to $749,999 | 23 (30.7%) | 38 (33.9%) |
| $750,000 to $999,999 | 9 (12.0%) | 36 (32.1%) |
| $1,000,000 or more | 13 (17.3%) | 15 (13.4%) |
| Total | 75 (100.0%) | 112 (100.0%) |
Household Income by Mortgage Status in Bear Creek
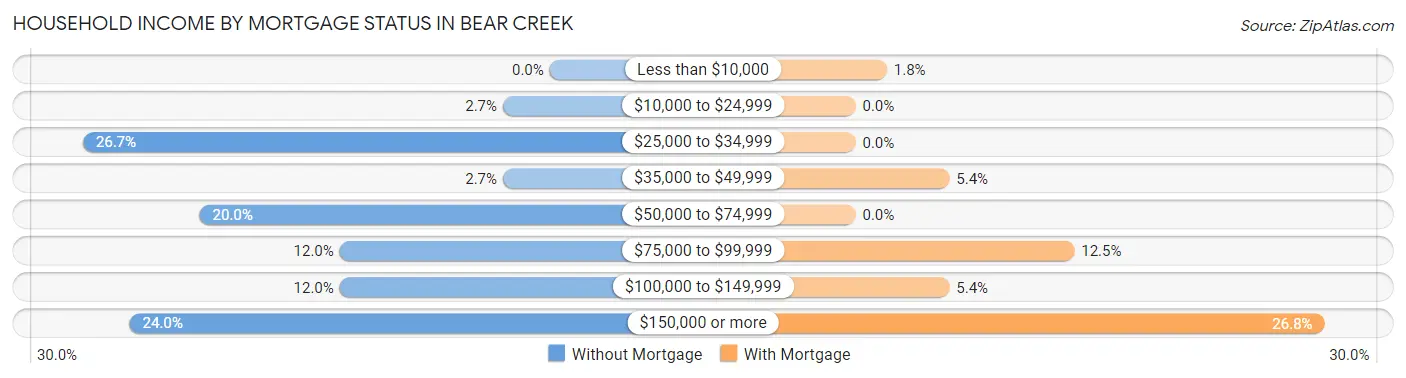
| Household Income | Without Mortgage | With Mortgage |
| Less than $10,000 | 0 (0.0%) | 2 (1.8%) |
| $10,000 to $24,999 | 2 (2.7%) | 0 (0.0%) |
| $25,000 to $34,999 | 20 (26.7%) | 0 (0.0%) |
| $35,000 to $49,999 | 2 (2.7%) | 6 (5.4%) |
| $50,000 to $74,999 | 15 (20.0%) | 0 (0.0%) |
| $75,000 to $99,999 | 9 (12.0%) | 14 (12.5%) |
| $100,000 to $149,999 | 9 (12.0%) | 6 (5.4%) |
| $150,000 or more | 18 (24.0%) | 30 (26.8%) |
| Total | 75 (100.0%) | 112 (100.0%) |
Property Value to Household Income Ratio in Bear Creek
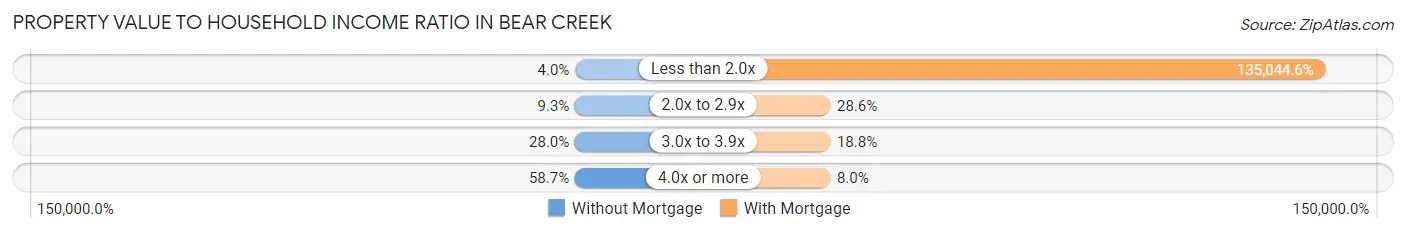
| Value-to-Income Ratio | Without Mortgage | With Mortgage |
| Less than 2.0x | 3 (4.0%) | 151,250 (135,044.6%) |
| 2.0x to 2.9x | 7 (9.3%) | 32 (28.6%) |
| 3.0x to 3.9x | 21 (28.0%) | 21 (18.8%) |
| 4.0x or more | 44 (58.7%) | 9 (8.0%) |
| Total | 75 (100.0%) | 112 (100.0%) |
Real Estate Taxes by Mortgage Status in Bear Creek
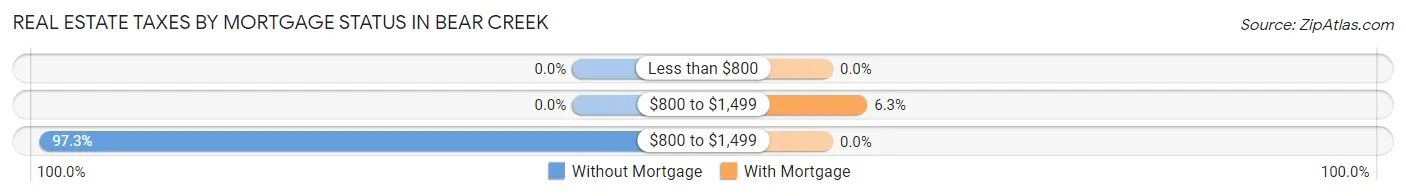
| Property Taxes | Without Mortgage | With Mortgage |
| Less than $800 | 0 (0.0%) | 0 (0.0%) |
| $800 to $1,499 | 0 (0.0%) | 7 (6.2%) |
| $800 to $1,499 | 73 (97.3%) | 0 (0.0%) |
| Total | 75 (100.0%) | 112 (100.0%) |
Health & Disability in Bear Creek
Health Insurance Coverage by Age in Bear Creek
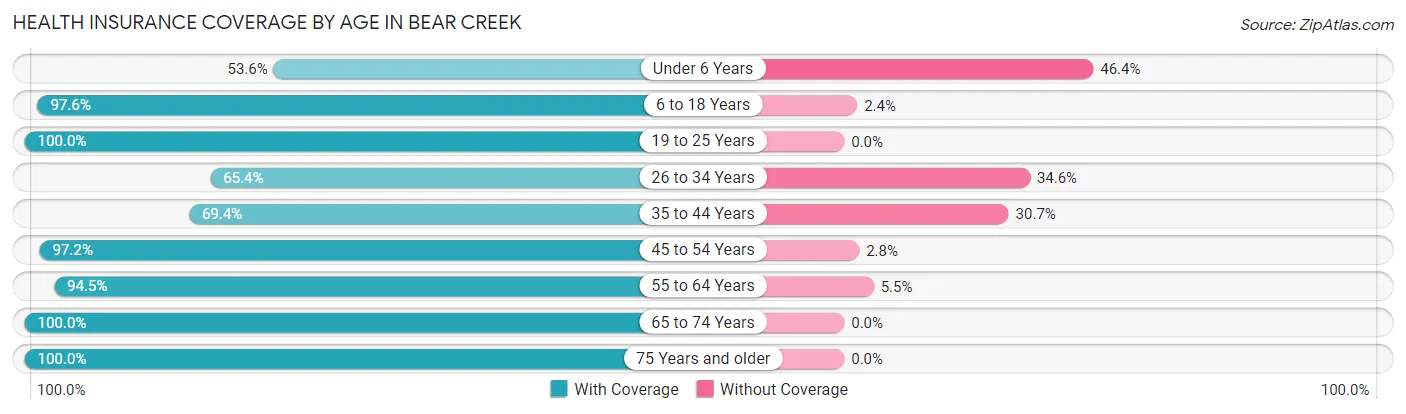
| Age Bracket | With Coverage | Without Coverage |
| Under 6 Years | 15 (53.6%) | 13 (46.4%) |
| 6 to 18 Years | 81 (97.6%) | 2 (2.4%) |
| 19 to 25 Years | 10 (100.0%) | 0 (0.0%) |
| 26 to 34 Years | 17 (65.4%) | 9 (34.6%) |
| 35 to 44 Years | 43 (69.4%) | 19 (30.6%) |
| 45 to 54 Years | 70 (97.2%) | 2 (2.8%) |
| 55 to 64 Years | 86 (94.5%) | 5 (5.5%) |
| 65 to 74 Years | 88 (100.0%) | 0 (0.0%) |
| 75 Years and older | 25 (100.0%) | 0 (0.0%) |
| Total | 435 (89.7%) | 50 (10.3%) |
Health Insurance Coverage by Citizenship Status in Bear Creek
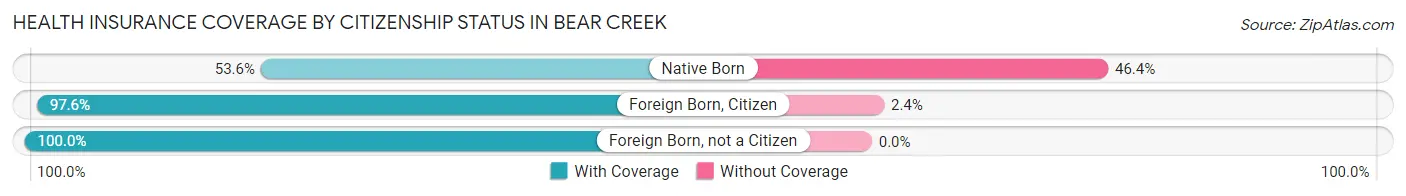
| Citizenship Status | With Coverage | Without Coverage |
| Native Born | 15 (53.6%) | 13 (46.4%) |
| Foreign Born, Citizen | 81 (97.6%) | 2 (2.4%) |
| Foreign Born, not a Citizen | 10 (100.0%) | 0 (0.0%) |
Health Insurance Coverage by Household Income in Bear Creek
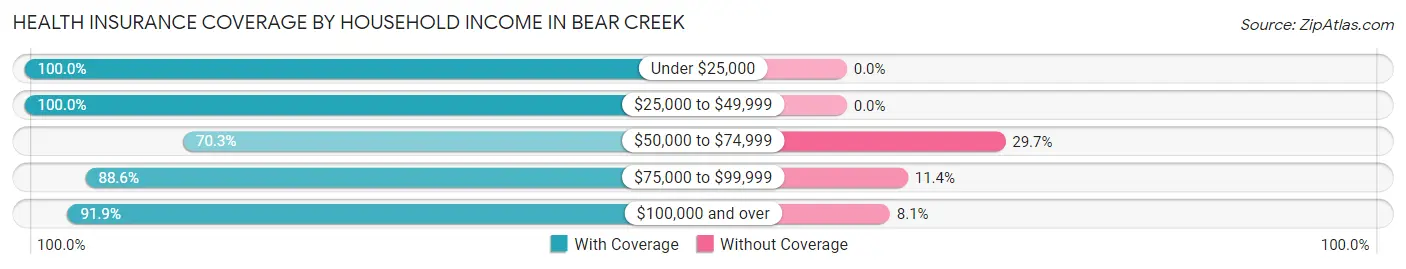
| Household Income | With Coverage | Without Coverage |
| Under $25,000 | 5 (100.0%) | 0 (0.0%) |
| $25,000 to $49,999 | 46 (100.0%) | 0 (0.0%) |
| $50,000 to $74,999 | 45 (70.3%) | 19 (29.7%) |
| $75,000 to $99,999 | 31 (88.6%) | 4 (11.4%) |
| $100,000 and over | 308 (91.9%) | 27 (8.1%) |
Public vs Private Health Insurance Coverage by Age in Bear Creek
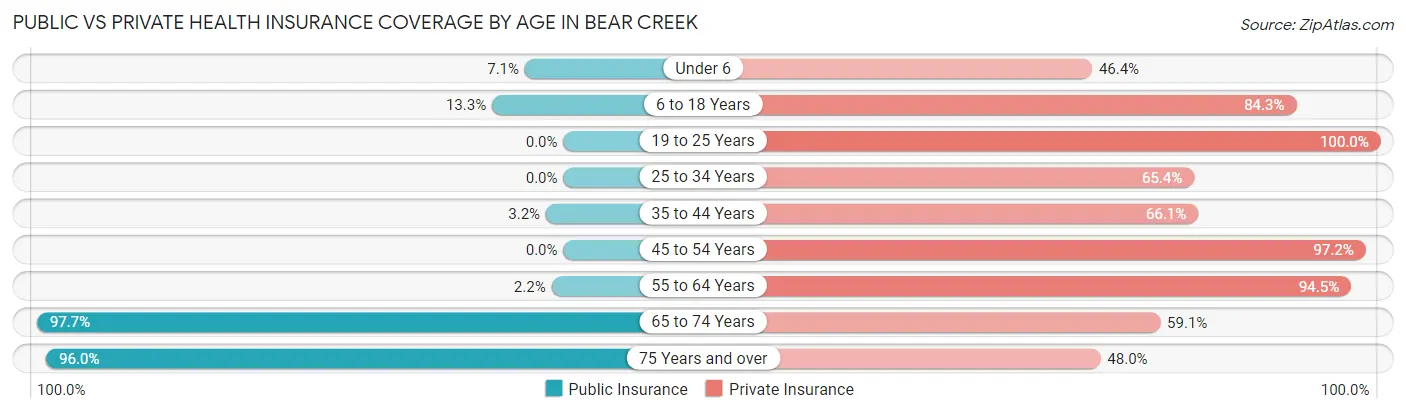
| Age Bracket | Public Insurance | Private Insurance |
| Under 6 | 2 (7.1%) | 13 (46.4%) |
| 6 to 18 Years | 11 (13.3%) | 70 (84.3%) |
| 19 to 25 Years | 0 (0.0%) | 10 (100.0%) |
| 25 to 34 Years | 0 (0.0%) | 17 (65.4%) |
| 35 to 44 Years | 2 (3.2%) | 41 (66.1%) |
| 45 to 54 Years | 0 (0.0%) | 70 (97.2%) |
| 55 to 64 Years | 2 (2.2%) | 86 (94.5%) |
| 65 to 74 Years | 86 (97.7%) | 52 (59.1%) |
| 75 Years and over | 24 (96.0%) | 12 (48.0%) |
| Total | 127 (26.2%) | 371 (76.5%) |
Disability Status by Sex by Age in Bear Creek
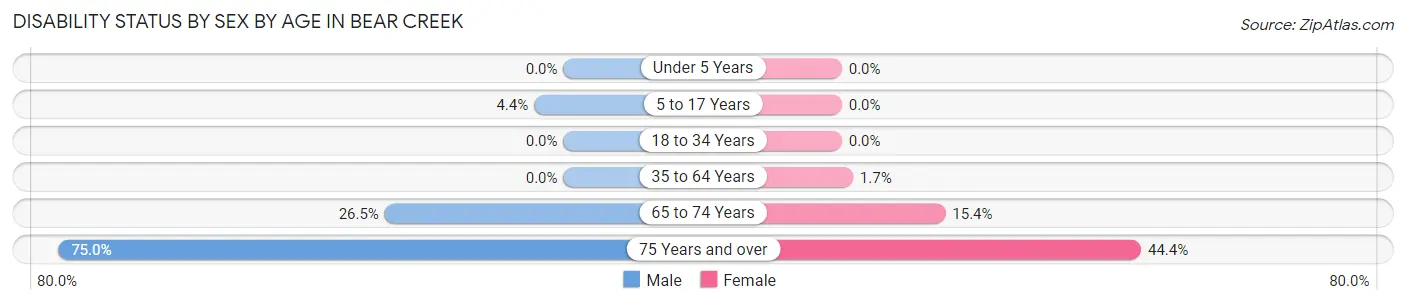
| Age Bracket | Male | Female |
| Under 5 Years | 0 (0.0%) | 0 (0.0%) |
| 5 to 17 Years | 1 (4.3%) | 0 (0.0%) |
| 18 to 34 Years | 0 (0.0%) | 0 (0.0%) |
| 35 to 64 Years | 0 (0.0%) | 2 (1.7%) |
| 65 to 74 Years | 13 (26.5%) | 6 (15.4%) |
| 75 Years and over | 12 (75.0%) | 4 (44.4%) |
Disability Class by Sex by Age in Bear Creek
Disability Class: Hearing Difficulty
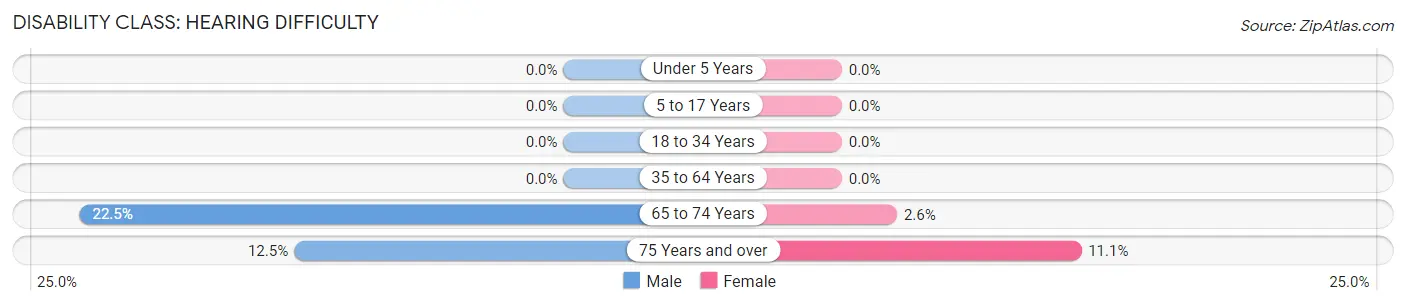
| Age Bracket | Male | Female |
| Under 5 Years | 0 (0.0%) | 0 (0.0%) |
| 5 to 17 Years | 0 (0.0%) | 0 (0.0%) |
| 18 to 34 Years | 0 (0.0%) | 0 (0.0%) |
| 35 to 64 Years | 0 (0.0%) | 0 (0.0%) |
| 65 to 74 Years | 11 (22.5%) | 1 (2.6%) |
| 75 Years and over | 2 (12.5%) | 1 (11.1%) |
Disability Class: Vision Difficulty
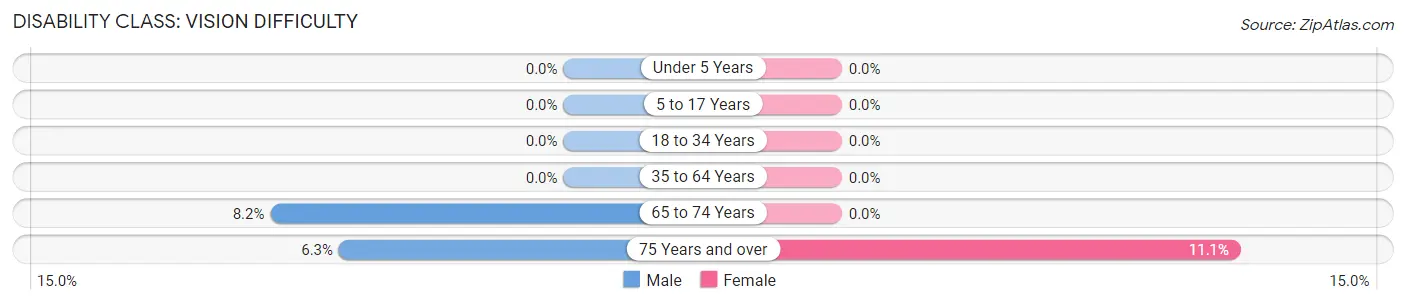
| Age Bracket | Male | Female |
| Under 5 Years | 0 (0.0%) | 0 (0.0%) |
| 5 to 17 Years | 0 (0.0%) | 0 (0.0%) |
| 18 to 34 Years | 0 (0.0%) | 0 (0.0%) |
| 35 to 64 Years | 0 (0.0%) | 0 (0.0%) |
| 65 to 74 Years | 4 (8.2%) | 0 (0.0%) |
| 75 Years and over | 1 (6.2%) | 1 (11.1%) |
Disability Class: Cognitive Difficulty
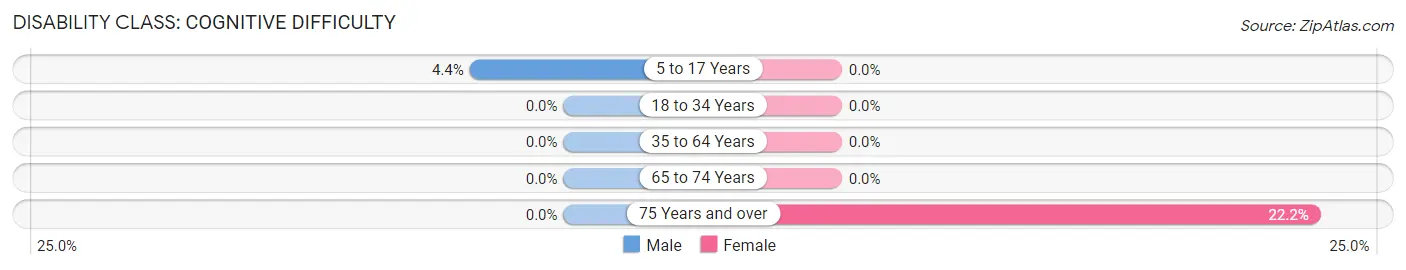
| Age Bracket | Male | Female |
| 5 to 17 Years | 1 (4.3%) | 0 (0.0%) |
| 18 to 34 Years | 0 (0.0%) | 0 (0.0%) |
| 35 to 64 Years | 0 (0.0%) | 0 (0.0%) |
| 65 to 74 Years | 0 (0.0%) | 0 (0.0%) |
| 75 Years and over | 0 (0.0%) | 2 (22.2%) |
Disability Class: Ambulatory Difficulty
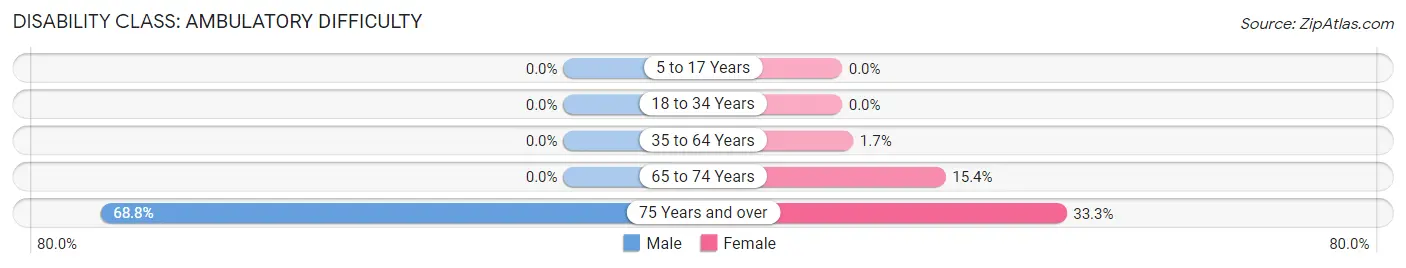
| Age Bracket | Male | Female |
| 5 to 17 Years | 0 (0.0%) | 0 (0.0%) |
| 18 to 34 Years | 0 (0.0%) | 0 (0.0%) |
| 35 to 64 Years | 0 (0.0%) | 2 (1.7%) |
| 65 to 74 Years | 0 (0.0%) | 6 (15.4%) |
| 75 Years and over | 11 (68.8%) | 3 (33.3%) |
Disability Class: Self-Care Difficulty
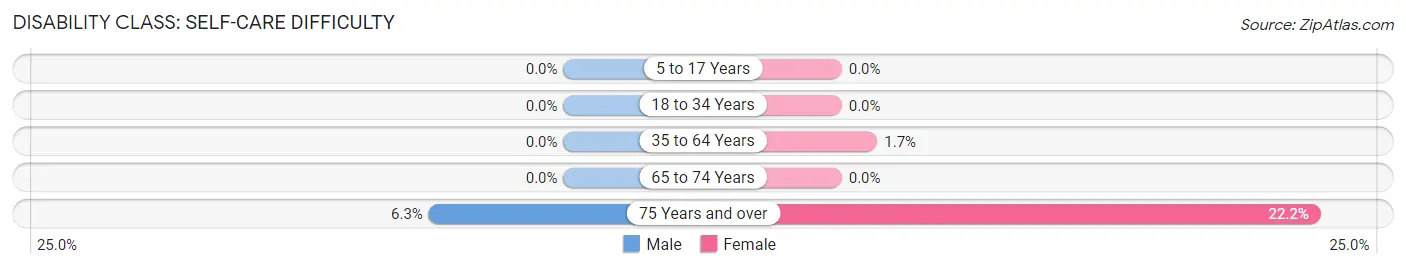
| Age Bracket | Male | Female |
| 5 to 17 Years | 0 (0.0%) | 0 (0.0%) |
| 18 to 34 Years | 0 (0.0%) | 0 (0.0%) |
| 35 to 64 Years | 0 (0.0%) | 2 (1.7%) |
| 65 to 74 Years | 0 (0.0%) | 0 (0.0%) |
| 75 Years and over | 1 (6.2%) | 2 (22.2%) |
Technology Access in Bear Creek
Computing Device Access in Bear Creek
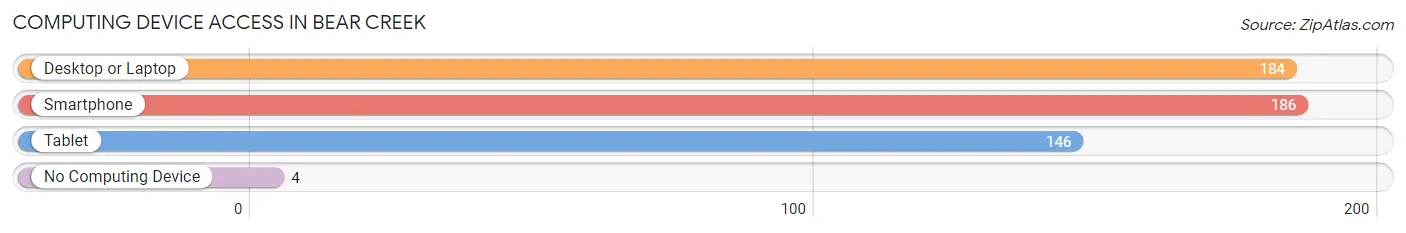
| Device Type | # Households | % Households |
| Desktop or Laptop | 184 | 94.9% |
| Smartphone | 186 | 95.9% |
| Tablet | 146 | 75.3% |
| No Computing Device | 4 | 2.1% |
| Total | 194 | 100.0% |
Internet Access in Bear Creek
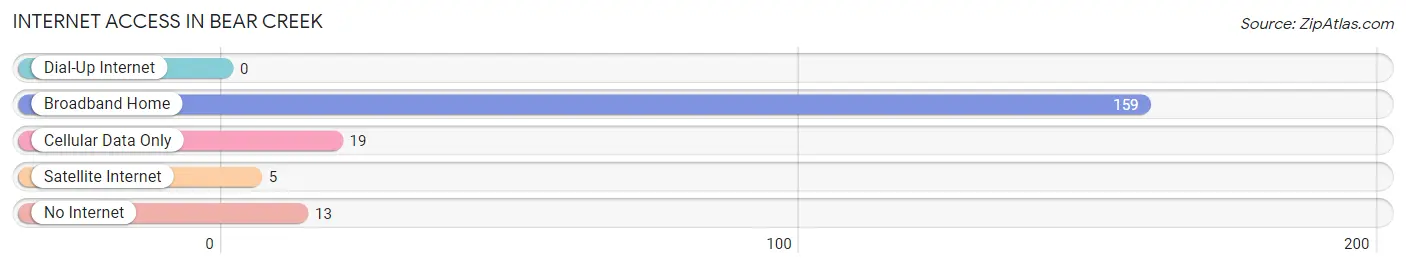
| Internet Type | # Households | % Households |
| Dial-Up Internet | 0 | 0.0% |
| Broadband Home | 159 | 82.0% |
| Cellular Data Only | 19 | 9.8% |
| Satellite Internet | 5 | 2.6% |
| No Internet | 13 | 6.7% |
| Total | 194 | 100.0% |
Bear Creek Summary
Introduction
Bear Creek is a small unincorporated community located in the state of Texas, United States. It is situated in the western part of the state, in the county of Bexar. The community is located on the banks of the Bear Creek, a tributary of the San Antonio River. The population of Bear Creek is estimated to be around 1,000 people.
History
The history of Bear Creek dates back to the early 1800s when the area was first settled by German immigrants. The first settlers were Johann and Anna Maria Schubert, who arrived in 1845. They were followed by other German families, who established farms and ranches in the area. The community was officially established in 1854, when the first post office was opened.
The community grew slowly over the years, and by the early 1900s, it had become a thriving agricultural center. The area was known for its production of cotton, corn, and other crops. In the 1920s, the community was connected to the outside world by the San Antonio and Aransas Pass Railway.
Geography
Bear Creek is located in the western part of the state of Texas, in the county of Bexar. It is situated on the banks of the Bear Creek, a tributary of the San Antonio River. The community is located at an elevation of 830 feet above sea level.
The climate in Bear Creek is classified as humid subtropical, with hot summers and mild winters. The average annual temperature is around 70 degrees Fahrenheit, with an average high of around 90 degrees in the summer and an average low of around 50 degrees in the winter.
Economy
The economy of Bear Creek is largely based on agriculture. The area is known for its production of cotton, corn, and other crops. The community also has a few small businesses, including a grocery store, a gas station, and a few restaurants.
Demographics
The population of Bear Creek is estimated to be around 1,000 people. The racial makeup of the community is predominantly white, with a small percentage of African Americans and Hispanics. The median household income is around $50,000, and the median home value is around $150,000.
Conclusion
Bear Creek is a small unincorporated community located in the western part of the state of Texas. It has a long history, dating back to the early 1800s when it was first settled by German immigrants. The economy of the community is largely based on agriculture, and the population is estimated to be around 1,000 people. The racial makeup of the community is predominantly white, with a small percentage of African Americans and Hispanics.
Common Questions
What is Per Capita Income in Bear Creek?
Per Capita income in Bear Creek is $62,091.
What is the Median Family Income in Bear Creek?
Median Family Income in Bear Creek is $128,542.
What is the Median Household income in Bear Creek?
Median Household Income in Bear Creek is $126,500.
What is Income or Wage Gap in Bear Creek?
Income or Wage Gap in Bear Creek is 5.0%.
Women in Bear Creek earn 95.0 cents for every dollar earned by a man.
What is Inequality or Gini Index in Bear Creek?
Inequality or Gini Index in Bear Creek is 0.40.
What is the Total Population of Bear Creek?
Total Population of Bear Creek is 485.
What is the Total Male Population of Bear Creek?
Total Male Population of Bear Creek is 212.
What is the Total Female Population of Bear Creek?
Total Female Population of Bear Creek is 273.
What is the Ratio of Males per 100 Females in Bear Creek?
There are 77.66 Males per 100 Females in Bear Creek.
What is the Ratio of Females per 100 Males in Bear Creek?
There are 128.77 Females per 100 Males in Bear Creek.
What is the Median Population Age in Bear Creek?
Median Population Age in Bear Creek is 50.1 Years.
What is the Average Family Size in Bear Creek
Average Family Size in Bear Creek is 2.8 People.
What is the Average Household Size in Bear Creek
Average Household Size in Bear Creek is 2.5 People.
How Large is the Labor Force in Bear Creek?
There are 246 People in the Labor Forcein in Bear Creek.
What is the Percentage of People in the Labor Force in Bear Creek?
62.3% of People are in the Labor Force in Bear Creek.
What is the Unemployment Rate in Bear Creek?
Unemployment Rate in Bear Creek is 6.1%.