Gibbsville, WI Map & Demographics
Gibbsville Map
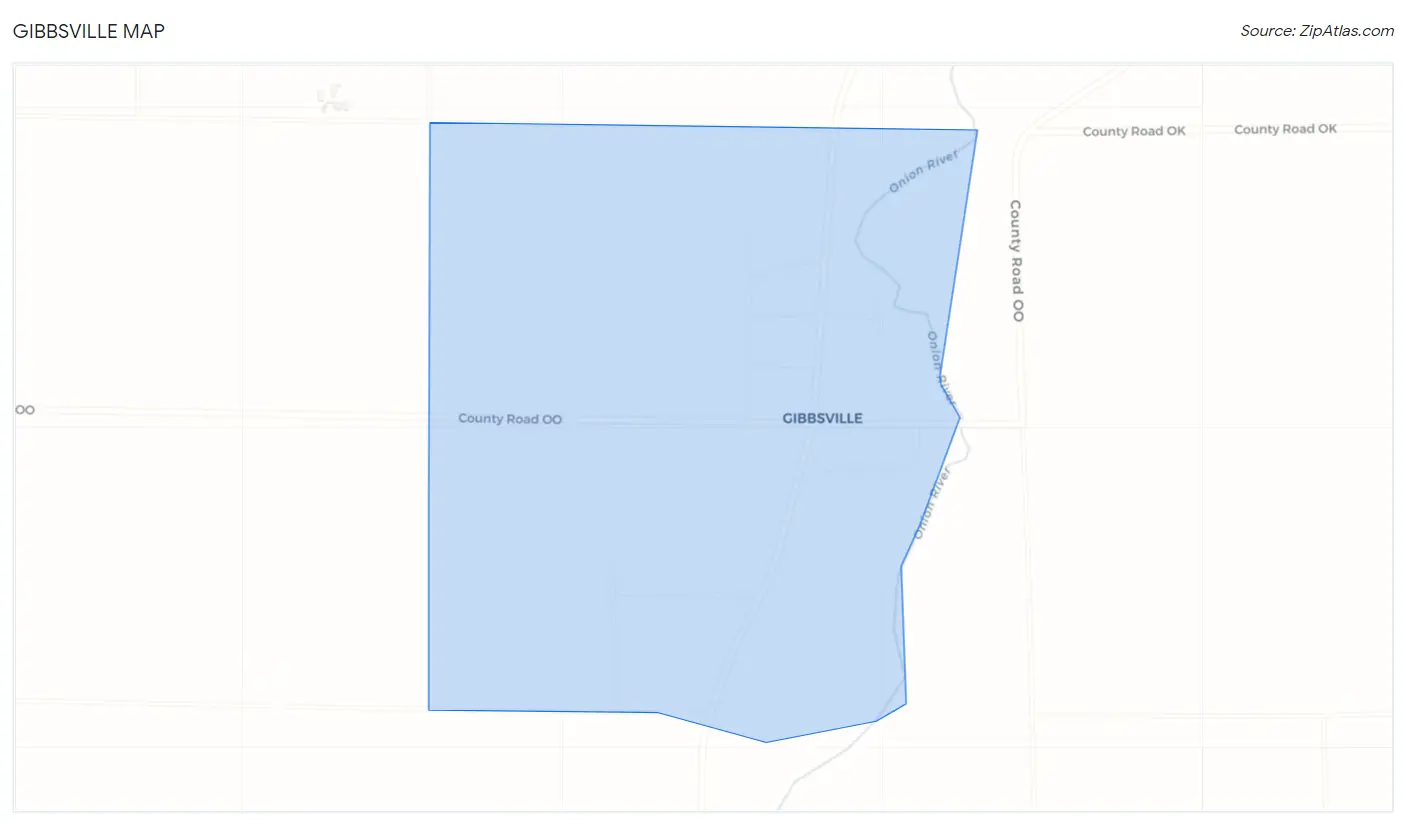
Gibbsville Overview
$39,555
PER CAPITA INCOME
$108,750
AVG FAMILY INCOME
$94,844
AVG HOUSEHOLD INCOME
5.5%
WAGE / INCOME GAP [ % ]
94.5¢/ $1
WAGE / INCOME GAP [ $ ]
0.29
INEQUALITY / GINI INDEX
526
TOTAL POPULATION
263
MALE POPULATION
263
FEMALE POPULATION
100.00
MALES / 100 FEMALES
100.00
FEMALES / 100 MALES
37.7
MEDIAN AGE
3.5
AVG FAMILY SIZE
2.8
AVG HOUSEHOLD SIZE
327
LABOR FORCE [ PEOPLE ]
78.2%
PERCENT IN LABOR FORCE
Income in Gibbsville
Income Overview in Gibbsville
Per Capita Income in Gibbsville is $39,555, while median incomes of families and households are $108,750 and $94,844 respectively.
| Characteristic | Number | Measure |
| Per Capita Income | 526 | $39,555 |
| Median Family Income | 126 | $108,750 |
| Mean Family Income | 126 | $119,575 |
| Median Household Income | 187 | $94,844 |
| Mean Household Income | 187 | $107,909 |
| Income Deficit | 126 | $0 |
| Wage / Income Gap (%) | 526 | 5.46% |
| Wage / Income Gap ($) | 526 | 94.54¢ per $1 |
| Gini / Inequality Index | 526 | 0.29 |
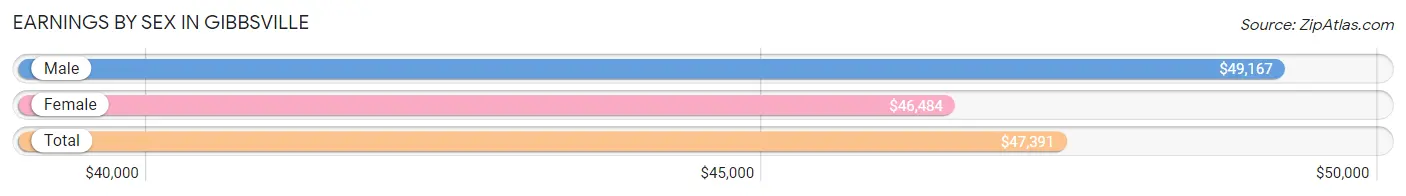
Earnings by Sex in Gibbsville
Average Earnings in Gibbsville are $47,391, $49,167 for men and $46,484 for women, a difference of 5.5%.
| Sex | Number | Average Earnings |
| Male | 196 (57.7%) | $49,167 |
| Female | 144 (42.3%) | $46,484 |
| Total | 340 (100.0%) | $47,391 |
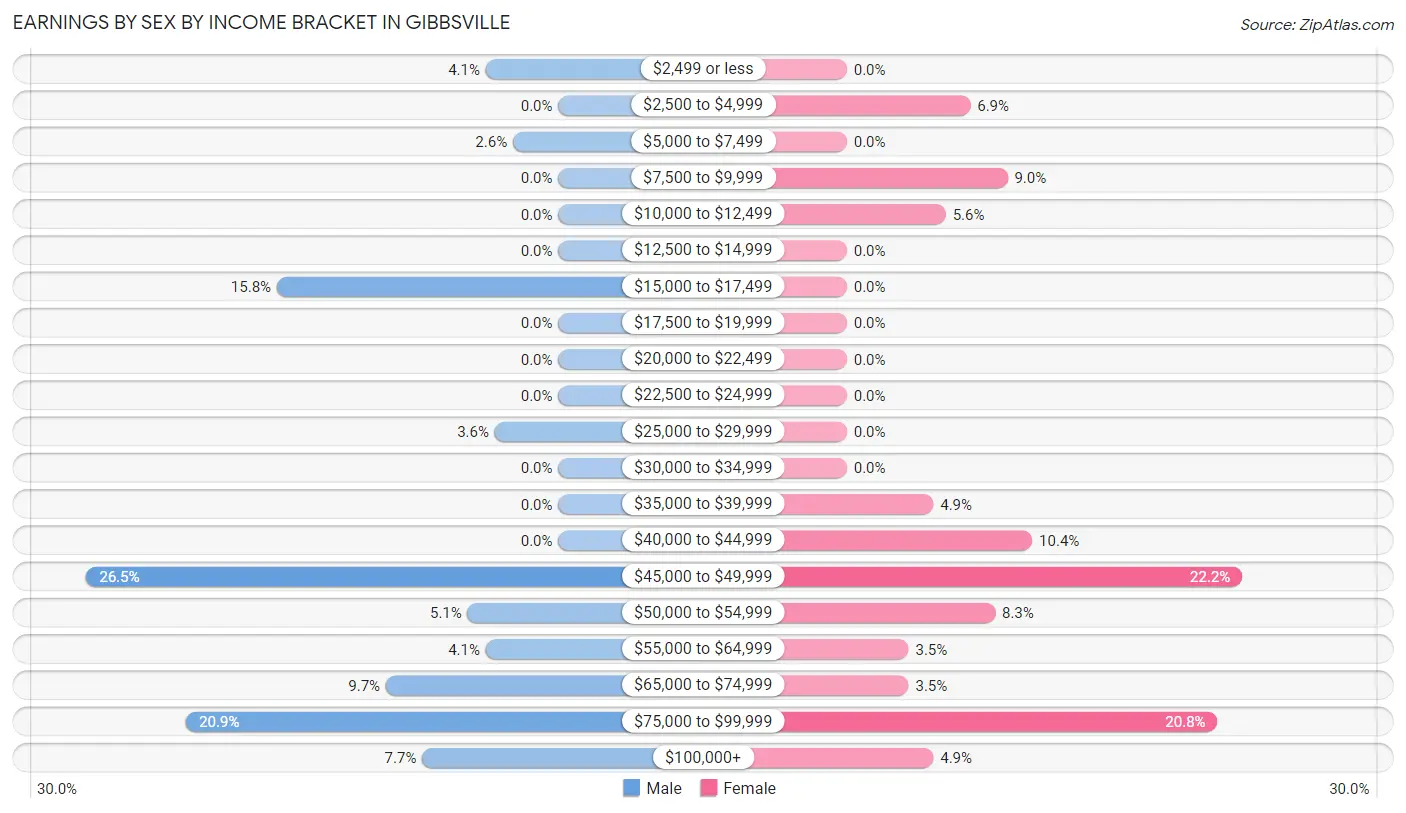
Earnings by Sex by Income Bracket in Gibbsville
The most common earnings brackets in Gibbsville are $45,000 to $49,999 for men (52 | 26.5%) and $45,000 to $49,999 for women (32 | 22.2%).
| Income | Male | Female |
| $2,499 or less | 8 (4.1%) | 0 (0.0%) |
| $2,500 to $4,999 | 0 (0.0%) | 10 (6.9%) |
| $5,000 to $7,499 | 5 (2.5%) | 0 (0.0%) |
| $7,500 to $9,999 | 0 (0.0%) | 13 (9.0%) |
| $10,000 to $12,499 | 0 (0.0%) | 8 (5.6%) |
| $12,500 to $14,999 | 0 (0.0%) | 0 (0.0%) |
| $15,000 to $17,499 | 31 (15.8%) | 0 (0.0%) |
| $17,500 to $19,999 | 0 (0.0%) | 0 (0.0%) |
| $20,000 to $22,499 | 0 (0.0%) | 0 (0.0%) |
| $22,500 to $24,999 | 0 (0.0%) | 0 (0.0%) |
| $25,000 to $29,999 | 7 (3.6%) | 0 (0.0%) |
| $30,000 to $34,999 | 0 (0.0%) | 0 (0.0%) |
| $35,000 to $39,999 | 0 (0.0%) | 7 (4.9%) |
| $40,000 to $44,999 | 0 (0.0%) | 15 (10.4%) |
| $45,000 to $49,999 | 52 (26.5%) | 32 (22.2%) |
| $50,000 to $54,999 | 10 (5.1%) | 12 (8.3%) |
| $55,000 to $64,999 | 8 (4.1%) | 5 (3.5%) |
| $65,000 to $74,999 | 19 (9.7%) | 5 (3.5%) |
| $75,000 to $99,999 | 41 (20.9%) | 30 (20.8%) |
| $100,000+ | 15 (7.6%) | 7 (4.9%) |
| Total | 196 (100.0%) | 144 (100.0%) |
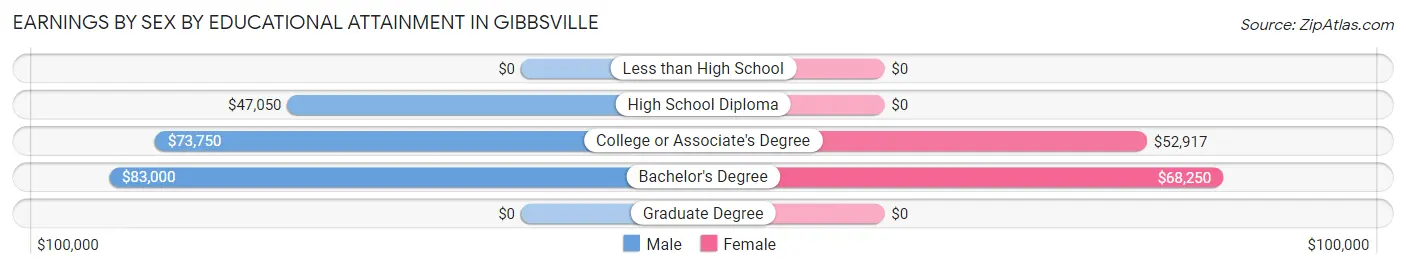
Earnings by Sex by Educational Attainment in Gibbsville
Average earnings in Gibbsville are $66,250 for men and $51,042 for women, a difference of 23.0%. Men with an educational attainment of bachelor's degree enjoy the highest average annual earnings of $83,000, while those with high school diploma education earn the least with $47,050. Women with an educational attainment of bachelor's degree earn the most with the average annual earnings of $68,250, while those with college or associate's degree education have the smallest earnings of $52,917.
| Educational Attainment | Male Income | Female Income |
| Less than High School | - | - |
| High School Diploma | $47,050 | $0 |
| College or Associate's Degree | $73,750 | $52,917 |
| Bachelor's Degree | $83,000 | $68,250 |
| Graduate Degree | - | - |
| Total | $66,250 | $51,042 |
Family Income in Gibbsville
Family Income Brackets in Gibbsville
According to the Gibbsville family income data, there are 59 families falling into the $100,000 to $149,999 income range, which is the most common income bracket and makes up 46.8% of all families.
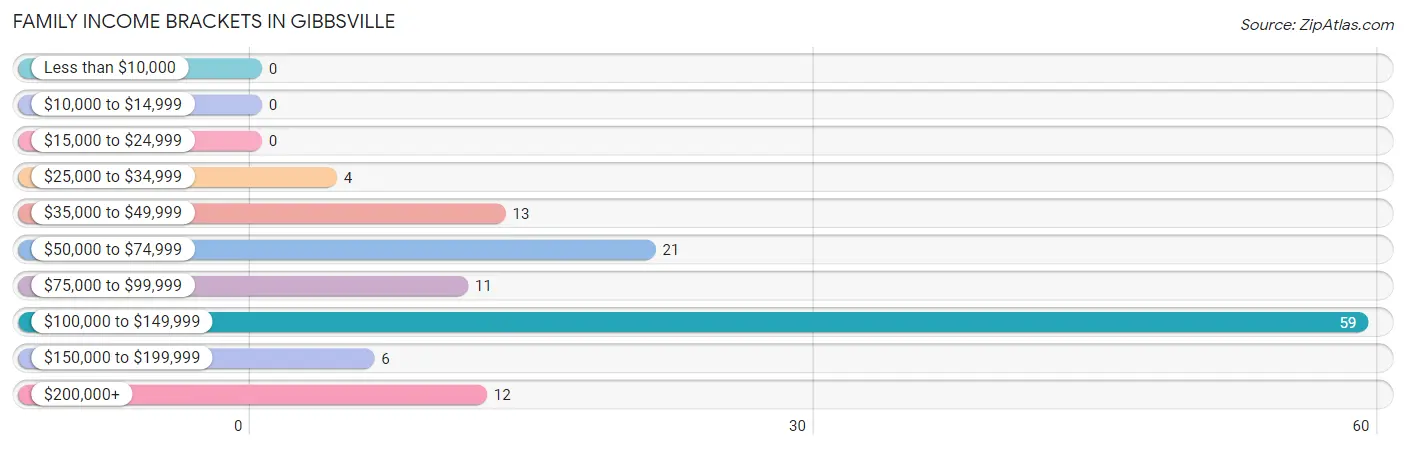
| Income Bracket | # Families | % Families |
| Less than $10,000 | 0 | 0.0% |
| $10,000 to $14,999 | 0 | 0.0% |
| $15,000 to $24,999 | 0 | 0.0% |
| $25,000 to $34,999 | 4 | 3.2% |
| $35,000 to $49,999 | 13 | 10.3% |
| $50,000 to $74,999 | 21 | 16.7% |
| $75,000 to $99,999 | 11 | 8.7% |
| $100,000 to $149,999 | 59 | 46.8% |
| $150,000 to $199,999 | 6 | 4.8% |
| $200,000+ | 12 | 9.5% |
Family Income by Famaliy Size in Gibbsville
4-person families (22 | 17.5%) account for the highest median family income in Gibbsville with $141,071 per family, while 2-person families (60 | 47.6%) have the highest median income of $35,834 per family member.
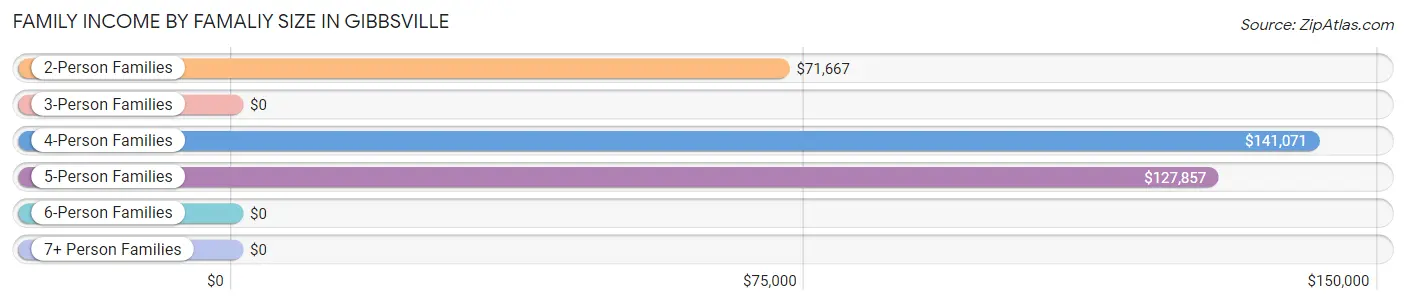
| Income Bracket | # Families | Median Income |
| 2-Person Families | 60 (47.6%) | $71,667 |
| 3-Person Families | 14 (11.1%) | $0 |
| 4-Person Families | 22 (17.5%) | $141,071 |
| 5-Person Families | 30 (23.8%) | $127,857 |
| 6-Person Families | 0 (0.0%) | $0 |
| 7+ Person Families | 0 (0.0%) | $0 |
| Total | 126 (100.0%) | $108,750 |
Family Income by Number of Earners in Gibbsville
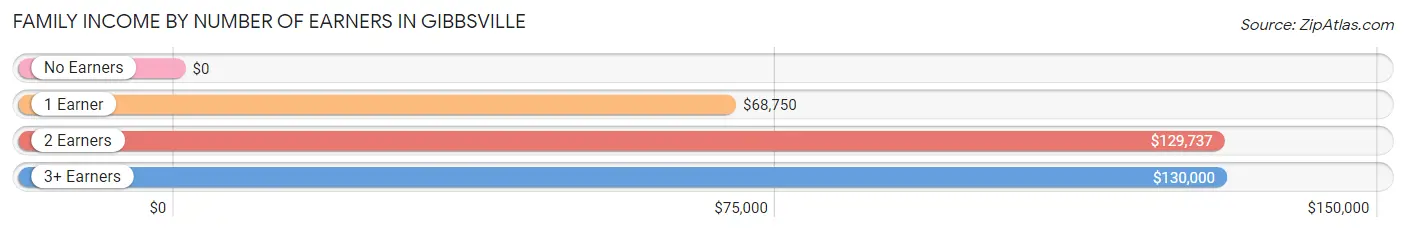
| Number of Earners | # Families | Median Income |
| No Earners | 4 (3.2%) | $0 |
| 1 Earner | 44 (34.9%) | $68,750 |
| 2 Earners | 40 (31.8%) | $129,737 |
| 3+ Earners | 38 (30.2%) | $130,000 |
| Total | 126 (100.0%) | $108,750 |
Household Income in Gibbsville
Household Income Brackets in Gibbsville
With 69 households falling in the category, the $100,000 to $149,999 income range is the most frequent in Gibbsville, accounting for 36.9% of all households.
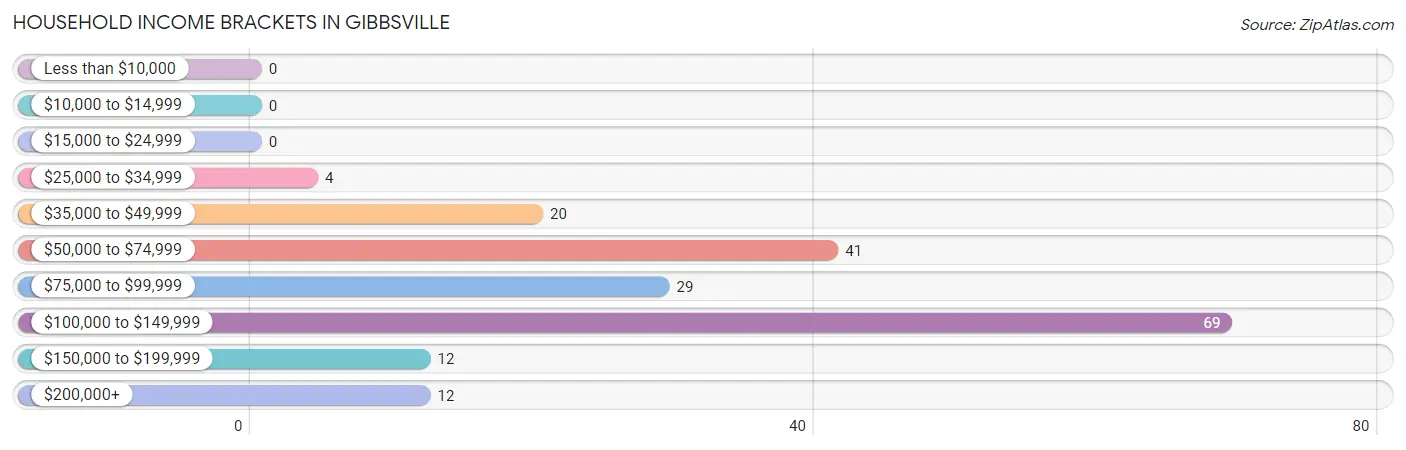
| Income Bracket | # Households | % Households |
| Less than $10,000 | 0 | 0.0% |
| $10,000 to $14,999 | 0 | 0.0% |
| $15,000 to $24,999 | 0 | 0.0% |
| $25,000 to $34,999 | 4 | 2.1% |
| $35,000 to $49,999 | 20 | 10.7% |
| $50,000 to $74,999 | 41 | 21.9% |
| $75,000 to $99,999 | 29 | 15.5% |
| $100,000 to $149,999 | 69 | 36.9% |
| $150,000 to $199,999 | 12 | 6.4% |
| $200,000+ | 12 | 6.4% |
Household Income by Householder Age in Gibbsville
The median household income in Gibbsville is $94,844, with the highest median household income of $103,047 found in the 45 to 64 years age bracket for the primary householder. A total of 107 households (57.2%) fall into this category. Meanwhile, the 15 to 24 years age bracket for the primary householder has the lowest median household income of $0, with 9 households (4.8%) in this group.
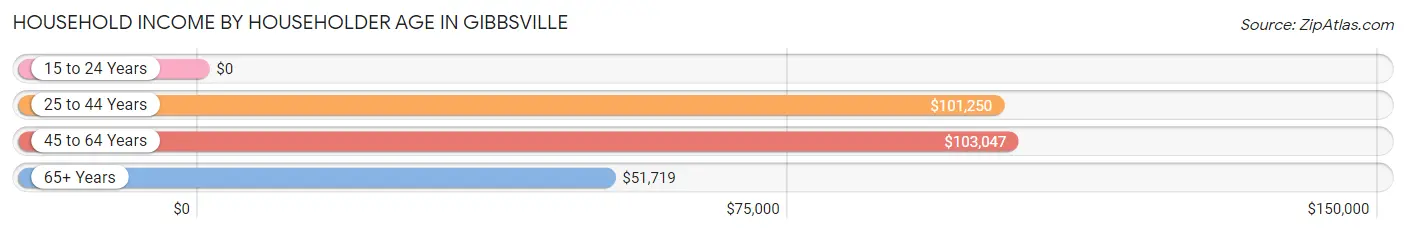
| Income Bracket | # Households | Median Income |
| 15 to 24 Years | 9 (4.8%) | $0 |
| 25 to 44 Years | 42 (22.5%) | $101,250 |
| 45 to 64 Years | 107 (57.2%) | $103,047 |
| 65+ Years | 29 (15.5%) | $51,719 |
| Total | 187 (100.0%) | $94,844 |
Poverty in Gibbsville
Income Below Poverty by Sex and Age in Gibbsville
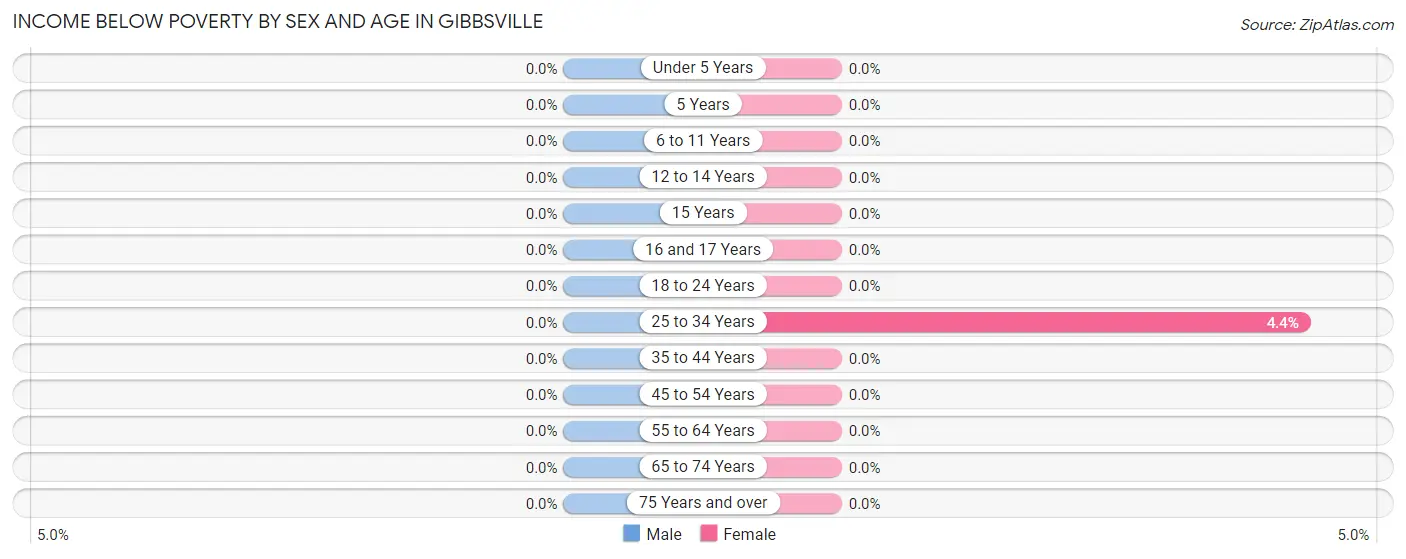
| Age Bracket | Male | Female |
| Under 5 Years | 0 (0.0%) | 0 (0.0%) |
| 5 Years | 0 (0.0%) | 0 (0.0%) |
| 6 to 11 Years | 0 (0.0%) | 0 (0.0%) |
| 12 to 14 Years | 0 (0.0%) | 0 (0.0%) |
| 15 Years | 0 (0.0%) | 0 (0.0%) |
| 16 and 17 Years | 0 (0.0%) | 0 (0.0%) |
| 18 to 24 Years | 0 (0.0%) | 0 (0.0%) |
| 25 to 34 Years | 0 (0.0%) | 1 (4.3%) |
| 35 to 44 Years | 0 (0.0%) | 0 (0.0%) |
| 45 to 54 Years | 0 (0.0%) | 0 (0.0%) |
| 55 to 64 Years | 0 (0.0%) | 0 (0.0%) |
| 65 to 74 Years | 0 (0.0%) | 0 (0.0%) |
| 75 Years and over | 0 (0.0%) | 0 (0.0%) |
| Total | 0 (0.0%) | 1 (0.4%) |
Income Above Poverty by Sex and Age in Gibbsville
According to the poverty statistics in Gibbsville, males aged under 5 years and females aged under 5 years are the age groups that are most secure financially, with 100.0% of males and 100.0% of females in these age groups living above the poverty line.
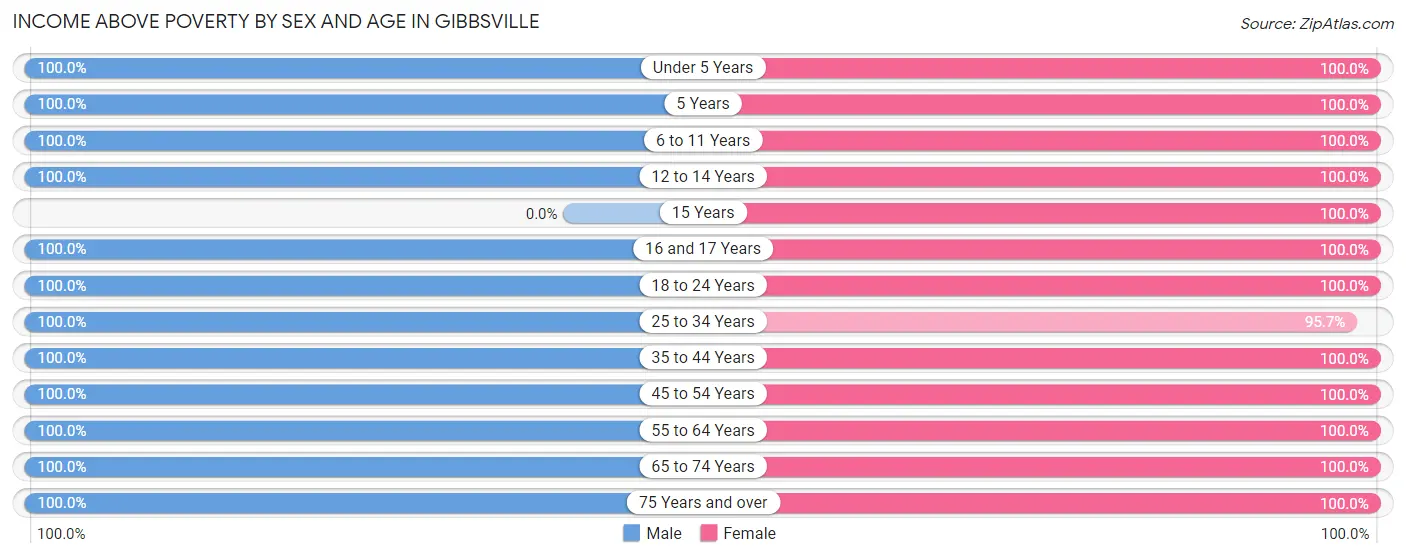
| Age Bracket | Male | Female |
| Under 5 Years | 14 (100.0%) | 15 (100.0%) |
| 5 Years | 7 (100.0%) | 13 (100.0%) |
| 6 to 11 Years | 6 (100.0%) | 19 (100.0%) |
| 12 to 14 Years | 7 (100.0%) | 23 (100.0%) |
| 15 Years | 0 (0.0%) | 4 (100.0%) |
| 16 and 17 Years | 3 (100.0%) | 5 (100.0%) |
| 18 to 24 Years | 58 (100.0%) | 26 (100.0%) |
| 25 to 34 Years | 31 (100.0%) | 22 (95.7%) |
| 35 to 44 Years | 14 (100.0%) | 16 (100.0%) |
| 45 to 54 Years | 57 (100.0%) | 61 (100.0%) |
| 55 to 64 Years | 29 (100.0%) | 39 (100.0%) |
| 65 to 74 Years | 28 (100.0%) | 10 (100.0%) |
| 75 Years and over | 9 (100.0%) | 9 (100.0%) |
| Total | 263 (100.0%) | 262 (99.6%) |
Income Below Poverty Among Married-Couple Families in Gibbsville
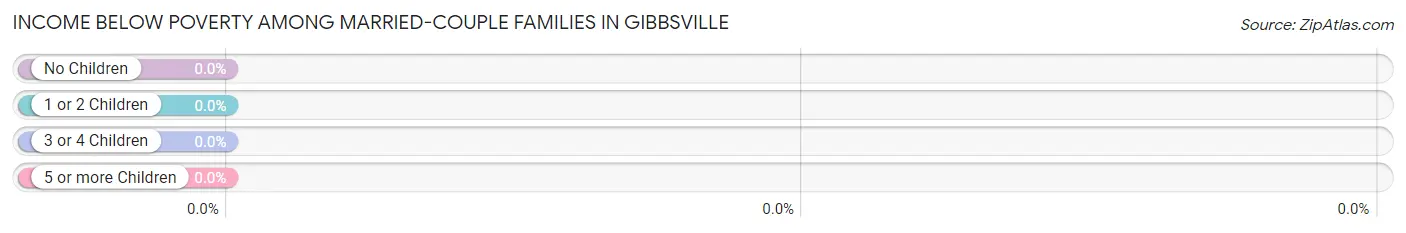
| Children | Above Poverty | Below Poverty |
| No Children | 65 (100.0%) | 0 (0.0%) |
| 1 or 2 Children | 34 (100.0%) | 0 (0.0%) |
| 3 or 4 Children | 19 (100.0%) | 0 (0.0%) |
| 5 or more Children | 0 (0.0%) | 0 (0.0%) |
| Total | 118 (100.0%) | 0 (0.0%) |
Income Below Poverty Among Single-Parent Households in Gibbsville
| Children | Single Father | Single Mother |
| No Children | 0 (0.0%) | 0 (0.0%) |
| 1 or 2 Children | 0 (0.0%) | 0 (0.0%) |
| 3 or 4 Children | 0 (0.0%) | 0 (0.0%) |
| 5 or more Children | 0 (0.0%) | 0 (0.0%) |
| Total | 0 (0.0%) | 0 (0.0%) |
Income Below Poverty Among Married-Couple vs Single-Parent Households in Gibbsville
| Children | Married-Couple Families | Single-Parent Households |
| No Children | 0 (0.0%) | 0 (0.0%) |
| 1 or 2 Children | 0 (0.0%) | 0 (0.0%) |
| 3 or 4 Children | 0 (0.0%) | 0 (0.0%) |
| 5 or more Children | 0 (0.0%) | 0 (0.0%) |
| Total | 0 (0.0%) | 0 (0.0%) |
Race in Gibbsville
The most populous races in Gibbsville are White / Caucasian (464 | 88.2%), Two or more Races (33 | 6.3%), and Asian (17 | 3.2%).
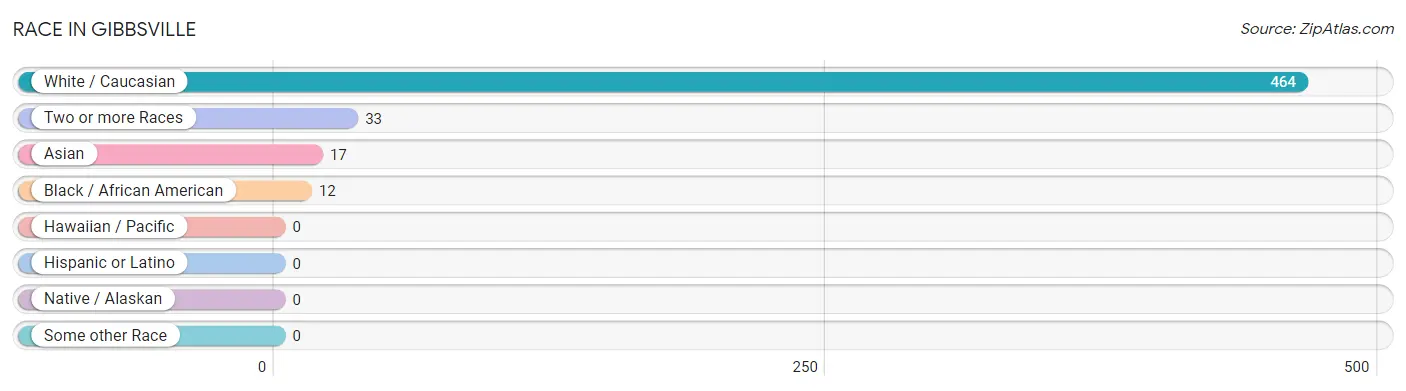
| Race | # Population | % Population |
| Asian | 17 | 3.2% |
| Black / African American | 12 | 2.3% |
| Hawaiian / Pacific | 0 | 0.0% |
| Hispanic or Latino | 0 | 0.0% |
| Native / Alaskan | 0 | 0.0% |
| White / Caucasian | 464 | 88.2% |
| Two or more Races | 33 | 6.3% |
| Some other Race | 0 | 0.0% |
| Total | 526 | 100.0% |
Ancestry in Gibbsville
The most populous ancestries reported in Gibbsville are German (259 | 49.2%), Dutch (117 | 22.2%), Irish (67 | 12.7%), English (58 | 11.0%), and Bangladeshi (33 | 6.3%), together accounting for 101.5% of all Gibbsville residents.
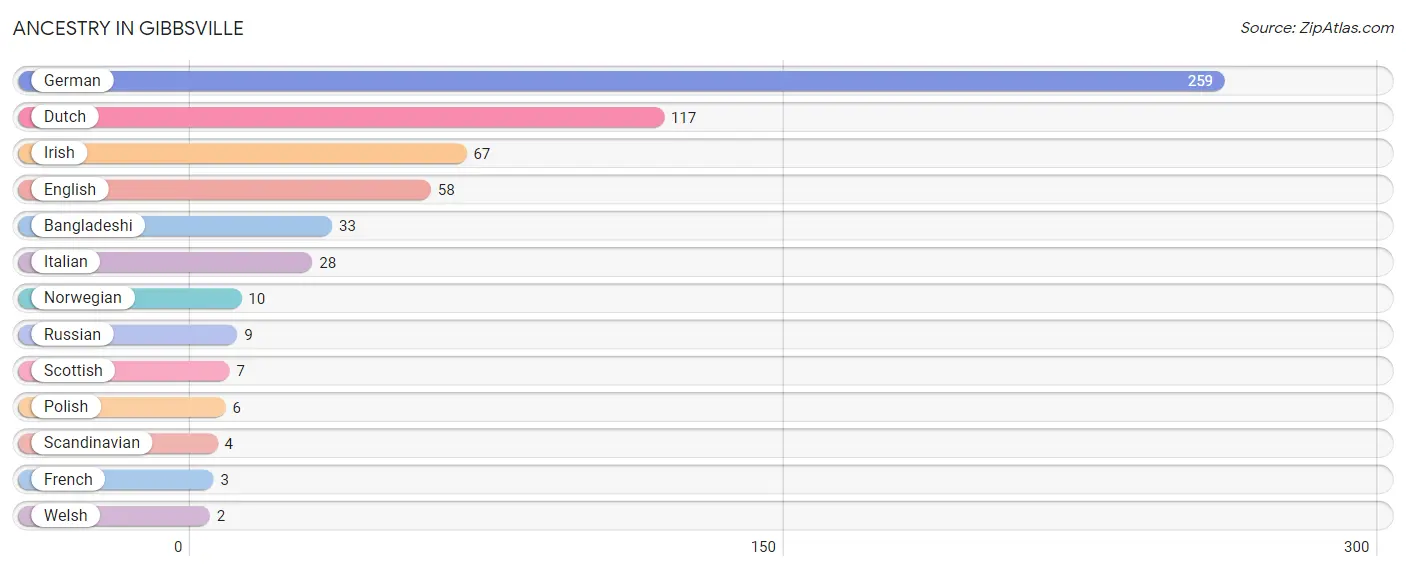
| Ancestry | # Population | % Population |
| Bangladeshi | 33 | 6.3% |
| Dutch | 117 | 22.2% |
| English | 58 | 11.0% |
| French | 3 | 0.6% |
| German | 259 | 49.2% |
| Irish | 67 | 12.7% |
| Italian | 28 | 5.3% |
| Norwegian | 10 | 1.9% |
| Polish | 6 | 1.1% |
| Russian | 9 | 1.7% |
| Scandinavian | 4 | 0.8% |
| Scottish | 7 | 1.3% |
| Welsh | 2 | 0.4% | View All 13 Rows |
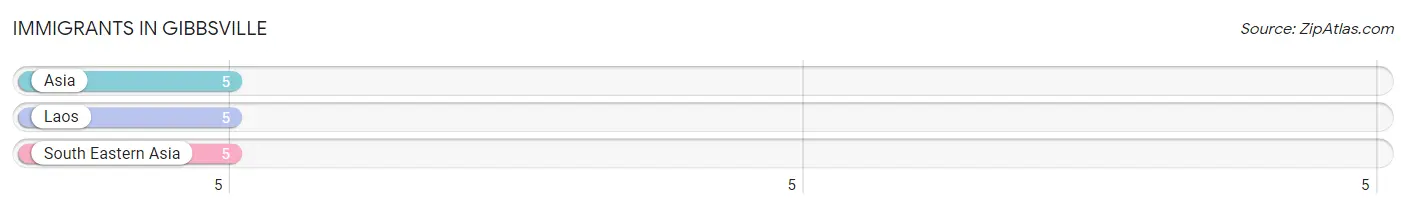
Immigrants in Gibbsville
The most numerous immigrant groups reported in Gibbsville came from Asia (5 | 0.9%), Laos (5 | 0.9%), and South Eastern Asia (5 | 0.9%), together accounting for 2.8% of all Gibbsville residents.
| Immigration Origin | # Population | % Population |
| Asia | 5 | 0.9% |
| Laos | 5 | 0.9% |
| South Eastern Asia | 5 | 0.9% | View All 3 Rows |
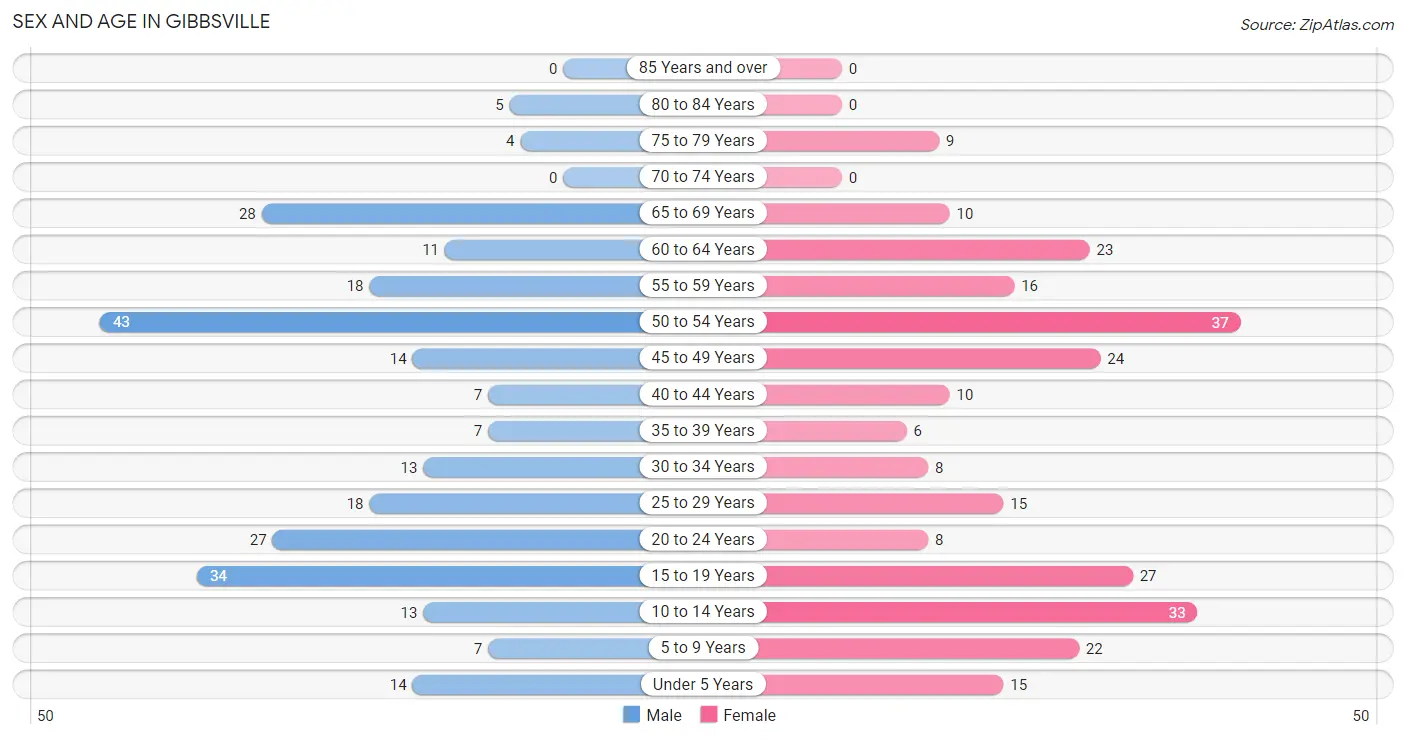
Sex and Age in Gibbsville
Sex and Age in Gibbsville
The most populous age groups in Gibbsville are 50 to 54 Years (43 | 16.4%) for men and 50 to 54 Years (37 | 14.1%) for women.
| Age Bracket | Male | Female |
| Under 5 Years | 14 (5.3%) | 15 (5.7%) |
| 5 to 9 Years | 7 (2.7%) | 22 (8.4%) |
| 10 to 14 Years | 13 (4.9%) | 33 (12.6%) |
| 15 to 19 Years | 34 (12.9%) | 27 (10.3%) |
| 20 to 24 Years | 27 (10.3%) | 8 (3.0%) |
| 25 to 29 Years | 18 (6.8%) | 15 (5.7%) |
| 30 to 34 Years | 13 (4.9%) | 8 (3.0%) |
| 35 to 39 Years | 7 (2.7%) | 6 (2.3%) |
| 40 to 44 Years | 7 (2.7%) | 10 (3.8%) |
| 45 to 49 Years | 14 (5.3%) | 24 (9.1%) |
| 50 to 54 Years | 43 (16.4%) | 37 (14.1%) |
| 55 to 59 Years | 18 (6.8%) | 16 (6.1%) |
| 60 to 64 Years | 11 (4.2%) | 23 (8.7%) |
| 65 to 69 Years | 28 (10.6%) | 10 (3.8%) |
| 70 to 74 Years | 0 (0.0%) | 0 (0.0%) |
| 75 to 79 Years | 4 (1.5%) | 9 (3.4%) |
| 80 to 84 Years | 5 (1.9%) | 0 (0.0%) |
| 85 Years and over | 0 (0.0%) | 0 (0.0%) |
| Total | 263 (100.0%) | 263 (100.0%) |
Families and Households in Gibbsville
Median Family Size in Gibbsville
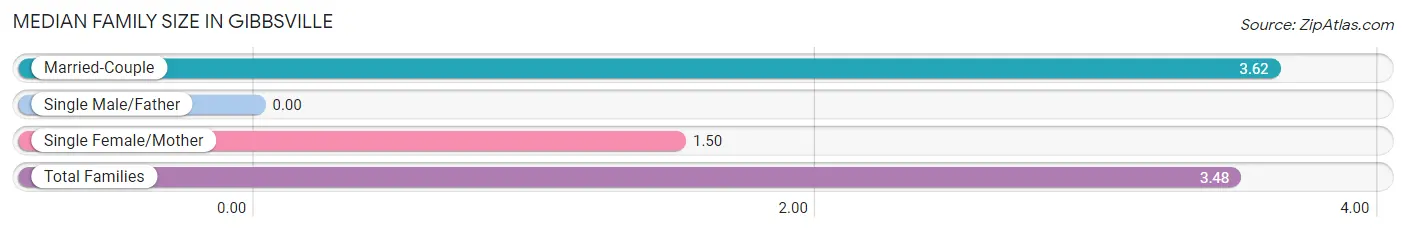
| Family Type | # Families | Family Size |
| Married-Couple | 118 (93.6%) | 3.62 |
| Single Male/Father | 0 (0.0%) | - |
| Single Female/Mother | 8 (6.4%) | 1.50 |
| Total Families | 126 (100.0%) | 3.48 |
Median Household Size in Gibbsville
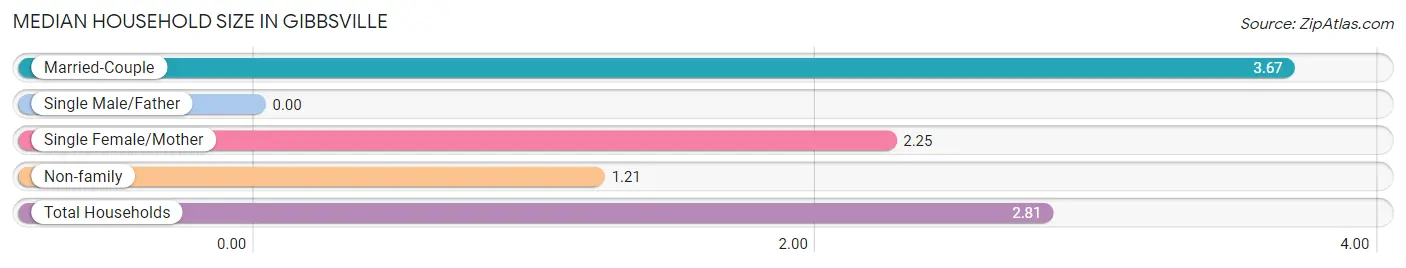
| Household Type | # Households | Household Size |
| Married-Couple | 118 (63.1%) | 3.67 |
| Single Male/Father | 0 (0.0%) | - |
| Single Female/Mother | 8 (4.3%) | 2.25 |
| Non-family | 61 (32.6%) | 1.21 |
| Total Households | 187 (100.0%) | 2.81 |
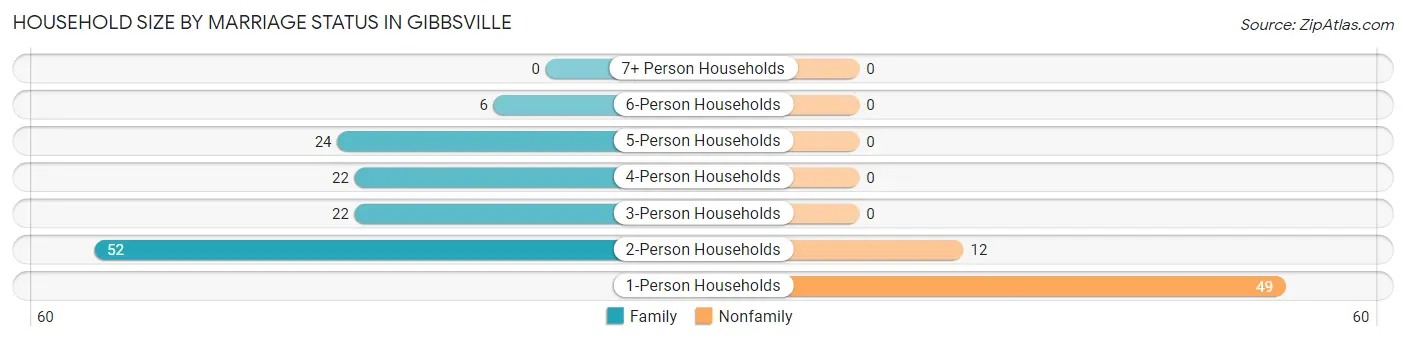
Household Size by Marriage Status in Gibbsville
Out of a total of 187 households in Gibbsville, 126 (67.4%) are family households, while 61 (32.6%) are nonfamily households. The most numerous type of family households are 2-person households, comprising 52, and the most common type of nonfamily households are 1-person households, comprising 49.
| Household Size | Family Households | Nonfamily Households |
| 1-Person Households | - | 49 (26.2%) |
| 2-Person Households | 52 (27.8%) | 12 (6.4%) |
| 3-Person Households | 22 (11.8%) | 0 (0.0%) |
| 4-Person Households | 22 (11.8%) | 0 (0.0%) |
| 5-Person Households | 24 (12.8%) | 0 (0.0%) |
| 6-Person Households | 6 (3.2%) | 0 (0.0%) |
| 7+ Person Households | 0 (0.0%) | 0 (0.0%) |
| Total | 126 (67.4%) | 61 (32.6%) |
Female Fertility in Gibbsville
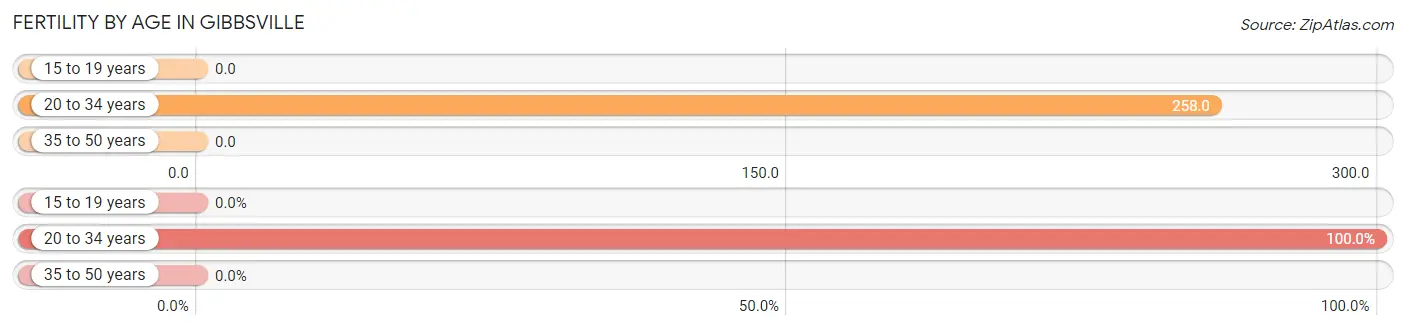
Fertility by Age in Gibbsville
Average fertility rate in Gibbsville is 82.0 births per 1,000 women. Women in the age bracket of 20 to 34 years have the highest fertility rate with 258.0 births per 1,000 women. Women in the age bracket of 20 to 34 years acount for 100.0% of all women with births.
| Age Bracket | Women with Births | Births / 1,000 Women |
| 15 to 19 years | 0 (0.0%) | 0.0 |
| 20 to 34 years | 8 (100.0%) | 258.0 |
| 35 to 50 years | 0 (0.0%) | 0.0 |
| Total | 8 (100.0%) | 82.0 |
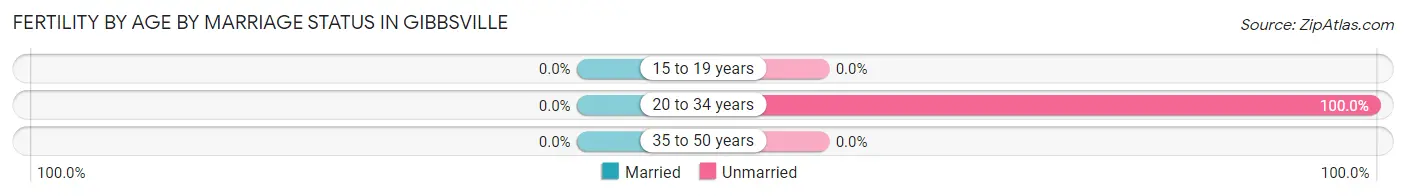
Fertility by Age by Marriage Status in Gibbsville
| Age Bracket | Married | Unmarried |
| 15 to 19 years | 0 (0.0%) | 0 (0.0%) |
| 20 to 34 years | 0 (0.0%) | 8 (100.0%) |
| 35 to 50 years | 0 (0.0%) | 0 (0.0%) |
| Total | 0 (0.0%) | 8 (100.0%) |
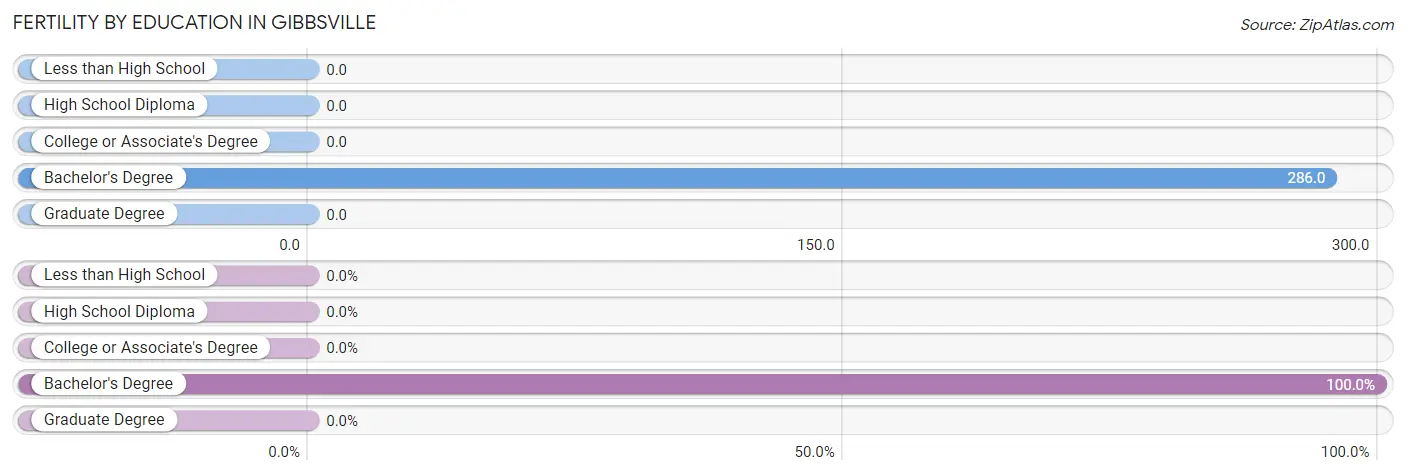
Fertility by Education in Gibbsville
| Educational Attainment | Women with Births | Births / 1,000 Women |
| Less than High School | 0 (0.0%) | 0.0 |
| High School Diploma | 0 (0.0%) | 0.0 |
| College or Associate's Degree | 0 (0.0%) | 0.0 |
| Bachelor's Degree | 8 (100.0%) | 286.0 |
| Graduate Degree | 0 (0.0%) | 0.0 |
| Total | 8 (100.0%) | 82.0 |
Fertility by Education by Marriage Status in Gibbsville
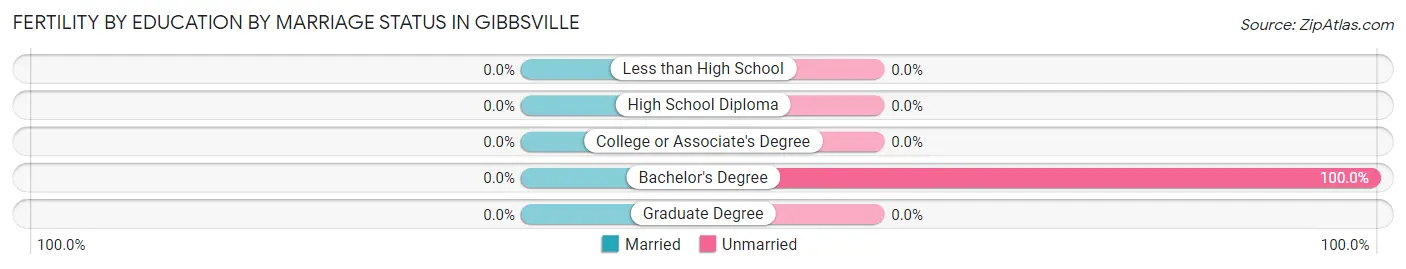
| Educational Attainment | Married | Unmarried |
| Less than High School | 0 (0.0%) | 0 (0.0%) |
| High School Diploma | 0 (0.0%) | 0 (0.0%) |
| College or Associate's Degree | 0 (0.0%) | 0 (0.0%) |
| Bachelor's Degree | 0 (0.0%) | 8 (100.0%) |
| Graduate Degree | 0 (0.0%) | 0 (0.0%) |
| Total | 0 (0.0%) | 8 (100.0%) |
Employment Characteristics in Gibbsville
Employment by Class of Employer in Gibbsville
Among the 327 employed individuals in Gibbsville, private company employees (256 | 78.3%), local government employees (30 | 9.2%), and not-for-profit organizations (22 | 6.7%) make up the most common classes of employment.
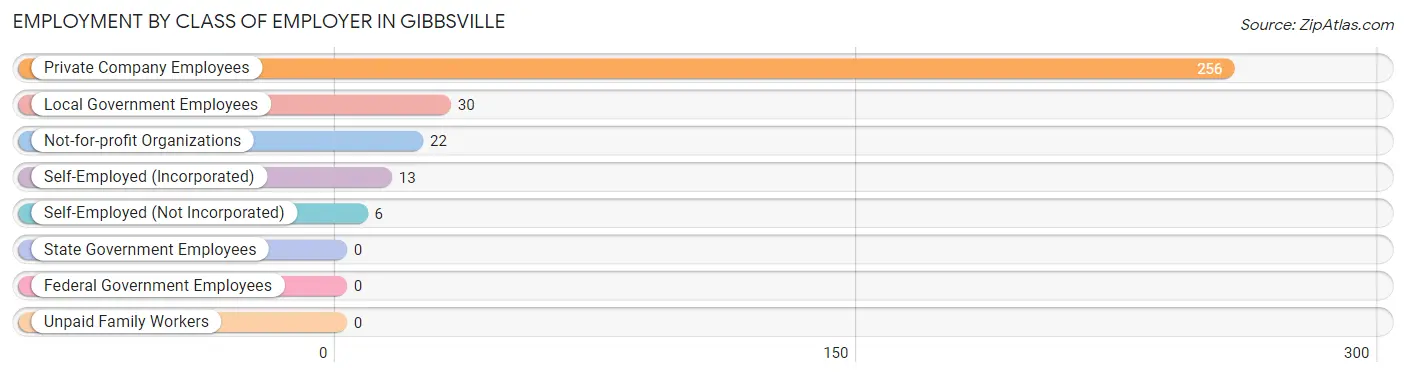
| Employer Class | # Employees | % Employees |
| Private Company Employees | 256 | 78.3% |
| Self-Employed (Incorporated) | 13 | 4.0% |
| Self-Employed (Not Incorporated) | 6 | 1.8% |
| Not-for-profit Organizations | 22 | 6.7% |
| Local Government Employees | 30 | 9.2% |
| State Government Employees | 0 | 0.0% |
| Federal Government Employees | 0 | 0.0% |
| Unpaid Family Workers | 0 | 0.0% |
| Total | 327 | 100.0% |
Employment Status by Age in Gibbsville
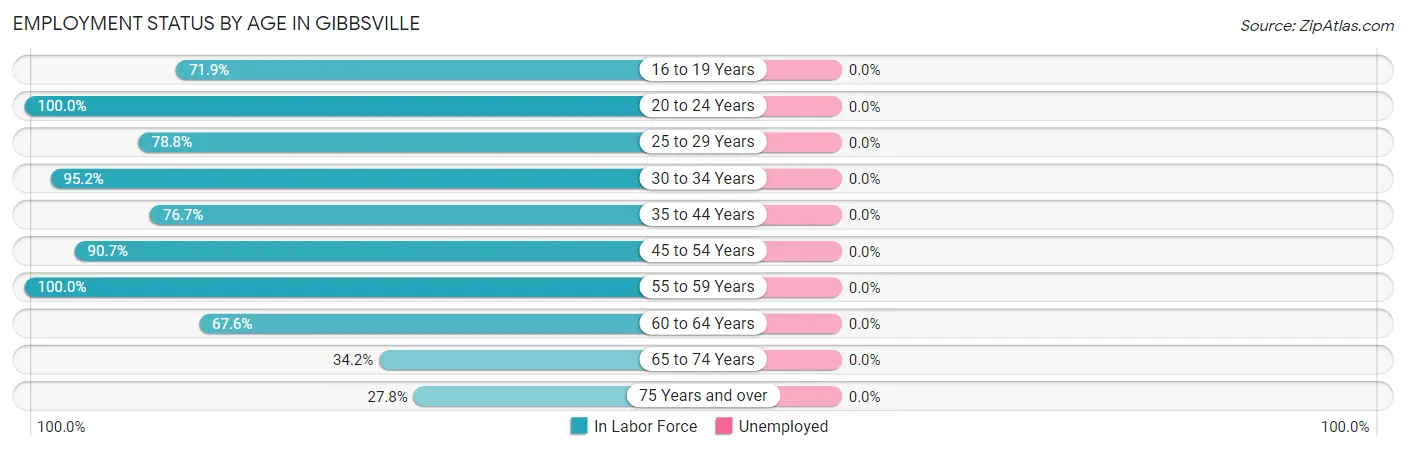
| Age Bracket | In Labor Force | Unemployed |
| 16 to 19 Years | 41 (71.9%) | 0 (0.0%) |
| 20 to 24 Years | 35 (100.0%) | 0 (0.0%) |
| 25 to 29 Years | 26 (78.8%) | 0 (0.0%) |
| 30 to 34 Years | 20 (95.2%) | 0 (0.0%) |
| 35 to 44 Years | 23 (76.7%) | 0 (0.0%) |
| 45 to 54 Years | 107 (90.7%) | 0 (0.0%) |
| 55 to 59 Years | 34 (100.0%) | 0 (0.0%) |
| 60 to 64 Years | 23 (67.6%) | 0 (0.0%) |
| 65 to 74 Years | 13 (34.2%) | 0 (0.0%) |
| 75 Years and over | 5 (27.8%) | 0 (0.0%) |
| Total | 327 (78.2%) | 0 (0.0%) |
Employment Status by Educational Attainment in Gibbsville
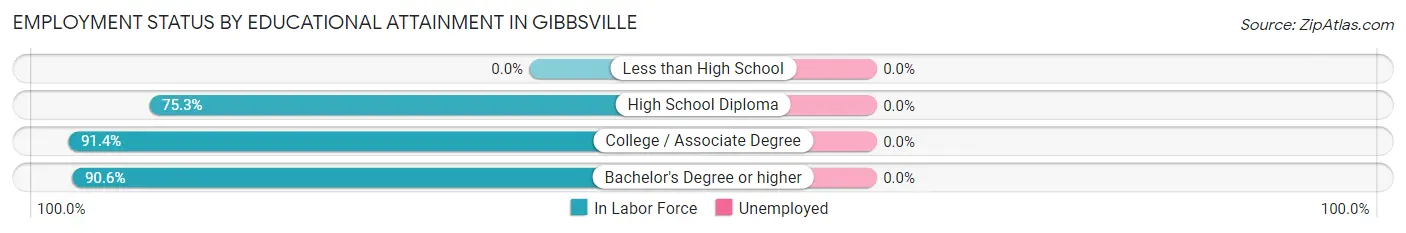
| Educational Attainment | In Labor Force | Unemployed |
| Less than High School | 0 (0.0%) | 0 (0.0%) |
| High School Diploma | 61 (75.3%) | 0 (0.0%) |
| College / Associate Degree | 85 (91.4%) | 0 (0.0%) |
| Bachelor's Degree or higher | 87 (90.6%) | 0 (0.0%) |
| Total | 233 (86.3%) | 0 (0.0%) |
Employment Occupations by Sex in Gibbsville
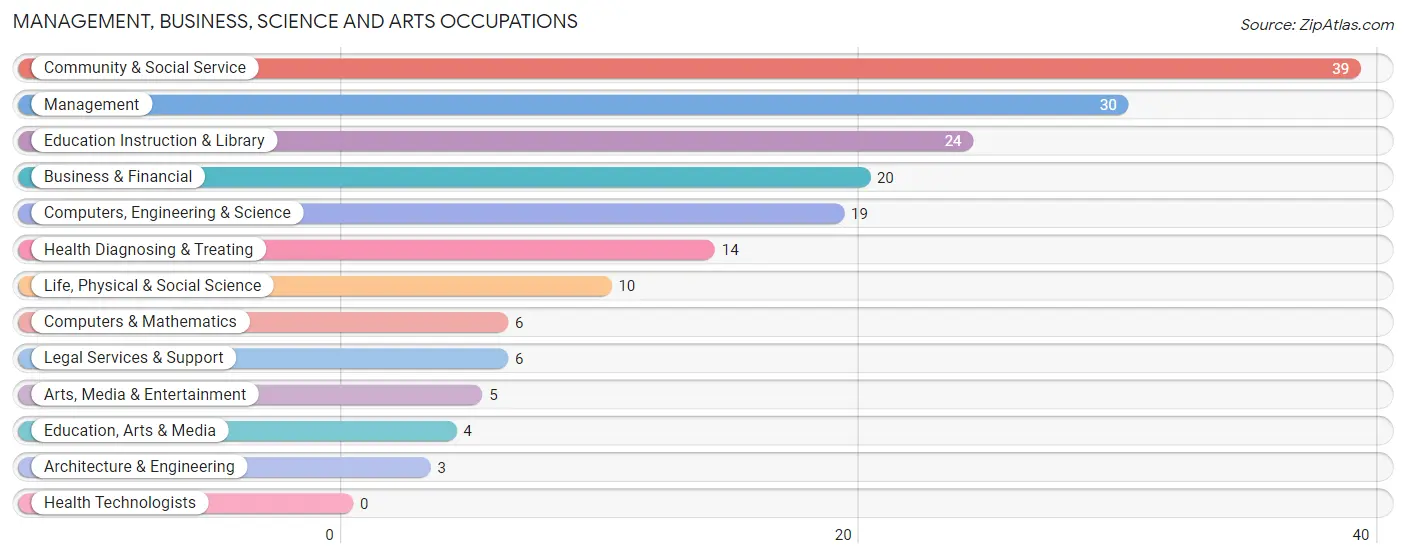
Management, Business, Science and Arts Occupations
The most common Management, Business, Science and Arts occupations in Gibbsville are Community & Social Service (39 | 11.9%), Management (30 | 9.2%), Education Instruction & Library (24 | 7.3%), Business & Financial (20 | 6.1%), and Computers, Engineering & Science (19 | 5.8%).
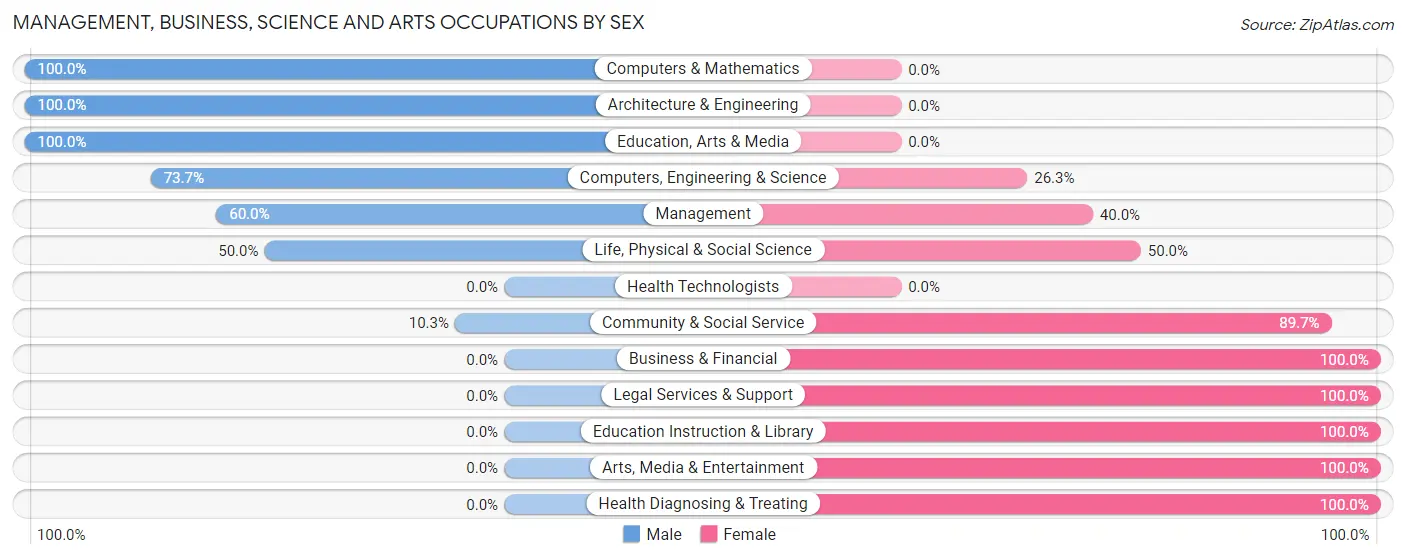
Management, Business, Science and Arts Occupations by Sex
Within the Management, Business, Science and Arts occupations in Gibbsville, the most male-oriented occupations are Computers & Mathematics (100.0%), Architecture & Engineering (100.0%), and Education, Arts & Media (100.0%), while the most female-oriented occupations are Business & Financial (100.0%), Legal Services & Support (100.0%), and Education Instruction & Library (100.0%).
| Occupation | Male | Female |
| Management | 18 (60.0%) | 12 (40.0%) |
| Business & Financial | 0 (0.0%) | 20 (100.0%) |
| Computers, Engineering & Science | 14 (73.7%) | 5 (26.3%) |
| Computers & Mathematics | 6 (100.0%) | 0 (0.0%) |
| Architecture & Engineering | 3 (100.0%) | 0 (0.0%) |
| Life, Physical & Social Science | 5 (50.0%) | 5 (50.0%) |
| Community & Social Service | 4 (10.3%) | 35 (89.7%) |
| Education, Arts & Media | 4 (100.0%) | 0 (0.0%) |
| Legal Services & Support | 0 (0.0%) | 6 (100.0%) |
| Education Instruction & Library | 0 (0.0%) | 24 (100.0%) |
| Arts, Media & Entertainment | 0 (0.0%) | 5 (100.0%) |
| Health Diagnosing & Treating | 0 (0.0%) | 14 (100.0%) |
| Health Technologists | 0 (0.0%) | 0 (0.0%) |
| Total (Category) | 36 (29.5%) | 86 (70.5%) |
| Total (Overall) | 196 (59.9%) | 131 (40.1%) |
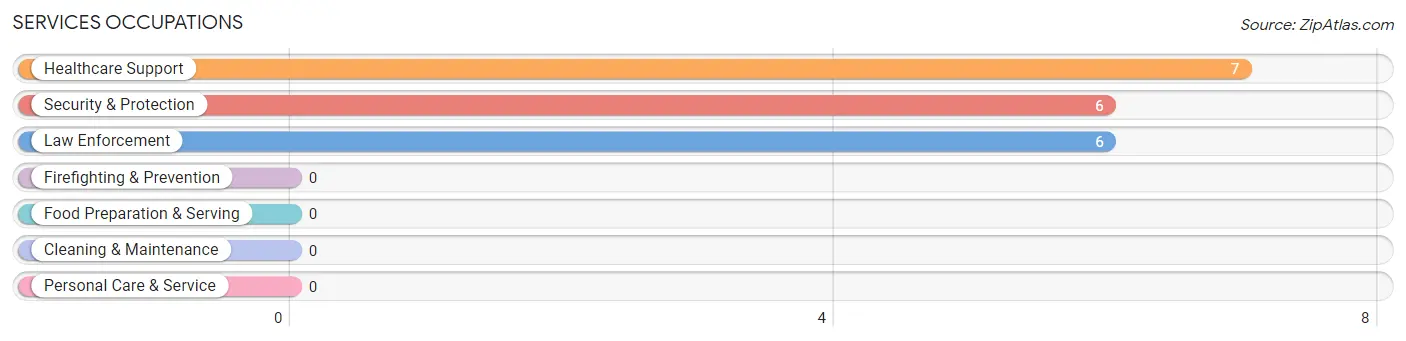
Services Occupations
The most common Services occupations in Gibbsville are Healthcare Support (7 | 2.1%), Security & Protection (6 | 1.8%), and Law Enforcement (6 | 1.8%).
Services Occupations by Sex
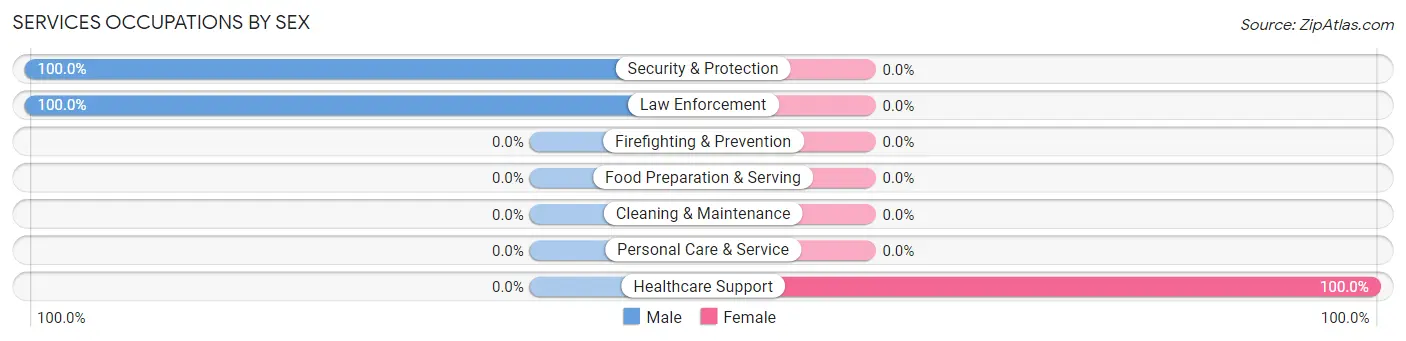
| Occupation | Male | Female |
| Healthcare Support | 0 (0.0%) | 7 (100.0%) |
| Security & Protection | 6 (100.0%) | 0 (0.0%) |
| Firefighting & Prevention | 0 (0.0%) | 0 (0.0%) |
| Law Enforcement | 6 (100.0%) | 0 (0.0%) |
| Food Preparation & Serving | 0 (0.0%) | 0 (0.0%) |
| Cleaning & Maintenance | 0 (0.0%) | 0 (0.0%) |
| Personal Care & Service | 0 (0.0%) | 0 (0.0%) |
| Total (Category) | 6 (46.2%) | 7 (53.8%) |
| Total (Overall) | 196 (59.9%) | 131 (40.1%) |
Sales and Office Occupations
The most common Sales and Office occupations in Gibbsville are , and Office & Administration (39 | 11.9%).
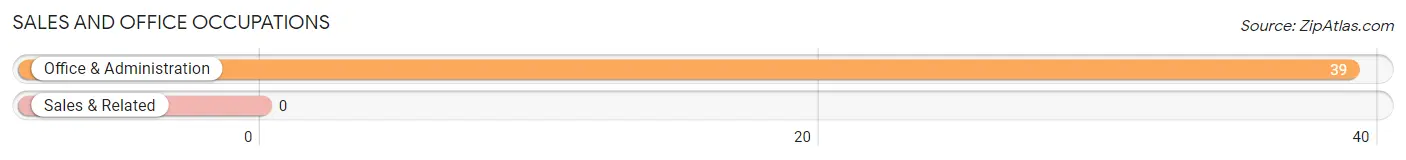
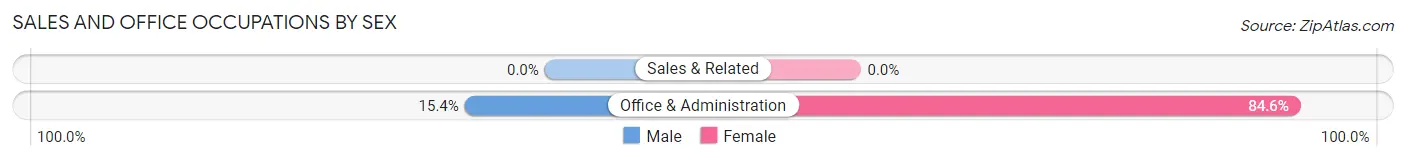
Sales and Office Occupations by Sex
| Occupation | Male | Female |
| Sales & Related | 0 (0.0%) | 0 (0.0%) |
| Office & Administration | 6 (15.4%) | 33 (84.6%) |
| Total (Category) | 6 (15.4%) | 33 (84.6%) |
| Total (Overall) | 196 (59.9%) | 131 (40.1%) |
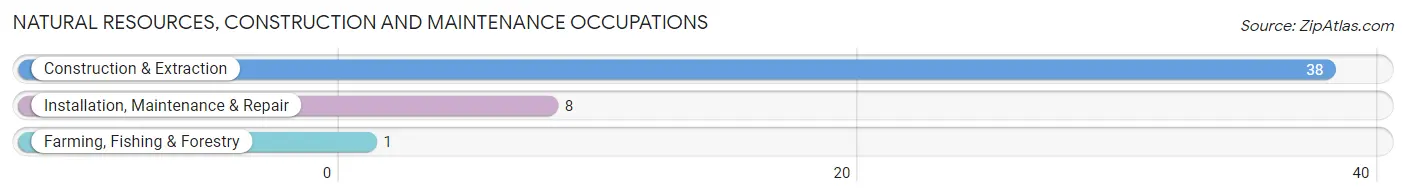
Natural Resources, Construction and Maintenance Occupations
The most common Natural Resources, Construction and Maintenance occupations in Gibbsville are Construction & Extraction (38 | 11.6%), Installation, Maintenance & Repair (8 | 2.5%), and Farming, Fishing & Forestry (1 | 0.3%).
Natural Resources, Construction and Maintenance Occupations by Sex
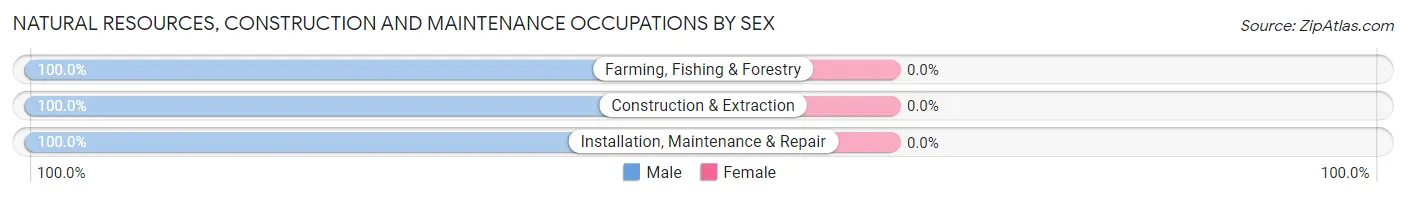
| Occupation | Male | Female |
| Farming, Fishing & Forestry | 1 (100.0%) | 0 (0.0%) |
| Construction & Extraction | 38 (100.0%) | 0 (0.0%) |
| Installation, Maintenance & Repair | 8 (100.0%) | 0 (0.0%) |
| Total (Category) | 47 (100.0%) | 0 (0.0%) |
| Total (Overall) | 196 (59.9%) | 131 (40.1%) |
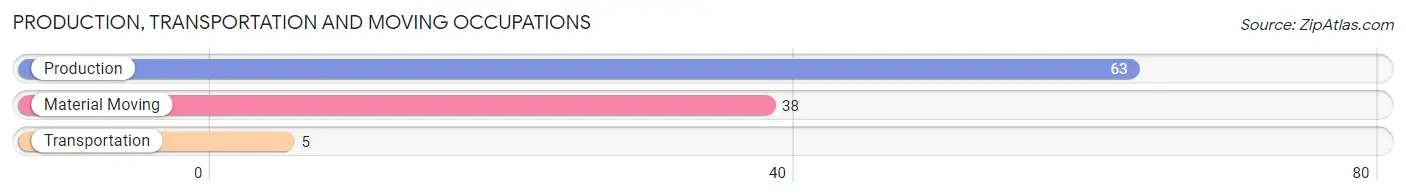
Production, Transportation and Moving Occupations
The most common Production, Transportation and Moving occupations in Gibbsville are Production (63 | 19.3%), Material Moving (38 | 11.6%), and Transportation (5 | 1.5%).
Production, Transportation and Moving Occupations by Sex
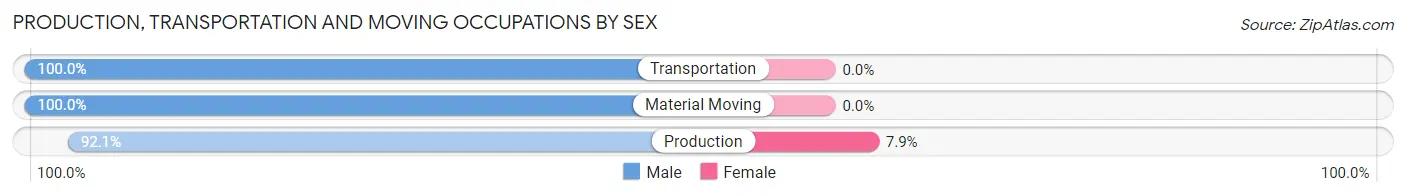
| Occupation | Male | Female |
| Production | 58 (92.1%) | 5 (7.9%) |
| Transportation | 5 (100.0%) | 0 (0.0%) |
| Material Moving | 38 (100.0%) | 0 (0.0%) |
| Total (Category) | 101 (95.3%) | 5 (4.7%) |
| Total (Overall) | 196 (59.9%) | 131 (40.1%) |
Employment Industries by Sex in Gibbsville
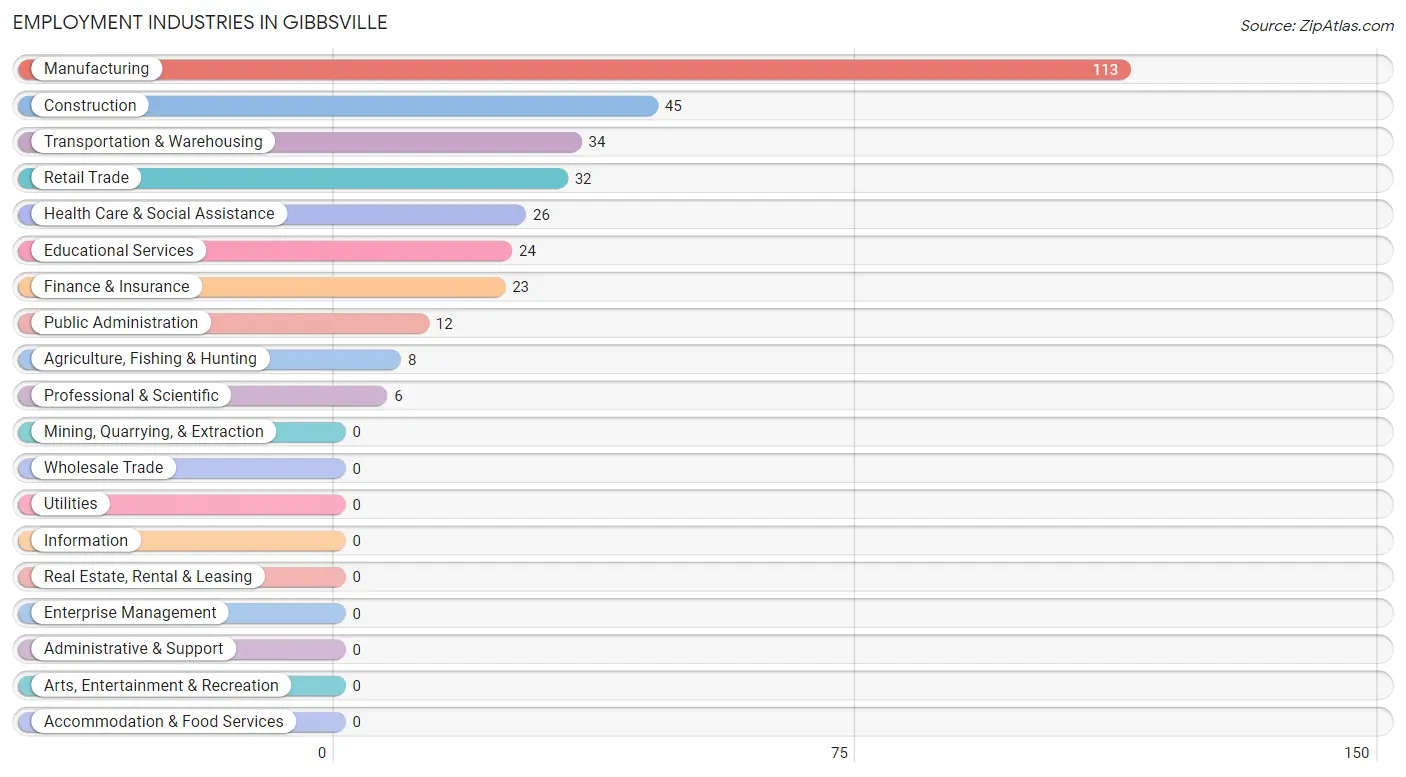
Employment Industries in Gibbsville
The major employment industries in Gibbsville include Manufacturing (113 | 34.6%), Construction (45 | 13.8%), Transportation & Warehousing (34 | 10.4%), Retail Trade (32 | 9.8%), and Health Care & Social Assistance (26 | 8.0%).
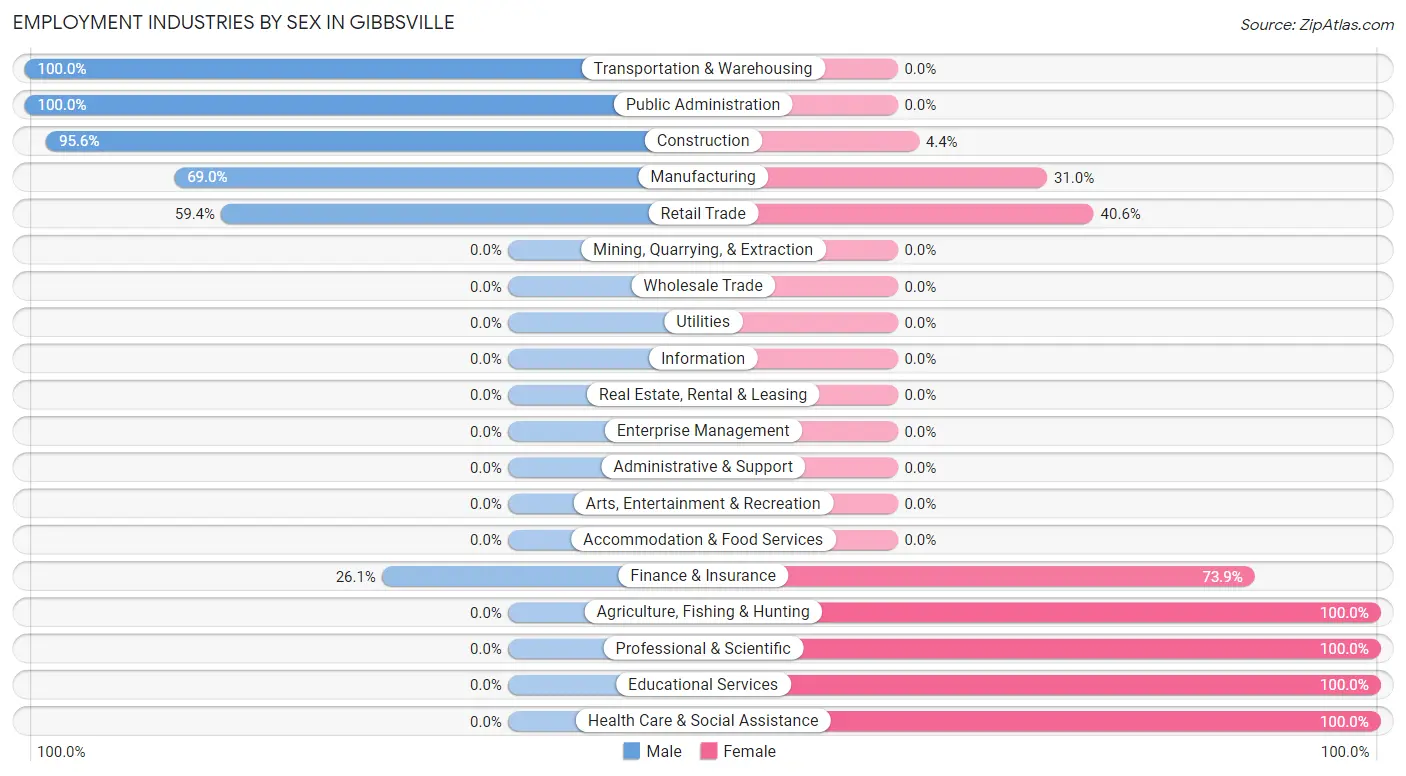
Employment Industries by Sex in Gibbsville
The Gibbsville industries that see more men than women are Transportation & Warehousing (100.0%), Public Administration (100.0%), and Construction (95.6%), whereas the industries that tend to have a higher number of women are Agriculture, Fishing & Hunting (100.0%), Professional & Scientific (100.0%), and Educational Services (100.0%).
| Industry | Male | Female |
| Agriculture, Fishing & Hunting | 0 (0.0%) | 8 (100.0%) |
| Mining, Quarrying, & Extraction | 0 (0.0%) | 0 (0.0%) |
| Construction | 43 (95.6%) | 2 (4.4%) |
| Manufacturing | 78 (69.0%) | 35 (31.0%) |
| Wholesale Trade | 0 (0.0%) | 0 (0.0%) |
| Retail Trade | 19 (59.4%) | 13 (40.6%) |
| Transportation & Warehousing | 34 (100.0%) | 0 (0.0%) |
| Utilities | 0 (0.0%) | 0 (0.0%) |
| Information | 0 (0.0%) | 0 (0.0%) |
| Finance & Insurance | 6 (26.1%) | 17 (73.9%) |
| Real Estate, Rental & Leasing | 0 (0.0%) | 0 (0.0%) |
| Professional & Scientific | 0 (0.0%) | 6 (100.0%) |
| Enterprise Management | 0 (0.0%) | 0 (0.0%) |
| Administrative & Support | 0 (0.0%) | 0 (0.0%) |
| Educational Services | 0 (0.0%) | 24 (100.0%) |
| Health Care & Social Assistance | 0 (0.0%) | 26 (100.0%) |
| Arts, Entertainment & Recreation | 0 (0.0%) | 0 (0.0%) |
| Accommodation & Food Services | 0 (0.0%) | 0 (0.0%) |
| Public Administration | 12 (100.0%) | 0 (0.0%) |
| Total | 196 (59.9%) | 131 (40.1%) |
Education in Gibbsville
School Enrollment in Gibbsville
The most common levels of schooling among the 140 students in Gibbsville are high school (49 | 35.0%), college / undergraduate (34 | 24.3%), and elementary school (21 | 15.0%).
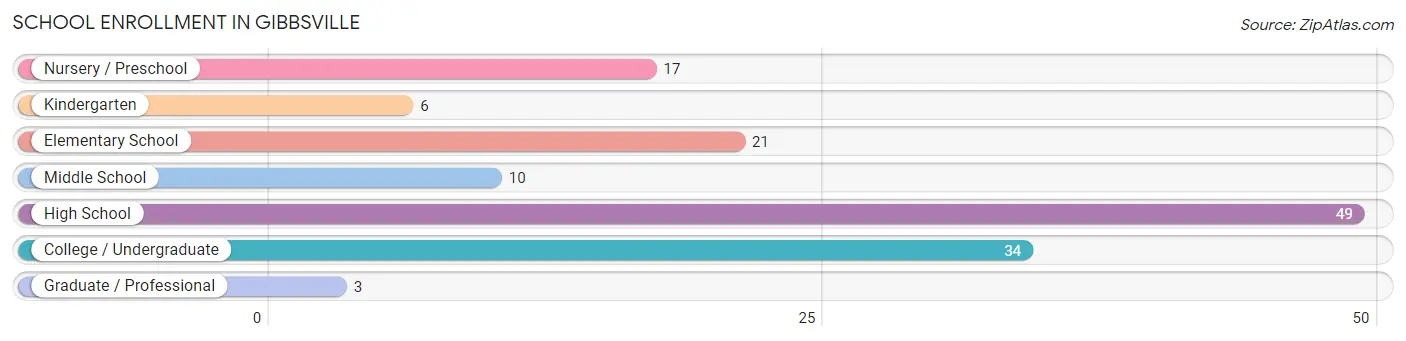
| School Level | # Students | % Students |
| Nursery / Preschool | 17 | 12.1% |
| Kindergarten | 6 | 4.3% |
| Elementary School | 21 | 15.0% |
| Middle School | 10 | 7.1% |
| High School | 49 | 35.0% |
| College / Undergraduate | 34 | 24.3% |
| Graduate / Professional | 3 | 2.1% |
| Total | 140 | 100.0% |
School Enrollment by Age by Funding Source in Gibbsville
Out of a total of 140 students who are enrolled in schools in Gibbsville, 10 (7.1%) attend a private institution, while the remaining 130 (92.9%) are enrolled in public schools. The age group of 35 years and over has the highest likelihood of being enrolled in private schools, with 6 (50.0% in the age bracket) enrolled. Conversely, the age group of 3 to 4 year olds has the lowest likelihood of being enrolled in a private school, with 3 (100.0% in the age bracket) attending a public institution.
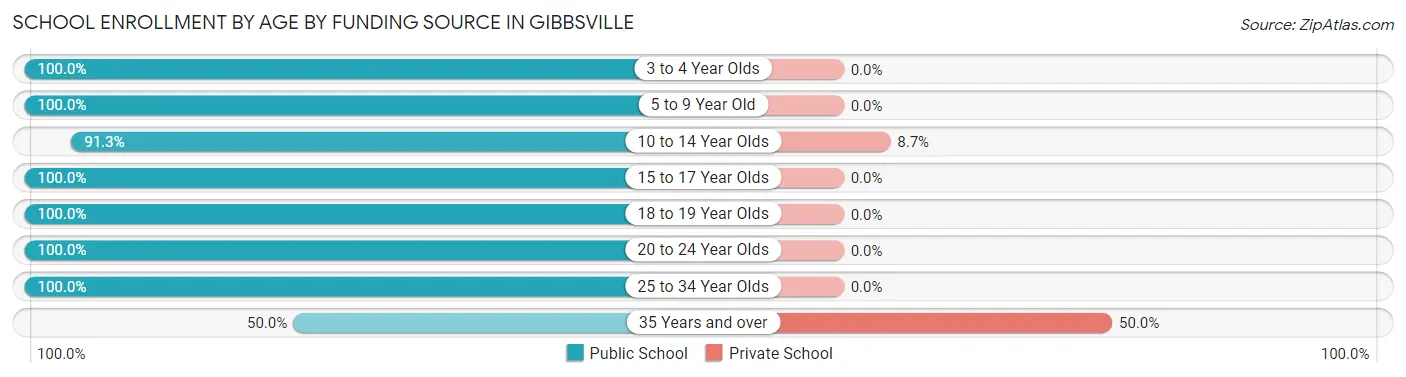
| Age Bracket | Public School | Private School |
| 3 to 4 Year Olds | 3 (100.0%) | 0 (0.0%) |
| 5 to 9 Year Old | 29 (100.0%) | 0 (0.0%) |
| 10 to 14 Year Olds | 42 (91.3%) | 4 (8.7%) |
| 15 to 17 Year Olds | 12 (100.0%) | 0 (0.0%) |
| 18 to 19 Year Olds | 13 (100.0%) | 0 (0.0%) |
| 20 to 24 Year Olds | 20 (100.0%) | 0 (0.0%) |
| 25 to 34 Year Olds | 5 (100.0%) | 0 (0.0%) |
| 35 Years and over | 6 (50.0%) | 6 (50.0%) |
| Total | 130 (92.9%) | 10 (7.1%) |
Educational Attainment by Field of Study in Gibbsville
Business (28 | 24.1%), science & technology (24 | 20.7%), education (24 | 20.7%), physical & health sciences (14 | 12.1%), and multidisciplinary studies (14 | 12.1%) are the most common fields of study among 116 individuals in Gibbsville who have obtained a bachelor's degree or higher.
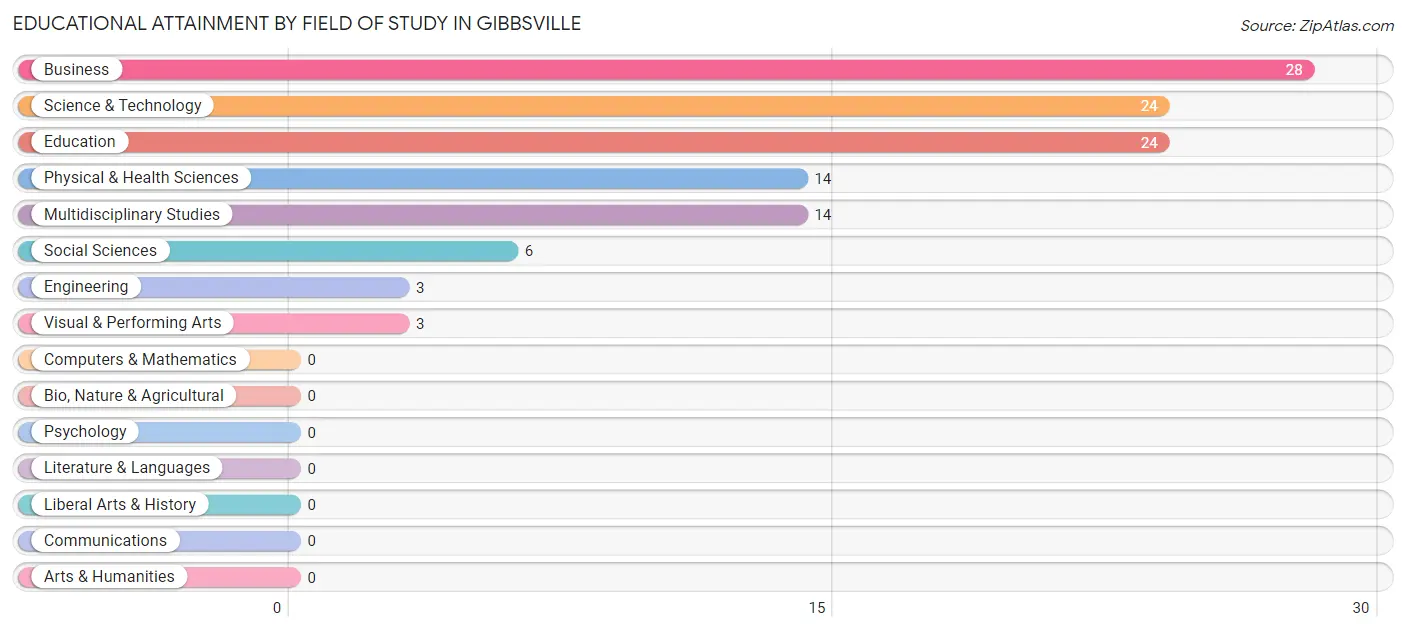
| Field of Study | # Graduates | % Graduates |
| Computers & Mathematics | 0 | 0.0% |
| Bio, Nature & Agricultural | 0 | 0.0% |
| Physical & Health Sciences | 14 | 12.1% |
| Psychology | 0 | 0.0% |
| Social Sciences | 6 | 5.2% |
| Engineering | 3 | 2.6% |
| Multidisciplinary Studies | 14 | 12.1% |
| Science & Technology | 24 | 20.7% |
| Business | 28 | 24.1% |
| Education | 24 | 20.7% |
| Literature & Languages | 0 | 0.0% |
| Liberal Arts & History | 0 | 0.0% |
| Visual & Performing Arts | 3 | 2.6% |
| Communications | 0 | 0.0% |
| Arts & Humanities | 0 | 0.0% |
| Total | 116 | 100.0% |
Transportation & Commute in Gibbsville
Vehicle Availability by Sex in Gibbsville
The most prevalent vehicle ownership categories in Gibbsville are males with 2 vehicles (95, accounting for 48.5%) and females with 2 vehicles (73, making up 72.5%).
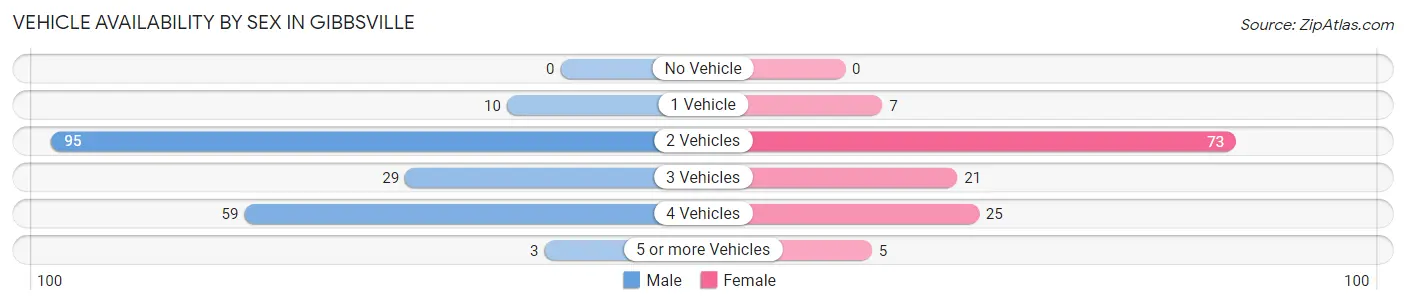
| Vehicles Available | Male | Female |
| No Vehicle | 0 (0.0%) | 0 (0.0%) |
| 1 Vehicle | 10 (5.1%) | 7 (5.3%) |
| 2 Vehicles | 95 (48.5%) | 73 (55.7%) |
| 3 Vehicles | 29 (14.8%) | 21 (16.0%) |
| 4 Vehicles | 59 (30.1%) | 25 (19.1%) |
| 5 or more Vehicles | 3 (1.5%) | 5 (3.8%) |
| Total | 196 (100.0%) | 131 (100.0%) |
Commute Time in Gibbsville
The most frequently occuring commute durations in Gibbsville are 15 to 19 minutes (125 commuters, 41.8%), 10 to 14 minutes (51 commuters, 17.1%), and 5 to 9 minutes (32 commuters, 10.7%).
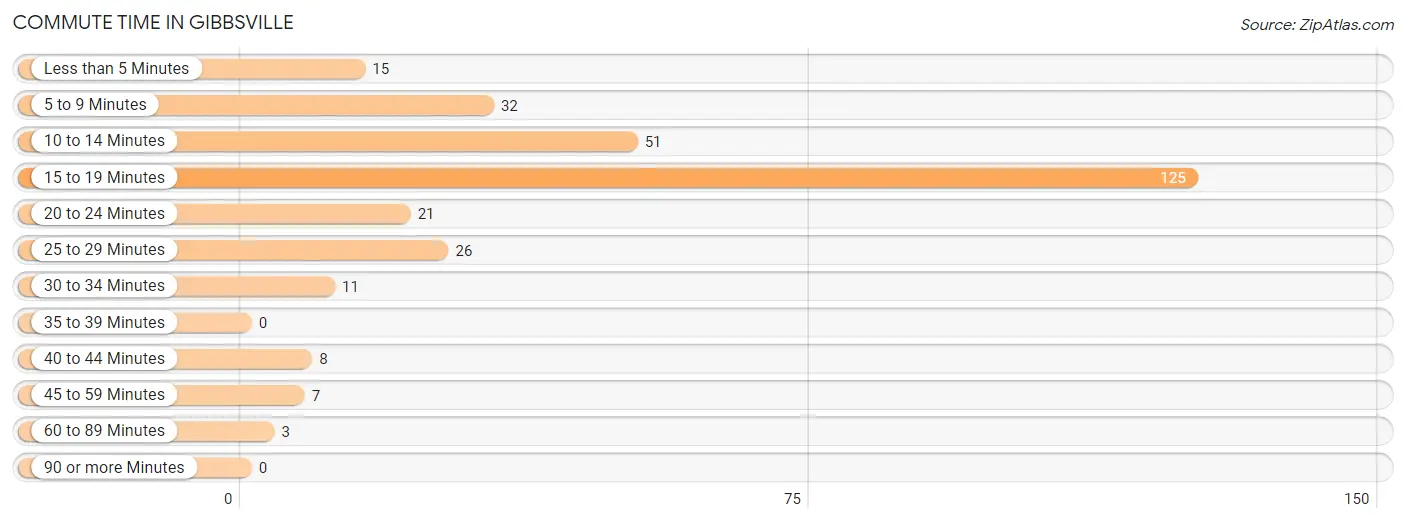
| Commute Time | # Commuters | % Commuters |
| Less than 5 Minutes | 15 | 5.0% |
| 5 to 9 Minutes | 32 | 10.7% |
| 10 to 14 Minutes | 51 | 17.1% |
| 15 to 19 Minutes | 125 | 41.8% |
| 20 to 24 Minutes | 21 | 7.0% |
| 25 to 29 Minutes | 26 | 8.7% |
| 30 to 34 Minutes | 11 | 3.7% |
| 35 to 39 Minutes | 0 | 0.0% |
| 40 to 44 Minutes | 8 | 2.7% |
| 45 to 59 Minutes | 7 | 2.3% |
| 60 to 89 Minutes | 3 | 1.0% |
| 90 or more Minutes | 0 | 0.0% |
Commute Time by Sex in Gibbsville
The most common commute times in Gibbsville are 15 to 19 minutes (96 commuters, 50.8%) for males and 10 to 14 minutes (35 commuters, 31.8%) for females.
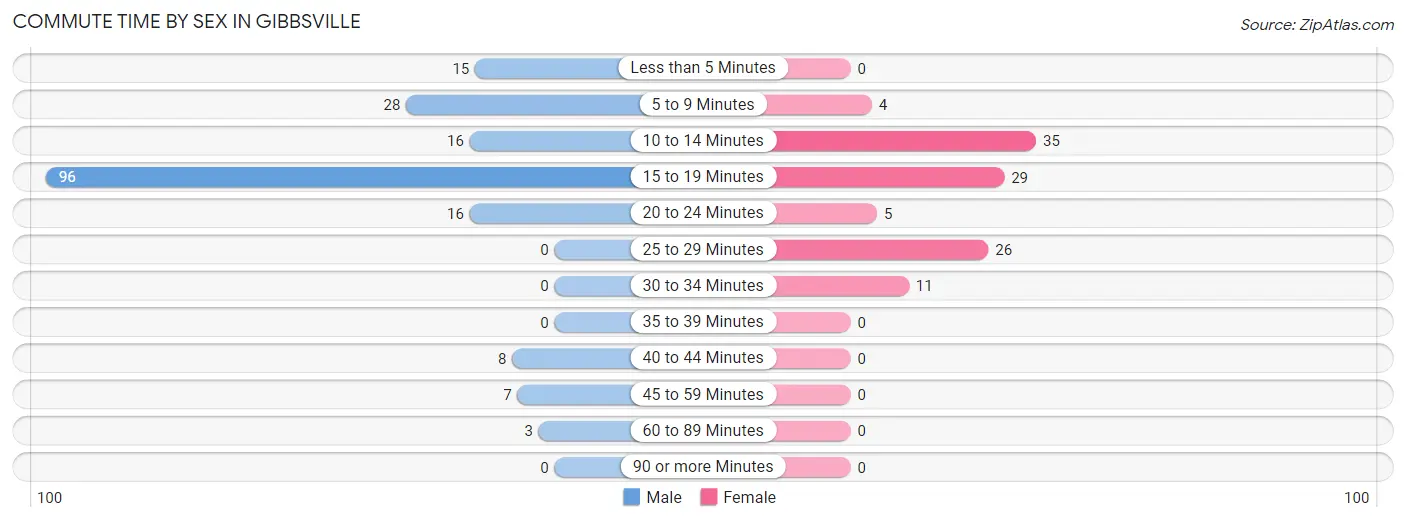
| Commute Time | Male | Female |
| Less than 5 Minutes | 15 (7.9%) | 0 (0.0%) |
| 5 to 9 Minutes | 28 (14.8%) | 4 (3.6%) |
| 10 to 14 Minutes | 16 (8.5%) | 35 (31.8%) |
| 15 to 19 Minutes | 96 (50.8%) | 29 (26.4%) |
| 20 to 24 Minutes | 16 (8.5%) | 5 (4.5%) |
| 25 to 29 Minutes | 0 (0.0%) | 26 (23.6%) |
| 30 to 34 Minutes | 0 (0.0%) | 11 (10.0%) |
| 35 to 39 Minutes | 0 (0.0%) | 0 (0.0%) |
| 40 to 44 Minutes | 8 (4.2%) | 0 (0.0%) |
| 45 to 59 Minutes | 7 (3.7%) | 0 (0.0%) |
| 60 to 89 Minutes | 3 (1.6%) | 0 (0.0%) |
| 90 or more Minutes | 0 (0.0%) | 0 (0.0%) |
Time of Departure to Work by Sex in Gibbsville
The most frequent times of departure to work in Gibbsville are 12:00 AM to 4:59 AM (38, 20.1%) for males and 7:00 AM to 7:29 AM (33, 30.0%) for females.
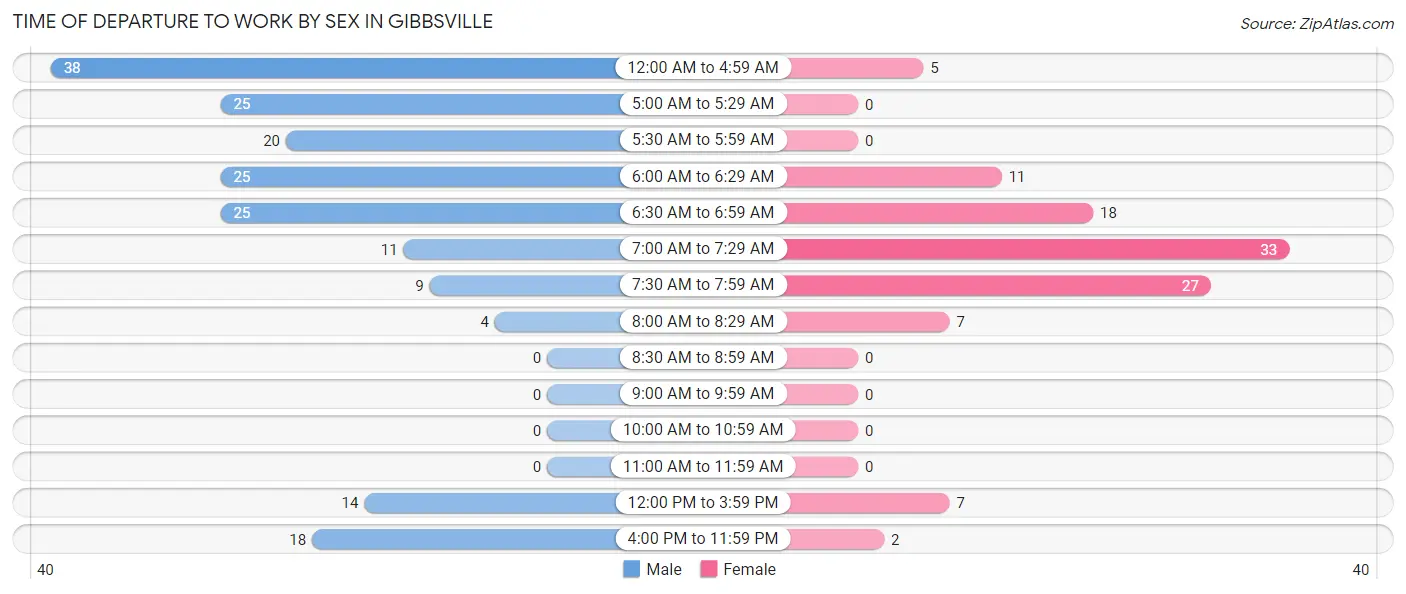
| Time of Departure | Male | Female |
| 12:00 AM to 4:59 AM | 38 (20.1%) | 5 (4.5%) |
| 5:00 AM to 5:29 AM | 25 (13.2%) | 0 (0.0%) |
| 5:30 AM to 5:59 AM | 20 (10.6%) | 0 (0.0%) |
| 6:00 AM to 6:29 AM | 25 (13.2%) | 11 (10.0%) |
| 6:30 AM to 6:59 AM | 25 (13.2%) | 18 (16.4%) |
| 7:00 AM to 7:29 AM | 11 (5.8%) | 33 (30.0%) |
| 7:30 AM to 7:59 AM | 9 (4.8%) | 27 (24.5%) |
| 8:00 AM to 8:29 AM | 4 (2.1%) | 7 (6.4%) |
| 8:30 AM to 8:59 AM | 0 (0.0%) | 0 (0.0%) |
| 9:00 AM to 9:59 AM | 0 (0.0%) | 0 (0.0%) |
| 10:00 AM to 10:59 AM | 0 (0.0%) | 0 (0.0%) |
| 11:00 AM to 11:59 AM | 0 (0.0%) | 0 (0.0%) |
| 12:00 PM to 3:59 PM | 14 (7.4%) | 7 (6.4%) |
| 4:00 PM to 11:59 PM | 18 (9.5%) | 2 (1.8%) |
| Total | 189 (100.0%) | 110 (100.0%) |
Housing Occupancy in Gibbsville
Occupancy by Ownership in Gibbsville
Of the total 187 dwellings in Gibbsville, owner-occupied units account for 152 (81.3%), while renter-occupied units make up 35 (18.7%).
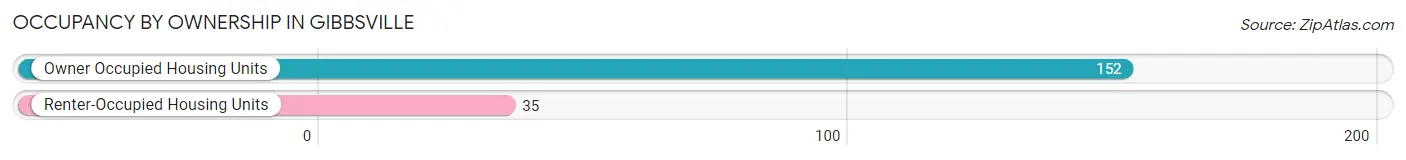
| Occupancy | # Housing Units | % Housing Units |
| Owner Occupied Housing Units | 152 | 81.3% |
| Renter-Occupied Housing Units | 35 | 18.7% |
| Total Occupied Housing Units | 187 | 100.0% |
Occupancy by Household Size in Gibbsville
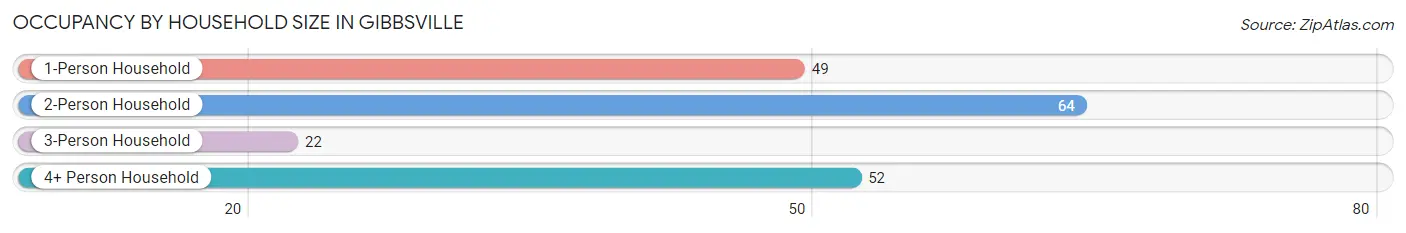
| Household Size | # Housing Units | % Housing Units |
| 1-Person Household | 49 | 26.2% |
| 2-Person Household | 64 | 34.2% |
| 3-Person Household | 22 | 11.8% |
| 4+ Person Household | 52 | 27.8% |
| Total Housing Units | 187 | 100.0% |
Occupancy by Ownership by Household Size in Gibbsville
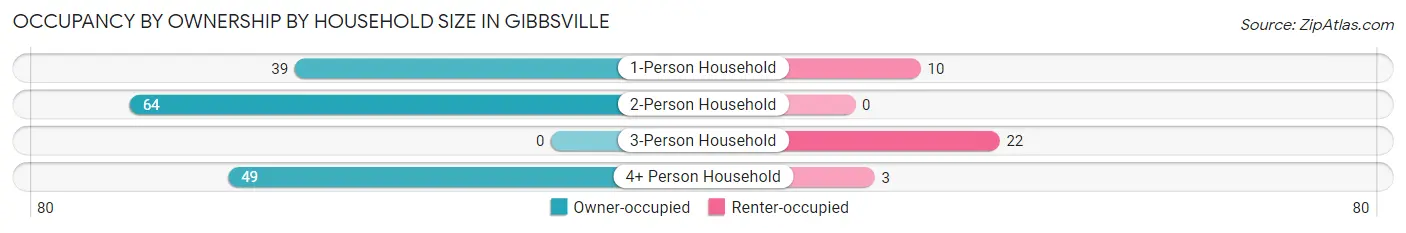
| Household Size | Owner-occupied | Renter-occupied |
| 1-Person Household | 39 (79.6%) | 10 (20.4%) |
| 2-Person Household | 64 (100.0%) | 0 (0.0%) |
| 3-Person Household | 0 (0.0%) | 22 (100.0%) |
| 4+ Person Household | 49 (94.2%) | 3 (5.8%) |
| Total Housing Units | 152 (81.3%) | 35 (18.7%) |
Occupancy by Educational Attainment in Gibbsville
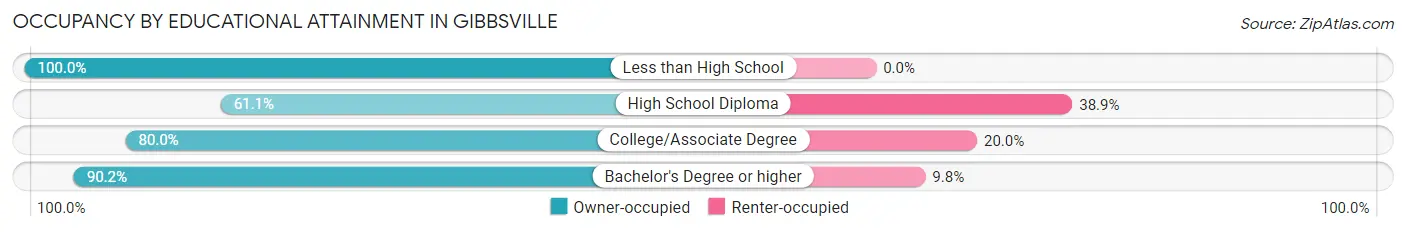
| Household Size | Owner-occupied | Renter-occupied |
| Less than High School | 4 (100.0%) | 0 (0.0%) |
| High School Diploma | 22 (61.1%) | 14 (38.9%) |
| College/Associate Degree | 52 (80.0%) | 13 (20.0%) |
| Bachelor's Degree or higher | 74 (90.2%) | 8 (9.8%) |
Occupancy by Age of Householder in Gibbsville
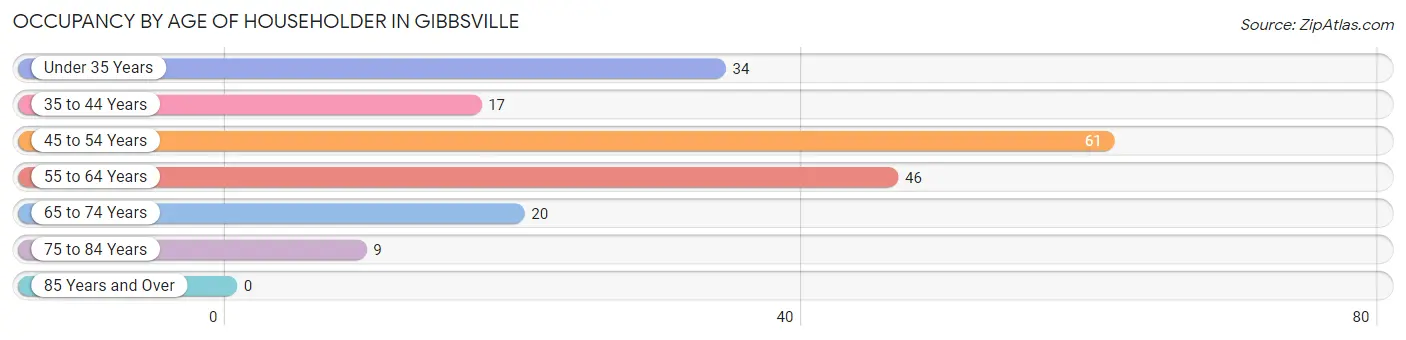
| Age Bracket | # Households | % Households |
| Under 35 Years | 34 | 18.2% |
| 35 to 44 Years | 17 | 9.1% |
| 45 to 54 Years | 61 | 32.6% |
| 55 to 64 Years | 46 | 24.6% |
| 65 to 74 Years | 20 | 10.7% |
| 75 to 84 Years | 9 | 4.8% |
| 85 Years and Over | 0 | 0.0% |
| Total | 187 | 100.0% |
Housing Finances in Gibbsville
Median Income by Occupancy in Gibbsville
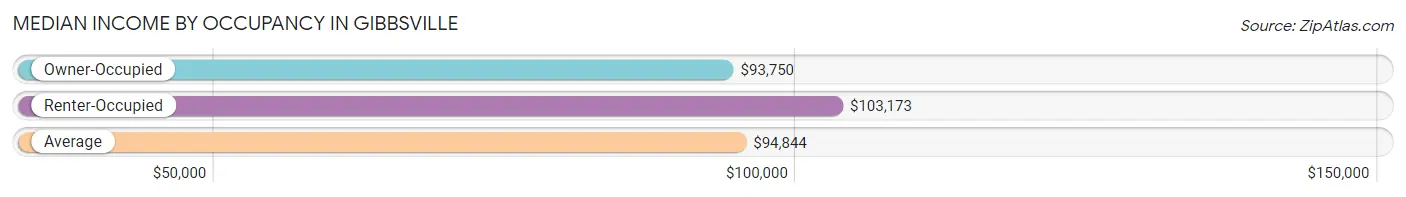
| Occupancy Type | # Households | Median Income |
| Owner-Occupied | 152 (81.3%) | $93,750 |
| Renter-Occupied | 35 (18.7%) | $103,173 |
| Average | 187 (100.0%) | $94,844 |
Occupancy by Householder Income Bracket in Gibbsville
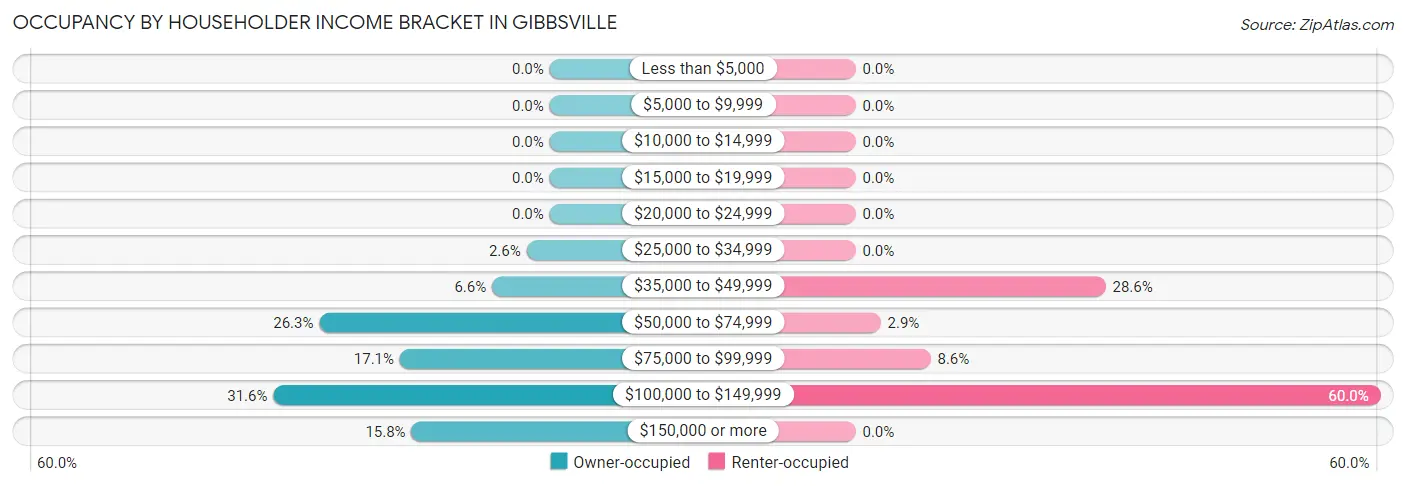
| Income Bracket | Owner-occupied | Renter-occupied |
| Less than $5,000 | 0 (0.0%) | 0 (0.0%) |
| $5,000 to $9,999 | 0 (0.0%) | 0 (0.0%) |
| $10,000 to $14,999 | 0 (0.0%) | 0 (0.0%) |
| $15,000 to $19,999 | 0 (0.0%) | 0 (0.0%) |
| $20,000 to $24,999 | 0 (0.0%) | 0 (0.0%) |
| $25,000 to $34,999 | 4 (2.6%) | 0 (0.0%) |
| $35,000 to $49,999 | 10 (6.6%) | 10 (28.6%) |
| $50,000 to $74,999 | 40 (26.3%) | 1 (2.9%) |
| $75,000 to $99,999 | 26 (17.1%) | 3 (8.6%) |
| $100,000 to $149,999 | 48 (31.6%) | 21 (60.0%) |
| $150,000 or more | 24 (15.8%) | 0 (0.0%) |
| Total | 152 (100.0%) | 35 (100.0%) |
Monthly Housing Cost Tiers in Gibbsville
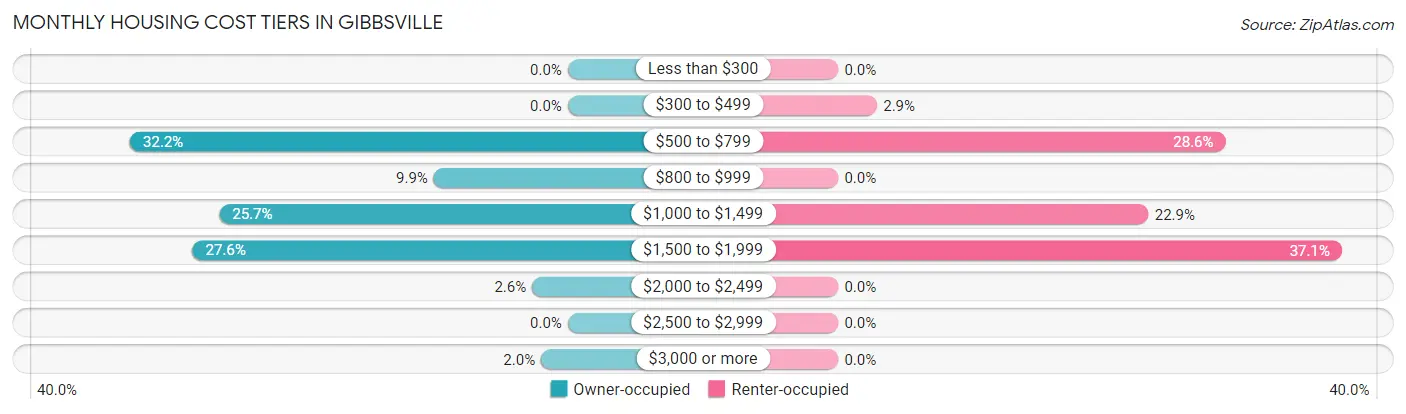
| Monthly Cost | Owner-occupied | Renter-occupied |
| Less than $300 | 0 (0.0%) | 0 (0.0%) |
| $300 to $499 | 0 (0.0%) | 1 (2.9%) |
| $500 to $799 | 49 (32.2%) | 10 (28.6%) |
| $800 to $999 | 15 (9.9%) | 0 (0.0%) |
| $1,000 to $1,499 | 39 (25.7%) | 8 (22.9%) |
| $1,500 to $1,999 | 42 (27.6%) | 13 (37.1%) |
| $2,000 to $2,499 | 4 (2.6%) | 0 (0.0%) |
| $2,500 to $2,999 | 0 (0.0%) | 0 (0.0%) |
| $3,000 or more | 3 (2.0%) | 0 (0.0%) |
| Total | 152 (100.0%) | 35 (100.0%) |
Physical Housing Characteristics in Gibbsville
Housing Structures in Gibbsville
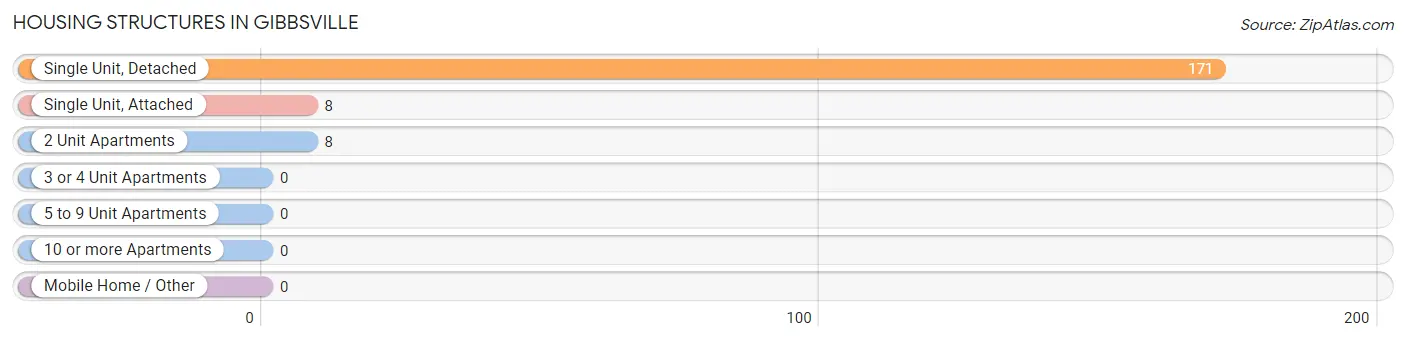
| Structure Type | # Housing Units | % Housing Units |
| Single Unit, Detached | 171 | 91.4% |
| Single Unit, Attached | 8 | 4.3% |
| 2 Unit Apartments | 8 | 4.3% |
| 3 or 4 Unit Apartments | 0 | 0.0% |
| 5 to 9 Unit Apartments | 0 | 0.0% |
| 10 or more Apartments | 0 | 0.0% |
| Mobile Home / Other | 0 | 0.0% |
| Total | 187 | 100.0% |
Housing Structures by Occupancy in Gibbsville
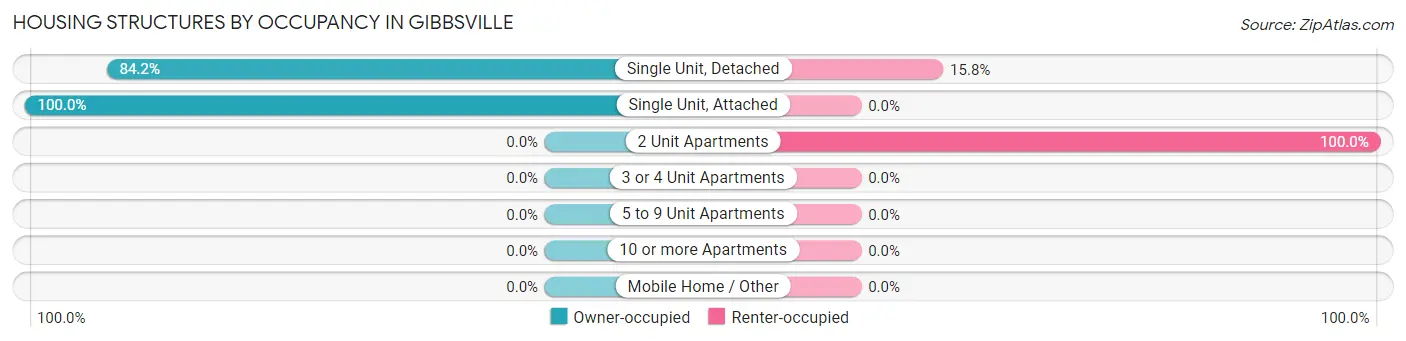
| Structure Type | Owner-occupied | Renter-occupied |
| Single Unit, Detached | 144 (84.2%) | 27 (15.8%) |
| Single Unit, Attached | 8 (100.0%) | 0 (0.0%) |
| 2 Unit Apartments | 0 (0.0%) | 8 (100.0%) |
| 3 or 4 Unit Apartments | 0 (0.0%) | 0 (0.0%) |
| 5 to 9 Unit Apartments | 0 (0.0%) | 0 (0.0%) |
| 10 or more Apartments | 0 (0.0%) | 0 (0.0%) |
| Mobile Home / Other | 0 (0.0%) | 0 (0.0%) |
| Total | 152 (81.3%) | 35 (18.7%) |
Housing Structures by Number of Rooms in Gibbsville
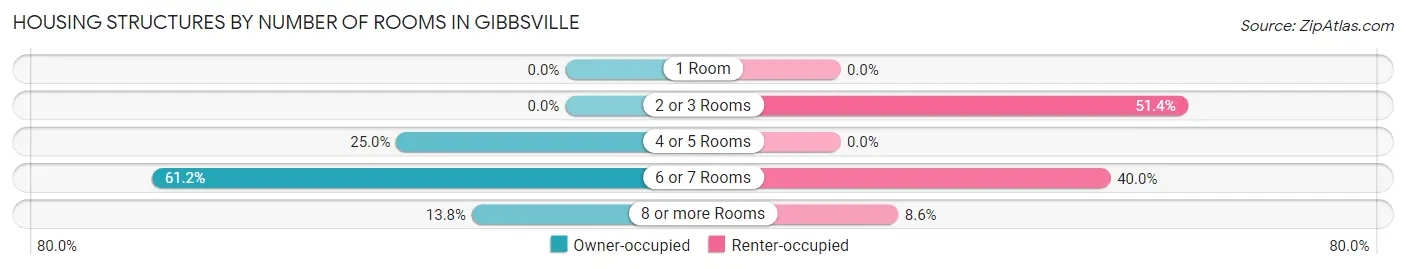
| Number of Rooms | Owner-occupied | Renter-occupied |
| 1 Room | 0 (0.0%) | 0 (0.0%) |
| 2 or 3 Rooms | 0 (0.0%) | 18 (51.4%) |
| 4 or 5 Rooms | 38 (25.0%) | 0 (0.0%) |
| 6 or 7 Rooms | 93 (61.2%) | 14 (40.0%) |
| 8 or more Rooms | 21 (13.8%) | 3 (8.6%) |
| Total | 152 (100.0%) | 35 (100.0%) |
Housing Structure by Heating Type in Gibbsville
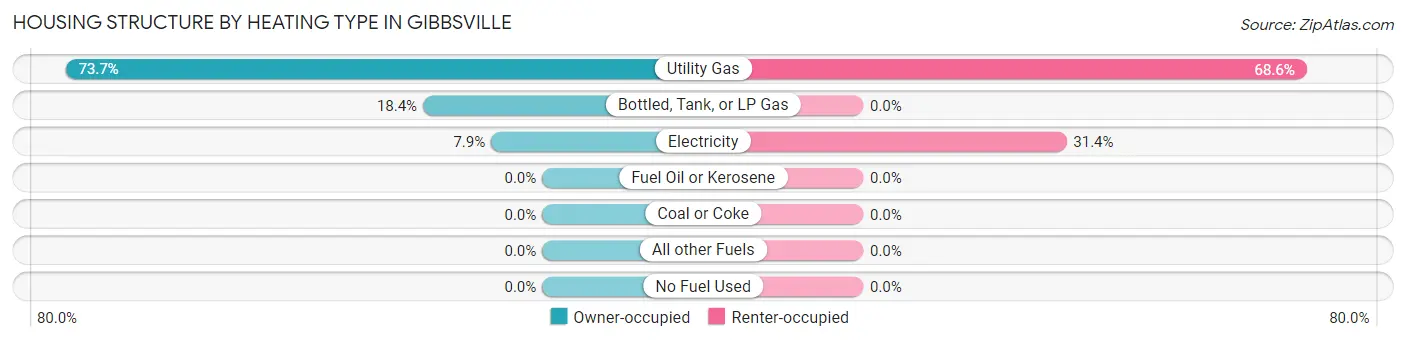
| Heating Type | Owner-occupied | Renter-occupied |
| Utility Gas | 112 (73.7%) | 24 (68.6%) |
| Bottled, Tank, or LP Gas | 28 (18.4%) | 0 (0.0%) |
| Electricity | 12 (7.9%) | 11 (31.4%) |
| Fuel Oil or Kerosene | 0 (0.0%) | 0 (0.0%) |
| Coal or Coke | 0 (0.0%) | 0 (0.0%) |
| All other Fuels | 0 (0.0%) | 0 (0.0%) |
| No Fuel Used | 0 (0.0%) | 0 (0.0%) |
| Total | 152 (100.0%) | 35 (100.0%) |
Household Vehicle Usage in Gibbsville
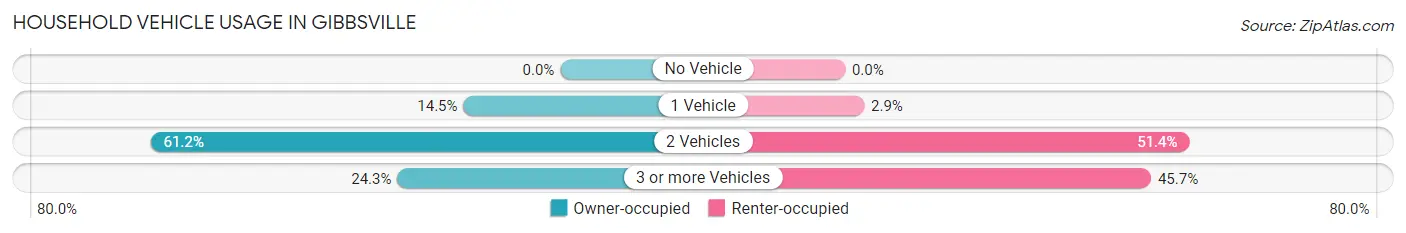
| Vehicles per Household | Owner-occupied | Renter-occupied |
| No Vehicle | 0 (0.0%) | 0 (0.0%) |
| 1 Vehicle | 22 (14.5%) | 1 (2.9%) |
| 2 Vehicles | 93 (61.2%) | 18 (51.4%) |
| 3 or more Vehicles | 37 (24.3%) | 16 (45.7%) |
| Total | 152 (100.0%) | 35 (100.0%) |
Real Estate & Mortgages in Gibbsville
Real Estate and Mortgage Overview in Gibbsville
| Characteristic | Without Mortgage | With Mortgage |
| Housing Units | 41 | 111 |
| Median Property Value | $243,100 | $236,900 |
| Median Household Income | $128,839 | $15 |
| Monthly Housing Costs | $613 | $3 |
| Real Estate Taxes | $3,283 | $0 |
Property Value by Mortgage Status in Gibbsville
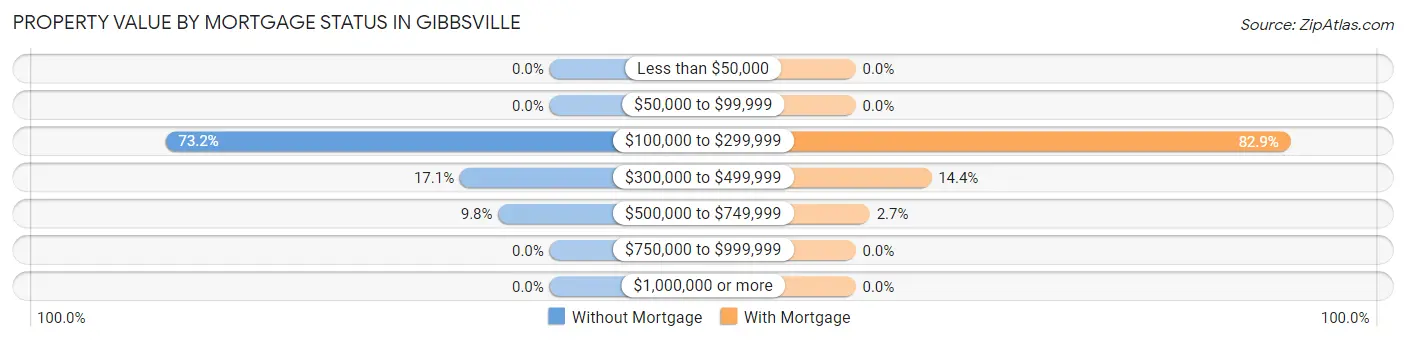
| Property Value | Without Mortgage | With Mortgage |
| Less than $50,000 | 0 (0.0%) | 0 (0.0%) |
| $50,000 to $99,999 | 0 (0.0%) | 0 (0.0%) |
| $100,000 to $299,999 | 30 (73.2%) | 92 (82.9%) |
| $300,000 to $499,999 | 7 (17.1%) | 16 (14.4%) |
| $500,000 to $749,999 | 4 (9.8%) | 3 (2.7%) |
| $750,000 to $999,999 | 0 (0.0%) | 0 (0.0%) |
| $1,000,000 or more | 0 (0.0%) | 0 (0.0%) |
| Total | 41 (100.0%) | 111 (100.0%) |
Household Income by Mortgage Status in Gibbsville
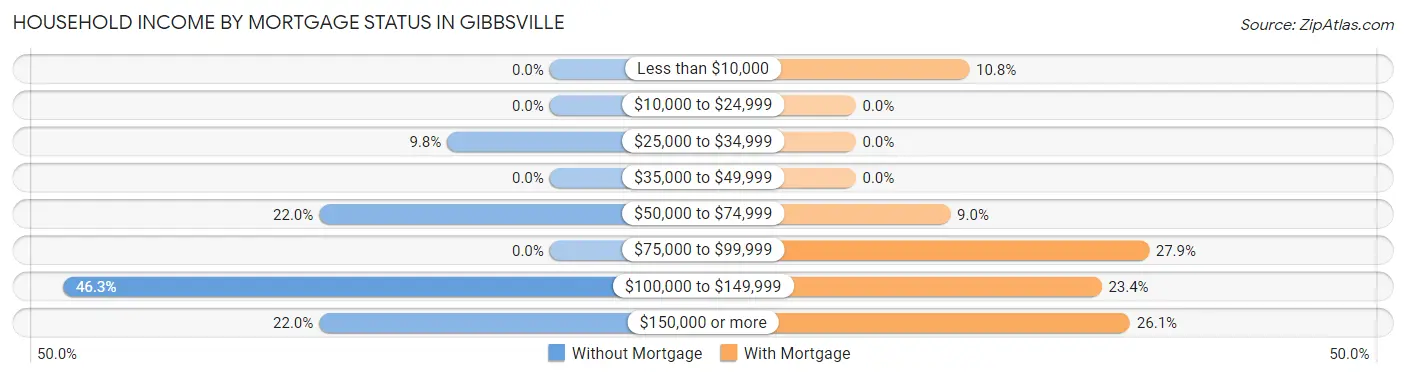
| Household Income | Without Mortgage | With Mortgage |
| Less than $10,000 | 0 (0.0%) | 12 (10.8%) |
| $10,000 to $24,999 | 0 (0.0%) | 0 (0.0%) |
| $25,000 to $34,999 | 4 (9.8%) | 0 (0.0%) |
| $35,000 to $49,999 | 0 (0.0%) | 0 (0.0%) |
| $50,000 to $74,999 | 9 (22.0%) | 10 (9.0%) |
| $75,000 to $99,999 | 0 (0.0%) | 31 (27.9%) |
| $100,000 to $149,999 | 19 (46.3%) | 26 (23.4%) |
| $150,000 or more | 9 (22.0%) | 29 (26.1%) |
| Total | 41 (100.0%) | 111 (100.0%) |
Property Value to Household Income Ratio in Gibbsville
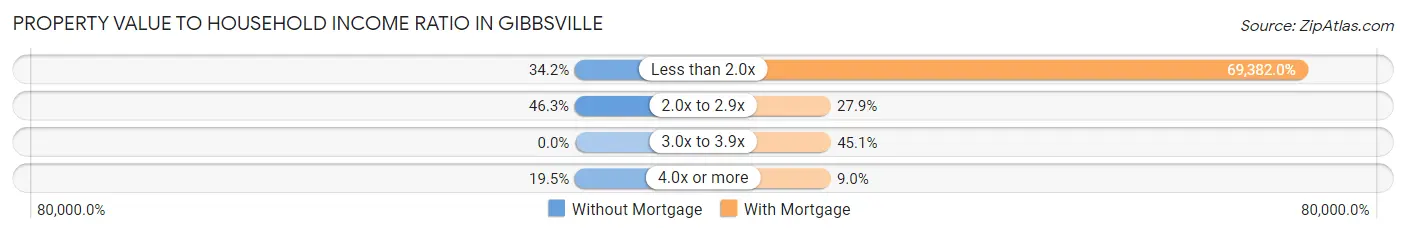
| Value-to-Income Ratio | Without Mortgage | With Mortgage |
| Less than 2.0x | 14 (34.2%) | 77,014 (69,382.0%) |
| 2.0x to 2.9x | 19 (46.3%) | 31 (27.9%) |
| 3.0x to 3.9x | 0 (0.0%) | 50 (45.1%) |
| 4.0x or more | 8 (19.5%) | 10 (9.0%) |
| Total | 41 (100.0%) | 111 (100.0%) |
Real Estate Taxes by Mortgage Status in Gibbsville
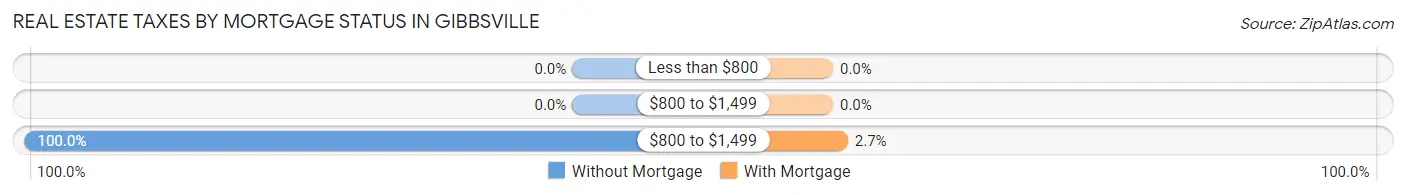
| Property Taxes | Without Mortgage | With Mortgage |
| Less than $800 | 0 (0.0%) | 0 (0.0%) |
| $800 to $1,499 | 0 (0.0%) | 0 (0.0%) |
| $800 to $1,499 | 41 (100.0%) | 3 (2.7%) |
| Total | 41 (100.0%) | 111 (100.0%) |
Health & Disability in Gibbsville
Health Insurance Coverage by Age in Gibbsville
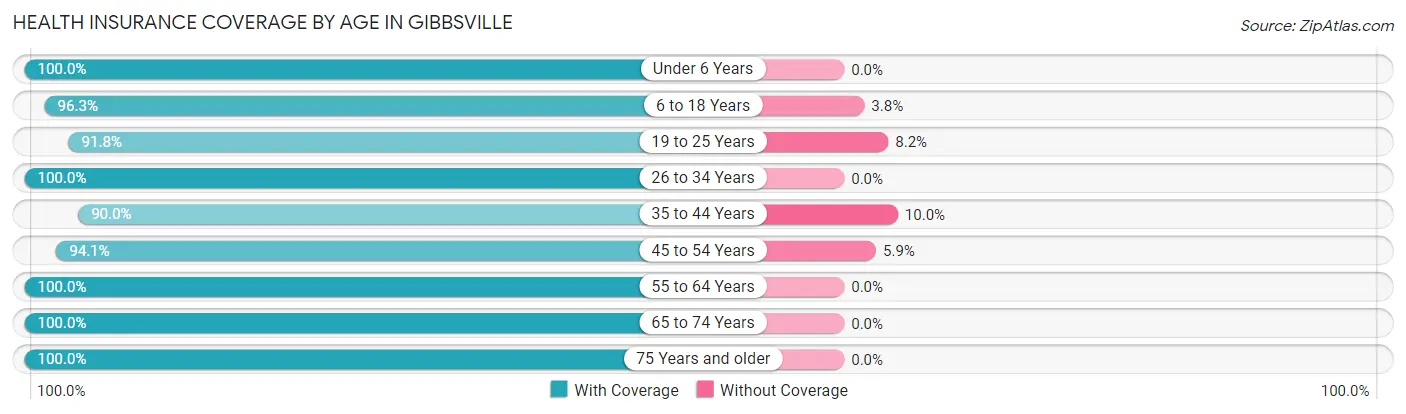
| Age Bracket | With Coverage | Without Coverage |
| Under 6 Years | 49 (100.0%) | 0 (0.0%) |
| 6 to 18 Years | 77 (96.3%) | 3 (3.7%) |
| 19 to 25 Years | 67 (91.8%) | 6 (8.2%) |
| 26 to 34 Years | 52 (100.0%) | 0 (0.0%) |
| 35 to 44 Years | 27 (90.0%) | 3 (10.0%) |
| 45 to 54 Years | 111 (94.1%) | 7 (5.9%) |
| 55 to 64 Years | 68 (100.0%) | 0 (0.0%) |
| 65 to 74 Years | 38 (100.0%) | 0 (0.0%) |
| 75 Years and older | 18 (100.0%) | 0 (0.0%) |
| Total | 507 (96.4%) | 19 (3.6%) |
Health Insurance Coverage by Citizenship Status in Gibbsville
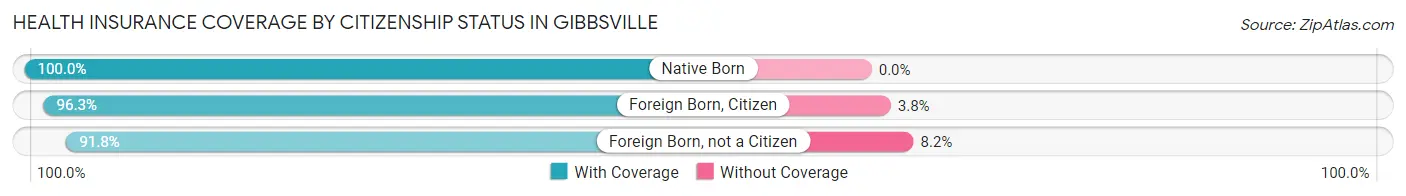
| Citizenship Status | With Coverage | Without Coverage |
| Native Born | 49 (100.0%) | 0 (0.0%) |
| Foreign Born, Citizen | 77 (96.3%) | 3 (3.7%) |
| Foreign Born, not a Citizen | 67 (91.8%) | 6 (8.2%) |
Health Insurance Coverage by Household Income in Gibbsville
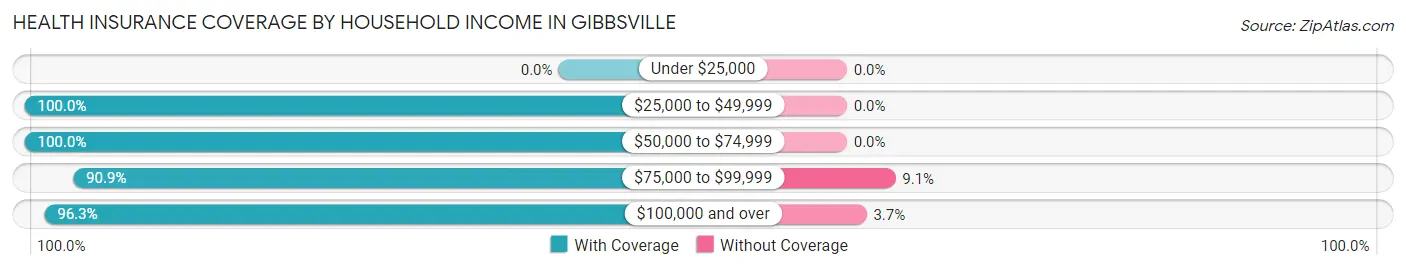
| Household Income | With Coverage | Without Coverage |
| Under $25,000 | 0 (0.0%) | 0 (0.0%) |
| $25,000 to $49,999 | 33 (100.0%) | 0 (0.0%) |
| $50,000 to $74,999 | 74 (100.0%) | 0 (0.0%) |
| $75,000 to $99,999 | 60 (90.9%) | 6 (9.1%) |
| $100,000 and over | 339 (96.3%) | 13 (3.7%) |
Public vs Private Health Insurance Coverage by Age in Gibbsville
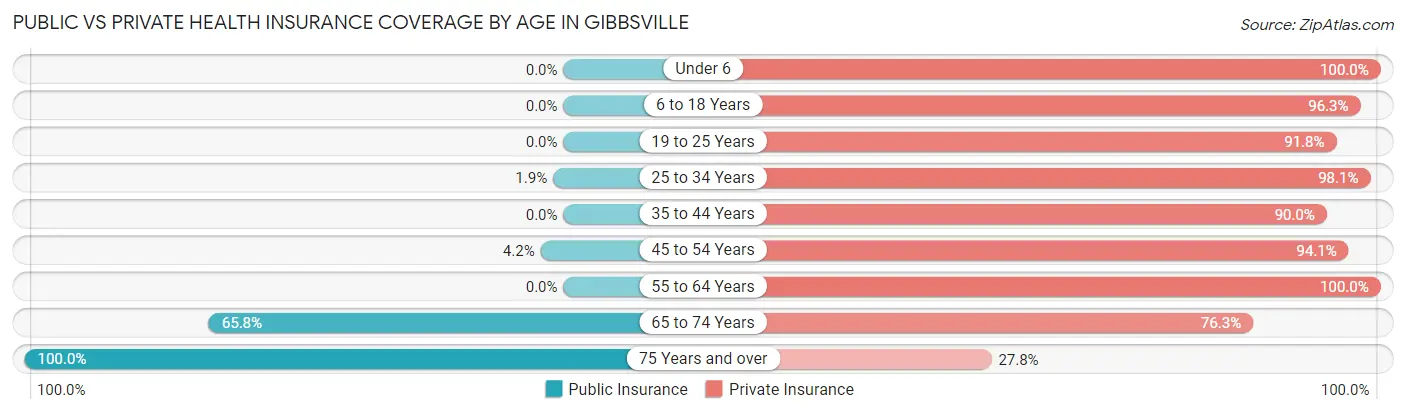
| Age Bracket | Public Insurance | Private Insurance |
| Under 6 | 0 (0.0%) | 49 (100.0%) |
| 6 to 18 Years | 0 (0.0%) | 77 (96.3%) |
| 19 to 25 Years | 0 (0.0%) | 67 (91.8%) |
| 25 to 34 Years | 1 (1.9%) | 51 (98.1%) |
| 35 to 44 Years | 0 (0.0%) | 27 (90.0%) |
| 45 to 54 Years | 5 (4.2%) | 111 (94.1%) |
| 55 to 64 Years | 0 (0.0%) | 68 (100.0%) |
| 65 to 74 Years | 25 (65.8%) | 29 (76.3%) |
| 75 Years and over | 18 (100.0%) | 5 (27.8%) |
| Total | 49 (9.3%) | 484 (92.0%) |
Disability Status by Sex by Age in Gibbsville
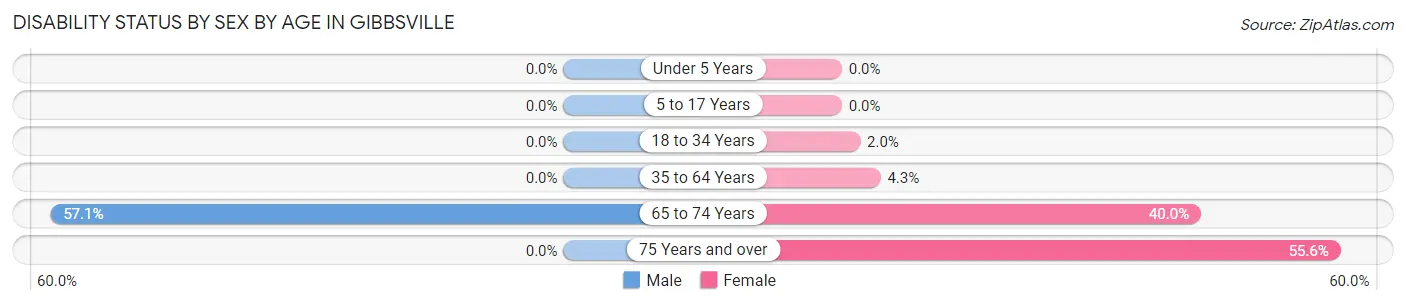
| Age Bracket | Male | Female |
| Under 5 Years | 0 (0.0%) | 0 (0.0%) |
| 5 to 17 Years | 0 (0.0%) | 0 (0.0%) |
| 18 to 34 Years | 0 (0.0%) | 1 (2.0%) |
| 35 to 64 Years | 0 (0.0%) | 5 (4.3%) |
| 65 to 74 Years | 16 (57.1%) | 4 (40.0%) |
| 75 Years and over | 0 (0.0%) | 5 (55.6%) |
Disability Class by Sex by Age in Gibbsville
Disability Class: Hearing Difficulty
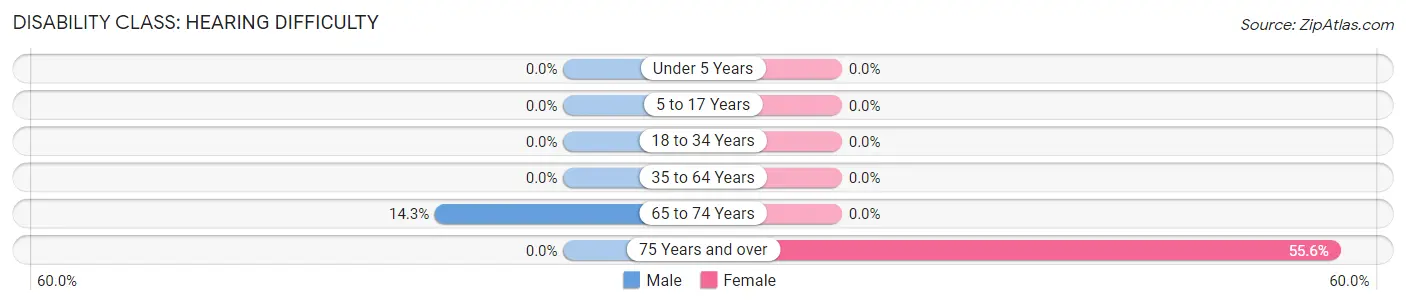
| Age Bracket | Male | Female |
| Under 5 Years | 0 (0.0%) | 0 (0.0%) |
| 5 to 17 Years | 0 (0.0%) | 0 (0.0%) |
| 18 to 34 Years | 0 (0.0%) | 0 (0.0%) |
| 35 to 64 Years | 0 (0.0%) | 0 (0.0%) |
| 65 to 74 Years | 4 (14.3%) | 0 (0.0%) |
| 75 Years and over | 0 (0.0%) | 5 (55.6%) |
Disability Class: Vision Difficulty
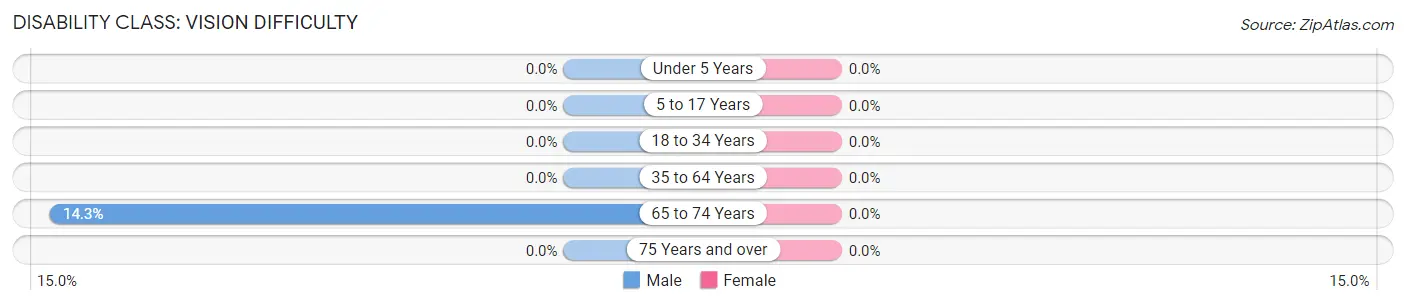
| Age Bracket | Male | Female |
| Under 5 Years | 0 (0.0%) | 0 (0.0%) |
| 5 to 17 Years | 0 (0.0%) | 0 (0.0%) |
| 18 to 34 Years | 0 (0.0%) | 0 (0.0%) |
| 35 to 64 Years | 0 (0.0%) | 0 (0.0%) |
| 65 to 74 Years | 4 (14.3%) | 0 (0.0%) |
| 75 Years and over | 0 (0.0%) | 0 (0.0%) |
Disability Class: Cognitive Difficulty
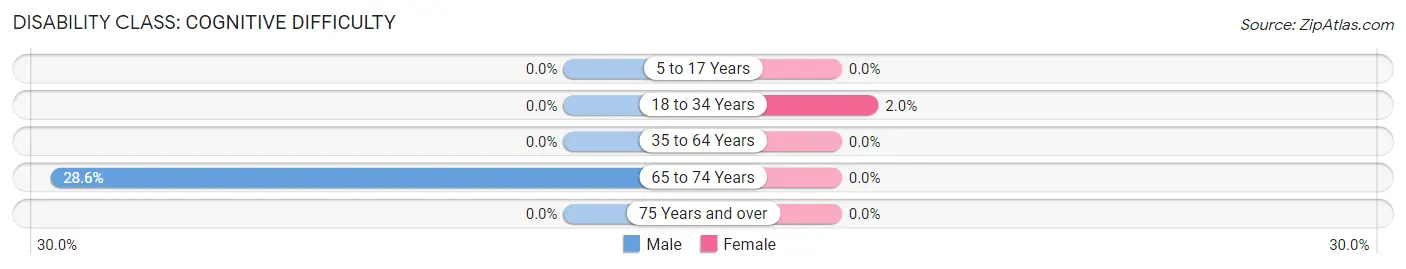
| Age Bracket | Male | Female |
| 5 to 17 Years | 0 (0.0%) | 0 (0.0%) |
| 18 to 34 Years | 0 (0.0%) | 1 (2.0%) |
| 35 to 64 Years | 0 (0.0%) | 0 (0.0%) |
| 65 to 74 Years | 8 (28.6%) | 0 (0.0%) |
| 75 Years and over | 0 (0.0%) | 0 (0.0%) |
Disability Class: Ambulatory Difficulty
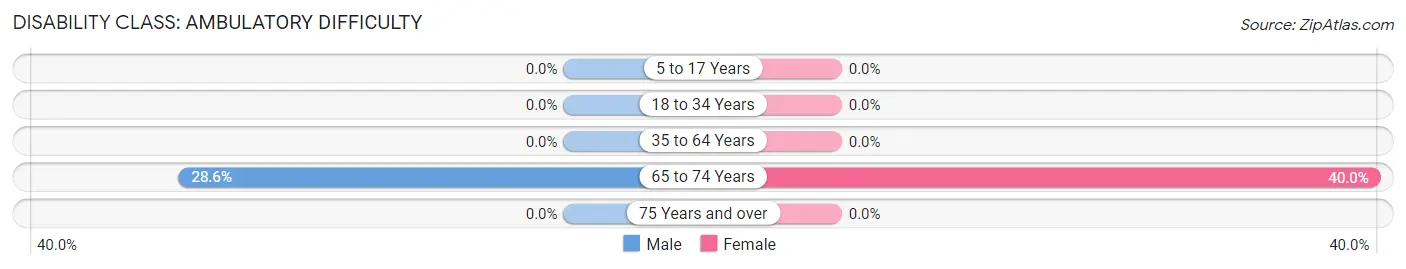
| Age Bracket | Male | Female |
| 5 to 17 Years | 0 (0.0%) | 0 (0.0%) |
| 18 to 34 Years | 0 (0.0%) | 0 (0.0%) |
| 35 to 64 Years | 0 (0.0%) | 0 (0.0%) |
| 65 to 74 Years | 8 (28.6%) | 4 (40.0%) |
| 75 Years and over | 0 (0.0%) | 0 (0.0%) |
Disability Class: Self-Care Difficulty
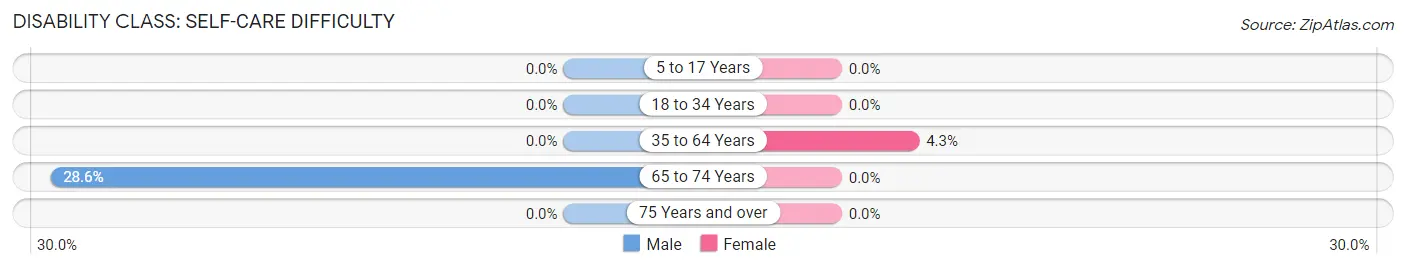
| Age Bracket | Male | Female |
| 5 to 17 Years | 0 (0.0%) | 0 (0.0%) |
| 18 to 34 Years | 0 (0.0%) | 0 (0.0%) |
| 35 to 64 Years | 0 (0.0%) | 5 (4.3%) |
| 65 to 74 Years | 8 (28.6%) | 0 (0.0%) |
| 75 Years and over | 0 (0.0%) | 0 (0.0%) |
Technology Access in Gibbsville
Computing Device Access in Gibbsville
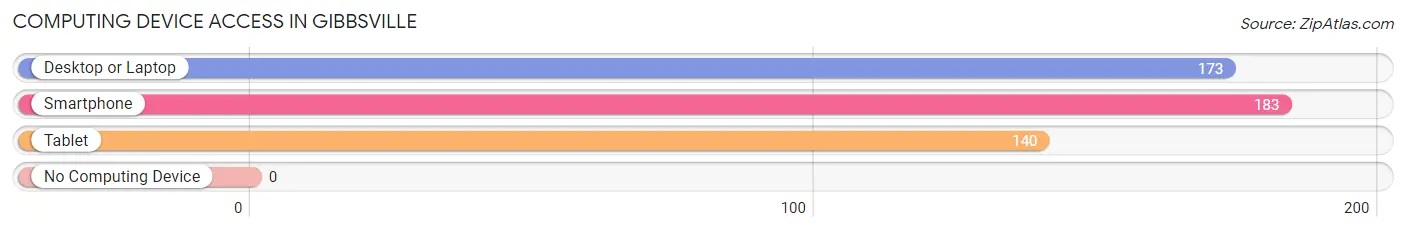
| Device Type | # Households | % Households |
| Desktop or Laptop | 173 | 92.5% |
| Smartphone | 183 | 97.9% |
| Tablet | 140 | 74.9% |
| No Computing Device | 0 | 0.0% |
| Total | 187 | 100.0% |
Internet Access in Gibbsville
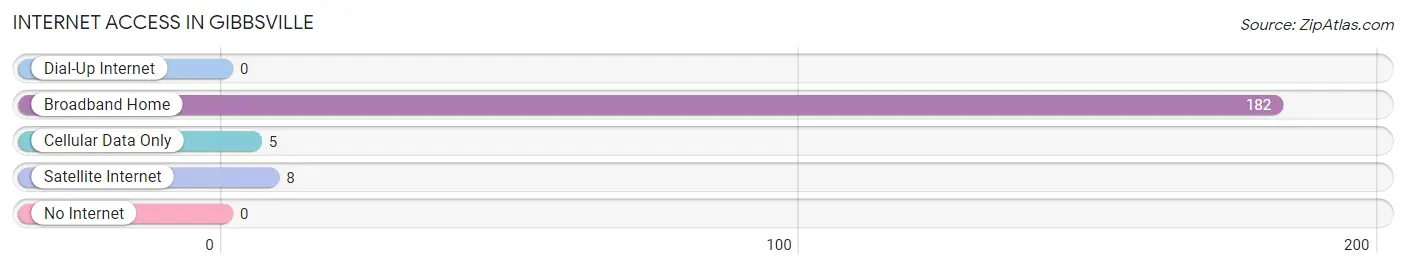
| Internet Type | # Households | % Households |
| Dial-Up Internet | 0 | 0.0% |
| Broadband Home | 182 | 97.3% |
| Cellular Data Only | 5 | 2.7% |
| Satellite Internet | 8 | 4.3% |
| No Internet | 0 | 0.0% |
| Total | 187 | 100.0% |
Gibbsville Summary
Gibbsville, Wisconsin is a small village located in Sheboygan County, Wisconsin. It is situated on the Sheboygan River, approximately 25 miles north of Milwaukee. The village has a population of approximately 1,000 people and is part of the Sheboygan Metropolitan Statistical Area.
History
Gibbsville was founded in 1845 by William Gibbs, a settler from New York. He purchased land from the local Native Americans and established a trading post. The village was named after him and was incorporated in 1848.
In the late 19th century, Gibbsville was a thriving community with a variety of businesses, including a sawmill, a grist mill, a blacksmith shop, a general store, and a hotel. The village also had a post office, a school, and a church.
In the early 20th century, Gibbsville experienced a period of growth and prosperity. The village was home to several factories, including a cheese factory, a canning factory, and a brickyard. The village also had a movie theater, a bowling alley, and a variety of other businesses.
Geography
Gibbsville is located in Sheboygan County, Wisconsin. It is situated on the Sheboygan River, approximately 25 miles north of Milwaukee. The village is surrounded by rolling hills and farmland. The climate is generally mild, with cold winters and warm summers.
Economy
Gibbsville’s economy is largely based on agriculture and tourism. The village is home to several farms, which produce a variety of crops, including corn, soybeans, and wheat. The village also has a number of small businesses, including restaurants, shops, and a gas station.
Tourism is an important part of the local economy. The village is home to several attractions, including a historic museum, a golf course, and a nature preserve. The village also hosts a variety of festivals and events throughout the year, including the annual Gibbsville Cheese Festival.
Demographics
As of the 2010 census, Gibbsville had a population of 1,000 people. The racial makeup of the village was 97.2% White, 0.7% African American, 0.3% Native American, 0.2% Asian, and 1.6% from other races. The median household income was $45,000, and the median age was 40.
Gibbsville is a small, rural village with a strong sense of community. The village is home to a variety of businesses and attractions, and it is a popular destination for tourists. The village is also home to a variety of festivals and events throughout the year, making it a great place to live and visit.
Common Questions
What is Per Capita Income in Gibbsville?
Per Capita income in Gibbsville is $39,555.
What is the Median Family Income in Gibbsville?
Median Family Income in Gibbsville is $108,750.
What is the Median Household income in Gibbsville?
Median Household Income in Gibbsville is $94,844.
What is Income or Wage Gap in Gibbsville?
Income or Wage Gap in Gibbsville is 5.5%.
Women in Gibbsville earn 94.5 cents for every dollar earned by a man.
What is Inequality or Gini Index in Gibbsville?
Inequality or Gini Index in Gibbsville is 0.29.
What is the Total Population of Gibbsville?
Total Population of Gibbsville is 526.
What is the Total Male Population of Gibbsville?
Total Male Population of Gibbsville is 263.
What is the Total Female Population of Gibbsville?
Total Female Population of Gibbsville is 263.
What is the Ratio of Males per 100 Females in Gibbsville?
There are 100.00 Males per 100 Females in Gibbsville.
What is the Ratio of Females per 100 Males in Gibbsville?
There are 100.00 Females per 100 Males in Gibbsville.
What is the Median Population Age in Gibbsville?
Median Population Age in Gibbsville is 37.7 Years.
What is the Average Family Size in Gibbsville
Average Family Size in Gibbsville is 3.5 People.
What is the Average Household Size in Gibbsville
Average Household Size in Gibbsville is 2.8 People.
How Large is the Labor Force in Gibbsville?
There are 327 People in the Labor Forcein in Gibbsville.
What is the Percentage of People in the Labor Force in Gibbsville?
78.2% of People are in the Labor Force in Gibbsville.