Buckner, KY Map & Demographics
Buckner Map
Buckner Overview
$49,671
PER CAPITA INCOME
$148,517
AVG FAMILY INCOME
$141,538
AVG HOUSEHOLD INCOME
19.5%
WAGE / INCOME GAP [ % ]
80.5¢/ $1
WAGE / INCOME GAP [ $ ]
0.32
INEQUALITY / GINI INDEX
3,658
TOTAL POPULATION
1,944
MALE POPULATION
1,714
FEMALE POPULATION
113.42
MALES / 100 FEMALES
88.17
FEMALES / 100 MALES
37.6
MEDIAN AGE
3.1
AVG FAMILY SIZE
3.0
AVG HOUSEHOLD SIZE
2,069
LABOR FORCE [ PEOPLE ]
71.5%
PERCENT IN LABOR FORCE
0.9%
UNEMPLOYMENT RATE
Buckner Zip Codes
Buckner Area Codes
Income in Buckner
Income Overview in Buckner
Per Capita Income in Buckner is $49,671, while median incomes of families and households are $148,517 and $141,538 respectively.
| Characteristic | Number | Measure |
| Per Capita Income | 3,658 | $49,671 |
| Median Family Income | 1,021 | $148,517 |
| Mean Family Income | 1,021 | $163,319 |
| Median Household Income | 1,136 | $141,538 |
| Mean Household Income | 1,136 | $152,701 |
| Income Deficit | 1,021 | $0 |
| Wage / Income Gap (%) | 3,658 | 19.50% |
| Wage / Income Gap ($) | 3,658 | 80.50¢ per $1 |
| Gini / Inequality Index | 3,658 | 0.32 |
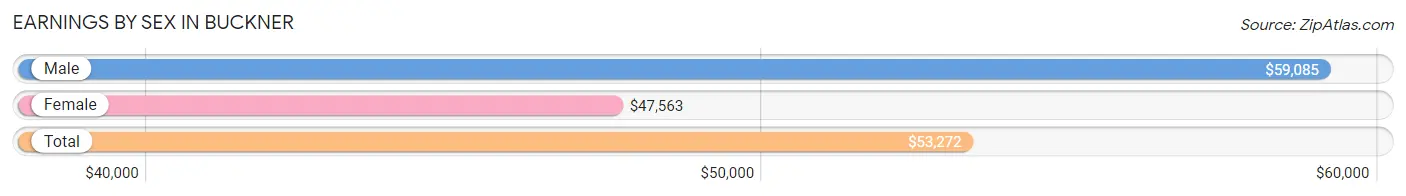
Earnings by Sex in Buckner
Average Earnings in Buckner are $53,272, $59,085 for men and $47,563 for women, a difference of 19.5%.
| Sex | Number | Average Earnings |
| Male | 1,308 (58.1%) | $59,085 |
| Female | 945 (41.9%) | $47,563 |
| Total | 2,253 (100.0%) | $53,272 |
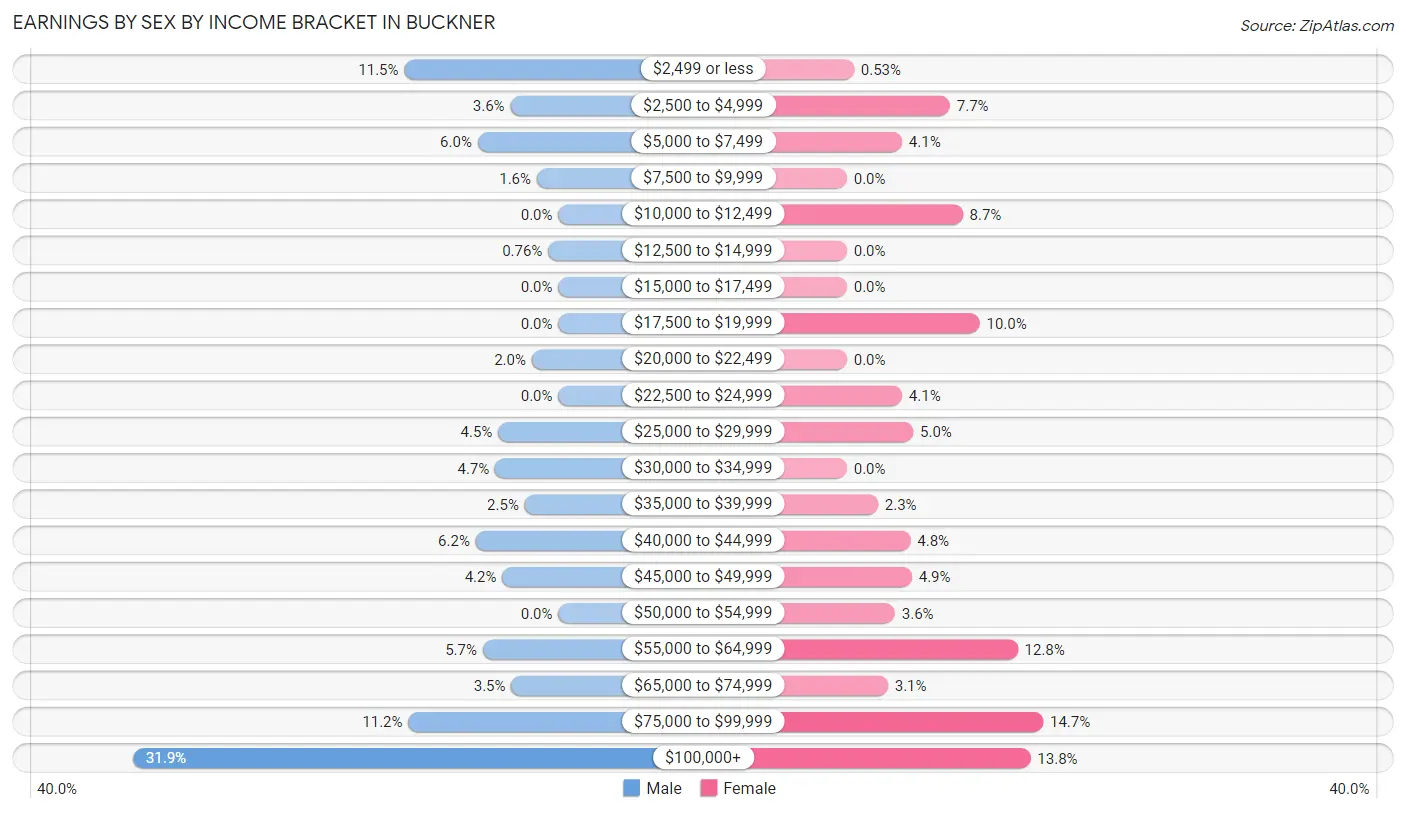
Earnings by Sex by Income Bracket in Buckner
The most common earnings brackets in Buckner are $100,000+ for men (417 | 31.9%) and $75,000 to $99,999 for women (139 | 14.7%).
| Income | Male | Female |
| $2,499 or less | 151 (11.5%) | 5 (0.5%) |
| $2,500 to $4,999 | 47 (3.6%) | 73 (7.7%) |
| $5,000 to $7,499 | 79 (6.0%) | 39 (4.1%) |
| $7,500 to $9,999 | 21 (1.6%) | 0 (0.0%) |
| $10,000 to $12,499 | 0 (0.0%) | 82 (8.7%) |
| $12,500 to $14,999 | 10 (0.8%) | 0 (0.0%) |
| $15,000 to $17,499 | 0 (0.0%) | 0 (0.0%) |
| $17,500 to $19,999 | 0 (0.0%) | 94 (10.0%) |
| $20,000 to $22,499 | 26 (2.0%) | 0 (0.0%) |
| $22,500 to $24,999 | 0 (0.0%) | 39 (4.1%) |
| $25,000 to $29,999 | 59 (4.5%) | 47 (5.0%) |
| $30,000 to $34,999 | 62 (4.7%) | 0 (0.0%) |
| $35,000 to $39,999 | 33 (2.5%) | 22 (2.3%) |
| $40,000 to $44,999 | 81 (6.2%) | 45 (4.8%) |
| $45,000 to $49,999 | 55 (4.2%) | 46 (4.9%) |
| $50,000 to $54,999 | 0 (0.0%) | 34 (3.6%) |
| $55,000 to $64,999 | 74 (5.7%) | 121 (12.8%) |
| $65,000 to $74,999 | 46 (3.5%) | 29 (3.1%) |
| $75,000 to $99,999 | 147 (11.2%) | 139 (14.7%) |
| $100,000+ | 417 (31.9%) | 130 (13.8%) |
| Total | 1,308 (100.0%) | 945 (100.0%) |
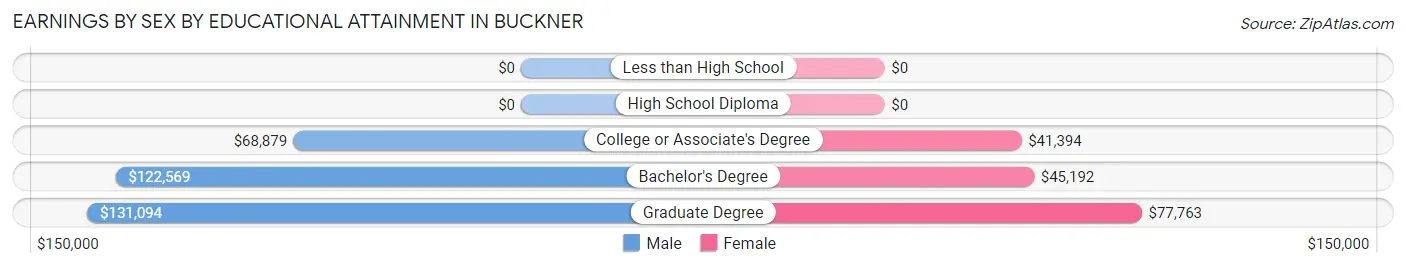
Earnings by Sex by Educational Attainment in Buckner
Average earnings in Buckner are $80,018 for men and $56,042 for women, a difference of 30.0%. Men with an educational attainment of graduate degree enjoy the highest average annual earnings of $131,094, while those with college or associate's degree education earn the least with $68,879. Women with an educational attainment of graduate degree earn the most with the average annual earnings of $77,763, while those with college or associate's degree education have the smallest earnings of $41,394.
| Educational Attainment | Male Income | Female Income |
| Less than High School | - | - |
| High School Diploma | - | - |
| College or Associate's Degree | $68,879 | $41,394 |
| Bachelor's Degree | $122,569 | $45,192 |
| Graduate Degree | $131,094 | $77,763 |
| Total | $80,018 | $56,042 |
Family Income in Buckner
Family Income Brackets in Buckner
According to the Buckner family income data, there are 276 families falling into the $200,000+ income range, which is the most common income bracket and makes up 27.0% of all families.
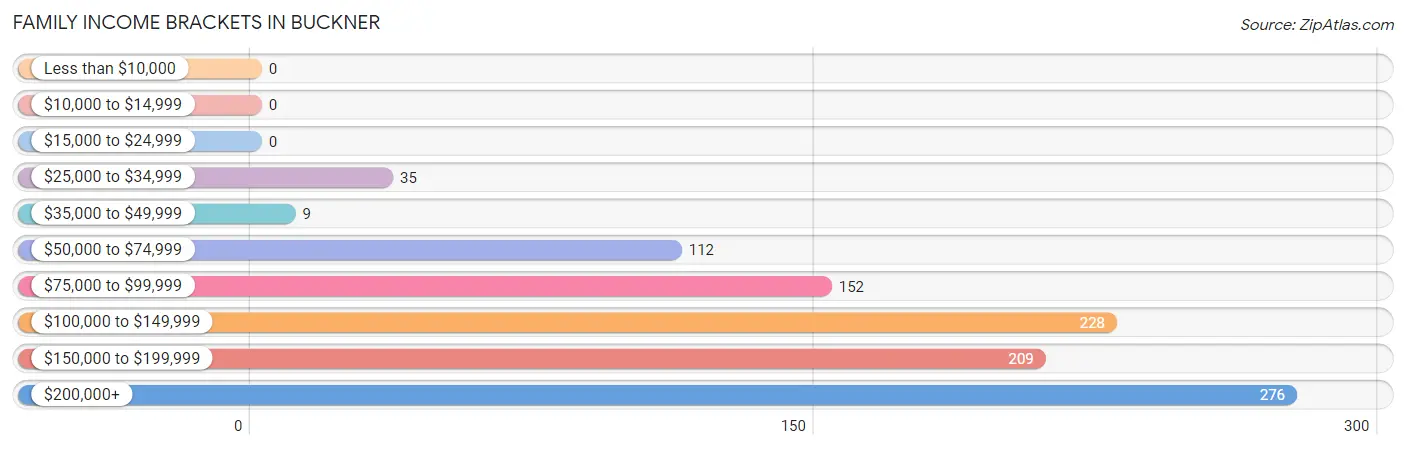
| Income Bracket | # Families | % Families |
| Less than $10,000 | 0 | 0.0% |
| $10,000 to $14,999 | 0 | 0.0% |
| $15,000 to $24,999 | 0 | 0.0% |
| $25,000 to $34,999 | 35 | 3.4% |
| $35,000 to $49,999 | 9 | 0.9% |
| $50,000 to $74,999 | 112 | 11.0% |
| $75,000 to $99,999 | 152 | 14.9% |
| $100,000 to $149,999 | 228 | 22.3% |
| $150,000 to $199,999 | 209 | 20.5% |
| $200,000+ | 276 | 27.0% |
Family Income by Famaliy Size in Buckner
5-person families (111 | 10.9%) account for the highest median family income in Buckner with $250,001 per family, while 3-person families (360 | 35.3%) have the highest median income of $53,722 per family member.
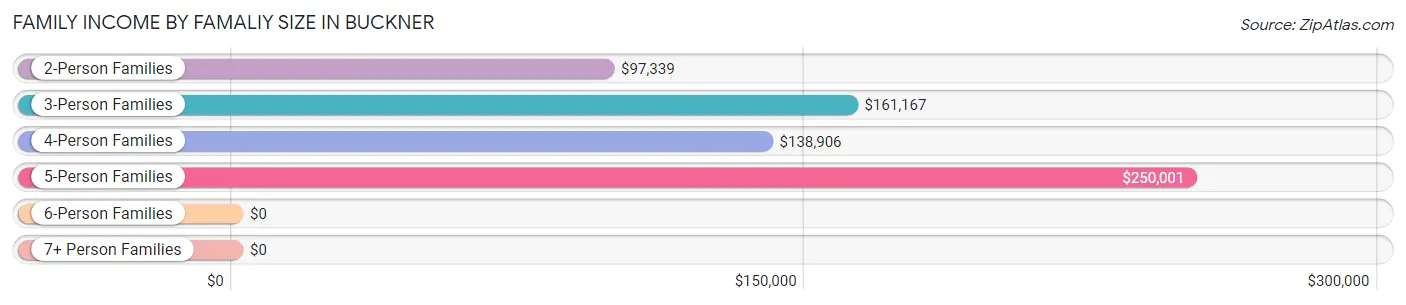
| Income Bracket | # Families | Median Income |
| 2-Person Families | 340 (33.3%) | $97,339 |
| 3-Person Families | 360 (35.3%) | $161,167 |
| 4-Person Families | 205 (20.1%) | $138,906 |
| 5-Person Families | 111 (10.9%) | $250,001 |
| 6-Person Families | 5 (0.5%) | $0 |
| 7+ Person Families | 0 (0.0%) | $0 |
| Total | 1,021 (100.0%) | $148,517 |
Family Income by Number of Earners in Buckner
The median family income in Buckner is $148,517, with families comprising 3+ earners (185) having the highest median family income of $250,001, while families with no earners (67) have the lowest median family income of $67,404, accounting for 18.1% and 6.6% of families, respectively.
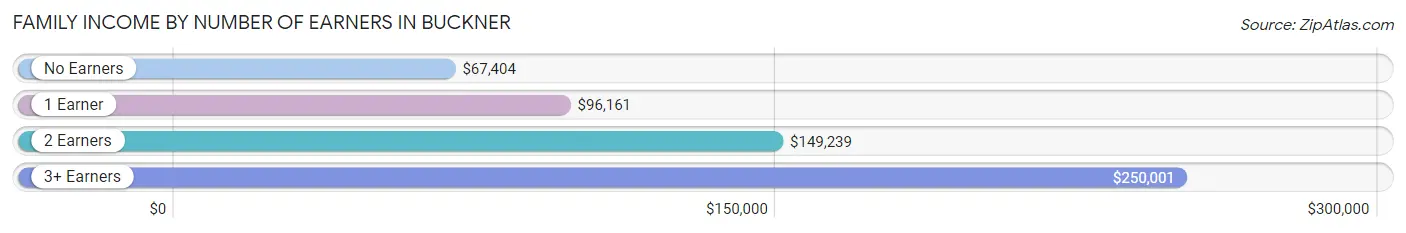
| Number of Earners | # Families | Median Income |
| No Earners | 67 (6.6%) | $67,404 |
| 1 Earner | 233 (22.8%) | $96,161 |
| 2 Earners | 536 (52.5%) | $149,239 |
| 3+ Earners | 185 (18.1%) | $250,001 |
| Total | 1,021 (100.0%) | $148,517 |
Household Income in Buckner
Household Income Brackets in Buckner
With 276 households falling in the category, the $200,000+ income range is the most frequent in Buckner, accounting for 24.3% of all households.
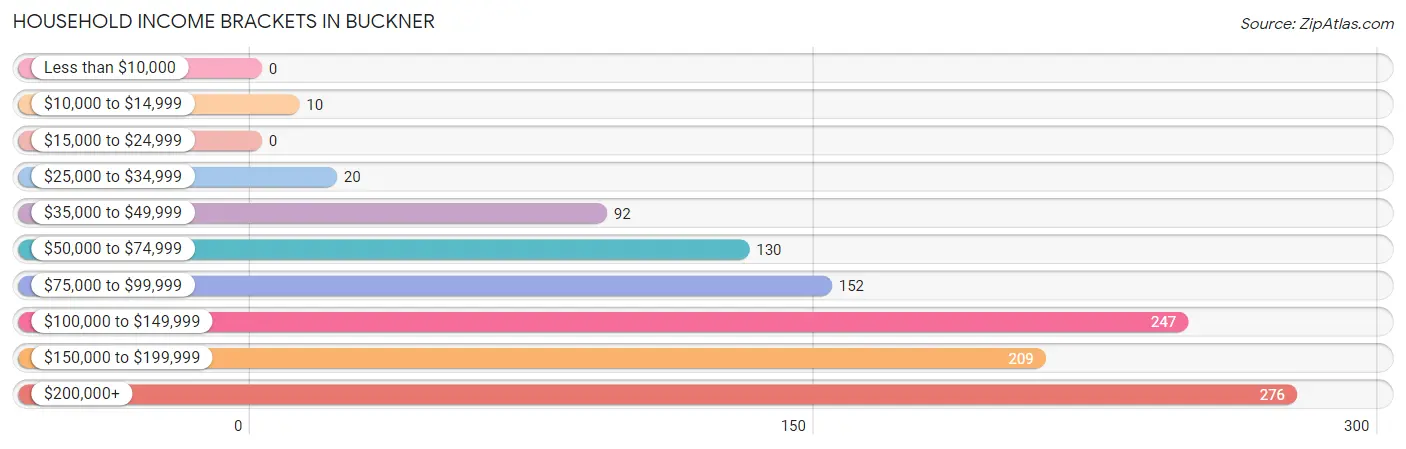
| Income Bracket | # Households | % Households |
| Less than $10,000 | 0 | 0.0% |
| $10,000 to $14,999 | 10 | 0.9% |
| $15,000 to $24,999 | 0 | 0.0% |
| $25,000 to $34,999 | 20 | 1.8% |
| $35,000 to $49,999 | 92 | 8.1% |
| $50,000 to $74,999 | 130 | 11.4% |
| $75,000 to $99,999 | 152 | 13.4% |
| $100,000 to $149,999 | 247 | 21.7% |
| $150,000 to $199,999 | 209 | 18.4% |
| $200,000+ | 276 | 24.3% |
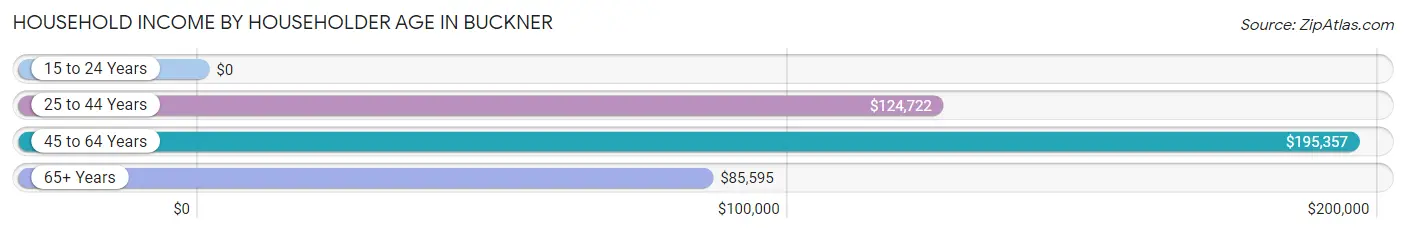
Household Income by Householder Age in Buckner
The median household income in Buckner is $141,538, with the highest median household income of $195,357 found in the 45 to 64 years age bracket for the primary householder. A total of 512 households (45.1%) fall into this category.
| Income Bracket | # Households | Median Income |
| 15 to 24 Years | 0 (0.0%) | $0 |
| 25 to 44 Years | 432 (38.0%) | $124,722 |
| 45 to 64 Years | 512 (45.1%) | $195,357 |
| 65+ Years | 192 (16.9%) | $85,595 |
| Total | 1,136 (100.0%) | $141,538 |
Poverty in Buckner
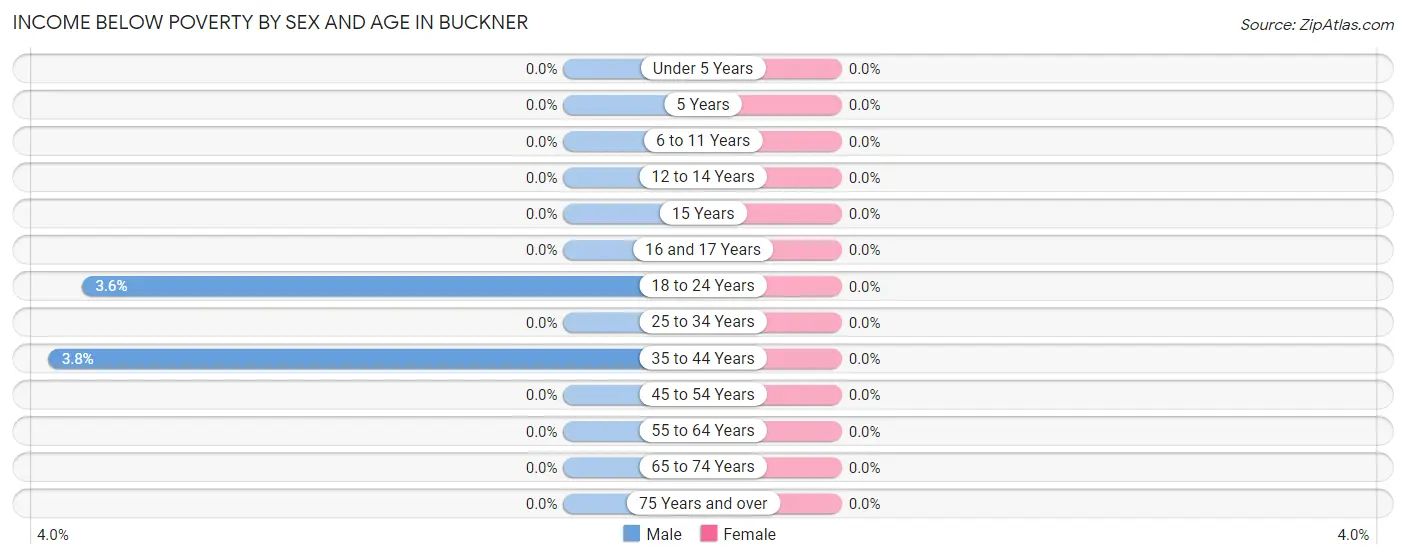
Income Below Poverty by Sex and Age in Buckner
| Age Bracket | Male | Female |
| Under 5 Years | 0 (0.0%) | 0 (0.0%) |
| 5 Years | 0 (0.0%) | 0 (0.0%) |
| 6 to 11 Years | 0 (0.0%) | 0 (0.0%) |
| 12 to 14 Years | 0 (0.0%) | 0 (0.0%) |
| 15 Years | 0 (0.0%) | 0 (0.0%) |
| 16 and 17 Years | 0 (0.0%) | 0 (0.0%) |
| 18 to 24 Years | 4 (3.6%) | 0 (0.0%) |
| 25 to 34 Years | 0 (0.0%) | 0 (0.0%) |
| 35 to 44 Years | 10 (3.8%) | 0 (0.0%) |
| 45 to 54 Years | 0 (0.0%) | 0 (0.0%) |
| 55 to 64 Years | 0 (0.0%) | 0 (0.0%) |
| 65 to 74 Years | 0 (0.0%) | 0 (0.0%) |
| 75 Years and over | 0 (0.0%) | 0 (0.0%) |
| Total | 14 (0.8%) | 0 (0.0%) |
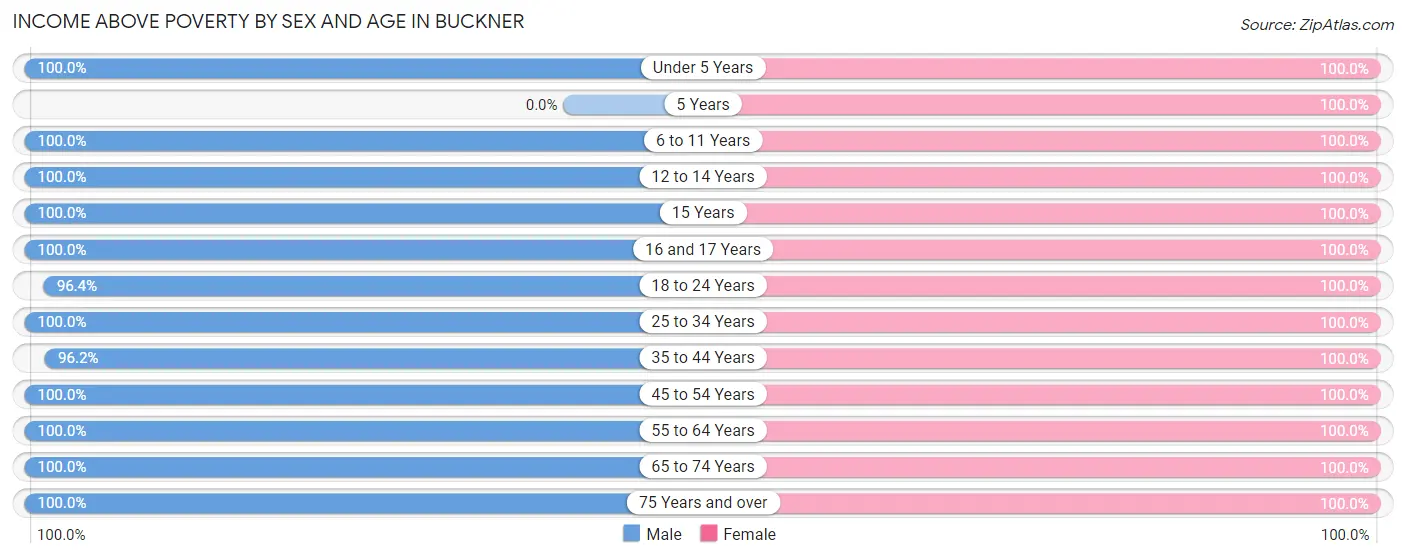
Income Above Poverty by Sex and Age in Buckner
According to the poverty statistics in Buckner, males aged under 5 years and females aged under 5 years are the age groups that are most secure financially, with 100.0% of males and 100.0% of females in these age groups living above the poverty line.
| Age Bracket | Male | Female |
| Under 5 Years | 34 (100.0%) | 173 (100.0%) |
| 5 Years | 0 (0.0%) | 41 (100.0%) |
| 6 to 11 Years | 132 (100.0%) | 105 (100.0%) |
| 12 to 14 Years | 114 (100.0%) | 79 (100.0%) |
| 15 Years | 23 (100.0%) | 63 (100.0%) |
| 16 and 17 Years | 124 (100.0%) | 39 (100.0%) |
| 18 to 24 Years | 108 (96.4%) | 147 (100.0%) |
| 25 to 34 Years | 196 (100.0%) | 129 (100.0%) |
| 35 to 44 Years | 252 (96.2%) | 229 (100.0%) |
| 45 to 54 Years | 316 (100.0%) | 337 (100.0%) |
| 55 to 64 Years | 149 (100.0%) | 114 (100.0%) |
| 65 to 74 Years | 200 (100.0%) | 129 (100.0%) |
| 75 Years and over | 52 (100.0%) | 60 (100.0%) |
| Total | 1,700 (99.2%) | 1,645 (100.0%) |
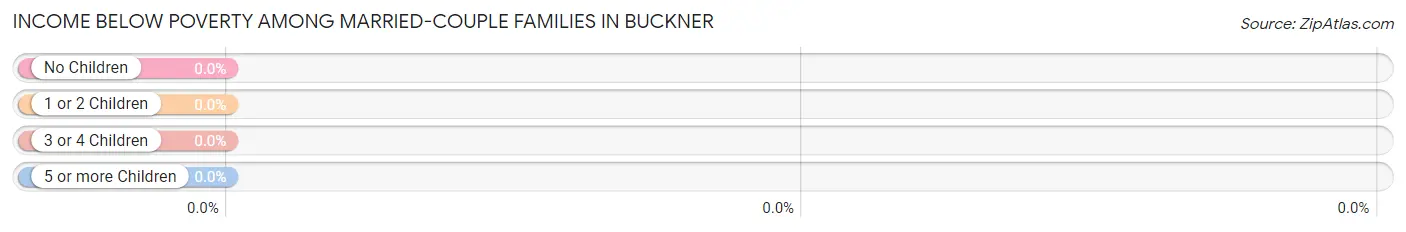
Income Below Poverty Among Married-Couple Families in Buckner
| Children | Above Poverty | Below Poverty |
| No Children | 403 (100.0%) | 0 (0.0%) |
| 1 or 2 Children | 445 (100.0%) | 0 (0.0%) |
| 3 or 4 Children | 44 (100.0%) | 0 (0.0%) |
| 5 or more Children | 0 (0.0%) | 0 (0.0%) |
| Total | 892 (100.0%) | 0 (0.0%) |
Income Below Poverty Among Single-Parent Households in Buckner
| Children | Single Father | Single Mother |
| No Children | 0 (0.0%) | 0 (0.0%) |
| 1 or 2 Children | 0 (0.0%) | 0 (0.0%) |
| 3 or 4 Children | 0 (0.0%) | 0 (0.0%) |
| 5 or more Children | 0 (0.0%) | 0 (0.0%) |
| Total | 0 (0.0%) | 0 (0.0%) |
Income Below Poverty Among Married-Couple vs Single-Parent Households in Buckner
| Children | Married-Couple Families | Single-Parent Households |
| No Children | 0 (0.0%) | 0 (0.0%) |
| 1 or 2 Children | 0 (0.0%) | 0 (0.0%) |
| 3 or 4 Children | 0 (0.0%) | 0 (0.0%) |
| 5 or more Children | 0 (0.0%) | 0 (0.0%) |
| Total | 0 (0.0%) | 0 (0.0%) |
Race in Buckner
The most populous races in Buckner are White / Caucasian (3,219 | 88.0%), Black / African American (222 | 6.1%), and Two or more Races (217 | 5.9%).
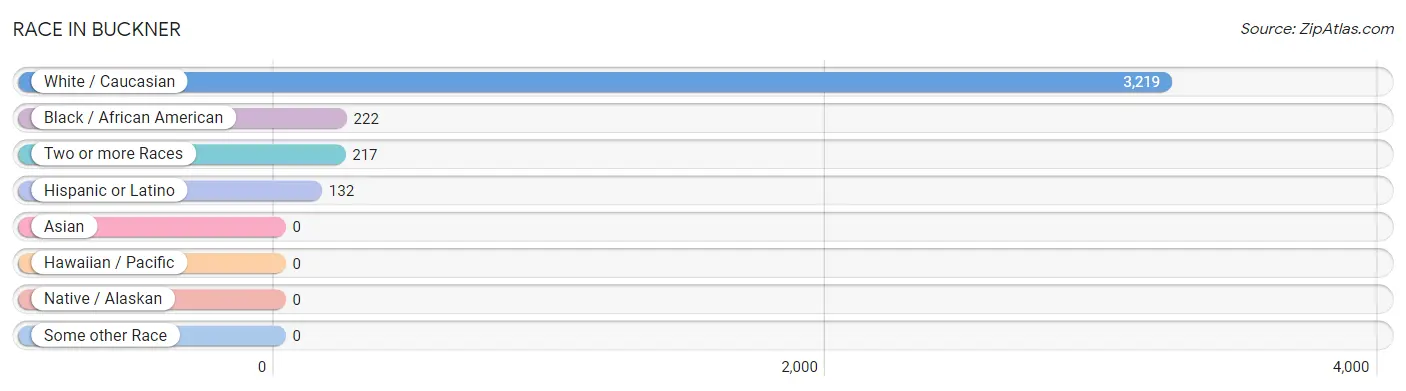
| Race | # Population | % Population |
| Asian | 0 | 0.0% |
| Black / African American | 222 | 6.1% |
| Hawaiian / Pacific | 0 | 0.0% |
| Hispanic or Latino | 132 | 3.6% |
| Native / Alaskan | 0 | 0.0% |
| White / Caucasian | 3,219 | 88.0% |
| Two or more Races | 217 | 5.9% |
| Some other Race | 0 | 0.0% |
| Total | 3,658 | 100.0% |
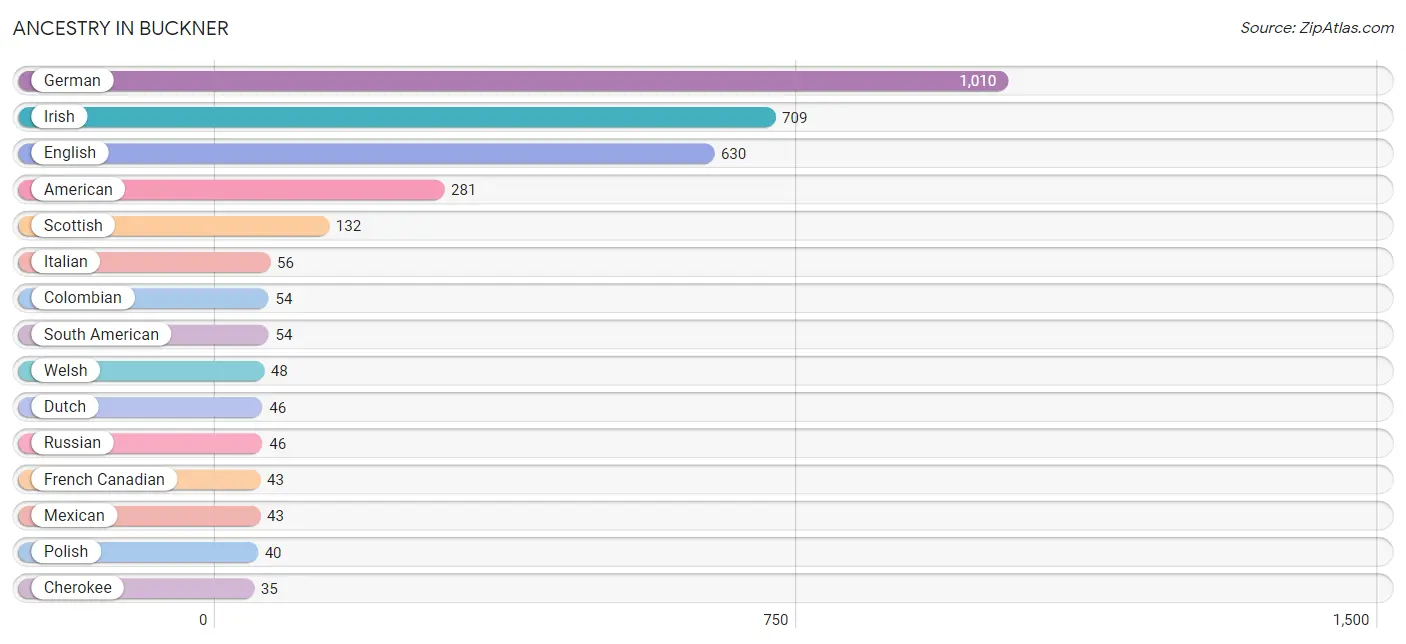
Ancestry in Buckner
The most populous ancestries reported in Buckner are German (1,010 | 27.6%), Irish (709 | 19.4%), English (630 | 17.2%), American (281 | 7.7%), and Scottish (132 | 3.6%), together accounting for 75.5% of all Buckner residents.
| Ancestry | # Population | % Population |
| African | 1 | 0.0% |
| American | 281 | 7.7% |
| Cherokee | 35 | 1.0% |
| Colombian | 54 | 1.5% |
| Dutch | 46 | 1.3% |
| Eastern European | 7 | 0.2% |
| English | 630 | 17.2% |
| European | 19 | 0.5% |
| French | 32 | 0.9% |
| French Canadian | 43 | 1.2% |
| German | 1,010 | 27.6% |
| Irish | 709 | 19.4% |
| Italian | 56 | 1.5% |
| Lithuanian | 14 | 0.4% |
| Mexican | 43 | 1.2% |
| Norwegian | 25 | 0.7% |
| Polish | 40 | 1.1% |
| Portuguese | 34 | 0.9% |
| Puerto Rican | 35 | 1.0% |
| Russian | 46 | 1.3% |
| Scotch-Irish | 26 | 0.7% |
| Scottish | 132 | 3.6% |
| South American | 54 | 1.5% |
| Subsaharan African | 1 | 0.0% |
| Swedish | 25 | 0.7% |
| Ukrainian | 14 | 0.4% |
| Welsh | 48 | 1.3% | View All 27 Rows |
Immigrants in Buckner
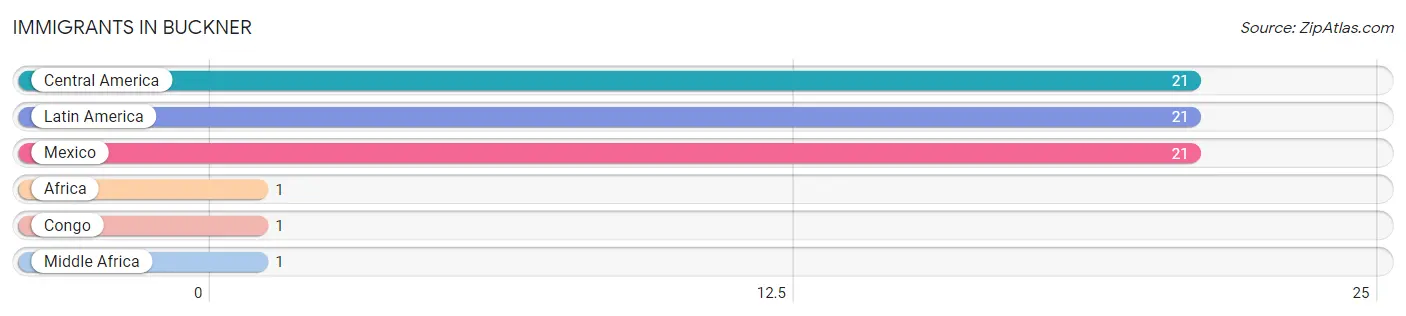
The most numerous immigrant groups reported in Buckner came from Central America (21 | 0.6%), Latin America (21 | 0.6%), Mexico (21 | 0.6%), Africa (1 | 0.0%), and Congo (1 | 0.0%), together accounting for 1.8% of all Buckner residents.
| Immigration Origin | # Population | % Population |
| Africa | 1 | 0.0% |
| Central America | 21 | 0.6% |
| Congo | 1 | 0.0% |
| Latin America | 21 | 0.6% |
| Mexico | 21 | 0.6% |
| Middle Africa | 1 | 0.0% | View All 6 Rows |
Sex and Age in Buckner
Sex and Age in Buckner
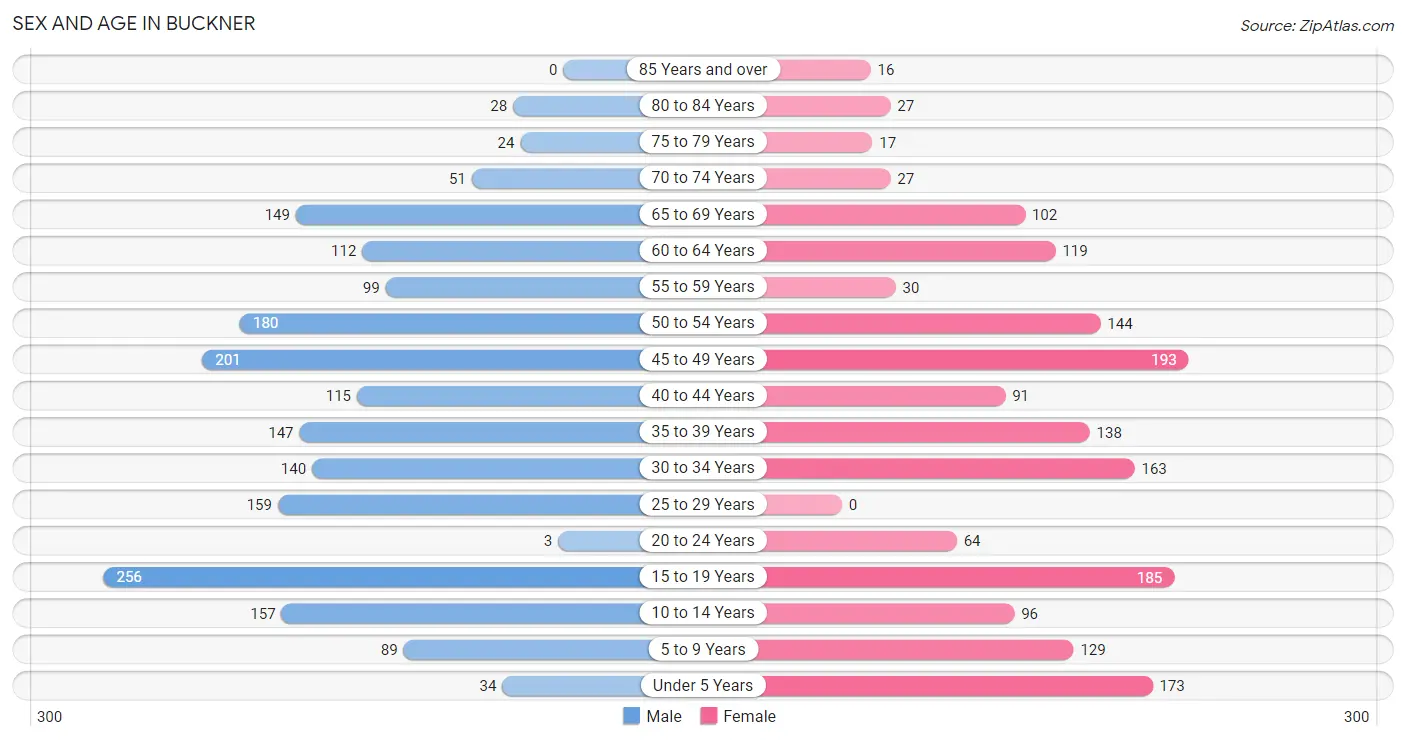
The most populous age groups in Buckner are 15 to 19 Years (256 | 13.2%) for men and 45 to 49 Years (193 | 11.3%) for women.
| Age Bracket | Male | Female |
| Under 5 Years | 34 (1.8%) | 173 (10.1%) |
| 5 to 9 Years | 89 (4.6%) | 129 (7.5%) |
| 10 to 14 Years | 157 (8.1%) | 96 (5.6%) |
| 15 to 19 Years | 256 (13.2%) | 185 (10.8%) |
| 20 to 24 Years | 3 (0.2%) | 64 (3.7%) |
| 25 to 29 Years | 159 (8.2%) | 0 (0.0%) |
| 30 to 34 Years | 140 (7.2%) | 163 (9.5%) |
| 35 to 39 Years | 147 (7.6%) | 138 (8.1%) |
| 40 to 44 Years | 115 (5.9%) | 91 (5.3%) |
| 45 to 49 Years | 201 (10.3%) | 193 (11.3%) |
| 50 to 54 Years | 180 (9.3%) | 144 (8.4%) |
| 55 to 59 Years | 99 (5.1%) | 30 (1.8%) |
| 60 to 64 Years | 112 (5.8%) | 119 (6.9%) |
| 65 to 69 Years | 149 (7.7%) | 102 (5.9%) |
| 70 to 74 Years | 51 (2.6%) | 27 (1.6%) |
| 75 to 79 Years | 24 (1.2%) | 17 (1.0%) |
| 80 to 84 Years | 28 (1.4%) | 27 (1.6%) |
| 85 Years and over | 0 (0.0%) | 16 (0.9%) |
| Total | 1,944 (100.0%) | 1,714 (100.0%) |
Families and Households in Buckner
Median Family Size in Buckner
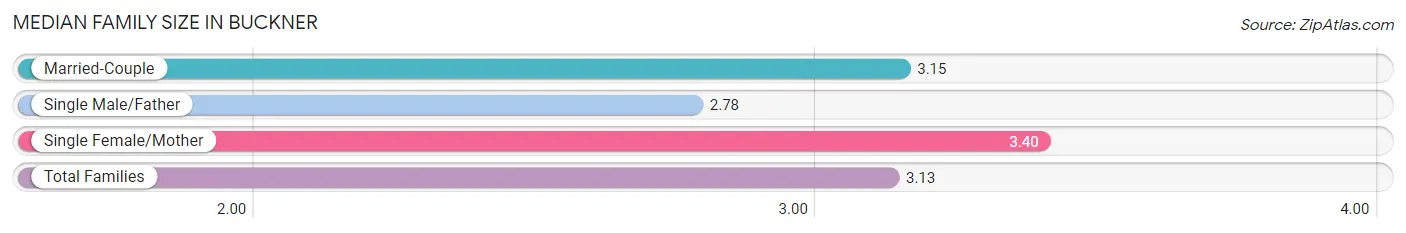
The median family size in Buckner is 3.13 persons per family, with single female/mother families (42 | 4.1%) accounting for the largest median family size of 3.4 persons per family. On the other hand, single male/father families (87 | 8.5%) represent the smallest median family size with 2.78 persons per family.
| Family Type | # Families | Family Size |
| Married-Couple | 892 (87.4%) | 3.15 |
| Single Male/Father | 87 (8.5%) | 2.78 |
| Single Female/Mother | 42 (4.1%) | 3.40 |
| Total Families | 1,021 (100.0%) | 3.13 |
Median Household Size in Buckner
| Household Type | # Households | Household Size |
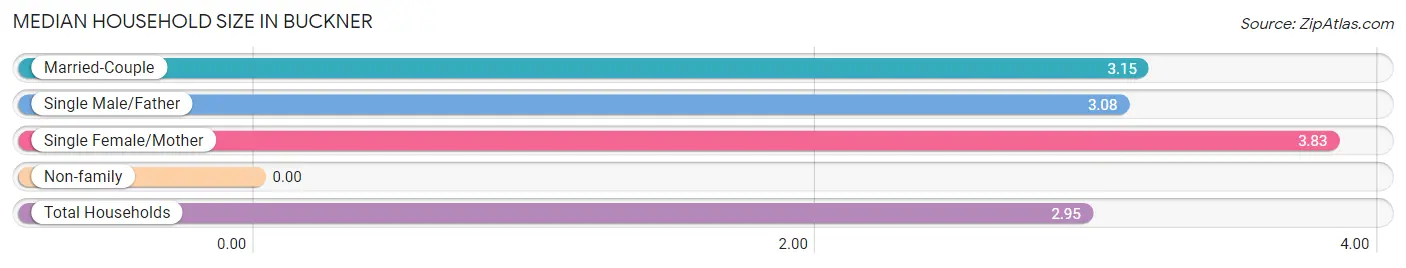
| Married-Couple | 892 (78.5%) | 3.15 |
| Single Male/Father | 87 (7.7%) | 3.08 |
| Single Female/Mother | 42 (3.7%) | 3.83 |
| Non-family | 115 (10.1%) | - |
| Total Households | 1,136 (100.0%) | 2.95 |
Household Size by Marriage Status in Buckner
Out of a total of 1,136 households in Buckner, 1,021 (89.9%) are family households, while 115 (10.1%) are nonfamily households. The most numerous type of family households are 2-person households, comprising 340, and the most common type of nonfamily households are 1-person households, comprising 115.
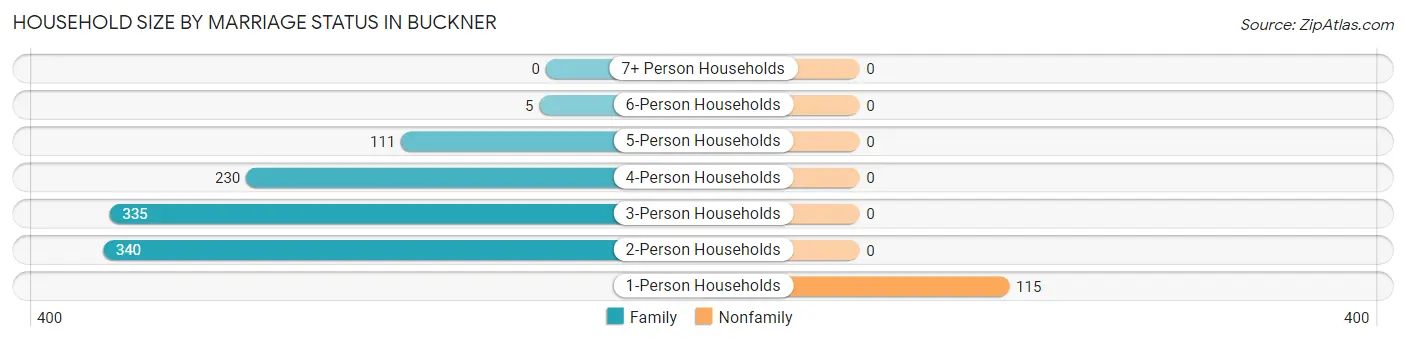
| Household Size | Family Households | Nonfamily Households |
| 1-Person Households | - | 115 (10.1%) |
| 2-Person Households | 340 (29.9%) | 0 (0.0%) |
| 3-Person Households | 335 (29.5%) | 0 (0.0%) |
| 4-Person Households | 230 (20.3%) | 0 (0.0%) |
| 5-Person Households | 111 (9.8%) | 0 (0.0%) |
| 6-Person Households | 5 (0.4%) | 0 (0.0%) |
| 7+ Person Households | 0 (0.0%) | 0 (0.0%) |
| Total | 1,021 (89.9%) | 115 (10.1%) |
Female Fertility in Buckner
Fertility by Age in Buckner
Average fertility rate in Buckner is 59.0 births per 1,000 women. Women in the age bracket of 20 to 34 years have the highest fertility rate with 115.0 births per 1,000 women. Women in the age bracket of 20 to 34 years acount for 50.0% of all women with births.
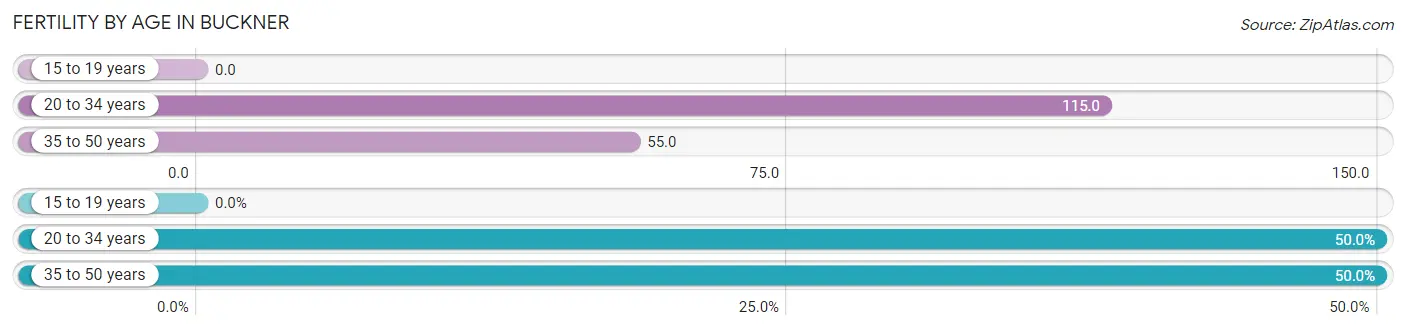
| Age Bracket | Women with Births | Births / 1,000 Women |
| 15 to 19 years | 0 (0.0%) | 0.0 |
| 20 to 34 years | 26 (50.0%) | 115.0 |
| 35 to 50 years | 26 (50.0%) | 55.0 |
| Total | 52 (100.0%) | 59.0 |
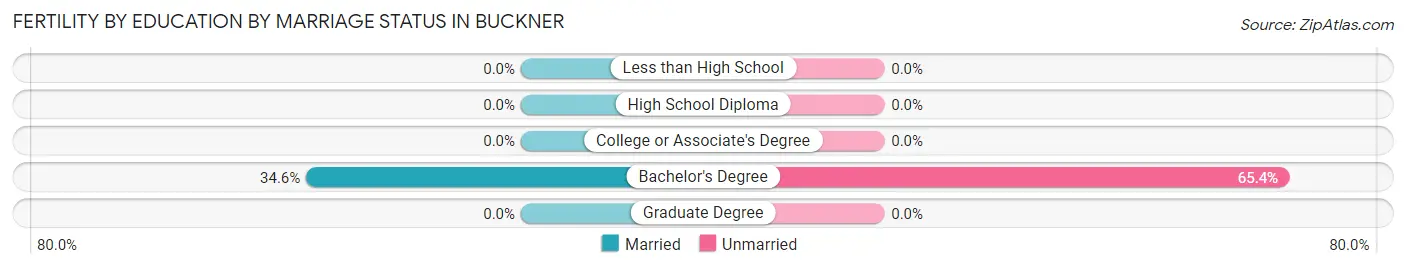
Fertility by Age by Marriage Status in Buckner
34.6% of women with births (52) in Buckner are married. The highest percentage of unmarried women with births falls into 20 to 34 years age bracket with 100.0% of them unmarried at the time of birth, while the lowest percentage of unmarried women with births belong to 35 to 50 years age bracket with 30.8% of them unmarried.
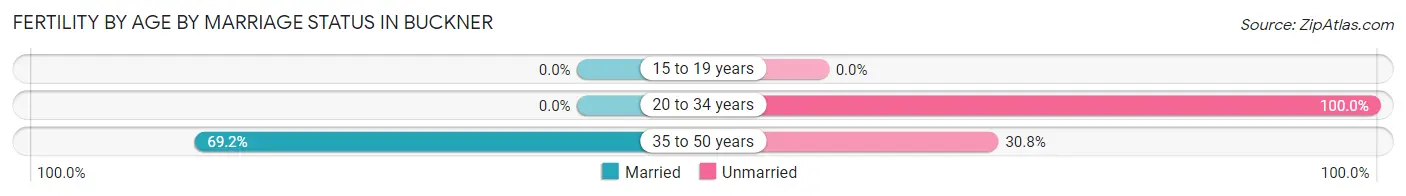
| Age Bracket | Married | Unmarried |
| 15 to 19 years | 0 (0.0%) | 0 (0.0%) |
| 20 to 34 years | 0 (0.0%) | 26 (100.0%) |
| 35 to 50 years | 18 (69.2%) | 8 (30.8%) |
| Total | 18 (34.6%) | 34 (65.4%) |
Fertility by Education in Buckner
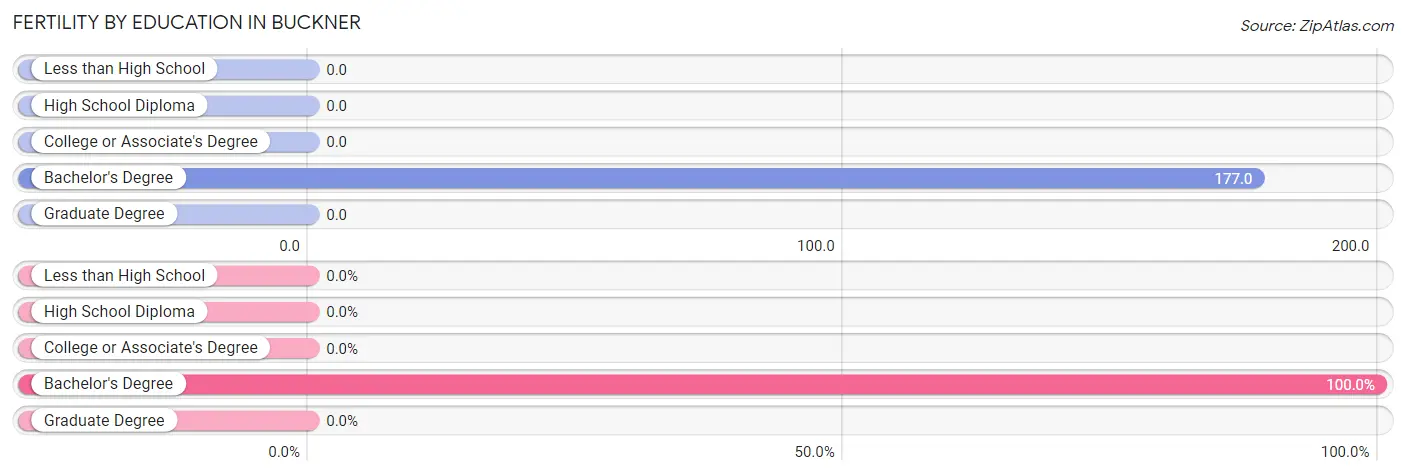
| Educational Attainment | Women with Births | Births / 1,000 Women |
| Less than High School | 0 (0.0%) | 0.0 |
| High School Diploma | 0 (0.0%) | 0.0 |
| College or Associate's Degree | 0 (0.0%) | 0.0 |
| Bachelor's Degree | 52 (100.0%) | 177.0 |
| Graduate Degree | 0 (0.0%) | 0.0 |
| Total | 52 (100.0%) | 59.0 |
Fertility by Education by Marriage Status in Buckner
65.4% of women with births in Buckner are unmarried. Women with the educational attainment of bachelor's degree are most likely to be married with 34.6% of them married at childbirth, while women with the educational attainment of bachelor's degree are least likely to be married with 65.4% of them unmarried at childbirth.
| Educational Attainment | Married | Unmarried |
| Less than High School | 0 (0.0%) | 0 (0.0%) |
| High School Diploma | 0 (0.0%) | 0 (0.0%) |
| College or Associate's Degree | 0 (0.0%) | 0 (0.0%) |
| Bachelor's Degree | 18 (34.6%) | 34 (65.4%) |
| Graduate Degree | 0 (0.0%) | 0 (0.0%) |
| Total | 18 (34.6%) | 34 (65.4%) |
Employment Characteristics in Buckner
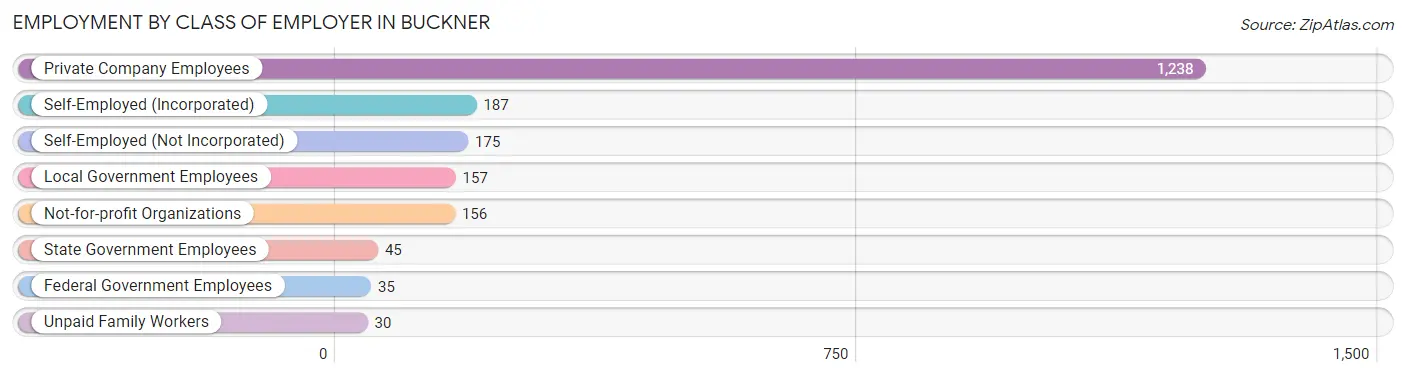
Employment by Class of Employer in Buckner
Among the 2,023 employed individuals in Buckner, private company employees (1,238 | 61.2%), self-employed (incorporated) (187 | 9.2%), and self-employed (not incorporated) (175 | 8.6%) make up the most common classes of employment.
| Employer Class | # Employees | % Employees |
| Private Company Employees | 1,238 | 61.2% |
| Self-Employed (Incorporated) | 187 | 9.2% |
| Self-Employed (Not Incorporated) | 175 | 8.6% |
| Not-for-profit Organizations | 156 | 7.7% |
| Local Government Employees | 157 | 7.8% |
| State Government Employees | 45 | 2.2% |
| Federal Government Employees | 35 | 1.7% |
| Unpaid Family Workers | 30 | 1.5% |
| Total | 2,023 | 100.0% |
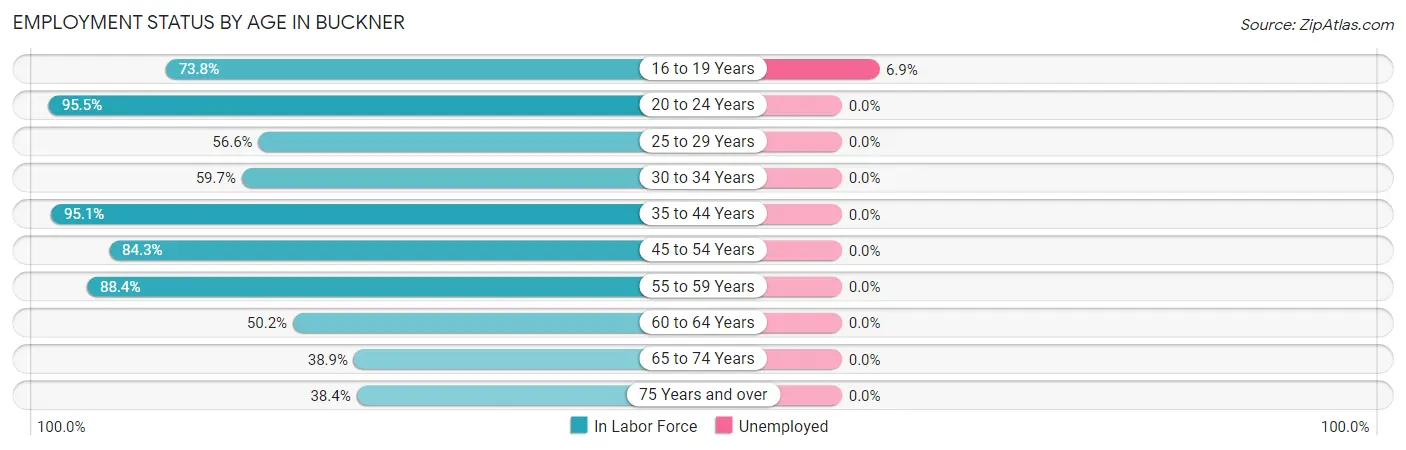
Employment Status by Age in Buckner
According to the labor force statistics for Buckner, out of the total population over 16 years of age (2,894), 71.5% or 2,069 individuals are in the labor force, with 0.9% or 19 of them unemployed. The age group with the highest labor force participation rate is 20 to 24 years, with 95.5% or 64 individuals in the labor force. Within the labor force, the 16 to 19 years age range has the highest percentage of unemployed individuals, with 6.9% or 18 of them being unemployed.
| Age Bracket | In Labor Force | Unemployed |
| 16 to 19 Years | 262 (73.8%) | 18 (6.9%) |
| 20 to 24 Years | 64 (95.5%) | 0 (0.0%) |
| 25 to 29 Years | 90 (56.6%) | 0 (0.0%) |
| 30 to 34 Years | 181 (59.7%) | 0 (0.0%) |
| 35 to 44 Years | 467 (95.1%) | 0 (0.0%) |
| 45 to 54 Years | 605 (84.3%) | 0 (0.0%) |
| 55 to 59 Years | 114 (88.4%) | 0 (0.0%) |
| 60 to 64 Years | 116 (50.2%) | 0 (0.0%) |
| 65 to 74 Years | 128 (38.9%) | 0 (0.0%) |
| 75 Years and over | 43 (38.4%) | 0 (0.0%) |
| Total | 2,069 (71.5%) | 19 (0.9%) |
Employment Status by Educational Attainment in Buckner
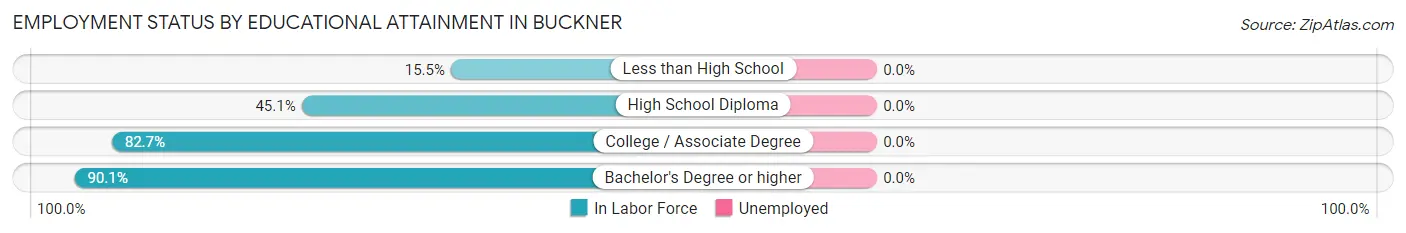
| Educational Attainment | In Labor Force | Unemployed |
| Less than High School | 30 (15.5%) | 0 (0.0%) |
| High School Diploma | 73 (45.1%) | 0 (0.0%) |
| College / Associate Degree | 445 (82.7%) | 0 (0.0%) |
| Bachelor's Degree or higher | 1,024 (90.1%) | 0 (0.0%) |
| Total | 1,572 (77.4%) | 0 (0.0%) |
Employment Occupations by Sex in Buckner
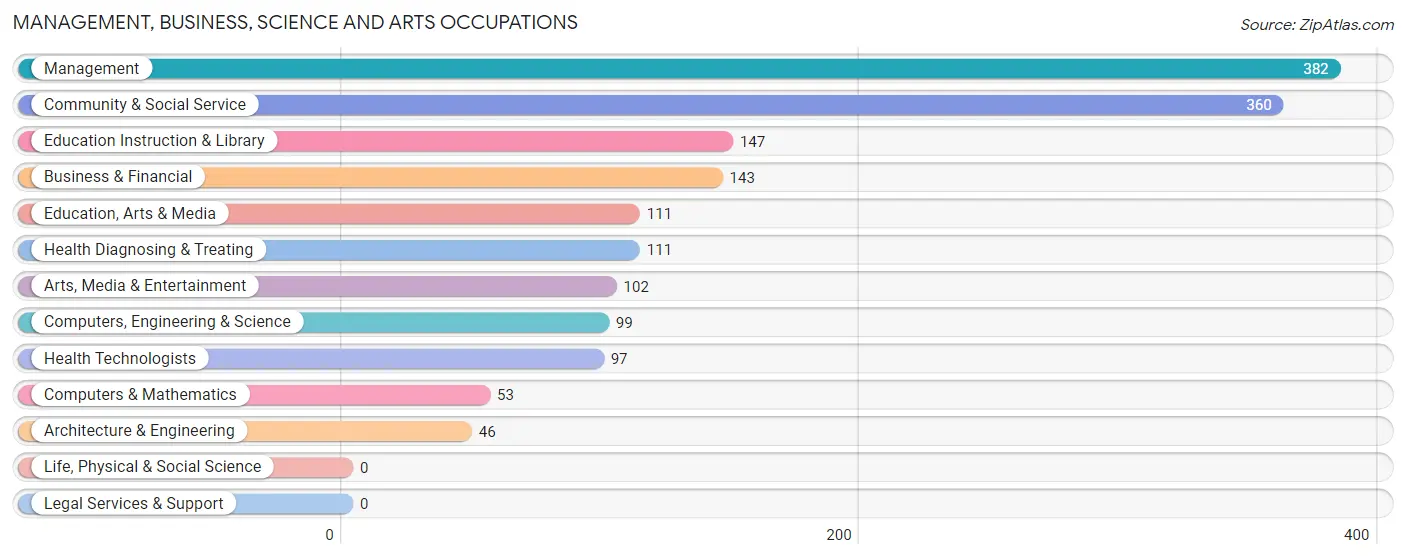
Management, Business, Science and Arts Occupations
The most common Management, Business, Science and Arts occupations in Buckner are Management (382 | 18.6%), Community & Social Service (360 | 17.5%), Education Instruction & Library (147 | 7.2%), Business & Financial (143 | 7.0%), and Education, Arts & Media (111 | 5.4%).
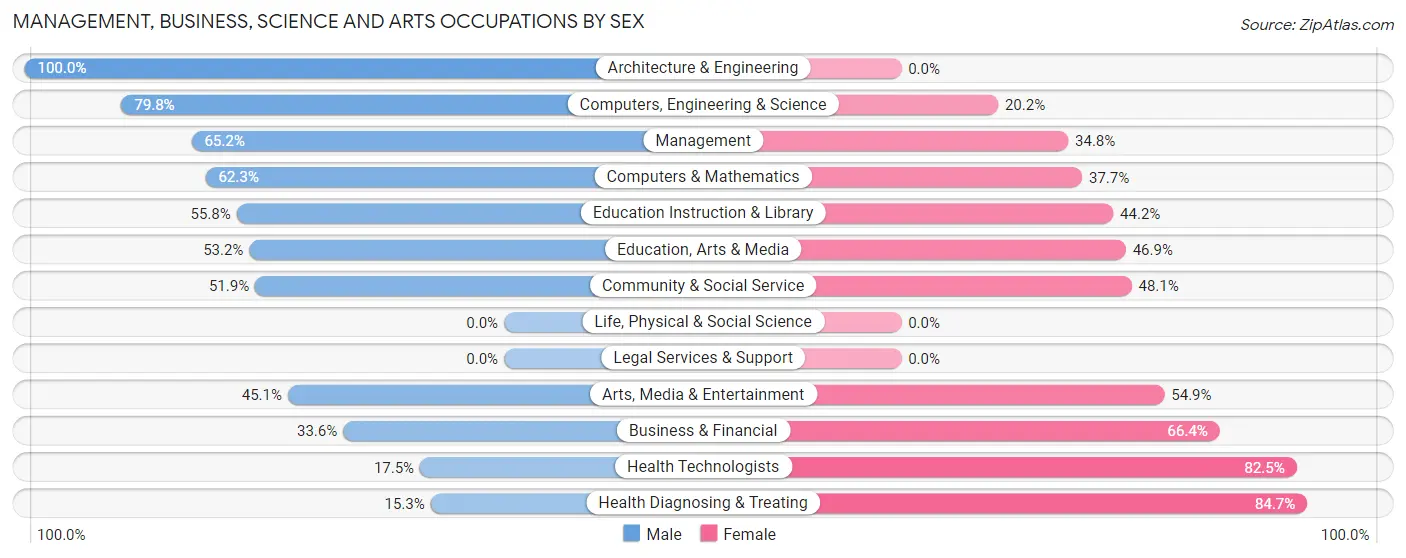
Management, Business, Science and Arts Occupations by Sex
Within the Management, Business, Science and Arts occupations in Buckner, the most male-oriented occupations are Architecture & Engineering (100.0%), Computers, Engineering & Science (79.8%), and Management (65.2%), while the most female-oriented occupations are Health Diagnosing & Treating (84.7%), Health Technologists (82.5%), and Business & Financial (66.4%).
| Occupation | Male | Female |
| Management | 249 (65.2%) | 133 (34.8%) |
| Business & Financial | 48 (33.6%) | 95 (66.4%) |
| Computers, Engineering & Science | 79 (79.8%) | 20 (20.2%) |
| Computers & Mathematics | 33 (62.3%) | 20 (37.7%) |
| Architecture & Engineering | 46 (100.0%) | 0 (0.0%) |
| Life, Physical & Social Science | 0 (0.0%) | 0 (0.0%) |
| Community & Social Service | 187 (51.9%) | 173 (48.1%) |
| Education, Arts & Media | 59 (53.1%) | 52 (46.9%) |
| Legal Services & Support | 0 (0.0%) | 0 (0.0%) |
| Education Instruction & Library | 82 (55.8%) | 65 (44.2%) |
| Arts, Media & Entertainment | 46 (45.1%) | 56 (54.9%) |
| Health Diagnosing & Treating | 17 (15.3%) | 94 (84.7%) |
| Health Technologists | 17 (17.5%) | 80 (82.5%) |
| Total (Category) | 580 (53.0%) | 515 (47.0%) |
| Total (Overall) | 1,159 (56.5%) | 893 (43.5%) |
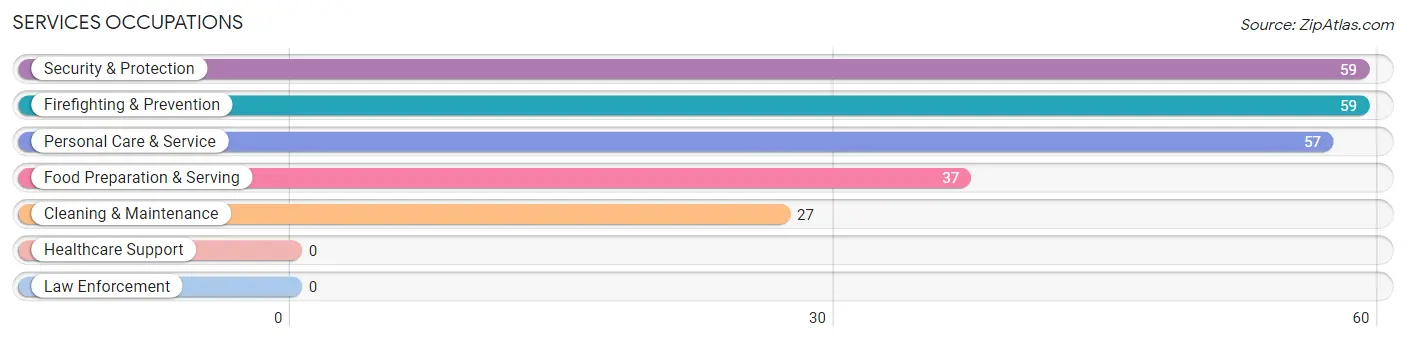
Services Occupations
The most common Services occupations in Buckner are Security & Protection (59 | 2.9%), Firefighting & Prevention (59 | 2.9%), Personal Care & Service (57 | 2.8%), Food Preparation & Serving (37 | 1.8%), and Cleaning & Maintenance (27 | 1.3%).
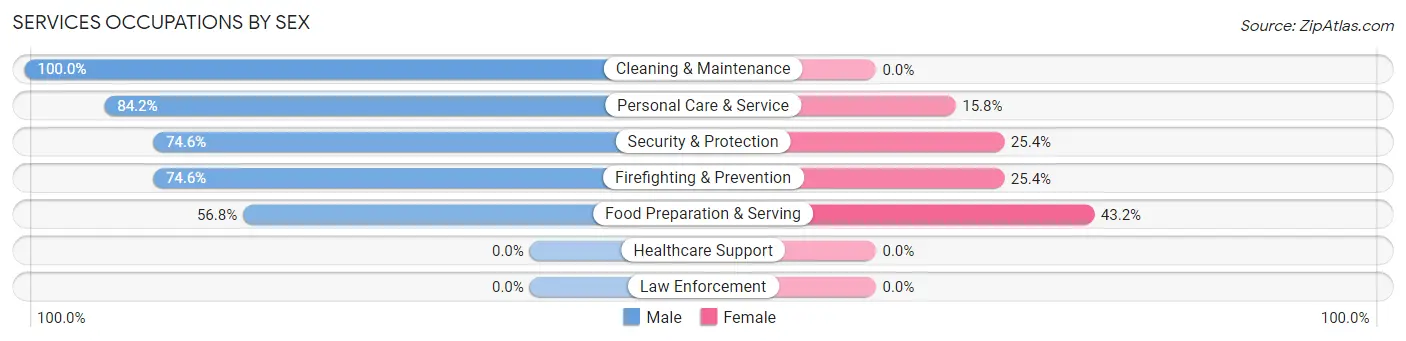
Services Occupations by Sex
Within the Services occupations in Buckner, the most male-oriented occupations are Cleaning & Maintenance (100.0%), Personal Care & Service (84.2%), and Security & Protection (74.6%), while the most female-oriented occupations are Food Preparation & Serving (43.2%), Security & Protection (25.4%), and Firefighting & Prevention (25.4%).
| Occupation | Male | Female |
| Healthcare Support | 0 (0.0%) | 0 (0.0%) |
| Security & Protection | 44 (74.6%) | 15 (25.4%) |
| Firefighting & Prevention | 44 (74.6%) | 15 (25.4%) |
| Law Enforcement | 0 (0.0%) | 0 (0.0%) |
| Food Preparation & Serving | 21 (56.8%) | 16 (43.2%) |
| Cleaning & Maintenance | 27 (100.0%) | 0 (0.0%) |
| Personal Care & Service | 48 (84.2%) | 9 (15.8%) |
| Total (Category) | 140 (77.8%) | 40 (22.2%) |
| Total (Overall) | 1,159 (56.5%) | 893 (43.5%) |
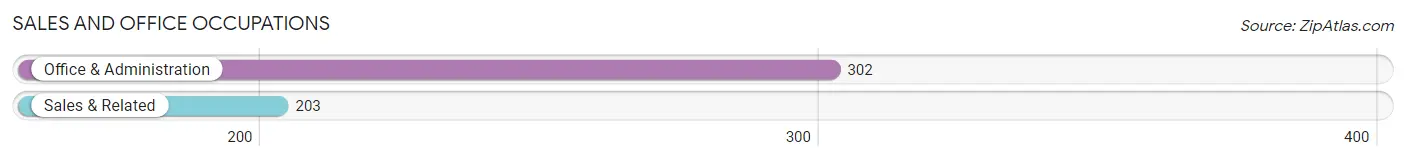
Sales and Office Occupations
The most common Sales and Office occupations in Buckner are Office & Administration (302 | 14.7%), and Sales & Related (203 | 9.9%).
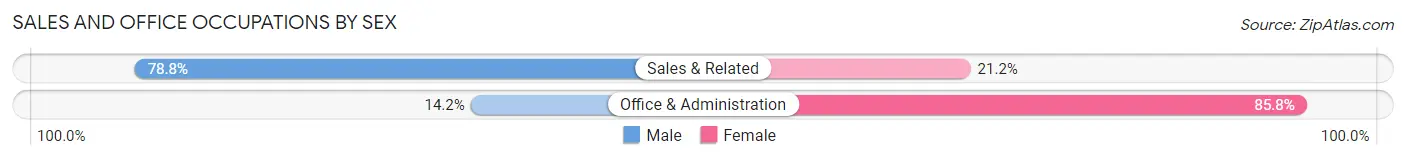
Sales and Office Occupations by Sex
| Occupation | Male | Female |
| Sales & Related | 160 (78.8%) | 43 (21.2%) |
| Office & Administration | 43 (14.2%) | 259 (85.8%) |
| Total (Category) | 203 (40.2%) | 302 (59.8%) |
| Total (Overall) | 1,159 (56.5%) | 893 (43.5%) |
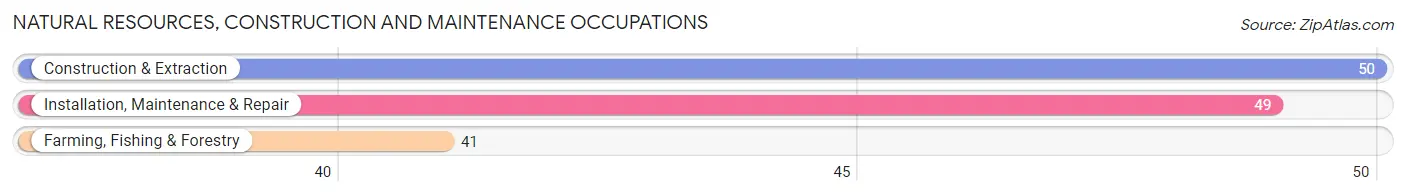
Natural Resources, Construction and Maintenance Occupations
The most common Natural Resources, Construction and Maintenance occupations in Buckner are Construction & Extraction (50 | 2.4%), Installation, Maintenance & Repair (49 | 2.4%), and Farming, Fishing & Forestry (41 | 2.0%).
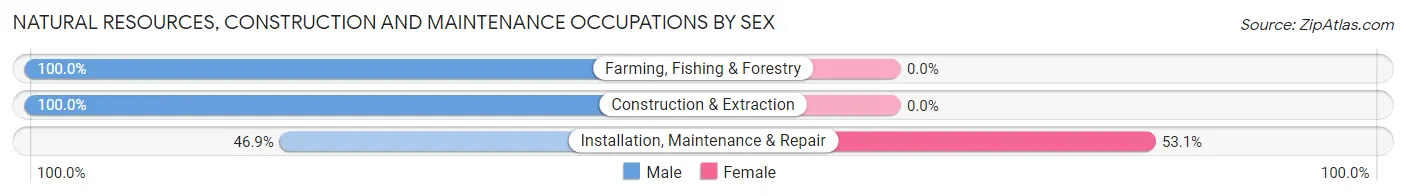
Natural Resources, Construction and Maintenance Occupations by Sex
| Occupation | Male | Female |
| Farming, Fishing & Forestry | 41 (100.0%) | 0 (0.0%) |
| Construction & Extraction | 50 (100.0%) | 0 (0.0%) |
| Installation, Maintenance & Repair | 23 (46.9%) | 26 (53.1%) |
| Total (Category) | 114 (81.4%) | 26 (18.6%) |
| Total (Overall) | 1,159 (56.5%) | 893 (43.5%) |
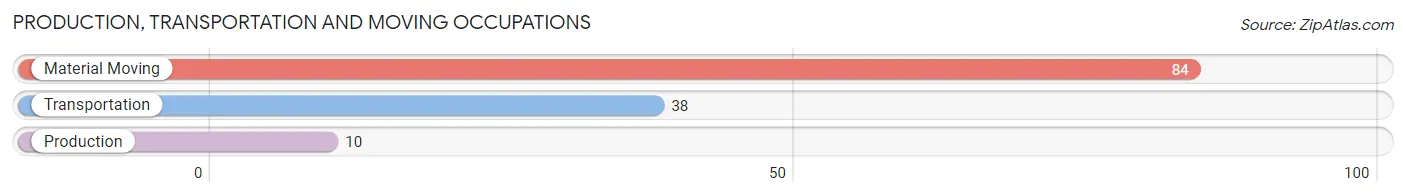
Production, Transportation and Moving Occupations
The most common Production, Transportation and Moving occupations in Buckner are Material Moving (84 | 4.1%), Transportation (38 | 1.8%), and Production (10 | 0.5%).
Production, Transportation and Moving Occupations by Sex
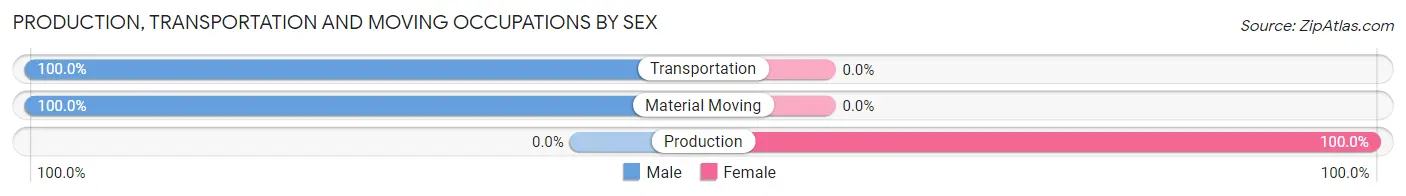
| Occupation | Male | Female |
| Production | 0 (0.0%) | 10 (100.0%) |
| Transportation | 38 (100.0%) | 0 (0.0%) |
| Material Moving | 84 (100.0%) | 0 (0.0%) |
| Total (Category) | 122 (92.4%) | 10 (7.6%) |
| Total (Overall) | 1,159 (56.5%) | 893 (43.5%) |
Employment Industries by Sex in Buckner
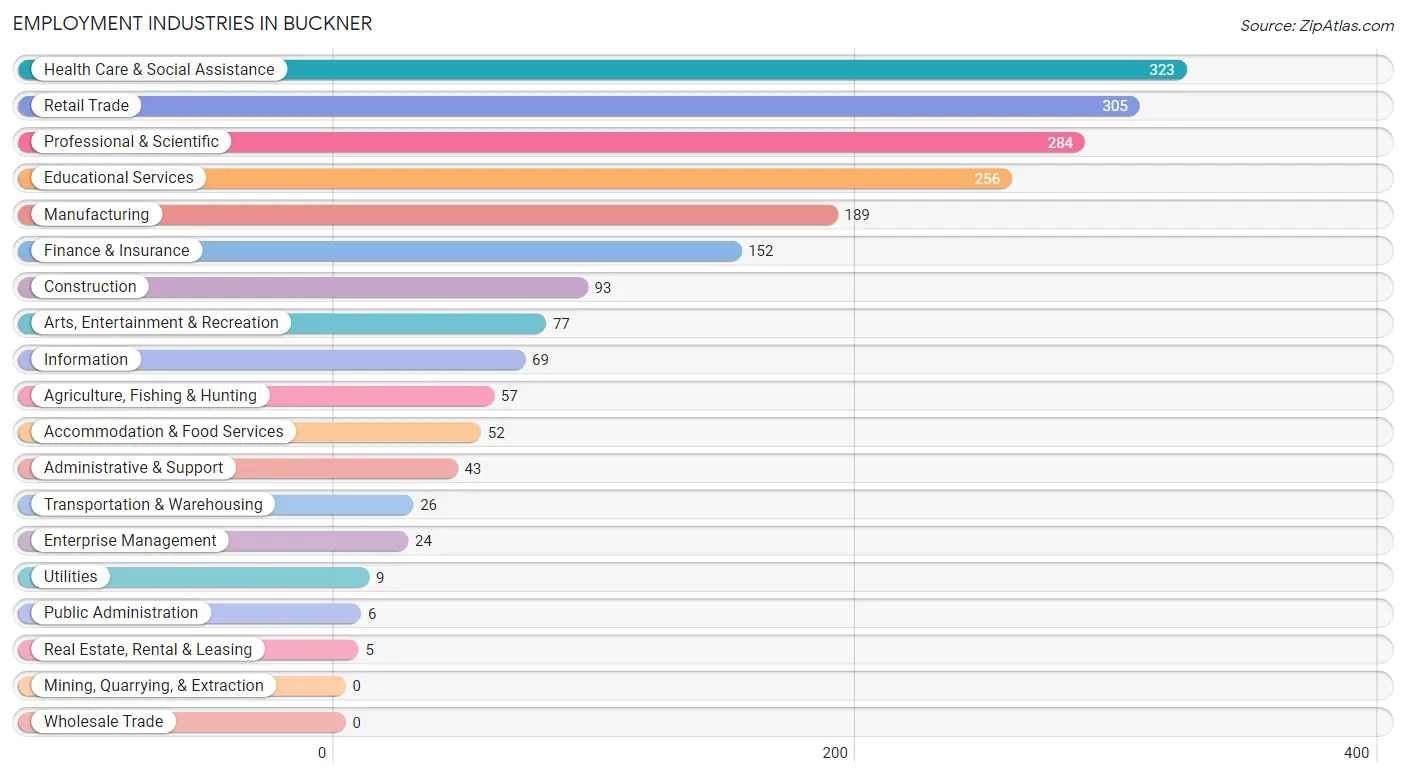
Employment Industries in Buckner
The major employment industries in Buckner include Health Care & Social Assistance (323 | 15.7%), Retail Trade (305 | 14.9%), Professional & Scientific (284 | 13.8%), Educational Services (256 | 12.5%), and Manufacturing (189 | 9.2%).
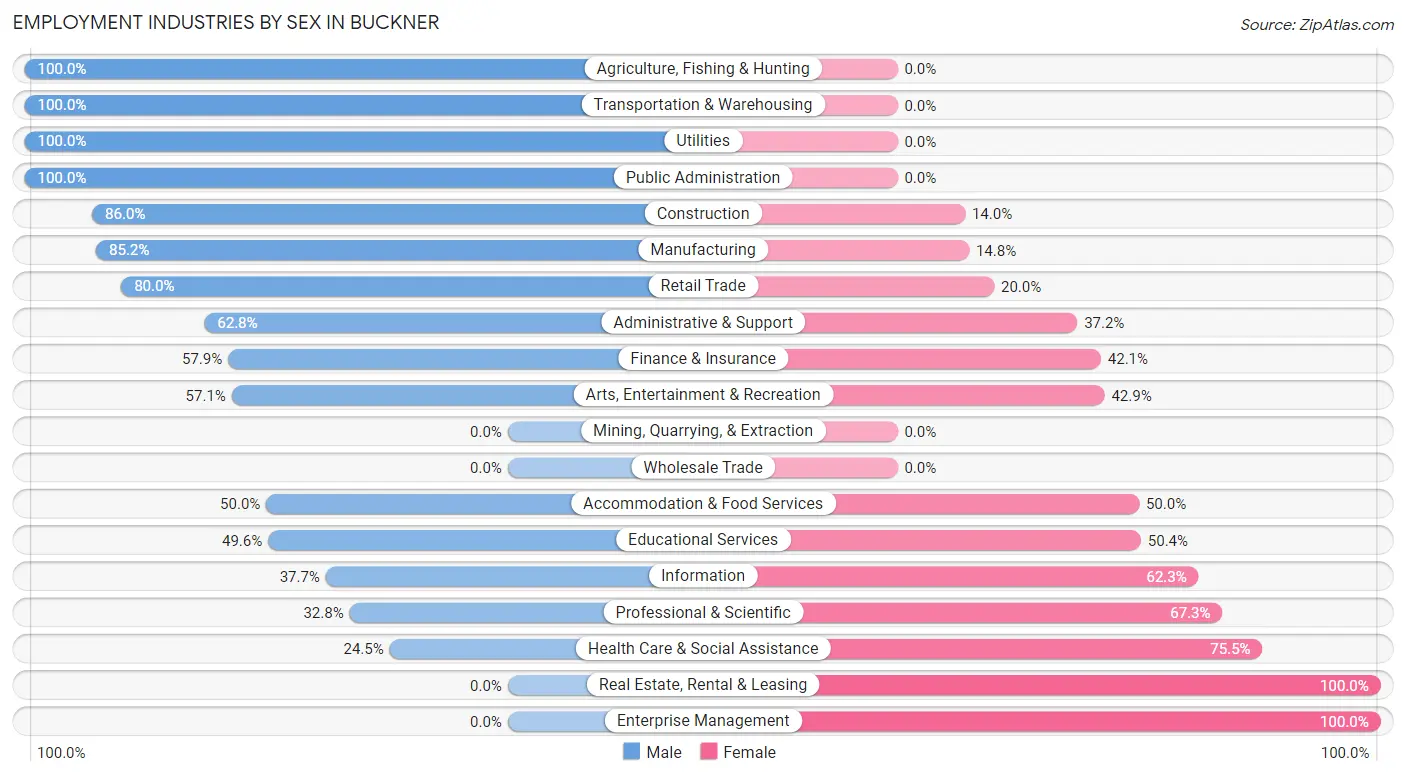
Employment Industries by Sex in Buckner
The Buckner industries that see more men than women are Agriculture, Fishing & Hunting (100.0%), Transportation & Warehousing (100.0%), and Utilities (100.0%), whereas the industries that tend to have a higher number of women are Real Estate, Rental & Leasing (100.0%), Enterprise Management (100.0%), and Health Care & Social Assistance (75.5%).
| Industry | Male | Female |
| Agriculture, Fishing & Hunting | 57 (100.0%) | 0 (0.0%) |
| Mining, Quarrying, & Extraction | 0 (0.0%) | 0 (0.0%) |
| Construction | 80 (86.0%) | 13 (14.0%) |
| Manufacturing | 161 (85.2%) | 28 (14.8%) |
| Wholesale Trade | 0 (0.0%) | 0 (0.0%) |
| Retail Trade | 244 (80.0%) | 61 (20.0%) |
| Transportation & Warehousing | 26 (100.0%) | 0 (0.0%) |
| Utilities | 9 (100.0%) | 0 (0.0%) |
| Information | 26 (37.7%) | 43 (62.3%) |
| Finance & Insurance | 88 (57.9%) | 64 (42.1%) |
| Real Estate, Rental & Leasing | 0 (0.0%) | 5 (100.0%) |
| Professional & Scientific | 93 (32.8%) | 191 (67.2%) |
| Enterprise Management | 0 (0.0%) | 24 (100.0%) |
| Administrative & Support | 27 (62.8%) | 16 (37.2%) |
| Educational Services | 127 (49.6%) | 129 (50.4%) |
| Health Care & Social Assistance | 79 (24.5%) | 244 (75.5%) |
| Arts, Entertainment & Recreation | 44 (57.1%) | 33 (42.9%) |
| Accommodation & Food Services | 26 (50.0%) | 26 (50.0%) |
| Public Administration | 6 (100.0%) | 0 (0.0%) |
| Total | 1,159 (56.5%) | 893 (43.5%) |
Education in Buckner
School Enrollment in Buckner
The most common levels of schooling among the 1,095 students in Buckner are high school (341 | 31.1%), middle school (248 | 22.7%), and college / undergraduate (183 | 16.7%).
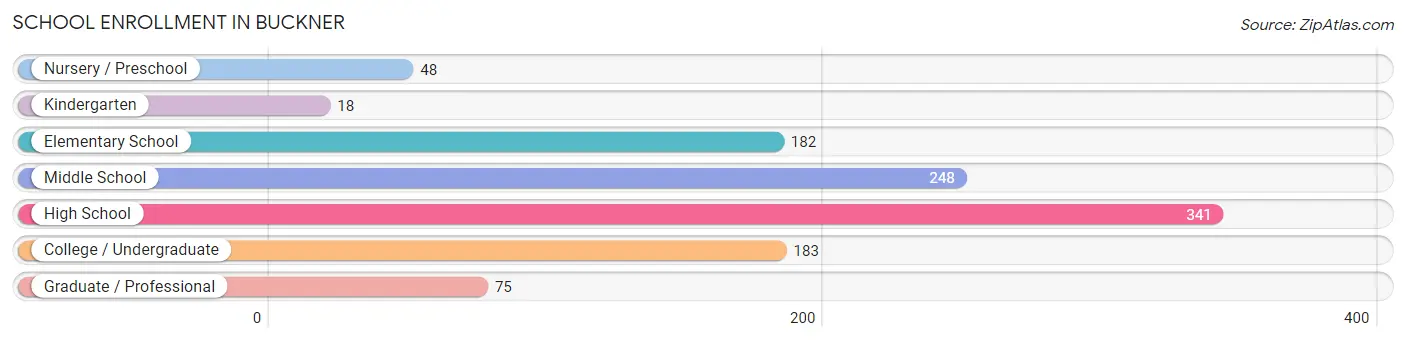
| School Level | # Students | % Students |
| Nursery / Preschool | 48 | 4.4% |
| Kindergarten | 18 | 1.6% |
| Elementary School | 182 | 16.6% |
| Middle School | 248 | 22.7% |
| High School | 341 | 31.1% |
| College / Undergraduate | 183 | 16.7% |
| Graduate / Professional | 75 | 6.9% |
| Total | 1,095 | 100.0% |
School Enrollment by Age by Funding Source in Buckner
Out of a total of 1,095 students who are enrolled in schools in Buckner, 164 (15.0%) attend a private institution, while the remaining 931 (85.0%) are enrolled in public schools. The age group of 3 to 4 year olds has the highest likelihood of being enrolled in private schools, with 13 (43.3% in the age bracket) enrolled. Conversely, the age group of 18 to 19 year olds has the lowest likelihood of being enrolled in a private school, with 131 (100.0% in the age bracket) attending a public institution.
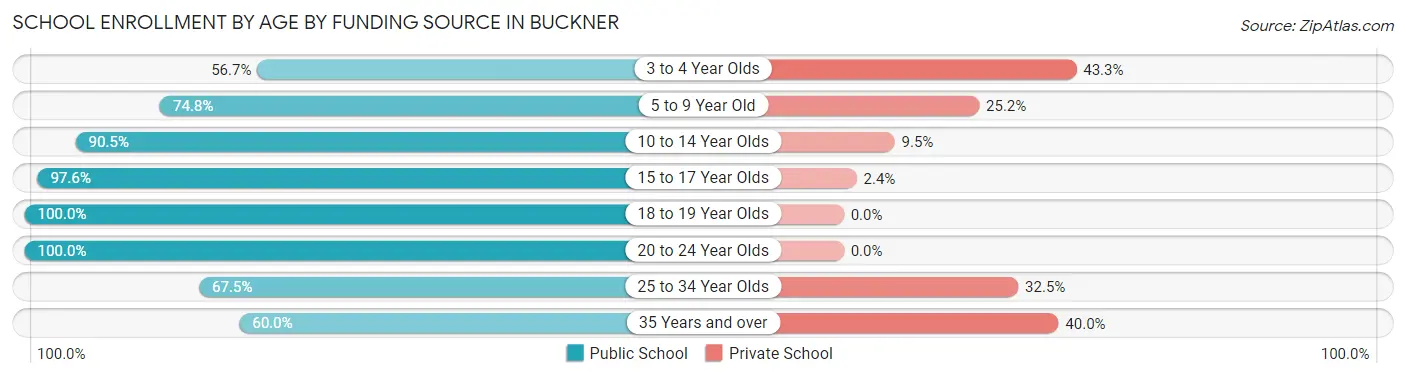
| Age Bracket | Public School | Private School |
| 3 to 4 Year Olds | 17 (56.7%) | 13 (43.3%) |
| 5 to 9 Year Old | 163 (74.8%) | 55 (25.2%) |
| 10 to 14 Year Olds | 229 (90.5%) | 24 (9.5%) |
| 15 to 17 Year Olds | 243 (97.6%) | 6 (2.4%) |
| 18 to 19 Year Olds | 131 (100.0%) | 0 (0.0%) |
| 20 to 24 Year Olds | 34 (100.0%) | 0 (0.0%) |
| 25 to 34 Year Olds | 54 (67.5%) | 26 (32.5%) |
| 35 Years and over | 60 (60.0%) | 40 (40.0%) |
| Total | 931 (85.0%) | 164 (15.0%) |
Educational Attainment by Field of Study in Buckner
Business (421 | 27.9%), education (207 | 13.7%), social sciences (172 | 11.4%), science & technology (161 | 10.7%), and arts & humanities (94 | 6.2%) are the most common fields of study among 1,510 individuals in Buckner who have obtained a bachelor's degree or higher.
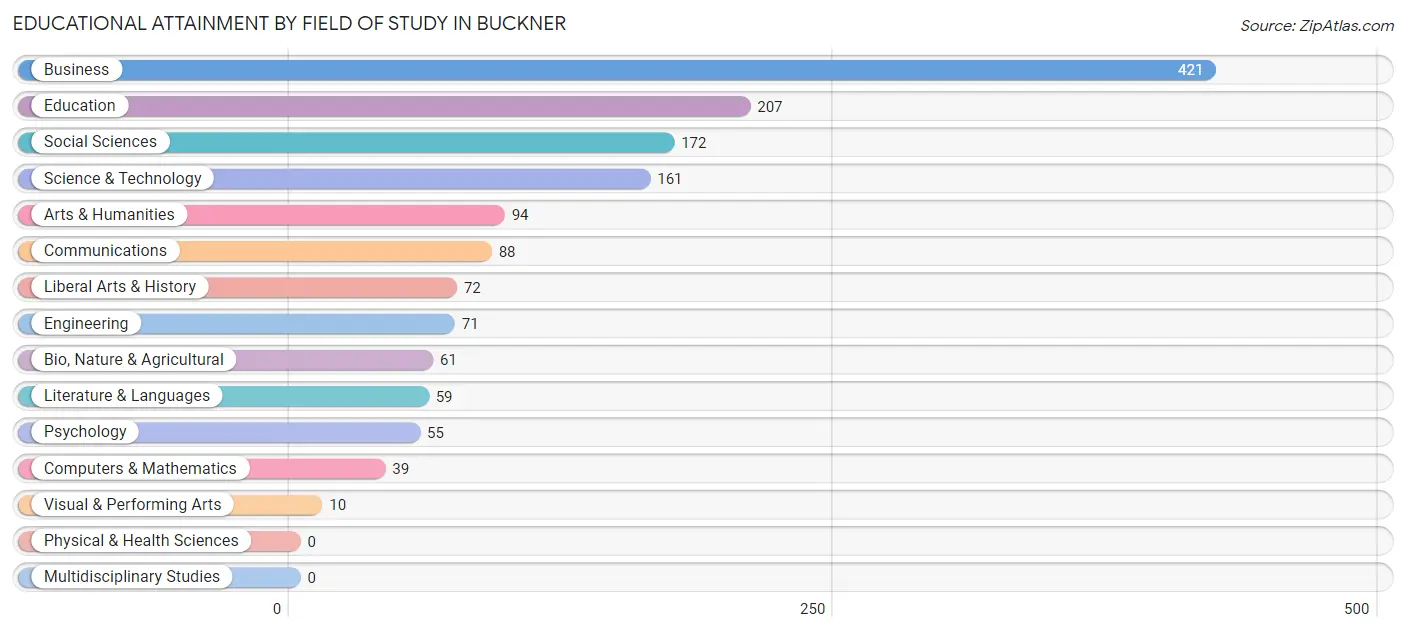
| Field of Study | # Graduates | % Graduates |
| Computers & Mathematics | 39 | 2.6% |
| Bio, Nature & Agricultural | 61 | 4.0% |
| Physical & Health Sciences | 0 | 0.0% |
| Psychology | 55 | 3.6% |
| Social Sciences | 172 | 11.4% |
| Engineering | 71 | 4.7% |
| Multidisciplinary Studies | 0 | 0.0% |
| Science & Technology | 161 | 10.7% |
| Business | 421 | 27.9% |
| Education | 207 | 13.7% |
| Literature & Languages | 59 | 3.9% |
| Liberal Arts & History | 72 | 4.8% |
| Visual & Performing Arts | 10 | 0.7% |
| Communications | 88 | 5.8% |
| Arts & Humanities | 94 | 6.2% |
| Total | 1,510 | 100.0% |
Transportation & Commute in Buckner
Vehicle Availability by Sex in Buckner
The most prevalent vehicle ownership categories in Buckner are males with 2 vehicles (482, accounting for 41.6%) and females with 2 vehicles (409, making up 55.8%).
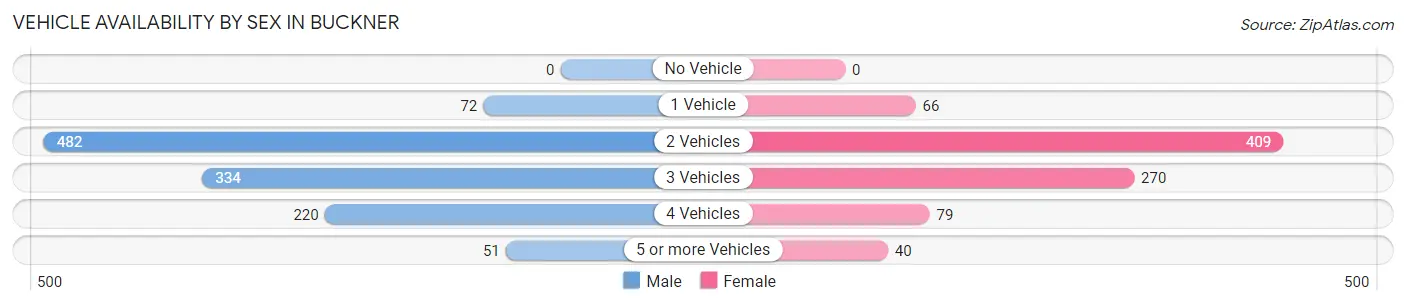
| Vehicles Available | Male | Female |
| No Vehicle | 0 (0.0%) | 0 (0.0%) |
| 1 Vehicle | 72 (6.2%) | 66 (7.6%) |
| 2 Vehicles | 482 (41.6%) | 409 (47.3%) |
| 3 Vehicles | 334 (28.8%) | 270 (31.2%) |
| 4 Vehicles | 220 (19.0%) | 79 (9.1%) |
| 5 or more Vehicles | 51 (4.4%) | 40 (4.6%) |
| Total | 1,159 (100.0%) | 864 (100.0%) |
Commute Time in Buckner
The most frequently occuring commute durations in Buckner are 30 to 34 minutes (292 commuters, 17.0%), less than 5 minutes (248 commuters, 14.4%), and 10 to 14 minutes (225 commuters, 13.1%).
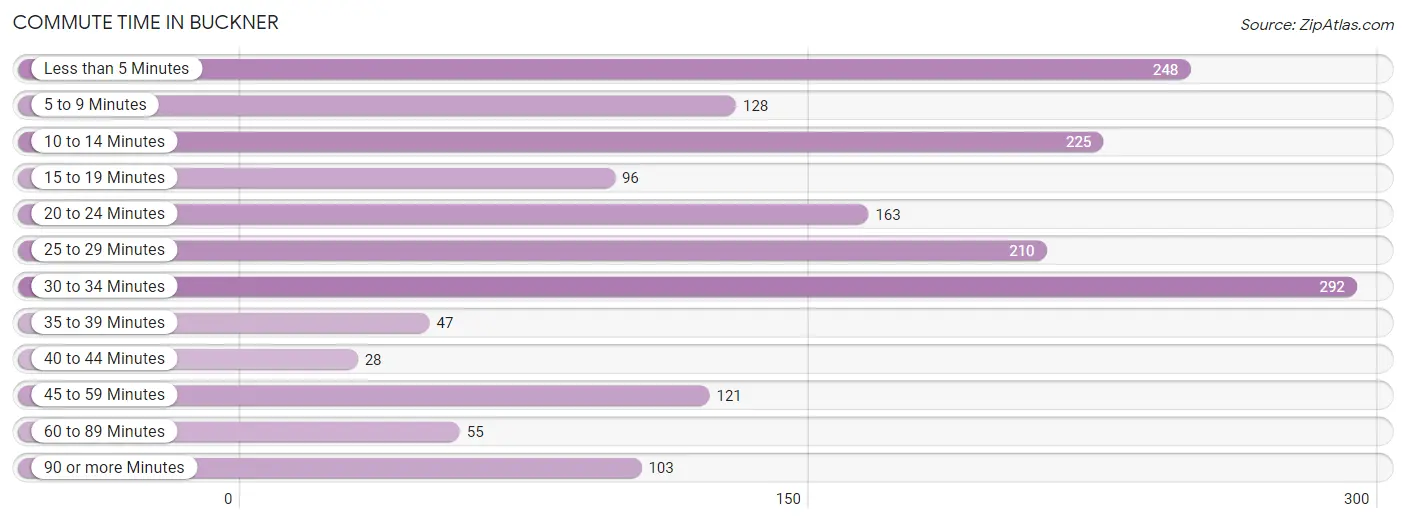
| Commute Time | # Commuters | % Commuters |
| Less than 5 Minutes | 248 | 14.4% |
| 5 to 9 Minutes | 128 | 7.5% |
| 10 to 14 Minutes | 225 | 13.1% |
| 15 to 19 Minutes | 96 | 5.6% |
| 20 to 24 Minutes | 163 | 9.5% |
| 25 to 29 Minutes | 210 | 12.2% |
| 30 to 34 Minutes | 292 | 17.0% |
| 35 to 39 Minutes | 47 | 2.7% |
| 40 to 44 Minutes | 28 | 1.6% |
| 45 to 59 Minutes | 121 | 7.0% |
| 60 to 89 Minutes | 55 | 3.2% |
| 90 or more Minutes | 103 | 6.0% |
Commute Time by Sex in Buckner
The most common commute times in Buckner are 30 to 34 minutes (212 commuters, 21.3%) for males and 10 to 14 minutes (152 commuters, 21.0%) for females.
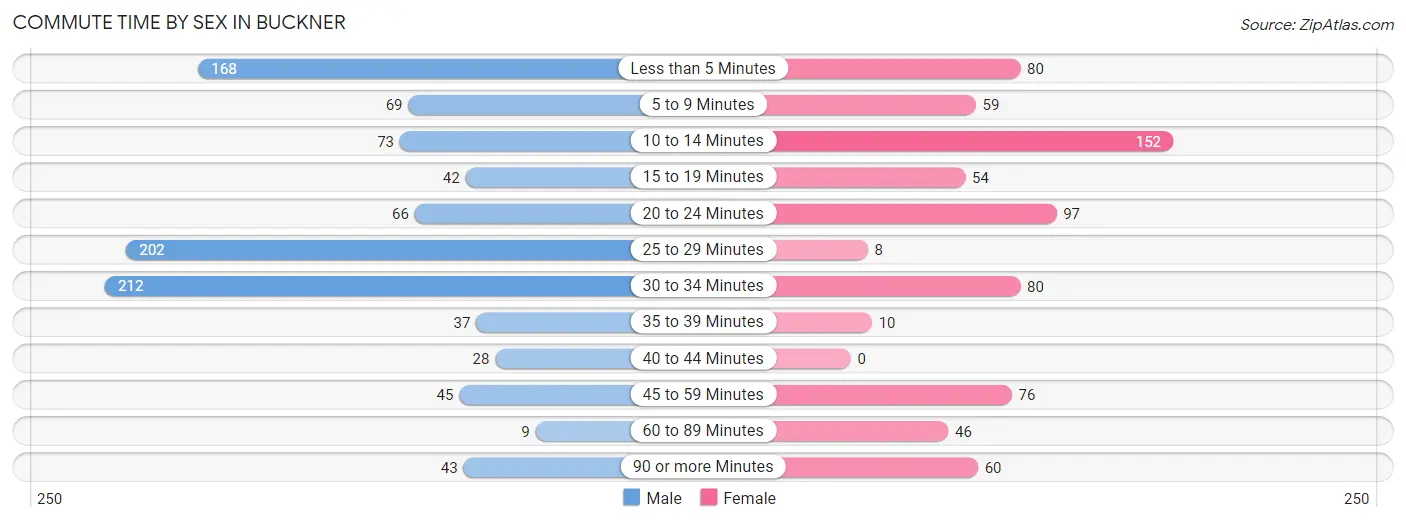
| Commute Time | Male | Female |
| Less than 5 Minutes | 168 (16.9%) | 80 (11.1%) |
| 5 to 9 Minutes | 69 (6.9%) | 59 (8.2%) |
| 10 to 14 Minutes | 73 (7.3%) | 152 (21.0%) |
| 15 to 19 Minutes | 42 (4.2%) | 54 (7.5%) |
| 20 to 24 Minutes | 66 (6.6%) | 97 (13.4%) |
| 25 to 29 Minutes | 202 (20.3%) | 8 (1.1%) |
| 30 to 34 Minutes | 212 (21.3%) | 80 (11.1%) |
| 35 to 39 Minutes | 37 (3.7%) | 10 (1.4%) |
| 40 to 44 Minutes | 28 (2.8%) | 0 (0.0%) |
| 45 to 59 Minutes | 45 (4.5%) | 76 (10.5%) |
| 60 to 89 Minutes | 9 (0.9%) | 46 (6.4%) |
| 90 or more Minutes | 43 (4.3%) | 60 (8.3%) |
Time of Departure to Work by Sex in Buckner
The most frequent times of departure to work in Buckner are 7:30 AM to 7:59 AM (247, 24.8%) for males and 7:00 AM to 7:29 AM (229, 31.7%) for females.
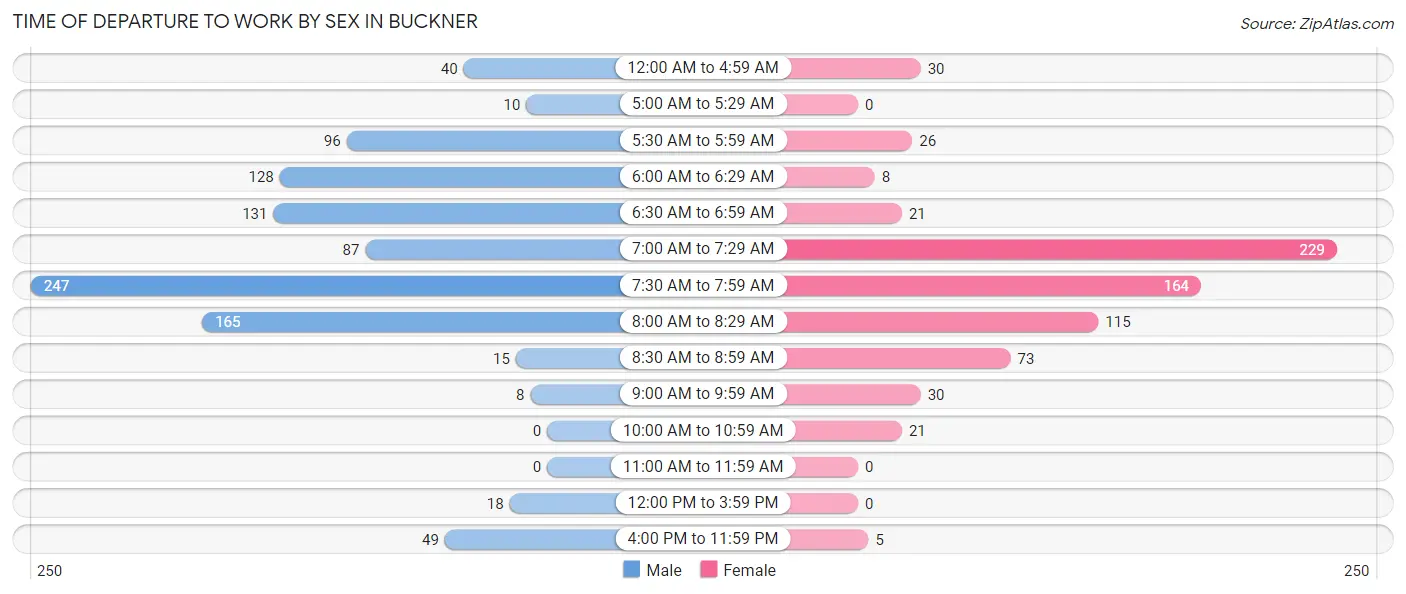
| Time of Departure | Male | Female |
| 12:00 AM to 4:59 AM | 40 (4.0%) | 30 (4.2%) |
| 5:00 AM to 5:29 AM | 10 (1.0%) | 0 (0.0%) |
| 5:30 AM to 5:59 AM | 96 (9.7%) | 26 (3.6%) |
| 6:00 AM to 6:29 AM | 128 (12.9%) | 8 (1.1%) |
| 6:30 AM to 6:59 AM | 131 (13.2%) | 21 (2.9%) |
| 7:00 AM to 7:29 AM | 87 (8.7%) | 229 (31.7%) |
| 7:30 AM to 7:59 AM | 247 (24.8%) | 164 (22.7%) |
| 8:00 AM to 8:29 AM | 165 (16.6%) | 115 (15.9%) |
| 8:30 AM to 8:59 AM | 15 (1.5%) | 73 (10.1%) |
| 9:00 AM to 9:59 AM | 8 (0.8%) | 30 (4.2%) |
| 10:00 AM to 10:59 AM | 0 (0.0%) | 21 (2.9%) |
| 11:00 AM to 11:59 AM | 0 (0.0%) | 0 (0.0%) |
| 12:00 PM to 3:59 PM | 18 (1.8%) | 0 (0.0%) |
| 4:00 PM to 11:59 PM | 49 (4.9%) | 5 (0.7%) |
| Total | 994 (100.0%) | 722 (100.0%) |
Housing Occupancy in Buckner
Occupancy by Ownership in Buckner
Of the total 1,136 dwellings in Buckner, owner-occupied units account for 1,069 (94.1%), while renter-occupied units make up 67 (5.9%).
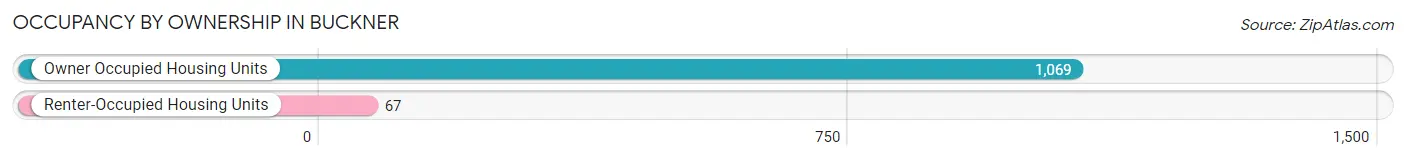
| Occupancy | # Housing Units | % Housing Units |
| Owner Occupied Housing Units | 1,069 | 94.1% |
| Renter-Occupied Housing Units | 67 | 5.9% |
| Total Occupied Housing Units | 1,136 | 100.0% |
Occupancy by Household Size in Buckner
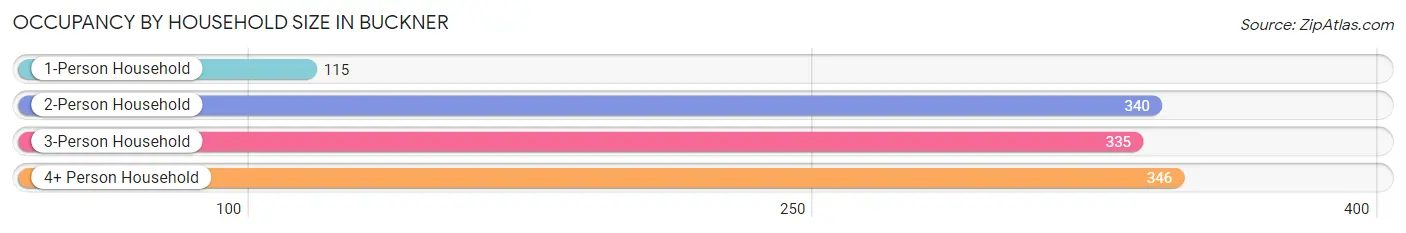
| Household Size | # Housing Units | % Housing Units |
| 1-Person Household | 115 | 10.1% |
| 2-Person Household | 340 | 29.9% |
| 3-Person Household | 335 | 29.5% |
| 4+ Person Household | 346 | 30.5% |
| Total Housing Units | 1,136 | 100.0% |
Occupancy by Ownership by Household Size in Buckner
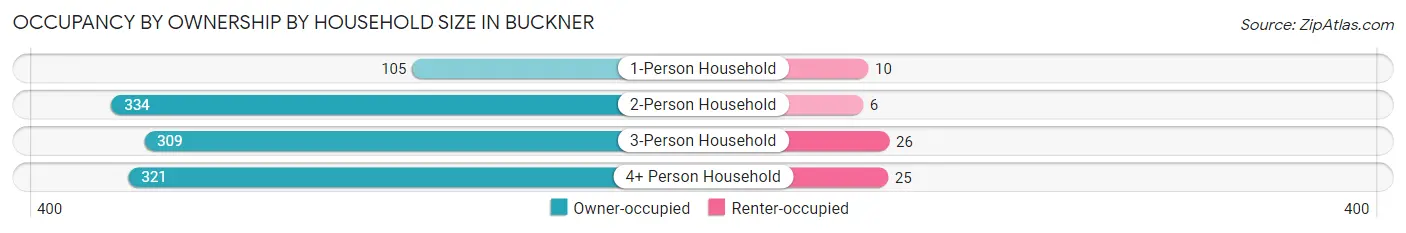
| Household Size | Owner-occupied | Renter-occupied |
| 1-Person Household | 105 (91.3%) | 10 (8.7%) |
| 2-Person Household | 334 (98.2%) | 6 (1.8%) |
| 3-Person Household | 309 (92.2%) | 26 (7.8%) |
| 4+ Person Household | 321 (92.8%) | 25 (7.2%) |
| Total Housing Units | 1,069 (94.1%) | 67 (5.9%) |
Occupancy by Educational Attainment in Buckner
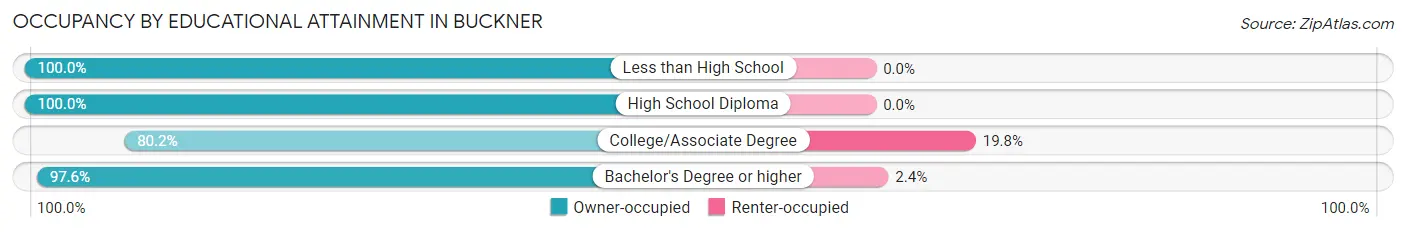
| Household Size | Owner-occupied | Renter-occupied |
| Less than High School | 25 (100.0%) | 0 (0.0%) |
| High School Diploma | 123 (100.0%) | 0 (0.0%) |
| College/Associate Degree | 199 (80.2%) | 49 (19.8%) |
| Bachelor's Degree or higher | 722 (97.6%) | 18 (2.4%) |
Occupancy by Age of Householder in Buckner
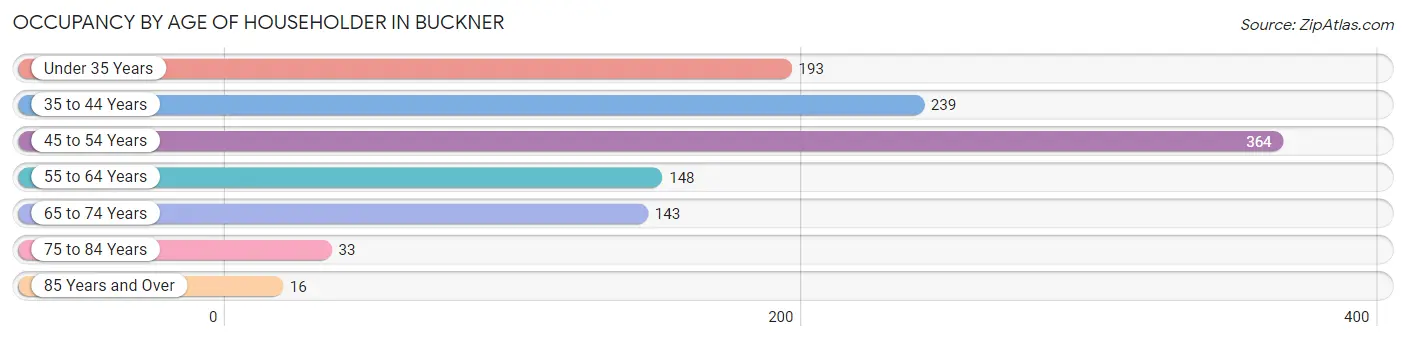
| Age Bracket | # Households | % Households |
| Under 35 Years | 193 | 17.0% |
| 35 to 44 Years | 239 | 21.0% |
| 45 to 54 Years | 364 | 32.0% |
| 55 to 64 Years | 148 | 13.0% |
| 65 to 74 Years | 143 | 12.6% |
| 75 to 84 Years | 33 | 2.9% |
| 85 Years and Over | 16 | 1.4% |
| Total | 1,136 | 100.0% |
Housing Finances in Buckner
Median Income by Occupancy in Buckner
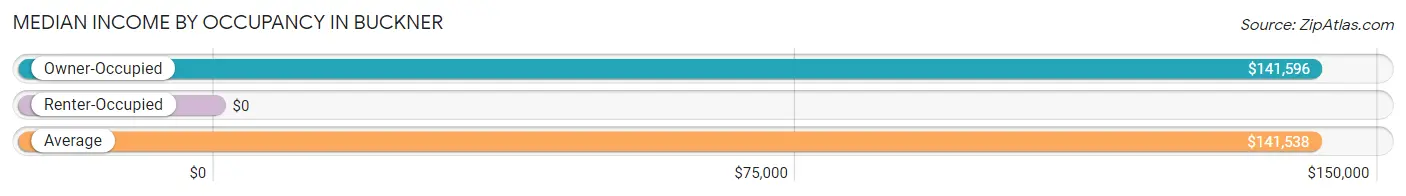
| Occupancy Type | # Households | Median Income |
| Owner-Occupied | 1,069 (94.1%) | $141,596 |
| Renter-Occupied | 67 (5.9%) | $0 |
| Average | 1,136 (100.0%) | $141,538 |
Occupancy by Householder Income Bracket in Buckner
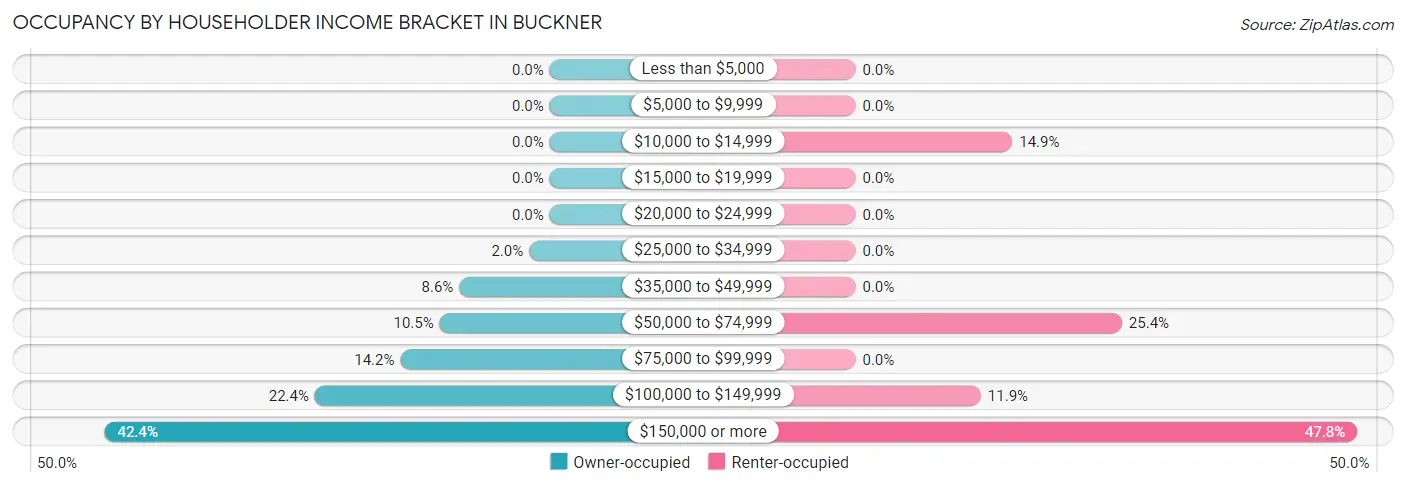
| Income Bracket | Owner-occupied | Renter-occupied |
| Less than $5,000 | 0 (0.0%) | 0 (0.0%) |
| $5,000 to $9,999 | 0 (0.0%) | 0 (0.0%) |
| $10,000 to $14,999 | 0 (0.0%) | 10 (14.9%) |
| $15,000 to $19,999 | 0 (0.0%) | 0 (0.0%) |
| $20,000 to $24,999 | 0 (0.0%) | 0 (0.0%) |
| $25,000 to $34,999 | 21 (2.0%) | 0 (0.0%) |
| $35,000 to $49,999 | 92 (8.6%) | 0 (0.0%) |
| $50,000 to $74,999 | 112 (10.5%) | 17 (25.4%) |
| $75,000 to $99,999 | 152 (14.2%) | 0 (0.0%) |
| $100,000 to $149,999 | 239 (22.4%) | 8 (11.9%) |
| $150,000 or more | 453 (42.4%) | 32 (47.8%) |
| Total | 1,069 (100.0%) | 67 (100.0%) |
Monthly Housing Cost Tiers in Buckner
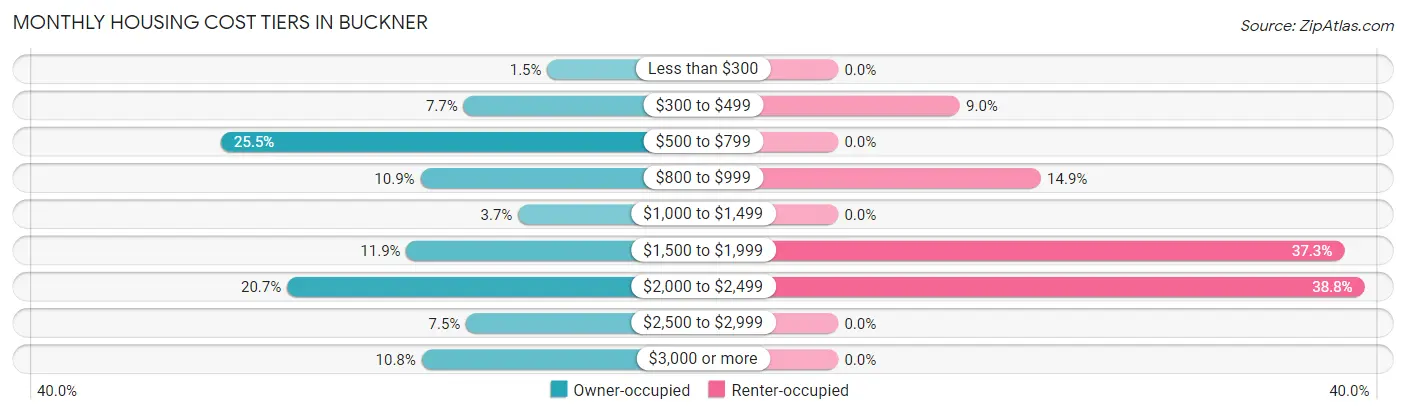
| Monthly Cost | Owner-occupied | Renter-occupied |
| Less than $300 | 16 (1.5%) | 0 (0.0%) |
| $300 to $499 | 82 (7.7%) | 6 (9.0%) |
| $500 to $799 | 273 (25.5%) | 0 (0.0%) |
| $800 to $999 | 116 (10.8%) | 10 (14.9%) |
| $1,000 to $1,499 | 39 (3.6%) | 0 (0.0%) |
| $1,500 to $1,999 | 127 (11.9%) | 25 (37.3%) |
| $2,000 to $2,499 | 221 (20.7%) | 26 (38.8%) |
| $2,500 to $2,999 | 80 (7.5%) | 0 (0.0%) |
| $3,000 or more | 115 (10.8%) | 0 (0.0%) |
| Total | 1,069 (100.0%) | 67 (100.0%) |
Physical Housing Characteristics in Buckner
Housing Structures in Buckner
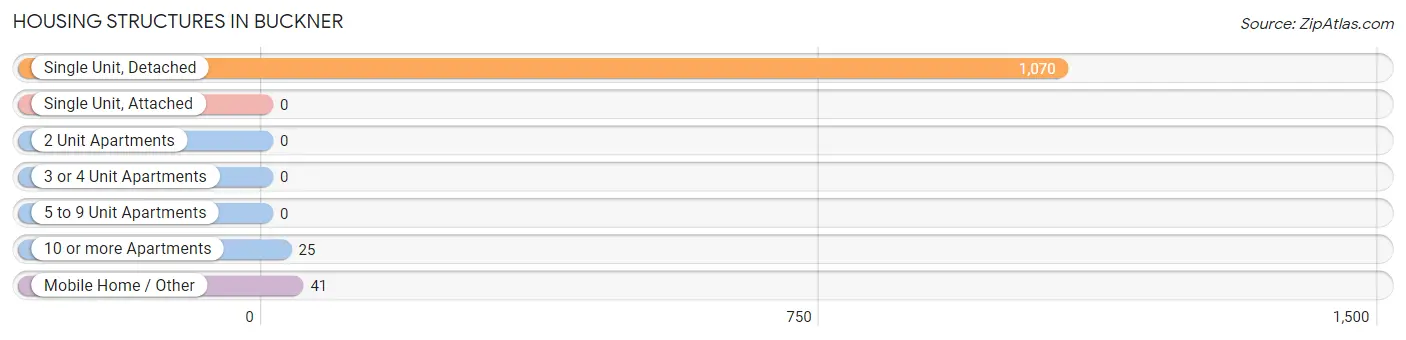
| Structure Type | # Housing Units | % Housing Units |
| Single Unit, Detached | 1,070 | 94.2% |
| Single Unit, Attached | 0 | 0.0% |
| 2 Unit Apartments | 0 | 0.0% |
| 3 or 4 Unit Apartments | 0 | 0.0% |
| 5 to 9 Unit Apartments | 0 | 0.0% |
| 10 or more Apartments | 25 | 2.2% |
| Mobile Home / Other | 41 | 3.6% |
| Total | 1,136 | 100.0% |
Housing Structures by Occupancy in Buckner
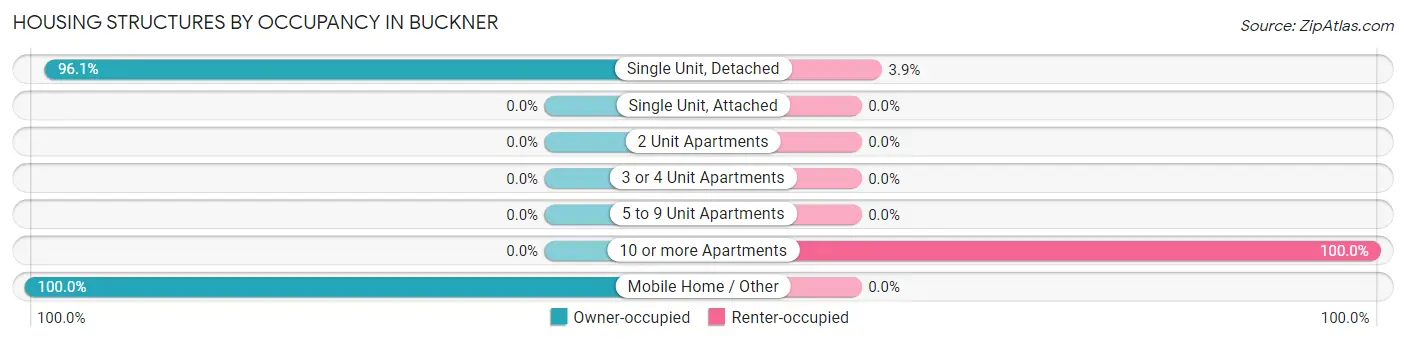
| Structure Type | Owner-occupied | Renter-occupied |
| Single Unit, Detached | 1,028 (96.1%) | 42 (3.9%) |
| Single Unit, Attached | 0 (0.0%) | 0 (0.0%) |
| 2 Unit Apartments | 0 (0.0%) | 0 (0.0%) |
| 3 or 4 Unit Apartments | 0 (0.0%) | 0 (0.0%) |
| 5 to 9 Unit Apartments | 0 (0.0%) | 0 (0.0%) |
| 10 or more Apartments | 0 (0.0%) | 25 (100.0%) |
| Mobile Home / Other | 41 (100.0%) | 0 (0.0%) |
| Total | 1,069 (94.1%) | 67 (5.9%) |
Housing Structures by Number of Rooms in Buckner
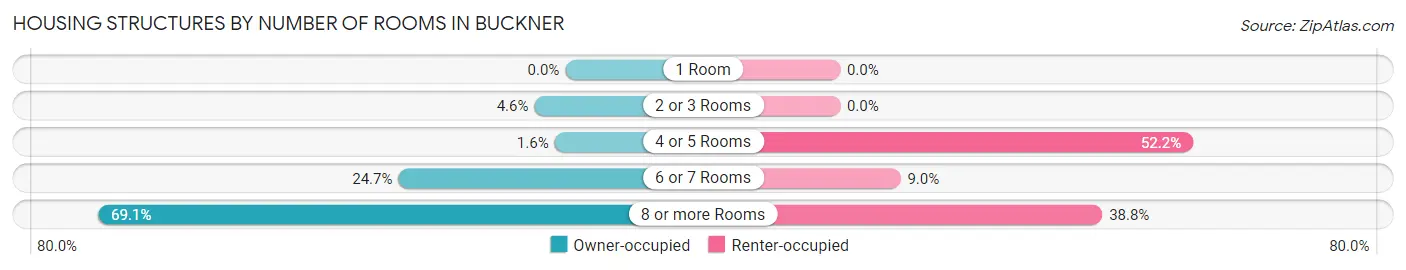
| Number of Rooms | Owner-occupied | Renter-occupied |
| 1 Room | 0 (0.0%) | 0 (0.0%) |
| 2 or 3 Rooms | 49 (4.6%) | 0 (0.0%) |
| 4 or 5 Rooms | 17 (1.6%) | 35 (52.2%) |
| 6 or 7 Rooms | 264 (24.7%) | 6 (9.0%) |
| 8 or more Rooms | 739 (69.1%) | 26 (38.8%) |
| Total | 1,069 (100.0%) | 67 (100.0%) |
Housing Structure by Heating Type in Buckner
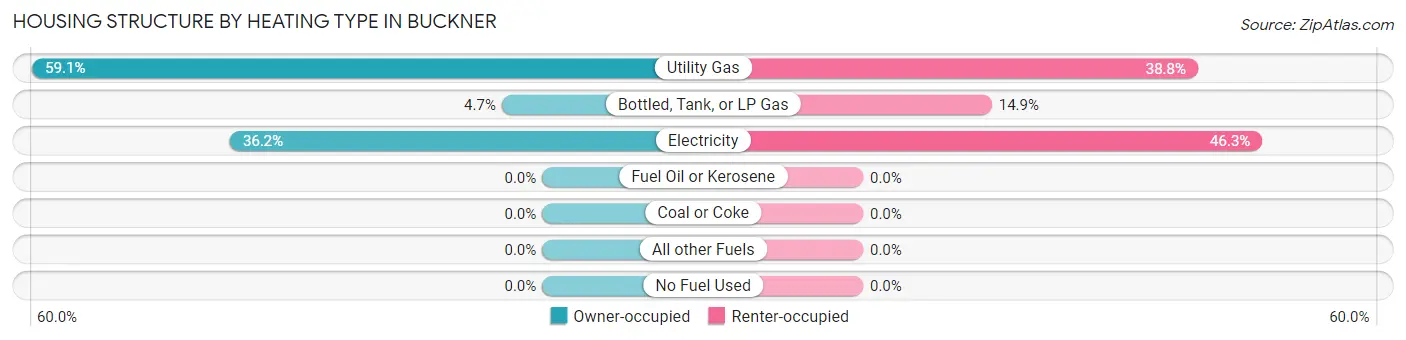
| Heating Type | Owner-occupied | Renter-occupied |
| Utility Gas | 632 (59.1%) | 26 (38.8%) |
| Bottled, Tank, or LP Gas | 50 (4.7%) | 10 (14.9%) |
| Electricity | 387 (36.2%) | 31 (46.3%) |
| Fuel Oil or Kerosene | 0 (0.0%) | 0 (0.0%) |
| Coal or Coke | 0 (0.0%) | 0 (0.0%) |
| All other Fuels | 0 (0.0%) | 0 (0.0%) |
| No Fuel Used | 0 (0.0%) | 0 (0.0%) |
| Total | 1,069 (100.0%) | 67 (100.0%) |
Household Vehicle Usage in Buckner
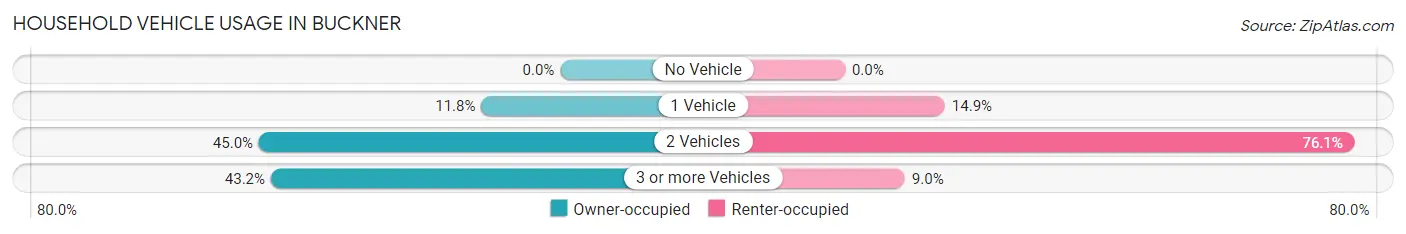
| Vehicles per Household | Owner-occupied | Renter-occupied |
| No Vehicle | 0 (0.0%) | 0 (0.0%) |
| 1 Vehicle | 126 (11.8%) | 10 (14.9%) |
| 2 Vehicles | 481 (45.0%) | 51 (76.1%) |
| 3 or more Vehicles | 462 (43.2%) | 6 (9.0%) |
| Total | 1,069 (100.0%) | 67 (100.0%) |
Real Estate & Mortgages in Buckner
Real Estate and Mortgage Overview in Buckner
| Characteristic | Without Mortgage | With Mortgage |
| Housing Units | 405 | 664 |
| Median Property Value | $312,500 | $373,100 |
| Median Household Income | $91,779 | $331 |
| Monthly Housing Costs | $642 | $115 |
| Real Estate Taxes | $2,847 | $0 |
Property Value by Mortgage Status in Buckner
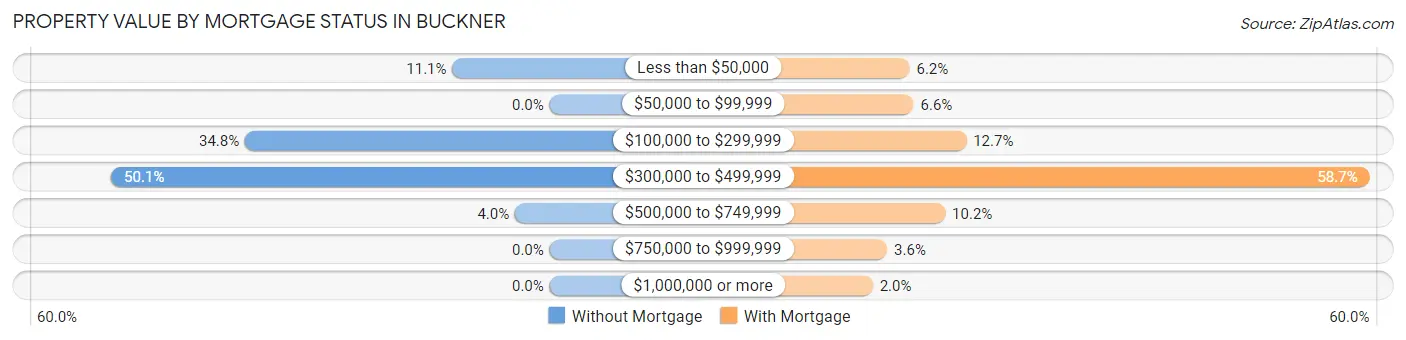
| Property Value | Without Mortgage | With Mortgage |
| Less than $50,000 | 45 (11.1%) | 41 (6.2%) |
| $50,000 to $99,999 | 0 (0.0%) | 44 (6.6%) |
| $100,000 to $299,999 | 141 (34.8%) | 84 (12.7%) |
| $300,000 to $499,999 | 203 (50.1%) | 390 (58.7%) |
| $500,000 to $749,999 | 16 (4.0%) | 68 (10.2%) |
| $750,000 to $999,999 | 0 (0.0%) | 24 (3.6%) |
| $1,000,000 or more | 0 (0.0%) | 13 (2.0%) |
| Total | 405 (100.0%) | 664 (100.0%) |
Household Income by Mortgage Status in Buckner
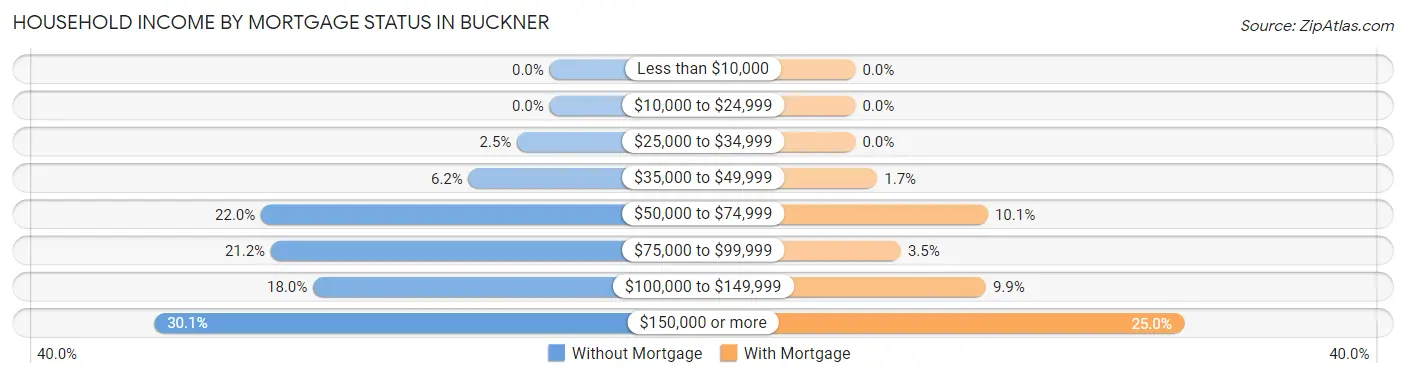
| Household Income | Without Mortgage | With Mortgage |
| Less than $10,000 | 0 (0.0%) | 0 (0.0%) |
| $10,000 to $24,999 | 0 (0.0%) | 0 (0.0%) |
| $25,000 to $34,999 | 10 (2.5%) | 0 (0.0%) |
| $35,000 to $49,999 | 25 (6.2%) | 11 (1.7%) |
| $50,000 to $74,999 | 89 (22.0%) | 67 (10.1%) |
| $75,000 to $99,999 | 86 (21.2%) | 23 (3.5%) |
| $100,000 to $149,999 | 73 (18.0%) | 66 (9.9%) |
| $150,000 or more | 122 (30.1%) | 166 (25.0%) |
| Total | 405 (100.0%) | 664 (100.0%) |
Property Value to Household Income Ratio in Buckner
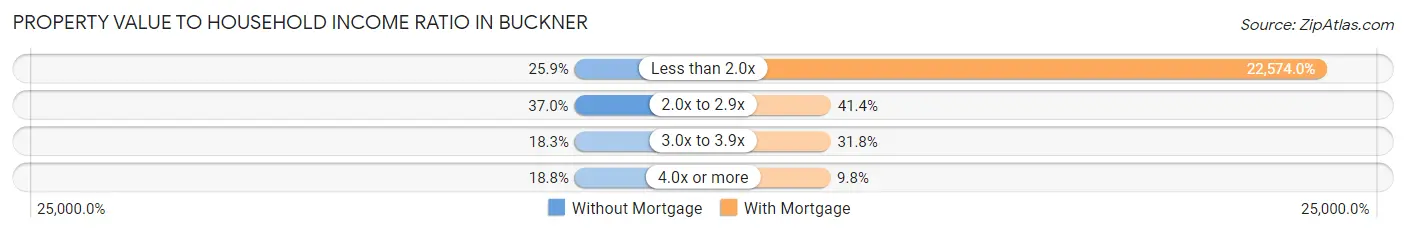
| Value-to-Income Ratio | Without Mortgage | With Mortgage |
| Less than 2.0x | 105 (25.9%) | 149,891 (22,573.9%) |
| 2.0x to 2.9x | 150 (37.0%) | 275 (41.4%) |
| 3.0x to 3.9x | 74 (18.3%) | 211 (31.8%) |
| 4.0x or more | 76 (18.8%) | 65 (9.8%) |
| Total | 405 (100.0%) | 664 (100.0%) |
Real Estate Taxes by Mortgage Status in Buckner
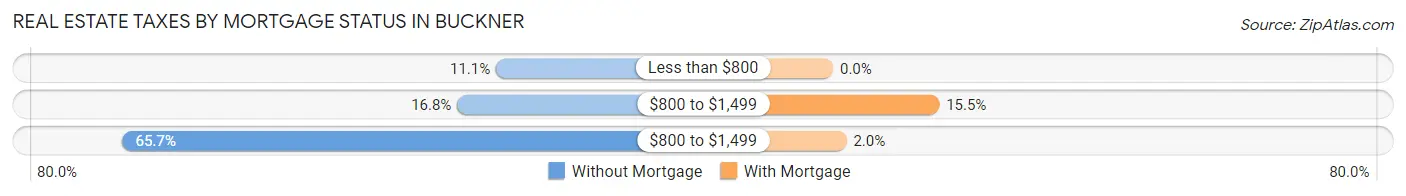
| Property Taxes | Without Mortgage | With Mortgage |
| Less than $800 | 45 (11.1%) | 0 (0.0%) |
| $800 to $1,499 | 68 (16.8%) | 103 (15.5%) |
| $800 to $1,499 | 266 (65.7%) | 13 (2.0%) |
| Total | 405 (100.0%) | 664 (100.0%) |
Health & Disability in Buckner
Health Insurance Coverage by Age in Buckner
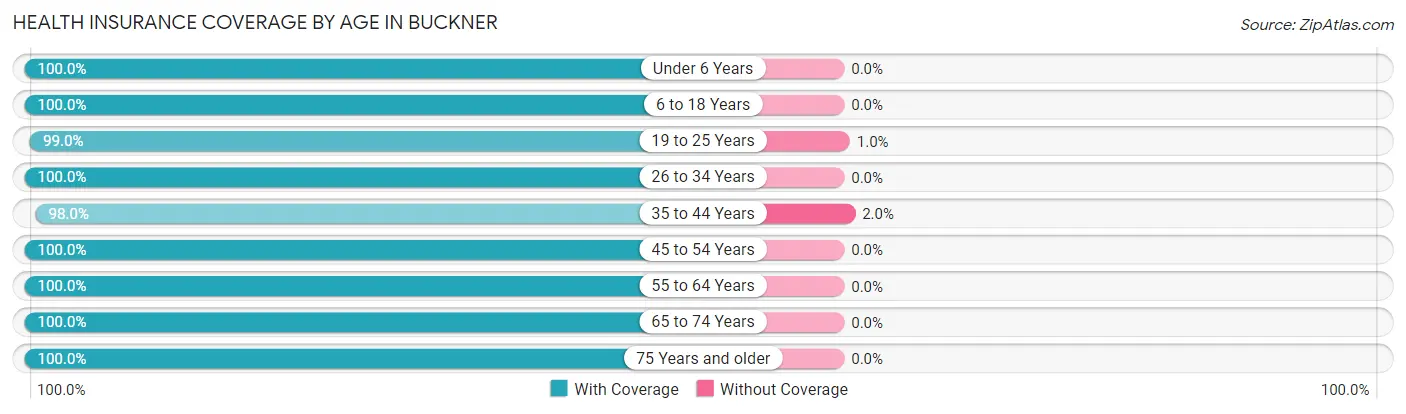
| Age Bracket | With Coverage | Without Coverage |
| Under 6 Years | 248 (100.0%) | 0 (0.0%) |
| 6 to 18 Years | 746 (100.0%) | 0 (0.0%) |
| 19 to 25 Years | 190 (99.0%) | 2 (1.0%) |
| 26 to 34 Years | 325 (100.0%) | 0 (0.0%) |
| 35 to 44 Years | 481 (98.0%) | 10 (2.0%) |
| 45 to 54 Years | 653 (100.0%) | 0 (0.0%) |
| 55 to 64 Years | 263 (100.0%) | 0 (0.0%) |
| 65 to 74 Years | 329 (100.0%) | 0 (0.0%) |
| 75 Years and older | 112 (100.0%) | 0 (0.0%) |
| Total | 3,347 (99.6%) | 12 (0.4%) |
Health Insurance Coverage by Citizenship Status in Buckner
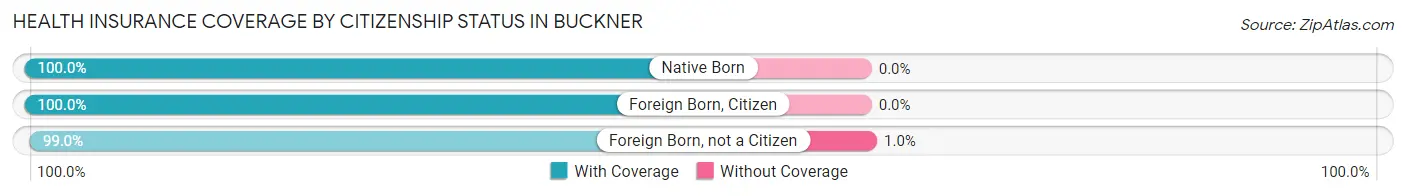
| Citizenship Status | With Coverage | Without Coverage |
| Native Born | 248 (100.0%) | 0 (0.0%) |
| Foreign Born, Citizen | 746 (100.0%) | 0 (0.0%) |
| Foreign Born, not a Citizen | 190 (99.0%) | 2 (1.0%) |
Health Insurance Coverage by Household Income in Buckner
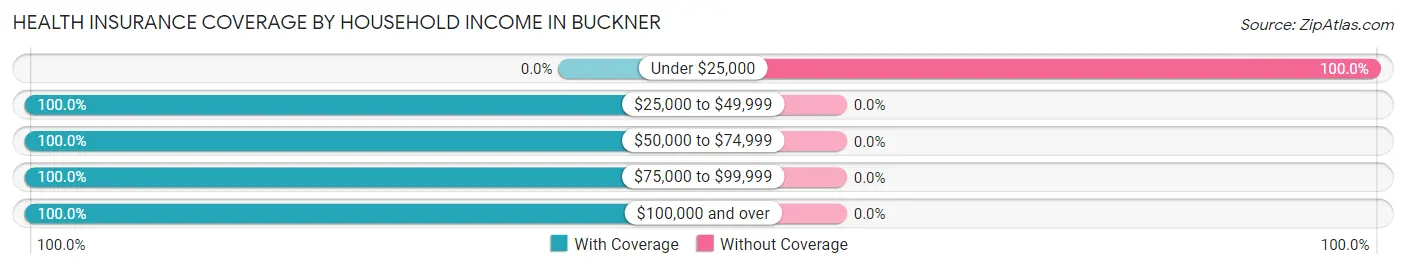
| Household Income | With Coverage | Without Coverage |
| Under $25,000 | 0 (0.0%) | 10 (100.0%) |
| $25,000 to $49,999 | 140 (100.0%) | 0 (0.0%) |
| $50,000 to $74,999 | 382 (100.0%) | 0 (0.0%) |
| $75,000 to $99,999 | 393 (100.0%) | 0 (0.0%) |
| $100,000 and over | 2,430 (100.0%) | 0 (0.0%) |
Public vs Private Health Insurance Coverage by Age in Buckner
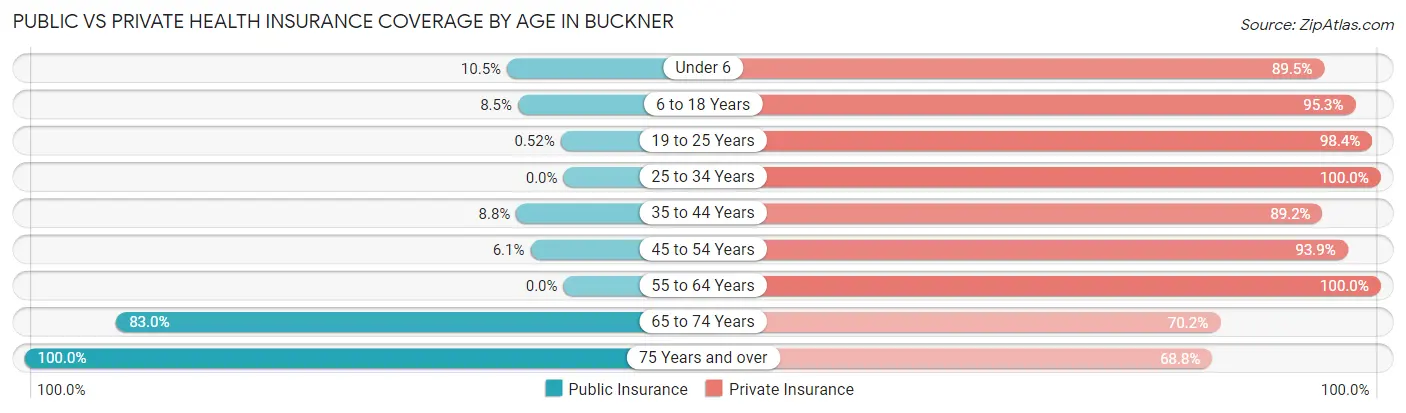
| Age Bracket | Public Insurance | Private Insurance |
| Under 6 | 26 (10.5%) | 222 (89.5%) |
| 6 to 18 Years | 63 (8.5%) | 711 (95.3%) |
| 19 to 25 Years | 1 (0.5%) | 189 (98.4%) |
| 25 to 34 Years | 0 (0.0%) | 325 (100.0%) |
| 35 to 44 Years | 43 (8.8%) | 438 (89.2%) |
| 45 to 54 Years | 40 (6.1%) | 613 (93.9%) |
| 55 to 64 Years | 0 (0.0%) | 263 (100.0%) |
| 65 to 74 Years | 273 (83.0%) | 231 (70.2%) |
| 75 Years and over | 112 (100.0%) | 77 (68.8%) |
| Total | 558 (16.6%) | 3,069 (91.4%) |
Disability Status by Sex by Age in Buckner
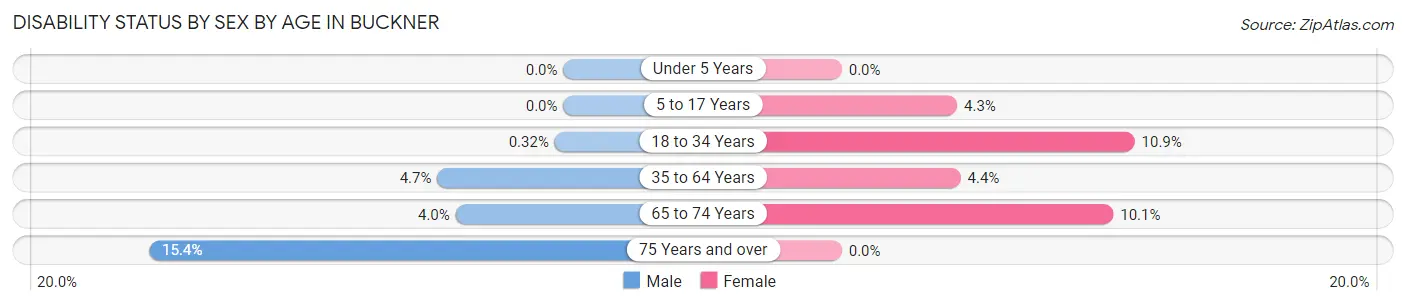
| Age Bracket | Male | Female |
| Under 5 Years | 0 (0.0%) | 0 (0.0%) |
| 5 to 17 Years | 0 (0.0%) | 14 (4.3%) |
| 18 to 34 Years | 1 (0.3%) | 30 (10.9%) |
| 35 to 64 Years | 34 (4.7%) | 30 (4.4%) |
| 65 to 74 Years | 8 (4.0%) | 13 (10.1%) |
| 75 Years and over | 8 (15.4%) | 0 (0.0%) |
Disability Class by Sex by Age in Buckner
Disability Class: Hearing Difficulty
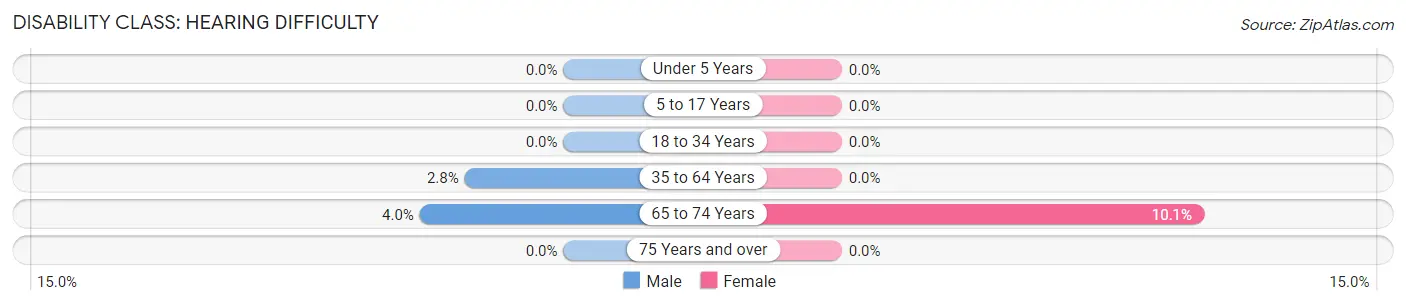
| Age Bracket | Male | Female |
| Under 5 Years | 0 (0.0%) | 0 (0.0%) |
| 5 to 17 Years | 0 (0.0%) | 0 (0.0%) |
| 18 to 34 Years | 0 (0.0%) | 0 (0.0%) |
| 35 to 64 Years | 20 (2.8%) | 0 (0.0%) |
| 65 to 74 Years | 8 (4.0%) | 13 (10.1%) |
| 75 Years and over | 0 (0.0%) | 0 (0.0%) |
Disability Class: Vision Difficulty
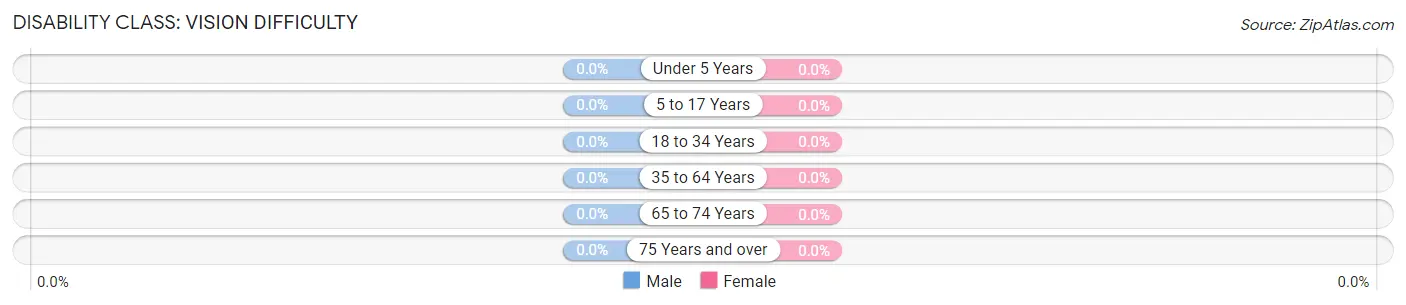
| Age Bracket | Male | Female |
| Under 5 Years | 0 (0.0%) | 0 (0.0%) |
| 5 to 17 Years | 0 (0.0%) | 0 (0.0%) |
| 18 to 34 Years | 0 (0.0%) | 0 (0.0%) |
| 35 to 64 Years | 0 (0.0%) | 0 (0.0%) |
| 65 to 74 Years | 0 (0.0%) | 0 (0.0%) |
| 75 Years and over | 0 (0.0%) | 0 (0.0%) |
Disability Class: Cognitive Difficulty
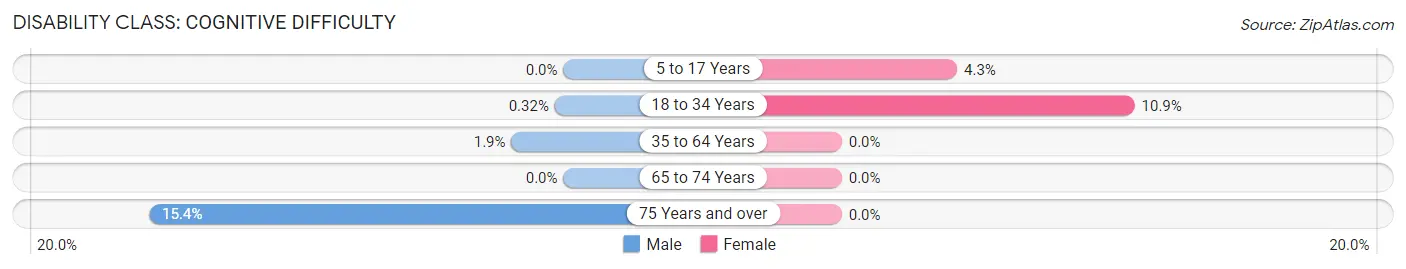
| Age Bracket | Male | Female |
| 5 to 17 Years | 0 (0.0%) | 14 (4.3%) |
| 18 to 34 Years | 1 (0.3%) | 30 (10.9%) |
| 35 to 64 Years | 14 (1.9%) | 0 (0.0%) |
| 65 to 74 Years | 0 (0.0%) | 0 (0.0%) |
| 75 Years and over | 8 (15.4%) | 0 (0.0%) |
Disability Class: Ambulatory Difficulty
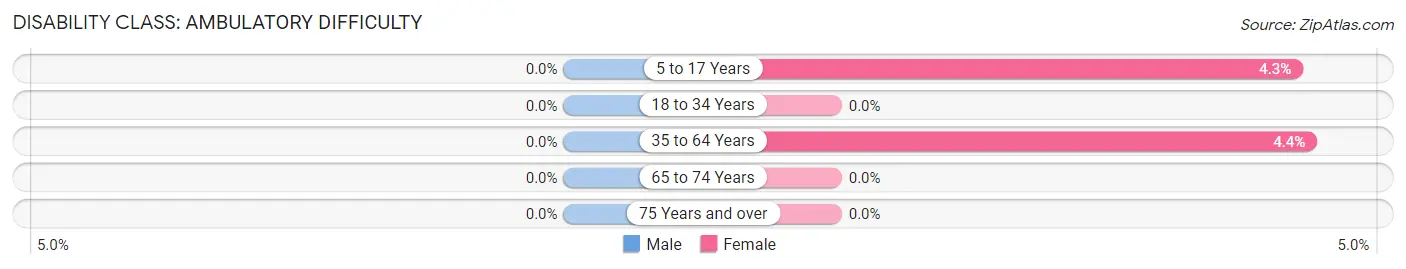
| Age Bracket | Male | Female |
| 5 to 17 Years | 0 (0.0%) | 14 (4.3%) |
| 18 to 34 Years | 0 (0.0%) | 0 (0.0%) |
| 35 to 64 Years | 0 (0.0%) | 30 (4.4%) |
| 65 to 74 Years | 0 (0.0%) | 0 (0.0%) |
| 75 Years and over | 0 (0.0%) | 0 (0.0%) |
Disability Class: Self-Care Difficulty
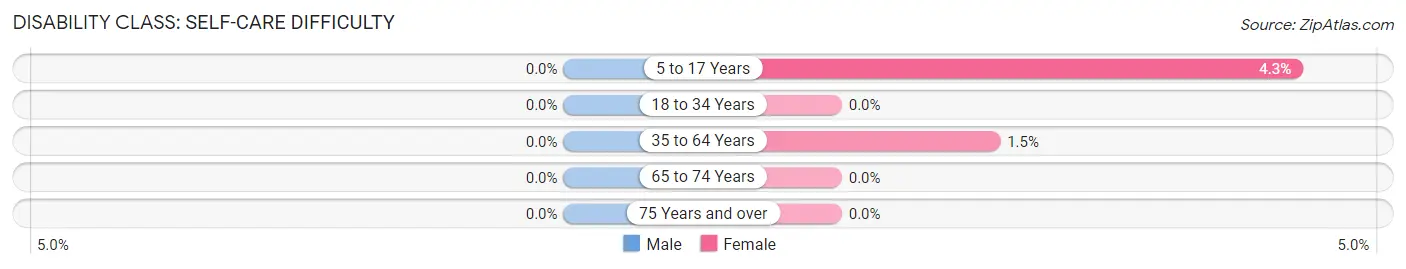
| Age Bracket | Male | Female |
| 5 to 17 Years | 0 (0.0%) | 14 (4.3%) |
| 18 to 34 Years | 0 (0.0%) | 0 (0.0%) |
| 35 to 64 Years | 0 (0.0%) | 10 (1.5%) |
| 65 to 74 Years | 0 (0.0%) | 0 (0.0%) |
| 75 Years and over | 0 (0.0%) | 0 (0.0%) |
Technology Access in Buckner
Computing Device Access in Buckner
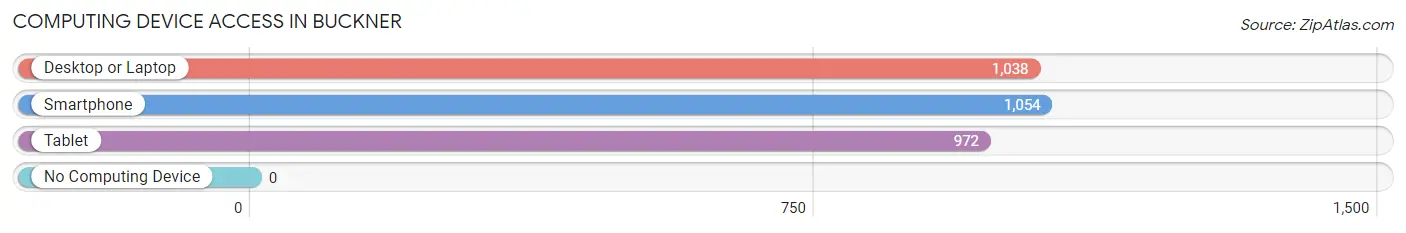
| Device Type | # Households | % Households |
| Desktop or Laptop | 1,038 | 91.4% |
| Smartphone | 1,054 | 92.8% |
| Tablet | 972 | 85.6% |
| No Computing Device | 0 | 0.0% |
| Total | 1,136 | 100.0% |
Internet Access in Buckner
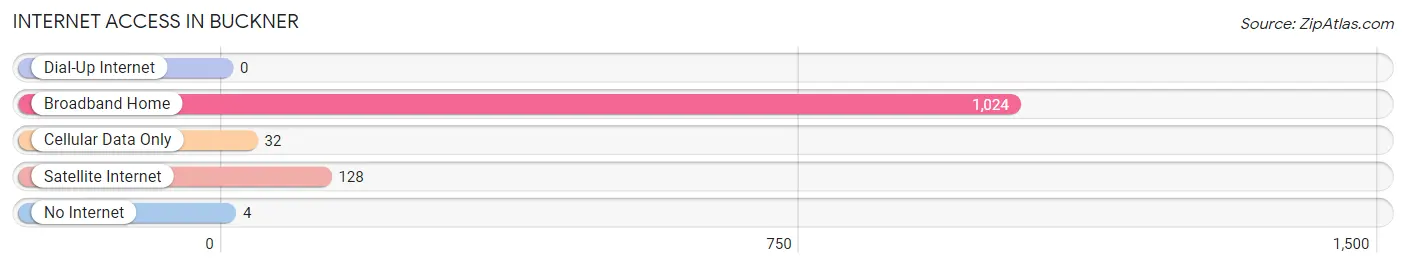
| Internet Type | # Households | % Households |
| Dial-Up Internet | 0 | 0.0% |
| Broadband Home | 1,024 | 90.1% |
| Cellular Data Only | 32 | 2.8% |
| Satellite Internet | 128 | 11.3% |
| No Internet | 4 | 0.4% |
| Total | 1,136 | 100.0% |
Buckner Summary
Buckner is a small city located in Oldham County, Kentucky. It is situated in the northern part of the state, just south of Louisville. The city has a population of approximately 2,000 people and is part of the Louisville metropolitan area.
History
Buckner was founded in 1817 by William Buckner, a Revolutionary War veteran. The city was originally known as Buckner’s Station, and was a stop on the Louisville and Nashville Railroad. The city was incorporated in 1867 and was named after its founder.
In the late 19th century, Buckner was a thriving agricultural community. The city was home to several large farms, and the local economy was largely based on the production of tobacco, corn, and wheat.
In the early 20th century, Buckner began to experience a decline in its agricultural economy. The city’s population began to decline as well, and by the 1950s, the city had become a small, rural community.
Geography
Buckner is located in northern Oldham County, Kentucky. The city is situated on the banks of the Ohio River, and is bordered by the cities of La Grange and Prospect. The city is located approximately 20 miles south of Louisville.
The city has a total area of 1.2 square miles, all of which is land. The terrain is mostly flat, with some rolling hills in the surrounding area. The climate is humid subtropical, with hot, humid summers and mild winters.
Economy
The economy of Buckner is largely based on agriculture. The city is home to several large farms, which produce a variety of crops, including tobacco, corn, and wheat. The city is also home to several small businesses, including restaurants, retail stores, and service providers.
The city is also home to several manufacturing companies, including a plastics manufacturer and a metal fabrication company. The city is also home to a large trucking company, which provides transportation services to the surrounding area.
Demographics
As of the 2010 census, the population of Buckner was 2,000. The racial makeup of the city was 97.2% White, 0.7% African American, 0.3% Native American, 0.2% Asian, 0.1% Pacific Islander, 0.7% from other races, and 0.9% from two or more races. Hispanic or Latino of any race were 1.7% of the population.
The median household income in Buckner was $45,000, and the median family income was $50,000. The per capita income was $20,000. About 8.3% of families and 10.2% of the population were below the poverty line, including 14.3% of those under age 18 and 8.3% of those age 65 or over.
Conclusion
Buckner is a small city located in Oldham County, Kentucky. It is situated in the northern part of the state, just south of Louisville. The city has a population of approximately 2,000 people and is part of the Louisville metropolitan area. The economy of Buckner is largely based on agriculture, with several large farms producing a variety of crops. The city is also home to several small businesses, manufacturing companies, and a large trucking company. The population of Buckner is predominantly White, with a small percentage of African American, Native American, Asian, and Pacific Islander residents. The median household income in Buckner is $45,000, and the median family income is $50,000.
Common Questions
What is Per Capita Income in Buckner?
Per Capita income in Buckner is $49,671.
What is the Median Family Income in Buckner?
Median Family Income in Buckner is $148,517.
What is the Median Household income in Buckner?
Median Household Income in Buckner is $141,538.
What is Income or Wage Gap in Buckner?
Income or Wage Gap in Buckner is 19.5%.
Women in Buckner earn 80.5 cents for every dollar earned by a man.
What is Inequality or Gini Index in Buckner?
Inequality or Gini Index in Buckner is 0.32.
What is the Total Population of Buckner?
Total Population of Buckner is 3,658.
What is the Total Male Population of Buckner?
Total Male Population of Buckner is 1,944.
What is the Total Female Population of Buckner?
Total Female Population of Buckner is 1,714.
What is the Ratio of Males per 100 Females in Buckner?
There are 113.42 Males per 100 Females in Buckner.
What is the Ratio of Females per 100 Males in Buckner?
There are 88.17 Females per 100 Males in Buckner.
What is the Median Population Age in Buckner?
Median Population Age in Buckner is 37.6 Years.
What is the Average Family Size in Buckner
Average Family Size in Buckner is 3.1 People.
What is the Average Household Size in Buckner
Average Household Size in Buckner is 3.0 People.
How Large is the Labor Force in Buckner?
There are 2,069 People in the Labor Forcein in Buckner.
What is the Percentage of People in the Labor Force in Buckner?
71.5% of People are in the Labor Force in Buckner.
What is the Unemployment Rate in Buckner?
Unemployment Rate in Buckner is 0.9%.