Hatteras, NC Map & Demographics
Hatteras Map
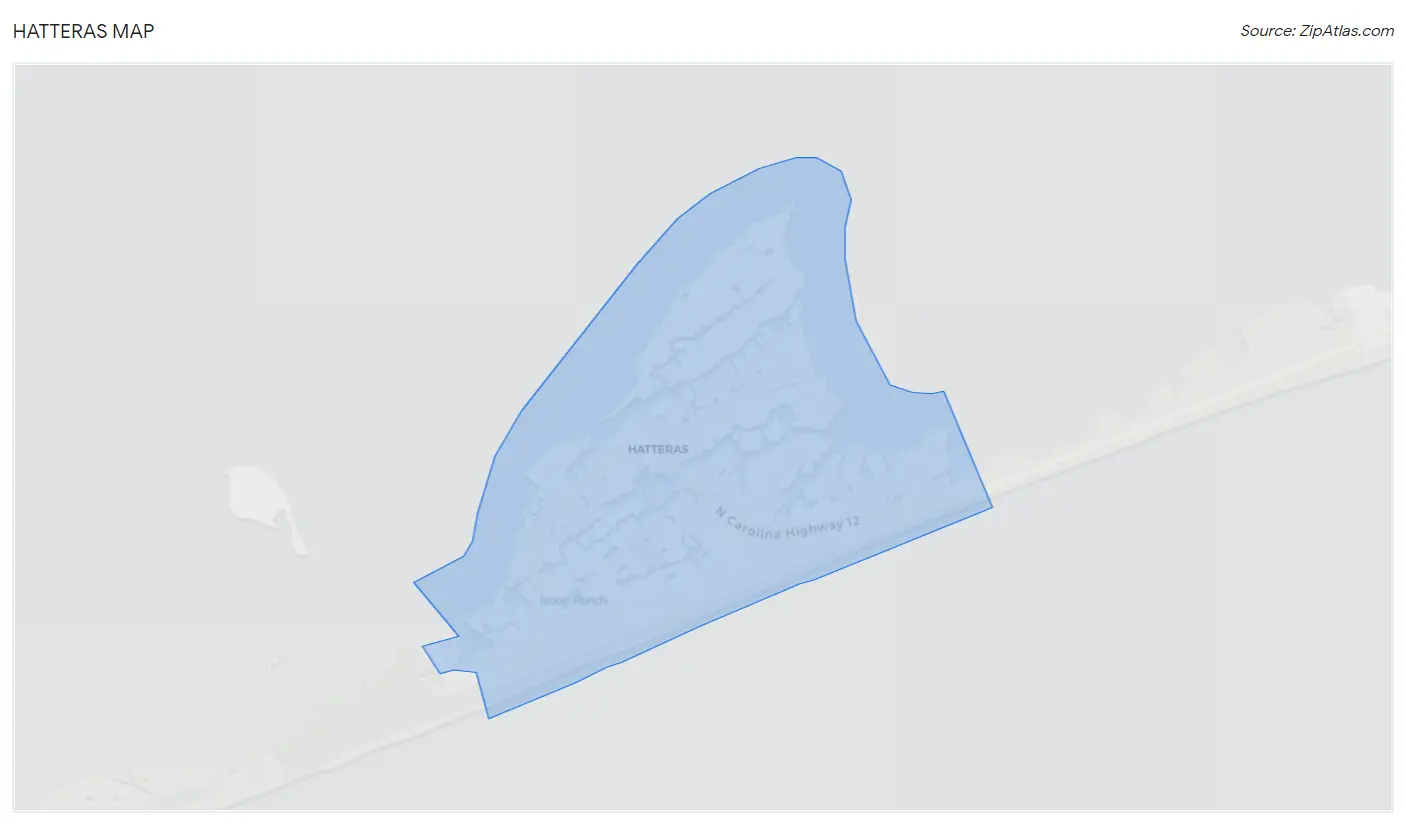
Hatteras Overview
$21,626
PER CAPITA INCOME
$47,115
AVG FAMILY INCOME
$47,067
AVG HOUSEHOLD INCOME
0.21
INEQUALITY / GINI INDEX
458
TOTAL POPULATION
209
MALE POPULATION
249
FEMALE POPULATION
83.94
MALES / 100 FEMALES
119.14
FEMALES / 100 MALES
33.7
MEDIAN AGE
2.9
AVG FAMILY SIZE
2.3
AVG HOUSEHOLD SIZE
230
LABOR FORCE [ PEOPLE ]
69.9%
PERCENT IN LABOR FORCE
Hatteras Zip Codes
Hatteras Area Codes
Income in Hatteras
Income Overview in Hatteras
Per Capita Income in Hatteras is $21,626, while median incomes of families and households are $47,115 and $47,067 respectively.
| Characteristic | Number | Measure |
| Per Capita Income | 458 | $21,626 |
| Median Family Income | 132 | $47,115 |
| Mean Family Income | 132 | $57,677 |
| Median Household Income | 186 | $47,067 |
| Mean Household Income | 186 | $52,917 |
| Income Deficit | 132 | $0 |
| Wage / Income Gap (%) | 458 | 0.00% |
| Wage / Income Gap ($) | 458 | 100.00¢ per $1 |
| Gini / Inequality Index | 458 | 0.21 |
Earnings by Sex in Hatteras
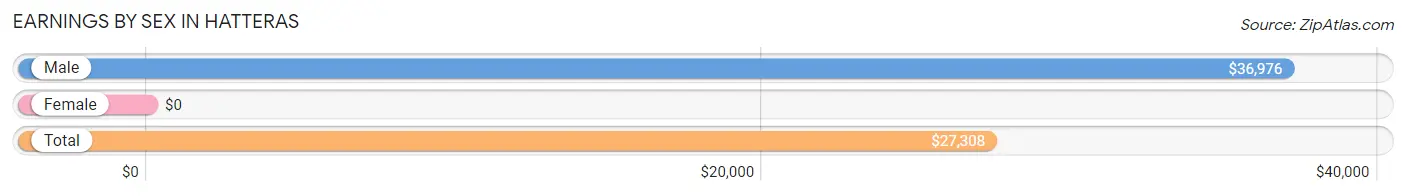
| Sex | Number | Average Earnings |
| Male | 129 (45.7%) | $36,976 |
| Female | 153 (54.3%) | $0 |
| Total | 282 (100.0%) | $27,308 |
Earnings by Sex by Income Bracket in Hatteras
The most common earnings brackets in Hatteras are $45,000 to $49,999 for men (41 | 31.8%) and $2,499 or less for women (52 | 34.0%).
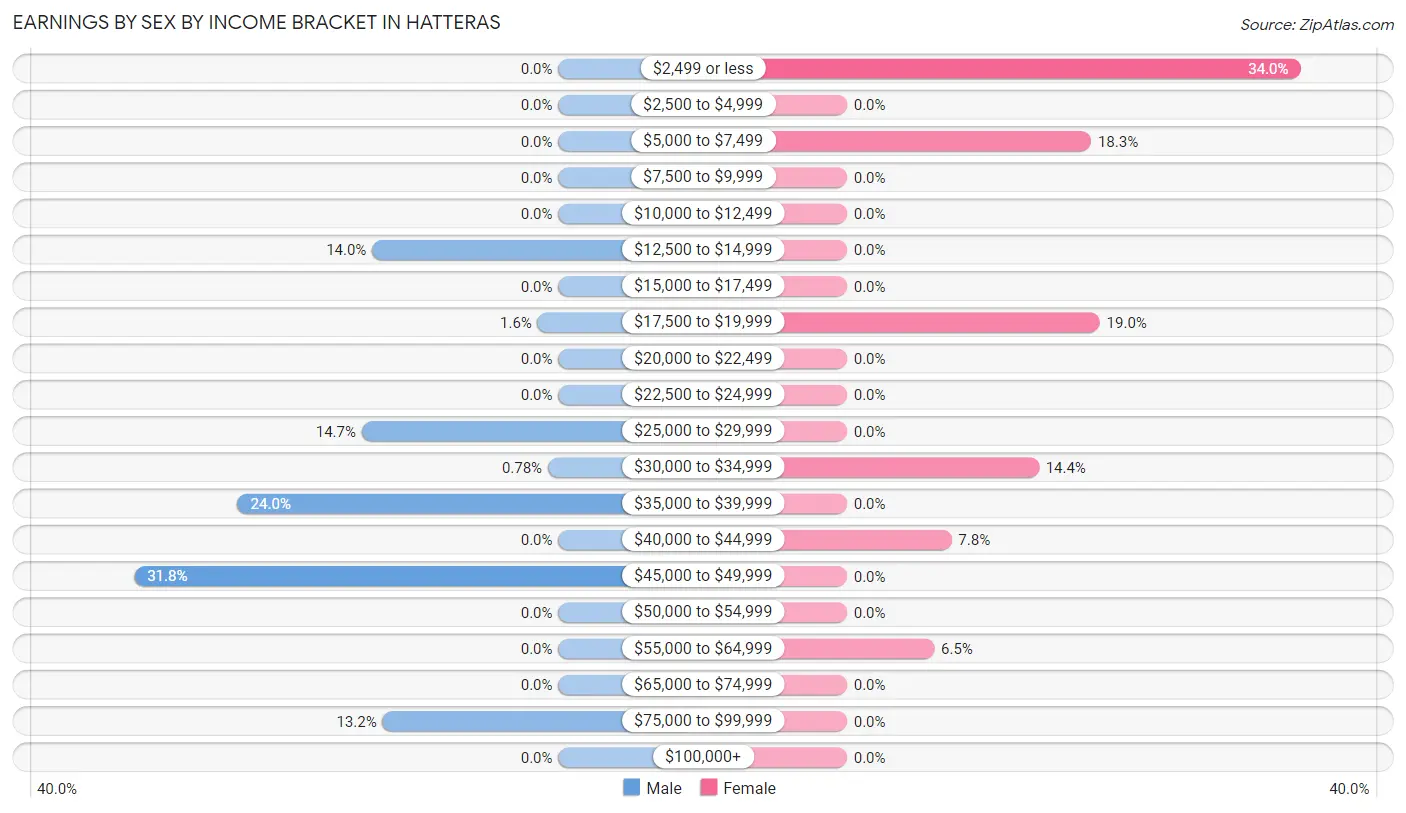
| Income | Male | Female |
| $2,499 or less | 0 (0.0%) | 52 (34.0%) |
| $2,500 to $4,999 | 0 (0.0%) | 0 (0.0%) |
| $5,000 to $7,499 | 0 (0.0%) | 28 (18.3%) |
| $7,500 to $9,999 | 0 (0.0%) | 0 (0.0%) |
| $10,000 to $12,499 | 0 (0.0%) | 0 (0.0%) |
| $12,500 to $14,999 | 18 (14.0%) | 0 (0.0%) |
| $15,000 to $17,499 | 0 (0.0%) | 0 (0.0%) |
| $17,500 to $19,999 | 2 (1.5%) | 29 (19.0%) |
| $20,000 to $22,499 | 0 (0.0%) | 0 (0.0%) |
| $22,500 to $24,999 | 0 (0.0%) | 0 (0.0%) |
| $25,000 to $29,999 | 19 (14.7%) | 0 (0.0%) |
| $30,000 to $34,999 | 1 (0.8%) | 22 (14.4%) |
| $35,000 to $39,999 | 31 (24.0%) | 0 (0.0%) |
| $40,000 to $44,999 | 0 (0.0%) | 12 (7.8%) |
| $45,000 to $49,999 | 41 (31.8%) | 0 (0.0%) |
| $50,000 to $54,999 | 0 (0.0%) | 0 (0.0%) |
| $55,000 to $64,999 | 0 (0.0%) | 10 (6.5%) |
| $65,000 to $74,999 | 0 (0.0%) | 0 (0.0%) |
| $75,000 to $99,999 | 17 (13.2%) | 0 (0.0%) |
| $100,000+ | 0 (0.0%) | 0 (0.0%) |
| Total | 129 (100.0%) | 153 (100.0%) |
Earnings by Sex by Educational Attainment in Hatteras
| Educational Attainment | Male Income | Female Income |
| Less than High School | - | - |
| High School Diploma | - | - |
| College or Associate's Degree | - | - |
| Bachelor's Degree | - | - |
| Graduate Degree | - | - |
| Total | $45,213 | $0 |
Family Income in Hatteras
Family Income Brackets in Hatteras
According to the Hatteras family income data, there are 52 families falling into the $35,000 to $49,999 income range, which is the most common income bracket and makes up 39.4% of all families.
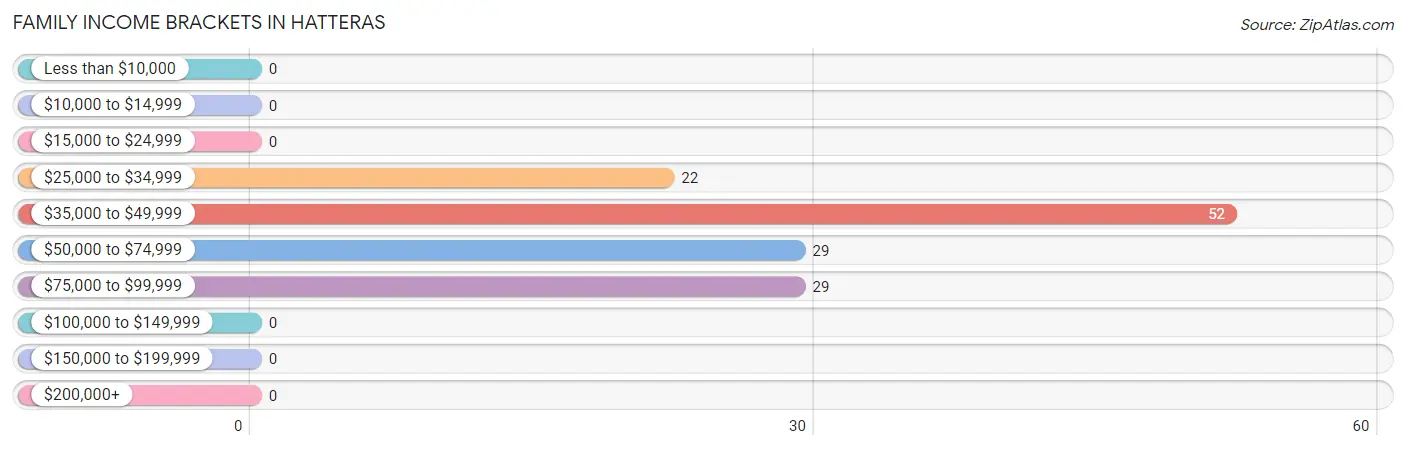
| Income Bracket | # Families | % Families |
| Less than $10,000 | 0 | 0.0% |
| $10,000 to $14,999 | 0 | 0.0% |
| $15,000 to $24,999 | 0 | 0.0% |
| $25,000 to $34,999 | 22 | 16.7% |
| $35,000 to $49,999 | 52 | 39.4% |
| $50,000 to $74,999 | 29 | 22.0% |
| $75,000 to $99,999 | 29 | 22.0% |
| $100,000 to $149,999 | 0 | 0.0% |
| $150,000 to $199,999 | 0 | 0.0% |
| $200,000+ | 0 | 0.0% |
Family Income by Famaliy Size in Hatteras
2-person families (63 | 47.7%) account for the highest median family income in Hatteras with $58,319 per family, while 2-person families (63 | 47.7%) have the highest median income of $29,160 per family member.
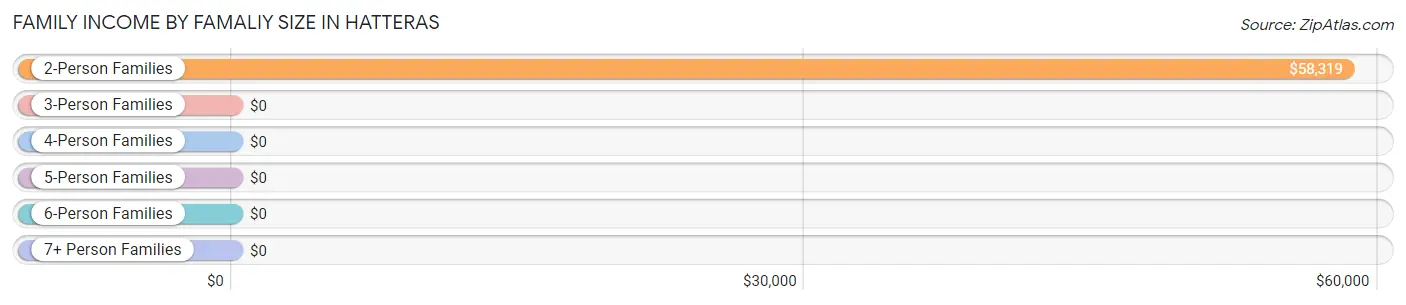
| Income Bracket | # Families | Median Income |
| 2-Person Families | 63 (47.7%) | $58,319 |
| 3-Person Families | 17 (12.9%) | $0 |
| 4-Person Families | 52 (39.4%) | $0 |
| 5-Person Families | 0 (0.0%) | $0 |
| 6-Person Families | 0 (0.0%) | $0 |
| 7+ Person Families | 0 (0.0%) | $0 |
| Total | 132 (100.0%) | $47,115 |
Family Income by Number of Earners in Hatteras
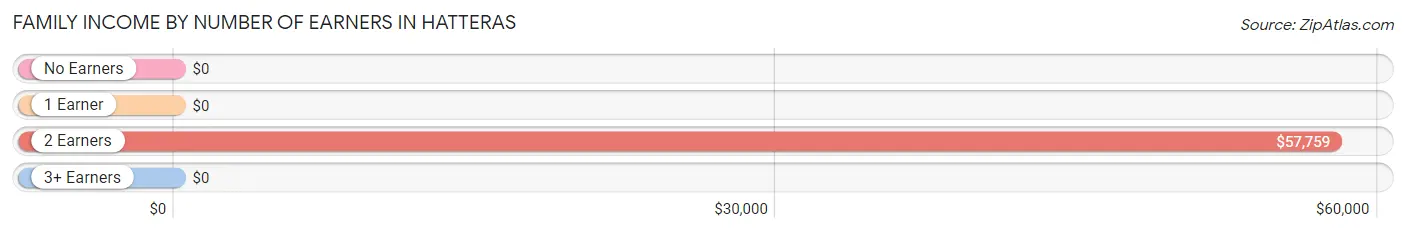
| Number of Earners | # Families | Median Income |
| No Earners | 0 (0.0%) | $0 |
| 1 Earner | 22 (16.7%) | $0 |
| 2 Earners | 110 (83.3%) | $57,759 |
| 3+ Earners | 0 (0.0%) | $0 |
| Total | 132 (100.0%) | $47,115 |
Household Income in Hatteras
Household Income Brackets in Hatteras
With 55 households falling in the category, the $50,000 to $74,999 income range is the most frequent in Hatteras, accounting for 29.6% of all households.
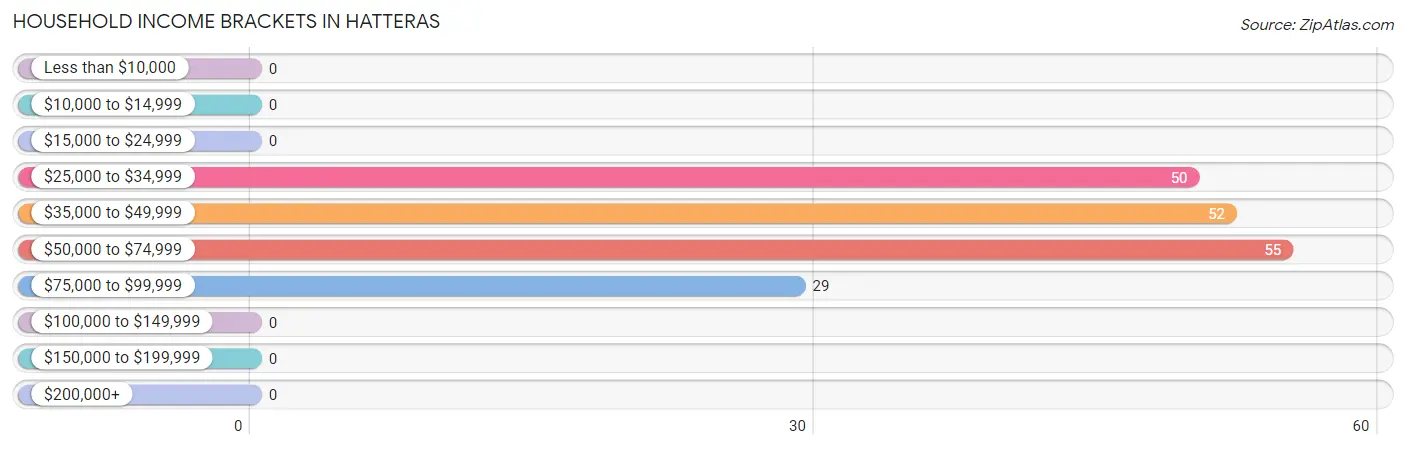
| Income Bracket | # Households | % Households |
| Less than $10,000 | 0 | 0.0% |
| $10,000 to $14,999 | 0 | 0.0% |
| $15,000 to $24,999 | 0 | 0.0% |
| $25,000 to $34,999 | 50 | 26.9% |
| $35,000 to $49,999 | 52 | 28.0% |
| $50,000 to $74,999 | 55 | 29.6% |
| $75,000 to $99,999 | 29 | 15.6% |
| $100,000 to $149,999 | 0 | 0.0% |
| $150,000 to $199,999 | 0 | 0.0% |
| $200,000+ | 0 | 0.0% |
Household Income by Householder Age in Hatteras
The median household income in Hatteras is $47,067, with the highest median household income of $59,052 found in the 45 to 64 years age bracket for the primary householder. A total of 80 households (43.0%) fall into this category.
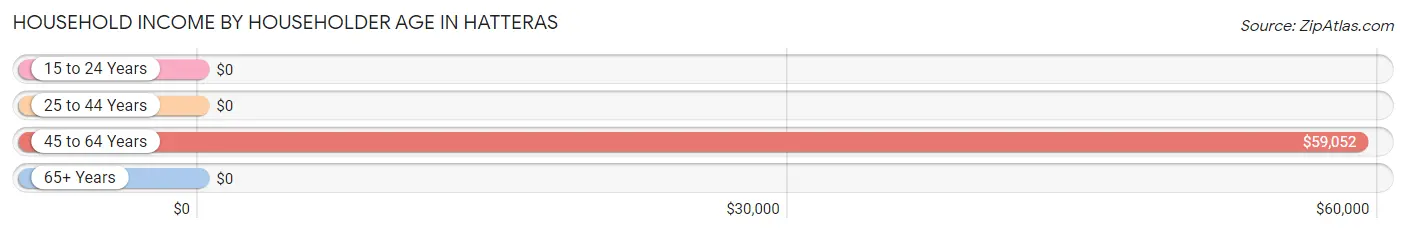
| Income Bracket | # Households | Median Income |
| 15 to 24 Years | 0 (0.0%) | $0 |
| 25 to 44 Years | 52 (28.0%) | $0 |
| 45 to 64 Years | 80 (43.0%) | $59,052 |
| 65+ Years | 54 (29.0%) | $0 |
| Total | 186 (100.0%) | $47,067 |
Poverty in Hatteras
Income Below Poverty by Sex and Age in Hatteras
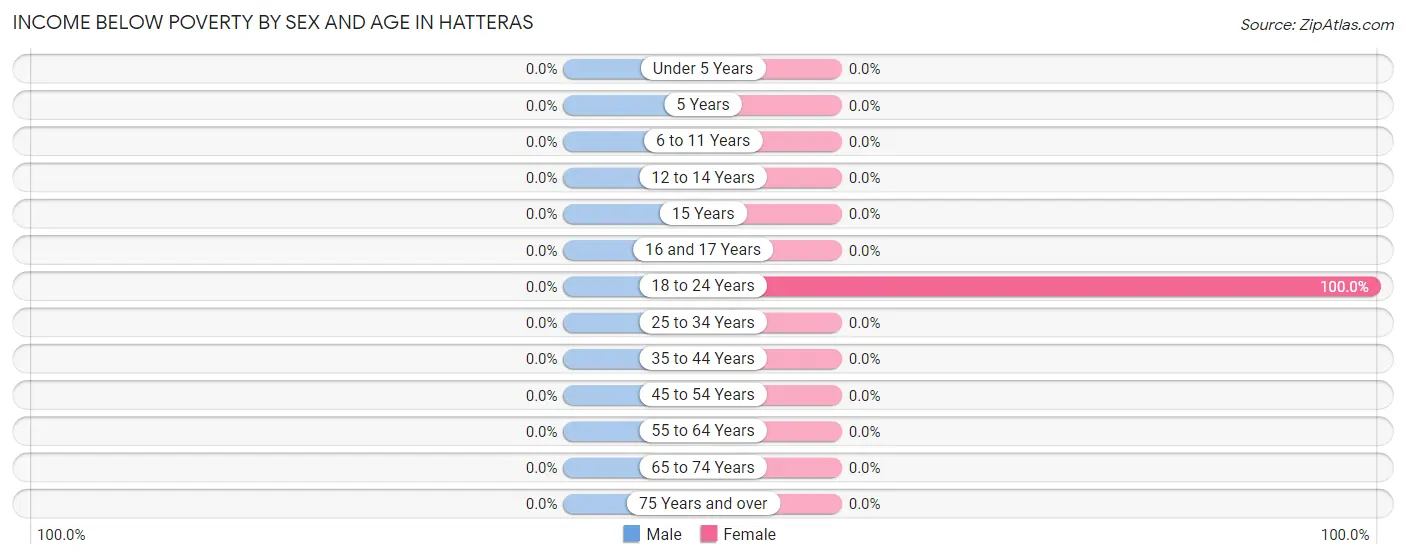
| Age Bracket | Male | Female |
| Under 5 Years | 0 (0.0%) | 0 (0.0%) |
| 5 Years | 0 (0.0%) | 0 (0.0%) |
| 6 to 11 Years | 0 (0.0%) | 0 (0.0%) |
| 12 to 14 Years | 0 (0.0%) | 0 (0.0%) |
| 15 Years | 0 (0.0%) | 0 (0.0%) |
| 16 and 17 Years | 0 (0.0%) | 0 (0.0%) |
| 18 to 24 Years | 0 (0.0%) | 1 (100.0%) |
| 25 to 34 Years | 0 (0.0%) | 0 (0.0%) |
| 35 to 44 Years | 0 (0.0%) | 0 (0.0%) |
| 45 to 54 Years | 0 (0.0%) | 0 (0.0%) |
| 55 to 64 Years | 0 (0.0%) | 0 (0.0%) |
| 65 to 74 Years | 0 (0.0%) | 0 (0.0%) |
| 75 Years and over | 0 (0.0%) | 0 (0.0%) |
| Total | 0 (0.0%) | 1 (0.4%) |
Income Above Poverty by Sex and Age in Hatteras
According to the poverty statistics in Hatteras, males aged under 5 years and females aged under 5 years are the age groups that are most secure financially, with 100.0% of males and 100.0% of females in these age groups living above the poverty line.
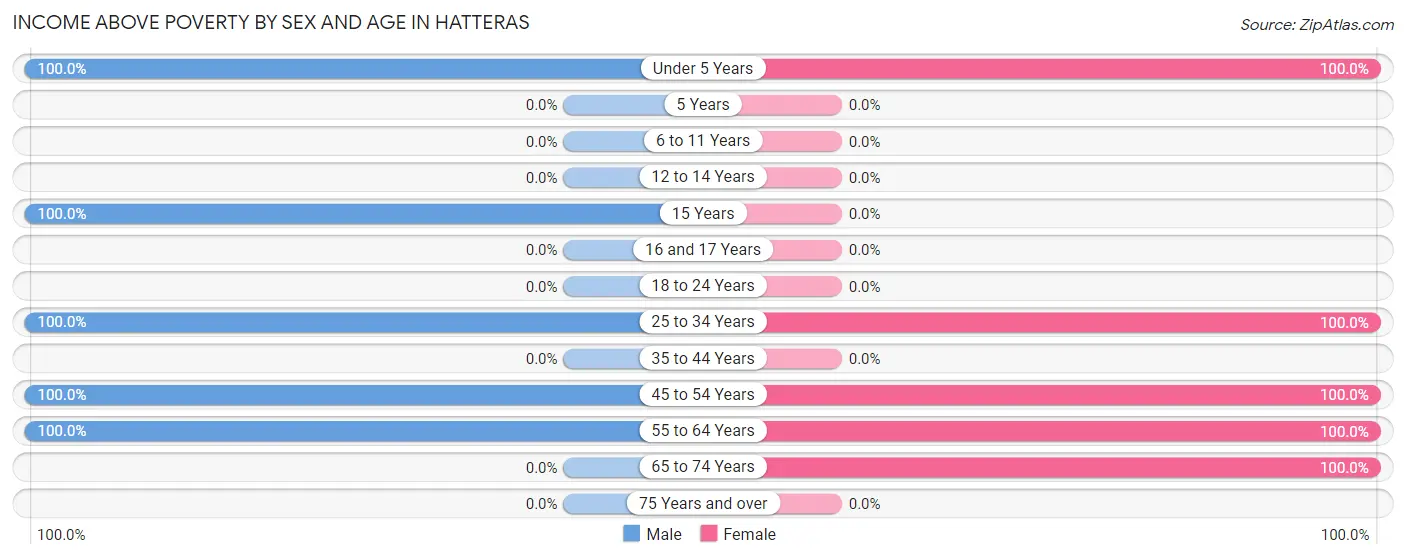
| Age Bracket | Male | Female |
| Under 5 Years | 45 (100.0%) | 49 (100.0%) |
| 5 Years | 0 (0.0%) | 0 (0.0%) |
| 6 to 11 Years | 0 (0.0%) | 0 (0.0%) |
| 12 to 14 Years | 0 (0.0%) | 0 (0.0%) |
| 15 Years | 33 (100.0%) | 0 (0.0%) |
| 16 and 17 Years | 0 (0.0%) | 0 (0.0%) |
| 18 to 24 Years | 0 (0.0%) | 0 (0.0%) |
| 25 to 34 Years | 59 (100.0%) | 52 (100.0%) |
| 35 to 44 Years | 0 (0.0%) | 0 (0.0%) |
| 45 to 54 Years | 17 (100.0%) | 52 (100.0%) |
| 55 to 64 Years | 33 (100.0%) | 41 (100.0%) |
| 65 to 74 Years | 0 (0.0%) | 54 (100.0%) |
| 75 Years and over | 0 (0.0%) | 0 (0.0%) |
| Total | 187 (100.0%) | 248 (99.6%) |
Income Below Poverty Among Married-Couple Families in Hatteras
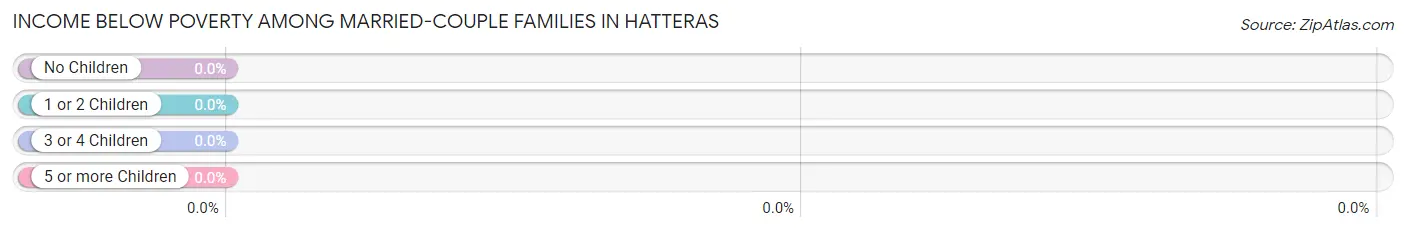
| Children | Above Poverty | Below Poverty |
| No Children | 46 (100.0%) | 0 (0.0%) |
| 1 or 2 Children | 52 (100.0%) | 0 (0.0%) |
| 3 or 4 Children | 0 (0.0%) | 0 (0.0%) |
| 5 or more Children | 0 (0.0%) | 0 (0.0%) |
| Total | 98 (100.0%) | 0 (0.0%) |
Income Below Poverty Among Single-Parent Households in Hatteras
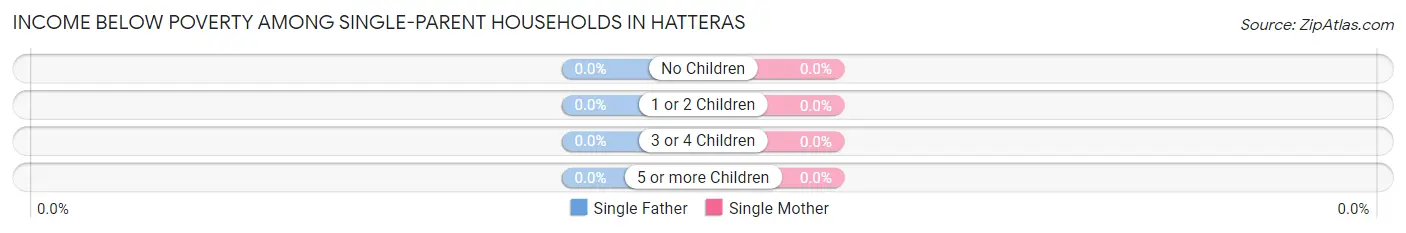
| Children | Single Father | Single Mother |
| No Children | 0 (0.0%) | 0 (0.0%) |
| 1 or 2 Children | 0 (0.0%) | 0 (0.0%) |
| 3 or 4 Children | 0 (0.0%) | 0 (0.0%) |
| 5 or more Children | 0 (0.0%) | 0 (0.0%) |
| Total | 0 (0.0%) | 0 (0.0%) |
Income Below Poverty Among Married-Couple vs Single-Parent Households in Hatteras
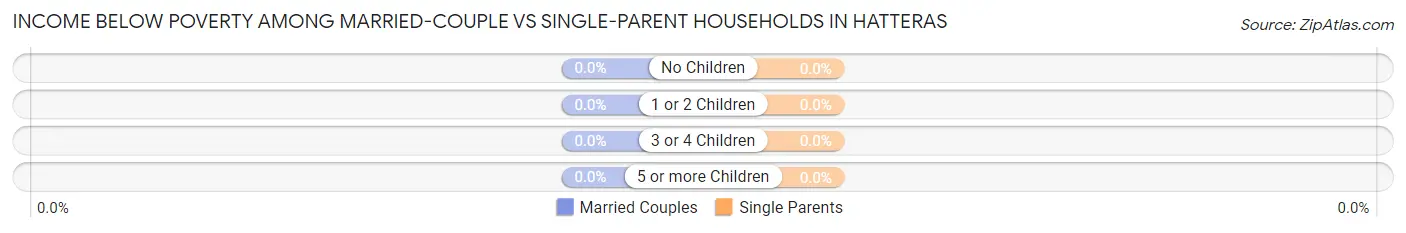
| Children | Married-Couple Families | Single-Parent Households |
| No Children | 0 (0.0%) | 0 (0.0%) |
| 1 or 2 Children | 0 (0.0%) | 0 (0.0%) |
| 3 or 4 Children | 0 (0.0%) | 0 (0.0%) |
| 5 or more Children | 0 (0.0%) | 0 (0.0%) |
| Total | 0 (0.0%) | 0 (0.0%) |
Race in Hatteras
The most populous races in Hatteras are White / Caucasian (442 | 96.5%), Hispanic or Latino (17 | 3.7%), and Two or more Races (13 | 2.8%).
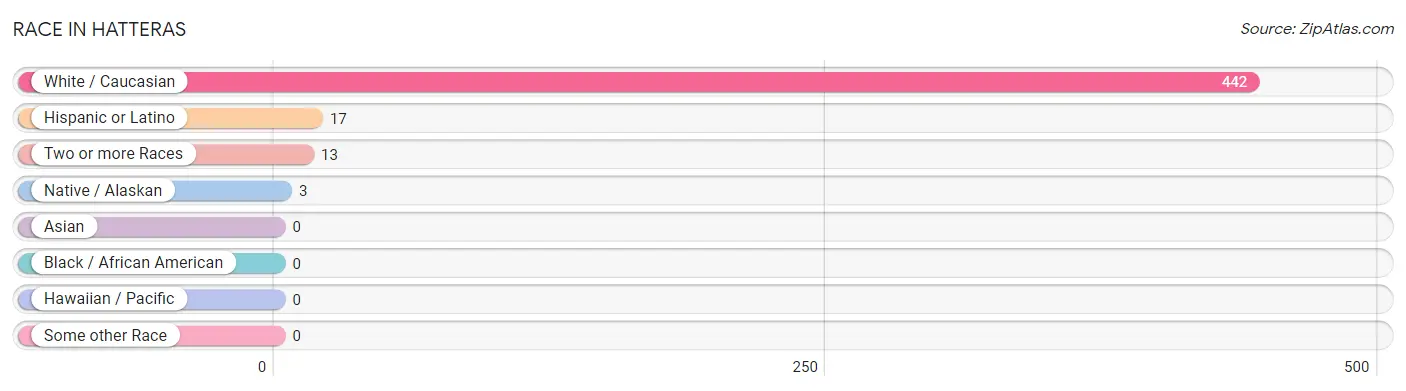
| Race | # Population | % Population |
| Asian | 0 | 0.0% |
| Black / African American | 0 | 0.0% |
| Hawaiian / Pacific | 0 | 0.0% |
| Hispanic or Latino | 17 | 3.7% |
| Native / Alaskan | 3 | 0.7% |
| White / Caucasian | 442 | 96.5% |
| Two or more Races | 13 | 2.8% |
| Some other Race | 0 | 0.0% |
| Total | 458 | 100.0% |
Ancestry in Hatteras
The most populous ancestries reported in Hatteras are American (187 | 40.8%), English (110 | 24.0%), Polish (26 | 5.7%), Puerto Rican (8 | 1.8%), and Mexican (7 | 1.5%), together accounting for 73.8% of all Hatteras residents.
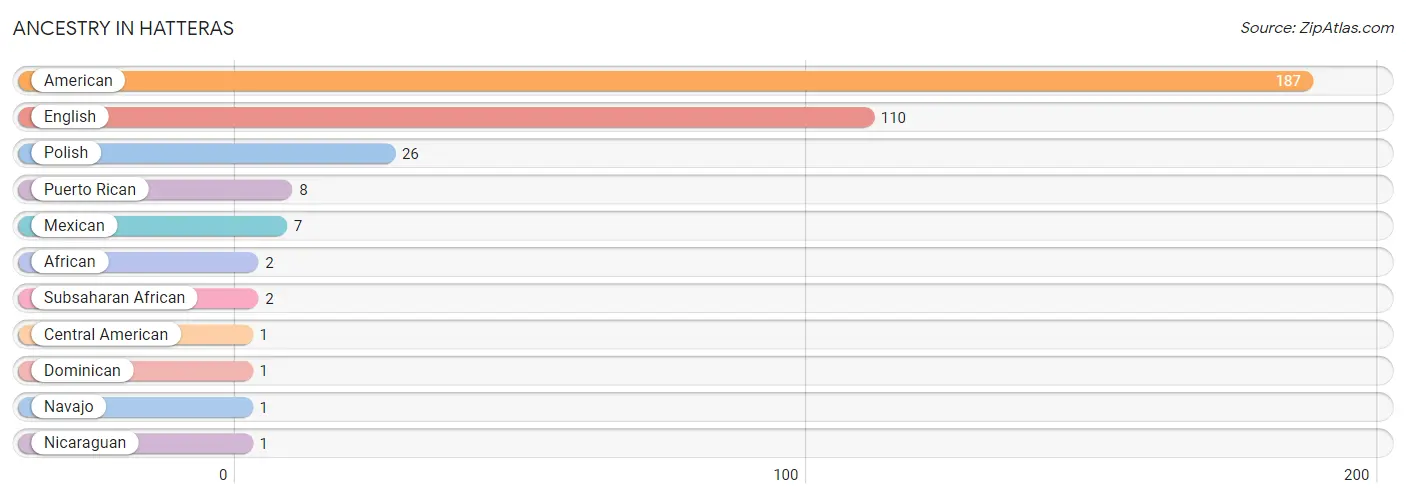
| Ancestry | # Population | % Population |
| African | 2 | 0.4% |
| American | 187 | 40.8% |
| Central American | 1 | 0.2% |
| Dominican | 1 | 0.2% |
| English | 110 | 24.0% |
| Mexican | 7 | 1.5% |
| Navajo | 1 | 0.2% |
| Nicaraguan | 1 | 0.2% |
| Polish | 26 | 5.7% |
| Puerto Rican | 8 | 1.8% |
| Subsaharan African | 2 | 0.4% | View All 11 Rows |
Immigrants in Hatteras
The most numerous immigrant groups reported in Hatteras came from Central America (2 | 0.4%), Latin America (2 | 0.4%), and Mexico (2 | 0.4%), together accounting for 1.3% of all Hatteras residents.
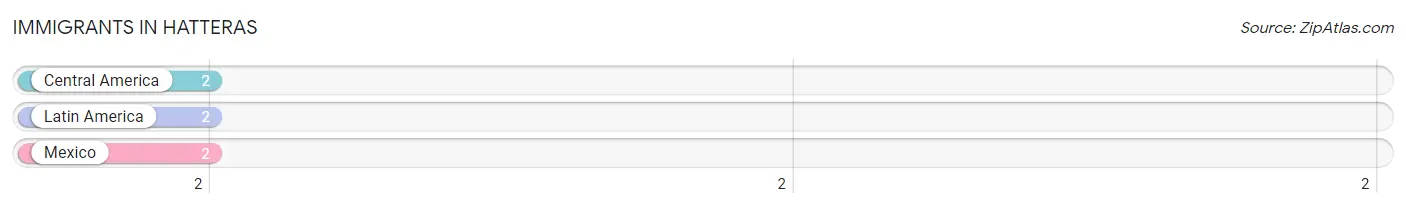
| Immigration Origin | # Population | % Population |
| Central America | 2 | 0.4% |
| Latin America | 2 | 0.4% |
| Mexico | 2 | 0.4% | View All 3 Rows |
Sex and Age in Hatteras
Sex and Age in Hatteras
The most populous age groups in Hatteras are 30 to 34 Years (59 | 28.2%) for men and 30 to 34 Years (52 | 20.9%) for women.
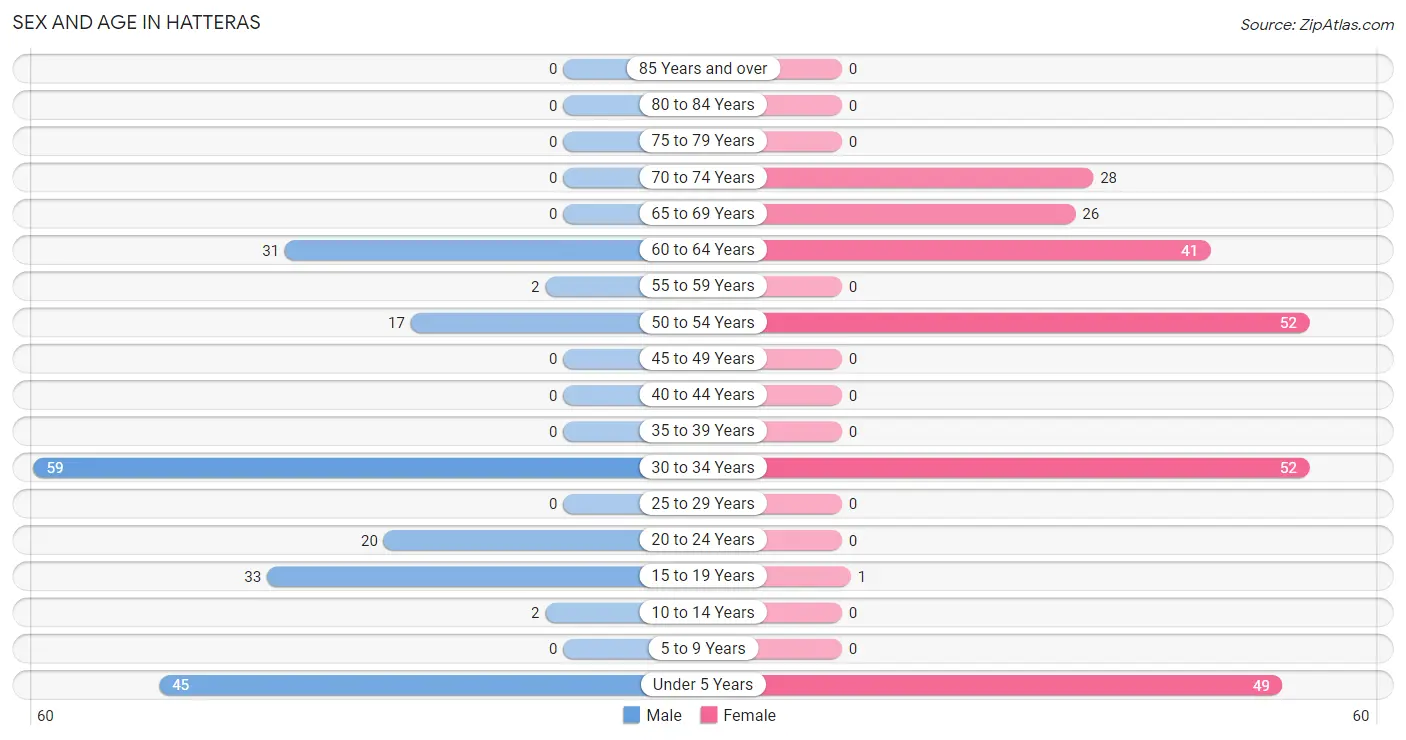
| Age Bracket | Male | Female |
| Under 5 Years | 45 (21.5%) | 49 (19.7%) |
| 5 to 9 Years | 0 (0.0%) | 0 (0.0%) |
| 10 to 14 Years | 2 (1.0%) | 0 (0.0%) |
| 15 to 19 Years | 33 (15.8%) | 1 (0.4%) |
| 20 to 24 Years | 20 (9.6%) | 0 (0.0%) |
| 25 to 29 Years | 0 (0.0%) | 0 (0.0%) |
| 30 to 34 Years | 59 (28.2%) | 52 (20.9%) |
| 35 to 39 Years | 0 (0.0%) | 0 (0.0%) |
| 40 to 44 Years | 0 (0.0%) | 0 (0.0%) |
| 45 to 49 Years | 0 (0.0%) | 0 (0.0%) |
| 50 to 54 Years | 17 (8.1%) | 52 (20.9%) |
| 55 to 59 Years | 2 (1.0%) | 0 (0.0%) |
| 60 to 64 Years | 31 (14.8%) | 41 (16.5%) |
| 65 to 69 Years | 0 (0.0%) | 26 (10.4%) |
| 70 to 74 Years | 0 (0.0%) | 28 (11.2%) |
| 75 to 79 Years | 0 (0.0%) | 0 (0.0%) |
| 80 to 84 Years | 0 (0.0%) | 0 (0.0%) |
| 85 Years and over | 0 (0.0%) | 0 (0.0%) |
| Total | 209 (100.0%) | 249 (100.0%) |
Families and Households in Hatteras
Median Family Size in Hatteras
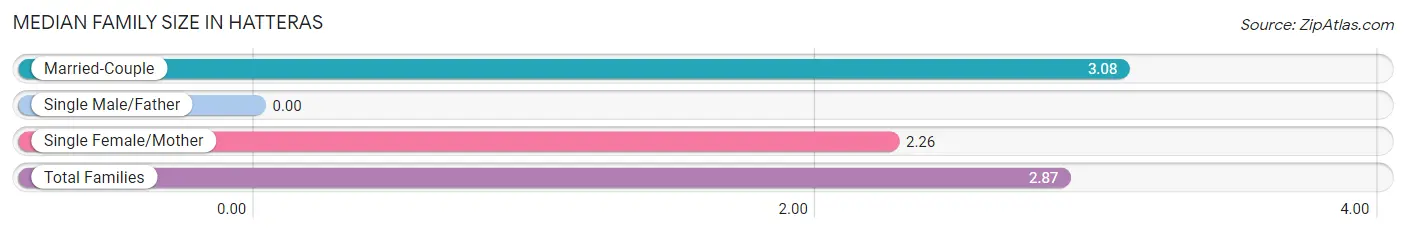
| Family Type | # Families | Family Size |
| Married-Couple | 98 (74.2%) | 3.08 |
| Single Male/Father | 0 (0.0%) | - |
| Single Female/Mother | 34 (25.8%) | 2.26 |
| Total Families | 132 (100.0%) | 2.87 |
Median Household Size in Hatteras
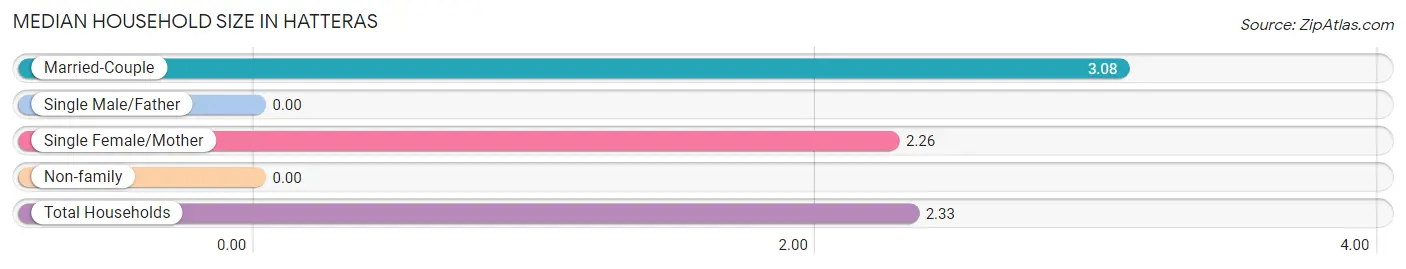
| Household Type | # Households | Household Size |
| Married-Couple | 98 (52.7%) | 3.08 |
| Single Male/Father | 0 (0.0%) | - |
| Single Female/Mother | 34 (18.3%) | 2.26 |
| Non-family | 54 (29.0%) | - |
| Total Households | 186 (100.0%) | 2.33 |
Household Size by Marriage Status in Hatteras
Out of a total of 186 households in Hatteras, 132 (71.0%) are family households, while 54 (29.0%) are nonfamily households. The most numerous type of family households are 2-person households, comprising 63, and the most common type of nonfamily households are 1-person households, comprising 54.
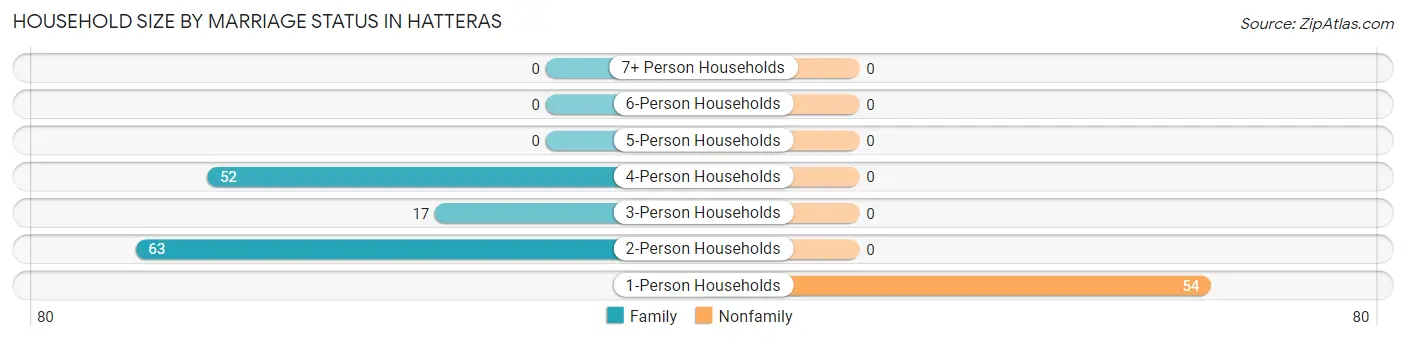
| Household Size | Family Households | Nonfamily Households |
| 1-Person Households | - | 54 (29.0%) |
| 2-Person Households | 63 (33.9%) | 0 (0.0%) |
| 3-Person Households | 17 (9.1%) | 0 (0.0%) |
| 4-Person Households | 52 (28.0%) | 0 (0.0%) |
| 5-Person Households | 0 (0.0%) | 0 (0.0%) |
| 6-Person Households | 0 (0.0%) | 0 (0.0%) |
| 7+ Person Households | 0 (0.0%) | 0 (0.0%) |
| Total | 132 (71.0%) | 54 (29.0%) |
Female Fertility in Hatteras
Fertility by Age in Hatteras
Average fertility rate in Hatteras is 981.0 births per 1,000 women. Women in the age bracket of 20 to 34 years have the highest fertility rate with 1,000.0 births per 1,000 women. Women in the age bracket of 20 to 34 years acount for 100.0% of all women with births.
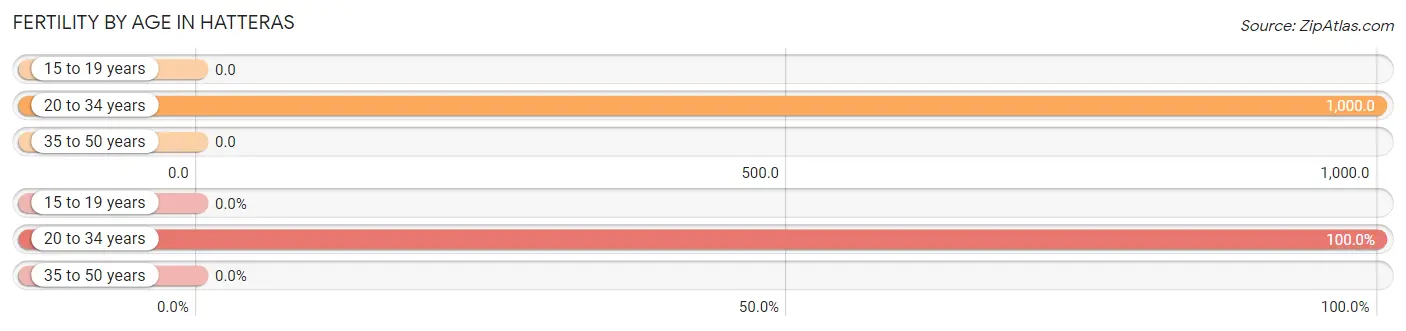
| Age Bracket | Women with Births | Births / 1,000 Women |
| 15 to 19 years | 0 (0.0%) | 0.0 |
| 20 to 34 years | 52 (100.0%) | 1,000.0 |
| 35 to 50 years | 0 (0.0%) | 0.0 |
| Total | 52 (100.0%) | 981.0 |
Fertility by Age by Marriage Status in Hatteras
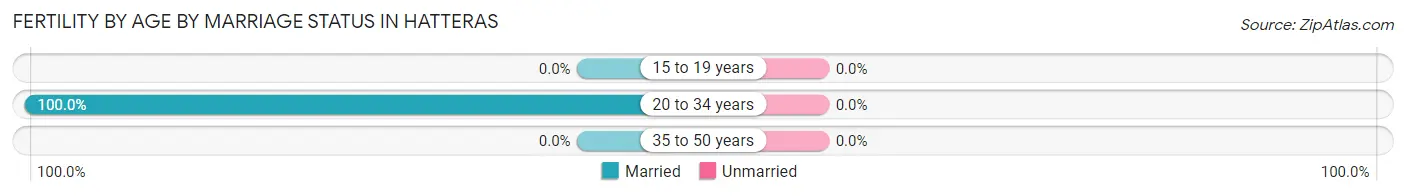
| Age Bracket | Married | Unmarried |
| 15 to 19 years | 0 (0.0%) | 0 (0.0%) |
| 20 to 34 years | 52 (100.0%) | 0 (0.0%) |
| 35 to 50 years | 0 (0.0%) | 0 (0.0%) |
| Total | 52 (100.0%) | 0 (0.0%) |
Fertility by Education in Hatteras
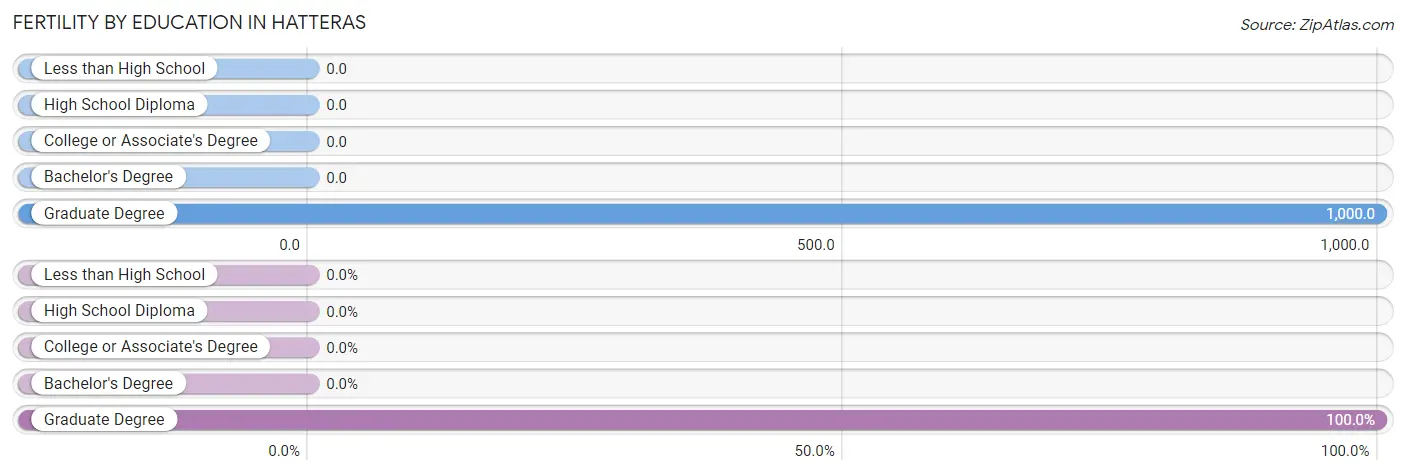
| Educational Attainment | Women with Births | Births / 1,000 Women |
| Less than High School | 0 (0.0%) | 0.0 |
| High School Diploma | 0 (0.0%) | 0.0 |
| College or Associate's Degree | 0 (0.0%) | 0.0 |
| Bachelor's Degree | 0 (0.0%) | 0.0 |
| Graduate Degree | 52 (100.0%) | 1,000.0 |
| Total | 52 (100.0%) | 981.0 |
Fertility by Education by Marriage Status in Hatteras
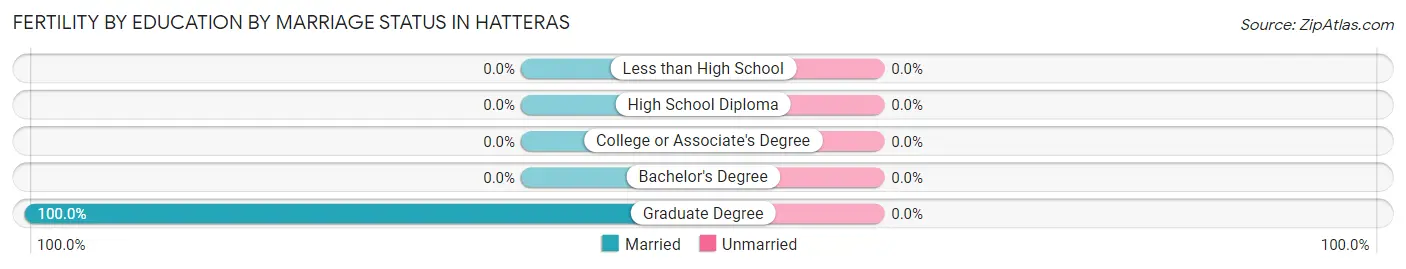
| Educational Attainment | Married | Unmarried |
| Less than High School | 0 (0.0%) | 0 (0.0%) |
| High School Diploma | 0 (0.0%) | 0 (0.0%) |
| College or Associate's Degree | 0 (0.0%) | 0 (0.0%) |
| Bachelor's Degree | 0 (0.0%) | 0 (0.0%) |
| Graduate Degree | 52 (100.0%) | 0 (0.0%) |
| Total | 52 (100.0%) | 0 (0.0%) |
Employment Characteristics in Hatteras
Employment by Class of Employer in Hatteras
Among the 230 employed individuals in Hatteras, federal government employees (61 | 26.5%), self-employed (incorporated) (59 | 25.7%), and private company employees (42 | 18.3%) make up the most common classes of employment.
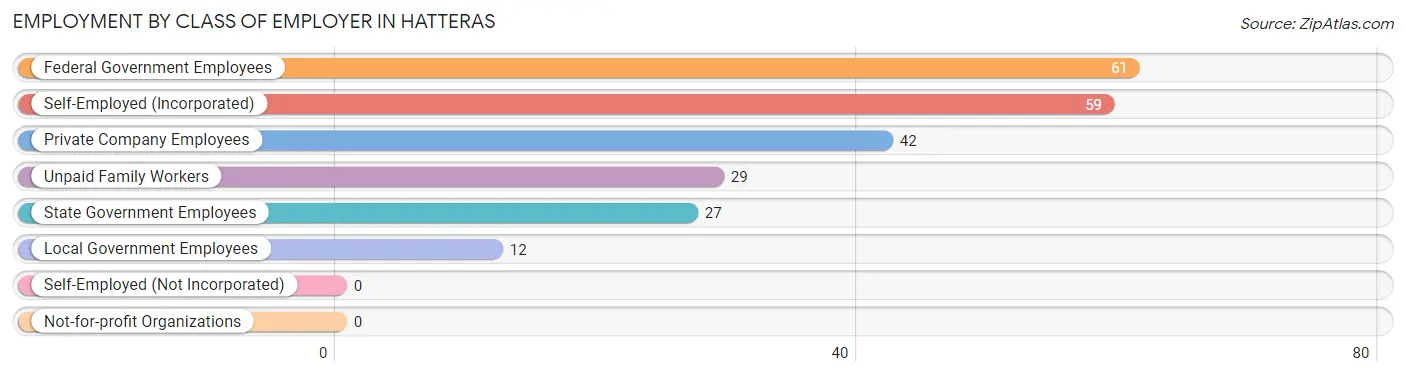
| Employer Class | # Employees | % Employees |
| Private Company Employees | 42 | 18.3% |
| Self-Employed (Incorporated) | 59 | 25.7% |
| Self-Employed (Not Incorporated) | 0 | 0.0% |
| Not-for-profit Organizations | 0 | 0.0% |
| Local Government Employees | 12 | 5.2% |
| State Government Employees | 27 | 11.7% |
| Federal Government Employees | 61 | 26.5% |
| Unpaid Family Workers | 29 | 12.6% |
| Total | 230 | 100.0% |
Employment Status by Age in Hatteras
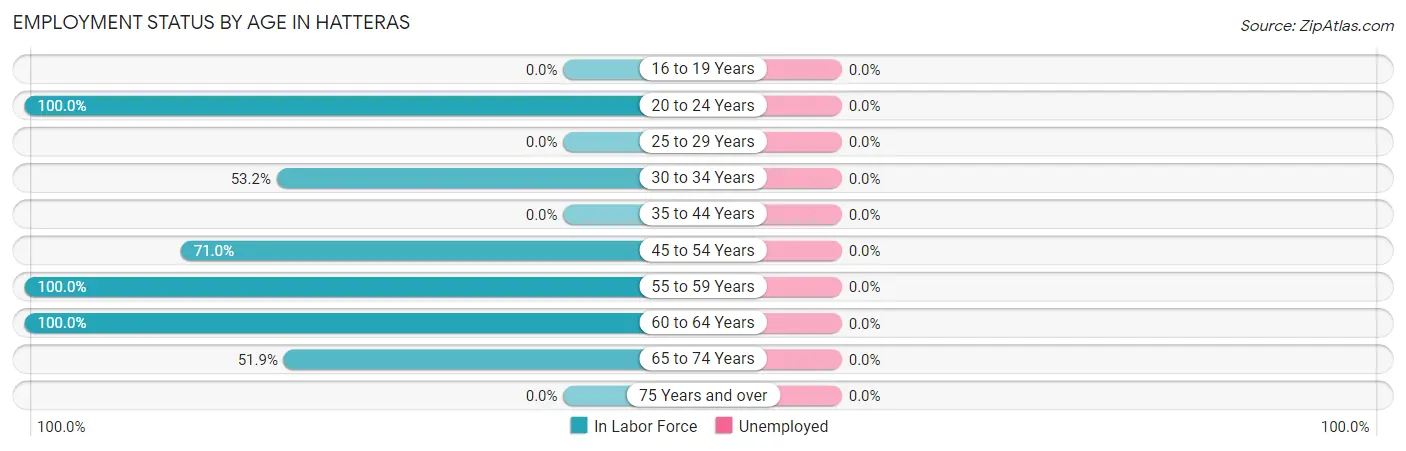
| Age Bracket | In Labor Force | Unemployed |
| 16 to 19 Years | 0 (0.0%) | 0 (0.0%) |
| 20 to 24 Years | 20 (100.0%) | 0 (0.0%) |
| 25 to 29 Years | 0 (0.0%) | 0 (0.0%) |
| 30 to 34 Years | 59 (53.2%) | 0 (0.0%) |
| 35 to 44 Years | 0 (0.0%) | 0 (0.0%) |
| 45 to 54 Years | 49 (71.0%) | 0 (0.0%) |
| 55 to 59 Years | 2 (100.0%) | 0 (0.0%) |
| 60 to 64 Years | 72 (100.0%) | 0 (0.0%) |
| 65 to 74 Years | 28 (51.9%) | 0 (0.0%) |
| 75 Years and over | 0 (0.0%) | 0 (0.0%) |
| Total | 230 (69.9%) | 0 (0.0%) |
Employment Status by Educational Attainment in Hatteras
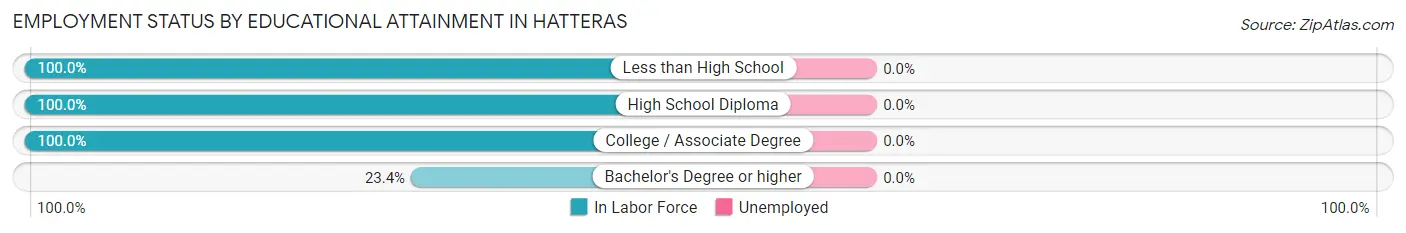
| Educational Attainment | In Labor Force | Unemployed |
| Less than High School | 2 (100.0%) | 0 (0.0%) |
| High School Diploma | 58 (100.0%) | 0 (0.0%) |
| College / Associate Degree | 100 (100.0%) | 0 (0.0%) |
| Bachelor's Degree or higher | 22 (23.4%) | 0 (0.0%) |
| Total | 182 (71.7%) | 0 (0.0%) |
Employment Occupations by Sex in Hatteras
Management, Business, Science and Arts Occupations
The most common Management, Business, Science and Arts occupations in Hatteras are Management (40 | 23.7%), Health Diagnosing & Treating (18 | 10.6%), Community & Social Service (10 | 5.9%), and Education Instruction & Library (10 | 5.9%).
Management, Business, Science and Arts Occupations by Sex
| Occupation | Male | Female |
| Management | 0 (0.0%) | 40 (100.0%) |
| Business & Financial | 0 (0.0%) | 0 (0.0%) |
| Computers, Engineering & Science | 0 (0.0%) | 0 (0.0%) |
| Computers & Mathematics | 0 (0.0%) | 0 (0.0%) |
| Architecture & Engineering | 0 (0.0%) | 0 (0.0%) |
| Life, Physical & Social Science | 0 (0.0%) | 0 (0.0%) |
| Community & Social Service | 0 (0.0%) | 10 (100.0%) |
| Education, Arts & Media | 0 (0.0%) | 0 (0.0%) |
| Legal Services & Support | 0 (0.0%) | 0 (0.0%) |
| Education Instruction & Library | 0 (0.0%) | 10 (100.0%) |
| Arts, Media & Entertainment | 0 (0.0%) | 0 (0.0%) |
| Health Diagnosing & Treating | 18 (100.0%) | 0 (0.0%) |
| Health Technologists | 0 (0.0%) | 0 (0.0%) |
| Total (Category) | 18 (26.5%) | 50 (73.5%) |
| Total (Overall) | 68 (40.2%) | 101 (59.8%) |
Services Occupations
The most common Services occupations in Hatteras are , and Cleaning & Maintenance (39 | 23.1%).
Services Occupations by Sex
| Occupation | Male | Female |
| Healthcare Support | 0 (0.0%) | 0 (0.0%) |
| Security & Protection | 0 (0.0%) | 0 (0.0%) |
| Firefighting & Prevention | 0 (0.0%) | 0 (0.0%) |
| Law Enforcement | 0 (0.0%) | 0 (0.0%) |
| Food Preparation & Serving | 0 (0.0%) | 0 (0.0%) |
| Cleaning & Maintenance | 17 (43.6%) | 22 (56.4%) |
| Personal Care & Service | 0 (0.0%) | 0 (0.0%) |
| Total (Category) | 17 (43.6%) | 22 (56.4%) |
| Total (Overall) | 68 (40.2%) | 101 (59.8%) |
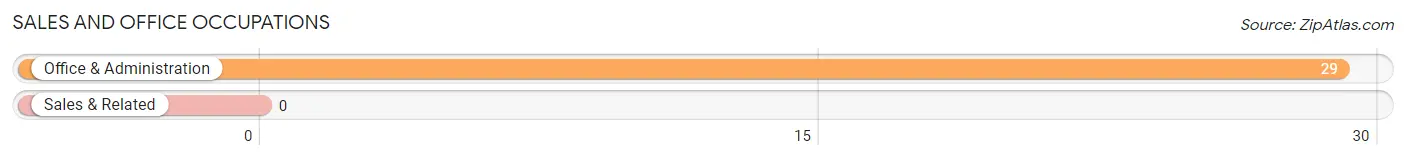
Sales and Office Occupations
The most common Sales and Office occupations in Hatteras are , and Office & Administration (29 | 17.2%).
Sales and Office Occupations by Sex
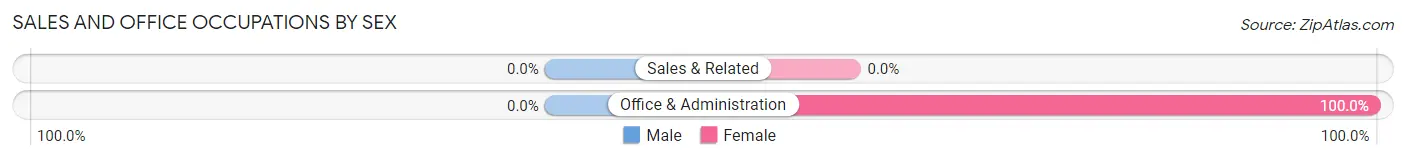
| Occupation | Male | Female |
| Sales & Related | 0 (0.0%) | 0 (0.0%) |
| Office & Administration | 0 (0.0%) | 29 (100.0%) |
| Total (Category) | 0 (0.0%) | 29 (100.0%) |
| Total (Overall) | 68 (40.2%) | 101 (59.8%) |
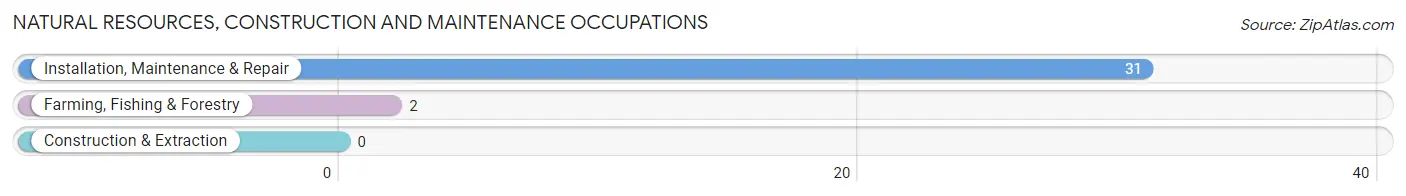
Natural Resources, Construction and Maintenance Occupations
The most common Natural Resources, Construction and Maintenance occupations in Hatteras are Installation, Maintenance & Repair (31 | 18.3%), and Farming, Fishing & Forestry (2 | 1.2%).
Natural Resources, Construction and Maintenance Occupations by Sex
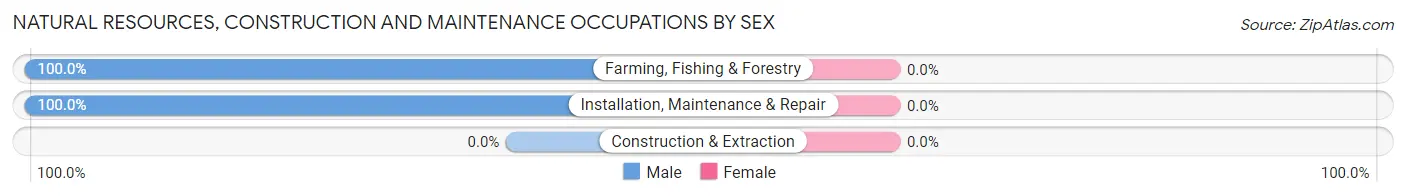
| Occupation | Male | Female |
| Farming, Fishing & Forestry | 2 (100.0%) | 0 (0.0%) |
| Construction & Extraction | 0 (0.0%) | 0 (0.0%) |
| Installation, Maintenance & Repair | 31 (100.0%) | 0 (0.0%) |
| Total (Category) | 33 (100.0%) | 0 (0.0%) |
| Total (Overall) | 68 (40.2%) | 101 (59.8%) |
Production, Transportation and Moving Occupations
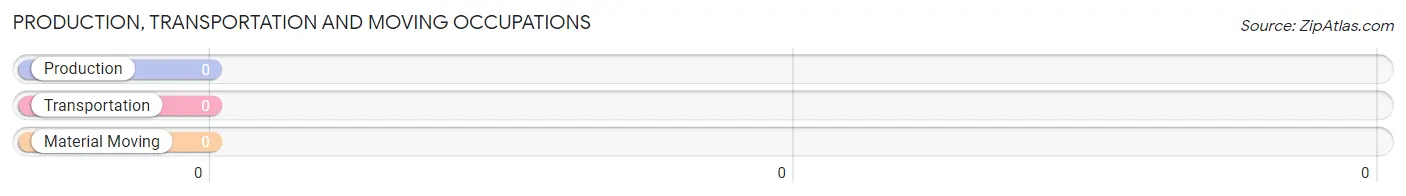
Production, Transportation and Moving Occupations by Sex
| Occupation | Male | Female |
| Production | 0 (0.0%) | 0 (0.0%) |
| Transportation | 0 (0.0%) | 0 (0.0%) |
| Material Moving | 0 (0.0%) | 0 (0.0%) |
| Total (Category) | 0 (0.0%) | 0 (0.0%) |
| Total (Overall) | 68 (40.2%) | 101 (59.8%) |
Employment Industries by Sex in Hatteras
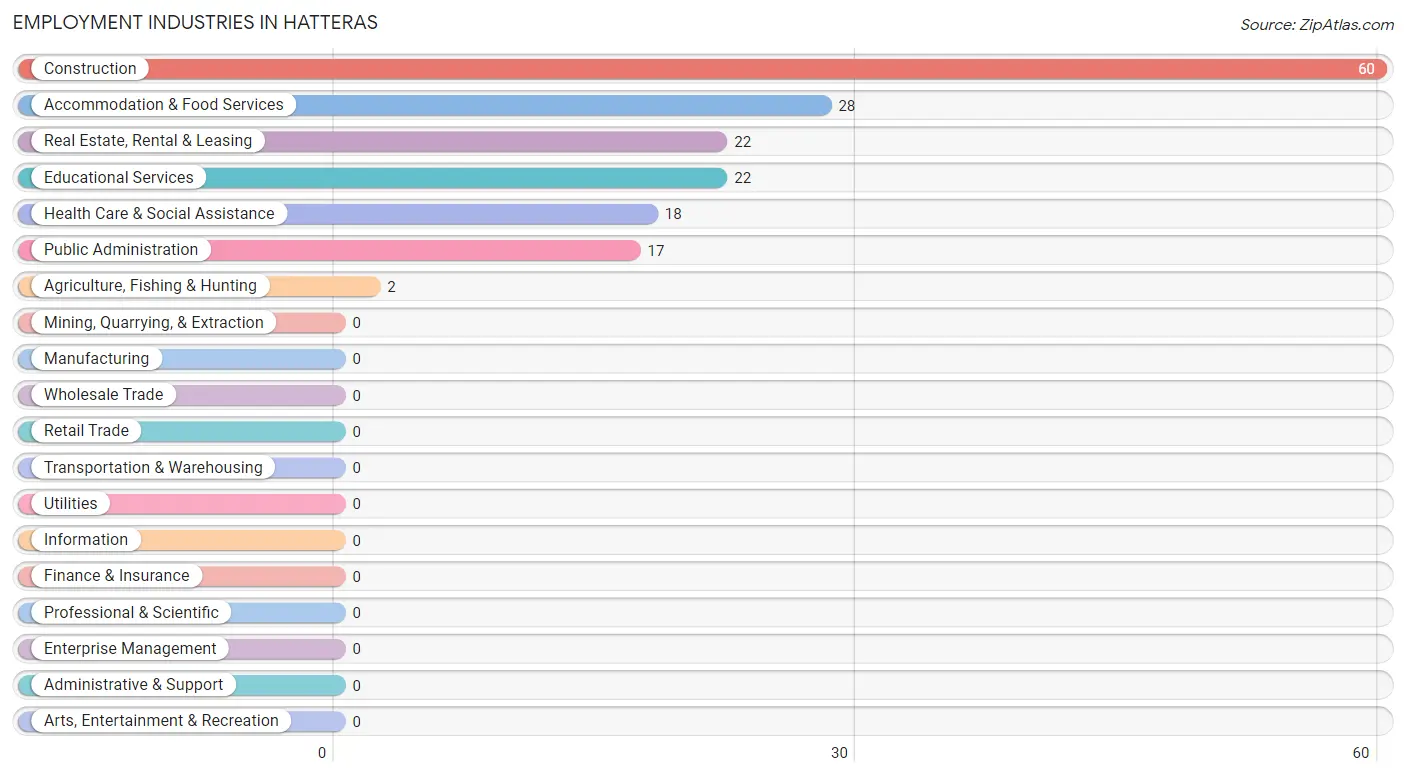
Employment Industries in Hatteras
The major employment industries in Hatteras include Construction (60 | 35.5%), Accommodation & Food Services (28 | 16.6%), Real Estate, Rental & Leasing (22 | 13.0%), Educational Services (22 | 13.0%), and Health Care & Social Assistance (18 | 10.6%).
Employment Industries by Sex in Hatteras
The Hatteras industries that see more men than women are Agriculture, Fishing & Hunting (100.0%), Health Care & Social Assistance (100.0%), and Public Administration (100.0%), whereas the industries that tend to have a higher number of women are Real Estate, Rental & Leasing (100.0%), Educational Services (100.0%), and Accommodation & Food Services (100.0%).
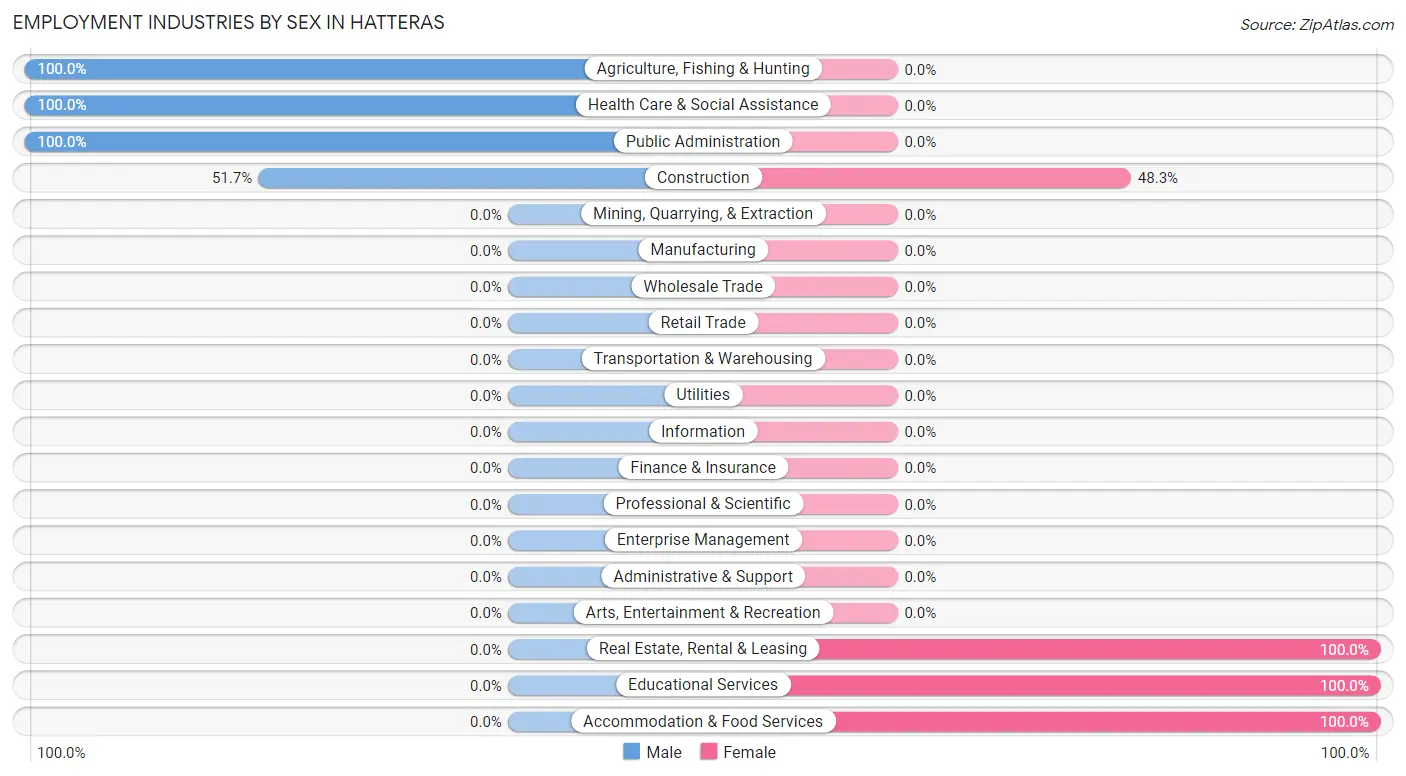
| Industry | Male | Female |
| Agriculture, Fishing & Hunting | 2 (100.0%) | 0 (0.0%) |
| Mining, Quarrying, & Extraction | 0 (0.0%) | 0 (0.0%) |
| Construction | 31 (51.7%) | 29 (48.3%) |
| Manufacturing | 0 (0.0%) | 0 (0.0%) |
| Wholesale Trade | 0 (0.0%) | 0 (0.0%) |
| Retail Trade | 0 (0.0%) | 0 (0.0%) |
| Transportation & Warehousing | 0 (0.0%) | 0 (0.0%) |
| Utilities | 0 (0.0%) | 0 (0.0%) |
| Information | 0 (0.0%) | 0 (0.0%) |
| Finance & Insurance | 0 (0.0%) | 0 (0.0%) |
| Real Estate, Rental & Leasing | 0 (0.0%) | 22 (100.0%) |
| Professional & Scientific | 0 (0.0%) | 0 (0.0%) |
| Enterprise Management | 0 (0.0%) | 0 (0.0%) |
| Administrative & Support | 0 (0.0%) | 0 (0.0%) |
| Educational Services | 0 (0.0%) | 22 (100.0%) |
| Health Care & Social Assistance | 18 (100.0%) | 0 (0.0%) |
| Arts, Entertainment & Recreation | 0 (0.0%) | 0 (0.0%) |
| Accommodation & Food Services | 0 (0.0%) | 28 (100.0%) |
| Public Administration | 17 (100.0%) | 0 (0.0%) |
| Total | 68 (40.2%) | 101 (59.8%) |
Education in Hatteras
School Enrollment in Hatteras
The most common levels of schooling among the 53 students in Hatteras are high school (33 | 62.3%), college / undergraduate (18 | 34.0%), and middle school (2 | 3.8%).
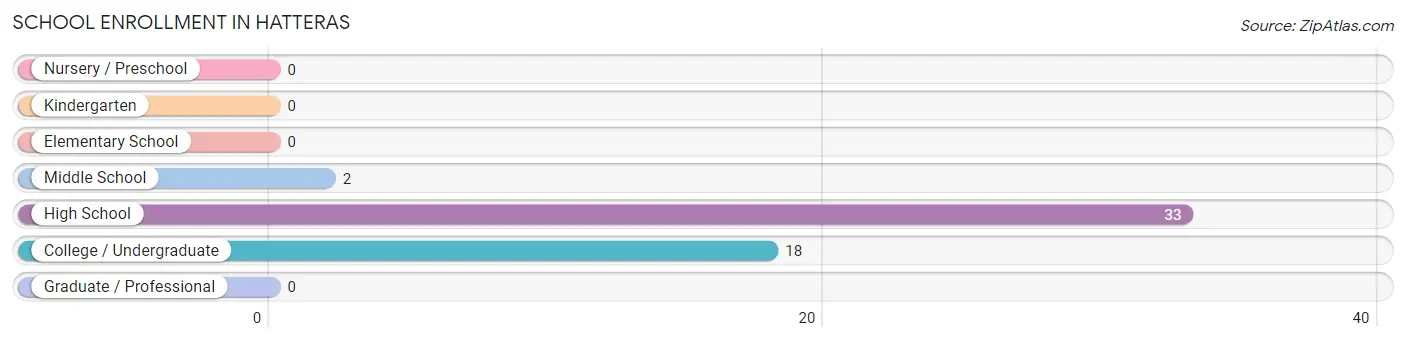
| School Level | # Students | % Students |
| Nursery / Preschool | 0 | 0.0% |
| Kindergarten | 0 | 0.0% |
| Elementary School | 0 | 0.0% |
| Middle School | 2 | 3.8% |
| High School | 33 | 62.3% |
| College / Undergraduate | 18 | 34.0% |
| Graduate / Professional | 0 | 0.0% |
| Total | 53 | 100.0% |
School Enrollment by Age by Funding Source in Hatteras
Out of a total of 53 students who are enrolled in schools in Hatteras, 18 (34.0%) attend a private institution, while the remaining 35 (66.0%) are enrolled in public schools. The age group of 25 to 34 year olds has the highest likelihood of being enrolled in private schools, with 18 (100.0% in the age bracket) enrolled. Conversely, the age group of 10 to 14 year olds has the lowest likelihood of being enrolled in a private school, with 2 (100.0% in the age bracket) attending a public institution.
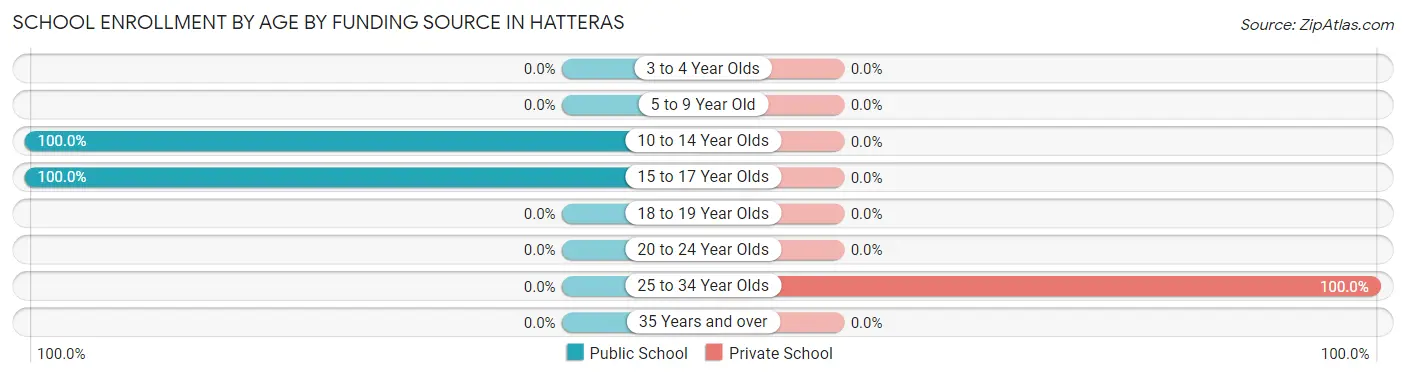
| Age Bracket | Public School | Private School |
| 3 to 4 Year Olds | 0 (0.0%) | 0 (0.0%) |
| 5 to 9 Year Old | 0 (0.0%) | 0 (0.0%) |
| 10 to 14 Year Olds | 2 (100.0%) | 0 (0.0%) |
| 15 to 17 Year Olds | 33 (100.0%) | 0 (0.0%) |
| 18 to 19 Year Olds | 0 (0.0%) | 0 (0.0%) |
| 20 to 24 Year Olds | 0 (0.0%) | 0 (0.0%) |
| 25 to 34 Year Olds | 0 (0.0%) | 18 (100.0%) |
| 35 Years and over | 0 (0.0%) | 0 (0.0%) |
| Total | 35 (66.0%) | 18 (34.0%) |
Educational Attainment by Field of Study in Hatteras
Education (90 | 40.5%), arts & humanities (72 | 32.4%), visual & performing arts (26 | 11.7%), business (22 | 9.9%), and social sciences (12 | 5.4%) are the most common fields of study among 222 individuals in Hatteras who have obtained a bachelor's degree or higher.
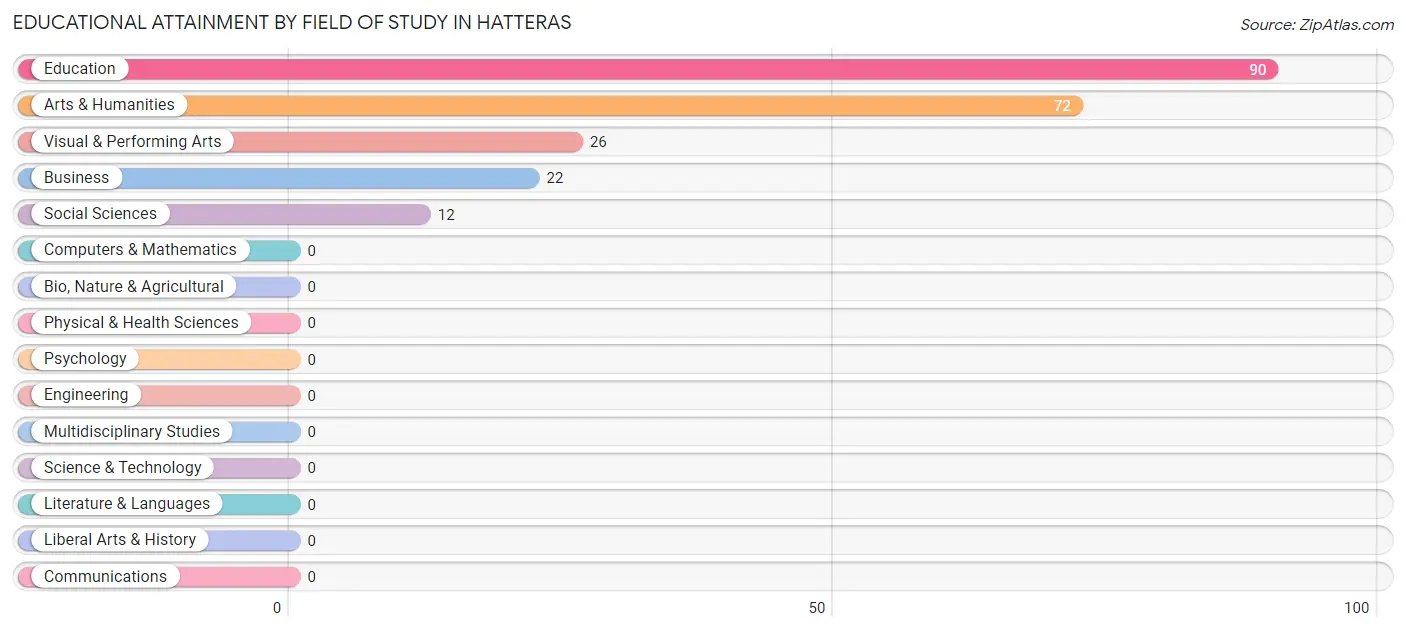
| Field of Study | # Graduates | % Graduates |
| Computers & Mathematics | 0 | 0.0% |
| Bio, Nature & Agricultural | 0 | 0.0% |
| Physical & Health Sciences | 0 | 0.0% |
| Psychology | 0 | 0.0% |
| Social Sciences | 12 | 5.4% |
| Engineering | 0 | 0.0% |
| Multidisciplinary Studies | 0 | 0.0% |
| Science & Technology | 0 | 0.0% |
| Business | 22 | 9.9% |
| Education | 90 | 40.5% |
| Literature & Languages | 0 | 0.0% |
| Liberal Arts & History | 0 | 0.0% |
| Visual & Performing Arts | 26 | 11.7% |
| Communications | 0 | 0.0% |
| Arts & Humanities | 72 | 32.4% |
| Total | 222 | 100.0% |
Transportation & Commute in Hatteras
Vehicle Availability by Sex in Hatteras
The most prevalent vehicle ownership categories in Hatteras are males with 3 vehicles (72, accounting for 67.3%) and females with 3 vehicles (51, making up 71.3%).
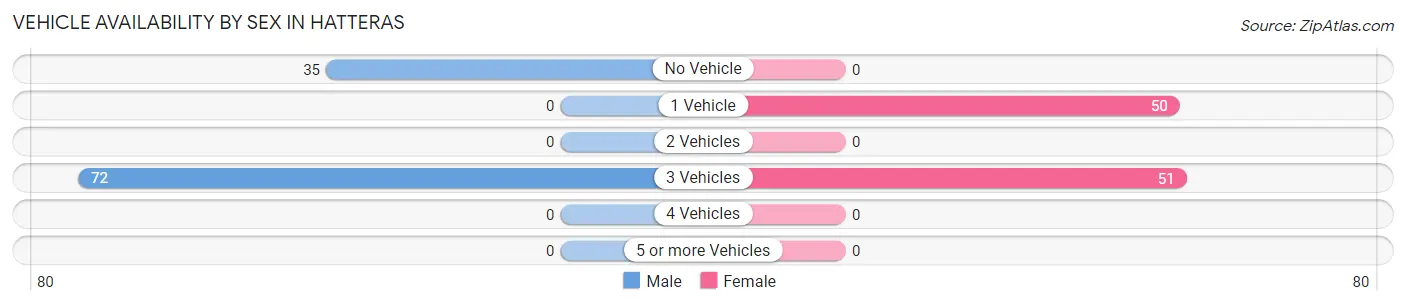
| Vehicles Available | Male | Female |
| No Vehicle | 35 (32.7%) | 0 (0.0%) |
| 1 Vehicle | 0 (0.0%) | 50 (49.5%) |
| 2 Vehicles | 0 (0.0%) | 0 (0.0%) |
| 3 Vehicles | 72 (67.3%) | 51 (50.5%) |
| 4 Vehicles | 0 (0.0%) | 0 (0.0%) |
| 5 or more Vehicles | 0 (0.0%) | 0 (0.0%) |
| Total | 107 (100.0%) | 101 (100.0%) |
Commute Time in Hatteras
The most frequently occuring commute durations in Hatteras are 30 to 34 minutes (66 commuters, 33.2%), 5 to 9 minutes (42 commuters, 21.1%), and 10 to 14 minutes (42 commuters, 21.1%).
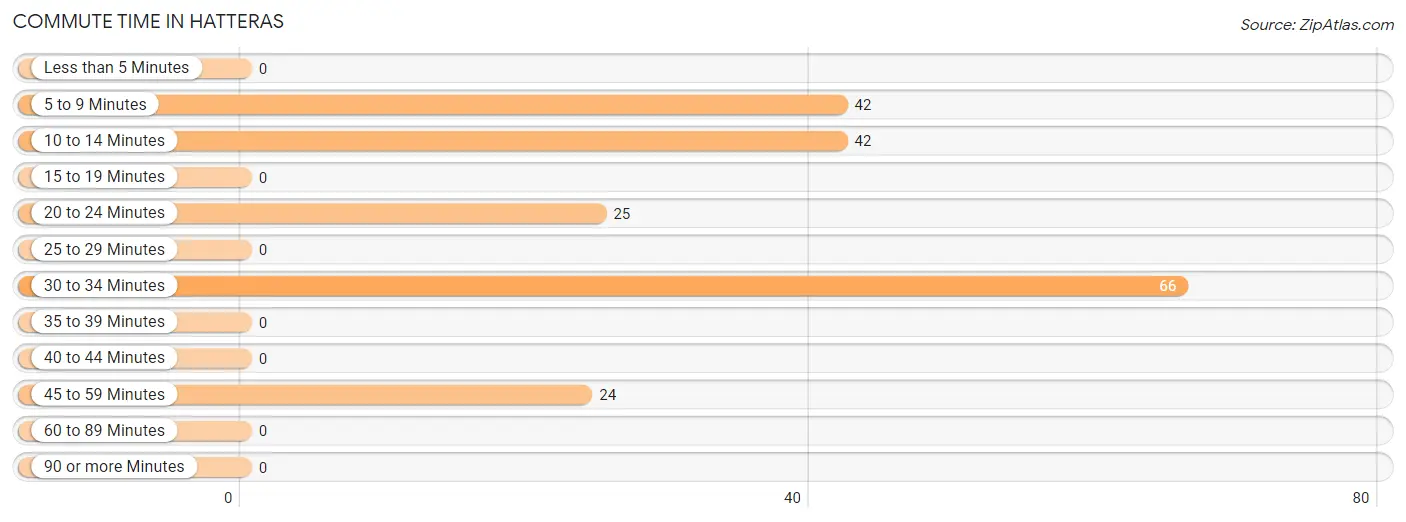
| Commute Time | # Commuters | % Commuters |
| Less than 5 Minutes | 0 | 0.0% |
| 5 to 9 Minutes | 42 | 21.1% |
| 10 to 14 Minutes | 42 | 21.1% |
| 15 to 19 Minutes | 0 | 0.0% |
| 20 to 24 Minutes | 25 | 12.6% |
| 25 to 29 Minutes | 0 | 0.0% |
| 30 to 34 Minutes | 66 | 33.2% |
| 35 to 39 Minutes | 0 | 0.0% |
| 40 to 44 Minutes | 0 | 0.0% |
| 45 to 59 Minutes | 24 | 12.1% |
| 60 to 89 Minutes | 0 | 0.0% |
| 90 or more Minutes | 0 | 0.0% |
Commute Time by Sex in Hatteras
The most common commute times in Hatteras are 30 to 34 minutes (66 commuters, 52.0%) for males and 5 to 9 minutes (28 commuters, 38.9%) for females.
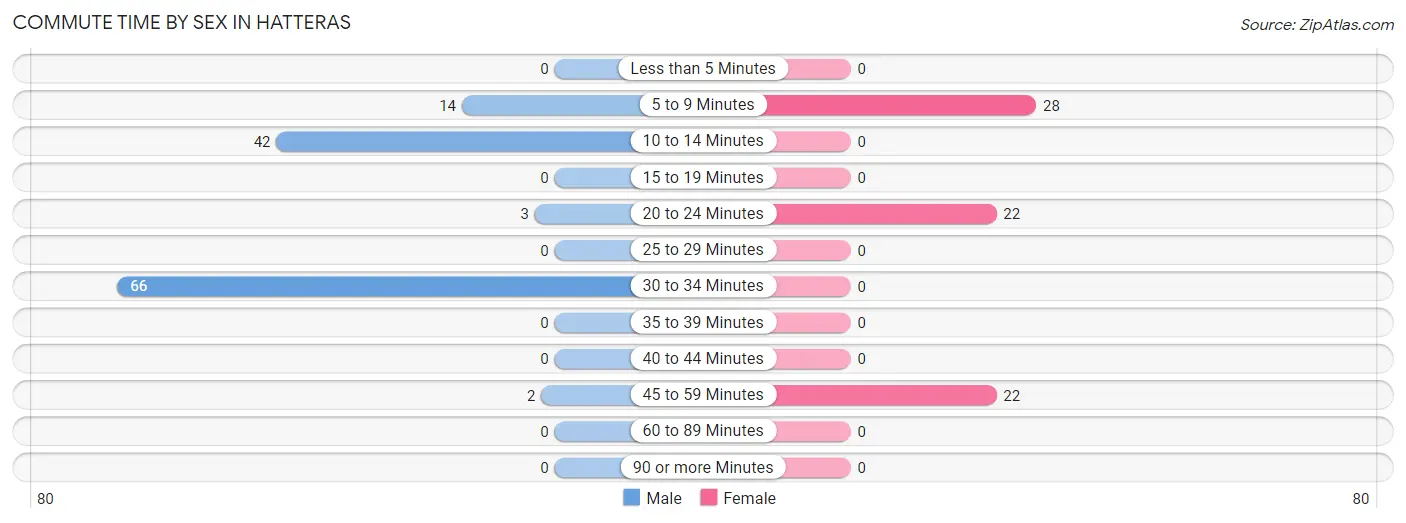
| Commute Time | Male | Female |
| Less than 5 Minutes | 0 (0.0%) | 0 (0.0%) |
| 5 to 9 Minutes | 14 (11.0%) | 28 (38.9%) |
| 10 to 14 Minutes | 42 (33.1%) | 0 (0.0%) |
| 15 to 19 Minutes | 0 (0.0%) | 0 (0.0%) |
| 20 to 24 Minutes | 3 (2.4%) | 22 (30.6%) |
| 25 to 29 Minutes | 0 (0.0%) | 0 (0.0%) |
| 30 to 34 Minutes | 66 (52.0%) | 0 (0.0%) |
| 35 to 39 Minutes | 0 (0.0%) | 0 (0.0%) |
| 40 to 44 Minutes | 0 (0.0%) | 0 (0.0%) |
| 45 to 59 Minutes | 2 (1.6%) | 22 (30.6%) |
| 60 to 89 Minutes | 0 (0.0%) | 0 (0.0%) |
| 90 or more Minutes | 0 (0.0%) | 0 (0.0%) |
Time of Departure to Work by Sex in Hatteras
The most frequent times of departure to work in Hatteras are 6:30 AM to 6:59 AM (47, 37.0%) for males and 12:00 PM to 3:59 PM (28, 38.9%) for females.
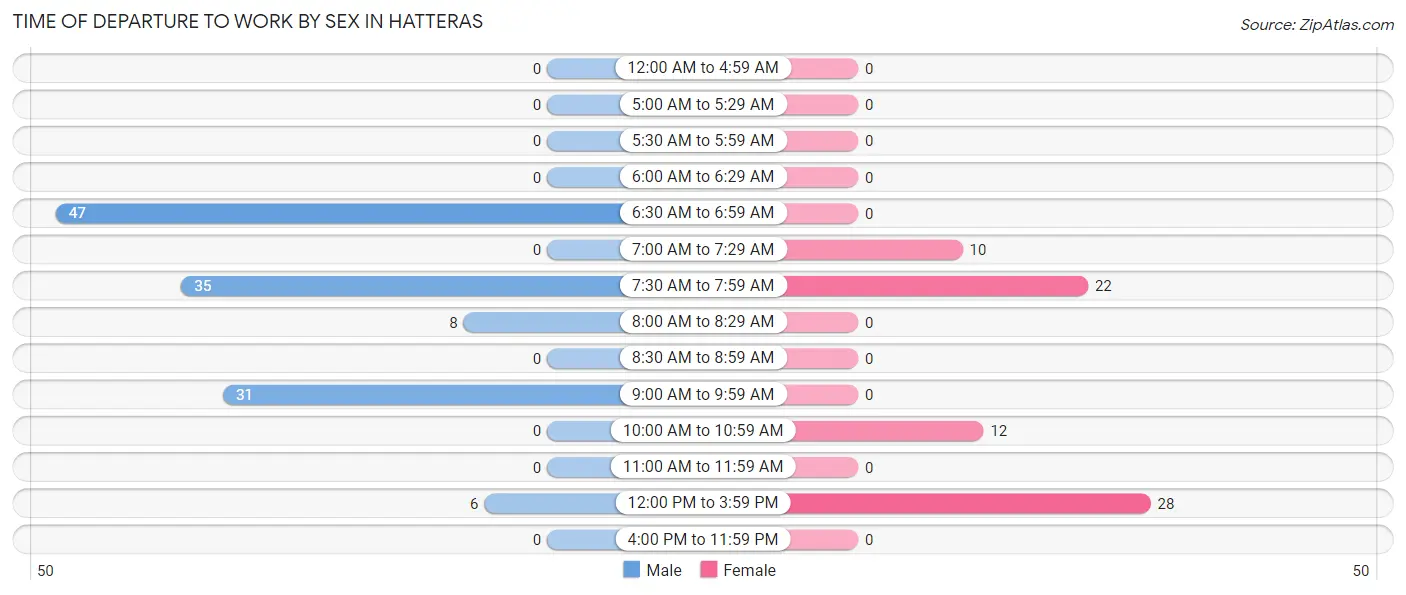
| Time of Departure | Male | Female |
| 12:00 AM to 4:59 AM | 0 (0.0%) | 0 (0.0%) |
| 5:00 AM to 5:29 AM | 0 (0.0%) | 0 (0.0%) |
| 5:30 AM to 5:59 AM | 0 (0.0%) | 0 (0.0%) |
| 6:00 AM to 6:29 AM | 0 (0.0%) | 0 (0.0%) |
| 6:30 AM to 6:59 AM | 47 (37.0%) | 0 (0.0%) |
| 7:00 AM to 7:29 AM | 0 (0.0%) | 10 (13.9%) |
| 7:30 AM to 7:59 AM | 35 (27.6%) | 22 (30.6%) |
| 8:00 AM to 8:29 AM | 8 (6.3%) | 0 (0.0%) |
| 8:30 AM to 8:59 AM | 0 (0.0%) | 0 (0.0%) |
| 9:00 AM to 9:59 AM | 31 (24.4%) | 0 (0.0%) |
| 10:00 AM to 10:59 AM | 0 (0.0%) | 12 (16.7%) |
| 11:00 AM to 11:59 AM | 0 (0.0%) | 0 (0.0%) |
| 12:00 PM to 3:59 PM | 6 (4.7%) | 28 (38.9%) |
| 4:00 PM to 11:59 PM | 0 (0.0%) | 0 (0.0%) |
| Total | 127 (100.0%) | 72 (100.0%) |
Housing Occupancy in Hatteras
Occupancy by Ownership in Hatteras
Of the total 186 dwellings in Hatteras, owner-occupied units account for 95 (51.1%), while renter-occupied units make up 91 (48.9%).
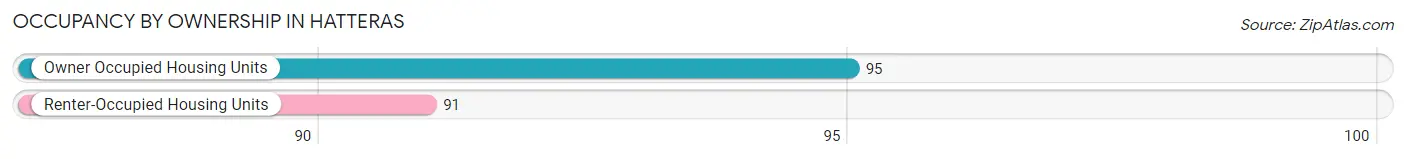
| Occupancy | # Housing Units | % Housing Units |
| Owner Occupied Housing Units | 95 | 51.1% |
| Renter-Occupied Housing Units | 91 | 48.9% |
| Total Occupied Housing Units | 186 | 100.0% |
Occupancy by Household Size in Hatteras
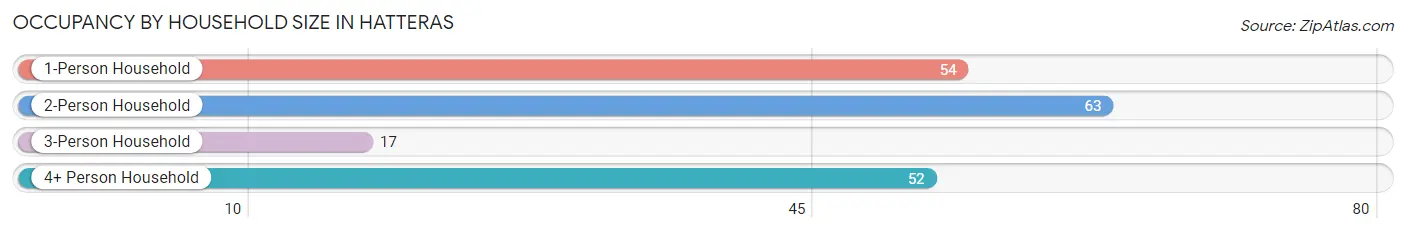
| Household Size | # Housing Units | % Housing Units |
| 1-Person Household | 54 | 29.0% |
| 2-Person Household | 63 | 33.9% |
| 3-Person Household | 17 | 9.1% |
| 4+ Person Household | 52 | 28.0% |
| Total Housing Units | 186 | 100.0% |
Occupancy by Ownership by Household Size in Hatteras
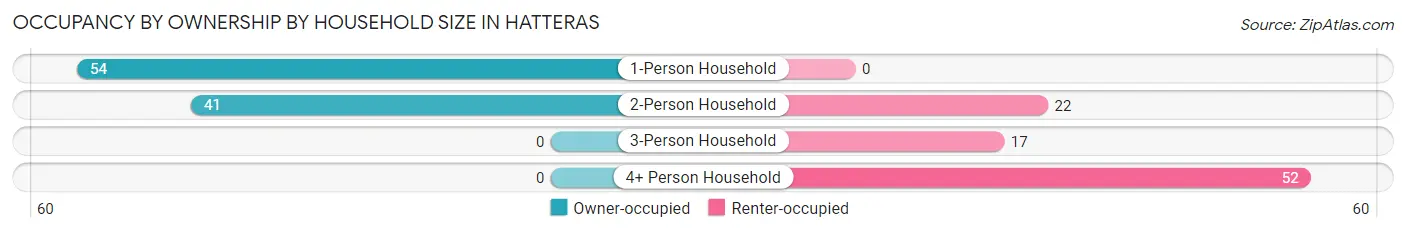
| Household Size | Owner-occupied | Renter-occupied |
| 1-Person Household | 54 (100.0%) | 0 (0.0%) |
| 2-Person Household | 41 (65.1%) | 22 (34.9%) |
| 3-Person Household | 0 (0.0%) | 17 (100.0%) |
| 4+ Person Household | 0 (0.0%) | 52 (100.0%) |
| Total Housing Units | 95 (51.1%) | 91 (48.9%) |
Occupancy by Educational Attainment in Hatteras
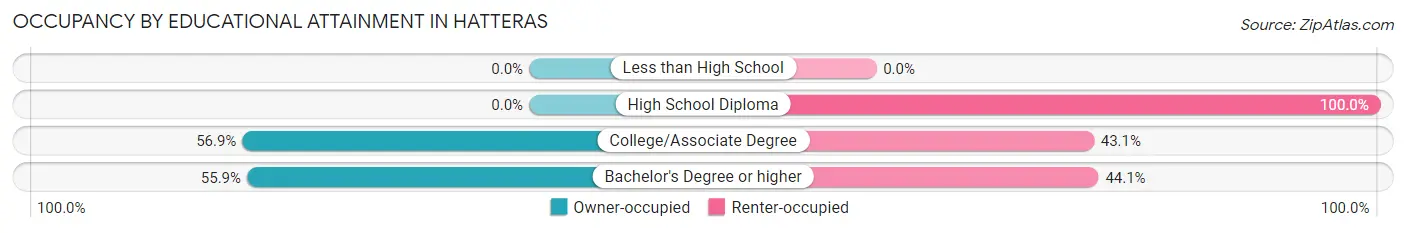
| Household Size | Owner-occupied | Renter-occupied |
| Less than High School | 0 (0.0%) | 0 (0.0%) |
| High School Diploma | 0 (0.0%) | 17 (100.0%) |
| College/Associate Degree | 29 (56.9%) | 22 (43.1%) |
| Bachelor's Degree or higher | 66 (55.9%) | 52 (44.1%) |
Occupancy by Age of Householder in Hatteras
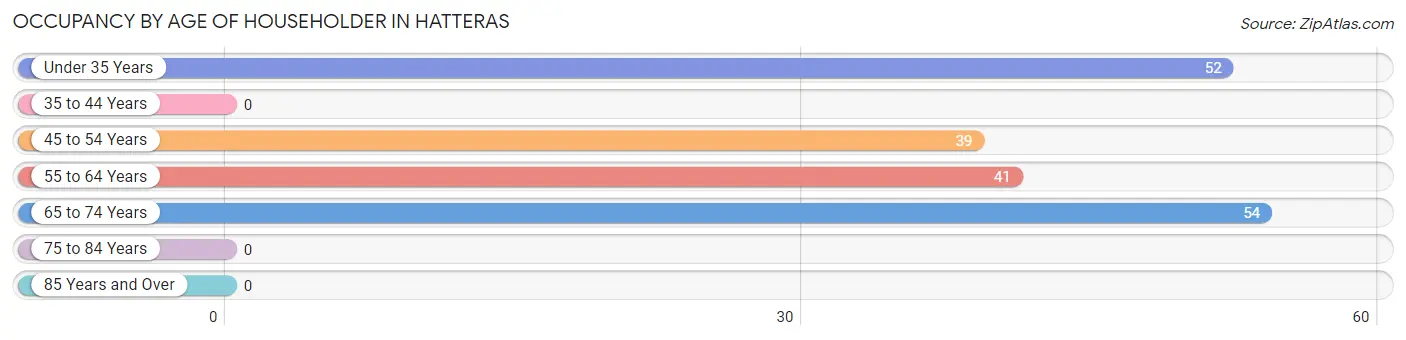
| Age Bracket | # Households | % Households |
| Under 35 Years | 52 | 28.0% |
| 35 to 44 Years | 0 | 0.0% |
| 45 to 54 Years | 39 | 21.0% |
| 55 to 64 Years | 41 | 22.0% |
| 65 to 74 Years | 54 | 29.0% |
| 75 to 84 Years | 0 | 0.0% |
| 85 Years and Over | 0 | 0.0% |
| Total | 186 | 100.0% |
Housing Finances in Hatteras
Median Income by Occupancy in Hatteras
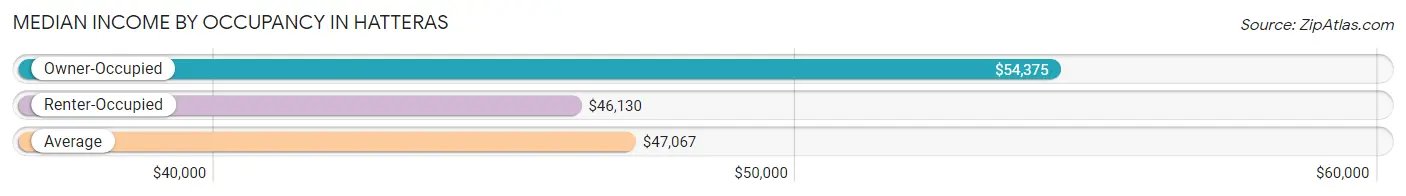
| Occupancy Type | # Households | Median Income |
| Owner-Occupied | 95 (51.1%) | $54,375 |
| Renter-Occupied | 91 (48.9%) | $46,130 |
| Average | 186 (100.0%) | $47,067 |
Occupancy by Householder Income Bracket in Hatteras
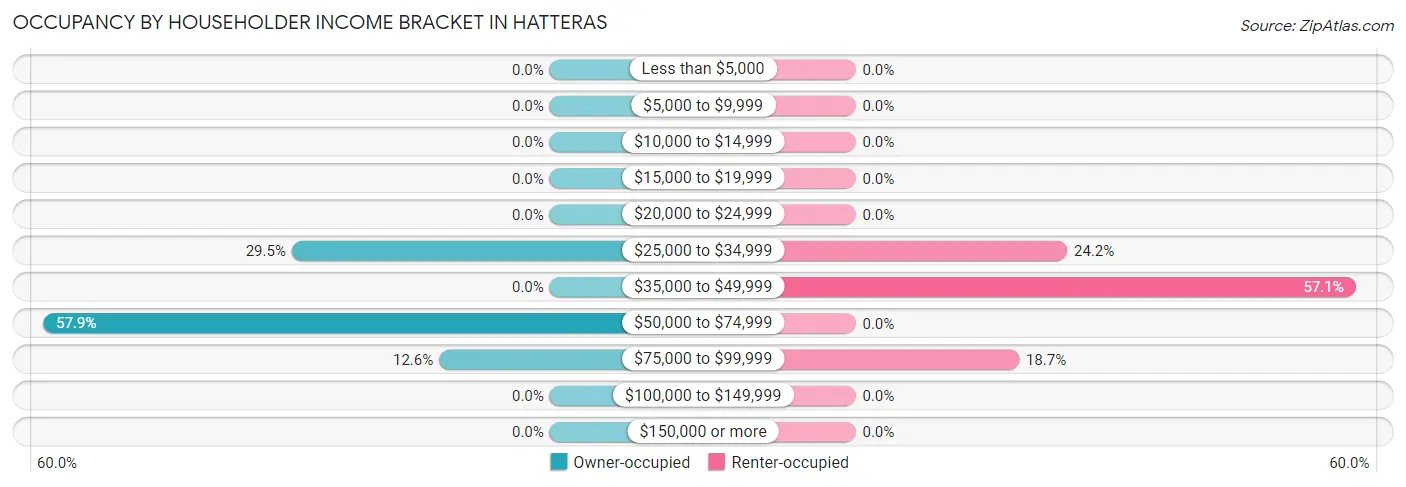
| Income Bracket | Owner-occupied | Renter-occupied |
| Less than $5,000 | 0 (0.0%) | 0 (0.0%) |
| $5,000 to $9,999 | 0 (0.0%) | 0 (0.0%) |
| $10,000 to $14,999 | 0 (0.0%) | 0 (0.0%) |
| $15,000 to $19,999 | 0 (0.0%) | 0 (0.0%) |
| $20,000 to $24,999 | 0 (0.0%) | 0 (0.0%) |
| $25,000 to $34,999 | 28 (29.5%) | 22 (24.2%) |
| $35,000 to $49,999 | 0 (0.0%) | 52 (57.1%) |
| $50,000 to $74,999 | 55 (57.9%) | 0 (0.0%) |
| $75,000 to $99,999 | 12 (12.6%) | 17 (18.7%) |
| $100,000 to $149,999 | 0 (0.0%) | 0 (0.0%) |
| $150,000 or more | 0 (0.0%) | 0 (0.0%) |
| Total | 95 (100.0%) | 91 (100.0%) |
Monthly Housing Cost Tiers in Hatteras
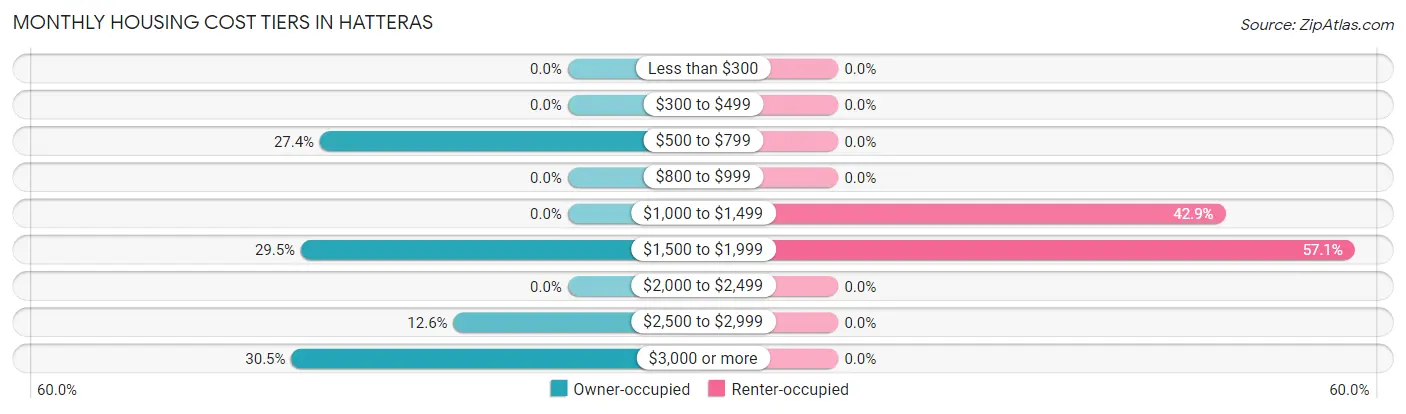
| Monthly Cost | Owner-occupied | Renter-occupied |
| Less than $300 | 0 (0.0%) | 0 (0.0%) |
| $300 to $499 | 0 (0.0%) | 0 (0.0%) |
| $500 to $799 | 26 (27.4%) | 0 (0.0%) |
| $800 to $999 | 0 (0.0%) | 0 (0.0%) |
| $1,000 to $1,499 | 0 (0.0%) | 39 (42.9%) |
| $1,500 to $1,999 | 28 (29.5%) | 52 (57.1%) |
| $2,000 to $2,499 | 0 (0.0%) | 0 (0.0%) |
| $2,500 to $2,999 | 12 (12.6%) | 0 (0.0%) |
| $3,000 or more | 29 (30.5%) | 0 (0.0%) |
| Total | 95 (100.0%) | 91 (100.0%) |
Physical Housing Characteristics in Hatteras
Housing Structures in Hatteras
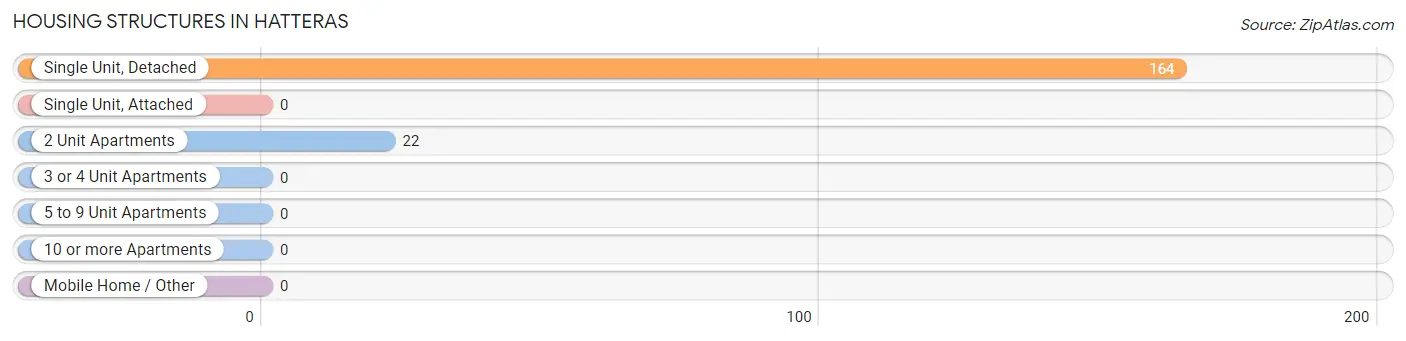
| Structure Type | # Housing Units | % Housing Units |
| Single Unit, Detached | 164 | 88.2% |
| Single Unit, Attached | 0 | 0.0% |
| 2 Unit Apartments | 22 | 11.8% |
| 3 or 4 Unit Apartments | 0 | 0.0% |
| 5 to 9 Unit Apartments | 0 | 0.0% |
| 10 or more Apartments | 0 | 0.0% |
| Mobile Home / Other | 0 | 0.0% |
| Total | 186 | 100.0% |
Housing Structures by Occupancy in Hatteras
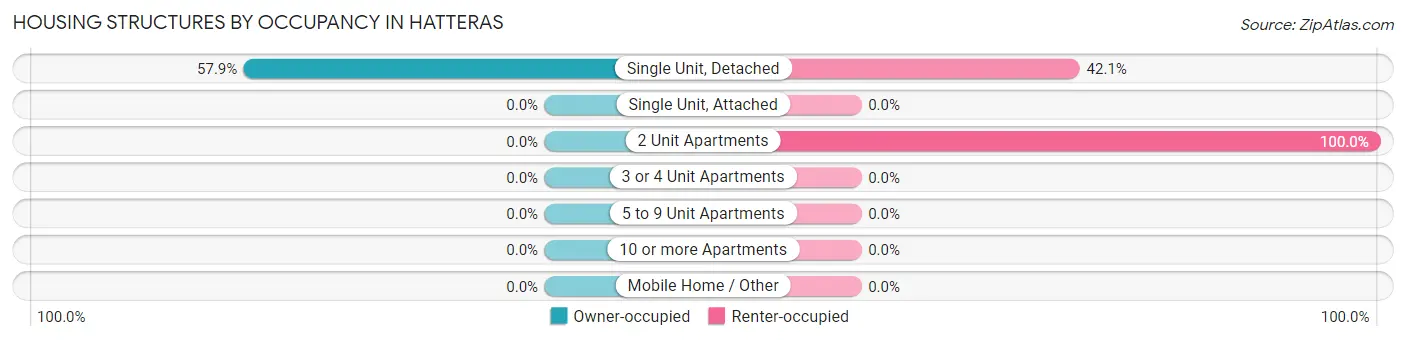
| Structure Type | Owner-occupied | Renter-occupied |
| Single Unit, Detached | 95 (57.9%) | 69 (42.1%) |
| Single Unit, Attached | 0 (0.0%) | 0 (0.0%) |
| 2 Unit Apartments | 0 (0.0%) | 22 (100.0%) |
| 3 or 4 Unit Apartments | 0 (0.0%) | 0 (0.0%) |
| 5 to 9 Unit Apartments | 0 (0.0%) | 0 (0.0%) |
| 10 or more Apartments | 0 (0.0%) | 0 (0.0%) |
| Mobile Home / Other | 0 (0.0%) | 0 (0.0%) |
| Total | 95 (51.1%) | 91 (48.9%) |
Housing Structures by Number of Rooms in Hatteras
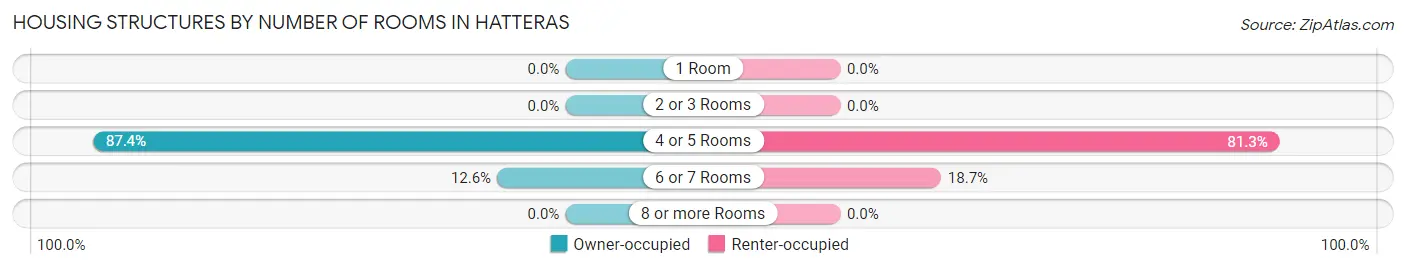
| Number of Rooms | Owner-occupied | Renter-occupied |
| 1 Room | 0 (0.0%) | 0 (0.0%) |
| 2 or 3 Rooms | 0 (0.0%) | 0 (0.0%) |
| 4 or 5 Rooms | 83 (87.4%) | 74 (81.3%) |
| 6 or 7 Rooms | 12 (12.6%) | 17 (18.7%) |
| 8 or more Rooms | 0 (0.0%) | 0 (0.0%) |
| Total | 95 (100.0%) | 91 (100.0%) |
Housing Structure by Heating Type in Hatteras
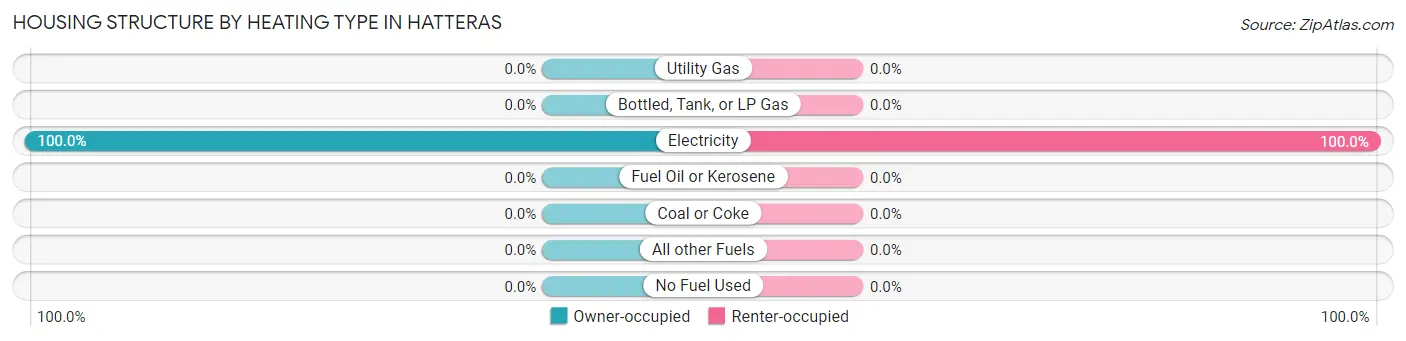
| Heating Type | Owner-occupied | Renter-occupied |
| Utility Gas | 0 (0.0%) | 0 (0.0%) |
| Bottled, Tank, or LP Gas | 0 (0.0%) | 0 (0.0%) |
| Electricity | 95 (100.0%) | 91 (100.0%) |
| Fuel Oil or Kerosene | 0 (0.0%) | 0 (0.0%) |
| Coal or Coke | 0 (0.0%) | 0 (0.0%) |
| All other Fuels | 0 (0.0%) | 0 (0.0%) |
| No Fuel Used | 0 (0.0%) | 0 (0.0%) |
| Total | 95 (100.0%) | 91 (100.0%) |
Household Vehicle Usage in Hatteras
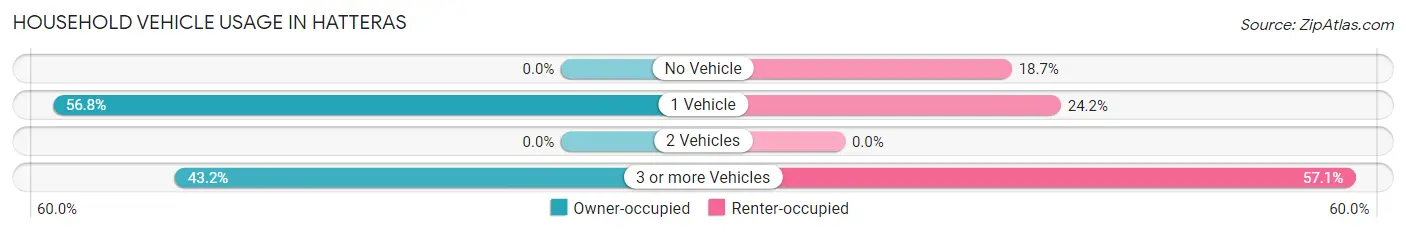
| Vehicles per Household | Owner-occupied | Renter-occupied |
| No Vehicle | 0 (0.0%) | 17 (18.7%) |
| 1 Vehicle | 54 (56.8%) | 22 (24.2%) |
| 2 Vehicles | 0 (0.0%) | 0 (0.0%) |
| 3 or more Vehicles | 41 (43.2%) | 52 (57.1%) |
| Total | 95 (100.0%) | 91 (100.0%) |
Real Estate & Mortgages in Hatteras
Real Estate and Mortgage Overview in Hatteras
| Characteristic | Without Mortgage | With Mortgage |
| Housing Units | 26 | 69 |
| Median Property Value | - | - |
| Median Household Income | - | - |
| Monthly Housing Costs | - | - |
| Real Estate Taxes | - | - |
Property Value by Mortgage Status in Hatteras
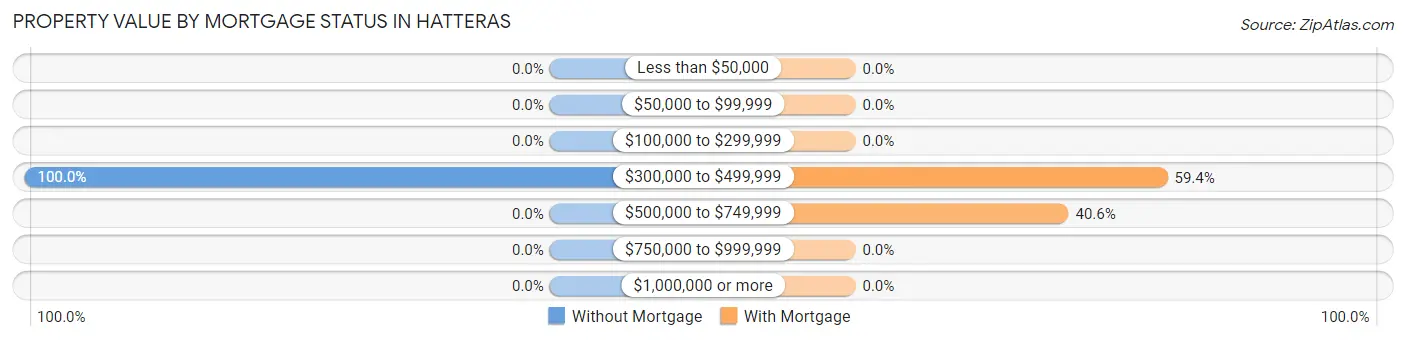
| Property Value | Without Mortgage | With Mortgage |
| Less than $50,000 | 0 (0.0%) | 0 (0.0%) |
| $50,000 to $99,999 | 0 (0.0%) | 0 (0.0%) |
| $100,000 to $299,999 | 0 (0.0%) | 0 (0.0%) |
| $300,000 to $499,999 | 26 (100.0%) | 41 (59.4%) |
| $500,000 to $749,999 | 0 (0.0%) | 28 (40.6%) |
| $750,000 to $999,999 | 0 (0.0%) | 0 (0.0%) |
| $1,000,000 or more | 0 (0.0%) | 0 (0.0%) |
| Total | 26 (100.0%) | 69 (100.0%) |
Household Income by Mortgage Status in Hatteras
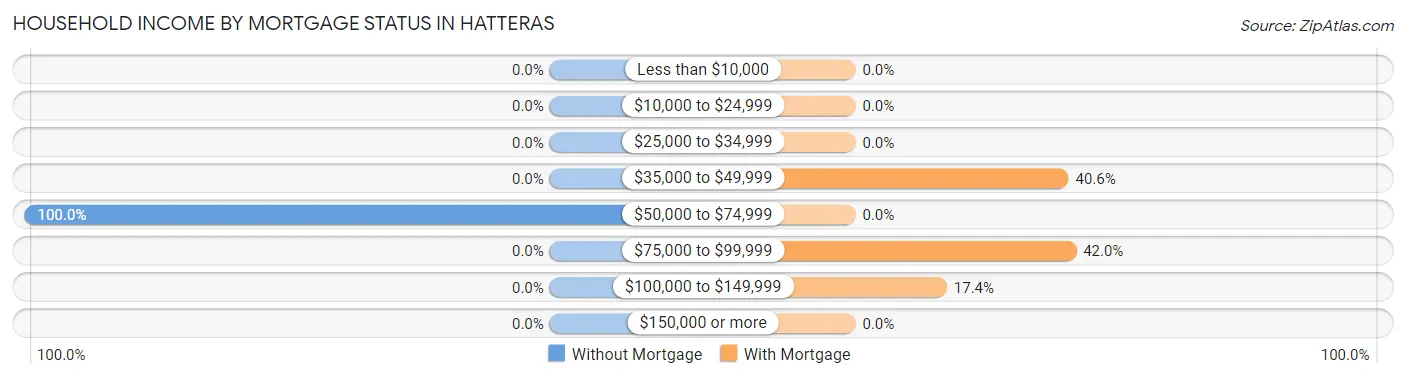
| Household Income | Without Mortgage | With Mortgage |
| Less than $10,000 | 0 (0.0%) | 0 (0.0%) |
| $10,000 to $24,999 | 0 (0.0%) | 0 (0.0%) |
| $25,000 to $34,999 | 0 (0.0%) | 0 (0.0%) |
| $35,000 to $49,999 | 0 (0.0%) | 28 (40.6%) |
| $50,000 to $74,999 | 26 (100.0%) | 0 (0.0%) |
| $75,000 to $99,999 | 0 (0.0%) | 29 (42.0%) |
| $100,000 to $149,999 | 0 (0.0%) | 12 (17.4%) |
| $150,000 or more | 0 (0.0%) | 0 (0.0%) |
| Total | 26 (100.0%) | 69 (100.0%) |
Property Value to Household Income Ratio in Hatteras
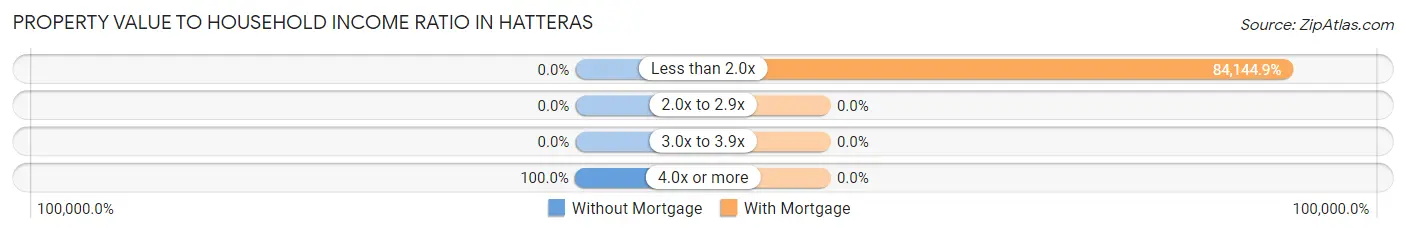
| Value-to-Income Ratio | Without Mortgage | With Mortgage |
| Less than 2.0x | 0 (0.0%) | 58,060 (84,144.9%) |
| 2.0x to 2.9x | 0 (0.0%) | 0 (0.0%) |
| 3.0x to 3.9x | 0 (0.0%) | 0 (0.0%) |
| 4.0x or more | 26 (100.0%) | 0 (0.0%) |
| Total | 26 (100.0%) | 69 (100.0%) |
Real Estate Taxes by Mortgage Status in Hatteras
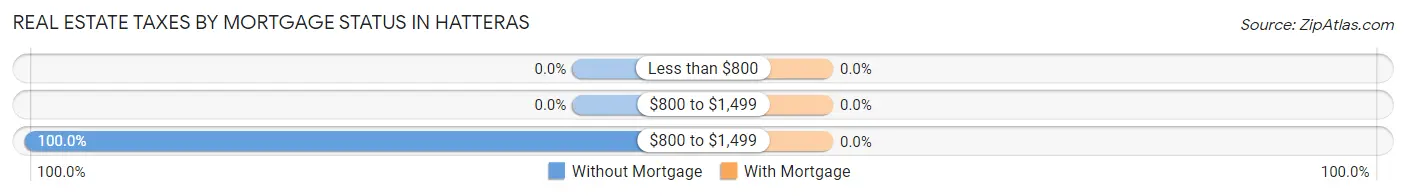
| Property Taxes | Without Mortgage | With Mortgage |
| Less than $800 | 0 (0.0%) | 0 (0.0%) |
| $800 to $1,499 | 0 (0.0%) | 0 (0.0%) |
| $800 to $1,499 | 26 (100.0%) | 0 (0.0%) |
| Total | 26 (100.0%) | 69 (100.0%) |
Health & Disability in Hatteras
Health Insurance Coverage by Age in Hatteras
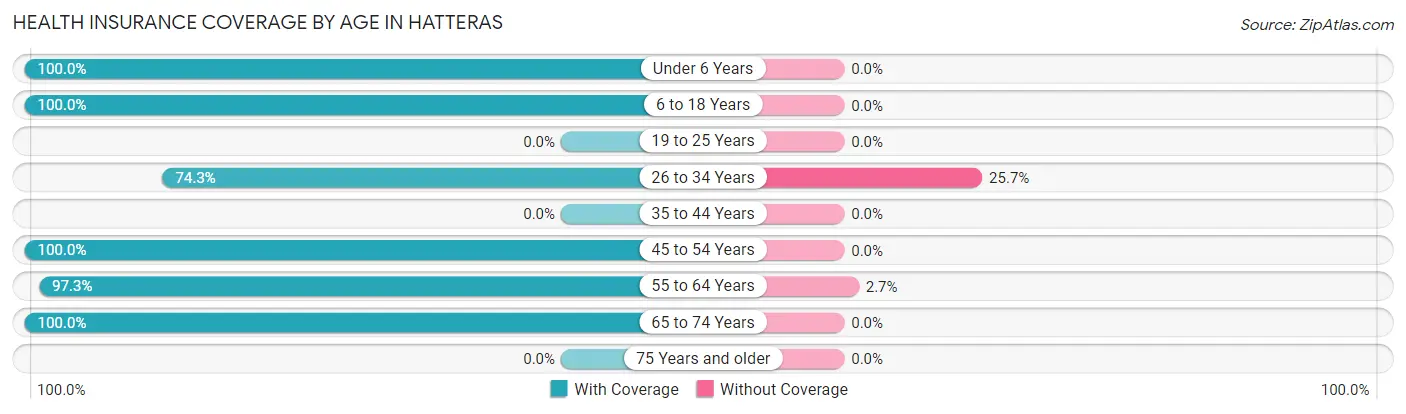
| Age Bracket | With Coverage | Without Coverage |
| Under 6 Years | 94 (100.0%) | 0 (0.0%) |
| 6 to 18 Years | 36 (100.0%) | 0 (0.0%) |
| 19 to 25 Years | 0 (0.0%) | 0 (0.0%) |
| 26 to 34 Years | 52 (74.3%) | 18 (25.7%) |
| 35 to 44 Years | 0 (0.0%) | 0 (0.0%) |
| 45 to 54 Years | 69 (100.0%) | 0 (0.0%) |
| 55 to 64 Years | 72 (97.3%) | 2 (2.7%) |
| 65 to 74 Years | 54 (100.0%) | 0 (0.0%) |
| 75 Years and older | 0 (0.0%) | 0 (0.0%) |
| Total | 377 (95.0%) | 20 (5.0%) |
Health Insurance Coverage by Citizenship Status in Hatteras
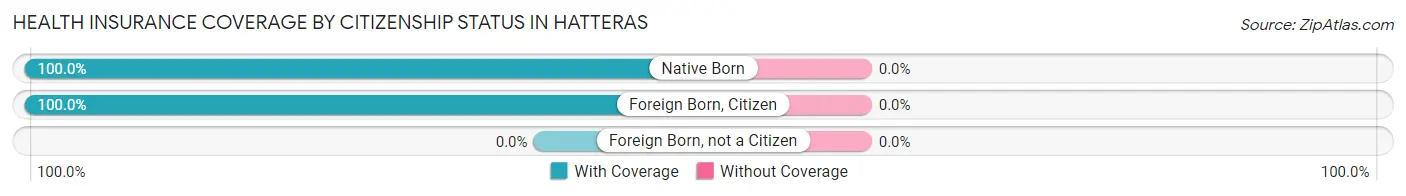
| Citizenship Status | With Coverage | Without Coverage |
| Native Born | 94 (100.0%) | 0 (0.0%) |
| Foreign Born, Citizen | 36 (100.0%) | 0 (0.0%) |
| Foreign Born, not a Citizen | 0 (0.0%) | 0 (0.0%) |
Health Insurance Coverage by Household Income in Hatteras
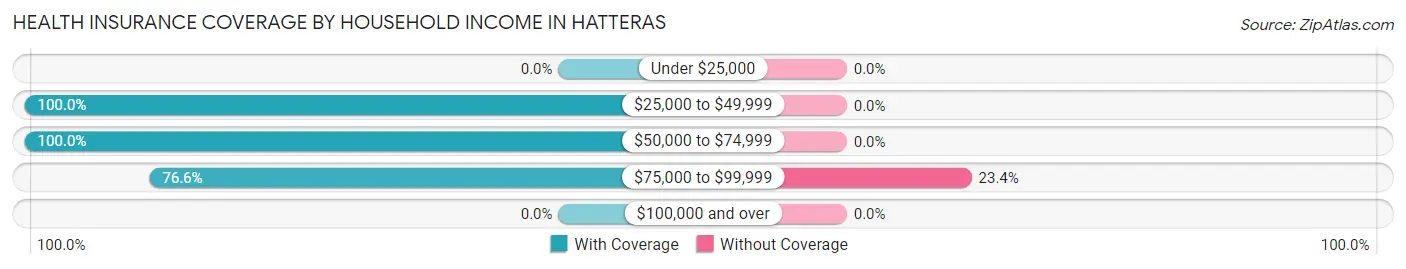
| Household Income | With Coverage | Without Coverage |
| Under $25,000 | 0 (0.0%) | 0 (0.0%) |
| $25,000 to $49,999 | 229 (100.0%) | 0 (0.0%) |
| $50,000 to $74,999 | 86 (100.0%) | 0 (0.0%) |
| $75,000 to $99,999 | 59 (76.6%) | 18 (23.4%) |
| $100,000 and over | 0 (0.0%) | 0 (0.0%) |
Public vs Private Health Insurance Coverage by Age in Hatteras
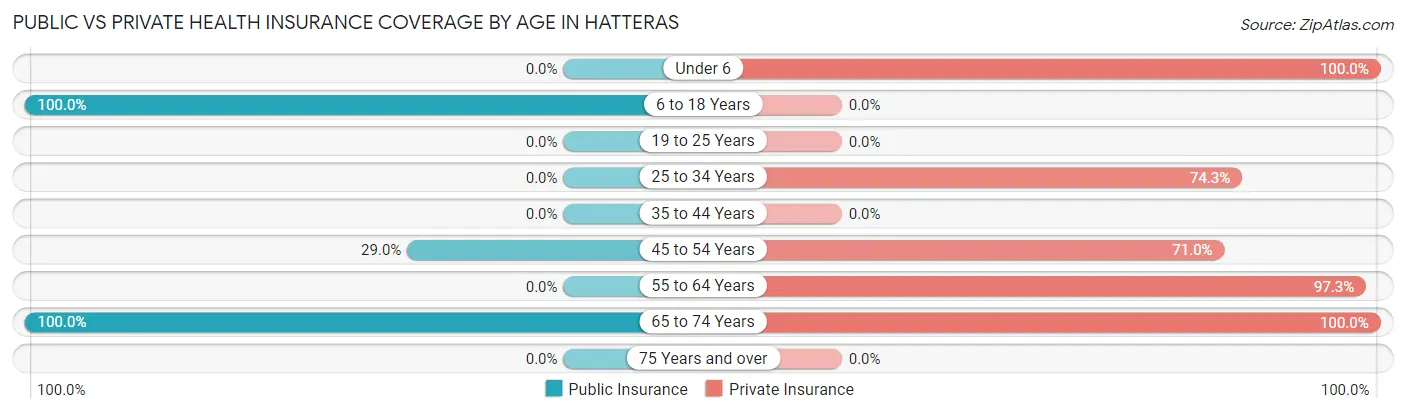
| Age Bracket | Public Insurance | Private Insurance |
| Under 6 | 0 (0.0%) | 94 (100.0%) |
| 6 to 18 Years | 36 (100.0%) | 0 (0.0%) |
| 19 to 25 Years | 0 (0.0%) | 0 (0.0%) |
| 25 to 34 Years | 0 (0.0%) | 52 (74.3%) |
| 35 to 44 Years | 0 (0.0%) | 0 (0.0%) |
| 45 to 54 Years | 20 (29.0%) | 49 (71.0%) |
| 55 to 64 Years | 0 (0.0%) | 72 (97.3%) |
| 65 to 74 Years | 54 (100.0%) | 54 (100.0%) |
| 75 Years and over | 0 (0.0%) | 0 (0.0%) |
| Total | 110 (27.7%) | 321 (80.9%) |
Disability Status by Sex by Age in Hatteras
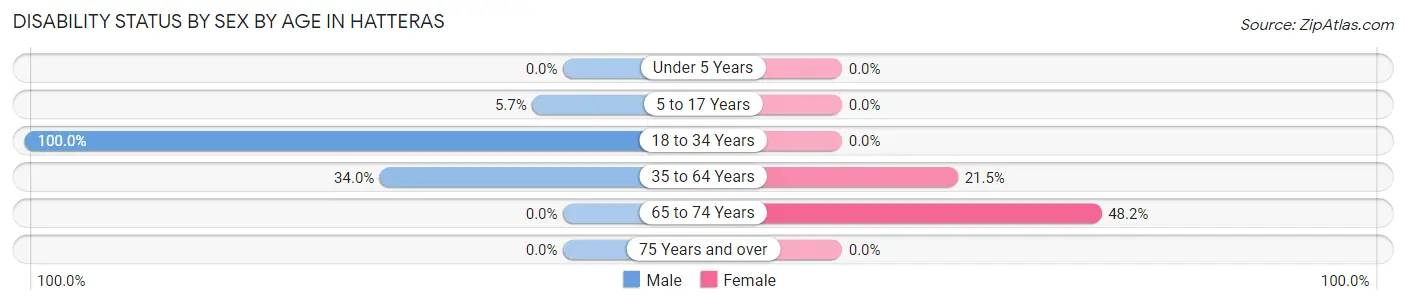
| Age Bracket | Male | Female |
| Under 5 Years | 0 (0.0%) | 0 (0.0%) |
| 5 to 17 Years | 2 (5.7%) | 0 (0.0%) |
| 18 to 34 Years | 18 (100.0%) | 0 (0.0%) |
| 35 to 64 Years | 17 (34.0%) | 20 (21.5%) |
| 65 to 74 Years | 0 (0.0%) | 26 (48.1%) |
| 75 Years and over | 0 (0.0%) | 0 (0.0%) |
Disability Class by Sex by Age in Hatteras
Disability Class: Hearing Difficulty
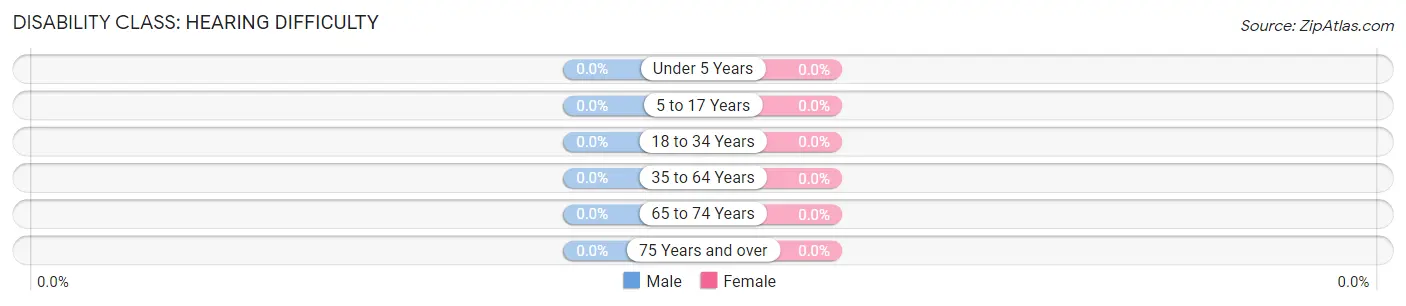
| Age Bracket | Male | Female |
| Under 5 Years | 0 (0.0%) | 0 (0.0%) |
| 5 to 17 Years | 0 (0.0%) | 0 (0.0%) |
| 18 to 34 Years | 0 (0.0%) | 0 (0.0%) |
| 35 to 64 Years | 0 (0.0%) | 0 (0.0%) |
| 65 to 74 Years | 0 (0.0%) | 0 (0.0%) |
| 75 Years and over | 0 (0.0%) | 0 (0.0%) |
Disability Class: Vision Difficulty
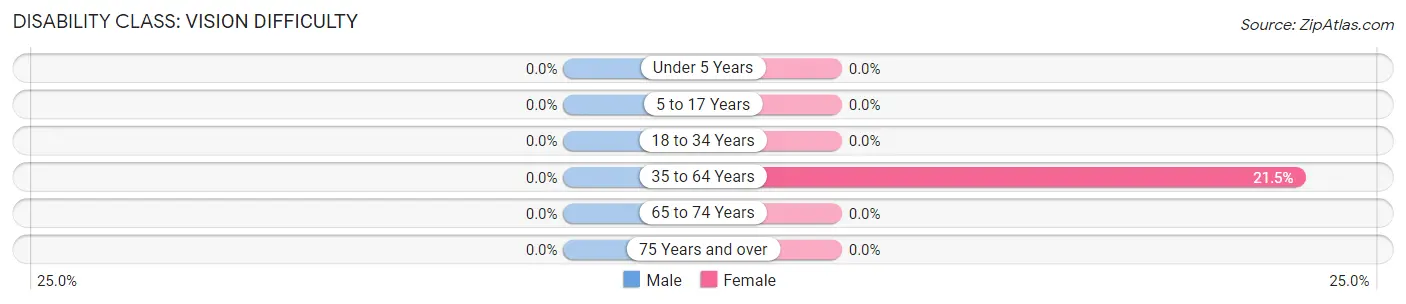
| Age Bracket | Male | Female |
| Under 5 Years | 0 (0.0%) | 0 (0.0%) |
| 5 to 17 Years | 0 (0.0%) | 0 (0.0%) |
| 18 to 34 Years | 0 (0.0%) | 0 (0.0%) |
| 35 to 64 Years | 0 (0.0%) | 20 (21.5%) |
| 65 to 74 Years | 0 (0.0%) | 0 (0.0%) |
| 75 Years and over | 0 (0.0%) | 0 (0.0%) |
Disability Class: Cognitive Difficulty
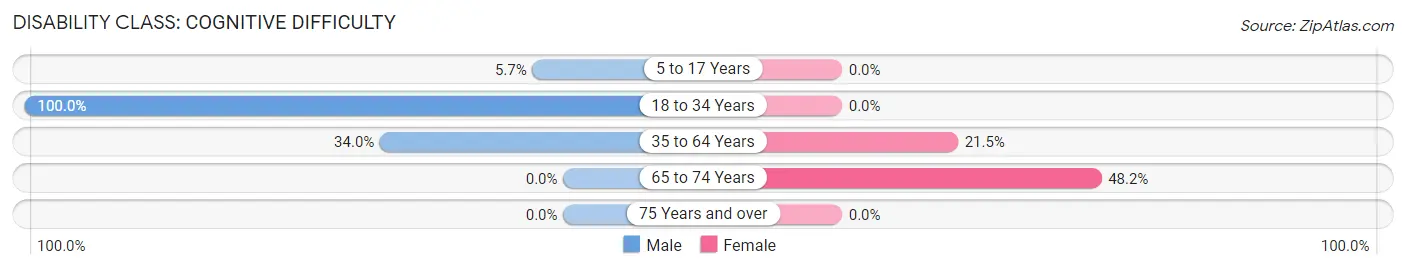
| Age Bracket | Male | Female |
| 5 to 17 Years | 2 (5.7%) | 0 (0.0%) |
| 18 to 34 Years | 18 (100.0%) | 0 (0.0%) |
| 35 to 64 Years | 17 (34.0%) | 20 (21.5%) |
| 65 to 74 Years | 0 (0.0%) | 26 (48.1%) |
| 75 Years and over | 0 (0.0%) | 0 (0.0%) |
Disability Class: Ambulatory Difficulty
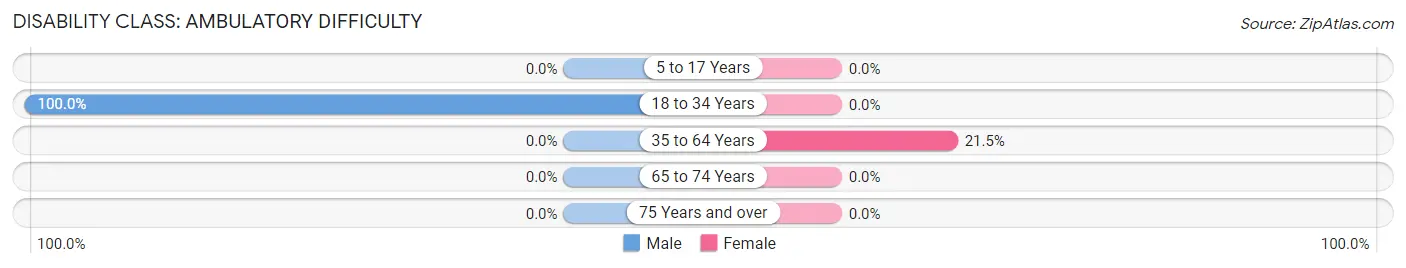
| Age Bracket | Male | Female |
| 5 to 17 Years | 0 (0.0%) | 0 (0.0%) |
| 18 to 34 Years | 18 (100.0%) | 0 (0.0%) |
| 35 to 64 Years | 0 (0.0%) | 20 (21.5%) |
| 65 to 74 Years | 0 (0.0%) | 0 (0.0%) |
| 75 Years and over | 0 (0.0%) | 0 (0.0%) |
Disability Class: Self-Care Difficulty
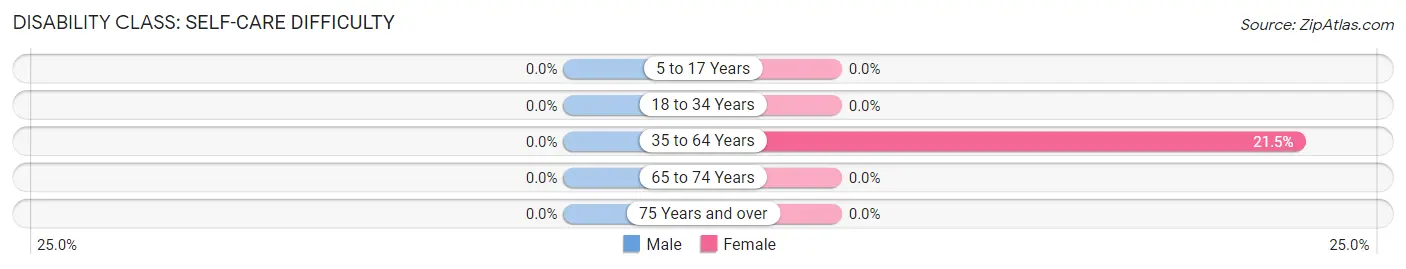
| Age Bracket | Male | Female |
| 5 to 17 Years | 0 (0.0%) | 0 (0.0%) |
| 18 to 34 Years | 0 (0.0%) | 0 (0.0%) |
| 35 to 64 Years | 0 (0.0%) | 20 (21.5%) |
| 65 to 74 Years | 0 (0.0%) | 0 (0.0%) |
| 75 Years and over | 0 (0.0%) | 0 (0.0%) |
Technology Access in Hatteras
Computing Device Access in Hatteras
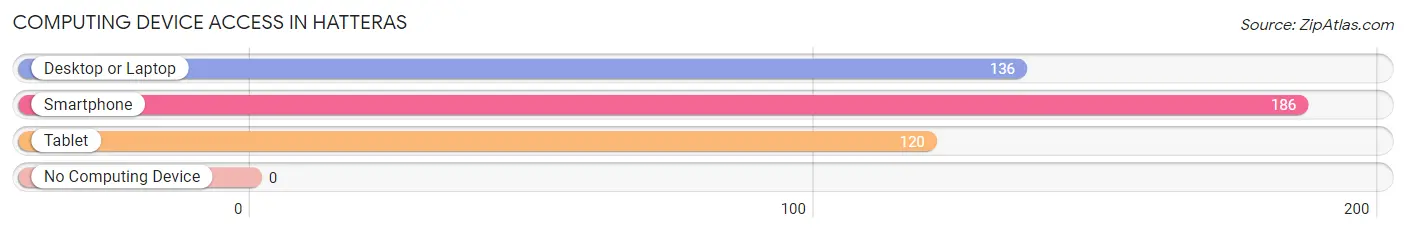
| Device Type | # Households | % Households |
| Desktop or Laptop | 136 | 73.1% |
| Smartphone | 186 | 100.0% |
| Tablet | 120 | 64.5% |
| No Computing Device | 0 | 0.0% |
| Total | 186 | 100.0% |
Internet Access in Hatteras
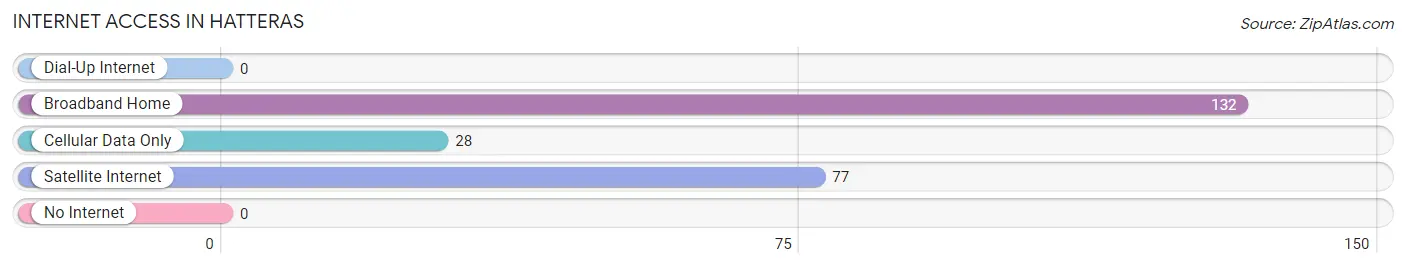
| Internet Type | # Households | % Households |
| Dial-Up Internet | 0 | 0.0% |
| Broadband Home | 132 | 71.0% |
| Cellular Data Only | 28 | 15.0% |
| Satellite Internet | 77 | 41.4% |
| No Internet | 0 | 0.0% |
| Total | 186 | 100.0% |
Hatteras Summary
Hatteras is a small unincorporated community located on the Outer Banks of North Carolina. It is part of Dare County and is situated on the easternmost point of the state. The town is known for its beautiful beaches, fishing, and wildlife. It is also home to the Cape Hatteras National Seashore, a protected area of the National Park Service.
History
Hatteras has a long and rich history. The area was first inhabited by Native Americans, who called the area “Croatoan”. The first European settlers arrived in the late 1600s, and the town was officially established in 1711. The town was named after the Hatteras Indians, who were a part of the Croatan tribe.
The town was a major port for the shipping of goods and supplies during the American Revolution. It was also a major fishing port, and the town’s economy was largely based on the fishing industry. In the late 1800s, the town became a popular tourist destination, and many of the town’s buildings were built during this time.
In the early 1900s, the town was devastated by a series of hurricanes, which destroyed much of the town. In 1933, the town was hit by the Great Hurricane, which caused extensive damage and killed many people. In the 1950s, the town was rebuilt and the economy shifted to tourism.
Geography
Hatteras is located on the Outer Banks of North Carolina, on the easternmost point of the state. The town is situated on a barrier island, which is separated from the mainland by the Pamlico Sound. The town is bordered by the Atlantic Ocean to the east and the Pamlico Sound to the west.
The town is located in a humid subtropical climate zone, with hot summers and mild winters. The average temperature in the summer is around 80 degrees Fahrenheit, and the average temperature in the winter is around 50 degrees Fahrenheit. The town receives an average of 50 inches of rain per year.
Economy
The economy of Hatteras is largely based on tourism. The town is a popular destination for beachgoers, fishermen, and wildlife enthusiasts. The town is also home to the Cape Hatteras National Seashore, which is a protected area of the National Park Service.
The town is also home to several businesses, including restaurants, hotels, and retail stores. The town also has a marina, which provides services for fishing boats and other vessels.
Demographics
As of the 2010 census, the population of Hatteras was 1,541. The racial makeup of the town was 94.3% White, 2.2% African American, 0.3% Native American, 0.7% Asian, 0.1% Pacific Islander, and 2.4% from other races. The median household income was $41,250, and the median family income was $50,000.
Conclusion
Hatteras is a small unincorporated community located on the Outer Banks of North Carolina. It is part of Dare County and is situated on the easternmost point of the state. The town is known for its beautiful beaches, fishing, and wildlife. It is also home to the Cape Hatteras National Seashore, a protected area of the National Park Service. The economy of Hatteras is largely based on tourism, and the town is home to a variety of businesses. The population of Hatteras was 1,541 as of the 2010 census.
Common Questions
What is Per Capita Income in Hatteras?
Per Capita income in Hatteras is $21,626.
What is the Median Family Income in Hatteras?
Median Family Income in Hatteras is $47,115.
What is the Median Household income in Hatteras?
Median Household Income in Hatteras is $47,067.
What is Inequality or Gini Index in Hatteras?
Inequality or Gini Index in Hatteras is 0.21.
What is the Total Population of Hatteras?
Total Population of Hatteras is 458.
What is the Total Male Population of Hatteras?
Total Male Population of Hatteras is 209.
What is the Total Female Population of Hatteras?
Total Female Population of Hatteras is 249.
What is the Ratio of Males per 100 Females in Hatteras?
There are 83.94 Males per 100 Females in Hatteras.
What is the Ratio of Females per 100 Males in Hatteras?
There are 119.14 Females per 100 Males in Hatteras.
What is the Median Population Age in Hatteras?
Median Population Age in Hatteras is 33.7 Years.
What is the Average Family Size in Hatteras
Average Family Size in Hatteras is 2.9 People.
What is the Average Household Size in Hatteras
Average Household Size in Hatteras is 2.3 People.
How Large is the Labor Force in Hatteras?
There are 230 People in the Labor Forcein in Hatteras.
What is the Percentage of People in the Labor Force in Hatteras?
69.9% of People are in the Labor Force in Hatteras.