Fishhook, AK Map & Demographics
Fishhook Map
Fishhook Overview
$40,342
PER CAPITA INCOME
$115,504
AVG FAMILY INCOME
$98,523
AVG HOUSEHOLD INCOME
41.1%
WAGE / INCOME GAP [ % ]
58.9¢/ $1
WAGE / INCOME GAP [ $ ]
0.38
INEQUALITY / GINI INDEX
5,115
TOTAL POPULATION
2,775
MALE POPULATION
2,340
FEMALE POPULATION
118.59
MALES / 100 FEMALES
84.32
FEMALES / 100 MALES
39.0
MEDIAN AGE
3.3
AVG FAMILY SIZE
2.9
AVG HOUSEHOLD SIZE
2,378
LABOR FORCE [ PEOPLE ]
62.6%
PERCENT IN LABOR FORCE
6.8%
UNEMPLOYMENT RATE
Income in Fishhook
Income Overview in Fishhook
Per Capita Income in Fishhook is $40,342, while median incomes of families and households are $115,504 and $98,523 respectively.
| Characteristic | Number | Measure |
| Per Capita Income | 5,115 | $40,342 |
| Median Family Income | 1,297 | $115,504 |
| Mean Family Income | 1,297 | $129,901 |
| Median Household Income | 1,767 | $98,523 |
| Mean Household Income | 1,767 | $114,684 |
| Income Deficit | 1,297 | $0 |
| Wage / Income Gap (%) | 5,115 | 41.13% |
| Wage / Income Gap ($) | 5,115 | 58.87¢ per $1 |
| Gini / Inequality Index | 5,115 | 0.38 |
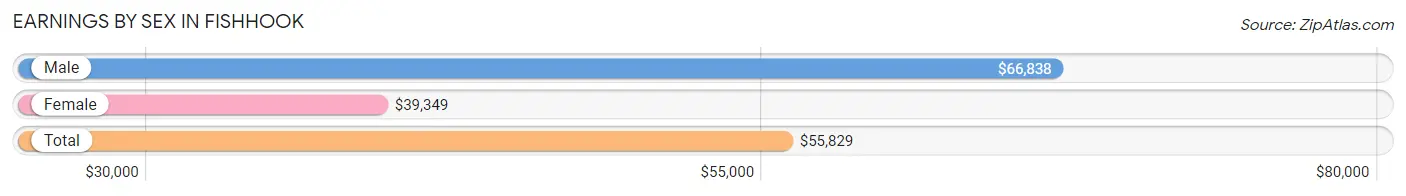
Earnings by Sex in Fishhook
Average Earnings in Fishhook are $55,829, $66,838 for men and $39,349 for women, a difference of 41.1%.
| Sex | Number | Average Earnings |
| Male | 1,446 (59.5%) | $66,838 |
| Female | 985 (40.5%) | $39,349 |
| Total | 2,431 (100.0%) | $55,829 |
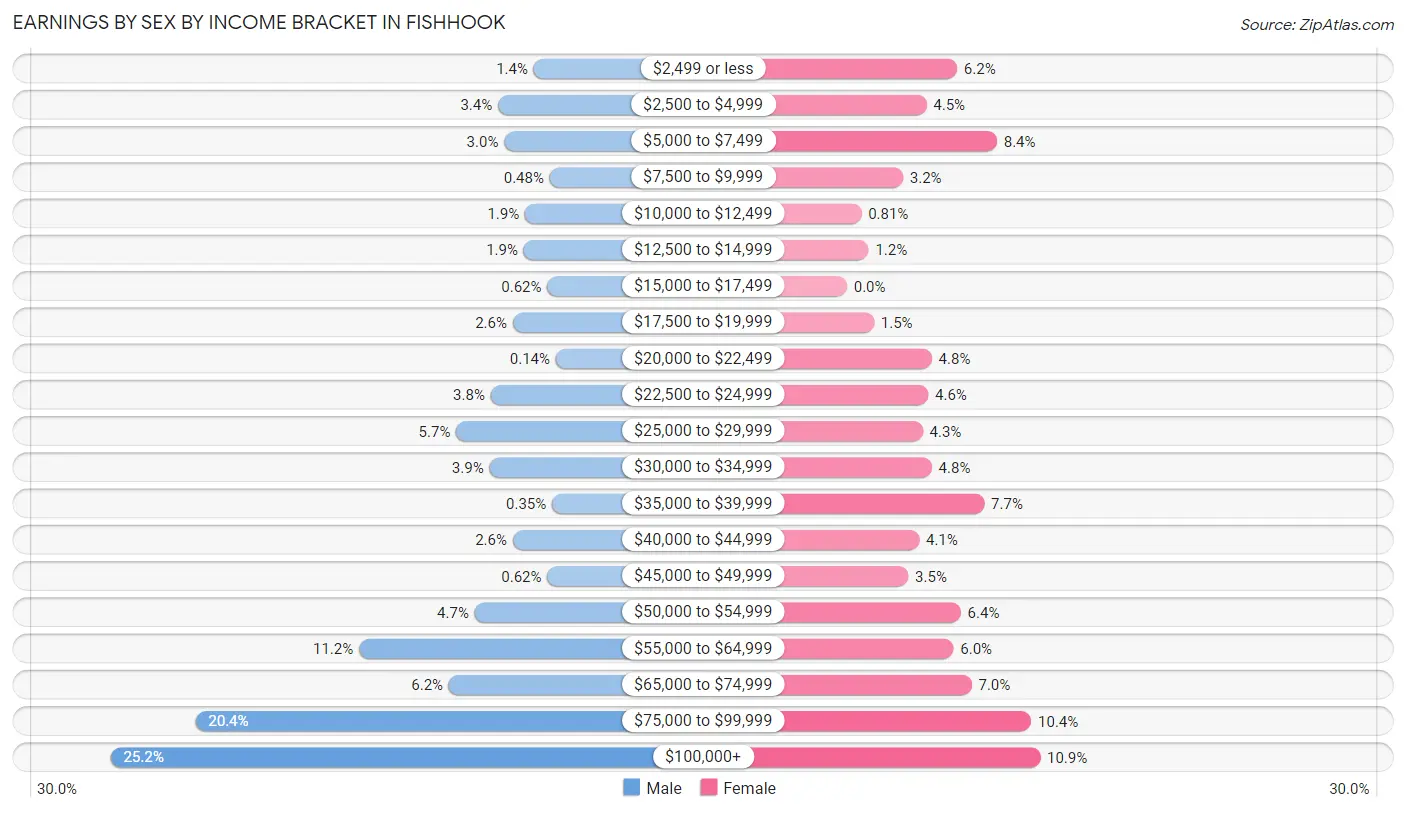
Earnings by Sex by Income Bracket in Fishhook
The most common earnings brackets in Fishhook are $100,000+ for men (364 | 25.2%) and $100,000+ for women (107 | 10.9%).
| Income | Male | Female |
| $2,499 or less | 20 (1.4%) | 61 (6.2%) |
| $2,500 to $4,999 | 49 (3.4%) | 44 (4.5%) |
| $5,000 to $7,499 | 44 (3.0%) | 83 (8.4%) |
| $7,500 to $9,999 | 7 (0.5%) | 31 (3.2%) |
| $10,000 to $12,499 | 27 (1.9%) | 8 (0.8%) |
| $12,500 to $14,999 | 28 (1.9%) | 12 (1.2%) |
| $15,000 to $17,499 | 9 (0.6%) | 0 (0.0%) |
| $17,500 to $19,999 | 37 (2.6%) | 15 (1.5%) |
| $20,000 to $22,499 | 2 (0.1%) | 47 (4.8%) |
| $22,500 to $24,999 | 55 (3.8%) | 45 (4.6%) |
| $25,000 to $29,999 | 83 (5.7%) | 42 (4.3%) |
| $30,000 to $34,999 | 56 (3.9%) | 47 (4.8%) |
| $35,000 to $39,999 | 5 (0.4%) | 76 (7.7%) |
| $40,000 to $44,999 | 37 (2.6%) | 40 (4.1%) |
| $45,000 to $49,999 | 9 (0.6%) | 34 (3.5%) |
| $50,000 to $54,999 | 68 (4.7%) | 63 (6.4%) |
| $55,000 to $64,999 | 162 (11.2%) | 59 (6.0%) |
| $65,000 to $74,999 | 89 (6.1%) | 69 (7.0%) |
| $75,000 to $99,999 | 295 (20.4%) | 102 (10.4%) |
| $100,000+ | 364 (25.2%) | 107 (10.9%) |
| Total | 1,446 (100.0%) | 985 (100.0%) |
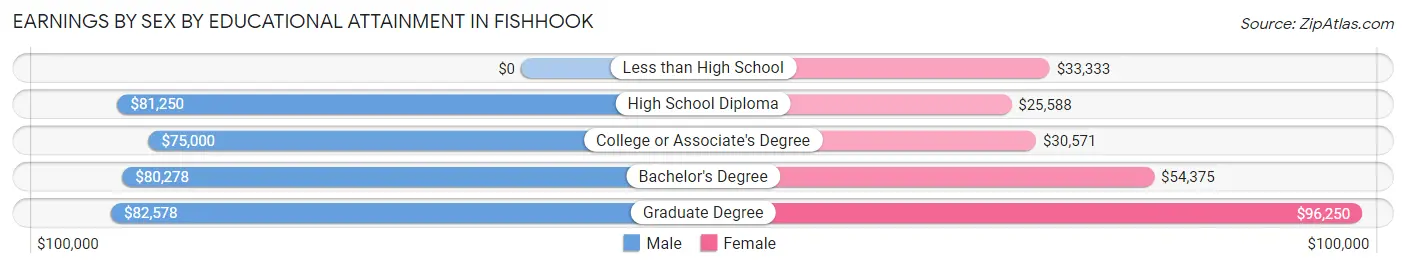
Earnings by Sex by Educational Attainment in Fishhook
Average earnings in Fishhook are $79,200 for men and $40,545 for women, a difference of 48.8%. Men with an educational attainment of graduate degree enjoy the highest average annual earnings of $82,578, while those with college or associate's degree education earn the least with $75,000. Women with an educational attainment of graduate degree earn the most with the average annual earnings of $96,250, while those with high school diploma education have the smallest earnings of $25,588.
| Educational Attainment | Male Income | Female Income |
| Less than High School | - | - |
| High School Diploma | $81,250 | $25,588 |
| College or Associate's Degree | $75,000 | $30,571 |
| Bachelor's Degree | $80,278 | $54,375 |
| Graduate Degree | $82,578 | $96,250 |
| Total | $79,200 | $40,545 |
Family Income in Fishhook
Family Income Brackets in Fishhook
According to the Fishhook family income data, there are 336 families falling into the $100,000 to $149,999 income range, which is the most common income bracket and makes up 25.9% of all families. Conversely, the less than $10,000 income bracket is the least frequent group with only 3 families (0.2%) belonging to this category.
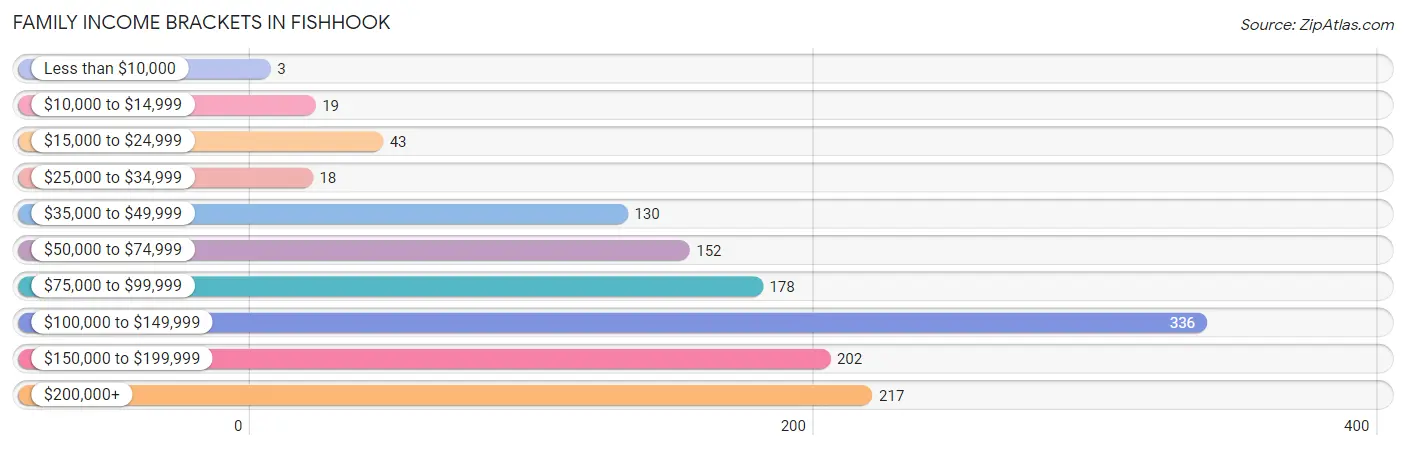
| Income Bracket | # Families | % Families |
| Less than $10,000 | 3 | 0.2% |
| $10,000 to $14,999 | 19 | 1.5% |
| $15,000 to $24,999 | 43 | 3.3% |
| $25,000 to $34,999 | 18 | 1.4% |
| $35,000 to $49,999 | 130 | 10.0% |
| $50,000 to $74,999 | 152 | 11.7% |
| $75,000 to $99,999 | 178 | 13.7% |
| $100,000 to $149,999 | 336 | 25.9% |
| $150,000 to $199,999 | 202 | 15.6% |
| $200,000+ | 217 | 16.7% |
Family Income by Famaliy Size in Fishhook
6-person families (99 | 7.6%) account for the highest median family income in Fishhook with $191,420 per family, while 2-person families (516 | 39.8%) have the highest median income of $39,208 per family member.
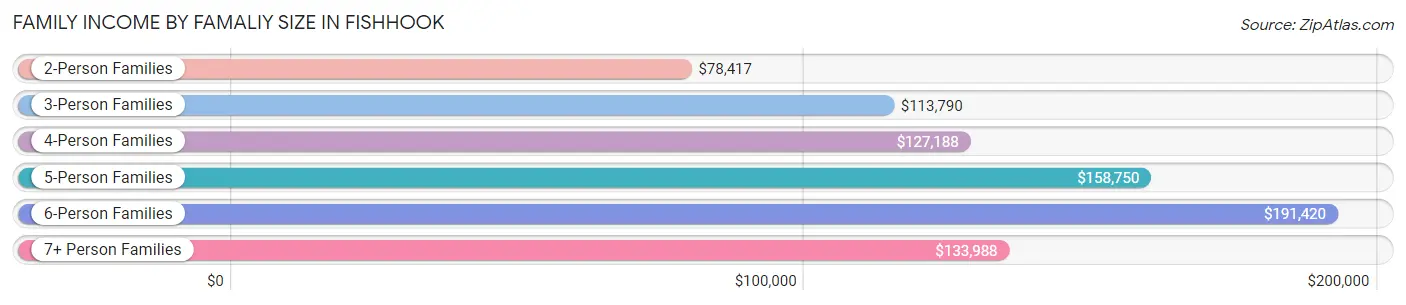
| Income Bracket | # Families | Median Income |
| 2-Person Families | 516 (39.8%) | $78,417 |
| 3-Person Families | 164 (12.6%) | $113,790 |
| 4-Person Families | 367 (28.3%) | $127,188 |
| 5-Person Families | 88 (6.8%) | $158,750 |
| 6-Person Families | 99 (7.6%) | $191,420 |
| 7+ Person Families | 63 (4.9%) | $133,988 |
| Total | 1,297 (100.0%) | $115,504 |
Family Income by Number of Earners in Fishhook
The median family income in Fishhook is $115,504, with families comprising 3+ earners (102) having the highest median family income of $143,158, while families with no earners (236) have the lowest median family income of $36,577, accounting for 7.9% and 18.2% of families, respectively.
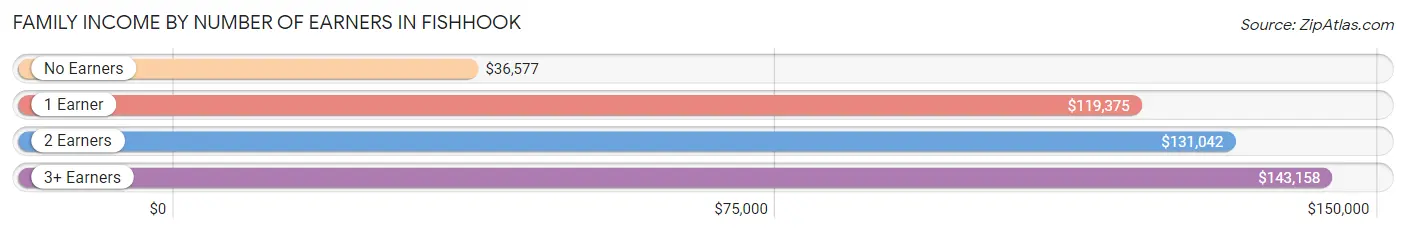
| Number of Earners | # Families | Median Income |
| No Earners | 236 (18.2%) | $36,577 |
| 1 Earner | 350 (27.0%) | $119,375 |
| 2 Earners | 609 (46.9%) | $131,042 |
| 3+ Earners | 102 (7.9%) | $143,158 |
| Total | 1,297 (100.0%) | $115,504 |
Household Income in Fishhook
Household Income Brackets in Fishhook
With 413 households falling in the category, the $100,000 to $149,999 income range is the most frequent in Fishhook, accounting for 23.4% of all households. In contrast, only 35 households (2.0%) fall into the $10,000 to $14,999 income bracket, making it the least populous group.
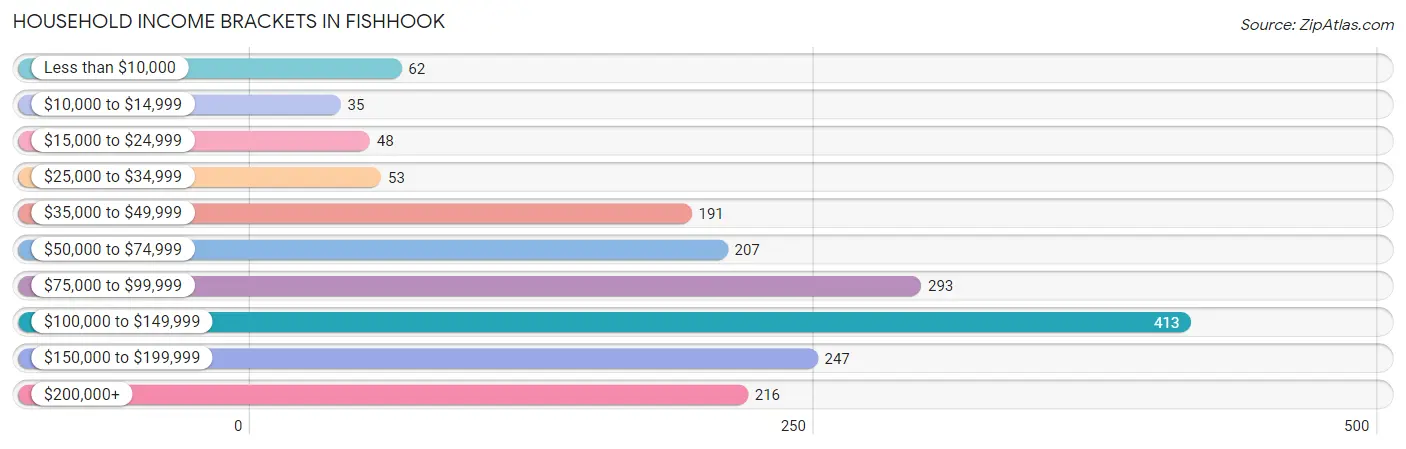
| Income Bracket | # Households | % Households |
| Less than $10,000 | 62 | 3.5% |
| $10,000 to $14,999 | 35 | 2.0% |
| $15,000 to $24,999 | 48 | 2.7% |
| $25,000 to $34,999 | 53 | 3.0% |
| $35,000 to $49,999 | 191 | 10.8% |
| $50,000 to $74,999 | 207 | 11.7% |
| $75,000 to $99,999 | 293 | 16.6% |
| $100,000 to $149,999 | 413 | 23.4% |
| $150,000 to $199,999 | 247 | 14.0% |
| $200,000+ | 216 | 12.2% |
Household Income by Householder Age in Fishhook
The median household income in Fishhook is $98,523, with the highest median household income of $117,024 found in the 25 to 44 years age bracket for the primary householder. A total of 588 households (33.3%) fall into this category. Meanwhile, the 15 to 24 years age bracket for the primary householder has the lowest median household income of $0, with 31 households (1.8%) in this group.
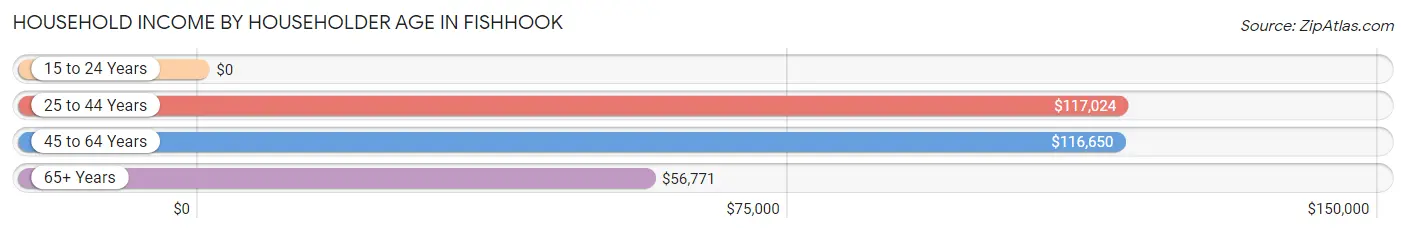
| Income Bracket | # Households | Median Income |
| 15 to 24 Years | 31 (1.8%) | $0 |
| 25 to 44 Years | 588 (33.3%) | $117,024 |
| 45 to 64 Years | 713 (40.4%) | $116,650 |
| 65+ Years | 435 (24.6%) | $56,771 |
| Total | 1,767 (100.0%) | $98,523 |
Poverty in Fishhook
Income Below Poverty by Sex and Age in Fishhook
With 9.6% poverty level for males and 5.3% for females among the residents of Fishhook, 5 year old males and 65 to 74 year old females are the most vulnerable to poverty, with 20 males (60.6%) and 62 females (19.0%) in their respective age groups living below the poverty level.
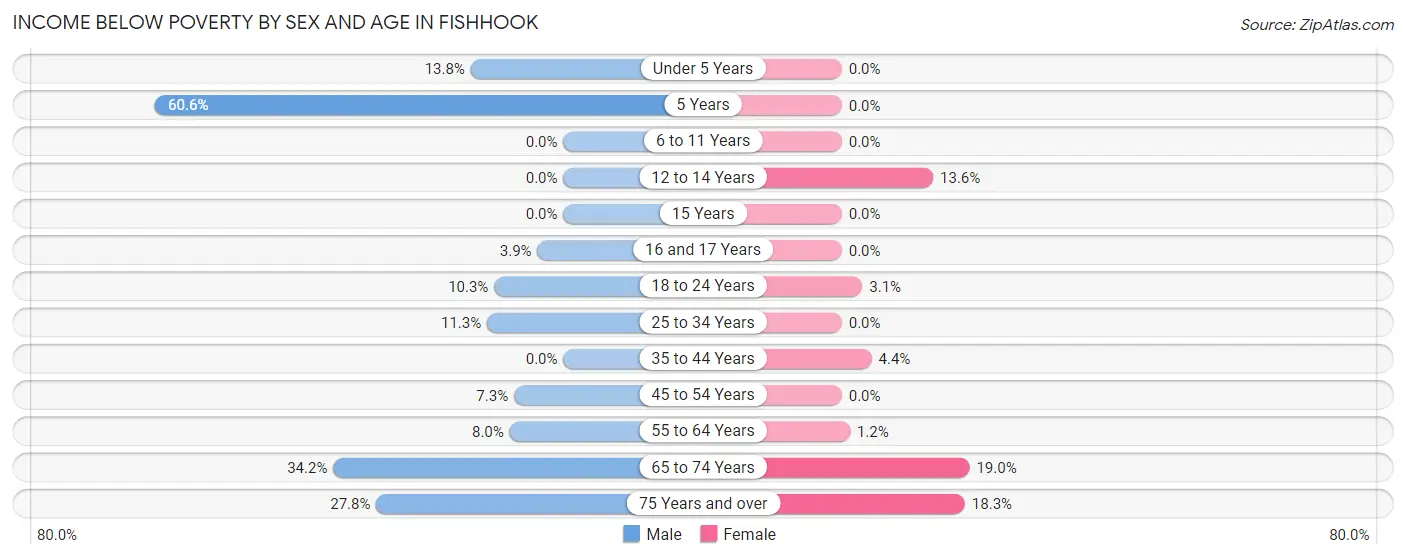
| Age Bracket | Male | Female |
| Under 5 Years | 26 (13.8%) | 0 (0.0%) |
| 5 Years | 20 (60.6%) | 0 (0.0%) |
| 6 to 11 Years | 0 (0.0%) | 0 (0.0%) |
| 12 to 14 Years | 0 (0.0%) | 16 (13.6%) |
| 15 Years | 0 (0.0%) | 0 (0.0%) |
| 16 and 17 Years | 4 (3.8%) | 0 (0.0%) |
| 18 to 24 Years | 27 (10.3%) | 4 (3.0%) |
| 25 to 34 Years | 23 (11.3%) | 0 (0.0%) |
| 35 to 44 Years | 0 (0.0%) | 19 (4.4%) |
| 45 to 54 Years | 17 (7.3%) | 0 (0.0%) |
| 55 to 64 Years | 28 (8.0%) | 4 (1.2%) |
| 65 to 74 Years | 95 (34.2%) | 62 (19.0%) |
| 75 Years and over | 20 (27.8%) | 17 (18.3%) |
| Total | 260 (9.6%) | 122 (5.3%) |
Income Above Poverty by Sex and Age in Fishhook
According to the poverty statistics in Fishhook, males aged 6 to 11 years and females aged under 5 years are the age groups that are most secure financially, with 100.0% of males and 100.0% of females in these age groups living above the poverty line.
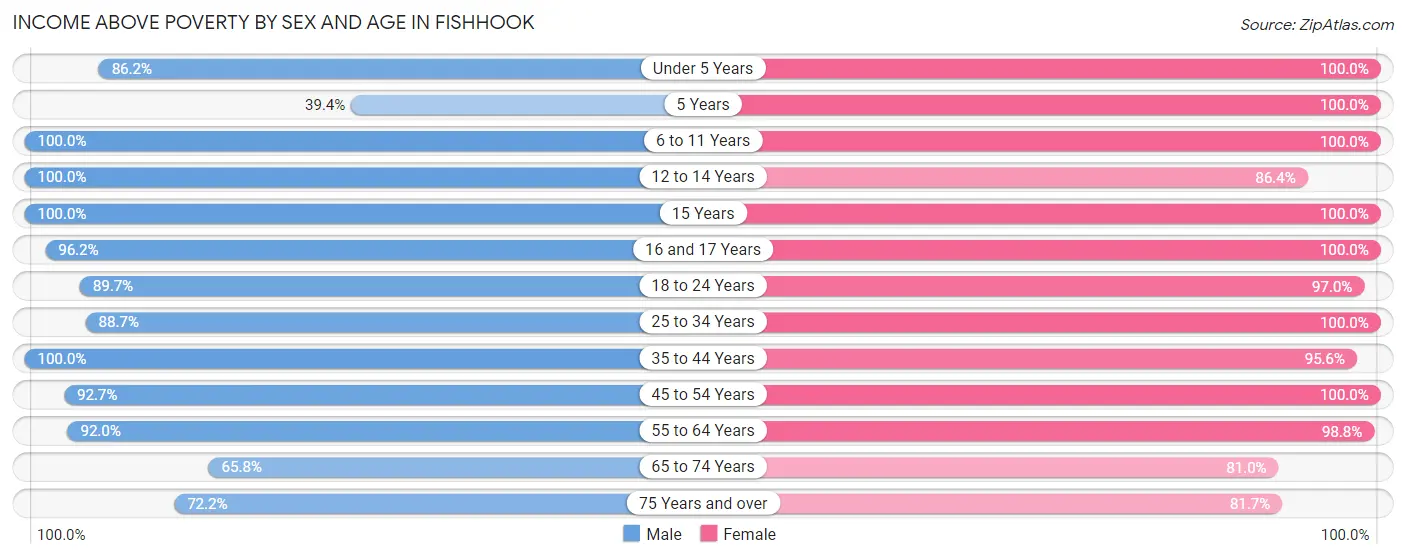
| Age Bracket | Male | Female |
| Under 5 Years | 163 (86.2%) | 92 (100.0%) |
| 5 Years | 13 (39.4%) | 24 (100.0%) |
| 6 to 11 Years | 234 (100.0%) | 242 (100.0%) |
| 12 to 14 Years | 181 (100.0%) | 102 (86.4%) |
| 15 Years | 93 (100.0%) | 23 (100.0%) |
| 16 and 17 Years | 100 (96.2%) | 61 (100.0%) |
| 18 to 24 Years | 236 (89.7%) | 127 (97.0%) |
| 25 to 34 Years | 180 (88.7%) | 209 (100.0%) |
| 35 to 44 Years | 481 (100.0%) | 411 (95.6%) |
| 45 to 54 Years | 215 (92.7%) | 234 (100.0%) |
| 55 to 64 Years | 323 (92.0%) | 326 (98.8%) |
| 65 to 74 Years | 183 (65.8%) | 265 (81.0%) |
| 75 Years and over | 52 (72.2%) | 76 (81.7%) |
| Total | 2,454 (90.4%) | 2,192 (94.7%) |
Income Below Poverty Among Married-Couple Families in Fishhook
The poverty statistics for married-couple families in Fishhook show that 2.3% or 23 of the total 1,019 families live below the poverty line. Families with no children have the highest poverty rate of 5.3%, comprising of 23 families. On the other hand, families with 1 or 2 children have the lowest poverty rate of 0.0%, which includes 0 families.
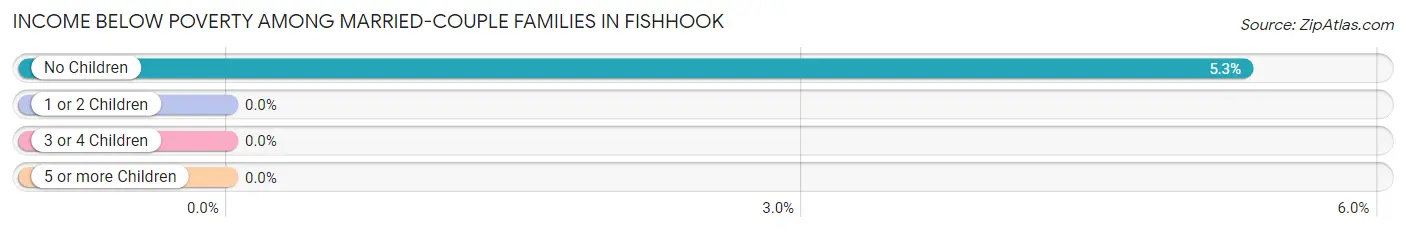
| Children | Above Poverty | Below Poverty |
| No Children | 411 (94.7%) | 23 (5.3%) |
| 1 or 2 Children | 439 (100.0%) | 0 (0.0%) |
| 3 or 4 Children | 104 (100.0%) | 0 (0.0%) |
| 5 or more Children | 42 (100.0%) | 0 (0.0%) |
| Total | 996 (97.7%) | 23 (2.3%) |
Income Below Poverty Among Single-Parent Households in Fishhook
According to the poverty data in Fishhook, 31.9% or 23 single-father households and 9.2% or 19 single-mother households are living below the poverty line. Among single-father households, those with no children have the highest poverty rate, with 23 households (67.6%) experiencing poverty. Likewise, among single-mother households, those with 3 or 4 children have the highest poverty rate, with 19 households (100.0%) falling below the poverty line.
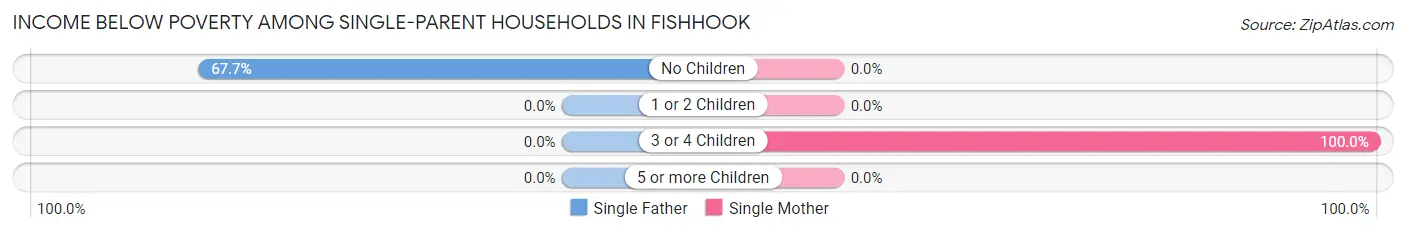
| Children | Single Father | Single Mother |
| No Children | 23 (67.6%) | 0 (0.0%) |
| 1 or 2 Children | 0 (0.0%) | 0 (0.0%) |
| 3 or 4 Children | 0 (0.0%) | 19 (100.0%) |
| 5 or more Children | 0 (0.0%) | 0 (0.0%) |
| Total | 23 (31.9%) | 19 (9.2%) |
Income Below Poverty Among Married-Couple vs Single-Parent Households in Fishhook
The poverty data for Fishhook shows that 23 of the married-couple family households (2.3%) and 42 of the single-parent households (15.1%) are living below the poverty level. Within the married-couple family households, those with no children have the highest poverty rate, with 23 households (5.3%) falling below the poverty line. Among the single-parent households, those with 3 or 4 children have the highest poverty rate, with 19 household (82.6%) living below poverty.
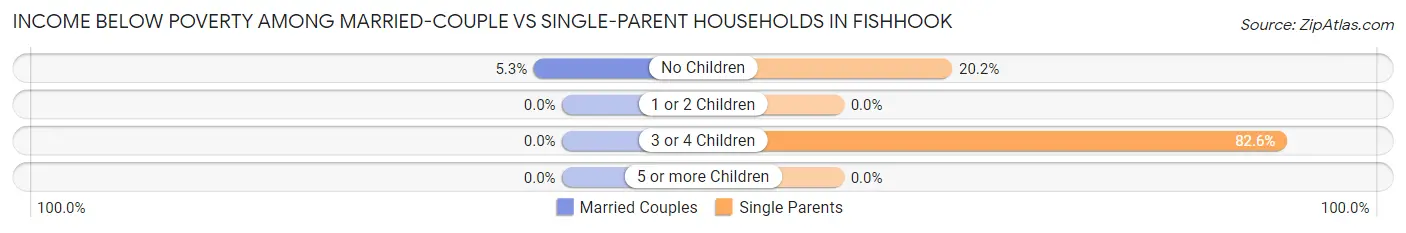
| Children | Married-Couple Families | Single-Parent Households |
| No Children | 23 (5.3%) | 23 (20.2%) |
| 1 or 2 Children | 0 (0.0%) | 0 (0.0%) |
| 3 or 4 Children | 0 (0.0%) | 19 (82.6%) |
| 5 or more Children | 0 (0.0%) | 0 (0.0%) |
| Total | 23 (2.3%) | 42 (15.1%) |
Race in Fishhook
The most populous races in Fishhook are White / Caucasian (4,002 | 78.2%), Two or more Races (465 | 9.1%), and Native / Alaskan (395 | 7.7%).
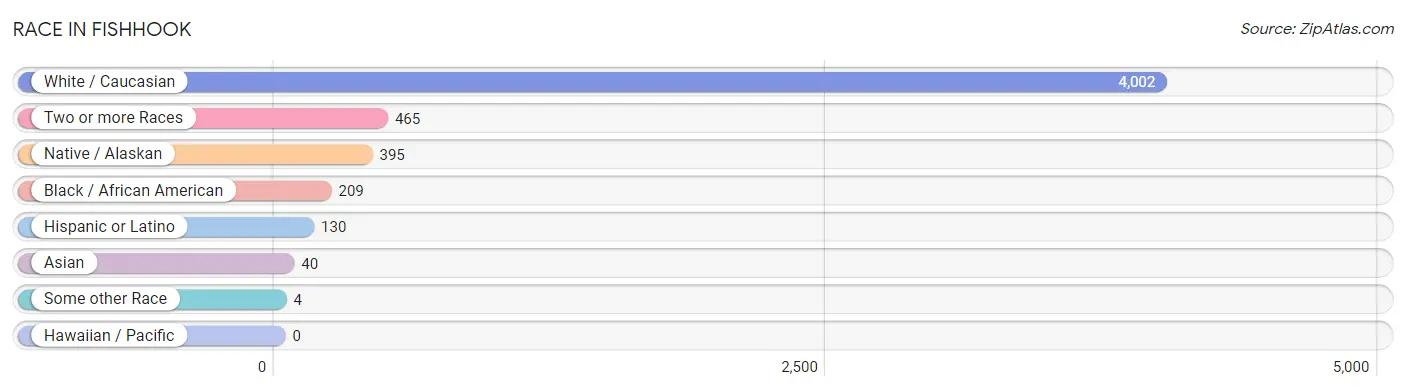
| Race | # Population | % Population |
| Asian | 40 | 0.8% |
| Black / African American | 209 | 4.1% |
| Hawaiian / Pacific | 0 | 0.0% |
| Hispanic or Latino | 130 | 2.5% |
| Native / Alaskan | 395 | 7.7% |
| White / Caucasian | 4,002 | 78.2% |
| Two or more Races | 465 | 9.1% |
| Some other Race | 4 | 0.1% |
| Total | 5,115 | 100.0% |
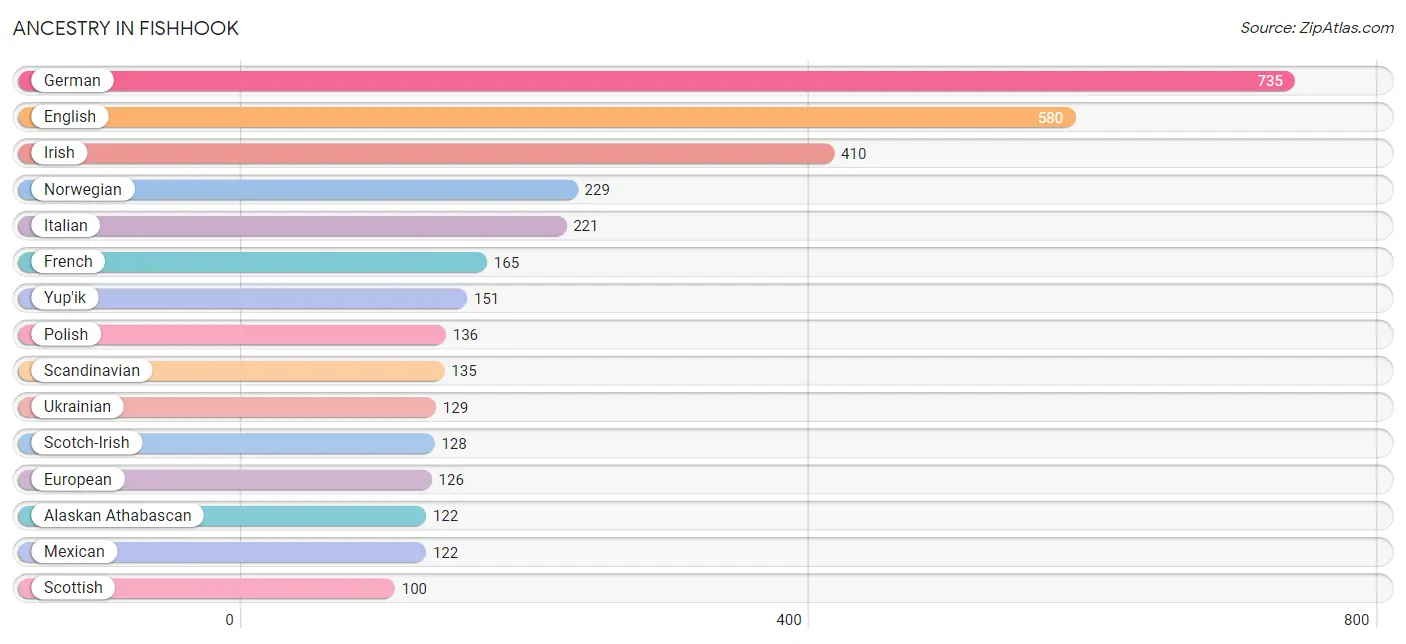
Ancestry in Fishhook
The most populous ancestries reported in Fishhook are German (735 | 14.4%), English (580 | 11.3%), Irish (410 | 8.0%), Norwegian (229 | 4.5%), and Italian (221 | 4.3%), together accounting for 42.5% of all Fishhook residents.
| Ancestry | # Population | % Population |
| Alaska Native | 26 | 0.5% |
| Alaskan Athabascan | 122 | 2.4% |
| Aleut | 85 | 1.7% |
| American | 48 | 0.9% |
| Australian | 17 | 0.3% |
| Bangladeshi | 28 | 0.5% |
| Basque | 5 | 0.1% |
| Canadian | 4 | 0.1% |
| Cape Verdean | 4 | 0.1% |
| Cherokee | 24 | 0.5% |
| Cree | 18 | 0.4% |
| Czech | 12 | 0.2% |
| Dominican | 4 | 0.1% |
| Dutch | 69 | 1.3% |
| English | 580 | 11.3% |
| European | 126 | 2.5% |
| Finnish | 14 | 0.3% |
| French | 165 | 3.2% |
| French Canadian | 9 | 0.2% |
| German | 735 | 14.4% |
| Hungarian | 3 | 0.1% |
| Indian (Asian) | 38 | 0.7% |
| Inupiat | 74 | 1.5% |
| Irish | 410 | 8.0% |
| Iroquois | 13 | 0.3% |
| Italian | 221 | 4.3% |
| Korean | 9 | 0.2% |
| Lithuanian | 7 | 0.1% |
| Macedonian | 6 | 0.1% |
| Mexican | 122 | 2.4% |
| Northern European | 26 | 0.5% |
| Norwegian | 229 | 4.5% |
| Polish | 136 | 2.7% |
| Potawatomi | 48 | 0.9% |
| Puget Sound Salish | 60 | 1.2% |
| Russian | 34 | 0.7% |
| Scandinavian | 135 | 2.6% |
| Scotch-Irish | 128 | 2.5% |
| Scottish | 100 | 2.0% |
| Spanish | 4 | 0.1% |
| Subsaharan African | 4 | 0.1% |
| Swedish | 87 | 1.7% |
| Tlingit-Haida | 26 | 0.5% |
| Trinidadian and Tobagonian | 3 | 0.1% |
| Ukrainian | 129 | 2.5% |
| Welsh | 18 | 0.4% |
| Yugoslavian | 21 | 0.4% |
| Yup'ik | 151 | 2.9% | View All 48 Rows |
Immigrants in Fishhook
The most numerous immigrant groups reported in Fishhook came from Latin America (51 | 1.0%), Europe (44 | 0.9%), Eastern Europe (34 | 0.7%), Russia (34 | 0.7%), and Central America (33 | 0.6%), together accounting for 3.8% of all Fishhook residents.
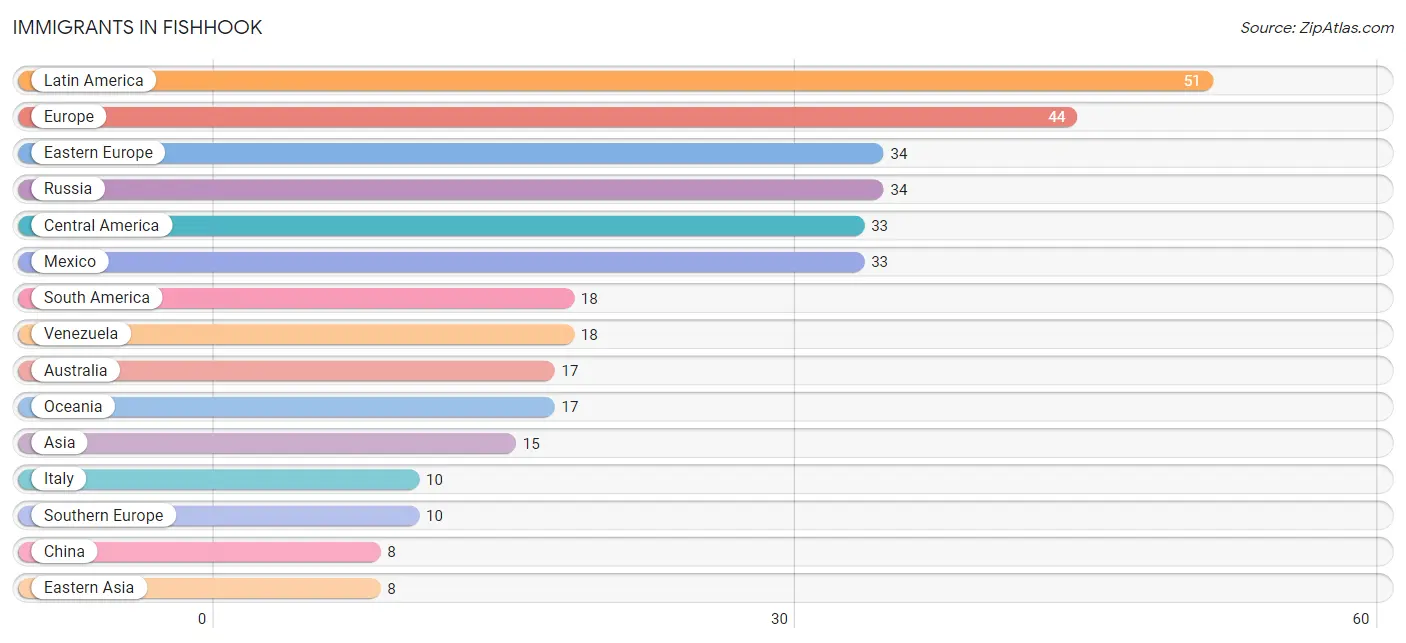
| Immigration Origin | # Population | % Population |
| Asia | 15 | 0.3% |
| Australia | 17 | 0.3% |
| Canada | 5 | 0.1% |
| Central America | 33 | 0.6% |
| China | 8 | 0.2% |
| Eastern Asia | 8 | 0.2% |
| Eastern Europe | 34 | 0.7% |
| Europe | 44 | 0.9% |
| Hong Kong | 8 | 0.2% |
| Italy | 10 | 0.2% |
| Laos | 7 | 0.1% |
| Latin America | 51 | 1.0% |
| Mexico | 33 | 0.6% |
| Oceania | 17 | 0.3% |
| Russia | 34 | 0.7% |
| South America | 18 | 0.4% |
| South Eastern Asia | 7 | 0.1% |
| Southern Europe | 10 | 0.2% |
| Venezuela | 18 | 0.4% | View All 19 Rows |
Sex and Age in Fishhook
Sex and Age in Fishhook
The most populous age groups in Fishhook are 15 to 19 Years (304 | 11.0%) for men and 65 to 69 Years (259 | 11.1%) for women.
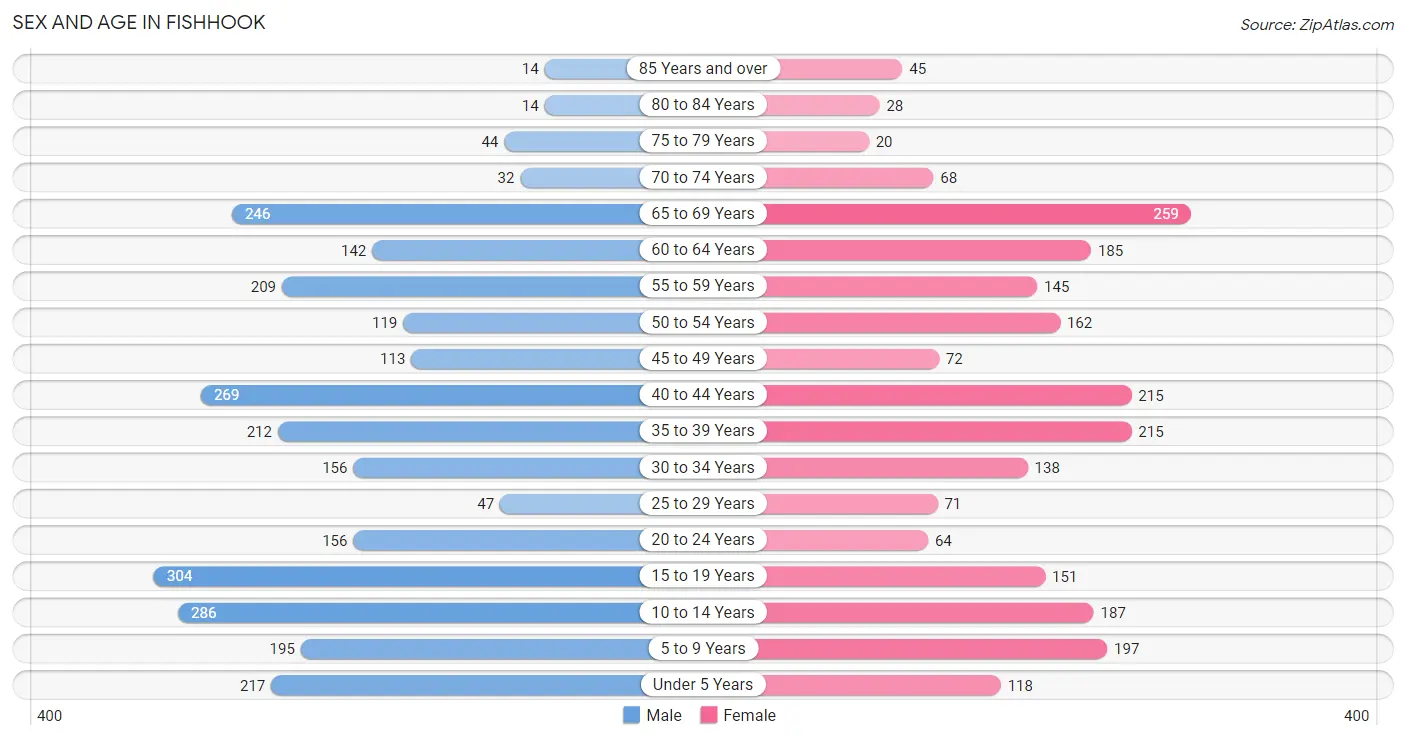
| Age Bracket | Male | Female |
| Under 5 Years | 217 (7.8%) | 118 (5.0%) |
| 5 to 9 Years | 195 (7.0%) | 197 (8.4%) |
| 10 to 14 Years | 286 (10.3%) | 187 (8.0%) |
| 15 to 19 Years | 304 (11.0%) | 151 (6.5%) |
| 20 to 24 Years | 156 (5.6%) | 64 (2.7%) |
| 25 to 29 Years | 47 (1.7%) | 71 (3.0%) |
| 30 to 34 Years | 156 (5.6%) | 138 (5.9%) |
| 35 to 39 Years | 212 (7.6%) | 215 (9.2%) |
| 40 to 44 Years | 269 (9.7%) | 215 (9.2%) |
| 45 to 49 Years | 113 (4.1%) | 72 (3.1%) |
| 50 to 54 Years | 119 (4.3%) | 162 (6.9%) |
| 55 to 59 Years | 209 (7.5%) | 145 (6.2%) |
| 60 to 64 Years | 142 (5.1%) | 185 (7.9%) |
| 65 to 69 Years | 246 (8.9%) | 259 (11.1%) |
| 70 to 74 Years | 32 (1.1%) | 68 (2.9%) |
| 75 to 79 Years | 44 (1.6%) | 20 (0.9%) |
| 80 to 84 Years | 14 (0.5%) | 28 (1.2%) |
| 85 Years and over | 14 (0.5%) | 45 (1.9%) |
| Total | 2,775 (100.0%) | 2,340 (100.0%) |
Families and Households in Fishhook
Median Family Size in Fishhook
The median family size in Fishhook is 3.33 persons per family, with married-couple families (1,019 | 78.6%) accounting for the largest median family size of 3.61 persons per family. On the other hand, single female/mother families (206 | 15.9%) represent the smallest median family size with 2.08 persons per family.
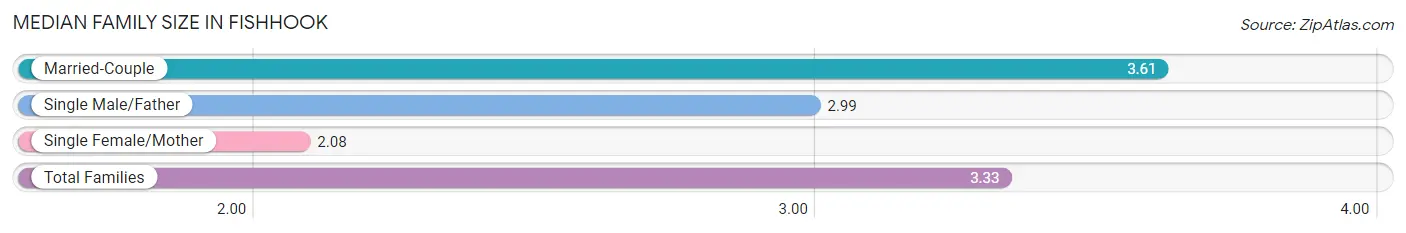
| Family Type | # Families | Family Size |
| Married-Couple | 1,019 (78.6%) | 3.61 |
| Single Male/Father | 72 (5.6%) | 2.99 |
| Single Female/Mother | 206 (15.9%) | 2.08 |
| Total Families | 1,297 (100.0%) | 3.33 |
Median Household Size in Fishhook
The median household size in Fishhook is 2.88 persons per household, with married-couple households (1,019 | 57.7%) accounting for the largest median household size of 3.62 persons per household. non-family households (470 | 26.6%) represent the smallest median household size with 1.45 persons per household.
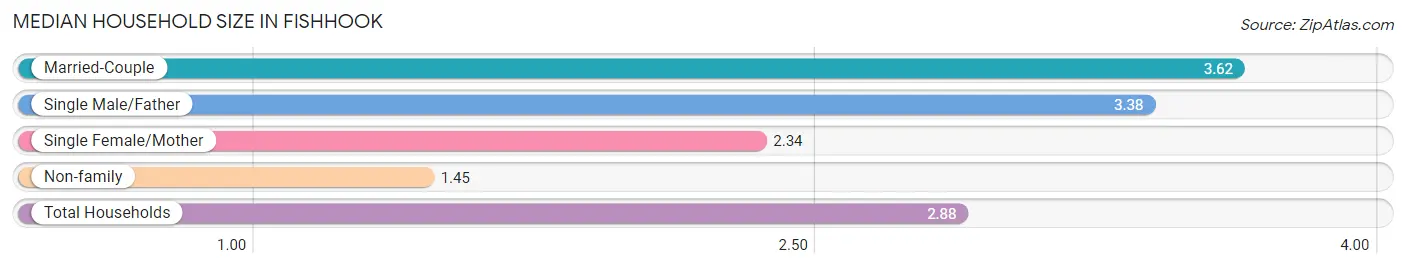
| Household Type | # Households | Household Size |
| Married-Couple | 1,019 (57.7%) | 3.62 |
| Single Male/Father | 72 (4.1%) | 3.38 |
| Single Female/Mother | 206 (11.7%) | 2.34 |
| Non-family | 470 (26.6%) | 1.45 |
| Total Households | 1,767 (100.0%) | 2.88 |
Household Size by Marriage Status in Fishhook
Out of a total of 1,767 households in Fishhook, 1,297 (73.4%) are family households, while 470 (26.6%) are nonfamily households. The most numerous type of family households are 2-person households, comprising 503, and the most common type of nonfamily households are 1-person households, comprising 385.
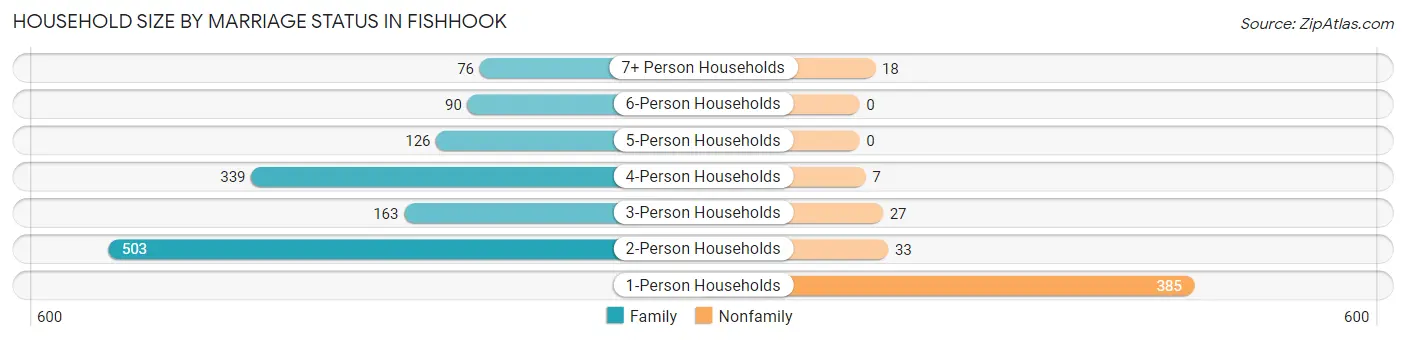
| Household Size | Family Households | Nonfamily Households |
| 1-Person Households | - | 385 (21.8%) |
| 2-Person Households | 503 (28.5%) | 33 (1.9%) |
| 3-Person Households | 163 (9.2%) | 27 (1.5%) |
| 4-Person Households | 339 (19.2%) | 7 (0.4%) |
| 5-Person Households | 126 (7.1%) | 0 (0.0%) |
| 6-Person Households | 90 (5.1%) | 0 (0.0%) |
| 7+ Person Households | 76 (4.3%) | 18 (1.0%) |
| Total | 1,297 (73.4%) | 470 (26.6%) |
Female Fertility in Fishhook
Fertility by Age in Fishhook
Average fertility rate in Fishhook is 74.0 births per 1,000 women. Women in the age bracket of 20 to 34 years have the highest fertility rate with 212.0 births per 1,000 women. Women in the age bracket of 20 to 34 years acount for 81.7% of all women with births.
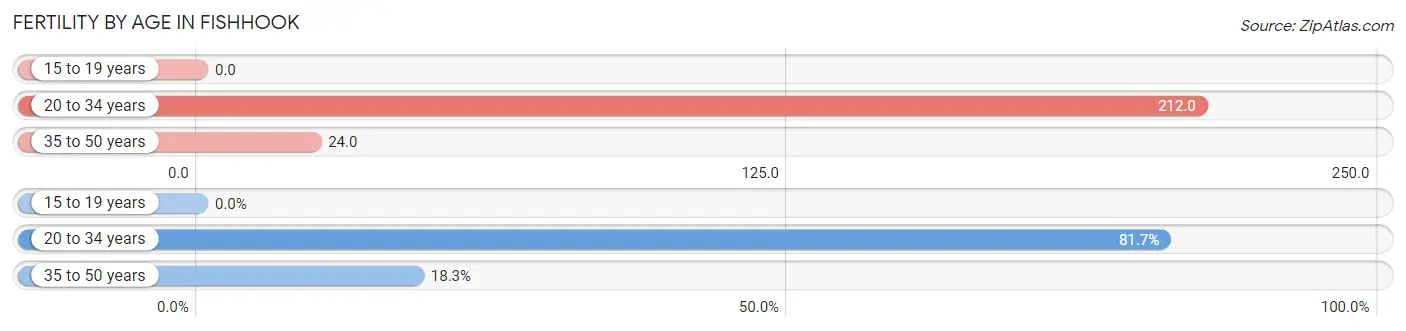
| Age Bracket | Women with Births | Births / 1,000 Women |
| 15 to 19 years | 0 (0.0%) | 0.0 |
| 20 to 34 years | 58 (81.7%) | 212.0 |
| 35 to 50 years | 13 (18.3%) | 24.0 |
| Total | 71 (100.0%) | 74.0 |
Fertility by Age by Marriage Status in Fishhook
70.4% of women with births (71) in Fishhook are married. The highest percentage of unmarried women with births falls into 20 to 34 years age bracket with 36.2% of them unmarried at the time of birth, while the lowest percentage of unmarried women with births belong to 35 to 50 years age bracket with 0.0% of them unmarried.
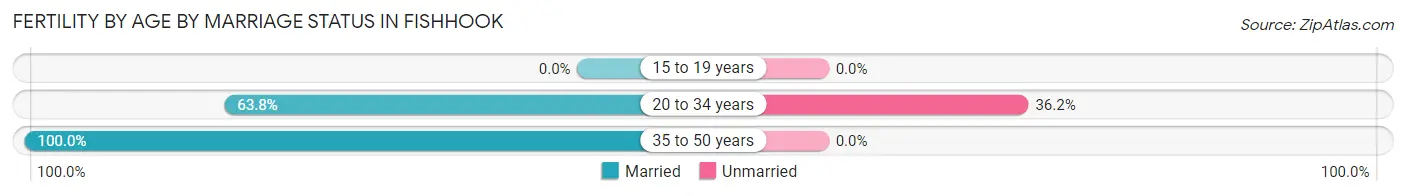
| Age Bracket | Married | Unmarried |
| 15 to 19 years | 0 (0.0%) | 0 (0.0%) |
| 20 to 34 years | 37 (63.8%) | 21 (36.2%) |
| 35 to 50 years | 13 (100.0%) | 0 (0.0%) |
| Total | 50 (70.4%) | 21 (29.6%) |
Fertility by Education in Fishhook
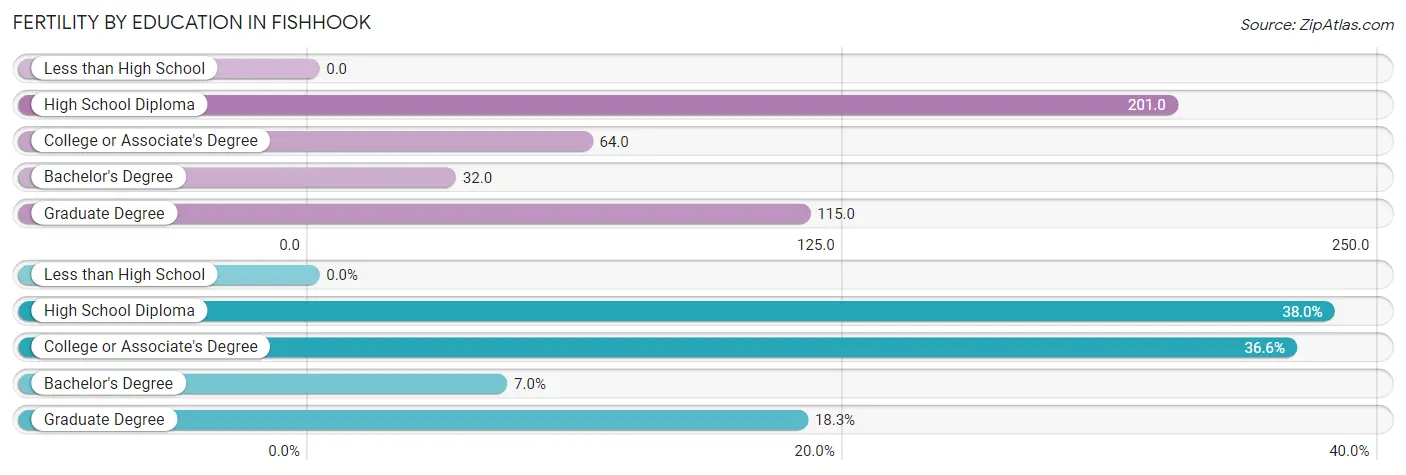
| Educational Attainment | Women with Births | Births / 1,000 Women |
| Less than High School | 0 (0.0%) | 0.0 |
| High School Diploma | 27 (38.0%) | 201.0 |
| College or Associate's Degree | 26 (36.6%) | 64.0 |
| Bachelor's Degree | 5 (7.0%) | 32.0 |
| Graduate Degree | 13 (18.3%) | 115.0 |
| Total | 71 (100.0%) | 74.0 |
Fertility by Education by Marriage Status in Fishhook
29.6% of women with births in Fishhook are unmarried. Women with the educational attainment of high school diploma are most likely to be married with 100.0% of them married at childbirth, while women with the educational attainment of college or associate's degree are least likely to be married with 80.8% of them unmarried at childbirth.
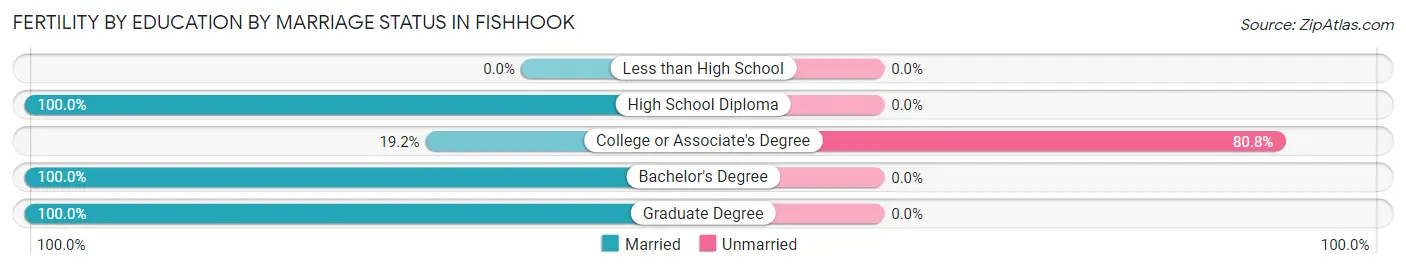
| Educational Attainment | Married | Unmarried |
| Less than High School | 0 (0.0%) | 0 (0.0%) |
| High School Diploma | 27 (100.0%) | 0 (0.0%) |
| College or Associate's Degree | 5 (19.2%) | 21 (80.8%) |
| Bachelor's Degree | 5 (100.0%) | 0 (0.0%) |
| Graduate Degree | 13 (100.0%) | 0 (0.0%) |
| Total | 50 (70.4%) | 21 (29.6%) |
Employment Characteristics in Fishhook
Employment by Class of Employer in Fishhook
Among the 2,159 employed individuals in Fishhook, private company employees (1,351 | 62.6%), federal government employees (232 | 10.7%), and self-employed (not incorporated) (199 | 9.2%) make up the most common classes of employment.
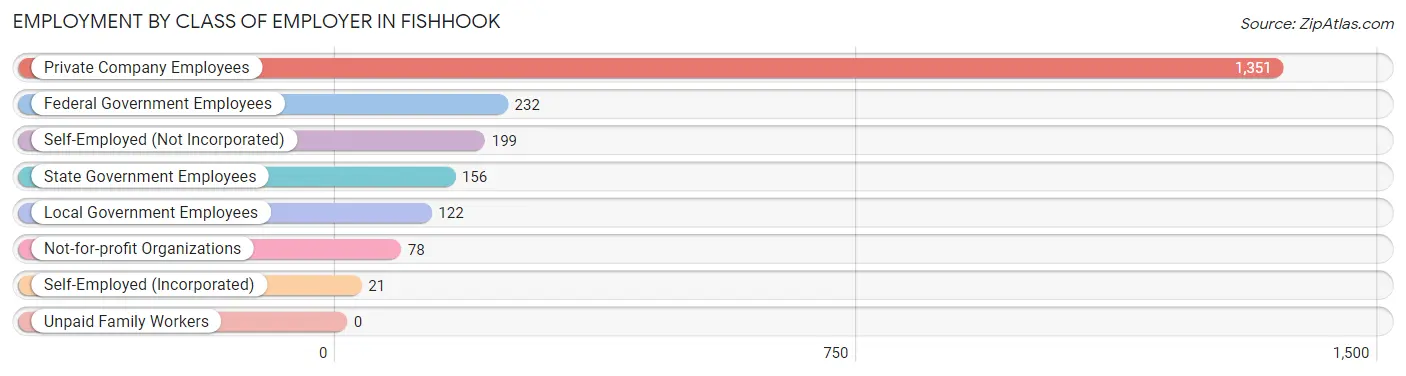
| Employer Class | # Employees | % Employees |
| Private Company Employees | 1,351 | 62.6% |
| Self-Employed (Incorporated) | 21 | 1.0% |
| Self-Employed (Not Incorporated) | 199 | 9.2% |
| Not-for-profit Organizations | 78 | 3.6% |
| Local Government Employees | 122 | 5.7% |
| State Government Employees | 156 | 7.2% |
| Federal Government Employees | 232 | 10.7% |
| Unpaid Family Workers | 0 | 0.0% |
| Total | 2,159 | 100.0% |
Employment Status by Age in Fishhook
According to the labor force statistics for Fishhook, out of the total population over 16 years of age (3,799), 62.6% or 2,378 individuals are in the labor force, with 6.8% or 162 of them unemployed. The age group with the highest labor force participation rate is 25 to 29 years, with 94.1% or 111 individuals in the labor force. Within the labor force, the 16 to 19 years age range has the highest percentage of unemployed individuals, with 45.3% or 58 of them being unemployed.
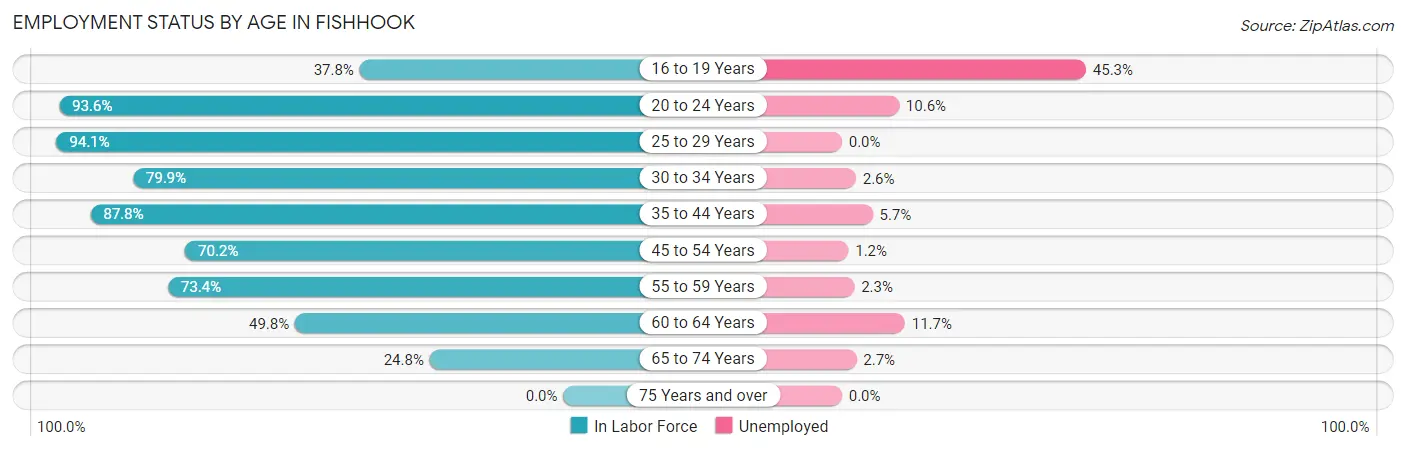
| Age Bracket | In Labor Force | Unemployed |
| 16 to 19 Years | 128 (37.8%) | 58 (45.3%) |
| 20 to 24 Years | 206 (93.6%) | 22 (10.6%) |
| 25 to 29 Years | 111 (94.1%) | 0 (0.0%) |
| 30 to 34 Years | 235 (79.9%) | 6 (2.6%) |
| 35 to 44 Years | 800 (87.8%) | 46 (5.7%) |
| 45 to 54 Years | 327 (70.2%) | 4 (1.2%) |
| 55 to 59 Years | 260 (73.4%) | 6 (2.3%) |
| 60 to 64 Years | 163 (49.8%) | 19 (11.7%) |
| 65 to 74 Years | 150 (24.8%) | 4 (2.7%) |
| 75 Years and over | 0 (0.0%) | 0 (0.0%) |
| Total | 2,378 (62.6%) | 162 (6.8%) |
Employment Status by Educational Attainment in Fishhook
According to labor force statistics for Fishhook, 76.8% of individuals (1,897) out of the total population between 25 and 64 years of age (2,470) are in the labor force, with 4.2% or 80 of them being unemployed. The group with the highest labor force participation rate are those with the educational attainment of bachelor's degree or higher, with 89.5% or 691 individuals in the labor force. Within the labor force, individuals with college / associate degree education have the highest percentage of unemployment, with 6.2% or 51 of them being unemployed.
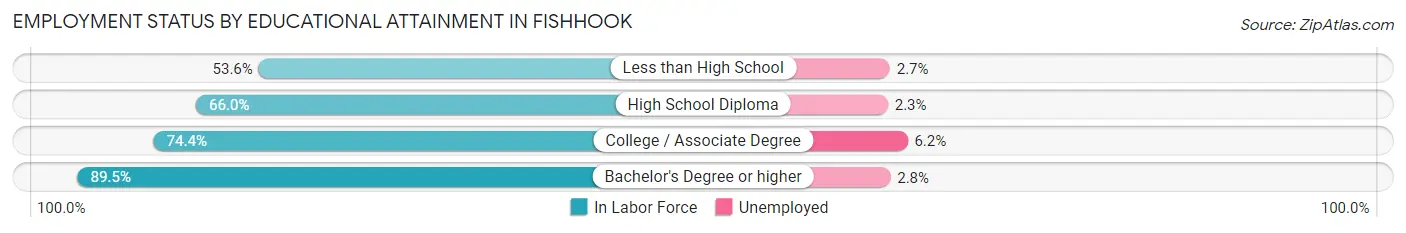
| Educational Attainment | In Labor Force | Unemployed |
| Less than High School | 37 (53.6%) | 2 (2.7%) |
| High School Diploma | 348 (66.0%) | 12 (2.3%) |
| College / Associate Degree | 820 (74.4%) | 68 (6.2%) |
| Bachelor's Degree or higher | 691 (89.5%) | 22 (2.8%) |
| Total | 1,897 (76.8%) | 104 (4.2%) |
Employment Occupations by Sex in Fishhook
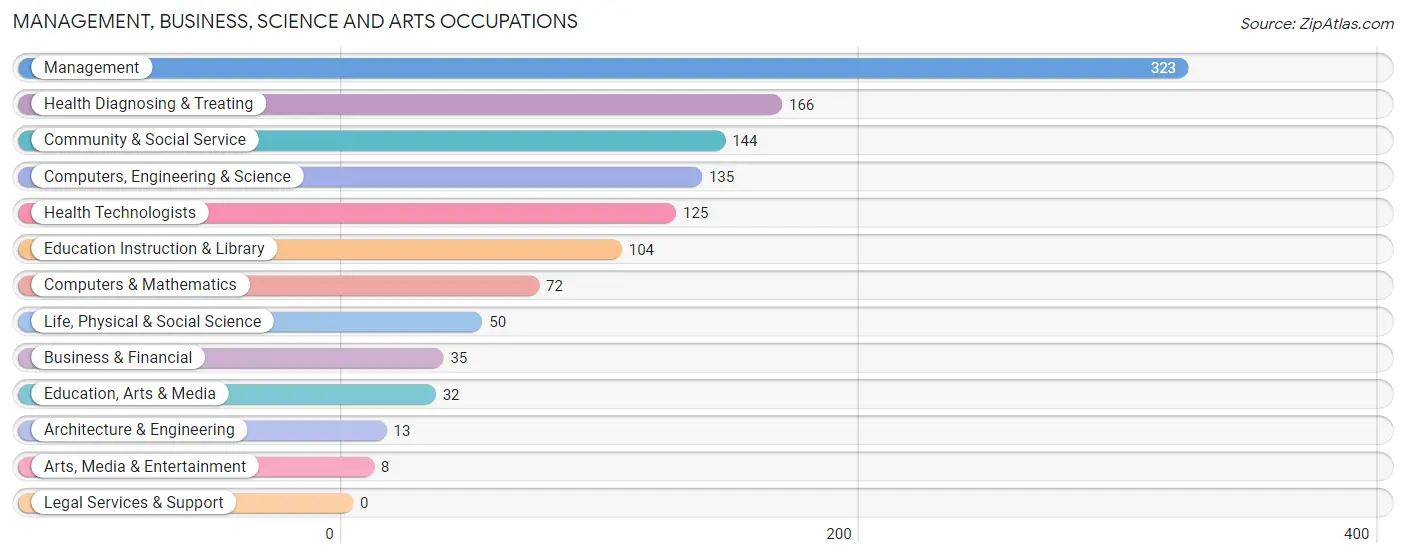
Management, Business, Science and Arts Occupations
The most common Management, Business, Science and Arts occupations in Fishhook are Management (323 | 15.2%), Health Diagnosing & Treating (166 | 7.8%), Community & Social Service (144 | 6.8%), Computers, Engineering & Science (135 | 6.4%), and Health Technologists (125 | 5.9%).
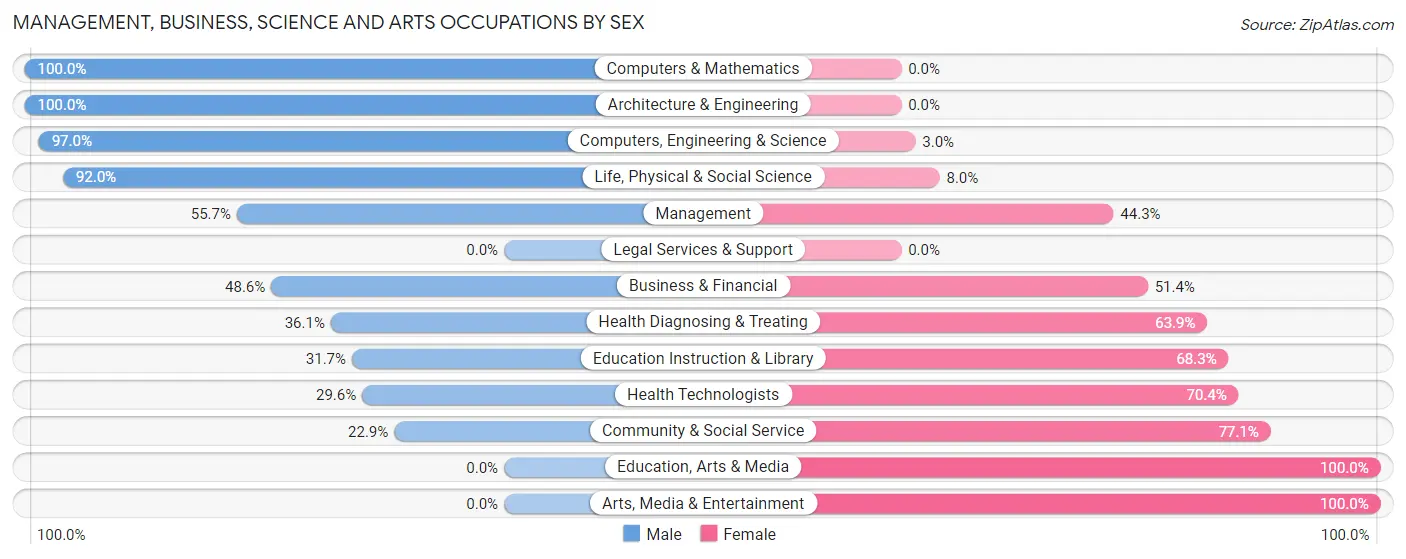
Management, Business, Science and Arts Occupations by Sex
Within the Management, Business, Science and Arts occupations in Fishhook, the most male-oriented occupations are Computers & Mathematics (100.0%), Architecture & Engineering (100.0%), and Computers, Engineering & Science (97.0%), while the most female-oriented occupations are Education, Arts & Media (100.0%), Arts, Media & Entertainment (100.0%), and Community & Social Service (77.1%).
| Occupation | Male | Female |
| Management | 180 (55.7%) | 143 (44.3%) |
| Business & Financial | 17 (48.6%) | 18 (51.4%) |
| Computers, Engineering & Science | 131 (97.0%) | 4 (3.0%) |
| Computers & Mathematics | 72 (100.0%) | 0 (0.0%) |
| Architecture & Engineering | 13 (100.0%) | 0 (0.0%) |
| Life, Physical & Social Science | 46 (92.0%) | 4 (8.0%) |
| Community & Social Service | 33 (22.9%) | 111 (77.1%) |
| Education, Arts & Media | 0 (0.0%) | 32 (100.0%) |
| Legal Services & Support | 0 (0.0%) | 0 (0.0%) |
| Education Instruction & Library | 33 (31.7%) | 71 (68.3%) |
| Arts, Media & Entertainment | 0 (0.0%) | 8 (100.0%) |
| Health Diagnosing & Treating | 60 (36.1%) | 106 (63.9%) |
| Health Technologists | 37 (29.6%) | 88 (70.4%) |
| Total (Category) | 421 (52.4%) | 382 (47.6%) |
| Total (Overall) | 1,242 (58.4%) | 885 (41.6%) |
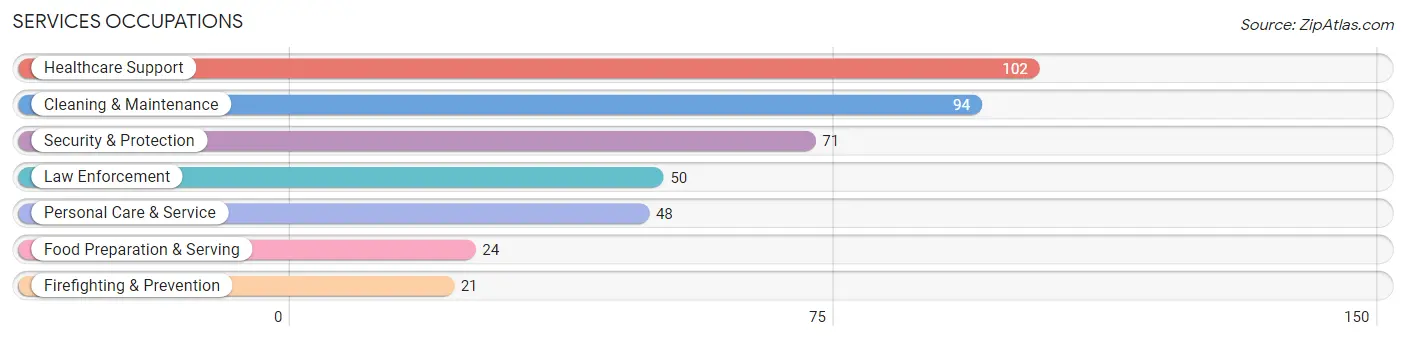
Services Occupations
The most common Services occupations in Fishhook are Healthcare Support (102 | 4.8%), Cleaning & Maintenance (94 | 4.4%), Security & Protection (71 | 3.3%), Law Enforcement (50 | 2.4%), and Personal Care & Service (48 | 2.3%).
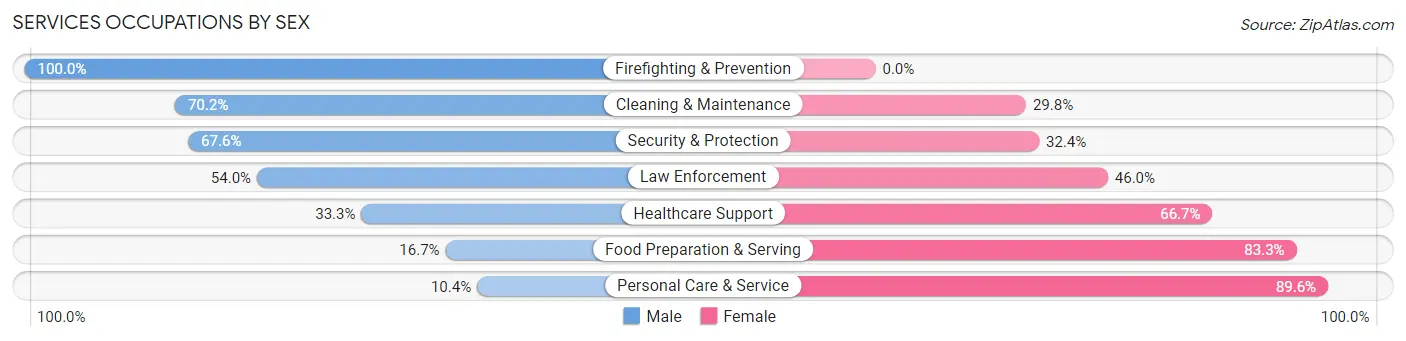
Services Occupations by Sex
Within the Services occupations in Fishhook, the most male-oriented occupations are Firefighting & Prevention (100.0%), Cleaning & Maintenance (70.2%), and Security & Protection (67.6%), while the most female-oriented occupations are Personal Care & Service (89.6%), Food Preparation & Serving (83.3%), and Healthcare Support (66.7%).
| Occupation | Male | Female |
| Healthcare Support | 34 (33.3%) | 68 (66.7%) |
| Security & Protection | 48 (67.6%) | 23 (32.4%) |
| Firefighting & Prevention | 21 (100.0%) | 0 (0.0%) |
| Law Enforcement | 27 (54.0%) | 23 (46.0%) |
| Food Preparation & Serving | 4 (16.7%) | 20 (83.3%) |
| Cleaning & Maintenance | 66 (70.2%) | 28 (29.8%) |
| Personal Care & Service | 5 (10.4%) | 43 (89.6%) |
| Total (Category) | 157 (46.3%) | 182 (53.7%) |
| Total (Overall) | 1,242 (58.4%) | 885 (41.6%) |
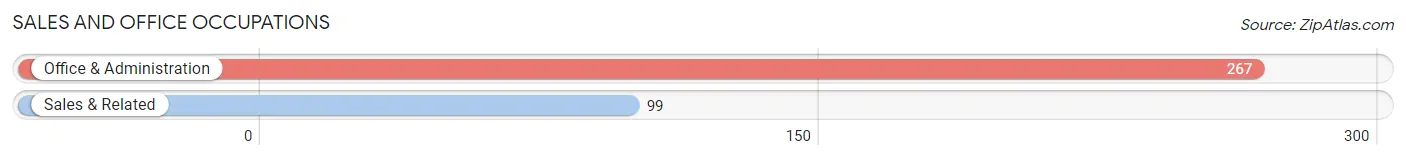
Sales and Office Occupations
The most common Sales and Office occupations in Fishhook are Office & Administration (267 | 12.6%), and Sales & Related (99 | 4.6%).
Sales and Office Occupations by Sex

| Occupation | Male | Female |
| Sales & Related | 4 (4.0%) | 95 (96.0%) |
| Office & Administration | 97 (36.3%) | 170 (63.7%) |
| Total (Category) | 101 (27.6%) | 265 (72.4%) |
| Total (Overall) | 1,242 (58.4%) | 885 (41.6%) |
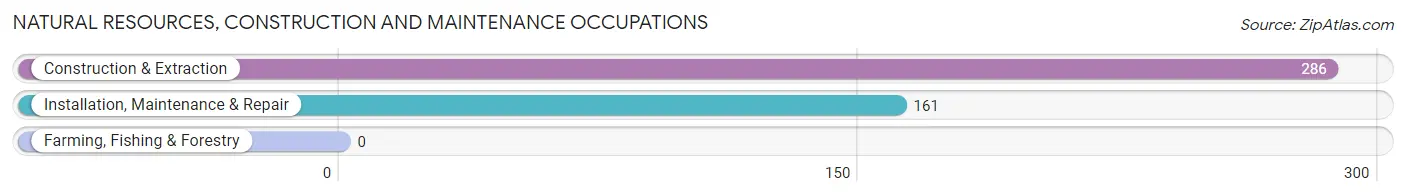
Natural Resources, Construction and Maintenance Occupations
The most common Natural Resources, Construction and Maintenance occupations in Fishhook are Construction & Extraction (286 | 13.5%), and Installation, Maintenance & Repair (161 | 7.6%).
Natural Resources, Construction and Maintenance Occupations by Sex
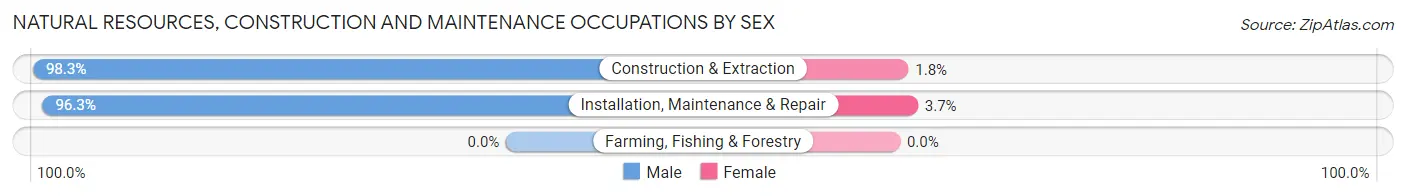
| Occupation | Male | Female |
| Farming, Fishing & Forestry | 0 (0.0%) | 0 (0.0%) |
| Construction & Extraction | 281 (98.3%) | 5 (1.8%) |
| Installation, Maintenance & Repair | 155 (96.3%) | 6 (3.7%) |
| Total (Category) | 436 (97.5%) | 11 (2.5%) |
| Total (Overall) | 1,242 (58.4%) | 885 (41.6%) |
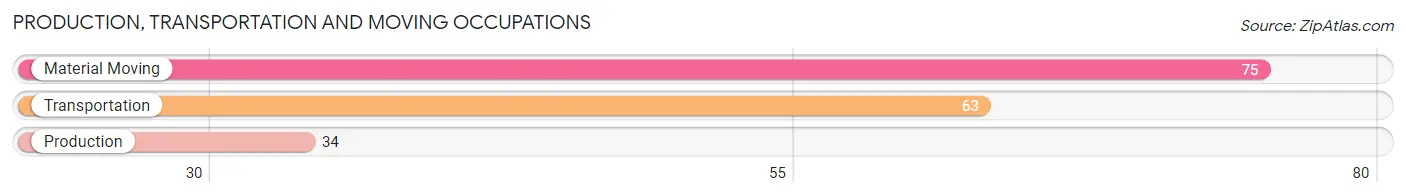
Production, Transportation and Moving Occupations
The most common Production, Transportation and Moving occupations in Fishhook are Material Moving (75 | 3.5%), Transportation (63 | 3.0%), and Production (34 | 1.6%).
Production, Transportation and Moving Occupations by Sex
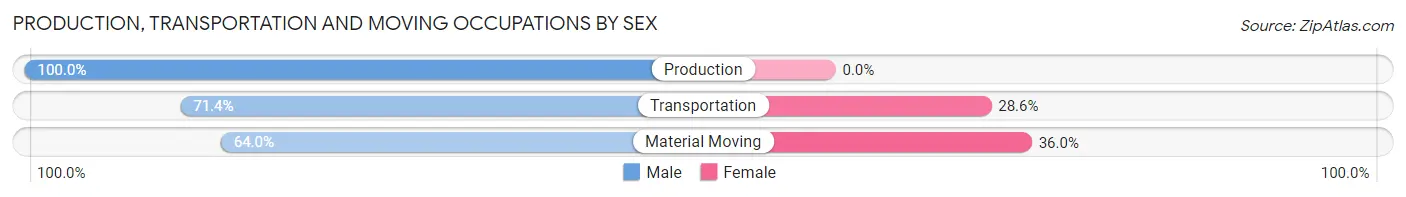
| Occupation | Male | Female |
| Production | 34 (100.0%) | 0 (0.0%) |
| Transportation | 45 (71.4%) | 18 (28.6%) |
| Material Moving | 48 (64.0%) | 27 (36.0%) |
| Total (Category) | 127 (73.8%) | 45 (26.2%) |
| Total (Overall) | 1,242 (58.4%) | 885 (41.6%) |
Employment Industries by Sex in Fishhook
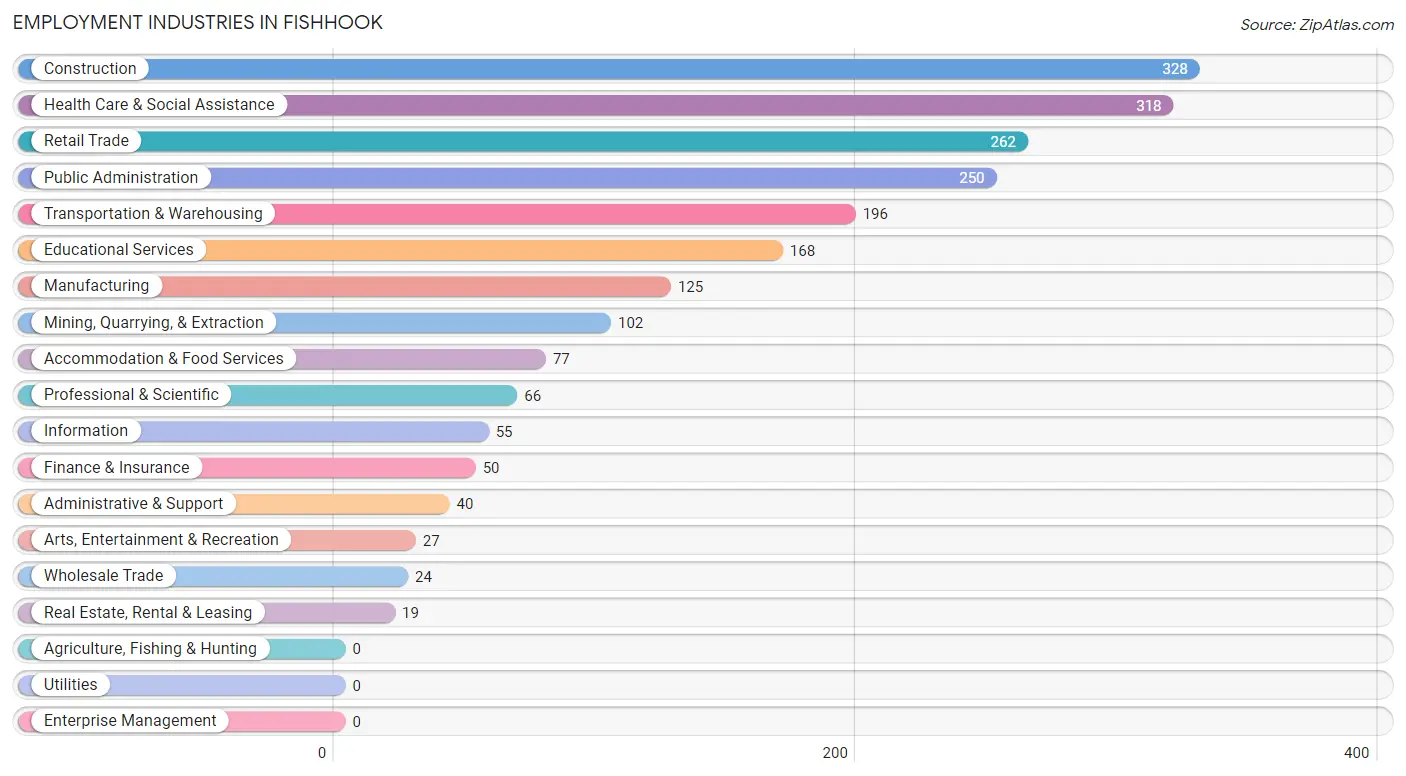
Employment Industries in Fishhook
The major employment industries in Fishhook include Construction (328 | 15.4%), Health Care & Social Assistance (318 | 14.9%), Retail Trade (262 | 12.3%), Public Administration (250 | 11.7%), and Transportation & Warehousing (196 | 9.2%).
Employment Industries by Sex in Fishhook
The Fishhook industries that see more men than women are Wholesale Trade (100.0%), Arts, Entertainment & Recreation (100.0%), and Manufacturing (97.6%), whereas the industries that tend to have a higher number of women are Real Estate, Rental & Leasing (100.0%), Administrative & Support (85.0%), and Finance & Insurance (80.0%).
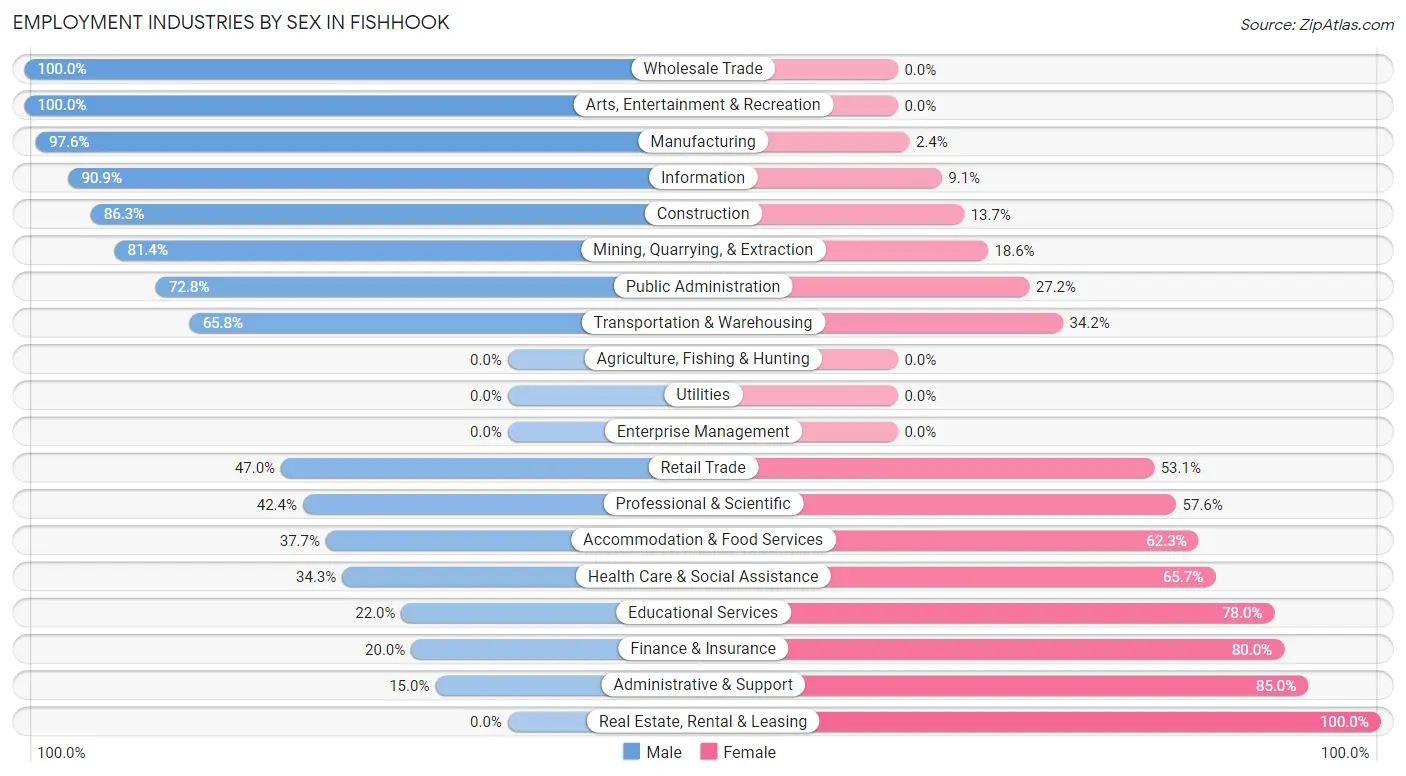
| Industry | Male | Female |
| Agriculture, Fishing & Hunting | 0 (0.0%) | 0 (0.0%) |
| Mining, Quarrying, & Extraction | 83 (81.4%) | 19 (18.6%) |
| Construction | 283 (86.3%) | 45 (13.7%) |
| Manufacturing | 122 (97.6%) | 3 (2.4%) |
| Wholesale Trade | 24 (100.0%) | 0 (0.0%) |
| Retail Trade | 123 (46.9%) | 139 (53.0%) |
| Transportation & Warehousing | 129 (65.8%) | 67 (34.2%) |
| Utilities | 0 (0.0%) | 0 (0.0%) |
| Information | 50 (90.9%) | 5 (9.1%) |
| Finance & Insurance | 10 (20.0%) | 40 (80.0%) |
| Real Estate, Rental & Leasing | 0 (0.0%) | 19 (100.0%) |
| Professional & Scientific | 28 (42.4%) | 38 (57.6%) |
| Enterprise Management | 0 (0.0%) | 0 (0.0%) |
| Administrative & Support | 6 (15.0%) | 34 (85.0%) |
| Educational Services | 37 (22.0%) | 131 (78.0%) |
| Health Care & Social Assistance | 109 (34.3%) | 209 (65.7%) |
| Arts, Entertainment & Recreation | 27 (100.0%) | 0 (0.0%) |
| Accommodation & Food Services | 29 (37.7%) | 48 (62.3%) |
| Public Administration | 182 (72.8%) | 68 (27.2%) |
| Total | 1,242 (58.4%) | 885 (41.6%) |
Education in Fishhook
School Enrollment in Fishhook
The most common levels of schooling among the 1,253 students in Fishhook are middle school (426 | 34.0%), elementary school (302 | 24.1%), and high school (278 | 22.2%).
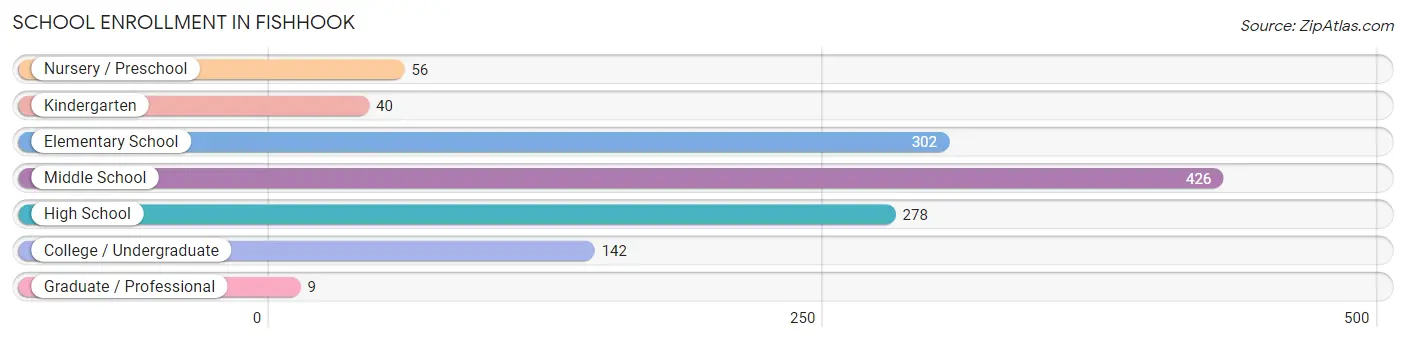
| School Level | # Students | % Students |
| Nursery / Preschool | 56 | 4.5% |
| Kindergarten | 40 | 3.2% |
| Elementary School | 302 | 24.1% |
| Middle School | 426 | 34.0% |
| High School | 278 | 22.2% |
| College / Undergraduate | 142 | 11.3% |
| Graduate / Professional | 9 | 0.7% |
| Total | 1,253 | 100.0% |
School Enrollment by Age by Funding Source in Fishhook
Out of a total of 1,253 students who are enrolled in schools in Fishhook, 228 (18.2%) attend a private institution, while the remaining 1,025 (81.8%) are enrolled in public schools. The age group of 3 to 4 year olds has the highest likelihood of being enrolled in private schools, with 32 (100.0% in the age bracket) enrolled. Conversely, the age group of 18 to 19 year olds has the lowest likelihood of being enrolled in a private school, with 68 (100.0% in the age bracket) attending a public institution.
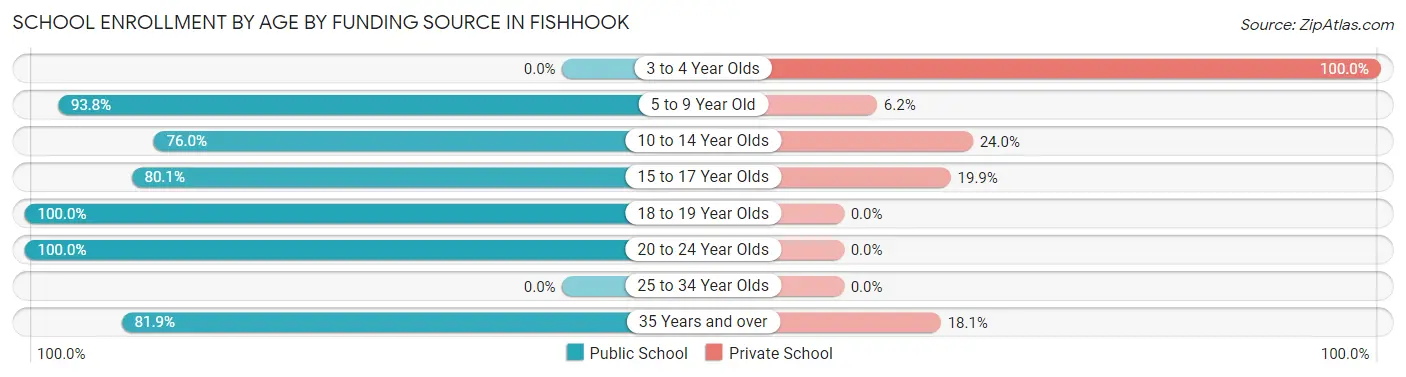
| Age Bracket | Public School | Private School |
| 3 to 4 Year Olds | 0 (0.0%) | 32 (100.0%) |
| 5 to 9 Year Old | 318 (93.8%) | 21 (6.2%) |
| 10 to 14 Year Olds | 338 (76.0%) | 107 (24.0%) |
| 15 to 17 Year Olds | 213 (80.1%) | 53 (19.9%) |
| 18 to 19 Year Olds | 68 (100.0%) | 0 (0.0%) |
| 20 to 24 Year Olds | 20 (100.0%) | 0 (0.0%) |
| 25 to 34 Year Olds | 0 (0.0%) | 0 (0.0%) |
| 35 Years and over | 68 (81.9%) | 15 (18.1%) |
| Total | 1,025 (81.8%) | 228 (18.2%) |
Educational Attainment by Field of Study in Fishhook
Arts & humanities (187 | 19.5%), science & technology (177 | 18.4%), business (140 | 14.6%), education (114 | 11.9%), and bio, nature & agricultural (98 | 10.2%) are the most common fields of study among 961 individuals in Fishhook who have obtained a bachelor's degree or higher.
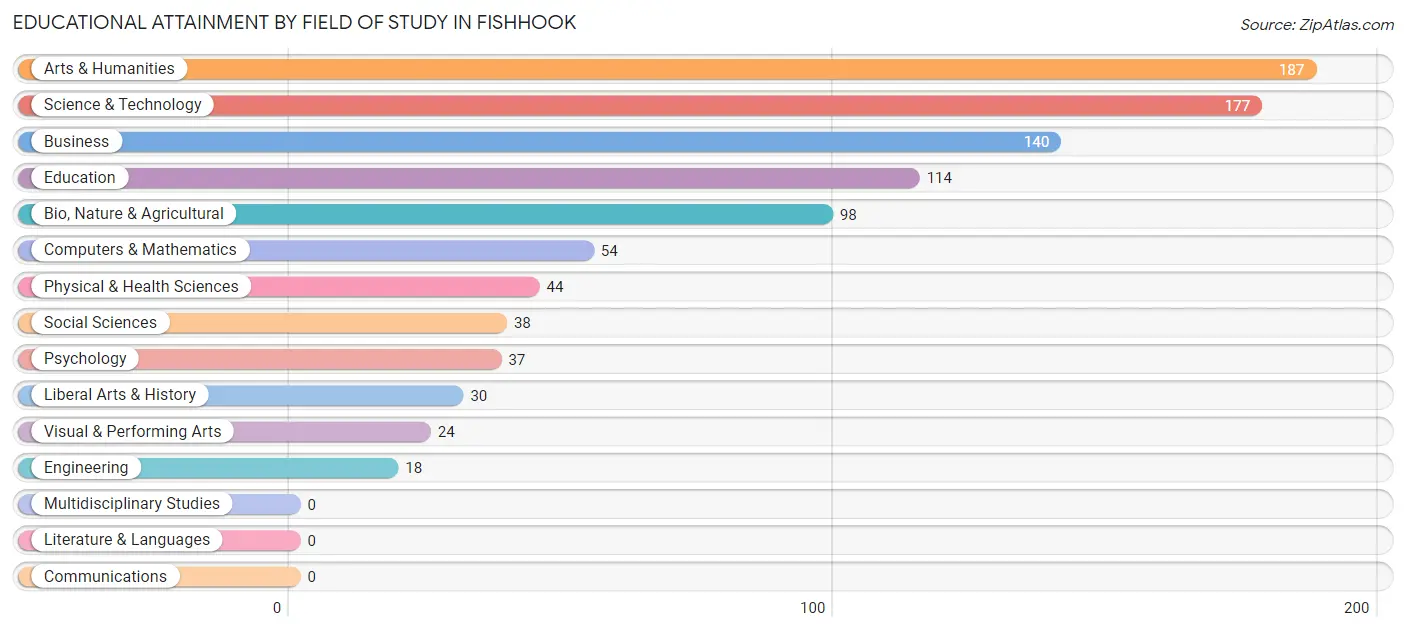
| Field of Study | # Graduates | % Graduates |
| Computers & Mathematics | 54 | 5.6% |
| Bio, Nature & Agricultural | 98 | 10.2% |
| Physical & Health Sciences | 44 | 4.6% |
| Psychology | 37 | 3.8% |
| Social Sciences | 38 | 4.0% |
| Engineering | 18 | 1.9% |
| Multidisciplinary Studies | 0 | 0.0% |
| Science & Technology | 177 | 18.4% |
| Business | 140 | 14.6% |
| Education | 114 | 11.9% |
| Literature & Languages | 0 | 0.0% |
| Liberal Arts & History | 30 | 3.1% |
| Visual & Performing Arts | 24 | 2.5% |
| Communications | 0 | 0.0% |
| Arts & Humanities | 187 | 19.5% |
| Total | 961 | 100.0% |
Transportation & Commute in Fishhook
Vehicle Availability by Sex in Fishhook
The most prevalent vehicle ownership categories in Fishhook are males with 2 vehicles (505, accounting for 38.5%) and females with 2 vehicles (307, making up 60.3%).
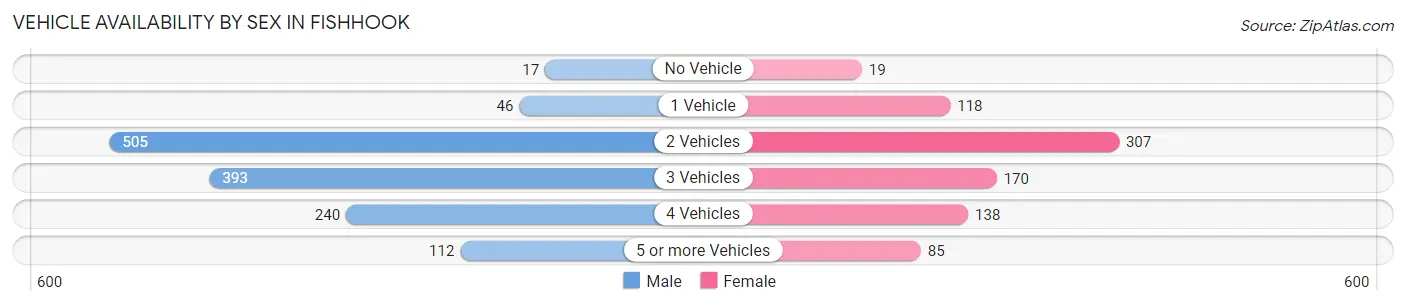
| Vehicles Available | Male | Female |
| No Vehicle | 17 (1.3%) | 19 (2.3%) |
| 1 Vehicle | 46 (3.5%) | 118 (14.1%) |
| 2 Vehicles | 505 (38.5%) | 307 (36.7%) |
| 3 Vehicles | 393 (29.9%) | 170 (20.3%) |
| 4 Vehicles | 240 (18.3%) | 138 (16.5%) |
| 5 or more Vehicles | 112 (8.5%) | 85 (10.2%) |
| Total | 1,313 (100.0%) | 837 (100.0%) |
Commute Time in Fishhook
The most frequently occuring commute durations in Fishhook are 15 to 19 minutes (361 commuters, 17.9%), 20 to 24 minutes (349 commuters, 17.3%), and 45 to 59 minutes (326 commuters, 16.1%).
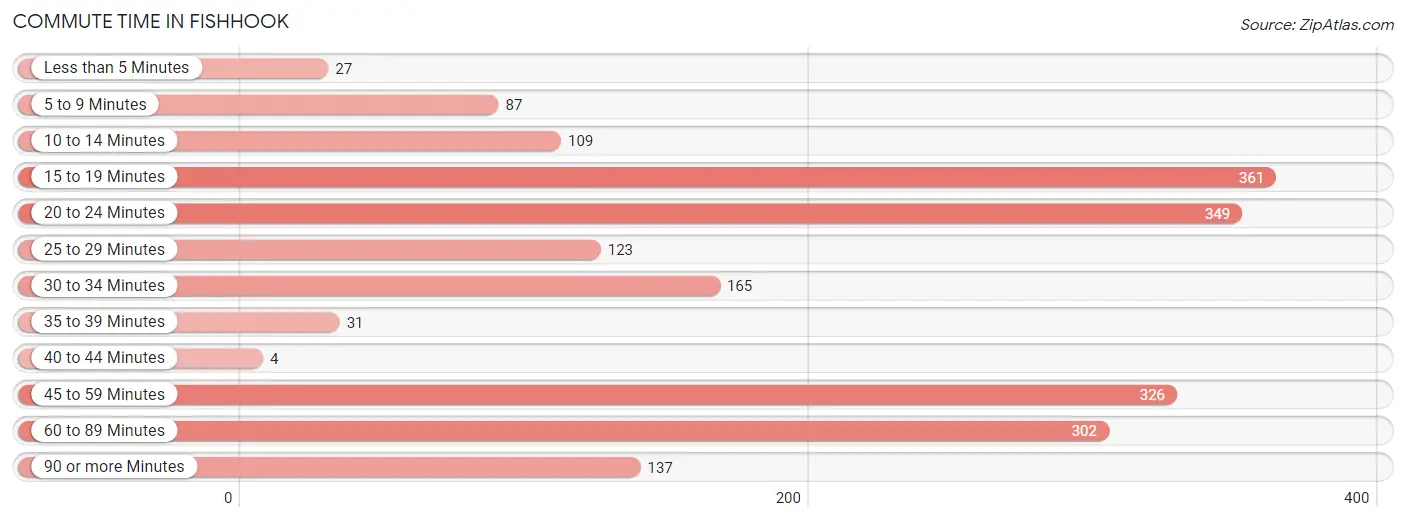
| Commute Time | # Commuters | % Commuters |
| Less than 5 Minutes | 27 | 1.3% |
| 5 to 9 Minutes | 87 | 4.3% |
| 10 to 14 Minutes | 109 | 5.4% |
| 15 to 19 Minutes | 361 | 17.9% |
| 20 to 24 Minutes | 349 | 17.3% |
| 25 to 29 Minutes | 123 | 6.1% |
| 30 to 34 Minutes | 165 | 8.2% |
| 35 to 39 Minutes | 31 | 1.5% |
| 40 to 44 Minutes | 4 | 0.2% |
| 45 to 59 Minutes | 326 | 16.1% |
| 60 to 89 Minutes | 302 | 14.9% |
| 90 or more Minutes | 137 | 6.8% |
Commute Time by Sex in Fishhook
The most common commute times in Fishhook are 45 to 59 minutes (295 commuters, 23.2%) for males and 20 to 24 minutes (160 commuters, 21.4%) for females.
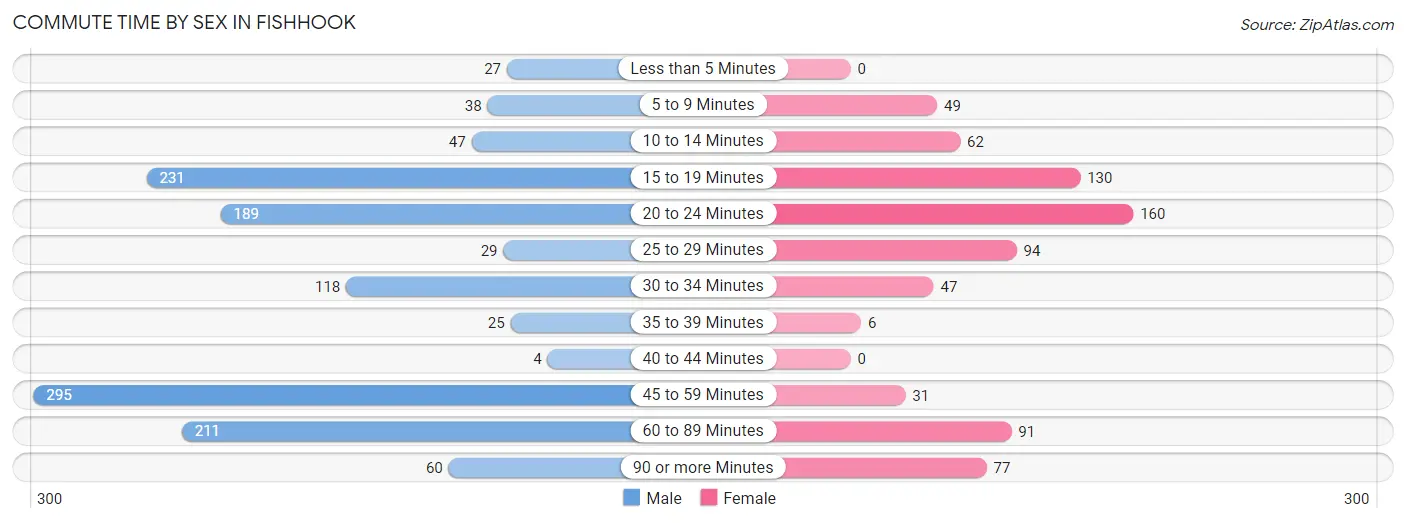
| Commute Time | Male | Female |
| Less than 5 Minutes | 27 (2.1%) | 0 (0.0%) |
| 5 to 9 Minutes | 38 (3.0%) | 49 (6.6%) |
| 10 to 14 Minutes | 47 (3.7%) | 62 (8.3%) |
| 15 to 19 Minutes | 231 (18.1%) | 130 (17.4%) |
| 20 to 24 Minutes | 189 (14.8%) | 160 (21.4%) |
| 25 to 29 Minutes | 29 (2.3%) | 94 (12.6%) |
| 30 to 34 Minutes | 118 (9.3%) | 47 (6.3%) |
| 35 to 39 Minutes | 25 (2.0%) | 6 (0.8%) |
| 40 to 44 Minutes | 4 (0.3%) | 0 (0.0%) |
| 45 to 59 Minutes | 295 (23.2%) | 31 (4.2%) |
| 60 to 89 Minutes | 211 (16.6%) | 91 (12.2%) |
| 90 or more Minutes | 60 (4.7%) | 77 (10.3%) |
Time of Departure to Work by Sex in Fishhook
The most frequent times of departure to work in Fishhook are 7:30 AM to 7:59 AM (248, 19.5%) for males and 8:00 AM to 8:29 AM (114, 15.3%) for females.
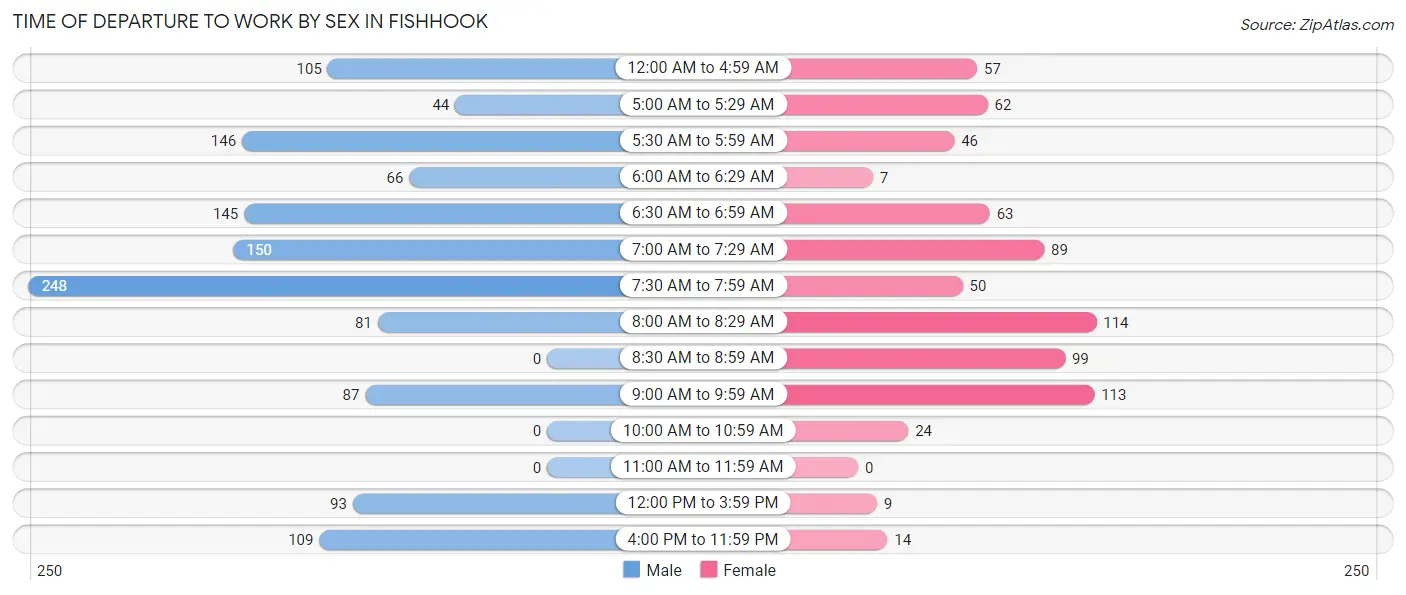
| Time of Departure | Male | Female |
| 12:00 AM to 4:59 AM | 105 (8.2%) | 57 (7.6%) |
| 5:00 AM to 5:29 AM | 44 (3.5%) | 62 (8.3%) |
| 5:30 AM to 5:59 AM | 146 (11.5%) | 46 (6.2%) |
| 6:00 AM to 6:29 AM | 66 (5.2%) | 7 (0.9%) |
| 6:30 AM to 6:59 AM | 145 (11.4%) | 63 (8.4%) |
| 7:00 AM to 7:29 AM | 150 (11.8%) | 89 (11.9%) |
| 7:30 AM to 7:59 AM | 248 (19.5%) | 50 (6.7%) |
| 8:00 AM to 8:29 AM | 81 (6.4%) | 114 (15.3%) |
| 8:30 AM to 8:59 AM | 0 (0.0%) | 99 (13.3%) |
| 9:00 AM to 9:59 AM | 87 (6.8%) | 113 (15.1%) |
| 10:00 AM to 10:59 AM | 0 (0.0%) | 24 (3.2%) |
| 11:00 AM to 11:59 AM | 0 (0.0%) | 0 (0.0%) |
| 12:00 PM to 3:59 PM | 93 (7.3%) | 9 (1.2%) |
| 4:00 PM to 11:59 PM | 109 (8.6%) | 14 (1.9%) |
| Total | 1,274 (100.0%) | 747 (100.0%) |
Housing Occupancy in Fishhook
Occupancy by Ownership in Fishhook
Of the total 1,767 dwellings in Fishhook, owner-occupied units account for 1,483 (83.9%), while renter-occupied units make up 284 (16.1%).
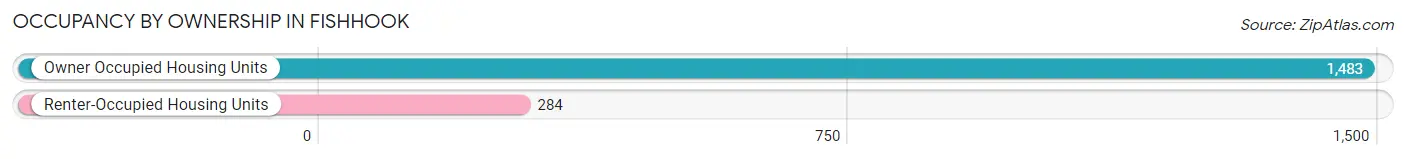
| Occupancy | # Housing Units | % Housing Units |
| Owner Occupied Housing Units | 1,483 | 83.9% |
| Renter-Occupied Housing Units | 284 | 16.1% |
| Total Occupied Housing Units | 1,767 | 100.0% |
Occupancy by Household Size in Fishhook
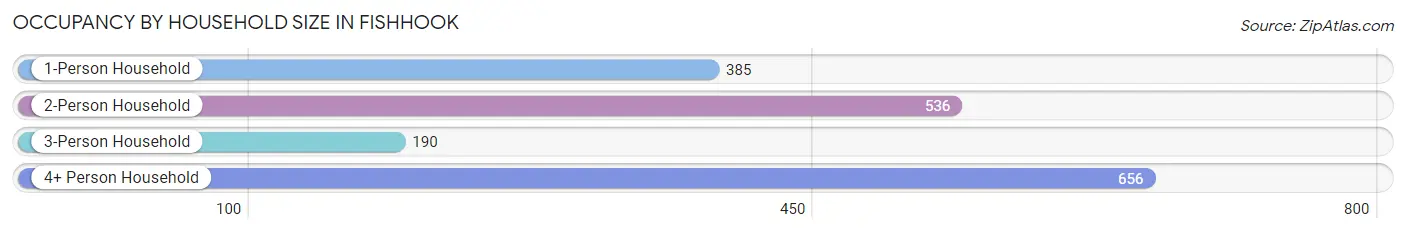
| Household Size | # Housing Units | % Housing Units |
| 1-Person Household | 385 | 21.8% |
| 2-Person Household | 536 | 30.3% |
| 3-Person Household | 190 | 10.7% |
| 4+ Person Household | 656 | 37.1% |
| Total Housing Units | 1,767 | 100.0% |
Occupancy by Ownership by Household Size in Fishhook
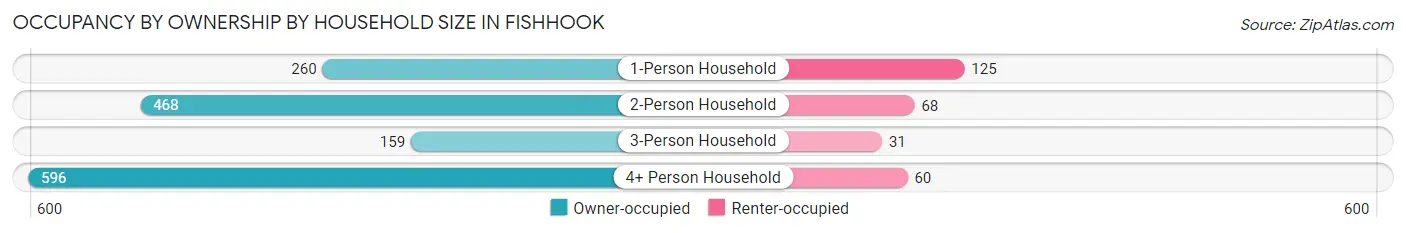
| Household Size | Owner-occupied | Renter-occupied |
| 1-Person Household | 260 (67.5%) | 125 (32.5%) |
| 2-Person Household | 468 (87.3%) | 68 (12.7%) |
| 3-Person Household | 159 (83.7%) | 31 (16.3%) |
| 4+ Person Household | 596 (90.8%) | 60 (9.1%) |
| Total Housing Units | 1,483 (83.9%) | 284 (16.1%) |
Occupancy by Educational Attainment in Fishhook
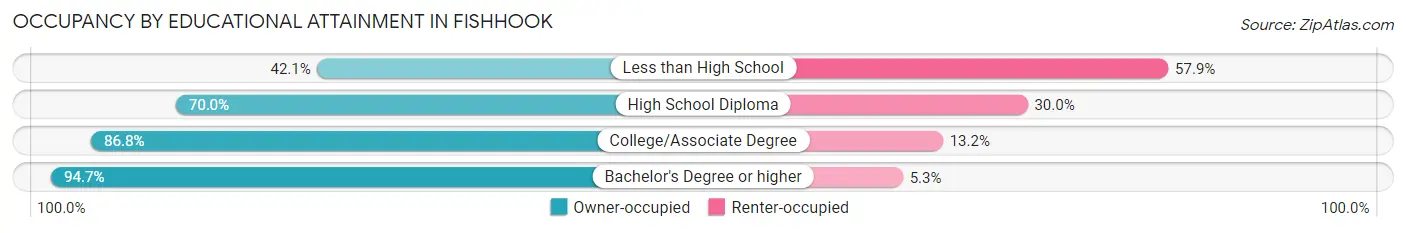
| Household Size | Owner-occupied | Renter-occupied |
| Less than High School | 24 (42.1%) | 33 (57.9%) |
| High School Diploma | 287 (70.0%) | 123 (30.0%) |
| College/Associate Degree | 651 (86.8%) | 99 (13.2%) |
| Bachelor's Degree or higher | 521 (94.7%) | 29 (5.3%) |
Occupancy by Age of Householder in Fishhook
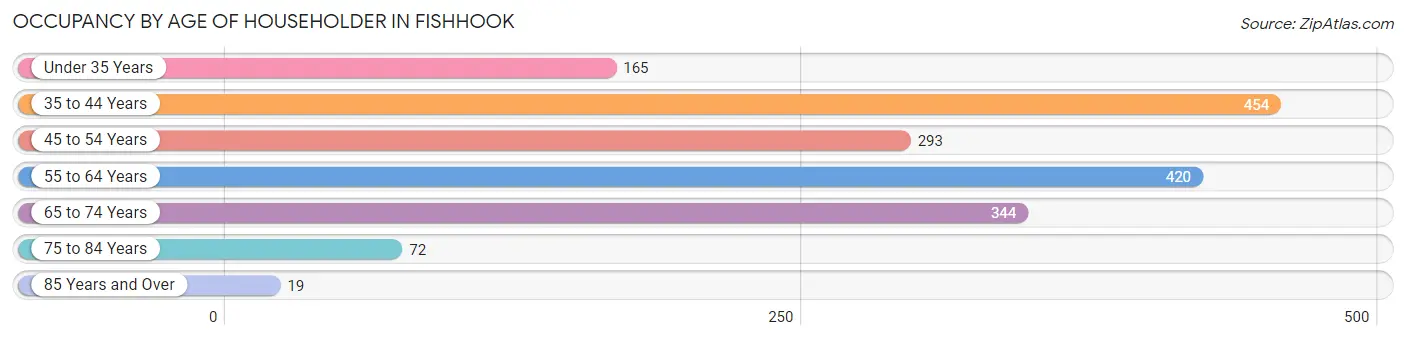
| Age Bracket | # Households | % Households |
| Under 35 Years | 165 | 9.3% |
| 35 to 44 Years | 454 | 25.7% |
| 45 to 54 Years | 293 | 16.6% |
| 55 to 64 Years | 420 | 23.8% |
| 65 to 74 Years | 344 | 19.5% |
| 75 to 84 Years | 72 | 4.1% |
| 85 Years and Over | 19 | 1.1% |
| Total | 1,767 | 100.0% |
Housing Finances in Fishhook
Median Income by Occupancy in Fishhook
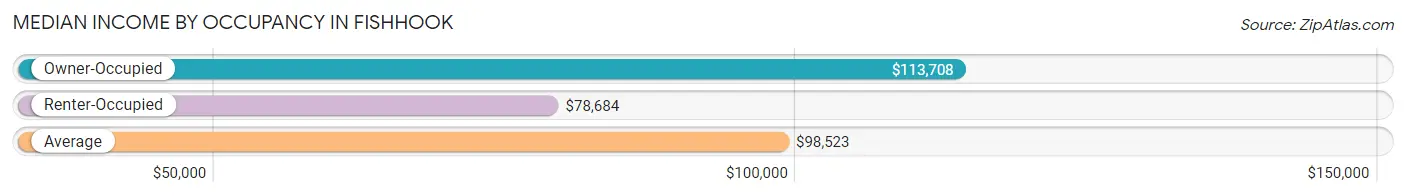
| Occupancy Type | # Households | Median Income |
| Owner-Occupied | 1,483 (83.9%) | $113,708 |
| Renter-Occupied | 284 (16.1%) | $78,684 |
| Average | 1,767 (100.0%) | $98,523 |
Occupancy by Householder Income Bracket in Fishhook
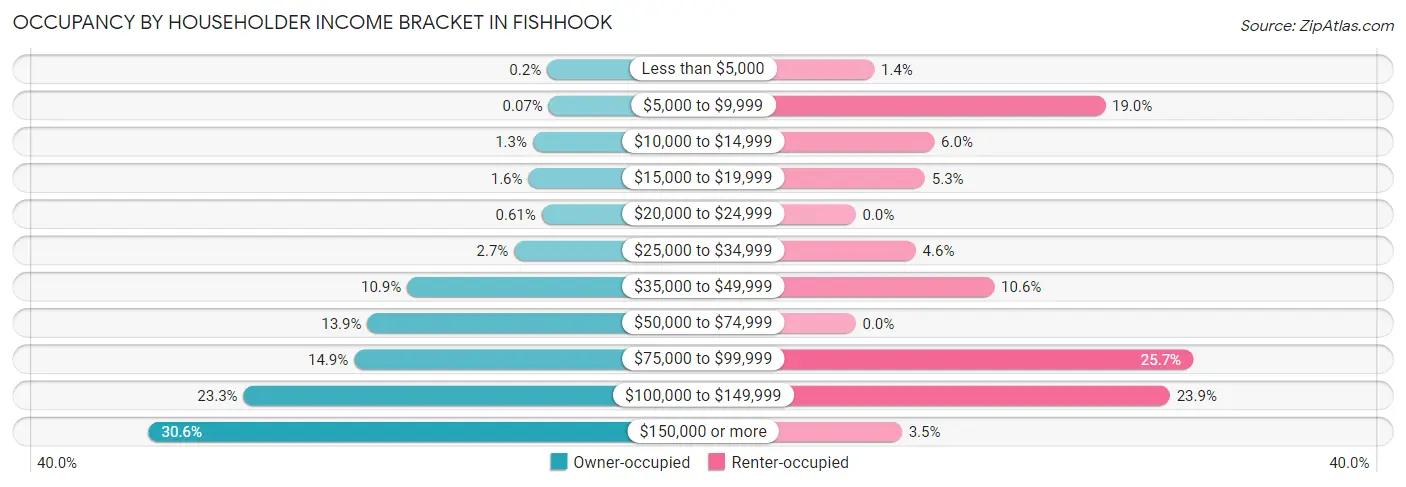
| Income Bracket | Owner-occupied | Renter-occupied |
| Less than $5,000 | 3 (0.2%) | 4 (1.4%) |
| $5,000 to $9,999 | 1 (0.1%) | 54 (19.0%) |
| $10,000 to $14,999 | 19 (1.3%) | 17 (6.0%) |
| $15,000 to $19,999 | 24 (1.6%) | 15 (5.3%) |
| $20,000 to $24,999 | 9 (0.6%) | 0 (0.0%) |
| $25,000 to $34,999 | 40 (2.7%) | 13 (4.6%) |
| $35,000 to $49,999 | 161 (10.9%) | 30 (10.6%) |
| $50,000 to $74,999 | 206 (13.9%) | 0 (0.0%) |
| $75,000 to $99,999 | 221 (14.9%) | 73 (25.7%) |
| $100,000 to $149,999 | 346 (23.3%) | 68 (23.9%) |
| $150,000 or more | 453 (30.5%) | 10 (3.5%) |
| Total | 1,483 (100.0%) | 284 (100.0%) |
Monthly Housing Cost Tiers in Fishhook
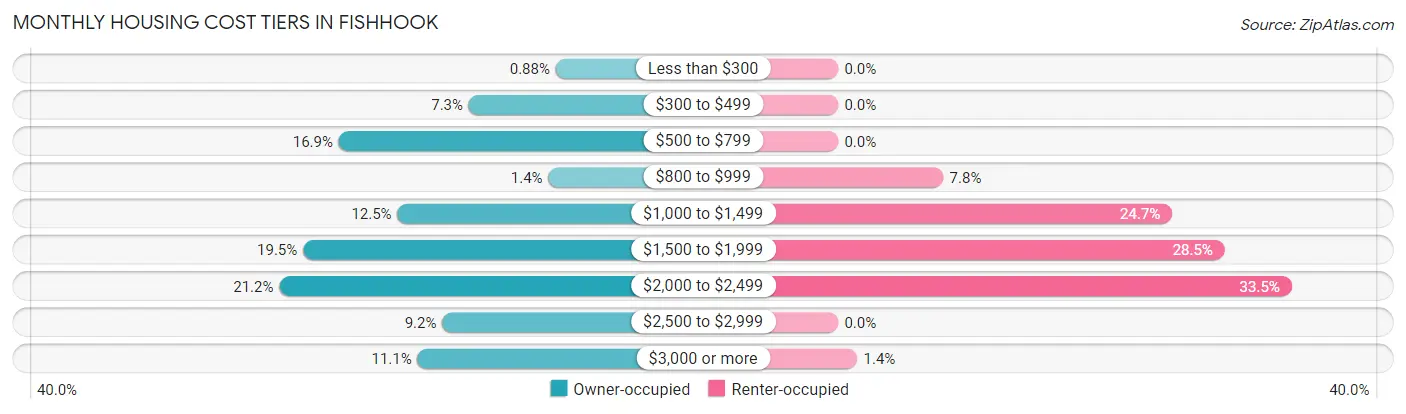
| Monthly Cost | Owner-occupied | Renter-occupied |
| Less than $300 | 13 (0.9%) | 0 (0.0%) |
| $300 to $499 | 108 (7.3%) | 0 (0.0%) |
| $500 to $799 | 250 (16.9%) | 0 (0.0%) |
| $800 to $999 | 21 (1.4%) | 22 (7.7%) |
| $1,000 to $1,499 | 186 (12.5%) | 70 (24.6%) |
| $1,500 to $1,999 | 289 (19.5%) | 81 (28.5%) |
| $2,000 to $2,499 | 315 (21.2%) | 95 (33.5%) |
| $2,500 to $2,999 | 137 (9.2%) | 0 (0.0%) |
| $3,000 or more | 164 (11.1%) | 4 (1.4%) |
| Total | 1,483 (100.0%) | 284 (100.0%) |
Physical Housing Characteristics in Fishhook
Housing Structures in Fishhook
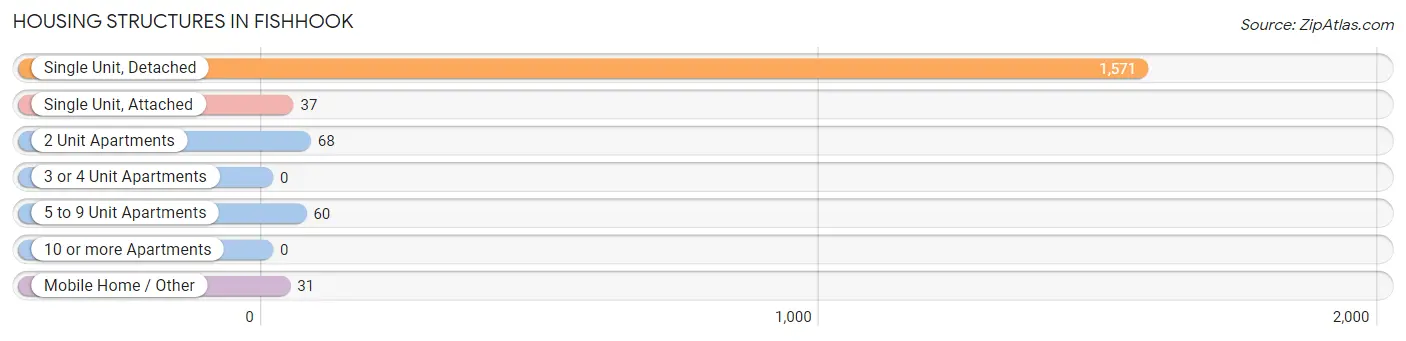
| Structure Type | # Housing Units | % Housing Units |
| Single Unit, Detached | 1,571 | 88.9% |
| Single Unit, Attached | 37 | 2.1% |
| 2 Unit Apartments | 68 | 3.8% |
| 3 or 4 Unit Apartments | 0 | 0.0% |
| 5 to 9 Unit Apartments | 60 | 3.4% |
| 10 or more Apartments | 0 | 0.0% |
| Mobile Home / Other | 31 | 1.8% |
| Total | 1,767 | 100.0% |
Housing Structures by Occupancy in Fishhook
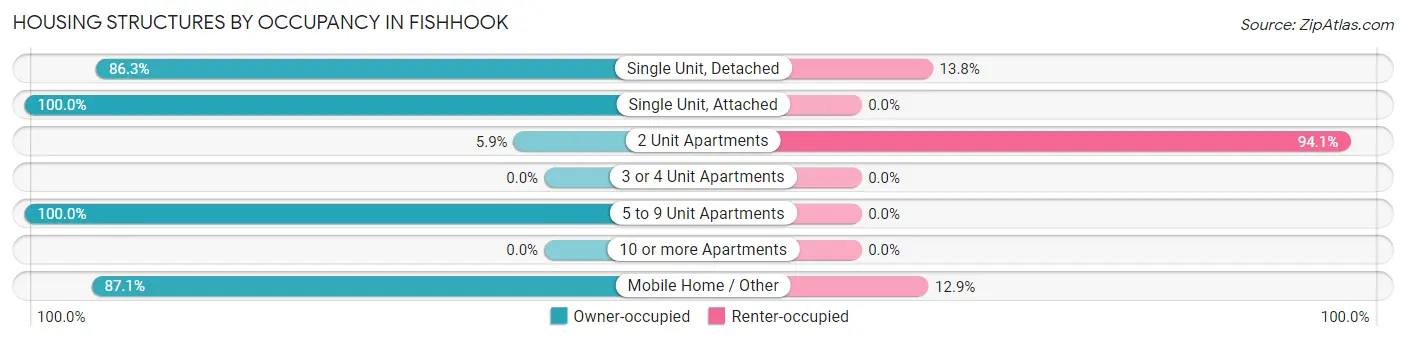
| Structure Type | Owner-occupied | Renter-occupied |
| Single Unit, Detached | 1,355 (86.3%) | 216 (13.8%) |
| Single Unit, Attached | 37 (100.0%) | 0 (0.0%) |
| 2 Unit Apartments | 4 (5.9%) | 64 (94.1%) |
| 3 or 4 Unit Apartments | 0 (0.0%) | 0 (0.0%) |
| 5 to 9 Unit Apartments | 60 (100.0%) | 0 (0.0%) |
| 10 or more Apartments | 0 (0.0%) | 0 (0.0%) |
| Mobile Home / Other | 27 (87.1%) | 4 (12.9%) |
| Total | 1,483 (83.9%) | 284 (16.1%) |
Housing Structures by Number of Rooms in Fishhook
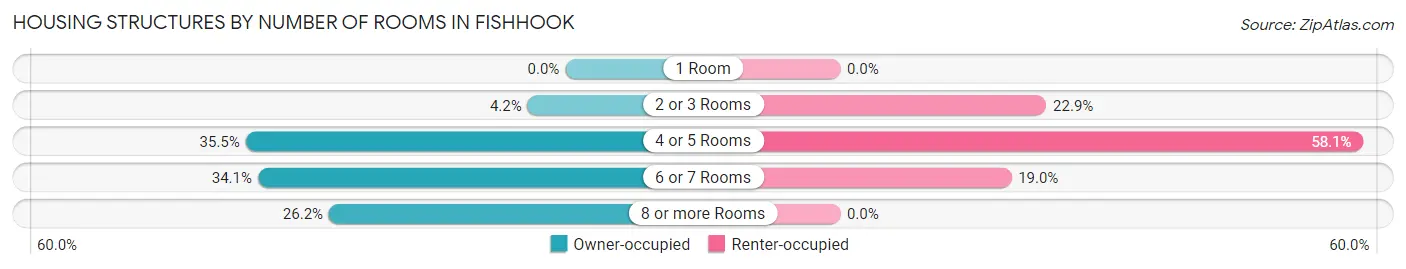
| Number of Rooms | Owner-occupied | Renter-occupied |
| 1 Room | 0 (0.0%) | 0 (0.0%) |
| 2 or 3 Rooms | 62 (4.2%) | 65 (22.9%) |
| 4 or 5 Rooms | 526 (35.5%) | 165 (58.1%) |
| 6 or 7 Rooms | 506 (34.1%) | 54 (19.0%) |
| 8 or more Rooms | 389 (26.2%) | 0 (0.0%) |
| Total | 1,483 (100.0%) | 284 (100.0%) |
Housing Structure by Heating Type in Fishhook
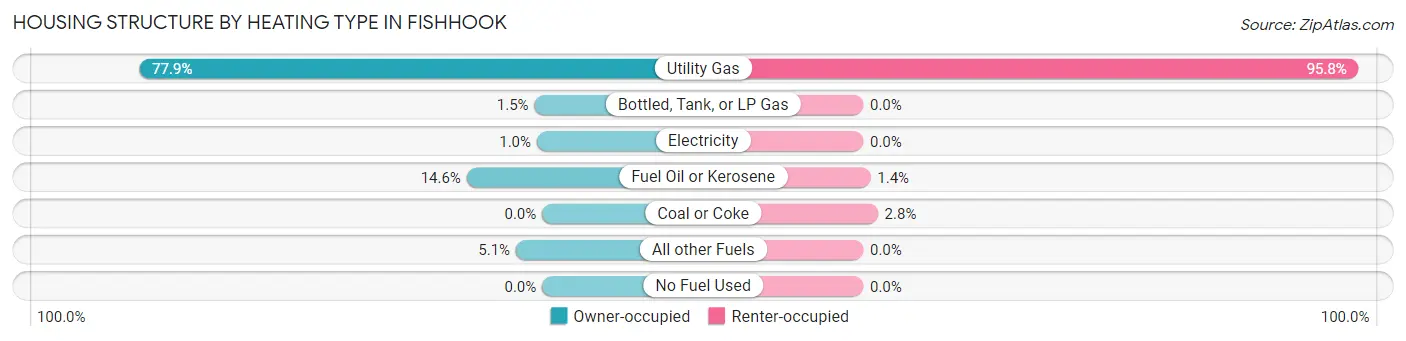
| Heating Type | Owner-occupied | Renter-occupied |
| Utility Gas | 1,155 (77.9%) | 272 (95.8%) |
| Bottled, Tank, or LP Gas | 22 (1.5%) | 0 (0.0%) |
| Electricity | 15 (1.0%) | 0 (0.0%) |
| Fuel Oil or Kerosene | 216 (14.6%) | 4 (1.4%) |
| Coal or Coke | 0 (0.0%) | 8 (2.8%) |
| All other Fuels | 75 (5.1%) | 0 (0.0%) |
| No Fuel Used | 0 (0.0%) | 0 (0.0%) |
| Total | 1,483 (100.0%) | 284 (100.0%) |
Household Vehicle Usage in Fishhook
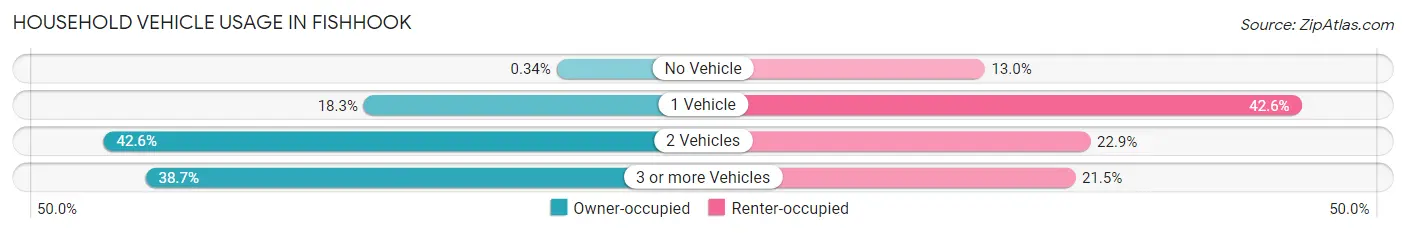
| Vehicles per Household | Owner-occupied | Renter-occupied |
| No Vehicle | 5 (0.3%) | 37 (13.0%) |
| 1 Vehicle | 272 (18.3%) | 121 (42.6%) |
| 2 Vehicles | 632 (42.6%) | 65 (22.9%) |
| 3 or more Vehicles | 574 (38.7%) | 61 (21.5%) |
| Total | 1,483 (100.0%) | 284 (100.0%) |
Real Estate & Mortgages in Fishhook
Real Estate and Mortgage Overview in Fishhook
| Characteristic | Without Mortgage | With Mortgage |
| Housing Units | 444 | 1,039 |
| Median Property Value | $268,500 | $365,600 |
| Median Household Income | $80,625 | $385 |
| Monthly Housing Costs | $622 | $164 |
| Real Estate Taxes | $2,042 | $25 |
Property Value by Mortgage Status in Fishhook
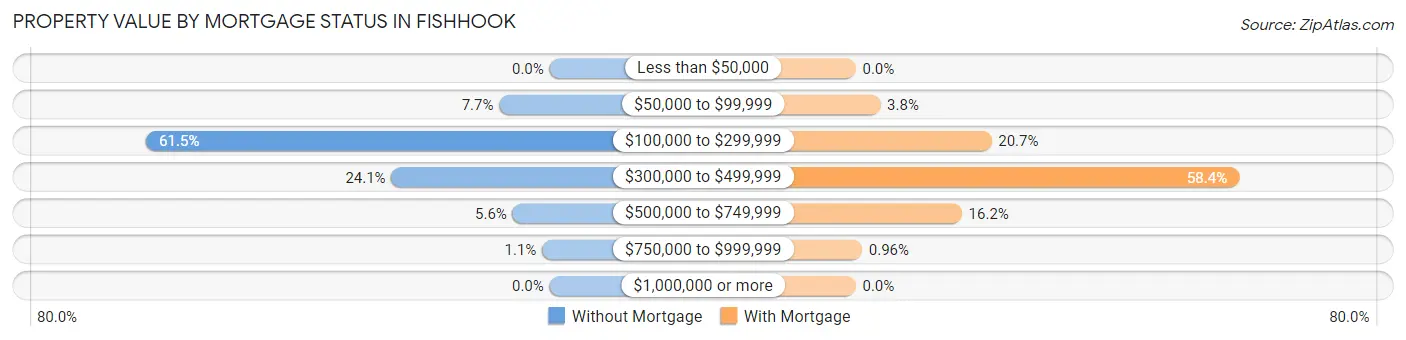
| Property Value | Without Mortgage | With Mortgage |
| Less than $50,000 | 0 (0.0%) | 0 (0.0%) |
| $50,000 to $99,999 | 34 (7.7%) | 39 (3.7%) |
| $100,000 to $299,999 | 273 (61.5%) | 215 (20.7%) |
| $300,000 to $499,999 | 107 (24.1%) | 607 (58.4%) |
| $500,000 to $749,999 | 25 (5.6%) | 168 (16.2%) |
| $750,000 to $999,999 | 5 (1.1%) | 10 (1.0%) |
| $1,000,000 or more | 0 (0.0%) | 0 (0.0%) |
| Total | 444 (100.0%) | 1,039 (100.0%) |
Household Income by Mortgage Status in Fishhook
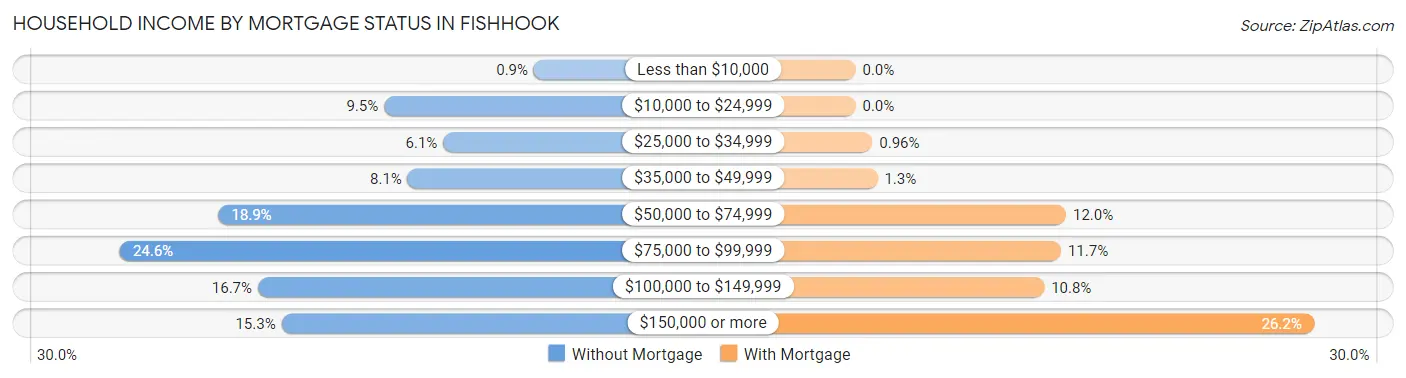
| Household Income | Without Mortgage | With Mortgage |
| Less than $10,000 | 4 (0.9%) | 0 (0.0%) |
| $10,000 to $24,999 | 42 (9.5%) | 0 (0.0%) |
| $25,000 to $34,999 | 27 (6.1%) | 10 (1.0%) |
| $35,000 to $49,999 | 36 (8.1%) | 13 (1.3%) |
| $50,000 to $74,999 | 84 (18.9%) | 125 (12.0%) |
| $75,000 to $99,999 | 109 (24.5%) | 122 (11.7%) |
| $100,000 to $149,999 | 74 (16.7%) | 112 (10.8%) |
| $150,000 or more | 68 (15.3%) | 272 (26.2%) |
| Total | 444 (100.0%) | 1,039 (100.0%) |
Property Value to Household Income Ratio in Fishhook
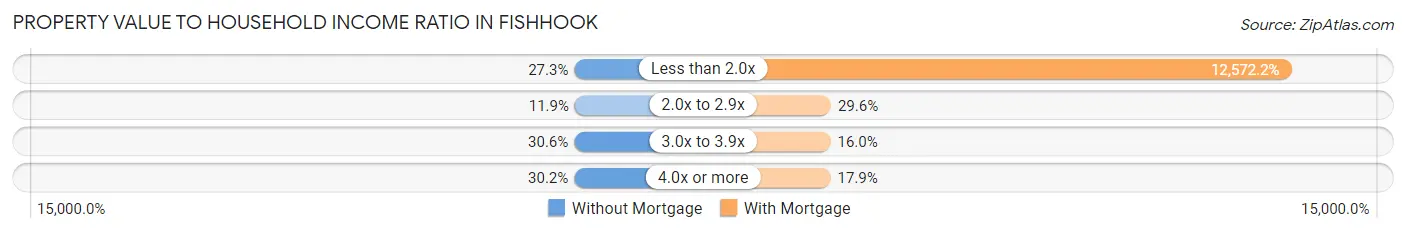
| Value-to-Income Ratio | Without Mortgage | With Mortgage |
| Less than 2.0x | 121 (27.3%) | 130,625 (12,572.2%) |
| 2.0x to 2.9x | 53 (11.9%) | 308 (29.6%) |
| 3.0x to 3.9x | 136 (30.6%) | 166 (16.0%) |
| 4.0x or more | 134 (30.2%) | 186 (17.9%) |
| Total | 444 (100.0%) | 1,039 (100.0%) |
Real Estate Taxes by Mortgage Status in Fishhook
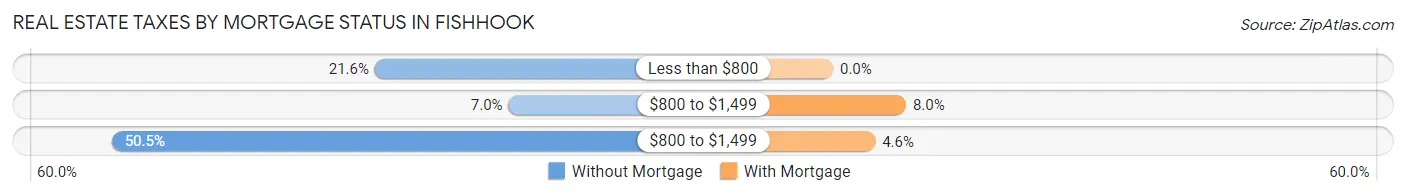
| Property Taxes | Without Mortgage | With Mortgage |
| Less than $800 | 96 (21.6%) | 0 (0.0%) |
| $800 to $1,499 | 31 (7.0%) | 83 (8.0%) |
| $800 to $1,499 | 224 (50.4%) | 48 (4.6%) |
| Total | 444 (100.0%) | 1,039 (100.0%) |
Health & Disability in Fishhook
Health Insurance Coverage by Age in Fishhook
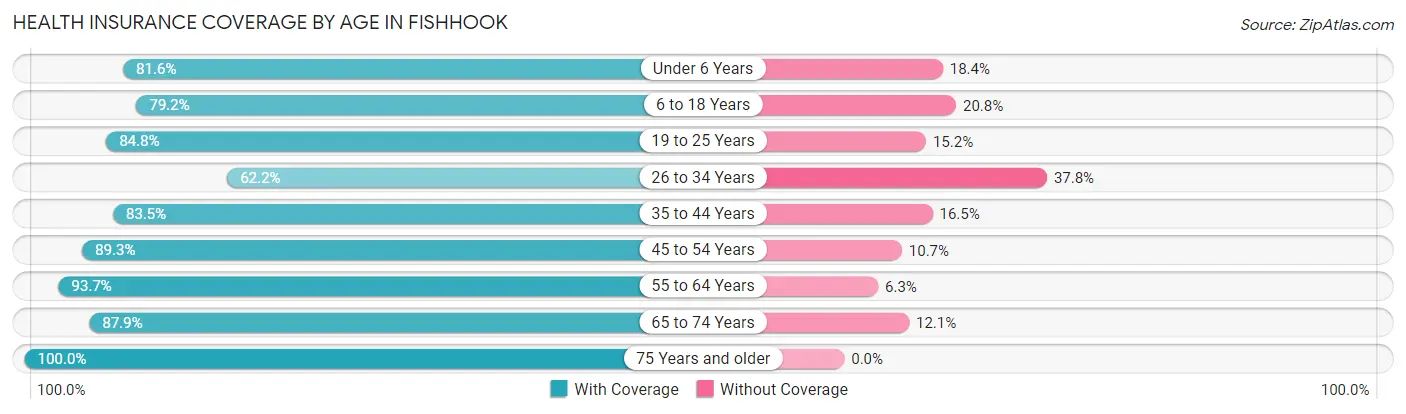
| Age Bracket | With Coverage | Without Coverage |
| Under 6 Years | 320 (81.6%) | 72 (18.4%) |
| 6 to 18 Years | 946 (79.2%) | 249 (20.8%) |
| 19 to 25 Years | 217 (84.8%) | 39 (15.2%) |
| 26 to 34 Years | 242 (62.2%) | 147 (37.8%) |
| 35 to 44 Years | 726 (83.5%) | 143 (16.5%) |
| 45 to 54 Years | 416 (89.3%) | 50 (10.7%) |
| 55 to 64 Years | 638 (93.7%) | 43 (6.3%) |
| 65 to 74 Years | 532 (87.9%) | 73 (12.1%) |
| 75 Years and older | 165 (100.0%) | 0 (0.0%) |
| Total | 4,202 (83.7%) | 816 (16.3%) |
Health Insurance Coverage by Citizenship Status in Fishhook
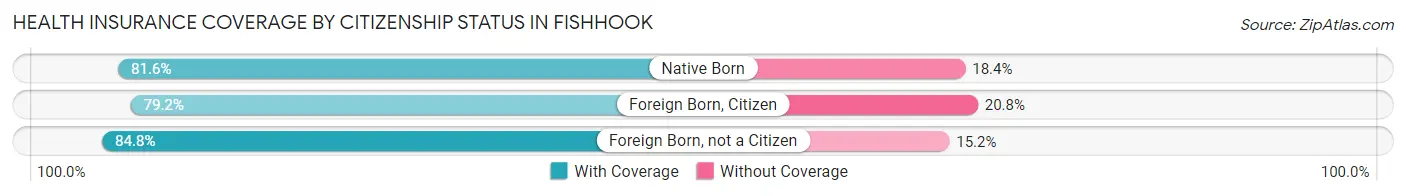
| Citizenship Status | With Coverage | Without Coverage |
| Native Born | 320 (81.6%) | 72 (18.4%) |
| Foreign Born, Citizen | 946 (79.2%) | 249 (20.8%) |
| Foreign Born, not a Citizen | 217 (84.8%) | 39 (15.2%) |
Health Insurance Coverage by Household Income in Fishhook
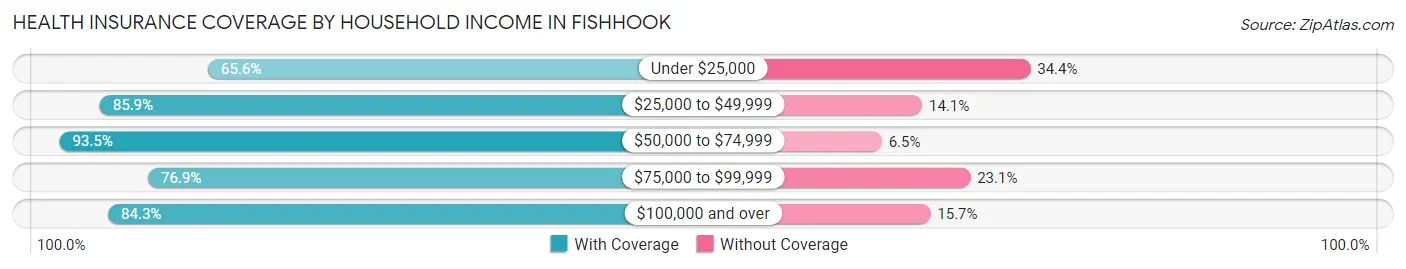
| Household Income | With Coverage | Without Coverage |
| Under $25,000 | 105 (65.6%) | 55 (34.4%) |
| $25,000 to $49,999 | 420 (85.9%) | 69 (14.1%) |
| $50,000 to $74,999 | 429 (93.5%) | 30 (6.5%) |
| $75,000 to $99,999 | 545 (76.9%) | 164 (23.1%) |
| $100,000 and over | 2,683 (84.3%) | 498 (15.7%) |
Public vs Private Health Insurance Coverage by Age in Fishhook
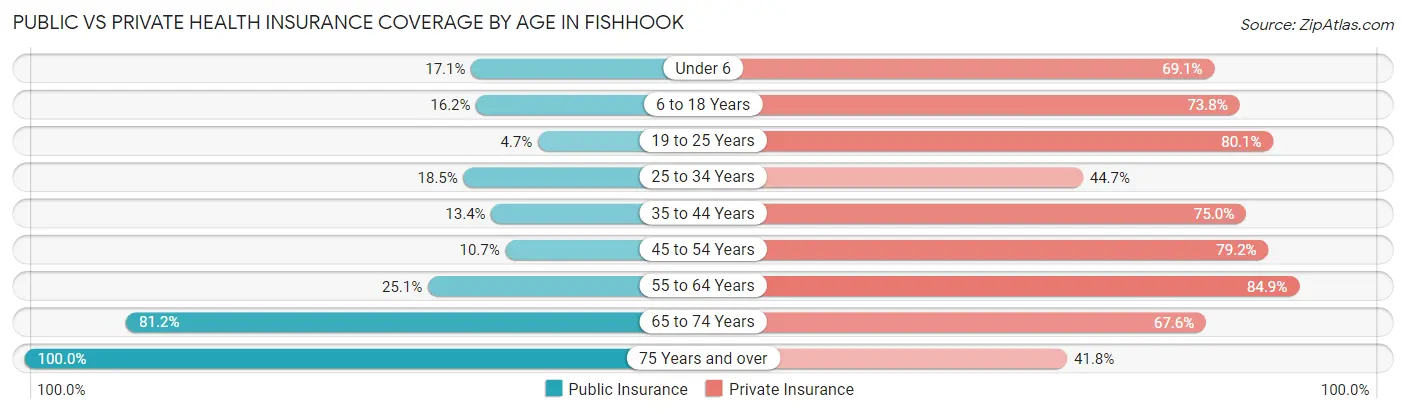
| Age Bracket | Public Insurance | Private Insurance |
| Under 6 | 67 (17.1%) | 271 (69.1%) |
| 6 to 18 Years | 193 (16.2%) | 882 (73.8%) |
| 19 to 25 Years | 12 (4.7%) | 205 (80.1%) |
| 25 to 34 Years | 72 (18.5%) | 174 (44.7%) |
| 35 to 44 Years | 116 (13.4%) | 652 (75.0%) |
| 45 to 54 Years | 50 (10.7%) | 369 (79.2%) |
| 55 to 64 Years | 171 (25.1%) | 578 (84.9%) |
| 65 to 74 Years | 491 (81.2%) | 409 (67.6%) |
| 75 Years and over | 165 (100.0%) | 69 (41.8%) |
| Total | 1,337 (26.6%) | 3,609 (71.9%) |
Disability Status by Sex by Age in Fishhook
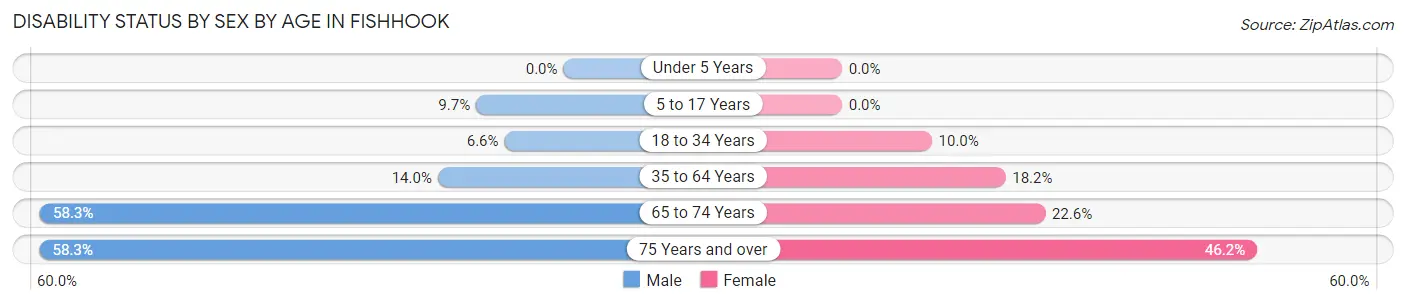
| Age Bracket | Male | Female |
| Under 5 Years | 0 (0.0%) | 0 (0.0%) |
| 5 to 17 Years | 66 (9.7%) | 0 (0.0%) |
| 18 to 34 Years | 27 (6.6%) | 34 (10.0%) |
| 35 to 64 Years | 143 (14.0%) | 181 (18.2%) |
| 65 to 74 Years | 162 (58.3%) | 74 (22.6%) |
| 75 Years and over | 42 (58.3%) | 43 (46.2%) |
Disability Class by Sex by Age in Fishhook
Disability Class: Hearing Difficulty
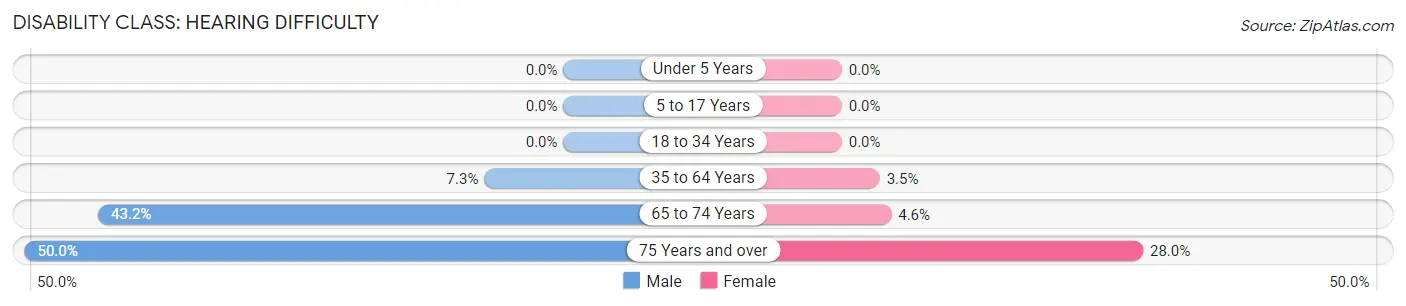
| Age Bracket | Male | Female |
| Under 5 Years | 0 (0.0%) | 0 (0.0%) |
| 5 to 17 Years | 0 (0.0%) | 0 (0.0%) |
| 18 to 34 Years | 0 (0.0%) | 0 (0.0%) |
| 35 to 64 Years | 75 (7.3%) | 35 (3.5%) |
| 65 to 74 Years | 120 (43.2%) | 15 (4.6%) |
| 75 Years and over | 36 (50.0%) | 26 (28.0%) |
Disability Class: Vision Difficulty
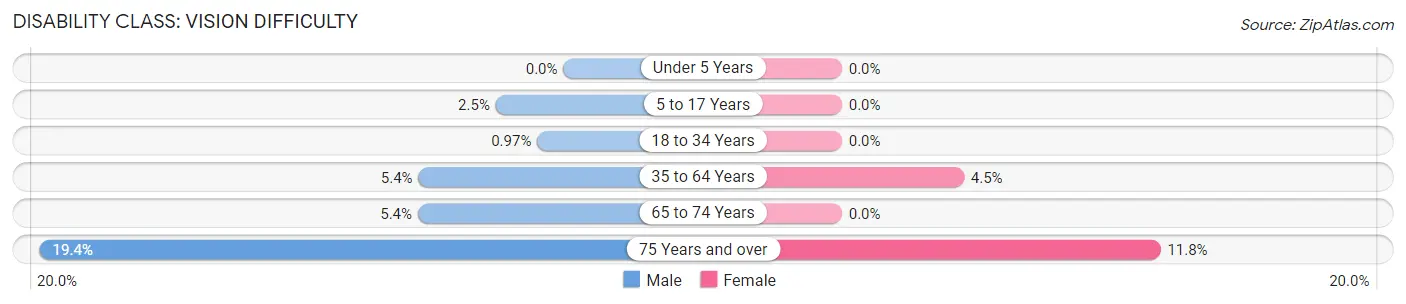
| Age Bracket | Male | Female |
| Under 5 Years | 0 (0.0%) | 0 (0.0%) |
| 5 to 17 Years | 17 (2.5%) | 0 (0.0%) |
| 18 to 34 Years | 4 (1.0%) | 0 (0.0%) |
| 35 to 64 Years | 55 (5.4%) | 45 (4.5%) |
| 65 to 74 Years | 15 (5.4%) | 0 (0.0%) |
| 75 Years and over | 14 (19.4%) | 11 (11.8%) |
Disability Class: Cognitive Difficulty
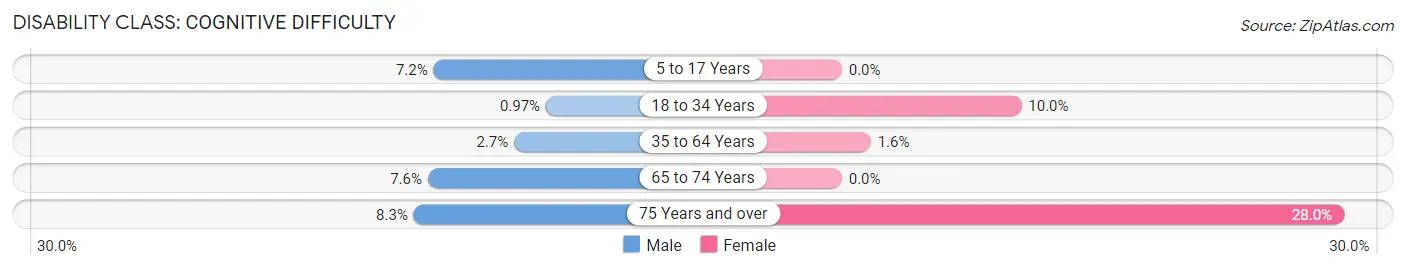
| Age Bracket | Male | Female |
| 5 to 17 Years | 49 (7.2%) | 0 (0.0%) |
| 18 to 34 Years | 4 (1.0%) | 34 (10.0%) |
| 35 to 64 Years | 28 (2.7%) | 16 (1.6%) |
| 65 to 74 Years | 21 (7.5%) | 0 (0.0%) |
| 75 Years and over | 6 (8.3%) | 26 (28.0%) |
Disability Class: Ambulatory Difficulty
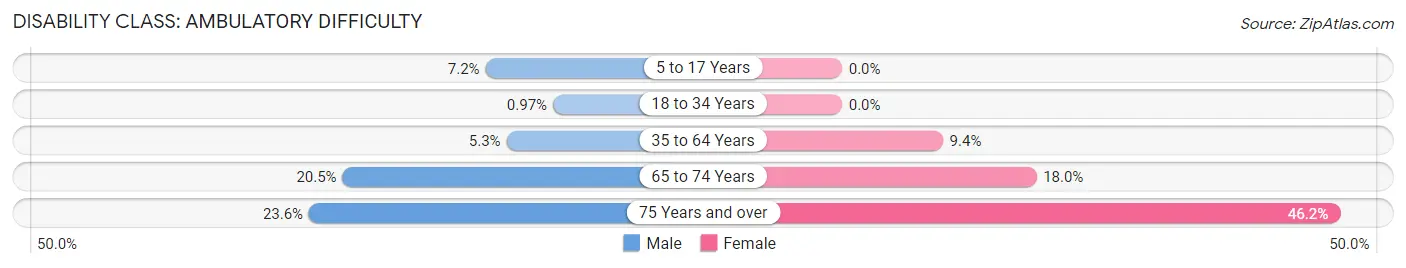
| Age Bracket | Male | Female |
| 5 to 17 Years | 49 (7.2%) | 0 (0.0%) |
| 18 to 34 Years | 4 (1.0%) | 0 (0.0%) |
| 35 to 64 Years | 54 (5.3%) | 93 (9.4%) |
| 65 to 74 Years | 57 (20.5%) | 59 (18.0%) |
| 75 Years and over | 17 (23.6%) | 43 (46.2%) |
Disability Class: Self-Care Difficulty
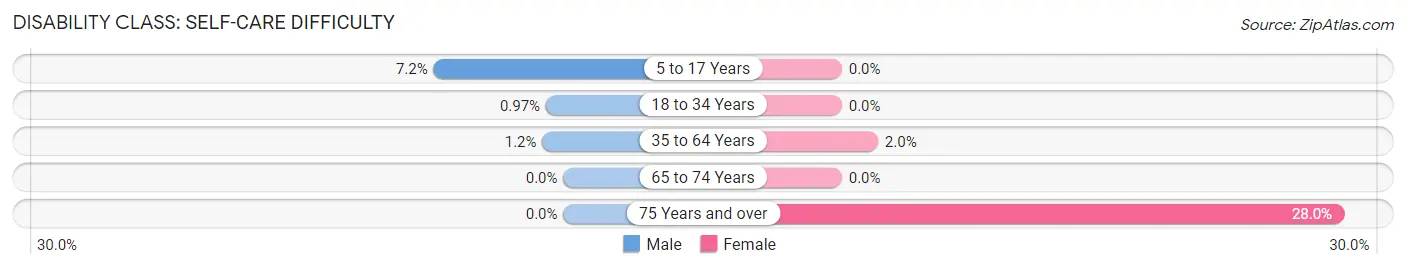
| Age Bracket | Male | Female |
| 5 to 17 Years | 49 (7.2%) | 0 (0.0%) |
| 18 to 34 Years | 4 (1.0%) | 0 (0.0%) |
| 35 to 64 Years | 12 (1.2%) | 20 (2.0%) |
| 65 to 74 Years | 0 (0.0%) | 0 (0.0%) |
| 75 Years and over | 0 (0.0%) | 26 (28.0%) |
Technology Access in Fishhook
Computing Device Access in Fishhook
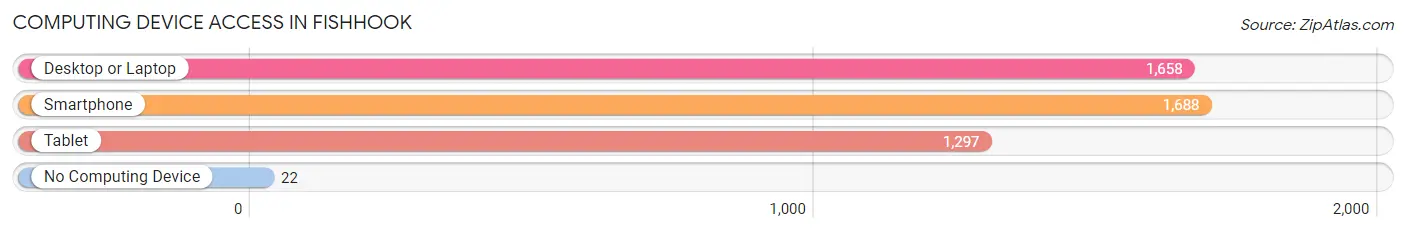
| Device Type | # Households | % Households |
| Desktop or Laptop | 1,658 | 93.8% |
| Smartphone | 1,688 | 95.5% |
| Tablet | 1,297 | 73.4% |
| No Computing Device | 22 | 1.3% |
| Total | 1,767 | 100.0% |
Internet Access in Fishhook
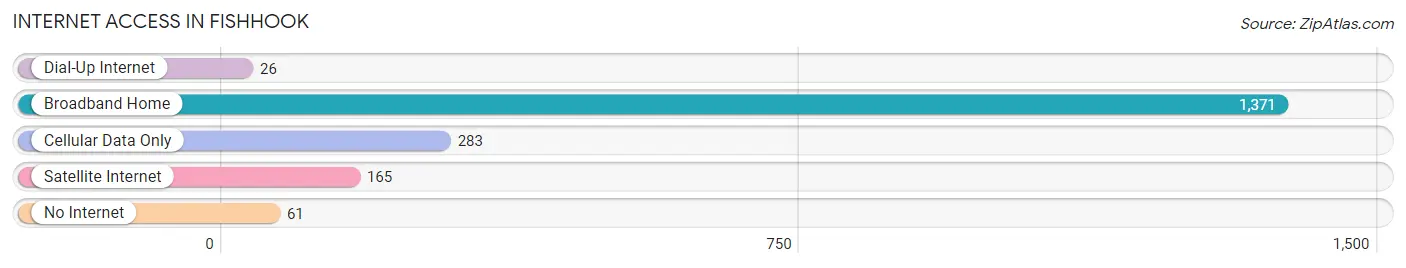
| Internet Type | # Households | % Households |
| Dial-Up Internet | 26 | 1.5% |
| Broadband Home | 1,371 | 77.6% |
| Cellular Data Only | 283 | 16.0% |
| Satellite Internet | 165 | 9.3% |
| No Internet | 61 | 3.5% |
| Total | 1,767 | 100.0% |
Fishhook Summary
Hook, Alaska is a small unincorporated community located in the Aleutians East Borough of Alaska. It is located on the eastern side of the Alaska Peninsula, approximately 40 miles southwest of the city of Cold Bay. The community is accessible by air and sea, and is home to a population of approximately 200 people.
History
The area around Fishhook, Alaska has been inhabited by the Aleut people for thousands of years. The first recorded contact with Europeans was in 1741, when the Russian explorer Vitus Bering sailed through the area. In the late 1800s, the area was settled by Russian fur traders, who established a trading post in the area.
In the early 1900s, the area was settled by American fishermen, who established a cannery in the area. The cannery was destroyed in the 1964 Good Friday Earthquake, but the community continued to thrive. In the 1970s, the community was connected to the rest of Alaska by a road, and the population began to grow.
Geography
Fishhook, Alaska is located on the eastern side of the Alaska Peninsula, approximately 40 miles southwest of the city of Cold Bay. The community is situated on a small bay, which is surrounded by mountains and forests. The area is known for its rugged beauty, and is home to a variety of wildlife, including bald eagles, brown bears, and sea otters.
The climate in Fishhook is mild and temperate, with average temperatures ranging from the mid-30s in the winter to the mid-60s in the summer. The area receives an average of 40 inches of precipitation per year, with most of it falling in the form of snow.
Economy
The economy of Fishhook, Alaska is largely based on fishing and tourism. The area is home to a number of commercial fishing operations, which harvest a variety of species, including salmon, halibut, and cod. The area is also popular with tourists, who come to enjoy the area’s natural beauty and wildlife.
In addition to fishing and tourism, the area is home to a number of small businesses, including a grocery store, a hardware store, and a post office. The community is also home to a number of small-scale manufacturing operations, which produce a variety of products, including furniture, clothing, and jewelry.
Demographics
As of the 2010 census, the population of Fishhook, Alaska was approximately 200 people. The population is largely composed of Native Americans, with the majority of the population being of Aleut descent. The median age of the population is 37 years, and the median household income is $45,000.
The majority of the population is employed in the fishing and tourism industries, although there are a number of small businesses in the area. The area is served by a single school, which serves students in grades K-12. The community is also home to a number of churches, which serve the spiritual needs of the community.
Common Questions
What is Per Capita Income in Fishhook?
Per Capita income in Fishhook is $40,342.
What is the Median Family Income in Fishhook?
Median Family Income in Fishhook is $115,504.
What is the Median Household income in Fishhook?
Median Household Income in Fishhook is $98,523.
What is Income or Wage Gap in Fishhook?
Income or Wage Gap in Fishhook is 41.1%.
Women in Fishhook earn 58.9 cents for every dollar earned by a man.
What is Inequality or Gini Index in Fishhook?
Inequality or Gini Index in Fishhook is 0.38.
What is the Total Population of Fishhook?
Total Population of Fishhook is 5,115.
What is the Total Male Population of Fishhook?
Total Male Population of Fishhook is 2,775.
What is the Total Female Population of Fishhook?
Total Female Population of Fishhook is 2,340.
What is the Ratio of Males per 100 Females in Fishhook?
There are 118.59 Males per 100 Females in Fishhook.
What is the Ratio of Females per 100 Males in Fishhook?
There are 84.32 Females per 100 Males in Fishhook.
What is the Median Population Age in Fishhook?
Median Population Age in Fishhook is 39.0 Years.
What is the Average Family Size in Fishhook
Average Family Size in Fishhook is 3.3 People.
What is the Average Household Size in Fishhook
Average Household Size in Fishhook is 2.9 People.
How Large is the Labor Force in Fishhook?
There are 2,378 People in the Labor Forcein in Fishhook.
What is the Percentage of People in the Labor Force in Fishhook?
62.6% of People are in the Labor Force in Fishhook.
What is the Unemployment Rate in Fishhook?
Unemployment Rate in Fishhook is 6.8%.