Nelson Lagoon, AK Map & Demographics
Nelson Lagoon Map
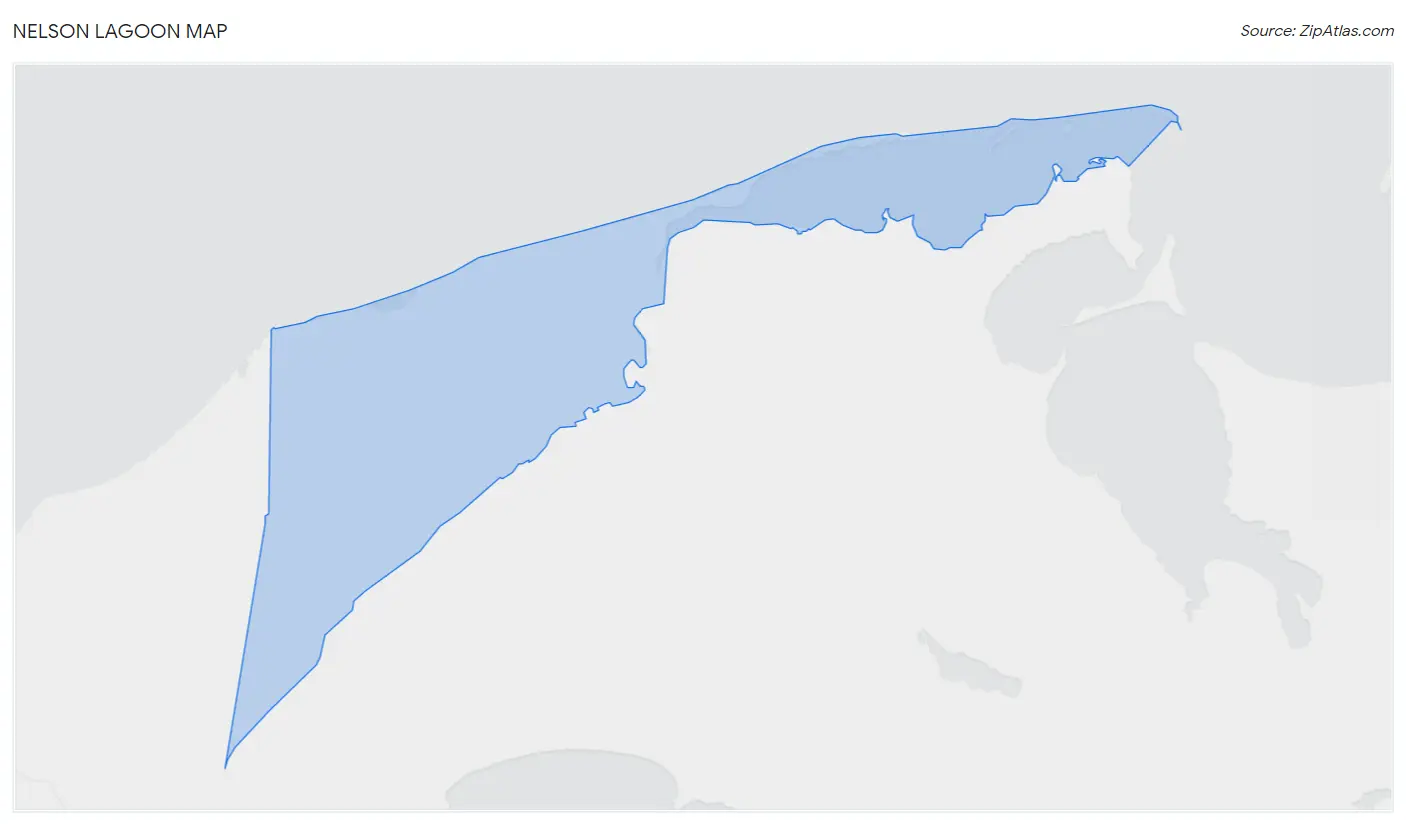
Nelson Lagoon Overview
$29,718
PER CAPITA INCOME
$52,500
AVG FAMILY INCOME
$58,750
AVG HOUSEHOLD INCOME
0.31
INEQUALITY / GINI INDEX
94
TOTAL POPULATION
58
MALE POPULATION
36
FEMALE POPULATION
161.11
MALES / 100 FEMALES
62.07
FEMALES / 100 MALES
50.4
MEDIAN AGE
3.0
AVG FAMILY SIZE
2.8
AVG HOUSEHOLD SIZE
52
LABOR FORCE [ PEOPLE ]
55.3%
PERCENT IN LABOR FORCE
Nelson Lagoon Area Codes
Income in Nelson Lagoon
Income Overview in Nelson Lagoon
Per Capita Income in Nelson Lagoon is $29,718, while median incomes of families and households are $52,500 and $58,750 respectively.
| Characteristic | Number | Measure |
| Per Capita Income | 94 | $29,718 |
| Median Family Income | 26 | $52,500 |
| Mean Family Income | 26 | $59,731 |
| Median Household Income | 34 | $58,750 |
| Mean Household Income | 34 | $68,332 |
| Income Deficit | 26 | $0 |
| Wage / Income Gap (%) | 94 | 0.00% |
| Wage / Income Gap ($) | 94 | 100.00¢ per $1 |
| Gini / Inequality Index | 94 | 0.31 |
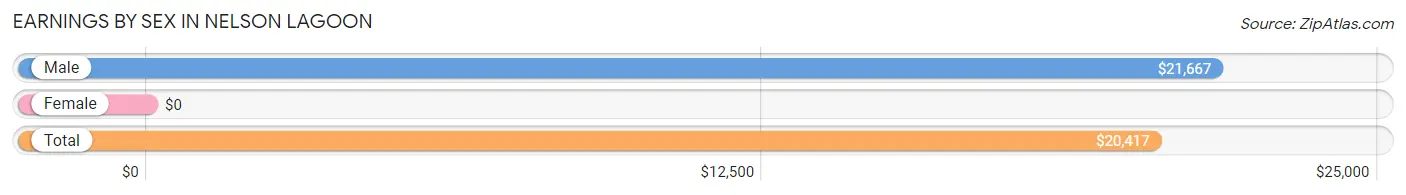
Earnings by Sex in Nelson Lagoon
| Sex | Number | Average Earnings |
| Male | 52 (65.8%) | $21,667 |
| Female | 27 (34.2%) | $0 |
| Total | 79 (100.0%) | $20,417 |
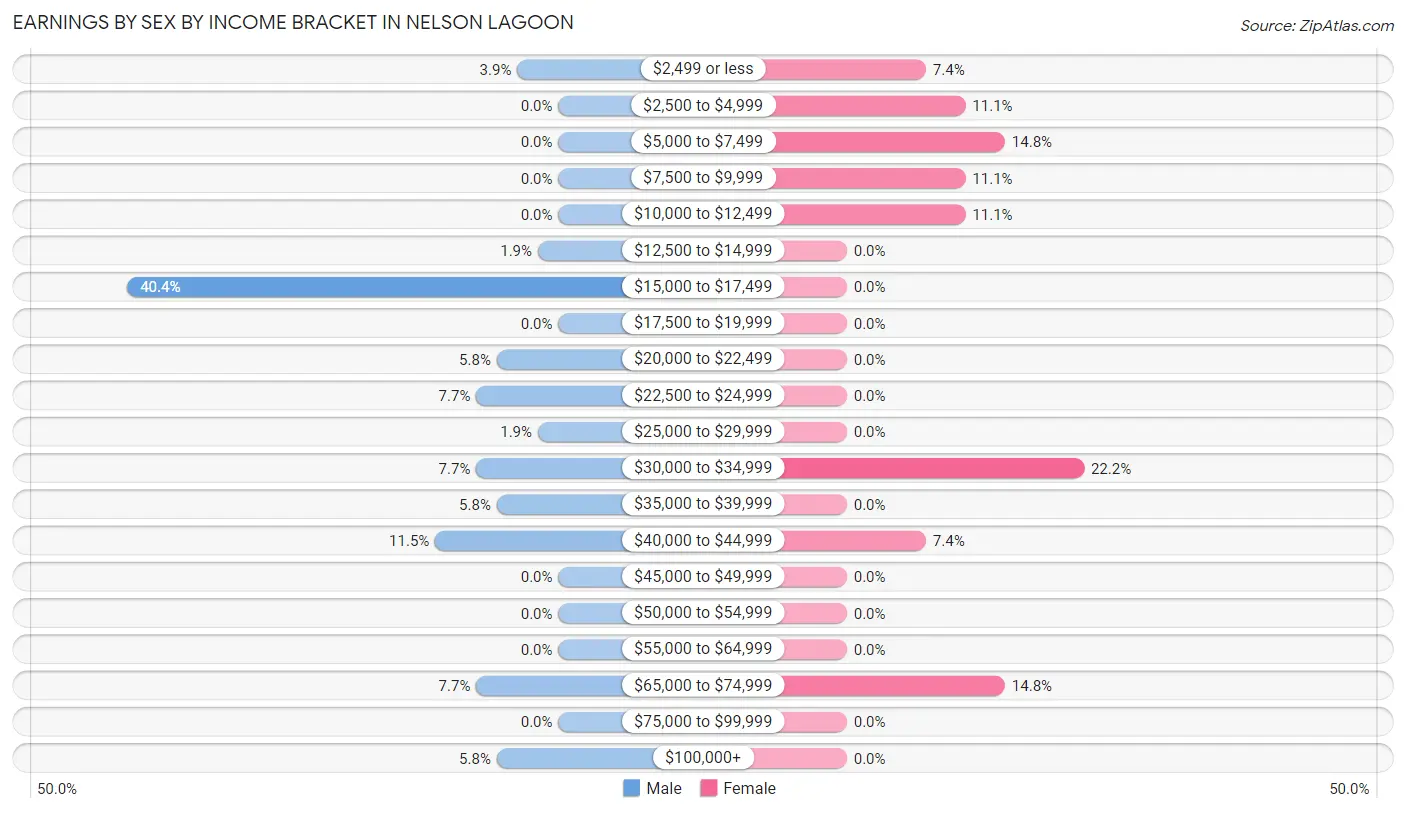
Earnings by Sex by Income Bracket in Nelson Lagoon
The most common earnings brackets in Nelson Lagoon are $15,000 to $17,499 for men (21 | 40.4%) and $30,000 to $34,999 for women (6 | 22.2%).
| Income | Male | Female |
| $2,499 or less | 2 (3.8%) | 2 (7.4%) |
| $2,500 to $4,999 | 0 (0.0%) | 3 (11.1%) |
| $5,000 to $7,499 | 0 (0.0%) | 4 (14.8%) |
| $7,500 to $9,999 | 0 (0.0%) | 3 (11.1%) |
| $10,000 to $12,499 | 0 (0.0%) | 3 (11.1%) |
| $12,500 to $14,999 | 1 (1.9%) | 0 (0.0%) |
| $15,000 to $17,499 | 21 (40.4%) | 0 (0.0%) |
| $17,500 to $19,999 | 0 (0.0%) | 0 (0.0%) |
| $20,000 to $22,499 | 3 (5.8%) | 0 (0.0%) |
| $22,500 to $24,999 | 4 (7.7%) | 0 (0.0%) |
| $25,000 to $29,999 | 1 (1.9%) | 0 (0.0%) |
| $30,000 to $34,999 | 4 (7.7%) | 6 (22.2%) |
| $35,000 to $39,999 | 3 (5.8%) | 0 (0.0%) |
| $40,000 to $44,999 | 6 (11.5%) | 2 (7.4%) |
| $45,000 to $49,999 | 0 (0.0%) | 0 (0.0%) |
| $50,000 to $54,999 | 0 (0.0%) | 0 (0.0%) |
| $55,000 to $64,999 | 0 (0.0%) | 0 (0.0%) |
| $65,000 to $74,999 | 4 (7.7%) | 4 (14.8%) |
| $75,000 to $99,999 | 0 (0.0%) | 0 (0.0%) |
| $100,000+ | 3 (5.8%) | 0 (0.0%) |
| Total | 52 (100.0%) | 27 (100.0%) |
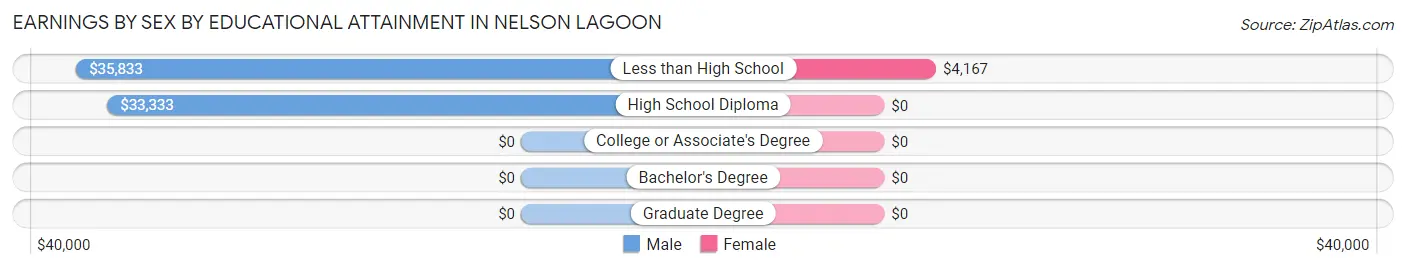
Earnings by Sex by Educational Attainment in Nelson Lagoon
| Educational Attainment | Male Income | Female Income |
| Less than High School | $35,833 | $4,167 |
| High School Diploma | $33,333 | $0 |
| College or Associate's Degree | - | - |
| Bachelor's Degree | - | - |
| Graduate Degree | - | - |
| Total | $34,375 | $0 |
Family Income in Nelson Lagoon
Family Income Brackets in Nelson Lagoon
According to the Nelson Lagoon family income data, there are 10 families falling into the $35,000 to $49,999 income range, which is the most common income bracket and makes up 38.5% of all families.
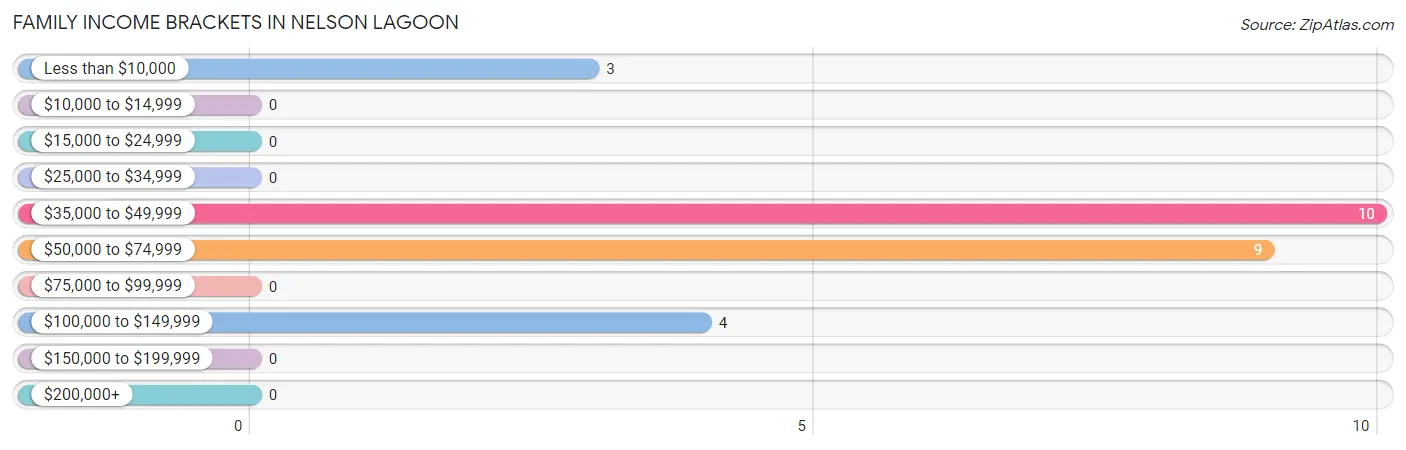
| Income Bracket | # Families | % Families |
| Less than $10,000 | 3 | 11.5% |
| $10,000 to $14,999 | 0 | 0.0% |
| $15,000 to $24,999 | 0 | 0.0% |
| $25,000 to $34,999 | 0 | 0.0% |
| $35,000 to $49,999 | 10 | 38.5% |
| $50,000 to $74,999 | 9 | 34.6% |
| $75,000 to $99,999 | 0 | 0.0% |
| $100,000 to $149,999 | 4 | 15.4% |
| $150,000 to $199,999 | 0 | 0.0% |
| $200,000+ | 0 | 0.0% |
Family Income by Famaliy Size in Nelson Lagoon
2-person families (23 | 88.5%) account for the highest median family income in Nelson Lagoon with $49,063 per family, while 2-person families (23 | 88.5%) have the highest median income of $24,532 per family member.
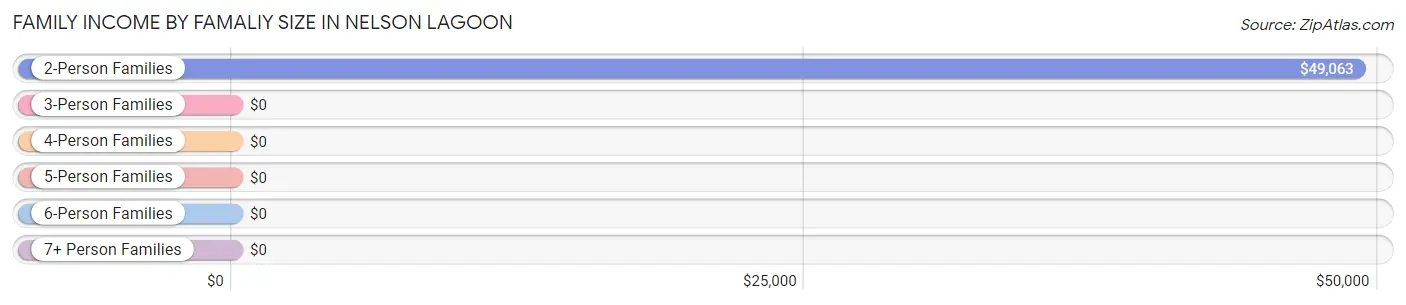
| Income Bracket | # Families | Median Income |
| 2-Person Families | 23 (88.5%) | $49,063 |
| 3-Person Families | 0 (0.0%) | $0 |
| 4-Person Families | 3 (11.5%) | $0 |
| 5-Person Families | 0 (0.0%) | $0 |
| 6-Person Families | 0 (0.0%) | $0 |
| 7+ Person Families | 0 (0.0%) | $0 |
| Total | 26 (100.0%) | $52,500 |
Family Income by Number of Earners in Nelson Lagoon
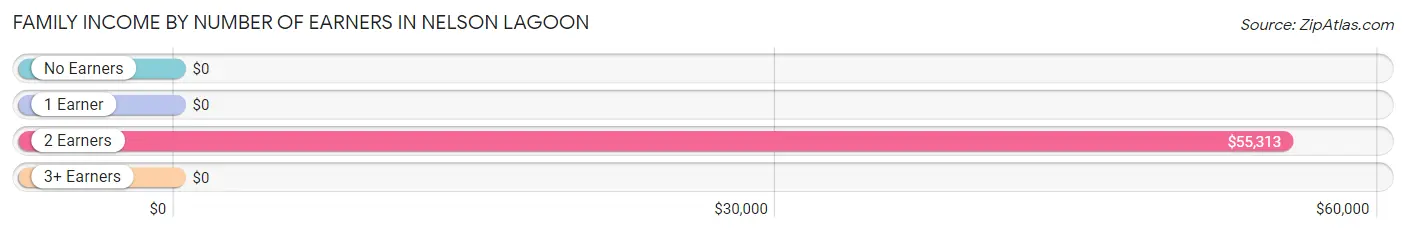
| Number of Earners | # Families | Median Income |
| No Earners | 0 (0.0%) | $0 |
| 1 Earner | 7 (26.9%) | $0 |
| 2 Earners | 19 (73.1%) | $55,313 |
| 3+ Earners | 0 (0.0%) | $0 |
| Total | 26 (100.0%) | $52,500 |
Household Income in Nelson Lagoon
Household Income Brackets in Nelson Lagoon
With 13 households falling in the category, the $35,000 to $49,999 income range is the most frequent in Nelson Lagoon, accounting for 38.2% of all households.
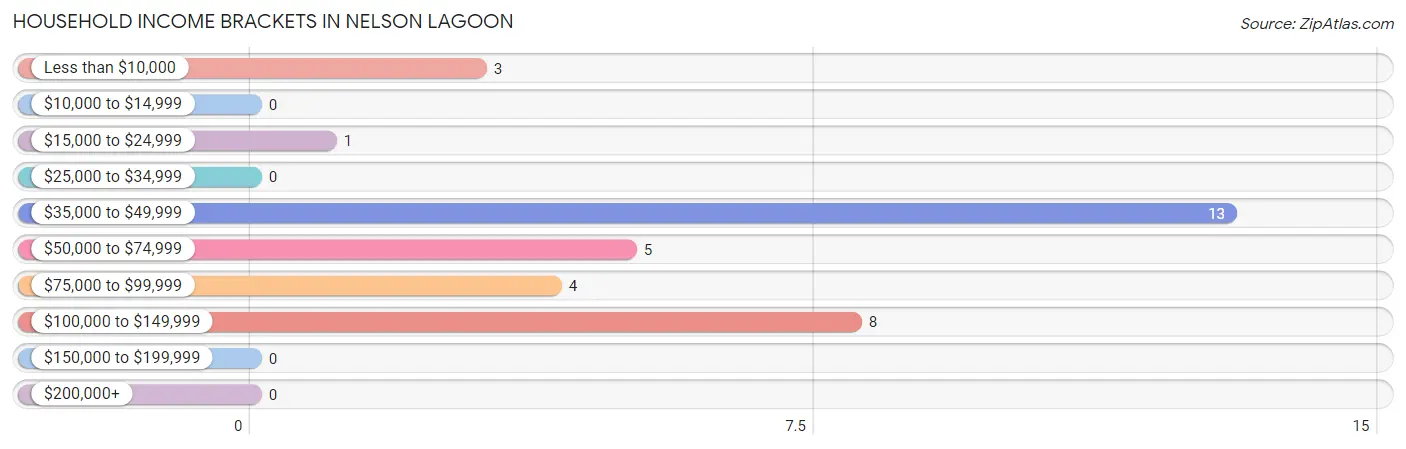
| Income Bracket | # Households | % Households |
| Less than $10,000 | 3 | 8.8% |
| $10,000 to $14,999 | 0 | 0.0% |
| $15,000 to $24,999 | 1 | 2.9% |
| $25,000 to $34,999 | 0 | 0.0% |
| $35,000 to $49,999 | 13 | 38.2% |
| $50,000 to $74,999 | 5 | 14.7% |
| $75,000 to $99,999 | 4 | 11.8% |
| $100,000 to $149,999 | 8 | 23.5% |
| $150,000 to $199,999 | 0 | 0.0% |
| $200,000+ | 0 | 0.0% |
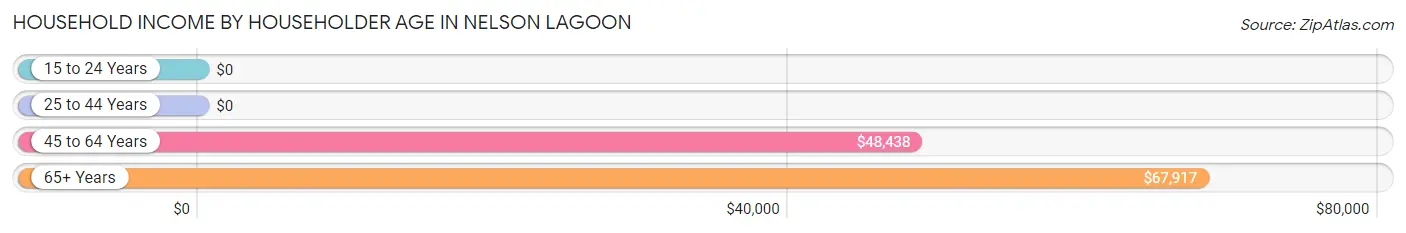
Household Income by Householder Age in Nelson Lagoon
The median household income in Nelson Lagoon is $58,750, with the highest median household income of $67,917 found in the 65+ years age bracket for the primary householder. A total of 13 households (38.2%) fall into this category. Meanwhile, the 15 to 24 years age bracket for the primary householder has the lowest median household income of $0, with 2 households (5.9%) in this group.
| Income Bracket | # Households | Median Income |
| 15 to 24 Years | 2 (5.9%) | $0 |
| 25 to 44 Years | 2 (5.9%) | $0 |
| 45 to 64 Years | 17 (50.0%) | $48,438 |
| 65+ Years | 13 (38.2%) | $67,917 |
| Total | 34 (100.0%) | $58,750 |
Poverty in Nelson Lagoon
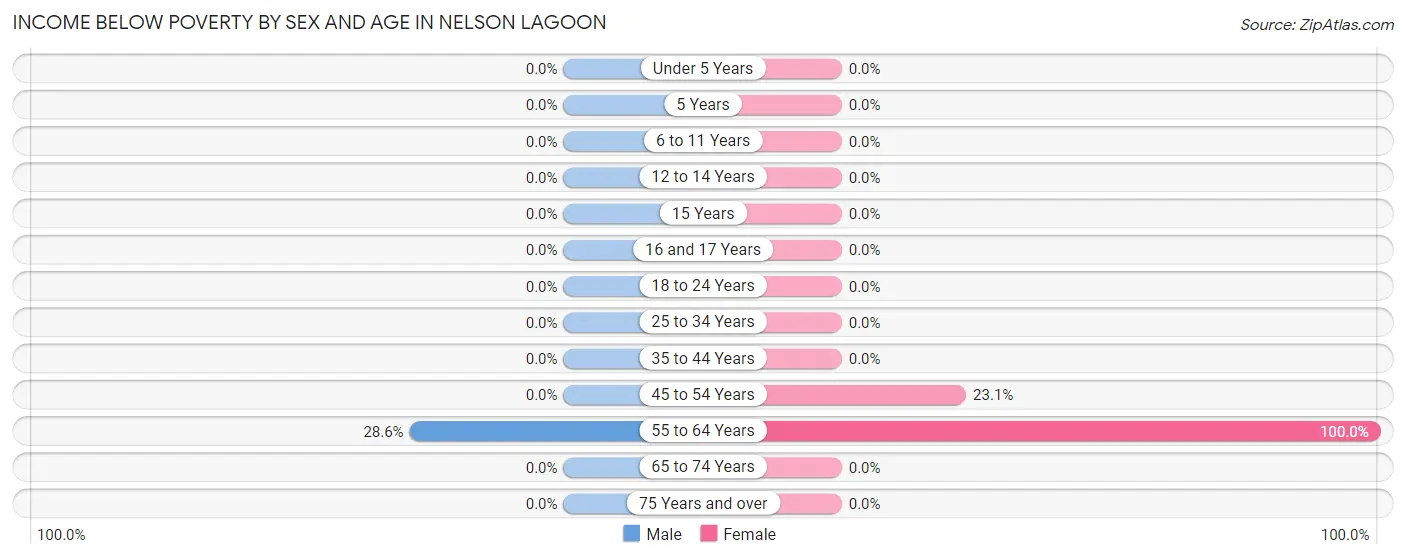
Income Below Poverty by Sex and Age in Nelson Lagoon
With 3.5% poverty level for males and 22.2% for females among the residents of Nelson Lagoon, 55 to 64 year old males and 55 to 64 year old females are the most vulnerable to poverty, with 2 males (28.6%) and 5 females (100.0%) in their respective age groups living below the poverty level.
| Age Bracket | Male | Female |
| Under 5 Years | 0 (0.0%) | 0 (0.0%) |
| 5 Years | 0 (0.0%) | 0 (0.0%) |
| 6 to 11 Years | 0 (0.0%) | 0 (0.0%) |
| 12 to 14 Years | 0 (0.0%) | 0 (0.0%) |
| 15 Years | 0 (0.0%) | 0 (0.0%) |
| 16 and 17 Years | 0 (0.0%) | 0 (0.0%) |
| 18 to 24 Years | 0 (0.0%) | 0 (0.0%) |
| 25 to 34 Years | 0 (0.0%) | 0 (0.0%) |
| 35 to 44 Years | 0 (0.0%) | 0 (0.0%) |
| 45 to 54 Years | 0 (0.0%) | 3 (23.1%) |
| 55 to 64 Years | 2 (28.6%) | 5 (100.0%) |
| 65 to 74 Years | 0 (0.0%) | 0 (0.0%) |
| 75 Years and over | 0 (0.0%) | 0 (0.0%) |
| Total | 2 (3.5%) | 8 (22.2%) |
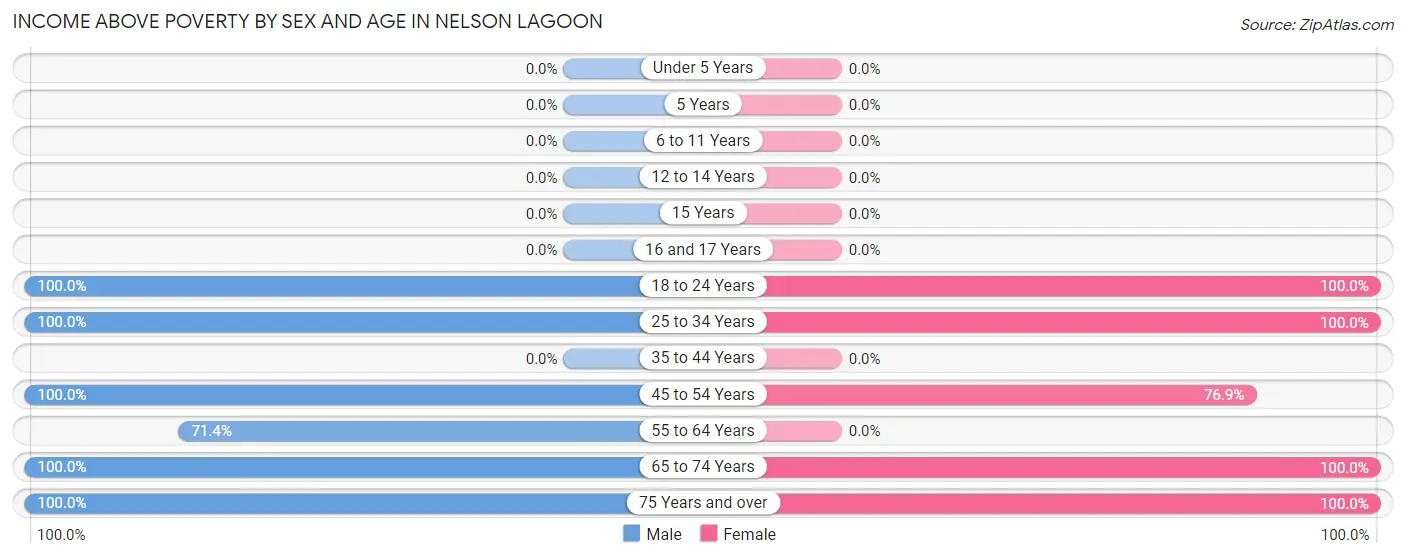
Income Above Poverty by Sex and Age in Nelson Lagoon
According to the poverty statistics in Nelson Lagoon, males aged 18 to 24 years and females aged 18 to 24 years are the age groups that are most secure financially, with 100.0% of males and 100.0% of females in these age groups living above the poverty line.
| Age Bracket | Male | Female |
| Under 5 Years | 0 (0.0%) | 0 (0.0%) |
| 5 Years | 0 (0.0%) | 0 (0.0%) |
| 6 to 11 Years | 0 (0.0%) | 0 (0.0%) |
| 12 to 14 Years | 0 (0.0%) | 0 (0.0%) |
| 15 Years | 0 (0.0%) | 0 (0.0%) |
| 16 and 17 Years | 0 (0.0%) | 0 (0.0%) |
| 18 to 24 Years | 18 (100.0%) | 6 (100.0%) |
| 25 to 34 Years | 5 (100.0%) | 2 (100.0%) |
| 35 to 44 Years | 0 (0.0%) | 0 (0.0%) |
| 45 to 54 Years | 16 (100.0%) | 10 (76.9%) |
| 55 to 64 Years | 5 (71.4%) | 0 (0.0%) |
| 65 to 74 Years | 9 (100.0%) | 6 (100.0%) |
| 75 Years and over | 3 (100.0%) | 4 (100.0%) |
| Total | 56 (96.6%) | 28 (77.8%) |
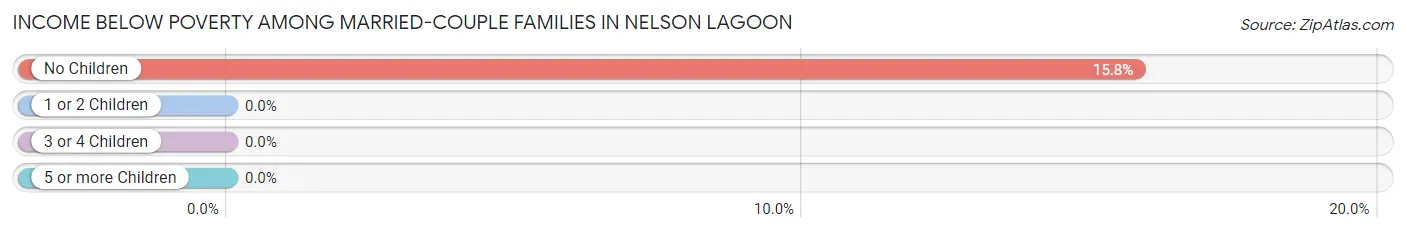
Income Below Poverty Among Married-Couple Families in Nelson Lagoon
The poverty statistics for married-couple families in Nelson Lagoon show that 15.8% or 3 of the total 19 families live below the poverty line. Families with no children have the highest poverty rate of 15.8%, comprising of 3 families. On the other hand, families with no children have the lowest poverty rate of 15.8%, which includes 3 families.
| Children | Above Poverty | Below Poverty |
| No Children | 16 (84.2%) | 3 (15.8%) |
| 1 or 2 Children | 0 (0.0%) | 0 (0.0%) |
| 3 or 4 Children | 0 (0.0%) | 0 (0.0%) |
| 5 or more Children | 0 (0.0%) | 0 (0.0%) |
| Total | 16 (84.2%) | 3 (15.8%) |
Income Below Poverty Among Single-Parent Households in Nelson Lagoon
| Children | Single Father | Single Mother |
| No Children | 0 (0.0%) | 0 (0.0%) |
| 1 or 2 Children | 0 (0.0%) | 0 (0.0%) |
| 3 or 4 Children | 0 (0.0%) | 0 (0.0%) |
| 5 or more Children | 0 (0.0%) | 0 (0.0%) |
| Total | 0 (0.0%) | 0 (0.0%) |
Income Below Poverty Among Married-Couple vs Single-Parent Households in Nelson Lagoon
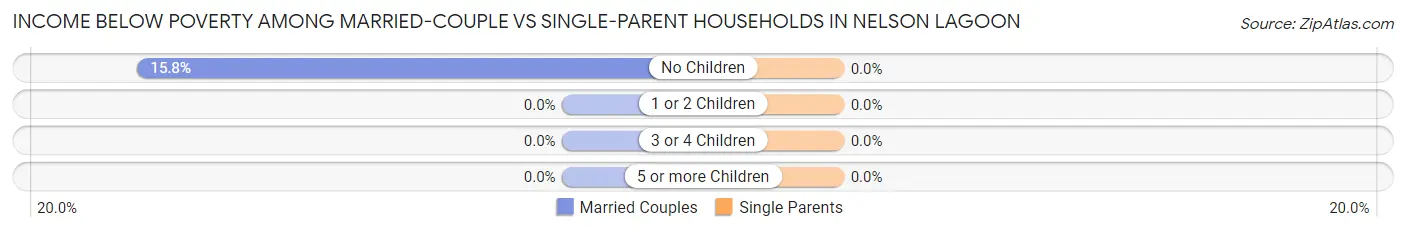
| Children | Married-Couple Families | Single-Parent Households |
| No Children | 3 (15.8%) | 0 (0.0%) |
| 1 or 2 Children | 0 (0.0%) | 0 (0.0%) |
| 3 or 4 Children | 0 (0.0%) | 0 (0.0%) |
| 5 or more Children | 0 (0.0%) | 0 (0.0%) |
| Total | 3 (15.8%) | 0 (0.0%) |
Race in Nelson Lagoon
The most populous races in Nelson Lagoon are Native / Alaskan (77 | 81.9%), and White / Caucasian (17 | 18.1%).
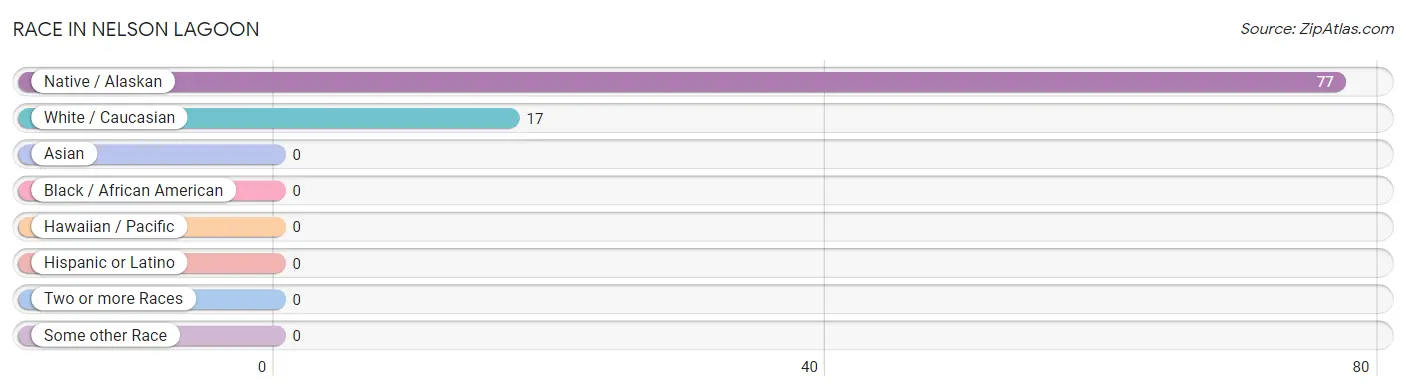
| Race | # Population | % Population |
| Asian | 0 | 0.0% |
| Black / African American | 0 | 0.0% |
| Hawaiian / Pacific | 0 | 0.0% |
| Hispanic or Latino | 0 | 0.0% |
| Native / Alaskan | 77 | 81.9% |
| White / Caucasian | 17 | 18.1% |
| Two or more Races | 0 | 0.0% |
| Some other Race | 0 | 0.0% |
| Total | 94 | 100.0% |
Ancestry in Nelson Lagoon
The most populous ancestries reported in Nelson Lagoon are Aleut (54 | 57.5%), Russian (39 | 41.5%), Alaska Native (23 | 24.5%), Norwegian (23 | 24.5%), and Irish (6 | 6.4%), together accounting for 154.3% of all Nelson Lagoon residents.
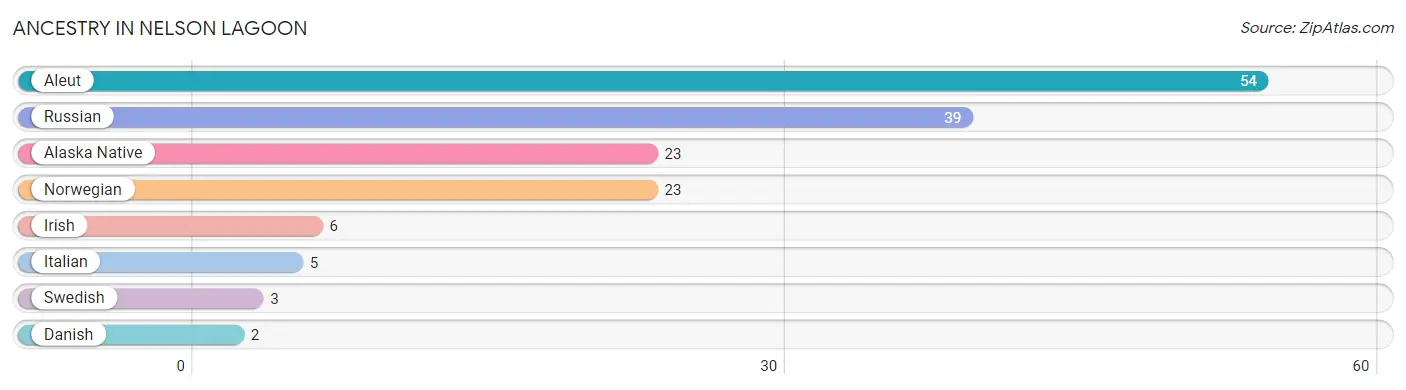
| Ancestry | # Population | % Population |
| Alaska Native | 23 | 24.5% |
| Aleut | 54 | 57.5% |
| Danish | 2 | 2.1% |
| Irish | 6 | 6.4% |
| Italian | 5 | 5.3% |
| Norwegian | 23 | 24.5% |
| Russian | 39 | 41.5% |
| Swedish | 3 | 3.2% | View All 8 Rows |
Immigrants in Nelson Lagoon

| Immigration Origin | # Population | % Population | View All 0 Rows |
Sex and Age in Nelson Lagoon
Sex and Age in Nelson Lagoon
The most populous age groups in Nelson Lagoon are 20 to 24 Years (18 | 31.0%) for men and 45 to 49 Years (8 | 22.2%) for women.
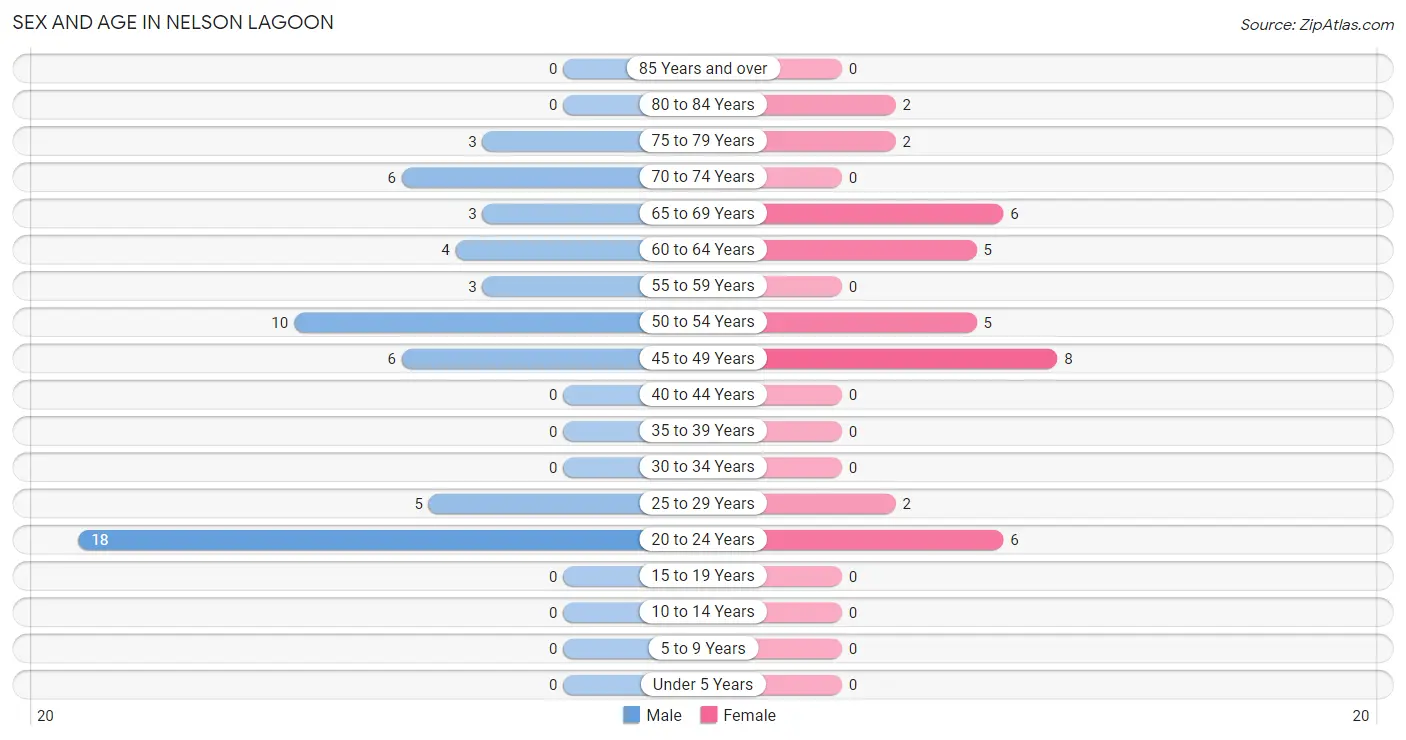
| Age Bracket | Male | Female |
| Under 5 Years | 0 (0.0%) | 0 (0.0%) |
| 5 to 9 Years | 0 (0.0%) | 0 (0.0%) |
| 10 to 14 Years | 0 (0.0%) | 0 (0.0%) |
| 15 to 19 Years | 0 (0.0%) | 0 (0.0%) |
| 20 to 24 Years | 18 (31.0%) | 6 (16.7%) |
| 25 to 29 Years | 5 (8.6%) | 2 (5.6%) |
| 30 to 34 Years | 0 (0.0%) | 0 (0.0%) |
| 35 to 39 Years | 0 (0.0%) | 0 (0.0%) |
| 40 to 44 Years | 0 (0.0%) | 0 (0.0%) |
| 45 to 49 Years | 6 (10.3%) | 8 (22.2%) |
| 50 to 54 Years | 10 (17.2%) | 5 (13.9%) |
| 55 to 59 Years | 3 (5.2%) | 0 (0.0%) |
| 60 to 64 Years | 4 (6.9%) | 5 (13.9%) |
| 65 to 69 Years | 3 (5.2%) | 6 (16.7%) |
| 70 to 74 Years | 6 (10.3%) | 0 (0.0%) |
| 75 to 79 Years | 3 (5.2%) | 2 (5.6%) |
| 80 to 84 Years | 0 (0.0%) | 2 (5.6%) |
| 85 Years and over | 0 (0.0%) | 0 (0.0%) |
| Total | 58 (100.0%) | 36 (100.0%) |
Families and Households in Nelson Lagoon
Median Family Size in Nelson Lagoon
The median family size in Nelson Lagoon is 2.96 persons per family, with single female/mother families (4 | 15.4%) accounting for the largest median family size of 5.5 persons per family. On the other hand, single male/father families (3 | 11.5%) represent the smallest median family size with 2.33 persons per family.
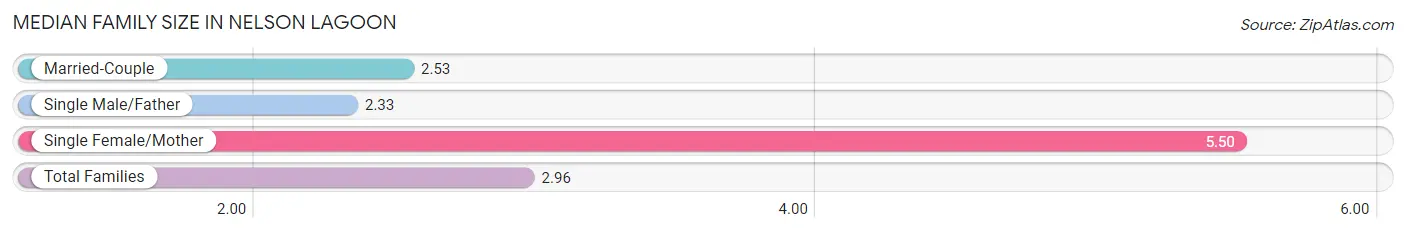
| Family Type | # Families | Family Size |
| Married-Couple | 19 (73.1%) | 2.53 |
| Single Male/Father | 3 (11.5%) | 2.33 |
| Single Female/Mother | 4 (15.4%) | 5.50 |
| Total Families | 26 (100.0%) | 2.96 |
Median Household Size in Nelson Lagoon
The median household size in Nelson Lagoon is 2.76 persons per household, with single female/mother households (4 | 11.8%) accounting for the largest median household size of 5.75 persons per household. non-family households (8 | 23.5%) represent the smallest median household size with 2.00 persons per household.
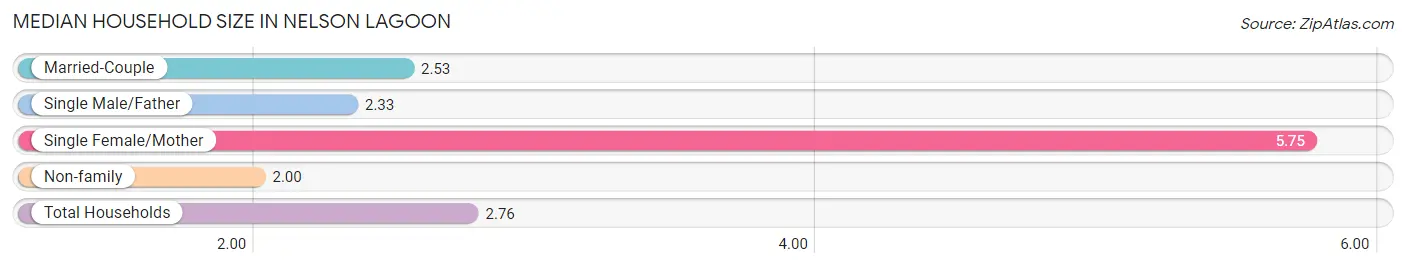
| Household Type | # Households | Household Size |
| Married-Couple | 19 (55.9%) | 2.53 |
| Single Male/Father | 3 (8.8%) | 2.33 |
| Single Female/Mother | 4 (11.8%) | 5.75 |
| Non-family | 8 (23.5%) | 2.00 |
| Total Households | 34 (100.0%) | 2.76 |
Household Size by Marriage Status in Nelson Lagoon
Out of a total of 34 households in Nelson Lagoon, 26 (76.5%) are family households, while 8 (23.5%) are nonfamily households. The most numerous type of family households are 2-person households, comprising 19, and the most common type of nonfamily households are 2-person households, comprising 7.
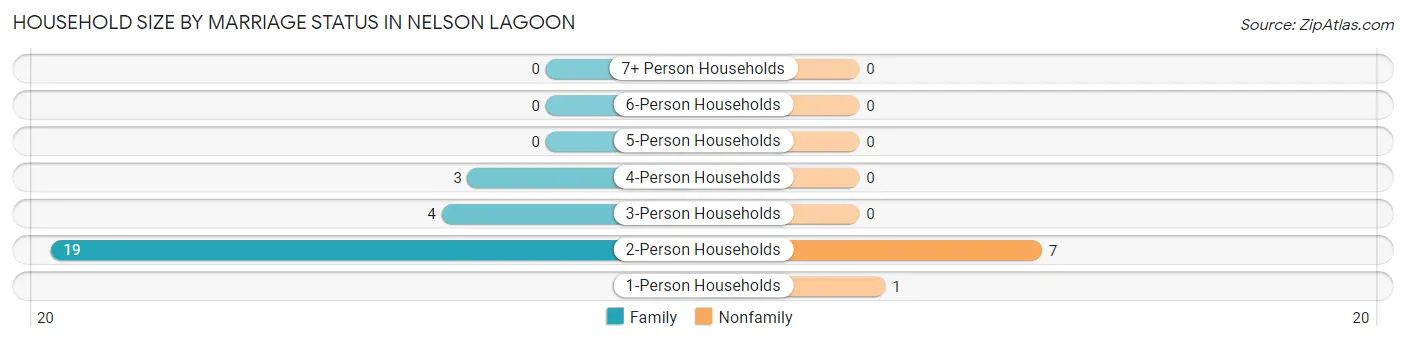
| Household Size | Family Households | Nonfamily Households |
| 1-Person Households | - | 1 (2.9%) |
| 2-Person Households | 19 (55.9%) | 7 (20.6%) |
| 3-Person Households | 4 (11.8%) | 0 (0.0%) |
| 4-Person Households | 3 (8.8%) | 0 (0.0%) |
| 5-Person Households | 0 (0.0%) | 0 (0.0%) |
| 6-Person Households | 0 (0.0%) | 0 (0.0%) |
| 7+ Person Households | 0 (0.0%) | 0 (0.0%) |
| Total | 26 (76.5%) | 8 (23.5%) |
Female Fertility in Nelson Lagoon
Fertility by Age in Nelson Lagoon
| Age Bracket | Women with Births | Births / 1,000 Women |
| 15 to 19 years | 0 (0.0%) | 0.0 |
| 20 to 34 years | 0 (0.0%) | 0.0 |
| 35 to 50 years | 0 (0.0%) | 0.0 |
| Total | 0 (0.0%) | 0.0 |
Fertility by Age by Marriage Status in Nelson Lagoon
| Age Bracket | Married | Unmarried |
| 15 to 19 years | 0 (0.0%) | 0 (0.0%) |
| 20 to 34 years | 0 (0.0%) | 0 (0.0%) |
| 35 to 50 years | 0 (0.0%) | 0 (0.0%) |
| Total | 0 (0.0%) | 0 (0.0%) |
Fertility by Education in Nelson Lagoon
| Educational Attainment | Women with Births | Births / 1,000 Women |
| Less than High School | 0 (0.0%) | 0.0 |
| High School Diploma | 0 (0.0%) | 0.0 |
| College or Associate's Degree | 0 (0.0%) | 0.0 |
| Bachelor's Degree | 0 (0.0%) | 0.0 |
| Graduate Degree | 0 (0.0%) | 0.0 |
| Total | 0 (0.0%) | 0.0 |
Fertility by Education by Marriage Status in Nelson Lagoon
| Educational Attainment | Married | Unmarried |
| Less than High School | 0 (0.0%) | 0 (0.0%) |
| High School Diploma | 0 (0.0%) | 0 (0.0%) |
| College or Associate's Degree | 0 (0.0%) | 0 (0.0%) |
| Bachelor's Degree | 0 (0.0%) | 0 (0.0%) |
| Graduate Degree | 0 (0.0%) | 0 (0.0%) |
| Total | 0 (0.0%) | 0 (0.0%) |
Employment Characteristics in Nelson Lagoon
Employment by Class of Employer in Nelson Lagoon
Among the 52 employed individuals in Nelson Lagoon, federal government employees (18 | 34.6%), local government employees (16 | 30.8%), and private company employees (12 | 23.1%) make up the most common classes of employment.
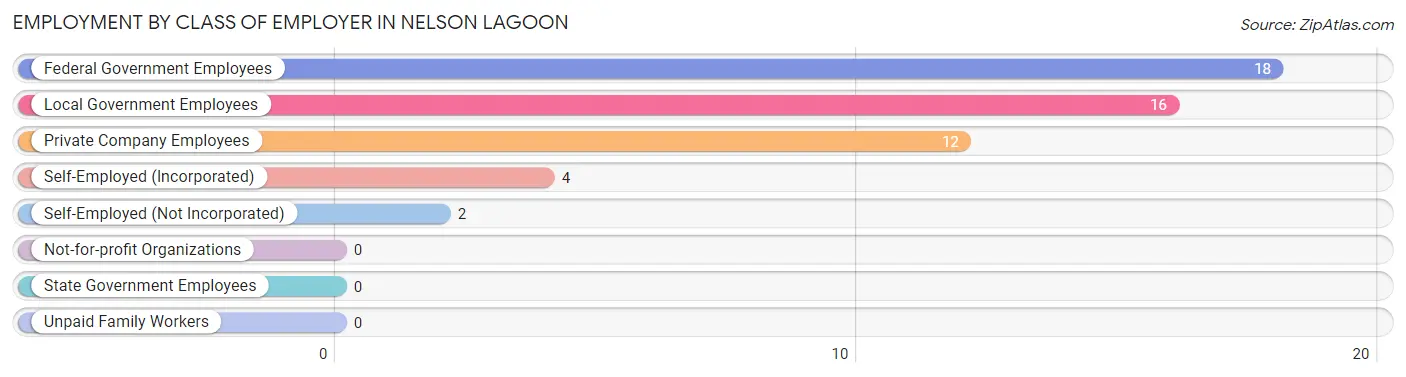
| Employer Class | # Employees | % Employees |
| Private Company Employees | 12 | 23.1% |
| Self-Employed (Incorporated) | 4 | 7.7% |
| Self-Employed (Not Incorporated) | 2 | 3.8% |
| Not-for-profit Organizations | 0 | 0.0% |
| Local Government Employees | 16 | 30.8% |
| State Government Employees | 0 | 0.0% |
| Federal Government Employees | 18 | 34.6% |
| Unpaid Family Workers | 0 | 0.0% |
| Total | 52 | 100.0% |
Employment Status by Age in Nelson Lagoon
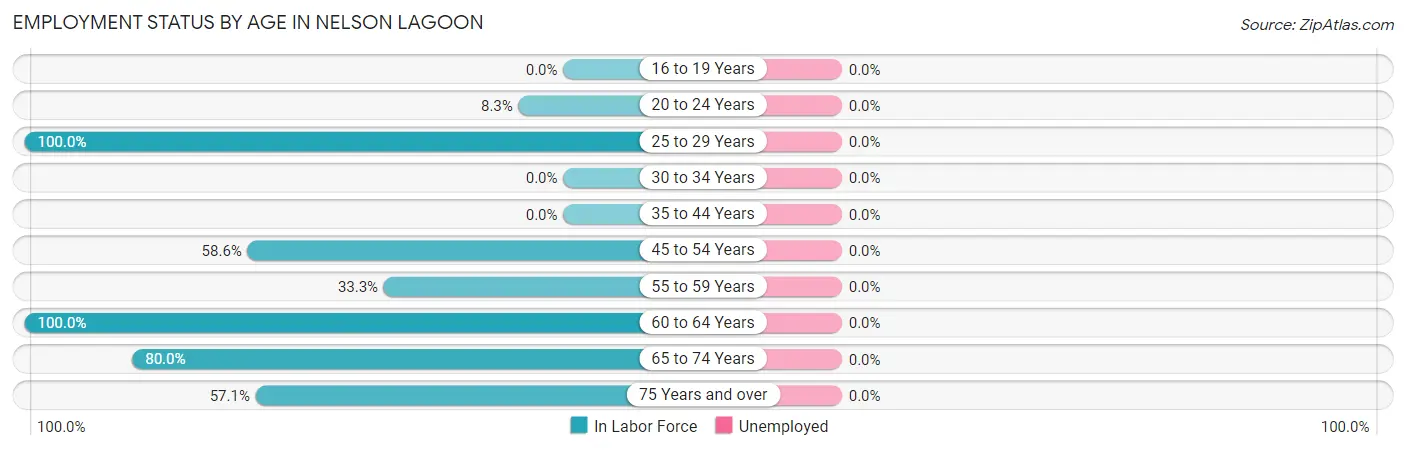
| Age Bracket | In Labor Force | Unemployed |
| 16 to 19 Years | 0 (0.0%) | 0 (0.0%) |
| 20 to 24 Years | 2 (8.3%) | 0 (0.0%) |
| 25 to 29 Years | 7 (100.0%) | 0 (0.0%) |
| 30 to 34 Years | 0 (0.0%) | 0 (0.0%) |
| 35 to 44 Years | 0 (0.0%) | 0 (0.0%) |
| 45 to 54 Years | 17 (58.6%) | 0 (0.0%) |
| 55 to 59 Years | 1 (33.3%) | 0 (0.0%) |
| 60 to 64 Years | 9 (100.0%) | 0 (0.0%) |
| 65 to 74 Years | 12 (80.0%) | 0 (0.0%) |
| 75 Years and over | 4 (57.1%) | 0 (0.0%) |
| Total | 52 (55.3%) | 0 (0.0%) |
Employment Status by Educational Attainment in Nelson Lagoon
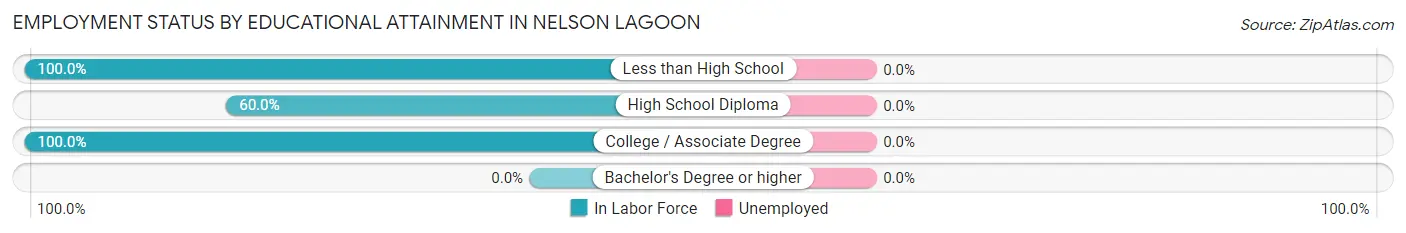
| Educational Attainment | In Labor Force | Unemployed |
| Less than High School | 6 (100.0%) | 0 (0.0%) |
| High School Diploma | 21 (60.0%) | 0 (0.0%) |
| College / Associate Degree | 7 (100.0%) | 0 (0.0%) |
| Bachelor's Degree or higher | 0 (0.0%) | 0 (0.0%) |
| Total | 34 (70.8%) | 0 (0.0%) |
Employment Occupations by Sex in Nelson Lagoon
Management, Business, Science and Arts Occupations
The most common Management, Business, Science and Arts occupations in Nelson Lagoon are , and Management (16 | 30.8%).
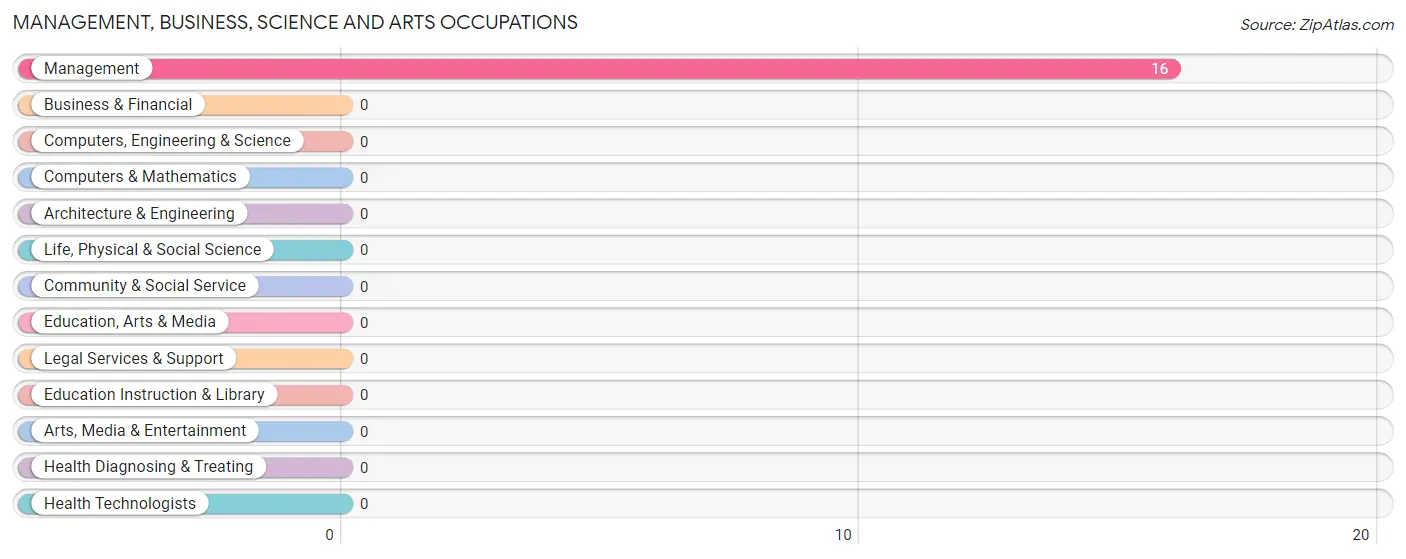
Management, Business, Science and Arts Occupations by Sex
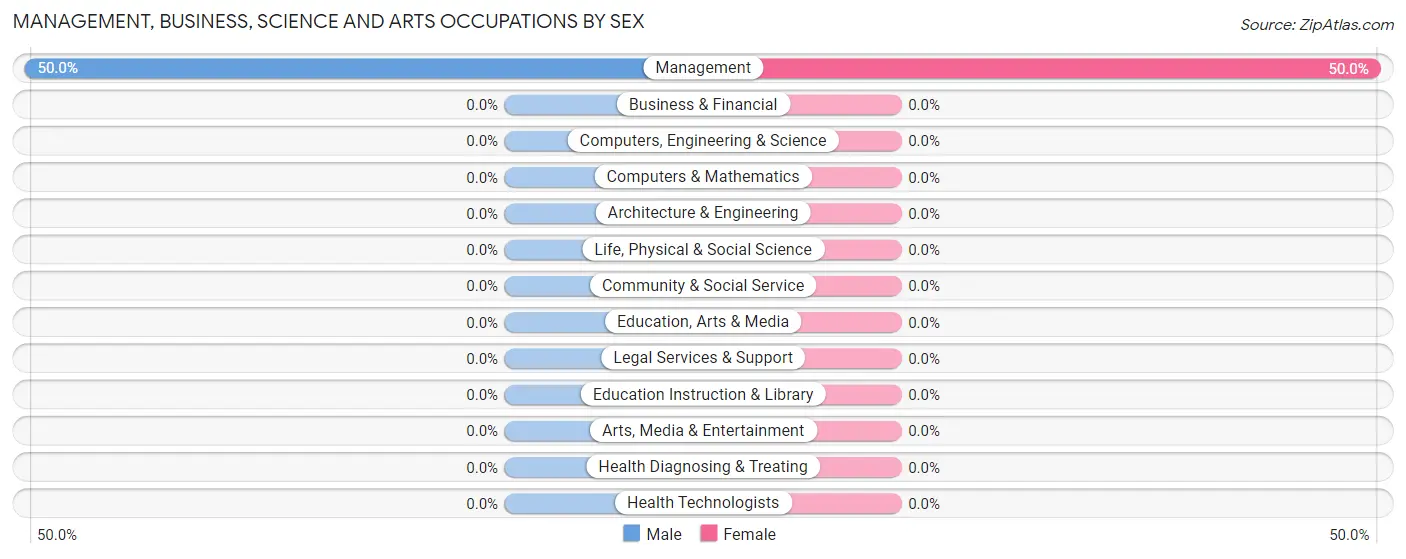
| Occupation | Male | Female |
| Management | 8 (50.0%) | 8 (50.0%) |
| Business & Financial | 0 (0.0%) | 0 (0.0%) |
| Computers, Engineering & Science | 0 (0.0%) | 0 (0.0%) |
| Computers & Mathematics | 0 (0.0%) | 0 (0.0%) |
| Architecture & Engineering | 0 (0.0%) | 0 (0.0%) |
| Life, Physical & Social Science | 0 (0.0%) | 0 (0.0%) |
| Community & Social Service | 0 (0.0%) | 0 (0.0%) |
| Education, Arts & Media | 0 (0.0%) | 0 (0.0%) |
| Legal Services & Support | 0 (0.0%) | 0 (0.0%) |
| Education Instruction & Library | 0 (0.0%) | 0 (0.0%) |
| Arts, Media & Entertainment | 0 (0.0%) | 0 (0.0%) |
| Health Diagnosing & Treating | 0 (0.0%) | 0 (0.0%) |
| Health Technologists | 0 (0.0%) | 0 (0.0%) |
| Total (Category) | 8 (50.0%) | 8 (50.0%) |
| Total (Overall) | 29 (55.8%) | 23 (44.2%) |
Services Occupations
The most common Services occupations in Nelson Lagoon are , and Cleaning & Maintenance (8 | 15.4%).
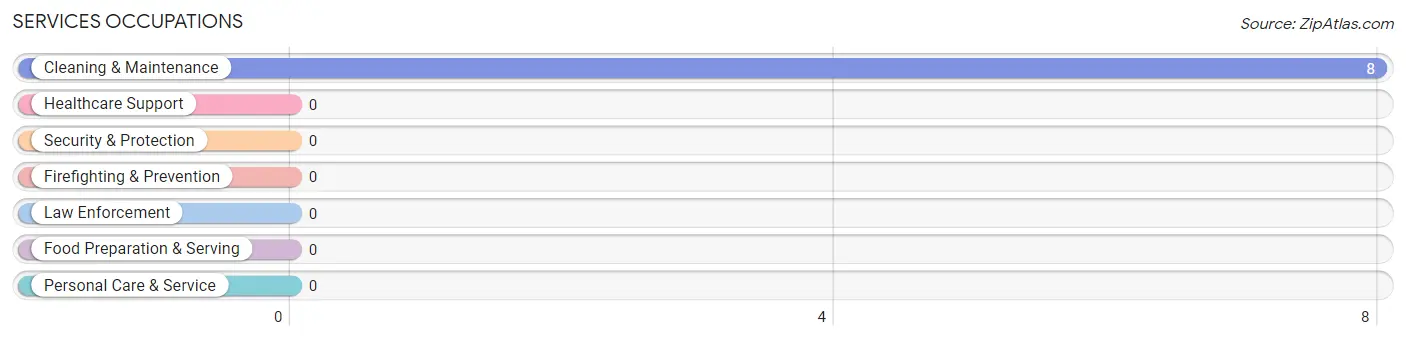
Services Occupations by Sex
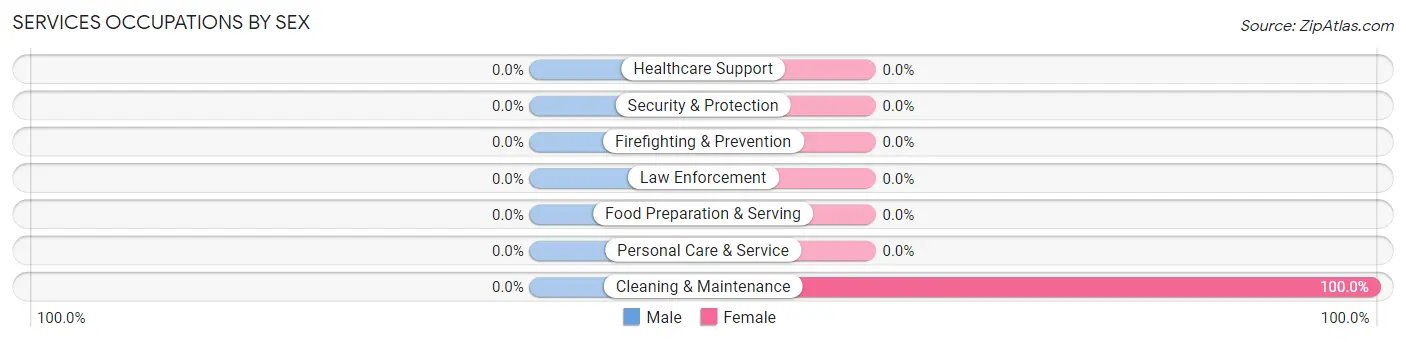
| Occupation | Male | Female |
| Healthcare Support | 0 (0.0%) | 0 (0.0%) |
| Security & Protection | 0 (0.0%) | 0 (0.0%) |
| Firefighting & Prevention | 0 (0.0%) | 0 (0.0%) |
| Law Enforcement | 0 (0.0%) | 0 (0.0%) |
| Food Preparation & Serving | 0 (0.0%) | 0 (0.0%) |
| Cleaning & Maintenance | 0 (0.0%) | 8 (100.0%) |
| Personal Care & Service | 0 (0.0%) | 0 (0.0%) |
| Total (Category) | 0 (0.0%) | 8 (100.0%) |
| Total (Overall) | 29 (55.8%) | 23 (44.2%) |
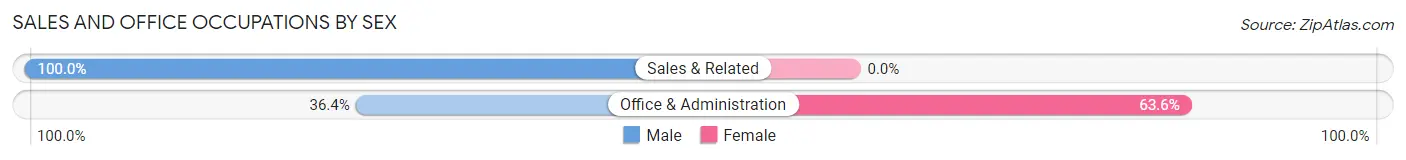
Sales and Office Occupations
The most common Sales and Office occupations in Nelson Lagoon are Office & Administration (11 | 21.1%), and Sales & Related (3 | 5.8%).
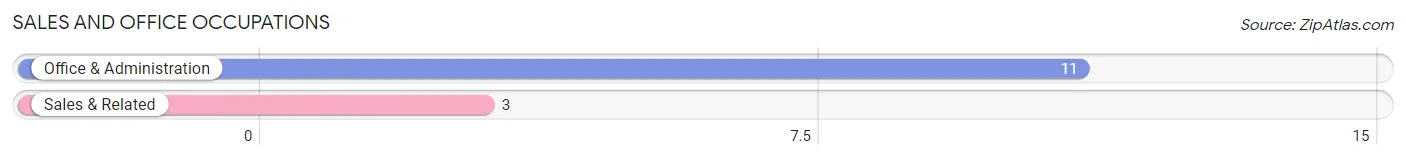
Sales and Office Occupations by Sex
| Occupation | Male | Female |
| Sales & Related | 3 (100.0%) | 0 (0.0%) |
| Office & Administration | 4 (36.4%) | 7 (63.6%) |
| Total (Category) | 7 (50.0%) | 7 (50.0%) |
| Total (Overall) | 29 (55.8%) | 23 (44.2%) |
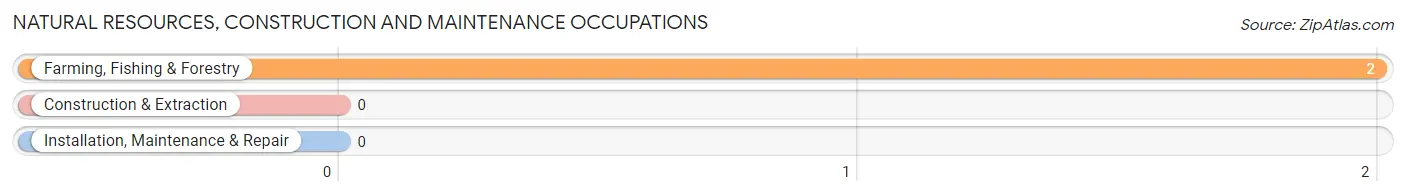
Natural Resources, Construction and Maintenance Occupations
The most common Natural Resources, Construction and Maintenance occupations in Nelson Lagoon are , and Farming, Fishing & Forestry (2 | 3.8%).
Natural Resources, Construction and Maintenance Occupations by Sex
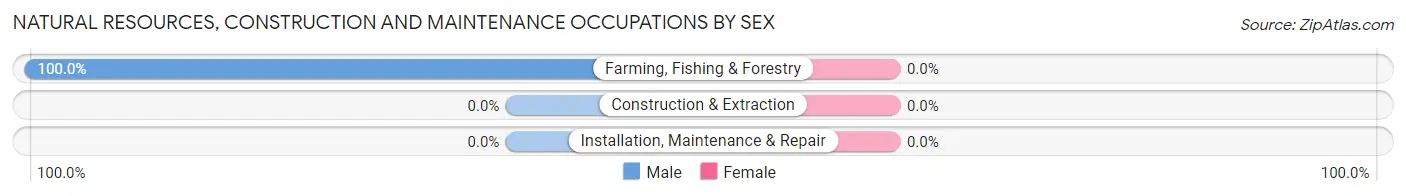
| Occupation | Male | Female |
| Farming, Fishing & Forestry | 2 (100.0%) | 0 (0.0%) |
| Construction & Extraction | 0 (0.0%) | 0 (0.0%) |
| Installation, Maintenance & Repair | 0 (0.0%) | 0 (0.0%) |
| Total (Category) | 2 (100.0%) | 0 (0.0%) |
| Total (Overall) | 29 (55.8%) | 23 (44.2%) |
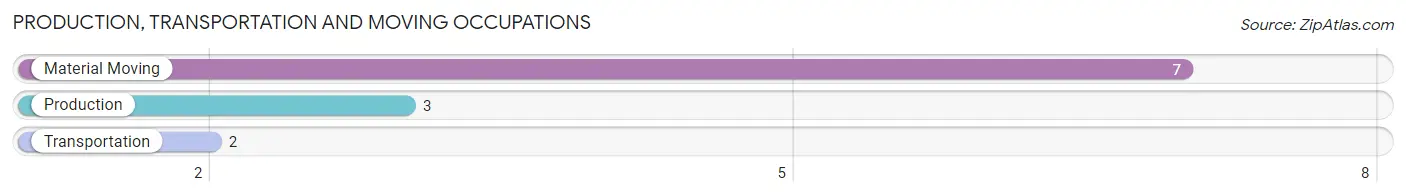
Production, Transportation and Moving Occupations
The most common Production, Transportation and Moving occupations in Nelson Lagoon are Material Moving (7 | 13.5%), Production (3 | 5.8%), and Transportation (2 | 3.8%).
Production, Transportation and Moving Occupations by Sex
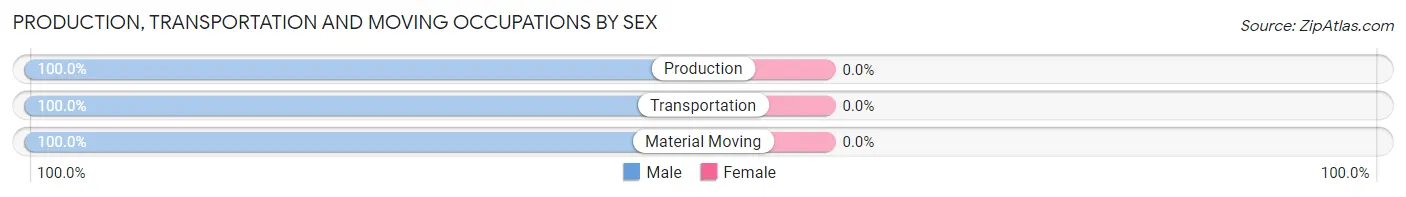
| Occupation | Male | Female |
| Production | 3 (100.0%) | 0 (0.0%) |
| Transportation | 2 (100.0%) | 0 (0.0%) |
| Material Moving | 7 (100.0%) | 0 (0.0%) |
| Total (Category) | 12 (100.0%) | 0 (0.0%) |
| Total (Overall) | 29 (55.8%) | 23 (44.2%) |
Employment Industries by Sex in Nelson Lagoon
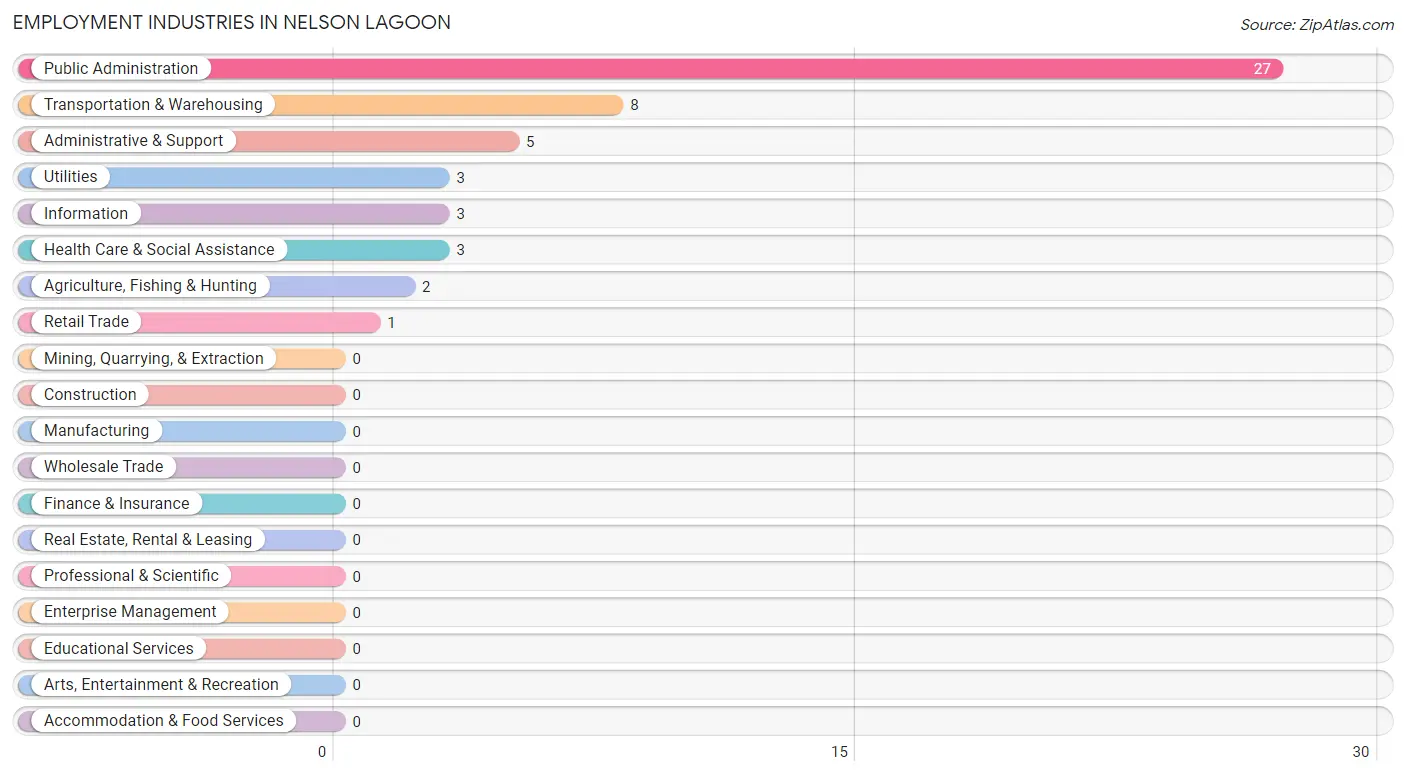
Employment Industries in Nelson Lagoon
The major employment industries in Nelson Lagoon include Public Administration (27 | 51.9%), Transportation & Warehousing (8 | 15.4%), Administrative & Support (5 | 9.6%), Utilities (3 | 5.8%), and Information (3 | 5.8%).
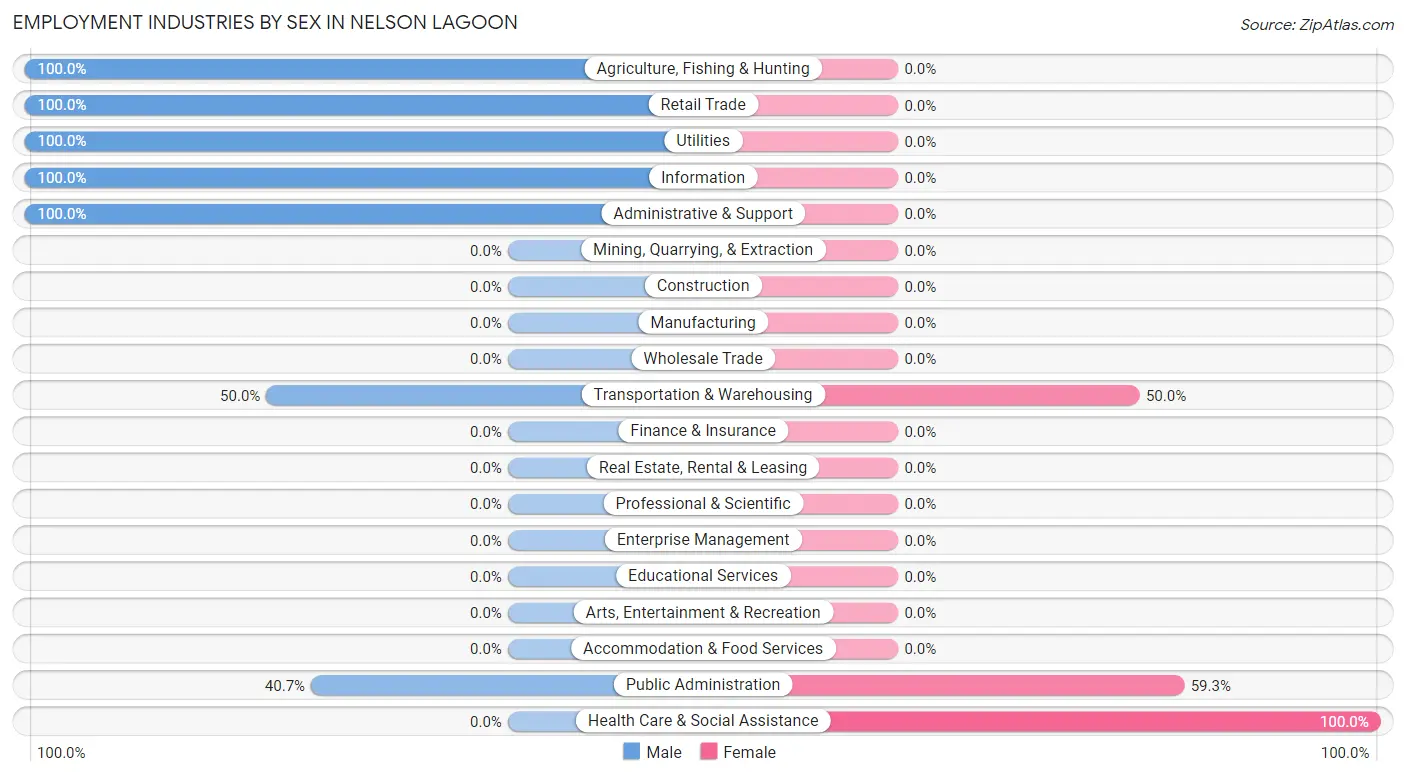
Employment Industries by Sex in Nelson Lagoon
The Nelson Lagoon industries that see more men than women are Agriculture, Fishing & Hunting (100.0%), Retail Trade (100.0%), and Utilities (100.0%), whereas the industries that tend to have a higher number of women are Health Care & Social Assistance (100.0%), Public Administration (59.3%), and Transportation & Warehousing (50.0%).
| Industry | Male | Female |
| Agriculture, Fishing & Hunting | 2 (100.0%) | 0 (0.0%) |
| Mining, Quarrying, & Extraction | 0 (0.0%) | 0 (0.0%) |
| Construction | 0 (0.0%) | 0 (0.0%) |
| Manufacturing | 0 (0.0%) | 0 (0.0%) |
| Wholesale Trade | 0 (0.0%) | 0 (0.0%) |
| Retail Trade | 1 (100.0%) | 0 (0.0%) |
| Transportation & Warehousing | 4 (50.0%) | 4 (50.0%) |
| Utilities | 3 (100.0%) | 0 (0.0%) |
| Information | 3 (100.0%) | 0 (0.0%) |
| Finance & Insurance | 0 (0.0%) | 0 (0.0%) |
| Real Estate, Rental & Leasing | 0 (0.0%) | 0 (0.0%) |
| Professional & Scientific | 0 (0.0%) | 0 (0.0%) |
| Enterprise Management | 0 (0.0%) | 0 (0.0%) |
| Administrative & Support | 5 (100.0%) | 0 (0.0%) |
| Educational Services | 0 (0.0%) | 0 (0.0%) |
| Health Care & Social Assistance | 0 (0.0%) | 3 (100.0%) |
| Arts, Entertainment & Recreation | 0 (0.0%) | 0 (0.0%) |
| Accommodation & Food Services | 0 (0.0%) | 0 (0.0%) |
| Public Administration | 11 (40.7%) | 16 (59.3%) |
| Total | 29 (55.8%) | 23 (44.2%) |
Education in Nelson Lagoon
School Enrollment in Nelson Lagoon
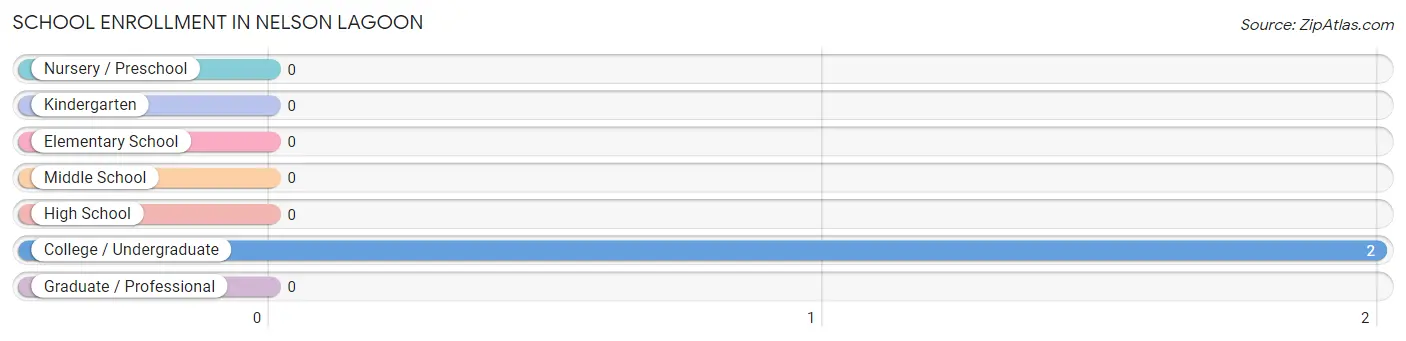
| School Level | # Students | % Students |
| Nursery / Preschool | 0 | 0.0% |
| Kindergarten | 0 | 0.0% |
| Elementary School | 0 | 0.0% |
| Middle School | 0 | 0.0% |
| High School | 0 | 0.0% |
| College / Undergraduate | 2 | 100.0% |
| Graduate / Professional | 0 | 0.0% |
| Total | 2 | 100.0% |
School Enrollment by Age by Funding Source in Nelson Lagoon
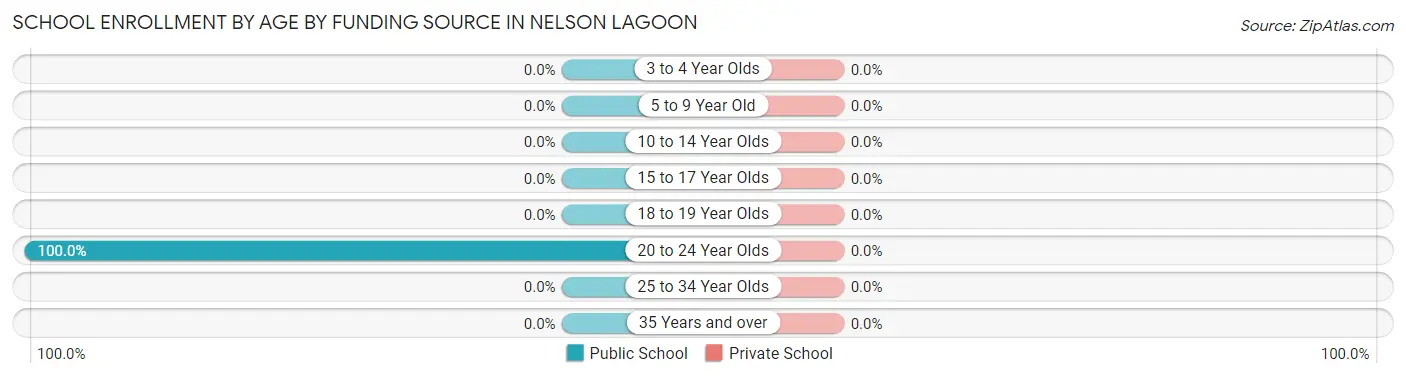
| Age Bracket | Public School | Private School |
| 3 to 4 Year Olds | 0 (0.0%) | 0 (0.0%) |
| 5 to 9 Year Old | 0 (0.0%) | 0 (0.0%) |
| 10 to 14 Year Olds | 0 (0.0%) | 0 (0.0%) |
| 15 to 17 Year Olds | 0 (0.0%) | 0 (0.0%) |
| 18 to 19 Year Olds | 0 (0.0%) | 0 (0.0%) |
| 20 to 24 Year Olds | 2 (100.0%) | 0 (0.0%) |
| 25 to 34 Year Olds | 0 (0.0%) | 0 (0.0%) |
| 35 Years and over | 0 (0.0%) | 0 (0.0%) |
| Total | 2 (100.0%) | 0 (0.0%) |
Educational Attainment by Field of Study in Nelson Lagoon
, and visual & performing arts (2 | 100.0%) are the most common fields of study among 2 individuals in Nelson Lagoon who have obtained a bachelor's degree or higher.
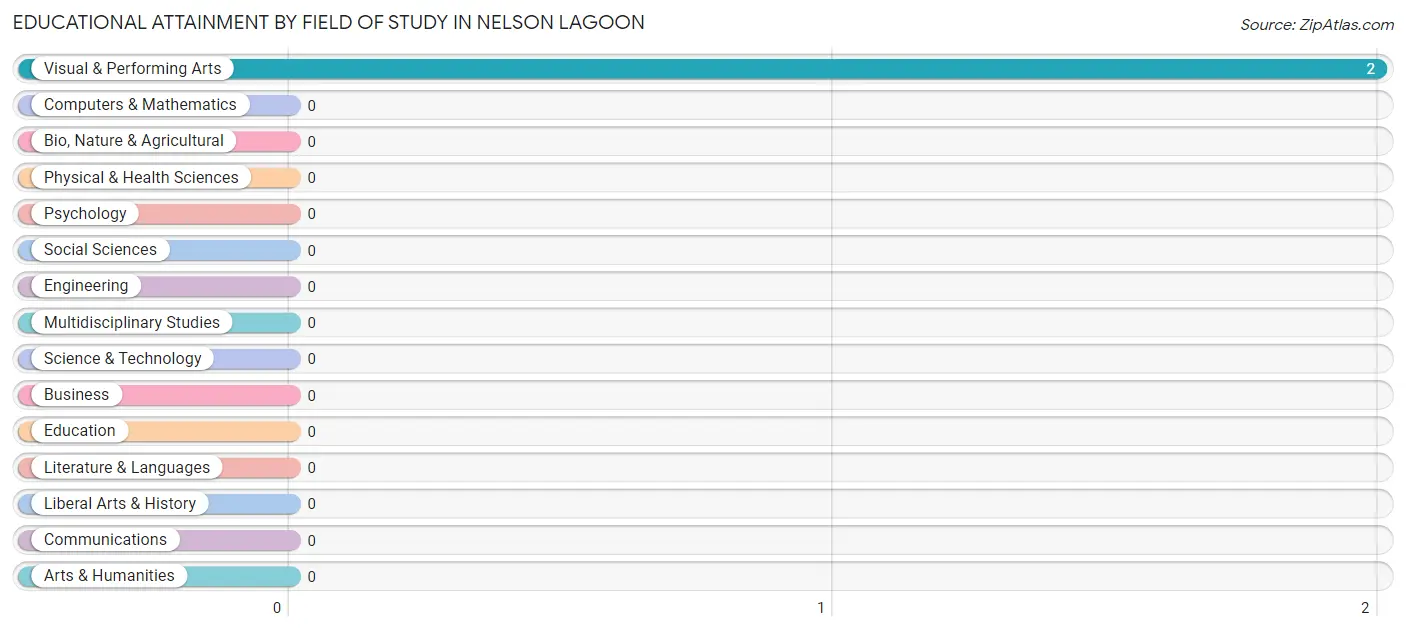
| Field of Study | # Graduates | % Graduates |
| Computers & Mathematics | 0 | 0.0% |
| Bio, Nature & Agricultural | 0 | 0.0% |
| Physical & Health Sciences | 0 | 0.0% |
| Psychology | 0 | 0.0% |
| Social Sciences | 0 | 0.0% |
| Engineering | 0 | 0.0% |
| Multidisciplinary Studies | 0 | 0.0% |
| Science & Technology | 0 | 0.0% |
| Business | 0 | 0.0% |
| Education | 0 | 0.0% |
| Literature & Languages | 0 | 0.0% |
| Liberal Arts & History | 0 | 0.0% |
| Visual & Performing Arts | 2 | 100.0% |
| Communications | 0 | 0.0% |
| Arts & Humanities | 0 | 0.0% |
| Total | 2 | 100.0% |
Transportation & Commute in Nelson Lagoon
Vehicle Availability by Sex in Nelson Lagoon
The most prevalent vehicle ownership categories in Nelson Lagoon are males with 1 vehicle (18, accounting for 62.1%) and females with 1 vehicle (13, making up 78.3%).
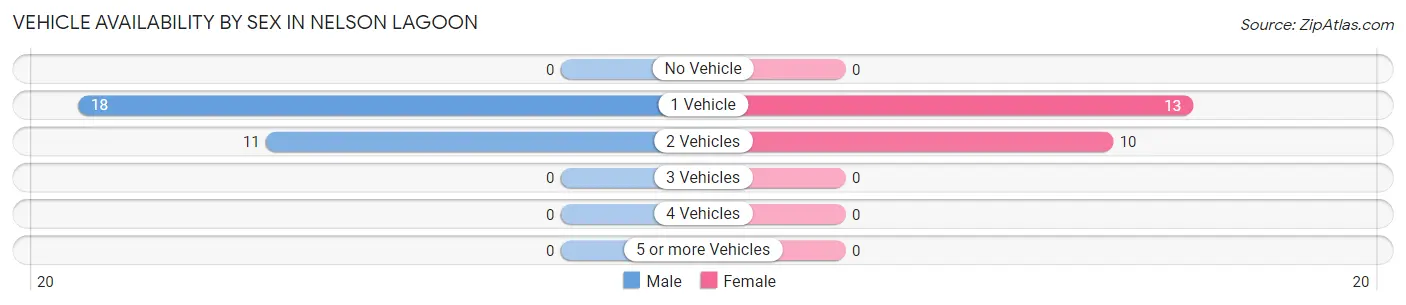
| Vehicles Available | Male | Female |
| No Vehicle | 0 (0.0%) | 0 (0.0%) |
| 1 Vehicle | 18 (62.1%) | 13 (56.5%) |
| 2 Vehicles | 11 (37.9%) | 10 (43.5%) |
| 3 Vehicles | 0 (0.0%) | 0 (0.0%) |
| 4 Vehicles | 0 (0.0%) | 0 (0.0%) |
| 5 or more Vehicles | 0 (0.0%) | 0 (0.0%) |
| Total | 29 (100.0%) | 23 (100.0%) |
Commute Time in Nelson Lagoon
The most frequently occuring commute durations in Nelson Lagoon are 5 to 9 minutes (19 commuters, 38.0%), less than 5 minutes (18 commuters, 36.0%), and 10 to 14 minutes (5 commuters, 10.0%).
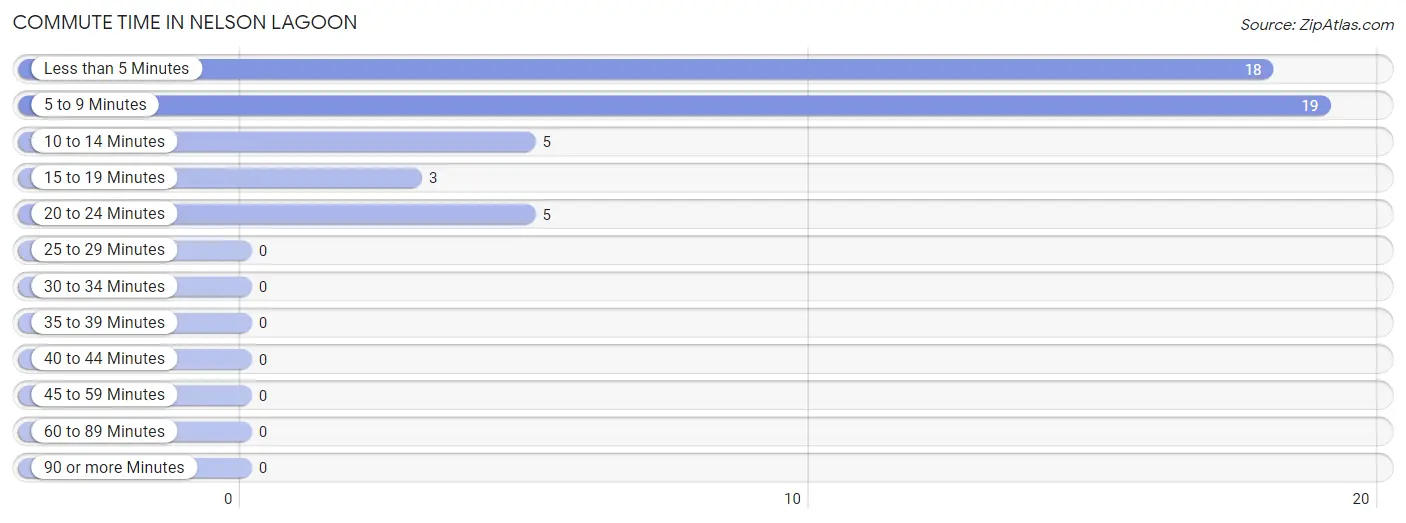
| Commute Time | # Commuters | % Commuters |
| Less than 5 Minutes | 18 | 36.0% |
| 5 to 9 Minutes | 19 | 38.0% |
| 10 to 14 Minutes | 5 | 10.0% |
| 15 to 19 Minutes | 3 | 6.0% |
| 20 to 24 Minutes | 5 | 10.0% |
| 25 to 29 Minutes | 0 | 0.0% |
| 30 to 34 Minutes | 0 | 0.0% |
| 35 to 39 Minutes | 0 | 0.0% |
| 40 to 44 Minutes | 0 | 0.0% |
| 45 to 59 Minutes | 0 | 0.0% |
| 60 to 89 Minutes | 0 | 0.0% |
| 90 or more Minutes | 0 | 0.0% |
Commute Time by Sex in Nelson Lagoon
The most common commute times in Nelson Lagoon are 5 to 9 minutes (13 commuters, 44.8%) for males and less than 5 minutes (10 commuters, 47.6%) for females.
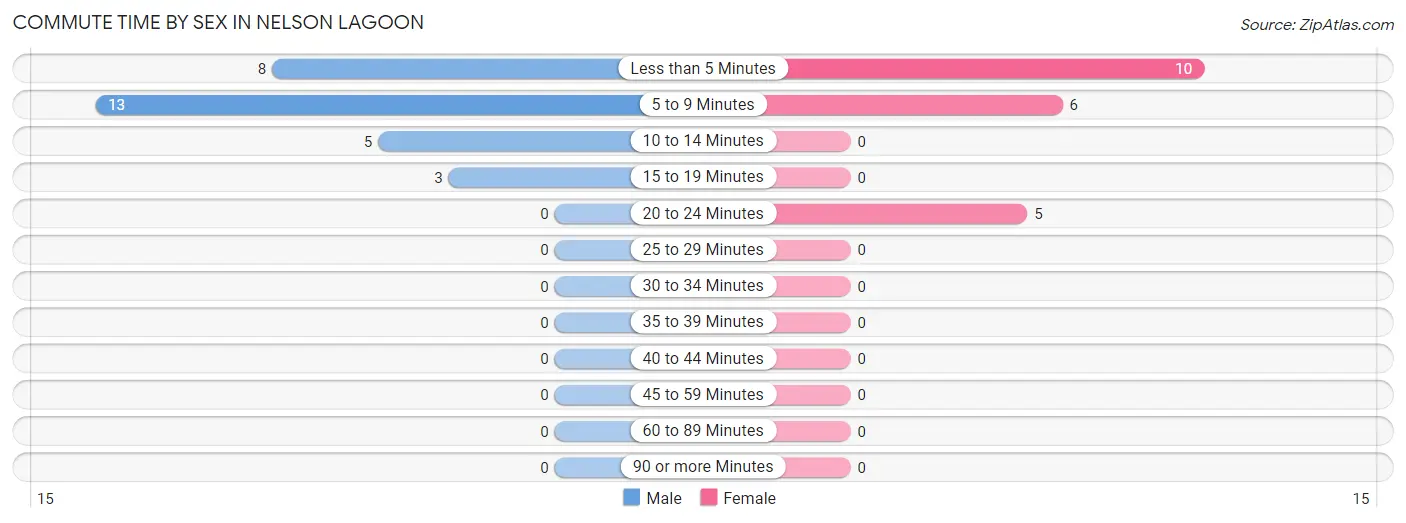
| Commute Time | Male | Female |
| Less than 5 Minutes | 8 (27.6%) | 10 (47.6%) |
| 5 to 9 Minutes | 13 (44.8%) | 6 (28.6%) |
| 10 to 14 Minutes | 5 (17.2%) | 0 (0.0%) |
| 15 to 19 Minutes | 3 (10.3%) | 0 (0.0%) |
| 20 to 24 Minutes | 0 (0.0%) | 5 (23.8%) |
| 25 to 29 Minutes | 0 (0.0%) | 0 (0.0%) |
| 30 to 34 Minutes | 0 (0.0%) | 0 (0.0%) |
| 35 to 39 Minutes | 0 (0.0%) | 0 (0.0%) |
| 40 to 44 Minutes | 0 (0.0%) | 0 (0.0%) |
| 45 to 59 Minutes | 0 (0.0%) | 0 (0.0%) |
| 60 to 89 Minutes | 0 (0.0%) | 0 (0.0%) |
| 90 or more Minutes | 0 (0.0%) | 0 (0.0%) |
Time of Departure to Work by Sex in Nelson Lagoon
The most frequent times of departure to work in Nelson Lagoon are 9:00 AM to 9:59 AM (13, 44.8%) for males and 12:00 PM to 3:59 PM (7, 33.3%) for females.
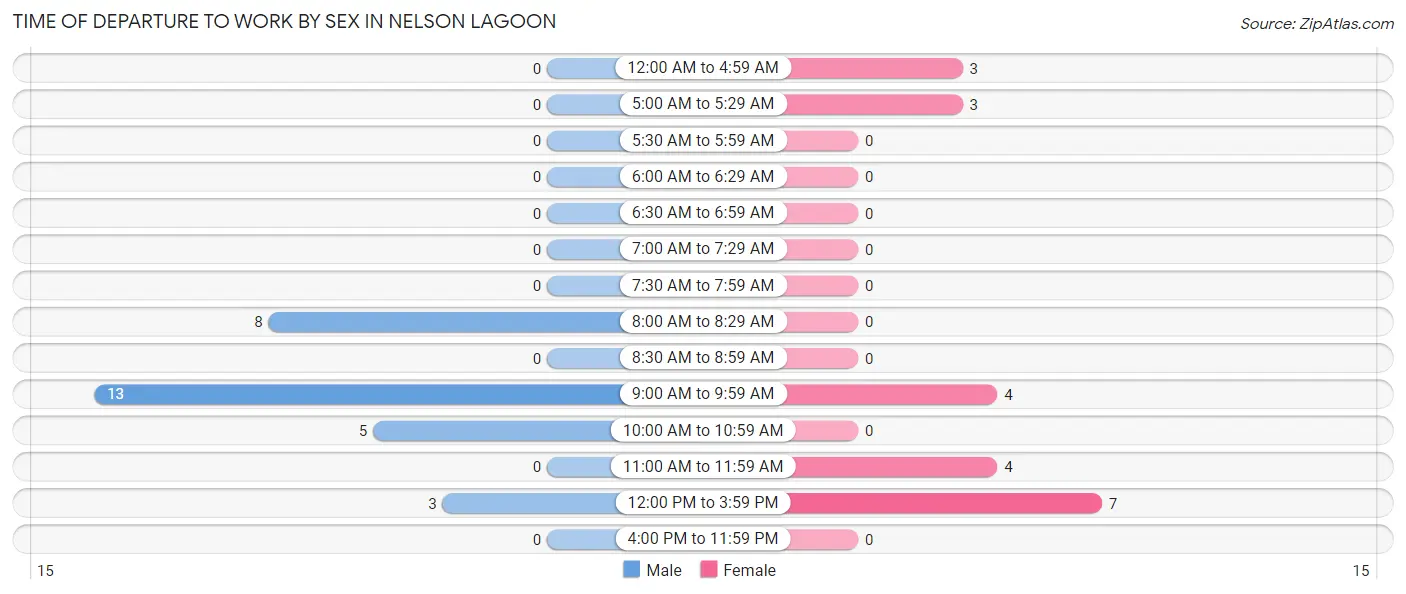
| Time of Departure | Male | Female |
| 12:00 AM to 4:59 AM | 0 (0.0%) | 3 (14.3%) |
| 5:00 AM to 5:29 AM | 0 (0.0%) | 3 (14.3%) |
| 5:30 AM to 5:59 AM | 0 (0.0%) | 0 (0.0%) |
| 6:00 AM to 6:29 AM | 0 (0.0%) | 0 (0.0%) |
| 6:30 AM to 6:59 AM | 0 (0.0%) | 0 (0.0%) |
| 7:00 AM to 7:29 AM | 0 (0.0%) | 0 (0.0%) |
| 7:30 AM to 7:59 AM | 0 (0.0%) | 0 (0.0%) |
| 8:00 AM to 8:29 AM | 8 (27.6%) | 0 (0.0%) |
| 8:30 AM to 8:59 AM | 0 (0.0%) | 0 (0.0%) |
| 9:00 AM to 9:59 AM | 13 (44.8%) | 4 (19.1%) |
| 10:00 AM to 10:59 AM | 5 (17.2%) | 0 (0.0%) |
| 11:00 AM to 11:59 AM | 0 (0.0%) | 4 (19.1%) |
| 12:00 PM to 3:59 PM | 3 (10.3%) | 7 (33.3%) |
| 4:00 PM to 11:59 PM | 0 (0.0%) | 0 (0.0%) |
| Total | 29 (100.0%) | 21 (100.0%) |
Housing Occupancy in Nelson Lagoon
Occupancy by Ownership in Nelson Lagoon
Of the total 34 dwellings in Nelson Lagoon, owner-occupied units account for 34 (100.0%), while renter-occupied units make up 0 (0.0%).
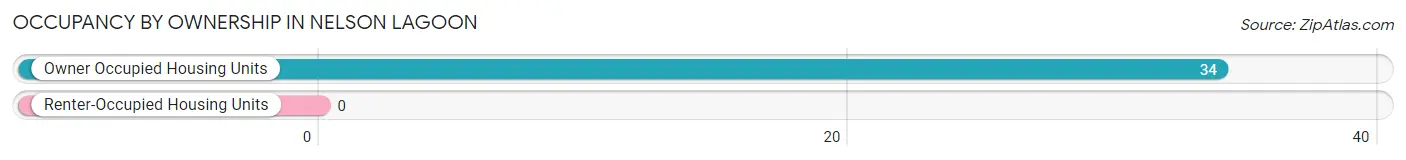
| Occupancy | # Housing Units | % Housing Units |
| Owner Occupied Housing Units | 34 | 100.0% |
| Renter-Occupied Housing Units | 0 | 0.0% |
| Total Occupied Housing Units | 34 | 100.0% |
Occupancy by Household Size in Nelson Lagoon
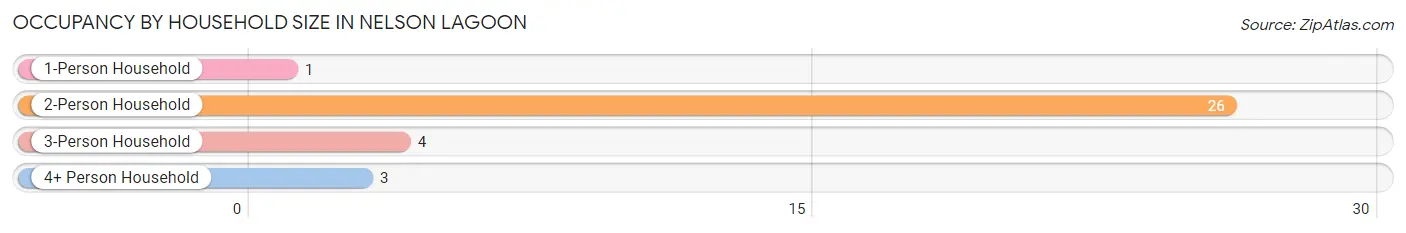
| Household Size | # Housing Units | % Housing Units |
| 1-Person Household | 1 | 2.9% |
| 2-Person Household | 26 | 76.5% |
| 3-Person Household | 4 | 11.8% |
| 4+ Person Household | 3 | 8.8% |
| Total Housing Units | 34 | 100.0% |
Occupancy by Ownership by Household Size in Nelson Lagoon
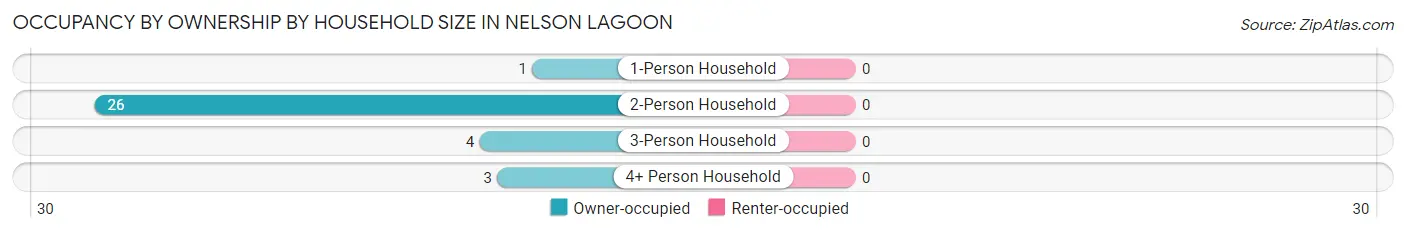
| Household Size | Owner-occupied | Renter-occupied |
| 1-Person Household | 1 (100.0%) | 0 (0.0%) |
| 2-Person Household | 26 (100.0%) | 0 (0.0%) |
| 3-Person Household | 4 (100.0%) | 0 (0.0%) |
| 4+ Person Household | 3 (100.0%) | 0 (0.0%) |
| Total Housing Units | 34 (100.0%) | 0 (0.0%) |
Occupancy by Educational Attainment in Nelson Lagoon
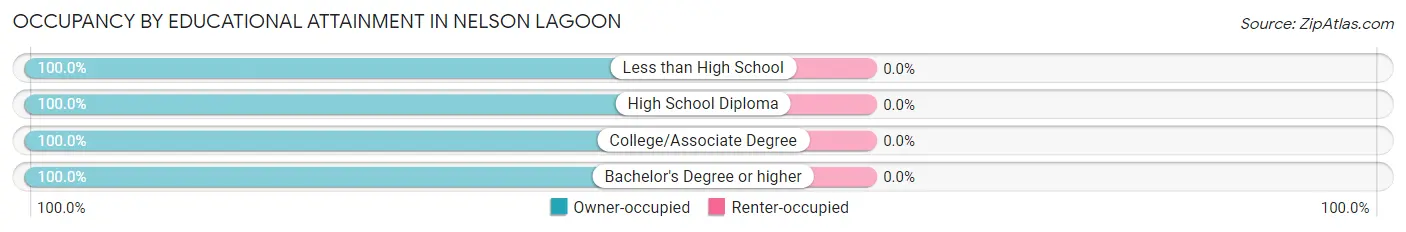
| Household Size | Owner-occupied | Renter-occupied |
| Less than High School | 11 (100.0%) | 0 (0.0%) |
| High School Diploma | 11 (100.0%) | 0 (0.0%) |
| College/Associate Degree | 10 (100.0%) | 0 (0.0%) |
| Bachelor's Degree or higher | 2 (100.0%) | 0 (0.0%) |
Occupancy by Age of Householder in Nelson Lagoon
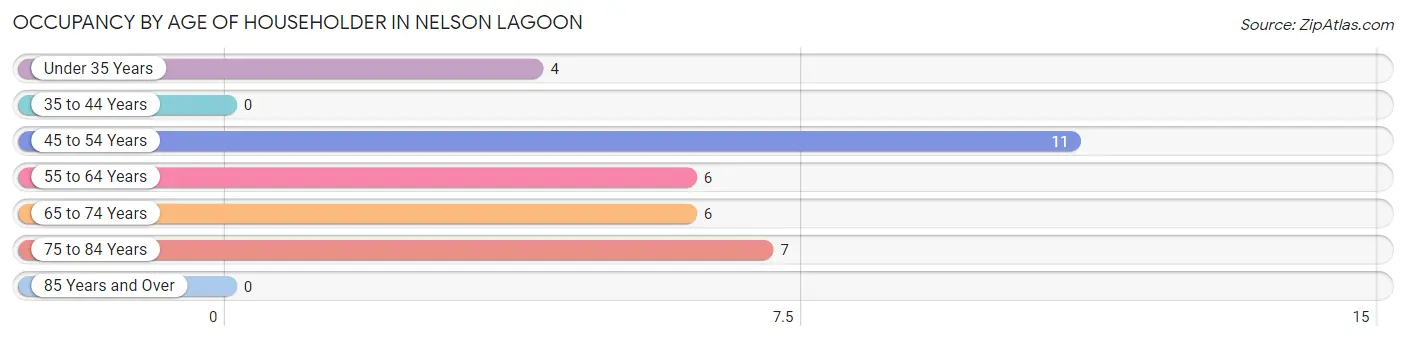
| Age Bracket | # Households | % Households |
| Under 35 Years | 4 | 11.8% |
| 35 to 44 Years | 0 | 0.0% |
| 45 to 54 Years | 11 | 32.4% |
| 55 to 64 Years | 6 | 17.6% |
| 65 to 74 Years | 6 | 17.6% |
| 75 to 84 Years | 7 | 20.6% |
| 85 Years and Over | 0 | 0.0% |
| Total | 34 | 100.0% |
Housing Finances in Nelson Lagoon
Median Income by Occupancy in Nelson Lagoon
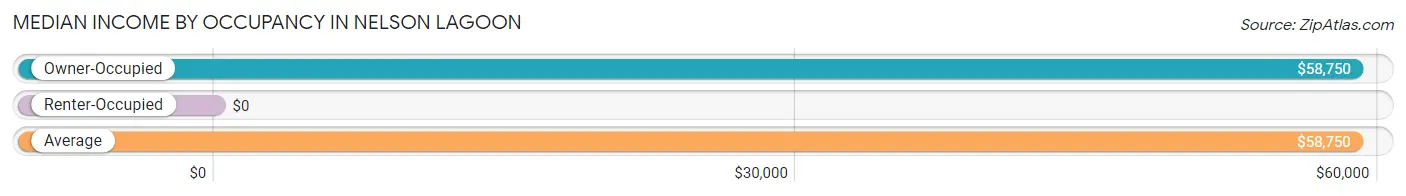
| Occupancy Type | # Households | Median Income |
| Owner-Occupied | 34 (100.0%) | $58,750 |
| Renter-Occupied | 0 (0.0%) | $0 |
| Average | 34 (100.0%) | $58,750 |
Occupancy by Householder Income Bracket in Nelson Lagoon
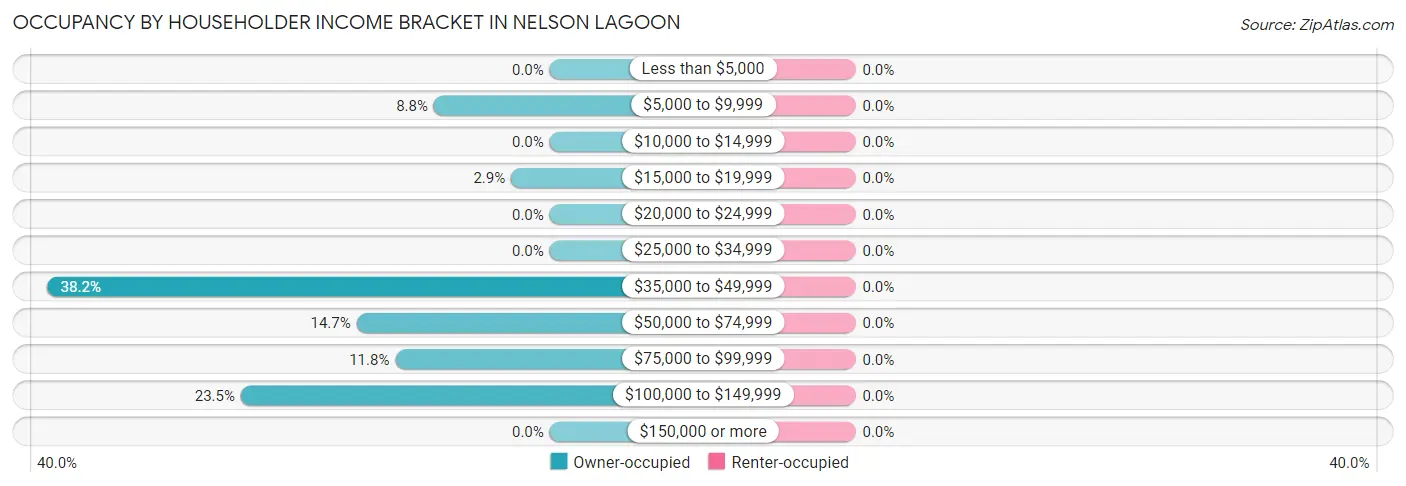
| Income Bracket | Owner-occupied | Renter-occupied |
| Less than $5,000 | 0 (0.0%) | 0 (0.0%) |
| $5,000 to $9,999 | 3 (8.8%) | 0 (0.0%) |
| $10,000 to $14,999 | 0 (0.0%) | 0 (0.0%) |
| $15,000 to $19,999 | 1 (2.9%) | 0 (0.0%) |
| $20,000 to $24,999 | 0 (0.0%) | 0 (0.0%) |
| $25,000 to $34,999 | 0 (0.0%) | 0 (0.0%) |
| $35,000 to $49,999 | 13 (38.2%) | 0 (0.0%) |
| $50,000 to $74,999 | 5 (14.7%) | 0 (0.0%) |
| $75,000 to $99,999 | 4 (11.8%) | 0 (0.0%) |
| $100,000 to $149,999 | 8 (23.5%) | 0 (0.0%) |
| $150,000 or more | 0 (0.0%) | 0 (0.0%) |
| Total | 34 (100.0%) | 0 (0.0%) |
Monthly Housing Cost Tiers in Nelson Lagoon
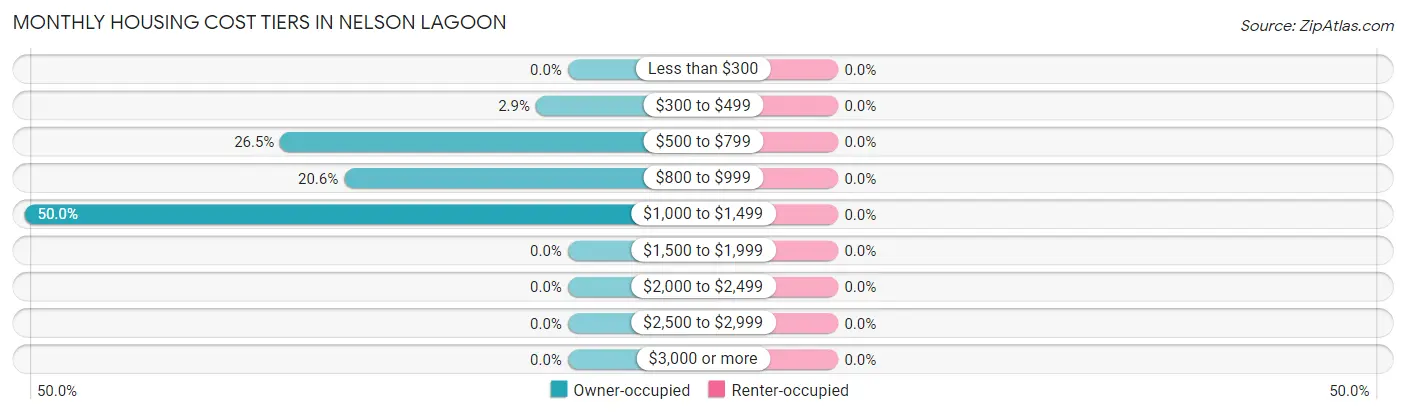
| Monthly Cost | Owner-occupied | Renter-occupied |
| Less than $300 | 0 (0.0%) | 0 (0.0%) |
| $300 to $499 | 1 (2.9%) | 0 (0.0%) |
| $500 to $799 | 9 (26.5%) | 0 (0.0%) |
| $800 to $999 | 7 (20.6%) | 0 (0.0%) |
| $1,000 to $1,499 | 17 (50.0%) | 0 (0.0%) |
| $1,500 to $1,999 | 0 (0.0%) | 0 (0.0%) |
| $2,000 to $2,499 | 0 (0.0%) | 0 (0.0%) |
| $2,500 to $2,999 | 0 (0.0%) | 0 (0.0%) |
| $3,000 or more | 0 (0.0%) | 0 (0.0%) |
| Total | 34 (100.0%) | 0 (0.0%) |
Physical Housing Characteristics in Nelson Lagoon
Housing Structures in Nelson Lagoon
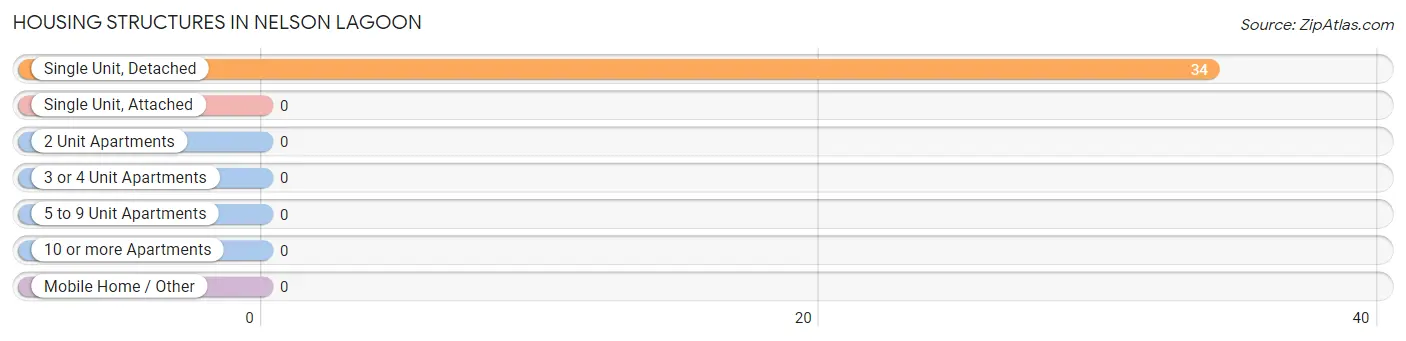
| Structure Type | # Housing Units | % Housing Units |
| Single Unit, Detached | 34 | 100.0% |
| Single Unit, Attached | 0 | 0.0% |
| 2 Unit Apartments | 0 | 0.0% |
| 3 or 4 Unit Apartments | 0 | 0.0% |
| 5 to 9 Unit Apartments | 0 | 0.0% |
| 10 or more Apartments | 0 | 0.0% |
| Mobile Home / Other | 0 | 0.0% |
| Total | 34 | 100.0% |
Housing Structures by Occupancy in Nelson Lagoon
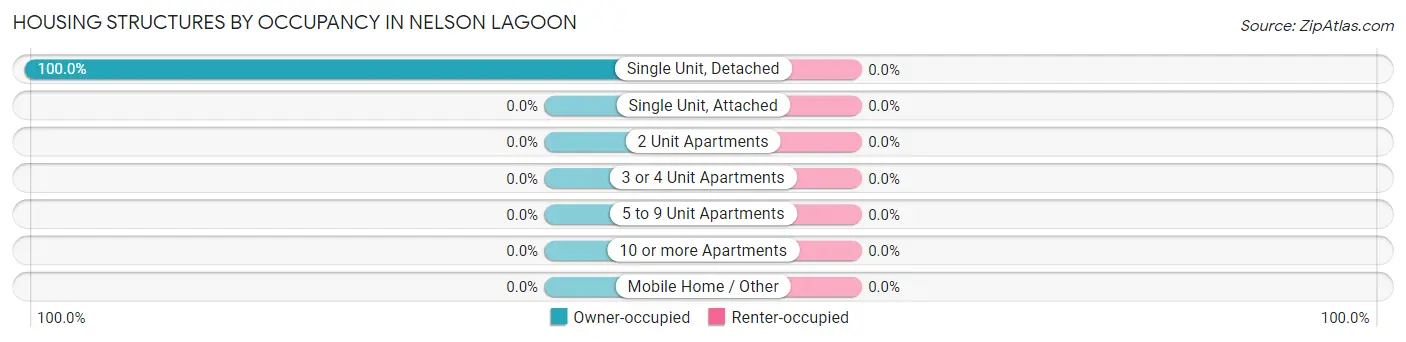
| Structure Type | Owner-occupied | Renter-occupied |
| Single Unit, Detached | 34 (100.0%) | 0 (0.0%) |
| Single Unit, Attached | 0 (0.0%) | 0 (0.0%) |
| 2 Unit Apartments | 0 (0.0%) | 0 (0.0%) |
| 3 or 4 Unit Apartments | 0 (0.0%) | 0 (0.0%) |
| 5 to 9 Unit Apartments | 0 (0.0%) | 0 (0.0%) |
| 10 or more Apartments | 0 (0.0%) | 0 (0.0%) |
| Mobile Home / Other | 0 (0.0%) | 0 (0.0%) |
| Total | 34 (100.0%) | 0 (0.0%) |
Housing Structures by Number of Rooms in Nelson Lagoon
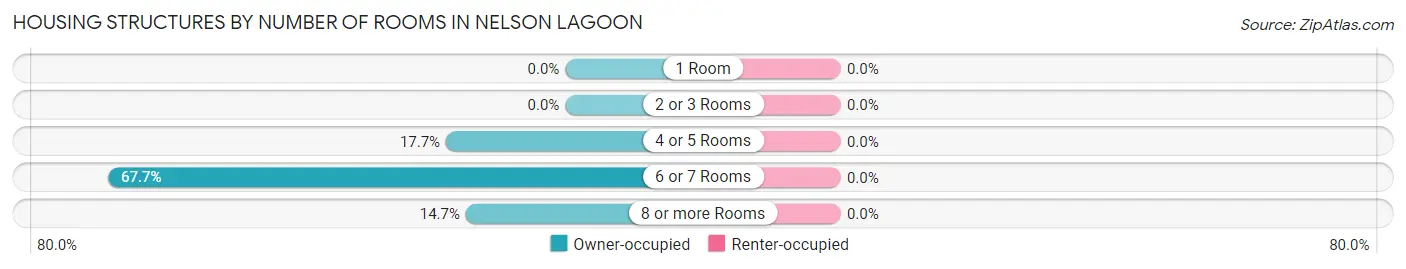
| Number of Rooms | Owner-occupied | Renter-occupied |
| 1 Room | 0 (0.0%) | 0 (0.0%) |
| 2 or 3 Rooms | 0 (0.0%) | 0 (0.0%) |
| 4 or 5 Rooms | 6 (17.6%) | 0 (0.0%) |
| 6 or 7 Rooms | 23 (67.6%) | 0 (0.0%) |
| 8 or more Rooms | 5 (14.7%) | 0 (0.0%) |
| Total | 34 (100.0%) | 0 (0.0%) |
Housing Structure by Heating Type in Nelson Lagoon
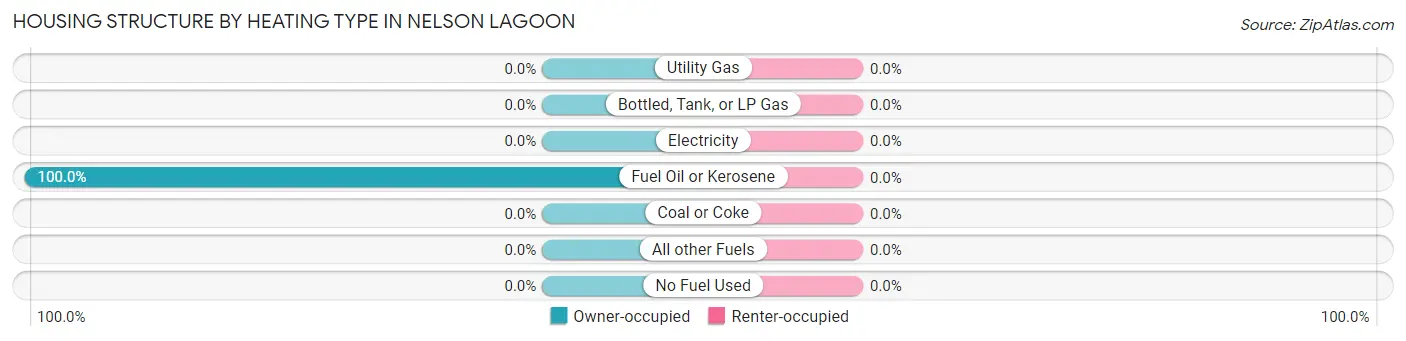
| Heating Type | Owner-occupied | Renter-occupied |
| Utility Gas | 0 (0.0%) | 0 (0.0%) |
| Bottled, Tank, or LP Gas | 0 (0.0%) | 0 (0.0%) |
| Electricity | 0 (0.0%) | 0 (0.0%) |
| Fuel Oil or Kerosene | 34 (100.0%) | 0 (0.0%) |
| Coal or Coke | 0 (0.0%) | 0 (0.0%) |
| All other Fuels | 0 (0.0%) | 0 (0.0%) |
| No Fuel Used | 0 (0.0%) | 0 (0.0%) |
| Total | 34 (100.0%) | 0 (0.0%) |
Household Vehicle Usage in Nelson Lagoon
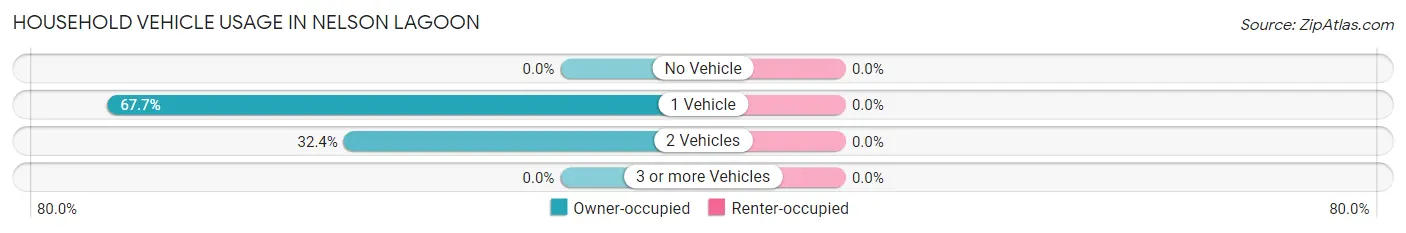
| Vehicles per Household | Owner-occupied | Renter-occupied |
| No Vehicle | 0 (0.0%) | 0 (0.0%) |
| 1 Vehicle | 23 (67.6%) | 0 (0.0%) |
| 2 Vehicles | 11 (32.4%) | 0 (0.0%) |
| 3 or more Vehicles | 0 (0.0%) | 0 (0.0%) |
| Total | 34 (100.0%) | 0 (0.0%) |
Real Estate & Mortgages in Nelson Lagoon
Real Estate and Mortgage Overview in Nelson Lagoon
| Characteristic | Without Mortgage | With Mortgage |
| Housing Units | 26 | 8 |
| Median Property Value | $141,700 | $175,000 |
| Median Household Income | $47,500 | $0 |
| Monthly Housing Costs | $900 | $0 |
| Real Estate Taxes | - | - |
Property Value by Mortgage Status in Nelson Lagoon
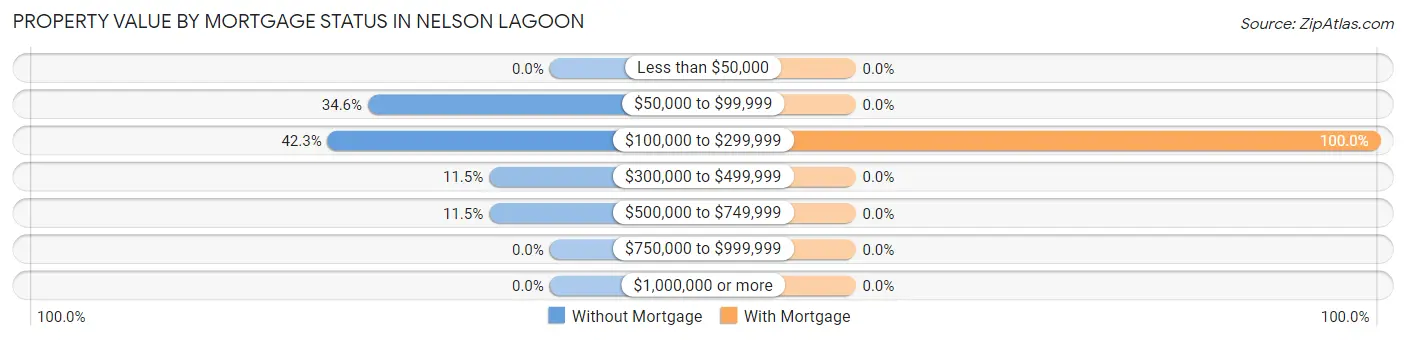
| Property Value | Without Mortgage | With Mortgage |
| Less than $50,000 | 0 (0.0%) | 0 (0.0%) |
| $50,000 to $99,999 | 9 (34.6%) | 0 (0.0%) |
| $100,000 to $299,999 | 11 (42.3%) | 8 (100.0%) |
| $300,000 to $499,999 | 3 (11.5%) | 0 (0.0%) |
| $500,000 to $749,999 | 3 (11.5%) | 0 (0.0%) |
| $750,000 to $999,999 | 0 (0.0%) | 0 (0.0%) |
| $1,000,000 or more | 0 (0.0%) | 0 (0.0%) |
| Total | 26 (100.0%) | 8 (100.0%) |
Household Income by Mortgage Status in Nelson Lagoon
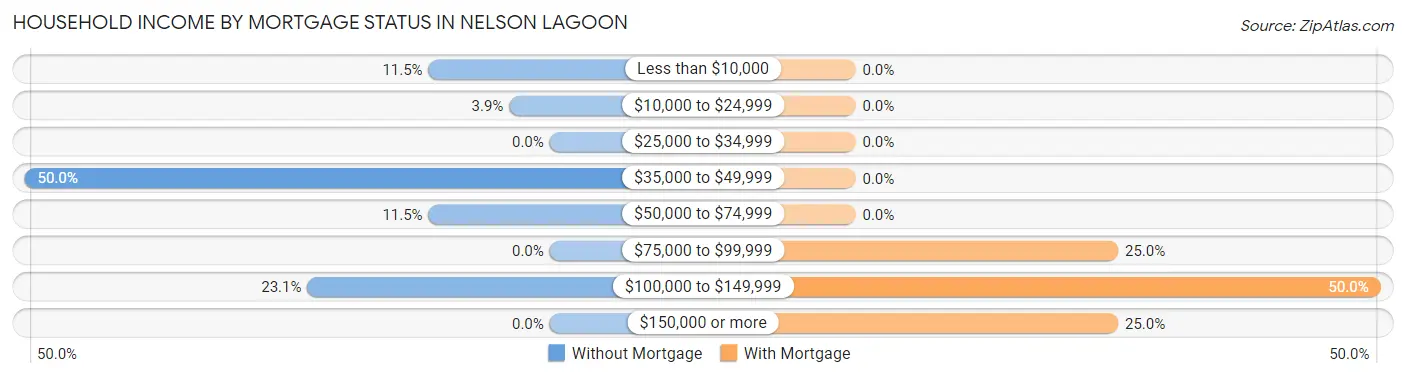
| Household Income | Without Mortgage | With Mortgage |
| Less than $10,000 | 3 (11.5%) | 0 (0.0%) |
| $10,000 to $24,999 | 1 (3.8%) | 0 (0.0%) |
| $25,000 to $34,999 | 0 (0.0%) | 0 (0.0%) |
| $35,000 to $49,999 | 13 (50.0%) | 0 (0.0%) |
| $50,000 to $74,999 | 3 (11.5%) | 0 (0.0%) |
| $75,000 to $99,999 | 0 (0.0%) | 2 (25.0%) |
| $100,000 to $149,999 | 6 (23.1%) | 4 (50.0%) |
| $150,000 or more | 0 (0.0%) | 2 (25.0%) |
| Total | 26 (100.0%) | 8 (100.0%) |
Property Value to Household Income Ratio in Nelson Lagoon
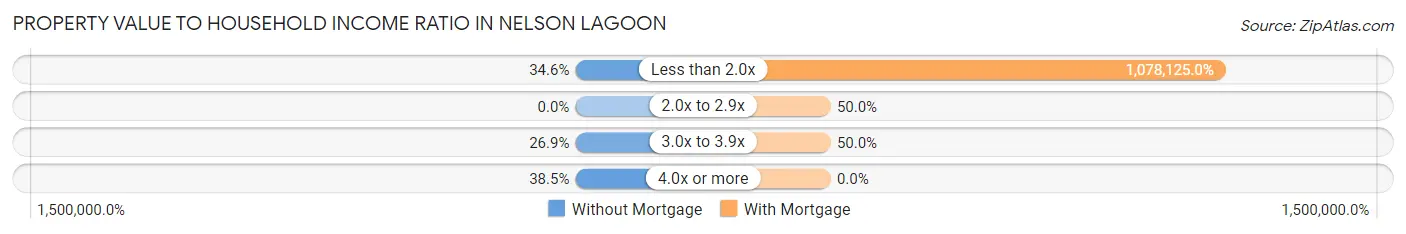
| Value-to-Income Ratio | Without Mortgage | With Mortgage |
| Less than 2.0x | 9 (34.6%) | 86,250 (1,078,125.0%) |
| 2.0x to 2.9x | 0 (0.0%) | 4 (50.0%) |
| 3.0x to 3.9x | 7 (26.9%) | 4 (50.0%) |
| 4.0x or more | 10 (38.5%) | 0 (0.0%) |
| Total | 26 (100.0%) | 8 (100.0%) |
Real Estate Taxes by Mortgage Status in Nelson Lagoon
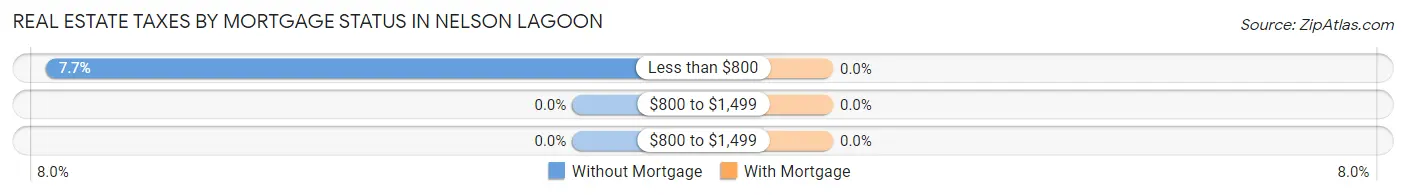
| Property Taxes | Without Mortgage | With Mortgage |
| Less than $800 | 2 (7.7%) | 0 (0.0%) |
| $800 to $1,499 | 0 (0.0%) | 0 (0.0%) |
| $800 to $1,499 | 0 (0.0%) | 0 (0.0%) |
| Total | 26 (100.0%) | 8 (100.0%) |
Health & Disability in Nelson Lagoon
Health Insurance Coverage by Age in Nelson Lagoon
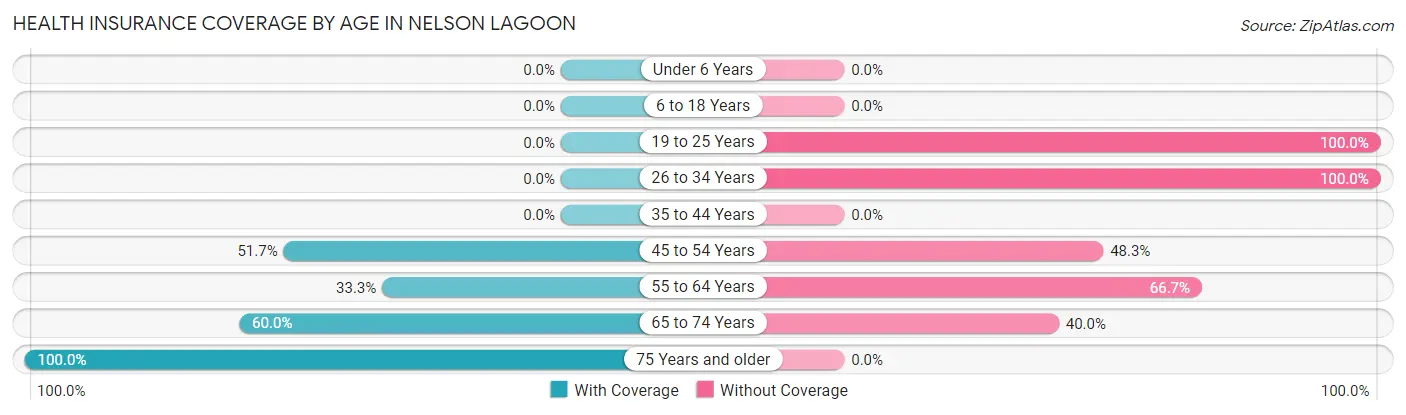
| Age Bracket | With Coverage | Without Coverage |
| Under 6 Years | 0 (0.0%) | 0 (0.0%) |
| 6 to 18 Years | 0 (0.0%) | 0 (0.0%) |
| 19 to 25 Years | 0 (0.0%) | 26 (100.0%) |
| 26 to 34 Years | 0 (0.0%) | 5 (100.0%) |
| 35 to 44 Years | 0 (0.0%) | 0 (0.0%) |
| 45 to 54 Years | 15 (51.7%) | 14 (48.3%) |
| 55 to 64 Years | 4 (33.3%) | 8 (66.7%) |
| 65 to 74 Years | 9 (60.0%) | 6 (40.0%) |
| 75 Years and older | 7 (100.0%) | 0 (0.0%) |
| Total | 35 (37.2%) | 59 (62.8%) |
Health Insurance Coverage by Citizenship Status in Nelson Lagoon
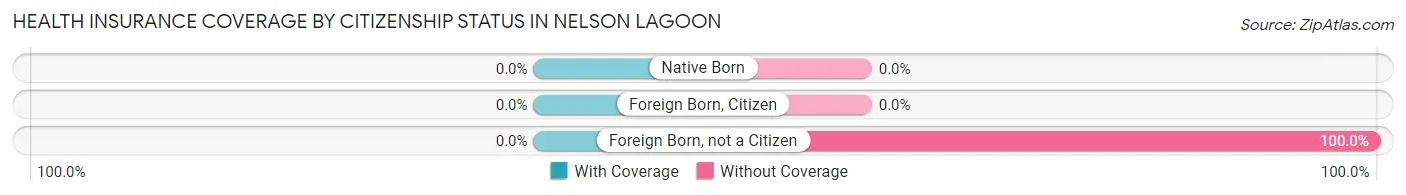
| Citizenship Status | With Coverage | Without Coverage |
| Native Born | 0 (0.0%) | 0 (0.0%) |
| Foreign Born, Citizen | 0 (0.0%) | 0 (0.0%) |
| Foreign Born, not a Citizen | 0 (0.0%) | 26 (100.0%) |
Health Insurance Coverage by Household Income in Nelson Lagoon
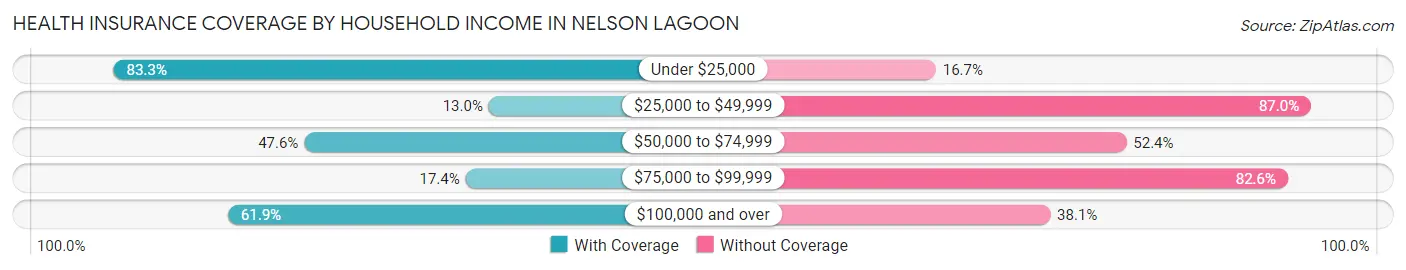
| Household Income | With Coverage | Without Coverage |
| Under $25,000 | 5 (83.3%) | 1 (16.7%) |
| $25,000 to $49,999 | 3 (13.0%) | 20 (87.0%) |
| $50,000 to $74,999 | 10 (47.6%) | 11 (52.4%) |
| $75,000 to $99,999 | 4 (17.4%) | 19 (82.6%) |
| $100,000 and over | 13 (61.9%) | 8 (38.1%) |
Public vs Private Health Insurance Coverage by Age in Nelson Lagoon
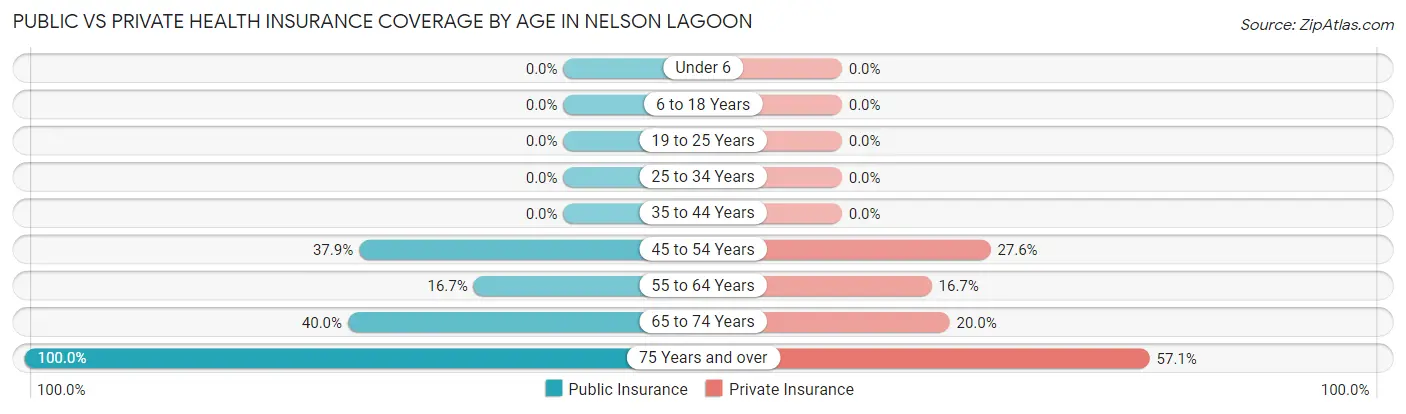
| Age Bracket | Public Insurance | Private Insurance |
| Under 6 | 0 (0.0%) | 0 (0.0%) |
| 6 to 18 Years | 0 (0.0%) | 0 (0.0%) |
| 19 to 25 Years | 0 (0.0%) | 0 (0.0%) |
| 25 to 34 Years | 0 (0.0%) | 0 (0.0%) |
| 35 to 44 Years | 0 (0.0%) | 0 (0.0%) |
| 45 to 54 Years | 11 (37.9%) | 8 (27.6%) |
| 55 to 64 Years | 2 (16.7%) | 2 (16.7%) |
| 65 to 74 Years | 6 (40.0%) | 3 (20.0%) |
| 75 Years and over | 7 (100.0%) | 4 (57.1%) |
| Total | 26 (27.7%) | 17 (18.1%) |
Disability Status by Sex by Age in Nelson Lagoon
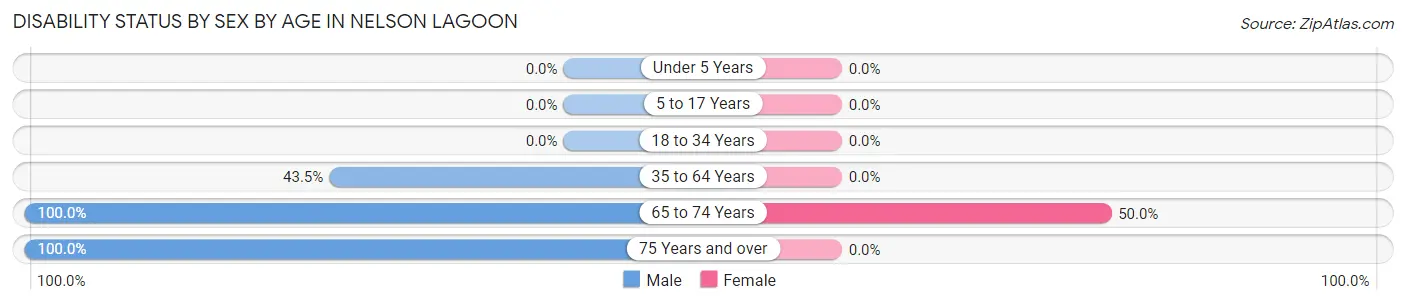
| Age Bracket | Male | Female |
| Under 5 Years | 0 (0.0%) | 0 (0.0%) |
| 5 to 17 Years | 0 (0.0%) | 0 (0.0%) |
| 18 to 34 Years | 0 (0.0%) | 0 (0.0%) |
| 35 to 64 Years | 10 (43.5%) | 0 (0.0%) |
| 65 to 74 Years | 9 (100.0%) | 3 (50.0%) |
| 75 Years and over | 3 (100.0%) | 0 (0.0%) |
Disability Class by Sex by Age in Nelson Lagoon
Disability Class: Hearing Difficulty
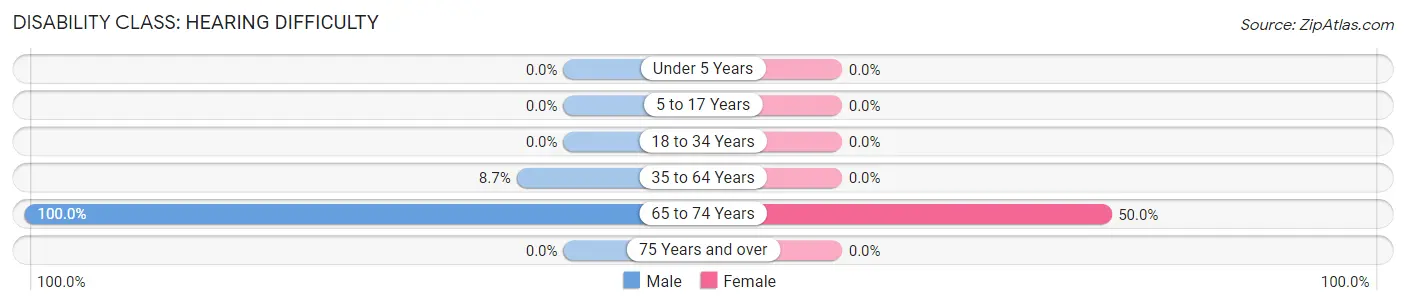
| Age Bracket | Male | Female |
| Under 5 Years | 0 (0.0%) | 0 (0.0%) |
| 5 to 17 Years | 0 (0.0%) | 0 (0.0%) |
| 18 to 34 Years | 0 (0.0%) | 0 (0.0%) |
| 35 to 64 Years | 2 (8.7%) | 0 (0.0%) |
| 65 to 74 Years | 9 (100.0%) | 3 (50.0%) |
| 75 Years and over | 0 (0.0%) | 0 (0.0%) |
Disability Class: Vision Difficulty
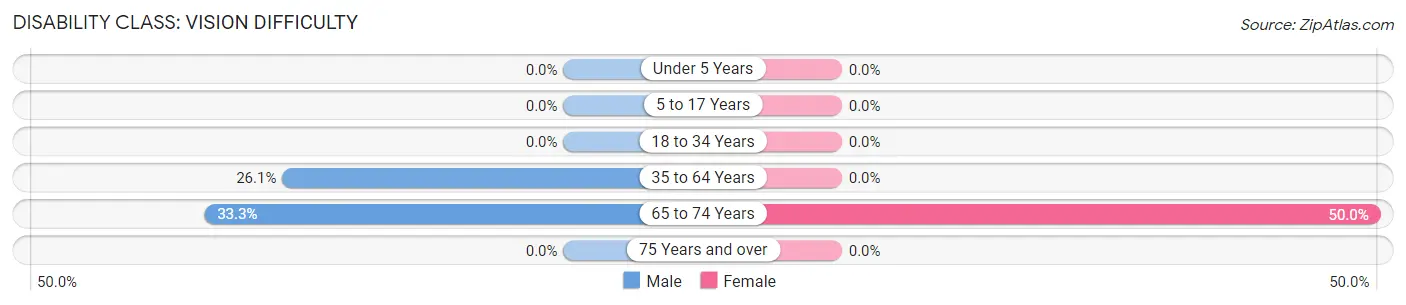
| Age Bracket | Male | Female |
| Under 5 Years | 0 (0.0%) | 0 (0.0%) |
| 5 to 17 Years | 0 (0.0%) | 0 (0.0%) |
| 18 to 34 Years | 0 (0.0%) | 0 (0.0%) |
| 35 to 64 Years | 6 (26.1%) | 0 (0.0%) |
| 65 to 74 Years | 3 (33.3%) | 3 (50.0%) |
| 75 Years and over | 0 (0.0%) | 0 (0.0%) |
Disability Class: Cognitive Difficulty
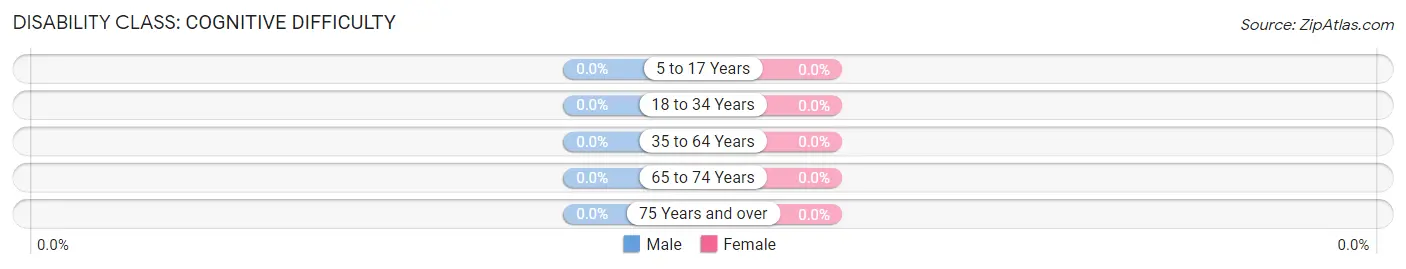
| Age Bracket | Male | Female |
| 5 to 17 Years | 0 (0.0%) | 0 (0.0%) |
| 18 to 34 Years | 0 (0.0%) | 0 (0.0%) |
| 35 to 64 Years | 0 (0.0%) | 0 (0.0%) |
| 65 to 74 Years | 0 (0.0%) | 0 (0.0%) |
| 75 Years and over | 0 (0.0%) | 0 (0.0%) |
Disability Class: Ambulatory Difficulty
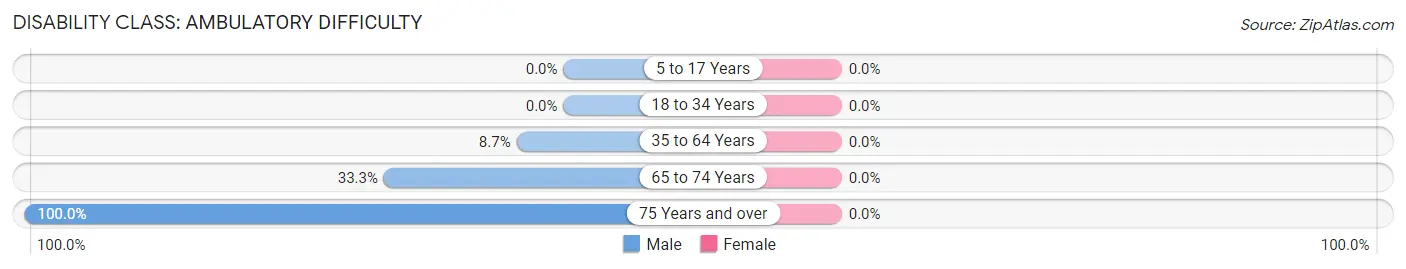
| Age Bracket | Male | Female |
| 5 to 17 Years | 0 (0.0%) | 0 (0.0%) |
| 18 to 34 Years | 0 (0.0%) | 0 (0.0%) |
| 35 to 64 Years | 2 (8.7%) | 0 (0.0%) |
| 65 to 74 Years | 3 (33.3%) | 0 (0.0%) |
| 75 Years and over | 3 (100.0%) | 0 (0.0%) |
Disability Class: Self-Care Difficulty
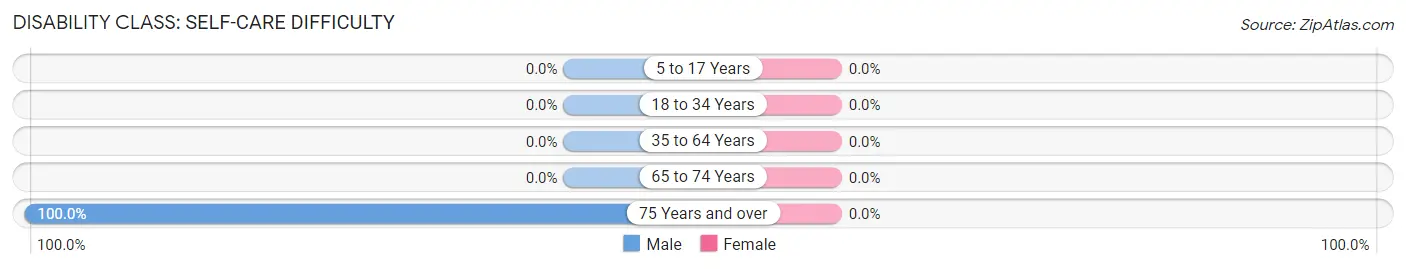
| Age Bracket | Male | Female |
| 5 to 17 Years | 0 (0.0%) | 0 (0.0%) |
| 18 to 34 Years | 0 (0.0%) | 0 (0.0%) |
| 35 to 64 Years | 0 (0.0%) | 0 (0.0%) |
| 65 to 74 Years | 0 (0.0%) | 0 (0.0%) |
| 75 Years and over | 3 (100.0%) | 0 (0.0%) |
Technology Access in Nelson Lagoon
Computing Device Access in Nelson Lagoon
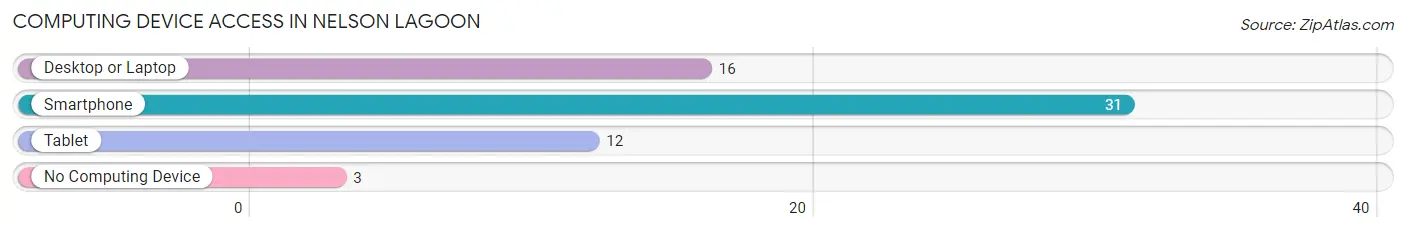
| Device Type | # Households | % Households |
| Desktop or Laptop | 16 | 47.1% |
| Smartphone | 31 | 91.2% |
| Tablet | 12 | 35.3% |
| No Computing Device | 3 | 8.8% |
| Total | 34 | 100.0% |
Internet Access in Nelson Lagoon
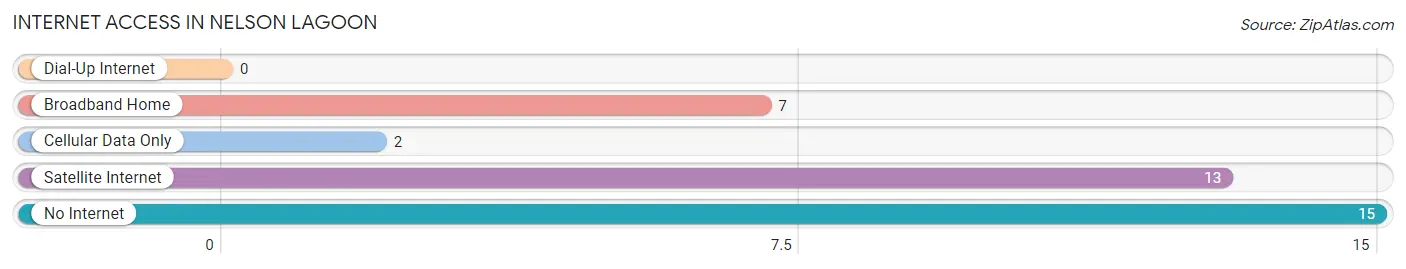
| Internet Type | # Households | % Households |
| Dial-Up Internet | 0 | 0.0% |
| Broadband Home | 7 | 20.6% |
| Cellular Data Only | 2 | 5.9% |
| Satellite Internet | 13 | 38.2% |
| No Internet | 15 | 44.1% |
| Total | 34 | 100.0% |
Nelson Lagoon Summary
Nelson Lagoon is a small unincorporated community located on the Alaska Peninsula in the Aleutians East Borough of Alaska. It is located on the western shore of the lagoon of the same name, which is part of the Bering Sea. The community is accessible by air and sea, and is home to a population of approximately 100 people.
History
Nelson Lagoon has a long and varied history. The area was first inhabited by the Unangan people, also known as the Aleut, who had lived in the area for thousands of years prior to the arrival of Europeans. The first recorded contact with Europeans was in 1741, when the Russian explorer Vitus Bering sailed through the area. The Russians established a trading post in the area in 1786, and the Unangan people were forced to work as laborers in the fur trade.
In 1867, the United States purchased Alaska from Russia, and the area around Nelson Lagoon became part of the newly formed Alaska Territory. In the late 19th century, the area was home to a number of commercial fishing operations, and the population of the area began to grow. In the early 20th century, the area was home to a number of canneries, and the population continued to grow.
In the 1950s, the area was home to a number of military installations, including a radar station and a naval air station. The military presence in the area brought a number of jobs to the area, and the population continued to grow. In the late 20th century, the military installations were closed, and the population of the area began to decline.
Geography
Nelson Lagoon is located on the western shore of the lagoon of the same name, which is part of the Bering Sea. The lagoon is approximately 8 miles long and 2 miles wide, and is surrounded by a number of small islands. The area is characterized by a rugged coastline, with rocky cliffs and sandy beaches. The area is also home to a number of small streams and rivers, as well as a number of lakes.
The climate of the area is subarctic, with cold winters and mild summers. The average temperature in the summer is around 50°F, and the average temperature in the winter is around 20°F. The area receives an average of 40 inches of precipitation per year, with most of the precipitation falling in the form of snow.
Economy
The economy of Nelson Lagoon is largely based on fishing and tourism. The area is home to a number of commercial fishing operations, and the local economy is heavily dependent on the fishing industry. The area is also home to a number of tourist attractions, including a number of lodges and resorts.
The area is also home to a number of small businesses, including a grocery store, a post office, and a number of restaurants. The area is also home to a number of small-scale manufacturing operations, including a fish processing plant and a woodworking shop.
Demographics
As of the 2010 census, the population of Nelson Lagoon was 100 people, with a population density of 0.2 people per square mile. The racial makeup of the area was 95.0% White, 0.0% African American, 0.0% Native American, 0.0% Asian, 0.0% Pacific Islander, 0.0% from other races, and 5.0% from two or more races. The median household income in the area was $37,500, and the median family income was $41,250. The per capita income in the area was $17,500.
Common Questions
What is Per Capita Income in Nelson Lagoon?
Per Capita income in Nelson Lagoon is $29,718.
What is the Median Family Income in Nelson Lagoon?
Median Family Income in Nelson Lagoon is $52,500.
What is the Median Household income in Nelson Lagoon?
Median Household Income in Nelson Lagoon is $58,750.
What is Inequality or Gini Index in Nelson Lagoon?
Inequality or Gini Index in Nelson Lagoon is 0.31.
What is the Total Population of Nelson Lagoon?
Total Population of Nelson Lagoon is 94.
What is the Total Male Population of Nelson Lagoon?
Total Male Population of Nelson Lagoon is 58.
What is the Total Female Population of Nelson Lagoon?
Total Female Population of Nelson Lagoon is 36.
What is the Ratio of Males per 100 Females in Nelson Lagoon?
There are 161.11 Males per 100 Females in Nelson Lagoon.
What is the Ratio of Females per 100 Males in Nelson Lagoon?
There are 62.07 Females per 100 Males in Nelson Lagoon.
What is the Median Population Age in Nelson Lagoon?
Median Population Age in Nelson Lagoon is 50.4 Years.
What is the Average Family Size in Nelson Lagoon
Average Family Size in Nelson Lagoon is 3.0 People.
What is the Average Household Size in Nelson Lagoon
Average Household Size in Nelson Lagoon is 2.8 People.
How Large is the Labor Force in Nelson Lagoon?
There are 52 People in the Labor Forcein in Nelson Lagoon.
What is the Percentage of People in the Labor Force in Nelson Lagoon?
55.3% of People are in the Labor Force in Nelson Lagoon.