Naknek, AK Map & Demographics
Naknek Map
Naknek Overview
$43,602
PER CAPITA INCOME
$93,750
AVG FAMILY INCOME
$88,333
AVG HOUSEHOLD INCOME
21.8%
WAGE / INCOME GAP [ % ]
78.2¢/ $1
WAGE / INCOME GAP [ $ ]
0.40
INEQUALITY / GINI INDEX
418
TOTAL POPULATION
261
MALE POPULATION
157
FEMALE POPULATION
166.24
MALES / 100 FEMALES
60.15
FEMALES / 100 MALES
32.6
MEDIAN AGE
2.9
AVG FAMILY SIZE
2.4
AVG HOUSEHOLD SIZE
210
LABOR FORCE [ PEOPLE ]
59.5%
PERCENT IN LABOR FORCE
2.9%
UNEMPLOYMENT RATE
Naknek Zip Codes
Naknek Area Codes
Income in Naknek
Income Overview in Naknek
Per Capita Income in Naknek is $43,602, while median incomes of families and households are $93,750 and $88,333 respectively.
| Characteristic | Number | Measure |
| Per Capita Income | 418 | $43,602 |
| Median Family Income | 80 | $93,750 |
| Mean Family Income | 80 | $117,506 |
| Median Household Income | 132 | $88,333 |
| Mean Household Income | 132 | $110,706 |
| Income Deficit | 80 | $0 |
| Wage / Income Gap (%) | 418 | 21.76% |
| Wage / Income Gap ($) | 418 | 78.24¢ per $1 |
| Gini / Inequality Index | 418 | 0.40 |
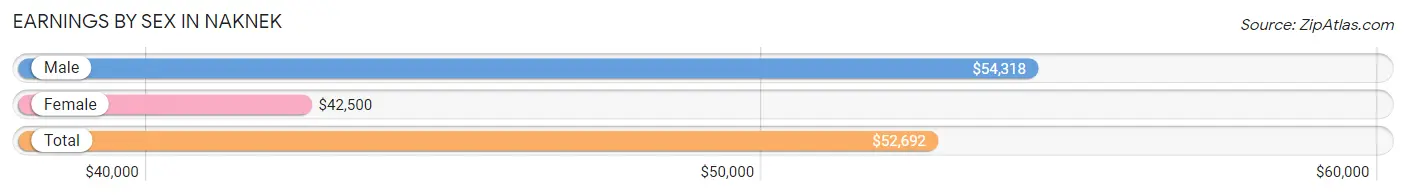
Earnings by Sex in Naknek
Average Earnings in Naknek are $52,692, $54,318 for men and $42,500 for women, a difference of 21.8%.
| Sex | Number | Average Earnings |
| Male | 176 (67.2%) | $54,318 |
| Female | 86 (32.8%) | $42,500 |
| Total | 262 (100.0%) | $52,692 |
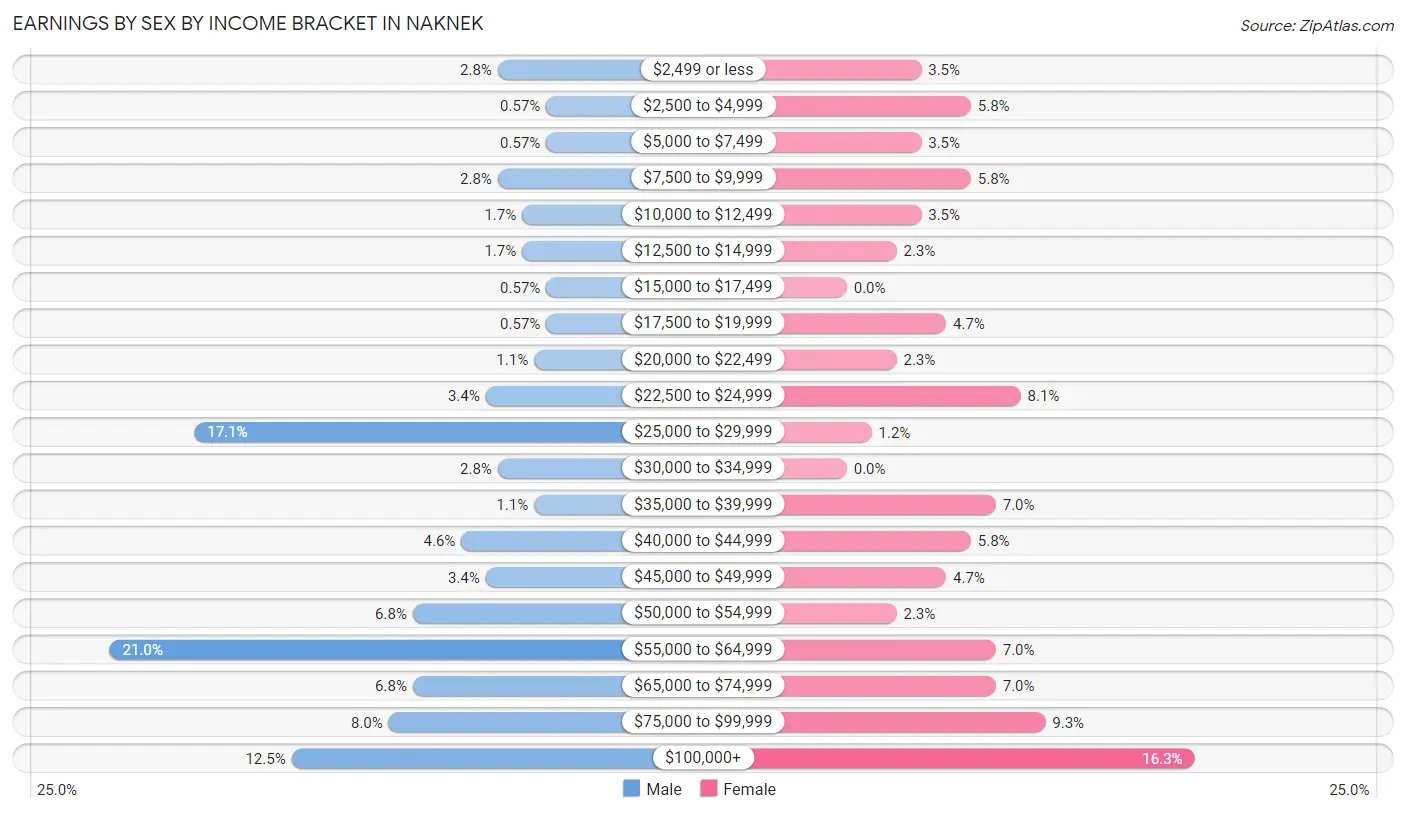
Earnings by Sex by Income Bracket in Naknek
The most common earnings brackets in Naknek are $55,000 to $64,999 for men (37 | 21.0%) and $100,000+ for women (14 | 16.3%).
| Income | Male | Female |
| $2,499 or less | 5 (2.8%) | 3 (3.5%) |
| $2,500 to $4,999 | 1 (0.6%) | 5 (5.8%) |
| $5,000 to $7,499 | 1 (0.6%) | 3 (3.5%) |
| $7,500 to $9,999 | 5 (2.8%) | 5 (5.8%) |
| $10,000 to $12,499 | 3 (1.7%) | 3 (3.5%) |
| $12,500 to $14,999 | 3 (1.7%) | 2 (2.3%) |
| $15,000 to $17,499 | 1 (0.6%) | 0 (0.0%) |
| $17,500 to $19,999 | 1 (0.6%) | 4 (4.6%) |
| $20,000 to $22,499 | 2 (1.1%) | 2 (2.3%) |
| $22,500 to $24,999 | 6 (3.4%) | 7 (8.1%) |
| $25,000 to $29,999 | 30 (17.1%) | 1 (1.2%) |
| $30,000 to $34,999 | 5 (2.8%) | 0 (0.0%) |
| $35,000 to $39,999 | 2 (1.1%) | 6 (7.0%) |
| $40,000 to $44,999 | 8 (4.5%) | 5 (5.8%) |
| $45,000 to $49,999 | 6 (3.4%) | 4 (4.6%) |
| $50,000 to $54,999 | 12 (6.8%) | 2 (2.3%) |
| $55,000 to $64,999 | 37 (21.0%) | 6 (7.0%) |
| $65,000 to $74,999 | 12 (6.8%) | 6 (7.0%) |
| $75,000 to $99,999 | 14 (8.0%) | 8 (9.3%) |
| $100,000+ | 22 (12.5%) | 14 (16.3%) |
| Total | 176 (100.0%) | 86 (100.0%) |
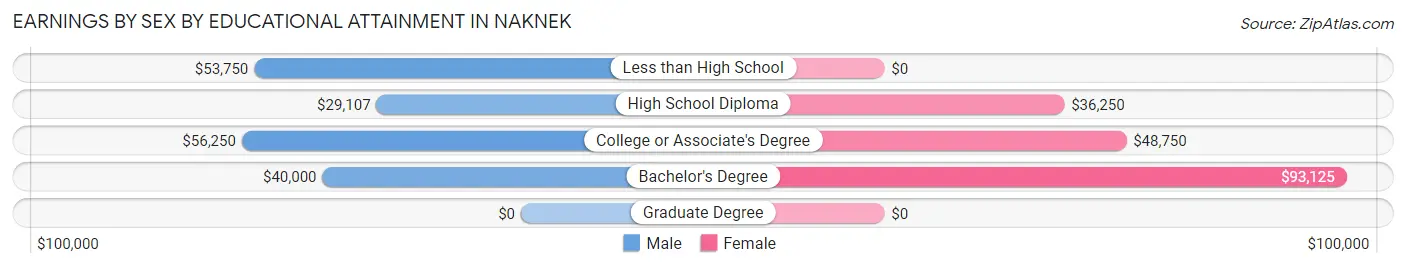
Earnings by Sex by Educational Attainment in Naknek
Average earnings in Naknek are $53,977 for men and $45,625 for women, a difference of 15.5%. Men with an educational attainment of college or associate's degree enjoy the highest average annual earnings of $56,250, while those with high school diploma education earn the least with $29,107. Women with an educational attainment of bachelor's degree earn the most with the average annual earnings of $93,125, while those with high school diploma education have the smallest earnings of $36,250.
| Educational Attainment | Male Income | Female Income |
| Less than High School | $53,750 | $0 |
| High School Diploma | $29,107 | $36,250 |
| College or Associate's Degree | $56,250 | $48,750 |
| Bachelor's Degree | $40,000 | $93,125 |
| Graduate Degree | - | - |
| Total | $53,977 | $45,625 |
Family Income in Naknek
Family Income Brackets in Naknek
According to the Naknek family income data, there are 21 families falling into the $100,000 to $149,999 income range, which is the most common income bracket and makes up 26.3% of all families.
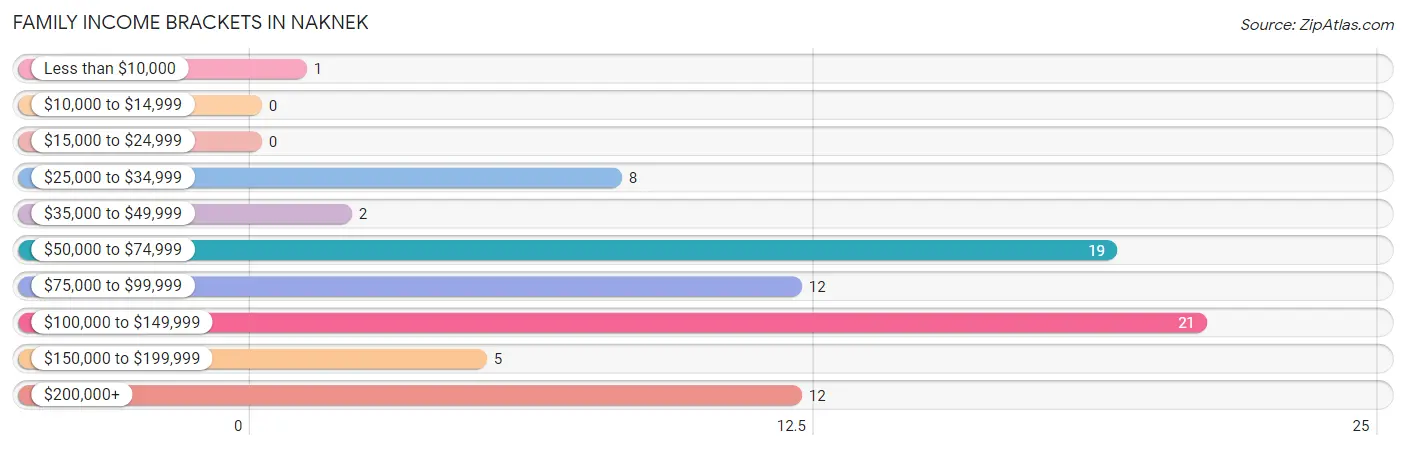
| Income Bracket | # Families | % Families |
| Less than $10,000 | 1 | 1.3% |
| $10,000 to $14,999 | 0 | 0.0% |
| $15,000 to $24,999 | 0 | 0.0% |
| $25,000 to $34,999 | 8 | 10.0% |
| $35,000 to $49,999 | 2 | 2.5% |
| $50,000 to $74,999 | 19 | 23.8% |
| $75,000 to $99,999 | 12 | 15.0% |
| $100,000 to $149,999 | 21 | 26.3% |
| $150,000 to $199,999 | 5 | 6.3% |
| $200,000+ | 12 | 15.0% |
Family Income by Famaliy Size in Naknek
3-person families (14 | 17.5%) account for the highest median family income in Naknek with $128,750 per family, while 2-person families (45 | 56.2%) have the highest median income of $43,958 per family member.
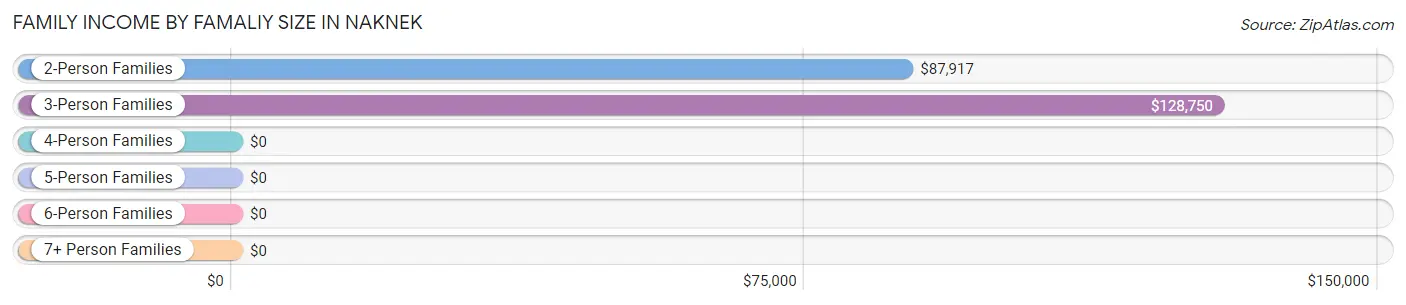
| Income Bracket | # Families | Median Income |
| 2-Person Families | 45 (56.2%) | $87,917 |
| 3-Person Families | 14 (17.5%) | $128,750 |
| 4-Person Families | 10 (12.5%) | $0 |
| 5-Person Families | 6 (7.5%) | $0 |
| 6-Person Families | 2 (2.5%) | $0 |
| 7+ Person Families | 3 (3.7%) | $0 |
| Total | 80 (100.0%) | $93,750 |
Family Income by Number of Earners in Naknek
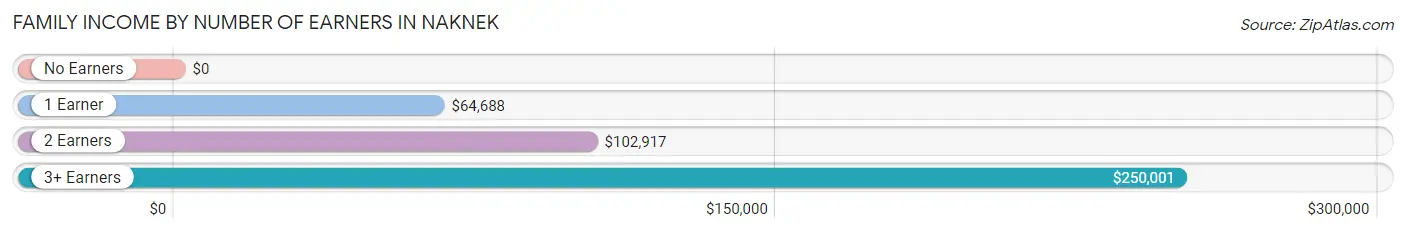
| Number of Earners | # Families | Median Income |
| No Earners | 6 (7.5%) | $0 |
| 1 Earner | 25 (31.2%) | $64,688 |
| 2 Earners | 43 (53.7%) | $102,917 |
| 3+ Earners | 6 (7.5%) | $250,001 |
| Total | 80 (100.0%) | $93,750 |
Household Income in Naknek
Household Income Brackets in Naknek
With 28 households falling in the category, the $50,000 to $74,999 income range is the most frequent in Naknek, accounting for 21.2% of all households. In contrast, only 1 households (0.8%) fall into the less than $10,000 income bracket, making it the least populous group.
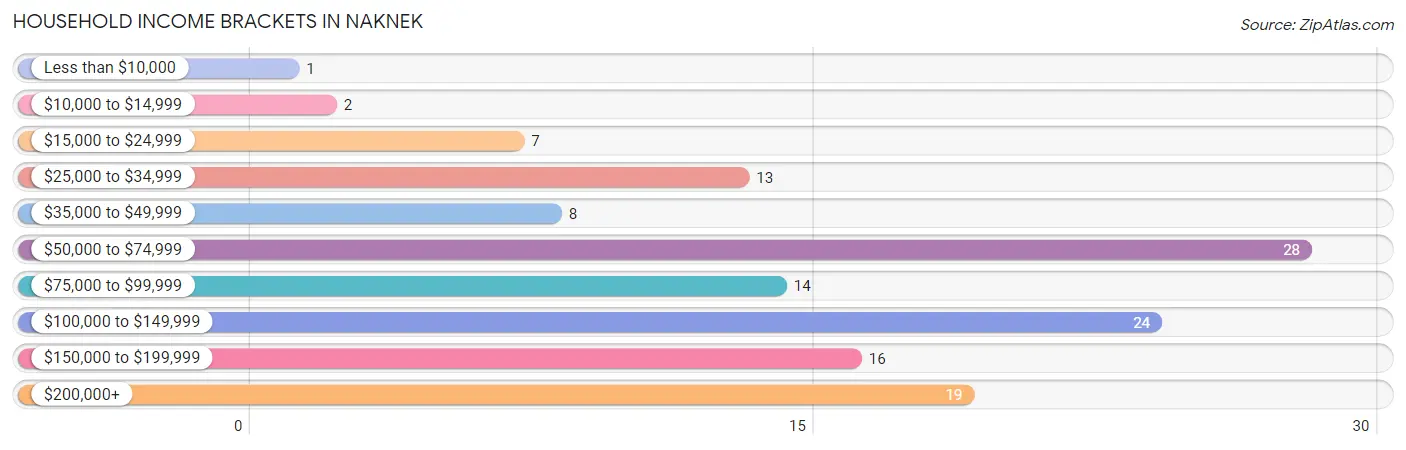
| Income Bracket | # Households | % Households |
| Less than $10,000 | 1 | 0.8% |
| $10,000 to $14,999 | 2 | 1.5% |
| $15,000 to $24,999 | 7 | 5.3% |
| $25,000 to $34,999 | 13 | 9.8% |
| $35,000 to $49,999 | 8 | 6.1% |
| $50,000 to $74,999 | 28 | 21.2% |
| $75,000 to $99,999 | 14 | 10.6% |
| $100,000 to $149,999 | 24 | 18.2% |
| $150,000 to $199,999 | 16 | 12.1% |
| $200,000+ | 19 | 14.4% |
Household Income by Householder Age in Naknek
The median household income in Naknek is $88,333, with the highest median household income of $106,250 found in the 45 to 64 years age bracket for the primary householder. A total of 48 households (36.4%) fall into this category. Meanwhile, the 15 to 24 years age bracket for the primary householder has the lowest median household income of $0, with 4 households (3.0%) in this group.
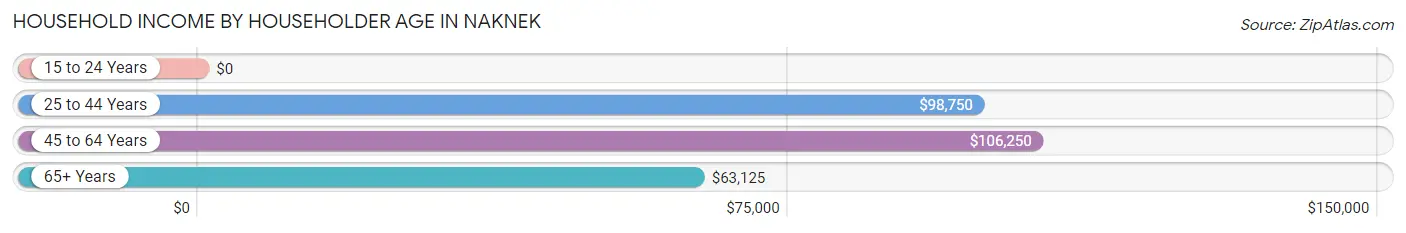
| Income Bracket | # Households | Median Income |
| 15 to 24 Years | 4 (3.0%) | $0 |
| 25 to 44 Years | 46 (34.8%) | $98,750 |
| 45 to 64 Years | 48 (36.4%) | $106,250 |
| 65+ Years | 34 (25.8%) | $63,125 |
| Total | 132 (100.0%) | $88,333 |
Poverty in Naknek
Income Below Poverty by Sex and Age in Naknek
With 16.6% poverty level for males and 10.3% for females among the residents of Naknek, 25 to 34 year old males and 16 and 17 year old females are the most vulnerable to poverty, with 38 males (40.4%) and 4 females (66.7%) in their respective age groups living below the poverty level.
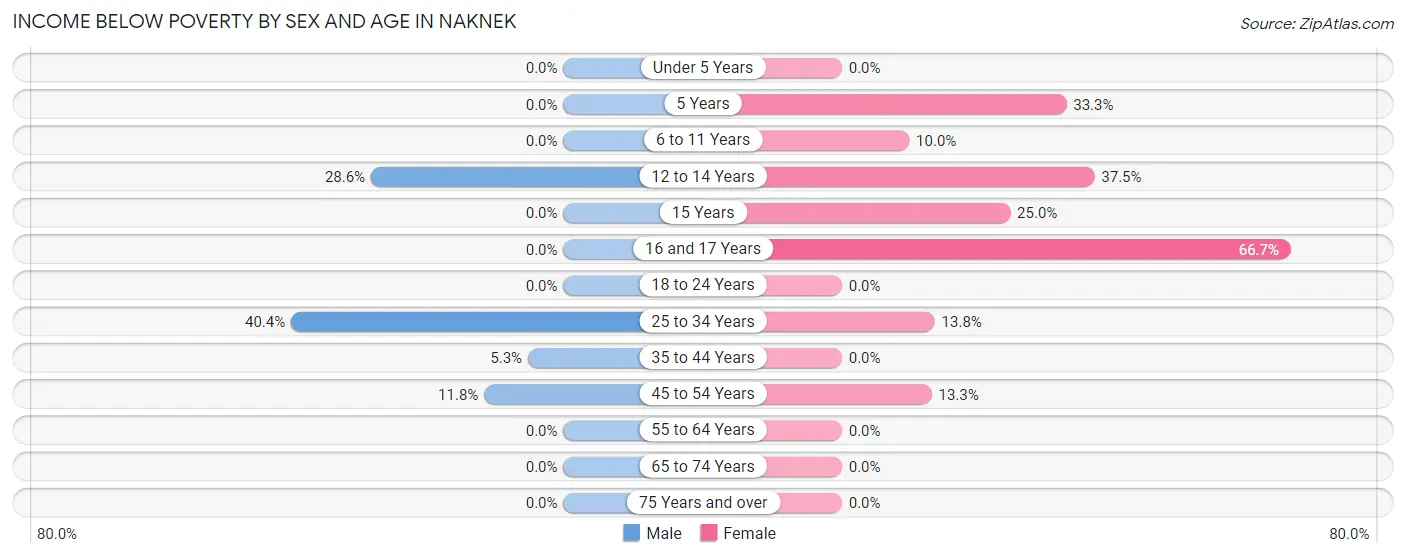
| Age Bracket | Male | Female |
| Under 5 Years | 0 (0.0%) | 0 (0.0%) |
| 5 Years | 0 (0.0%) | 1 (33.3%) |
| 6 to 11 Years | 0 (0.0%) | 1 (10.0%) |
| 12 to 14 Years | 2 (28.6%) | 3 (37.5%) |
| 15 Years | 0 (0.0%) | 1 (25.0%) |
| 16 and 17 Years | 0 (0.0%) | 4 (66.7%) |
| 18 to 24 Years | 0 (0.0%) | 0 (0.0%) |
| 25 to 34 Years | 38 (40.4%) | 4 (13.8%) |
| 35 to 44 Years | 1 (5.3%) | 0 (0.0%) |
| 45 to 54 Years | 2 (11.8%) | 2 (13.3%) |
| 55 to 64 Years | 0 (0.0%) | 0 (0.0%) |
| 65 to 74 Years | 0 (0.0%) | 0 (0.0%) |
| 75 Years and over | 0 (0.0%) | 0 (0.0%) |
| Total | 43 (16.6%) | 16 (10.3%) |
Income Above Poverty by Sex and Age in Naknek
According to the poverty statistics in Naknek, males aged under 5 years and females aged under 5 years are the age groups that are most secure financially, with 100.0% of males and 100.0% of females in these age groups living above the poverty line.
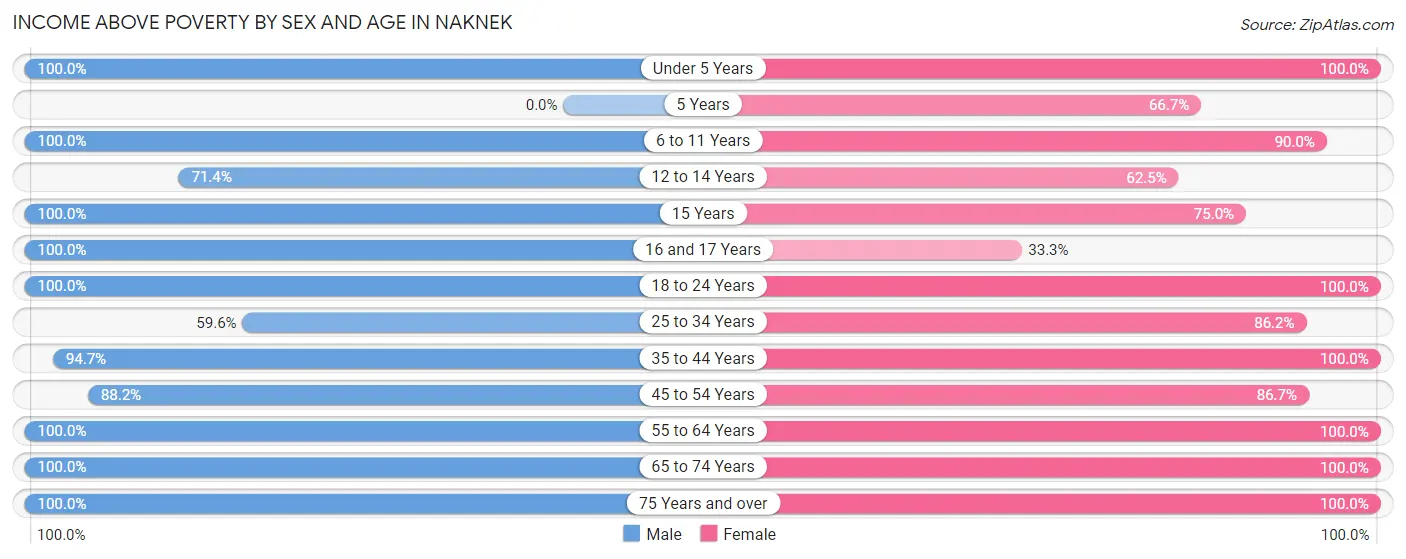
| Age Bracket | Male | Female |
| Under 5 Years | 8 (100.0%) | 10 (100.0%) |
| 5 Years | 0 (0.0%) | 2 (66.7%) |
| 6 to 11 Years | 11 (100.0%) | 9 (90.0%) |
| 12 to 14 Years | 5 (71.4%) | 5 (62.5%) |
| 15 Years | 1 (100.0%) | 3 (75.0%) |
| 16 and 17 Years | 1 (100.0%) | 2 (33.3%) |
| 18 to 24 Years | 21 (100.0%) | 4 (100.0%) |
| 25 to 34 Years | 56 (59.6%) | 25 (86.2%) |
| 35 to 44 Years | 18 (94.7%) | 10 (100.0%) |
| 45 to 54 Years | 15 (88.2%) | 13 (86.7%) |
| 55 to 64 Years | 58 (100.0%) | 31 (100.0%) |
| 65 to 74 Years | 8 (100.0%) | 13 (100.0%) |
| 75 Years and over | 14 (100.0%) | 13 (100.0%) |
| Total | 216 (83.4%) | 140 (89.7%) |
Income Below Poverty Among Married-Couple Families in Naknek
The poverty statistics for married-couple families in Naknek show that 3.4% or 2 of the total 59 families live below the poverty line. Families with 3 or 4 children have the highest poverty rate of 22.2%, comprising of 2 families. On the other hand, families with no children have the lowest poverty rate of 0.0%, which includes 0 families.
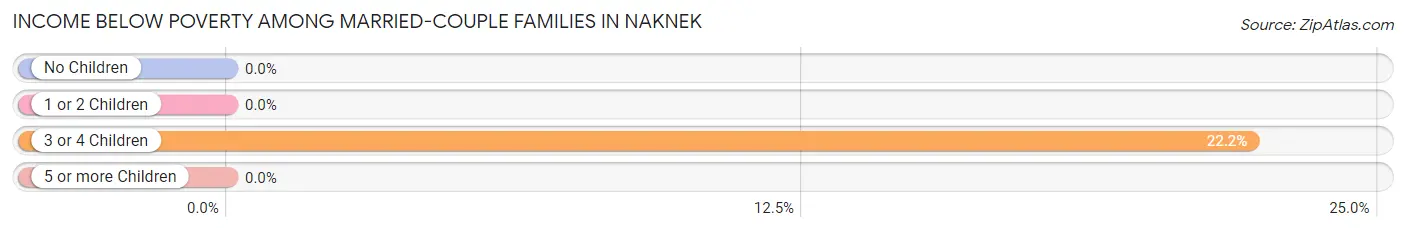
| Children | Above Poverty | Below Poverty |
| No Children | 41 (100.0%) | 0 (0.0%) |
| 1 or 2 Children | 8 (100.0%) | 0 (0.0%) |
| 3 or 4 Children | 7 (77.8%) | 2 (22.2%) |
| 5 or more Children | 1 (100.0%) | 0 (0.0%) |
| Total | 57 (96.6%) | 2 (3.4%) |
Income Below Poverty Among Single-Parent Households in Naknek
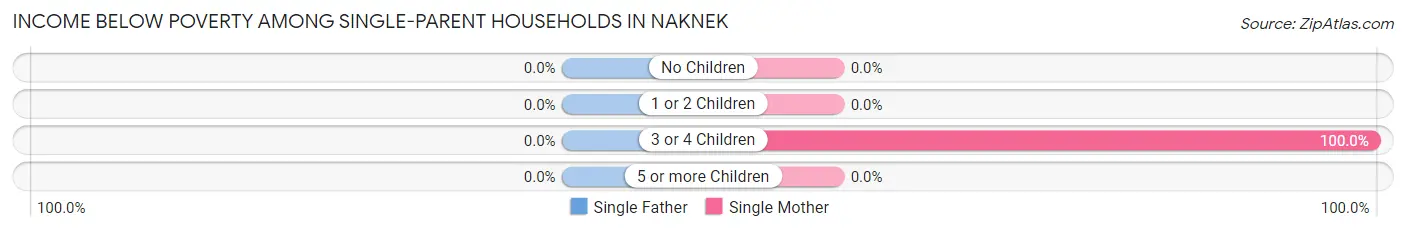
| Children | Single Father | Single Mother |
| No Children | 0 (0.0%) | 0 (0.0%) |
| 1 or 2 Children | 0 (0.0%) | 0 (0.0%) |
| 3 or 4 Children | 0 (0.0%) | 1 (100.0%) |
| 5 or more Children | 0 (0.0%) | 0 (0.0%) |
| Total | 0 (0.0%) | 1 (7.7%) |
Income Below Poverty Among Married-Couple vs Single-Parent Households in Naknek
The poverty data for Naknek shows that 2 of the married-couple family households (3.4%) and 1 of the single-parent households (4.8%) are living below the poverty level. Within the married-couple family households, those with 3 or 4 children have the highest poverty rate, with 2 households (22.2%) falling below the poverty line. Among the single-parent households, those with 3 or 4 children have the highest poverty rate, with 1 household (100.0%) living below poverty.
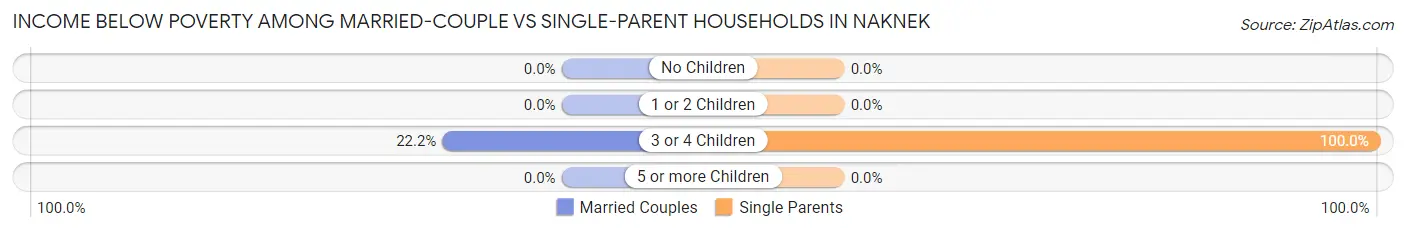
| Children | Married-Couple Families | Single-Parent Households |
| No Children | 0 (0.0%) | 0 (0.0%) |
| 1 or 2 Children | 0 (0.0%) | 0 (0.0%) |
| 3 or 4 Children | 2 (22.2%) | 1 (100.0%) |
| 5 or more Children | 0 (0.0%) | 0 (0.0%) |
| Total | 2 (3.4%) | 1 (4.8%) |
Race in Naknek
The most populous races in Naknek are White / Caucasian (183 | 43.8%), Native / Alaskan (148 | 35.4%), and Two or more Races (44 | 10.5%).
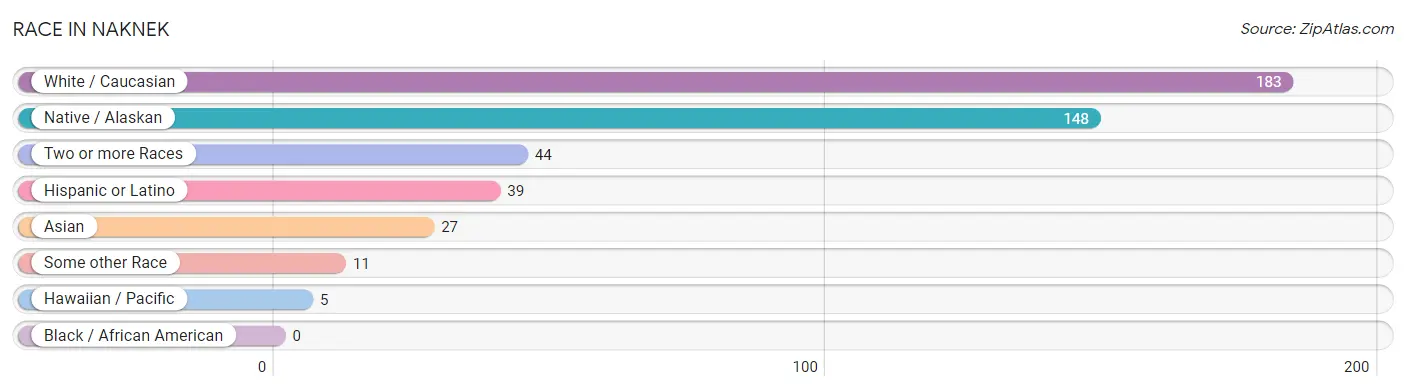
| Race | # Population | % Population |
| Asian | 27 | 6.5% |
| Black / African American | 0 | 0.0% |
| Hawaiian / Pacific | 5 | 1.2% |
| Hispanic or Latino | 39 | 9.3% |
| Native / Alaskan | 148 | 35.4% |
| White / Caucasian | 183 | 43.8% |
| Two or more Races | 44 | 10.5% |
| Some other Race | 11 | 2.6% |
| Total | 418 | 100.0% |
Ancestry in Naknek
The most populous ancestries reported in Naknek are Aleut (88 | 21.0%), Yup'ik (63 | 15.1%), German (36 | 8.6%), Eastern European (27 | 6.5%), and Korean (27 | 6.5%), together accounting for 57.7% of all Naknek residents.
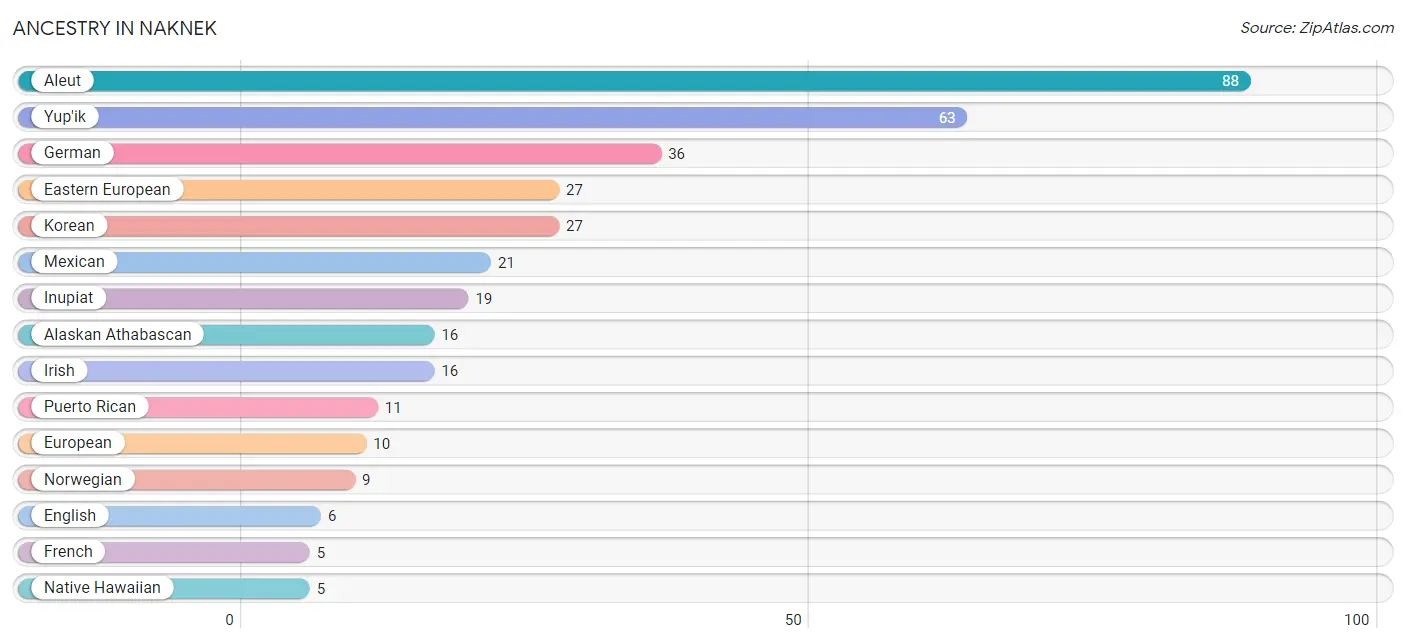
| Ancestry | # Population | % Population |
| Alaska Native | 2 | 0.5% |
| Alaskan Athabascan | 16 | 3.8% |
| Aleut | 88 | 21.0% |
| Danish | 2 | 0.5% |
| Dutch | 4 | 1.0% |
| Eastern European | 27 | 6.5% |
| English | 6 | 1.4% |
| European | 10 | 2.4% |
| Finnish | 1 | 0.2% |
| French | 5 | 1.2% |
| French Canadian | 2 | 0.5% |
| German | 36 | 8.6% |
| Inupiat | 19 | 4.5% |
| Irish | 16 | 3.8% |
| Italian | 3 | 0.7% |
| Korean | 27 | 6.5% |
| Mexican | 21 | 5.0% |
| Native Hawaiian | 5 | 1.2% |
| Northern European | 1 | 0.2% |
| Norwegian | 9 | 2.1% |
| Polish | 2 | 0.5% |
| Puerto Rican | 11 | 2.6% |
| Scandinavian | 2 | 0.5% |
| Scotch-Irish | 1 | 0.2% |
| Scottish | 3 | 0.7% |
| South African | 1 | 0.2% |
| Spaniard | 1 | 0.2% |
| Spanish | 2 | 0.5% |
| Subsaharan African | 1 | 0.2% |
| Swedish | 3 | 0.7% |
| Tlingit-Haida | 1 | 0.2% |
| Welsh | 3 | 0.7% |
| Yugoslavian | 2 | 0.5% |
| Yup'ik | 63 | 15.1% | View All 34 Rows |
Immigrants in Naknek
The most numerous immigrant groups reported in Naknek came from Europe (30 | 7.2%), Asia (27 | 6.5%), Philippines (27 | 6.5%), South Eastern Asia (27 | 6.5%), and Central America (10 | 2.4%), together accounting for 28.9% of all Naknek residents.
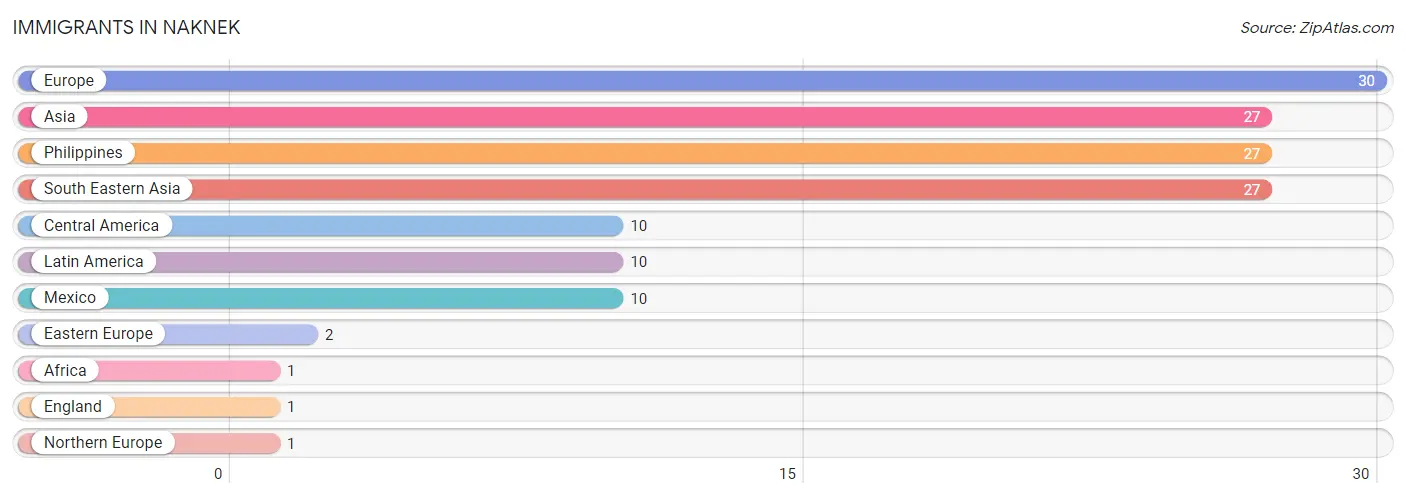
| Immigration Origin | # Population | % Population |
| Africa | 1 | 0.2% |
| Asia | 27 | 6.5% |
| Central America | 10 | 2.4% |
| Eastern Europe | 2 | 0.5% |
| England | 1 | 0.2% |
| Europe | 30 | 7.2% |
| Latin America | 10 | 2.4% |
| Mexico | 10 | 2.4% |
| Northern Europe | 1 | 0.2% |
| Philippines | 27 | 6.5% |
| South Eastern Asia | 27 | 6.5% | View All 11 Rows |
Sex and Age in Naknek
Sex and Age in Naknek
The most populous age groups in Naknek are 25 to 29 Years (81 | 31.0%) for men and 55 to 59 Years (19 | 12.1%) for women.
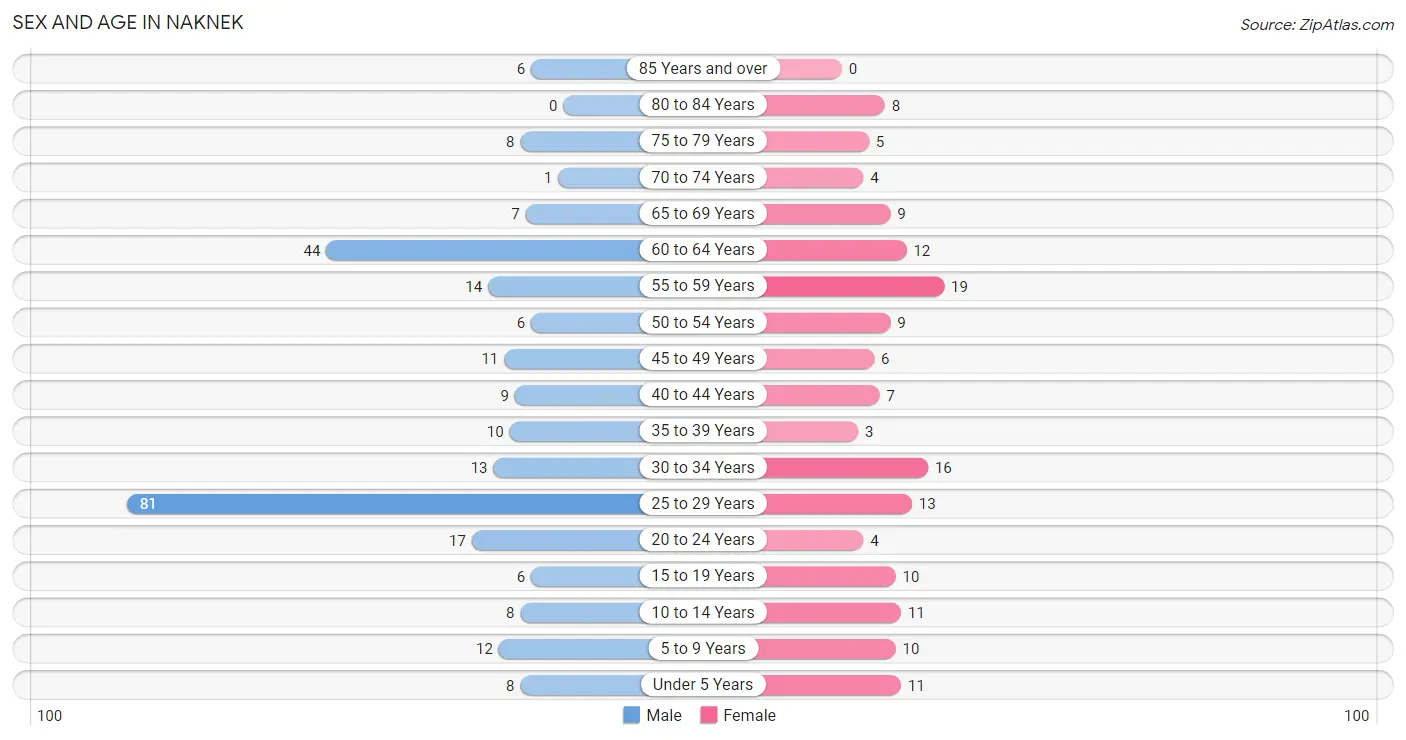
| Age Bracket | Male | Female |
| Under 5 Years | 8 (3.1%) | 11 (7.0%) |
| 5 to 9 Years | 12 (4.6%) | 10 (6.4%) |
| 10 to 14 Years | 8 (3.1%) | 11 (7.0%) |
| 15 to 19 Years | 6 (2.3%) | 10 (6.4%) |
| 20 to 24 Years | 17 (6.5%) | 4 (2.5%) |
| 25 to 29 Years | 81 (31.0%) | 13 (8.3%) |
| 30 to 34 Years | 13 (5.0%) | 16 (10.2%) |
| 35 to 39 Years | 10 (3.8%) | 3 (1.9%) |
| 40 to 44 Years | 9 (3.5%) | 7 (4.5%) |
| 45 to 49 Years | 11 (4.2%) | 6 (3.8%) |
| 50 to 54 Years | 6 (2.3%) | 9 (5.7%) |
| 55 to 59 Years | 14 (5.4%) | 19 (12.1%) |
| 60 to 64 Years | 44 (16.9%) | 12 (7.6%) |
| 65 to 69 Years | 7 (2.7%) | 9 (5.7%) |
| 70 to 74 Years | 1 (0.4%) | 4 (2.5%) |
| 75 to 79 Years | 8 (3.1%) | 5 (3.2%) |
| 80 to 84 Years | 0 (0.0%) | 8 (5.1%) |
| 85 Years and over | 6 (2.3%) | 0 (0.0%) |
| Total | 261 (100.0%) | 157 (100.0%) |
Families and Households in Naknek
Median Family Size in Naknek
The median family size in Naknek is 2.88 persons per family, with married-couple families (59 | 73.8%) accounting for the largest median family size of 3 persons per family. On the other hand, single male/father families (8 | 10.0%) represent the smallest median family size with 2.50 persons per family.
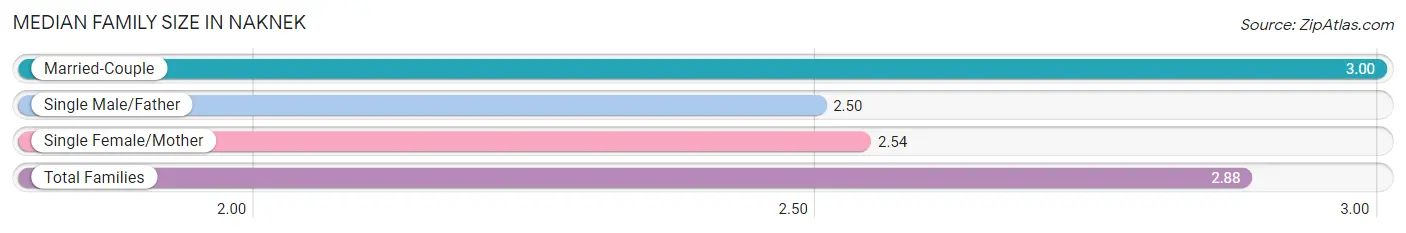
| Family Type | # Families | Family Size |
| Married-Couple | 59 (73.8%) | 3.00 |
| Single Male/Father | 8 (10.0%) | 2.50 |
| Single Female/Mother | 13 (16.3%) | 2.54 |
| Total Families | 80 (100.0%) | 2.88 |
Median Household Size in Naknek
The median household size in Naknek is 2.44 persons per household, with married-couple households (59 | 44.7%) accounting for the largest median household size of 3.08 persons per household. non-family households (52 | 39.4%) represent the smallest median household size with 1.62 persons per household.
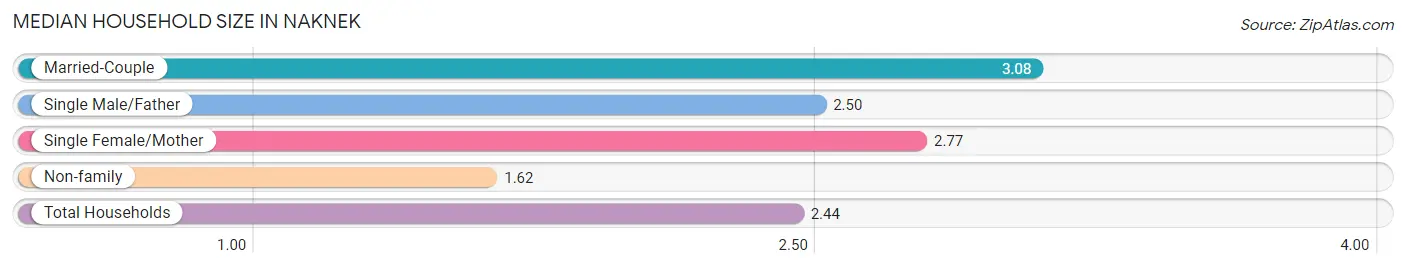
| Household Type | # Households | Household Size |
| Married-Couple | 59 (44.7%) | 3.08 |
| Single Male/Father | 8 (6.1%) | 2.50 |
| Single Female/Mother | 13 (9.9%) | 2.77 |
| Non-family | 52 (39.4%) | 1.62 |
| Total Households | 132 (100.0%) | 2.44 |
Household Size by Marriage Status in Naknek
Out of a total of 132 households in Naknek, 80 (60.6%) are family households, while 52 (39.4%) are nonfamily households. The most numerous type of family households are 2-person households, comprising 44, and the most common type of nonfamily households are 1-person households, comprising 28.
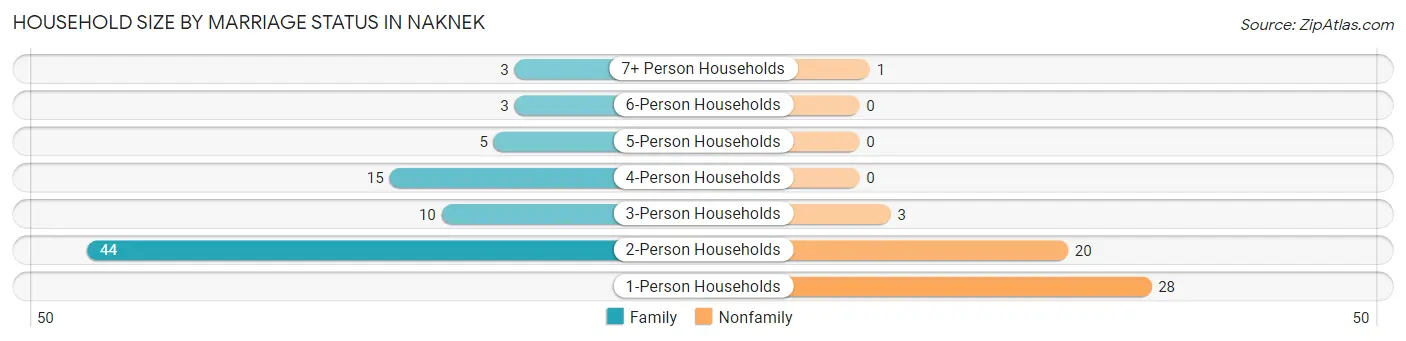
| Household Size | Family Households | Nonfamily Households |
| 1-Person Households | - | 28 (21.2%) |
| 2-Person Households | 44 (33.3%) | 20 (15.1%) |
| 3-Person Households | 10 (7.6%) | 3 (2.3%) |
| 4-Person Households | 15 (11.4%) | 0 (0.0%) |
| 5-Person Households | 5 (3.8%) | 0 (0.0%) |
| 6-Person Households | 3 (2.3%) | 0 (0.0%) |
| 7+ Person Households | 3 (2.3%) | 1 (0.8%) |
| Total | 80 (60.6%) | 52 (39.4%) |
Female Fertility in Naknek
Fertility by Age in Naknek
Average fertility rate in Naknek is 98.0 births per 1,000 women. Women in the age bracket of 20 to 34 years have the highest fertility rate with 121.0 births per 1,000 women. Women in the age bracket of 20 to 34 years acount for 66.7% of all women with births.
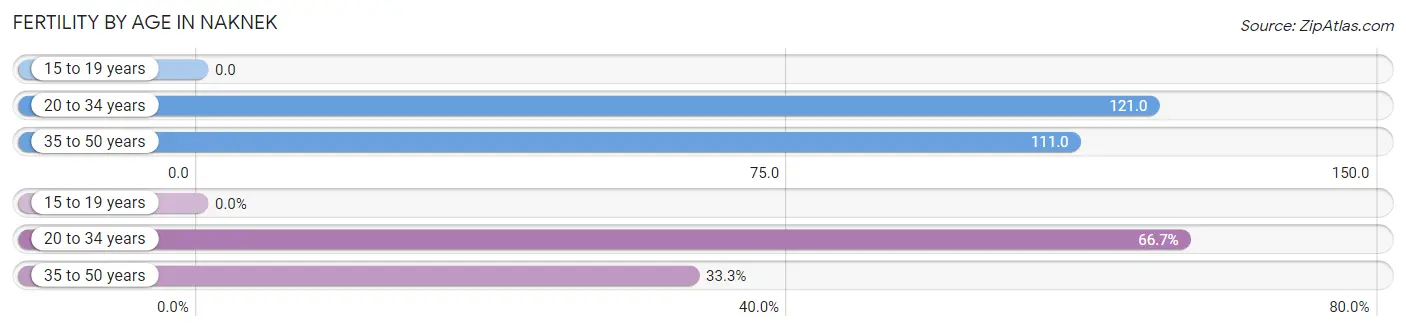
| Age Bracket | Women with Births | Births / 1,000 Women |
| 15 to 19 years | 0 (0.0%) | 0.0 |
| 20 to 34 years | 4 (66.7%) | 121.0 |
| 35 to 50 years | 2 (33.3%) | 111.0 |
| Total | 6 (100.0%) | 98.0 |
Fertility by Age by Marriage Status in Naknek
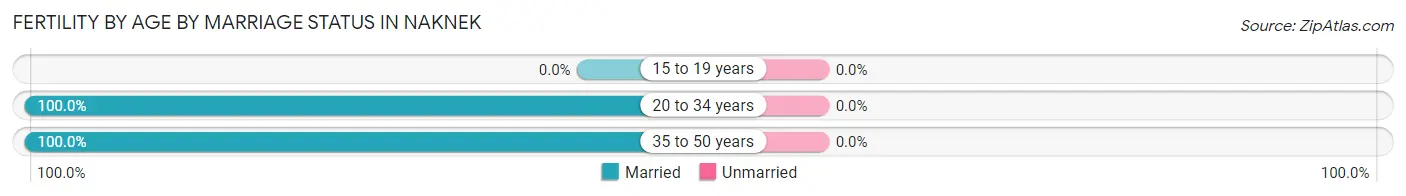
| Age Bracket | Married | Unmarried |
| 15 to 19 years | 0 (0.0%) | 0 (0.0%) |
| 20 to 34 years | 4 (100.0%) | 0 (0.0%) |
| 35 to 50 years | 2 (100.0%) | 0 (0.0%) |
| Total | 6 (100.0%) | 0 (0.0%) |
Fertility by Education in Naknek
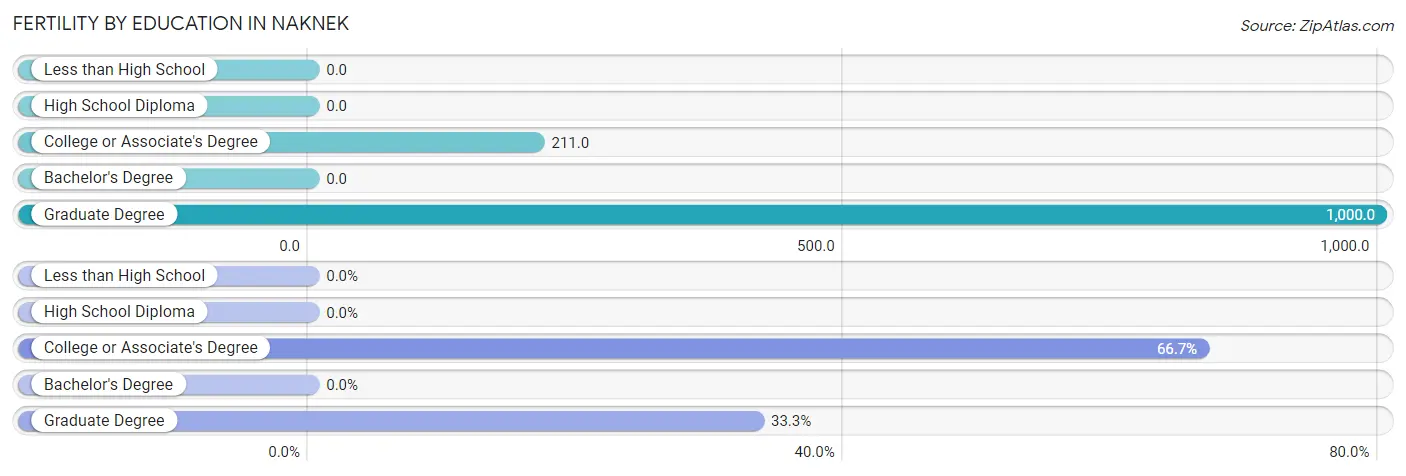
| Educational Attainment | Women with Births | Births / 1,000 Women |
| Less than High School | 0 (0.0%) | 0.0 |
| High School Diploma | 0 (0.0%) | 0.0 |
| College or Associate's Degree | 4 (66.7%) | 211.0 |
| Bachelor's Degree | 0 (0.0%) | 0.0 |
| Graduate Degree | 2 (33.3%) | 1,000.0 |
| Total | 6 (100.0%) | 98.0 |
Fertility by Education by Marriage Status in Naknek

| Educational Attainment | Married | Unmarried |
| Less than High School | 0 (0.0%) | 0 (0.0%) |
| High School Diploma | 0 (0.0%) | 0 (0.0%) |
| College or Associate's Degree | 4 (100.0%) | 0 (0.0%) |
| Bachelor's Degree | 0 (0.0%) | 0 (0.0%) |
| Graduate Degree | 2 (100.0%) | 0 (0.0%) |
| Total | 6 (100.0%) | 0 (0.0%) |
Employment Characteristics in Naknek
Employment by Class of Employer in Naknek
Among the 204 employed individuals in Naknek, private company employees (90 | 44.1%), local government employees (52 | 25.5%), and not-for-profit organizations (21 | 10.3%) make up the most common classes of employment.
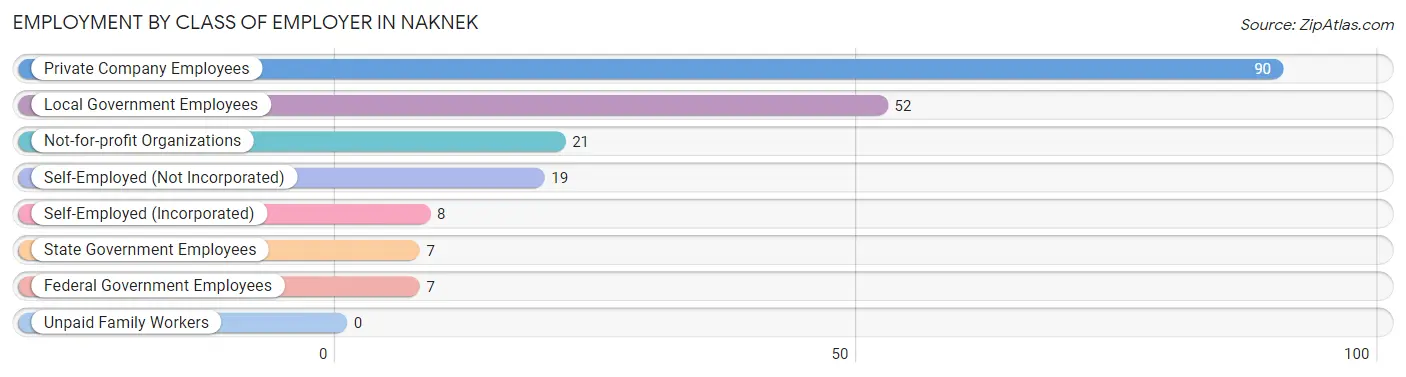
| Employer Class | # Employees | % Employees |
| Private Company Employees | 90 | 44.1% |
| Self-Employed (Incorporated) | 8 | 3.9% |
| Self-Employed (Not Incorporated) | 19 | 9.3% |
| Not-for-profit Organizations | 21 | 10.3% |
| Local Government Employees | 52 | 25.5% |
| State Government Employees | 7 | 3.4% |
| Federal Government Employees | 7 | 3.4% |
| Unpaid Family Workers | 0 | 0.0% |
| Total | 204 | 100.0% |
Employment Status by Age in Naknek
According to the labor force statistics for Naknek, out of the total population over 16 years of age (353), 59.5% or 210 individuals are in the labor force, with 2.9% or 6 of them unemployed. The age group with the highest labor force participation rate is 35 to 44 years, with 100.0% or 29 individuals in the labor force. Within the labor force, the 20 to 24 years age range has the highest percentage of unemployed individuals, with 18.8% or 4 of them being unemployed.
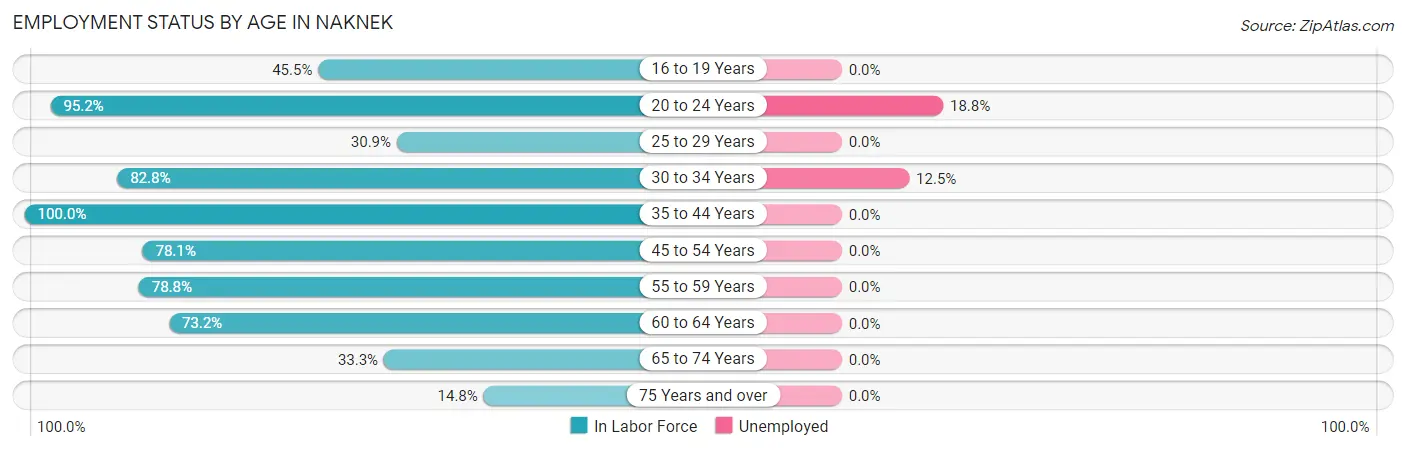
| Age Bracket | In Labor Force | Unemployed |
| 16 to 19 Years | 5 (45.5%) | 0 (0.0%) |
| 20 to 24 Years | 20 (95.2%) | 4 (18.8%) |
| 25 to 29 Years | 29 (30.9%) | 0 (0.0%) |
| 30 to 34 Years | 24 (82.8%) | 3 (12.5%) |
| 35 to 44 Years | 29 (100.0%) | 0 (0.0%) |
| 45 to 54 Years | 25 (78.1%) | 0 (0.0%) |
| 55 to 59 Years | 26 (78.8%) | 0 (0.0%) |
| 60 to 64 Years | 41 (73.2%) | 0 (0.0%) |
| 65 to 74 Years | 7 (33.3%) | 0 (0.0%) |
| 75 Years and over | 4 (14.8%) | 0 (0.0%) |
| Total | 210 (59.5%) | 6 (2.9%) |
Employment Status by Educational Attainment in Naknek
According to labor force statistics for Naknek, 63.7% of individuals (174) out of the total population between 25 and 64 years of age (273) are in the labor force, with 1.7% or 3 of them being unemployed. The group with the highest labor force participation rate are those with the educational attainment of less than high school, with 100.0% or 13 individuals in the labor force. Within the labor force, individuals with college / associate degree education have the highest percentage of unemployment, with 3.4% or 3 of them being unemployed.
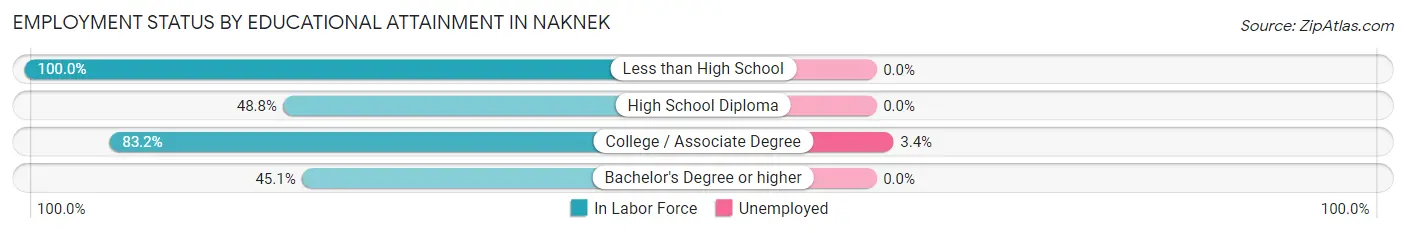
| Educational Attainment | In Labor Force | Unemployed |
| Less than High School | 13 (100.0%) | 0 (0.0%) |
| High School Diploma | 40 (48.8%) | 0 (0.0%) |
| College / Associate Degree | 89 (83.2%) | 4 (3.4%) |
| Bachelor's Degree or higher | 32 (45.1%) | 0 (0.0%) |
| Total | 174 (63.7%) | 5 (1.7%) |
Employment Occupations by Sex in Naknek
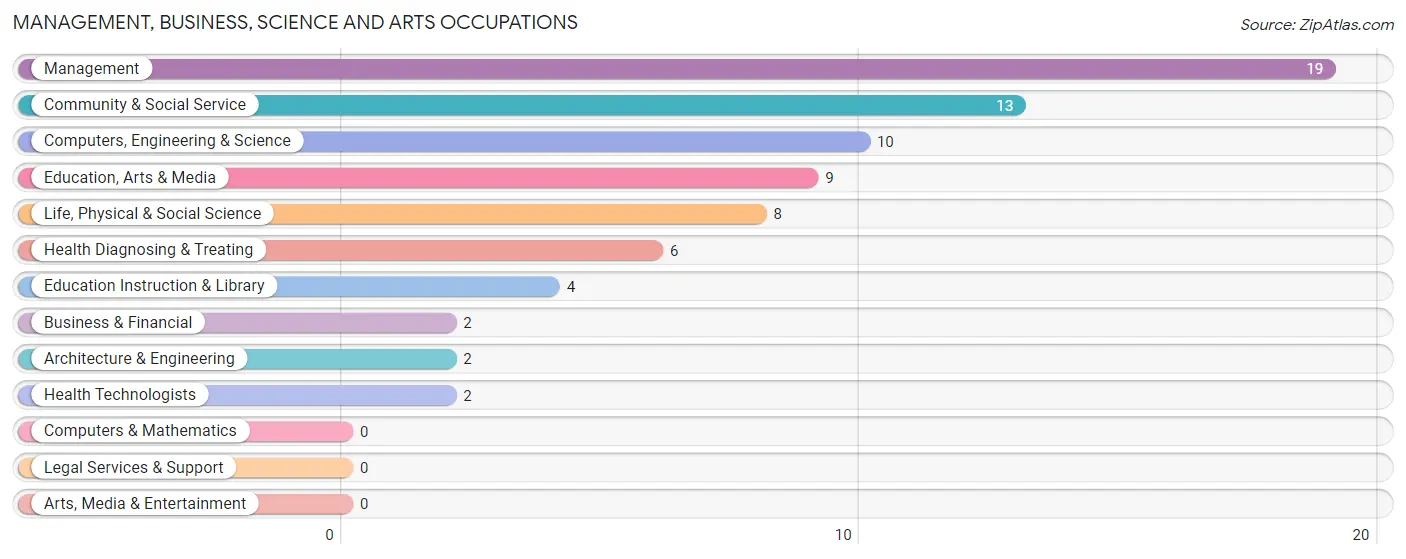
Management, Business, Science and Arts Occupations
The most common Management, Business, Science and Arts occupations in Naknek are Management (19 | 9.6%), Community & Social Service (13 | 6.5%), Computers, Engineering & Science (10 | 5.0%), Education, Arts & Media (9 | 4.5%), and Life, Physical & Social Science (8 | 4.0%).
Management, Business, Science and Arts Occupations by Sex
Within the Management, Business, Science and Arts occupations in Naknek, the most male-oriented occupations are Business & Financial (100.0%), Architecture & Engineering (100.0%), and Education, Arts & Media (55.6%), while the most female-oriented occupations are Life, Physical & Social Science (100.0%), Education Instruction & Library (100.0%), and Health Diagnosing & Treating (100.0%).
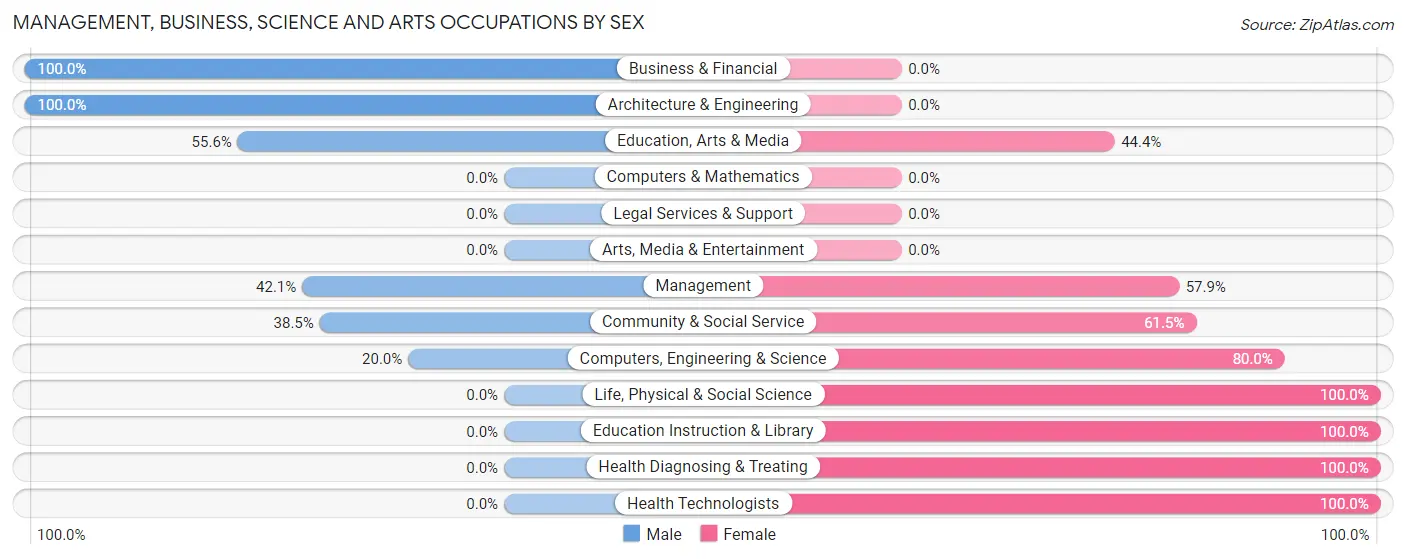
| Occupation | Male | Female |
| Management | 8 (42.1%) | 11 (57.9%) |
| Business & Financial | 2 (100.0%) | 0 (0.0%) |
| Computers, Engineering & Science | 2 (20.0%) | 8 (80.0%) |
| Computers & Mathematics | 0 (0.0%) | 0 (0.0%) |
| Architecture & Engineering | 2 (100.0%) | 0 (0.0%) |
| Life, Physical & Social Science | 0 (0.0%) | 8 (100.0%) |
| Community & Social Service | 5 (38.5%) | 8 (61.5%) |
| Education, Arts & Media | 5 (55.6%) | 4 (44.4%) |
| Legal Services & Support | 0 (0.0%) | 0 (0.0%) |
| Education Instruction & Library | 0 (0.0%) | 4 (100.0%) |
| Arts, Media & Entertainment | 0 (0.0%) | 0 (0.0%) |
| Health Diagnosing & Treating | 0 (0.0%) | 6 (100.0%) |
| Health Technologists | 0 (0.0%) | 2 (100.0%) |
| Total (Category) | 17 (34.0%) | 33 (66.0%) |
| Total (Overall) | 123 (61.8%) | 76 (38.2%) |
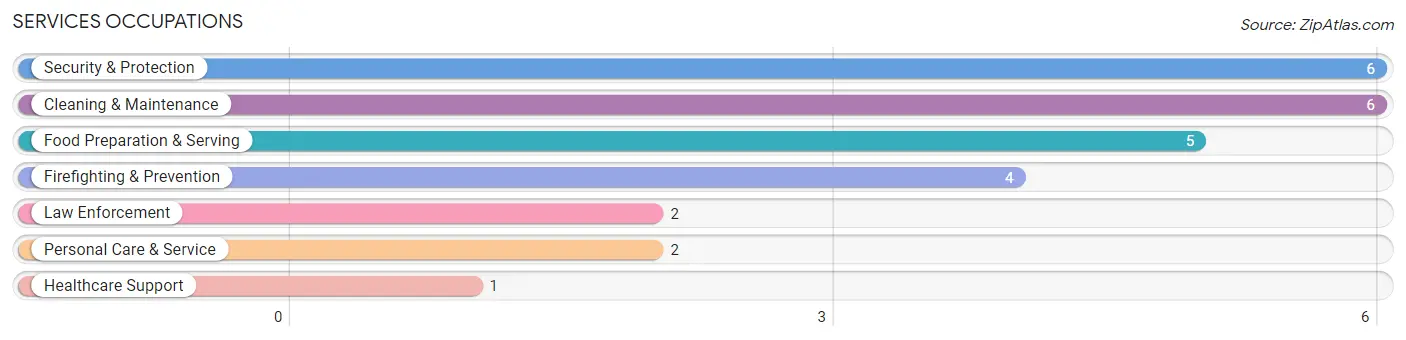
Services Occupations
The most common Services occupations in Naknek are Security & Protection (6 | 3.0%), Cleaning & Maintenance (6 | 3.0%), Food Preparation & Serving (5 | 2.5%), Firefighting & Prevention (4 | 2.0%), and Law Enforcement (2 | 1.0%).
Services Occupations by Sex
Within the Services occupations in Naknek, the most male-oriented occupations are Law Enforcement (100.0%), Security & Protection (83.3%), and Cleaning & Maintenance (83.3%), while the most female-oriented occupations are Healthcare Support (100.0%), Food Preparation & Serving (100.0%), and Personal Care & Service (50.0%).
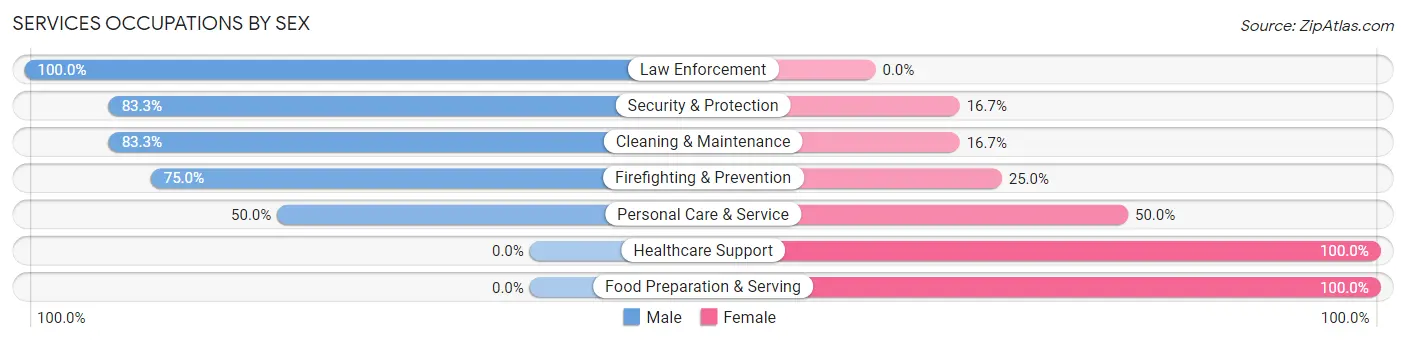
| Occupation | Male | Female |
| Healthcare Support | 0 (0.0%) | 1 (100.0%) |
| Security & Protection | 5 (83.3%) | 1 (16.7%) |
| Firefighting & Prevention | 3 (75.0%) | 1 (25.0%) |
| Law Enforcement | 2 (100.0%) | 0 (0.0%) |
| Food Preparation & Serving | 0 (0.0%) | 5 (100.0%) |
| Cleaning & Maintenance | 5 (83.3%) | 1 (16.7%) |
| Personal Care & Service | 1 (50.0%) | 1 (50.0%) |
| Total (Category) | 11 (55.0%) | 9 (45.0%) |
| Total (Overall) | 123 (61.8%) | 76 (38.2%) |
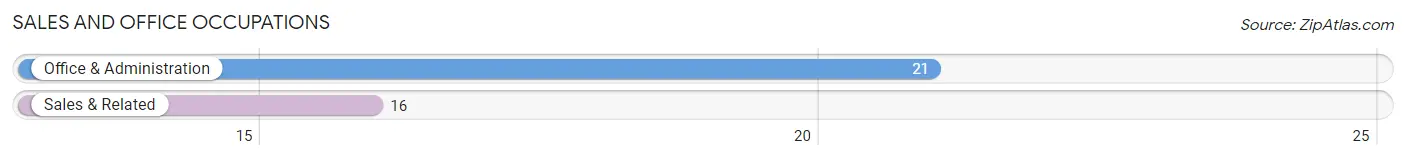
Sales and Office Occupations
The most common Sales and Office occupations in Naknek are Office & Administration (21 | 10.5%), and Sales & Related (16 | 8.0%).
Sales and Office Occupations by Sex
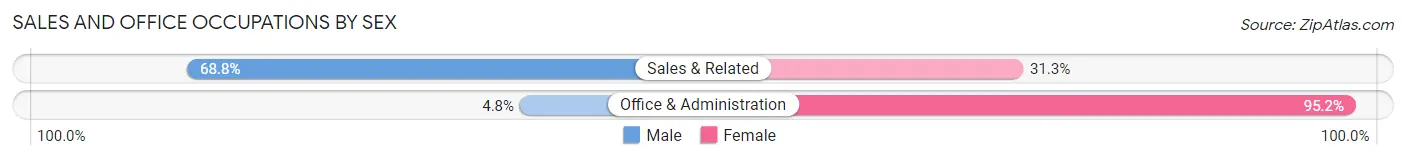
| Occupation | Male | Female |
| Sales & Related | 11 (68.8%) | 5 (31.2%) |
| Office & Administration | 1 (4.8%) | 20 (95.2%) |
| Total (Category) | 12 (32.4%) | 25 (67.6%) |
| Total (Overall) | 123 (61.8%) | 76 (38.2%) |
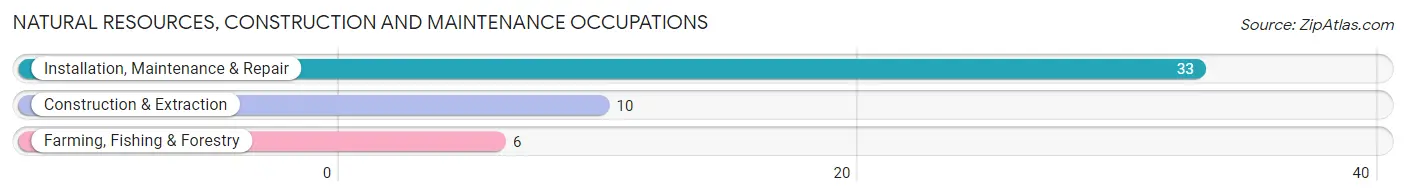
Natural Resources, Construction and Maintenance Occupations
The most common Natural Resources, Construction and Maintenance occupations in Naknek are Installation, Maintenance & Repair (33 | 16.6%), Construction & Extraction (10 | 5.0%), and Farming, Fishing & Forestry (6 | 3.0%).
Natural Resources, Construction and Maintenance Occupations by Sex
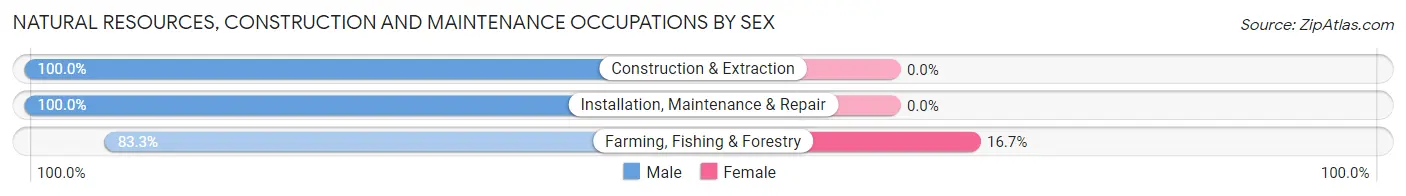
| Occupation | Male | Female |
| Farming, Fishing & Forestry | 5 (83.3%) | 1 (16.7%) |
| Construction & Extraction | 10 (100.0%) | 0 (0.0%) |
| Installation, Maintenance & Repair | 33 (100.0%) | 0 (0.0%) |
| Total (Category) | 48 (98.0%) | 1 (2.0%) |
| Total (Overall) | 123 (61.8%) | 76 (38.2%) |
Production, Transportation and Moving Occupations
The most common Production, Transportation and Moving occupations in Naknek are Material Moving (17 | 8.5%), Production (13 | 6.5%), and Transportation (13 | 6.5%).
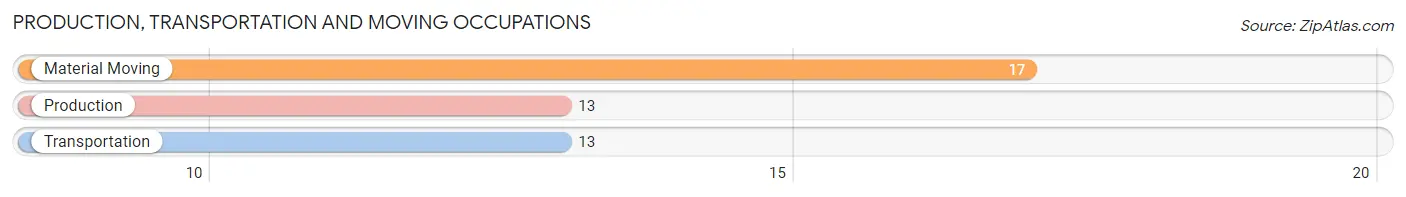
Production, Transportation and Moving Occupations by Sex
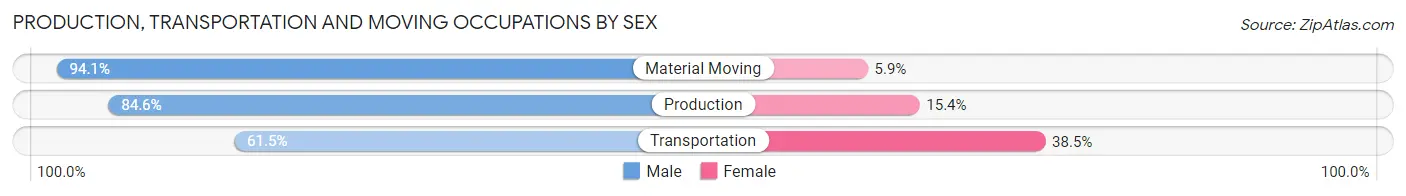
| Occupation | Male | Female |
| Production | 11 (84.6%) | 2 (15.4%) |
| Transportation | 8 (61.5%) | 5 (38.5%) |
| Material Moving | 16 (94.1%) | 1 (5.9%) |
| Total (Category) | 35 (81.4%) | 8 (18.6%) |
| Total (Overall) | 123 (61.8%) | 76 (38.2%) |
Employment Industries by Sex in Naknek
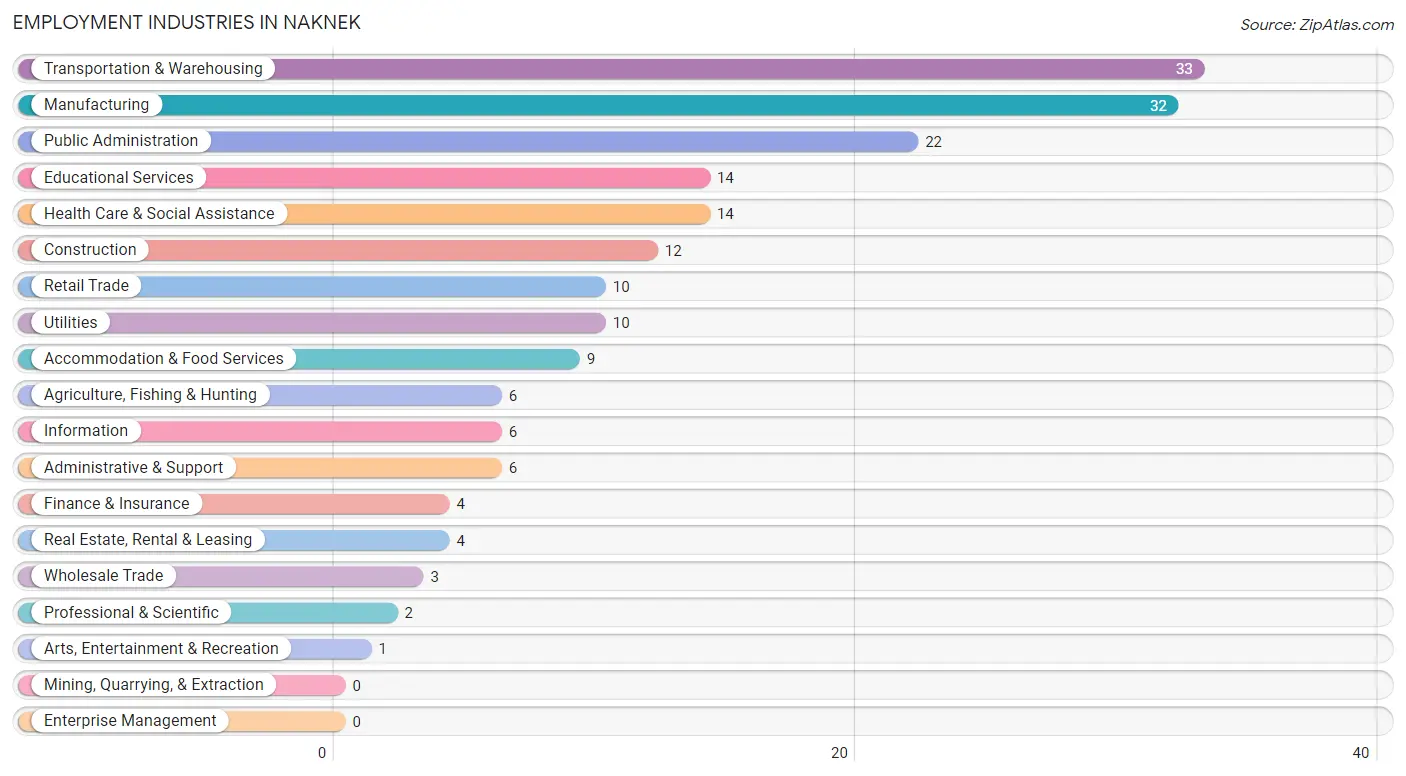
Employment Industries in Naknek
The major employment industries in Naknek include Transportation & Warehousing (33 | 16.6%), Manufacturing (32 | 16.1%), Public Administration (22 | 11.1%), Educational Services (14 | 7.0%), and Health Care & Social Assistance (14 | 7.0%).
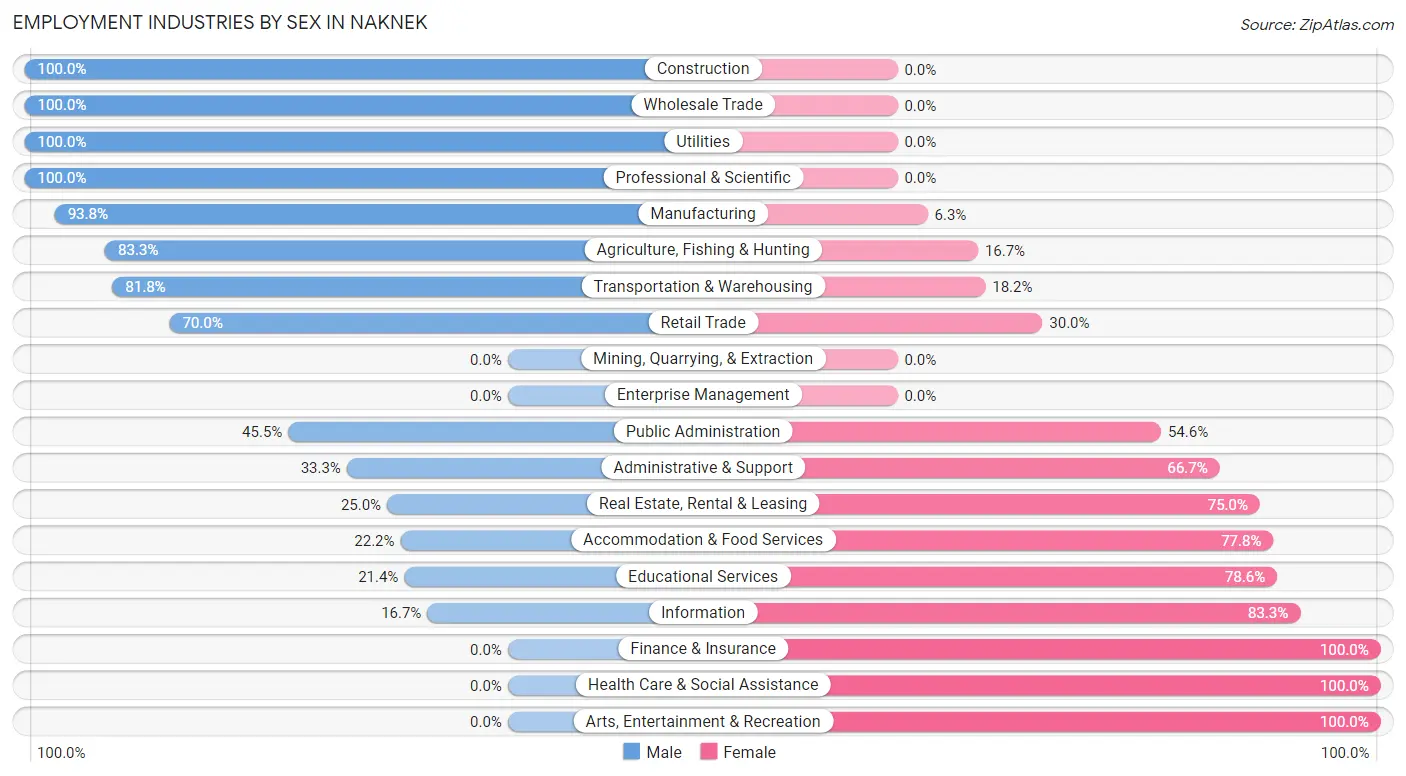
Employment Industries by Sex in Naknek
The Naknek industries that see more men than women are Construction (100.0%), Wholesale Trade (100.0%), and Utilities (100.0%), whereas the industries that tend to have a higher number of women are Finance & Insurance (100.0%), Health Care & Social Assistance (100.0%), and Arts, Entertainment & Recreation (100.0%).
| Industry | Male | Female |
| Agriculture, Fishing & Hunting | 5 (83.3%) | 1 (16.7%) |
| Mining, Quarrying, & Extraction | 0 (0.0%) | 0 (0.0%) |
| Construction | 12 (100.0%) | 0 (0.0%) |
| Manufacturing | 30 (93.8%) | 2 (6.2%) |
| Wholesale Trade | 3 (100.0%) | 0 (0.0%) |
| Retail Trade | 7 (70.0%) | 3 (30.0%) |
| Transportation & Warehousing | 27 (81.8%) | 6 (18.2%) |
| Utilities | 10 (100.0%) | 0 (0.0%) |
| Information | 1 (16.7%) | 5 (83.3%) |
| Finance & Insurance | 0 (0.0%) | 4 (100.0%) |
| Real Estate, Rental & Leasing | 1 (25.0%) | 3 (75.0%) |
| Professional & Scientific | 2 (100.0%) | 0 (0.0%) |
| Enterprise Management | 0 (0.0%) | 0 (0.0%) |
| Administrative & Support | 2 (33.3%) | 4 (66.7%) |
| Educational Services | 3 (21.4%) | 11 (78.6%) |
| Health Care & Social Assistance | 0 (0.0%) | 14 (100.0%) |
| Arts, Entertainment & Recreation | 0 (0.0%) | 1 (100.0%) |
| Accommodation & Food Services | 2 (22.2%) | 7 (77.8%) |
| Public Administration | 10 (45.5%) | 12 (54.5%) |
| Total | 123 (61.8%) | 76 (38.2%) |
Education in Naknek
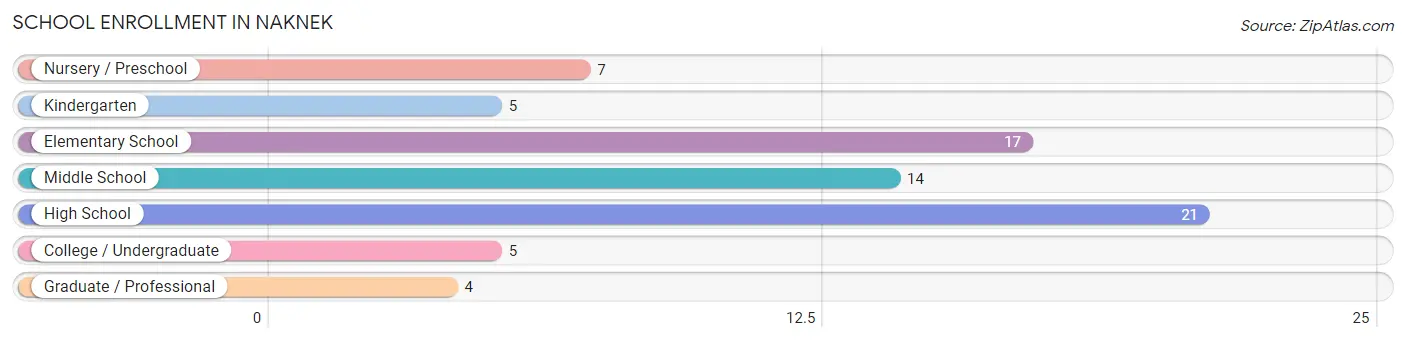
School Enrollment in Naknek
The most common levels of schooling among the 73 students in Naknek are high school (21 | 28.8%), elementary school (17 | 23.3%), and middle school (14 | 19.2%).
| School Level | # Students | % Students |
| Nursery / Preschool | 7 | 9.6% |
| Kindergarten | 5 | 6.9% |
| Elementary School | 17 | 23.3% |
| Middle School | 14 | 19.2% |
| High School | 21 | 28.8% |
| College / Undergraduate | 5 | 6.9% |
| Graduate / Professional | 4 | 5.5% |
| Total | 73 | 100.0% |
School Enrollment by Age by Funding Source in Naknek
Out of a total of 73 students who are enrolled in schools in Naknek, 9 (12.3%) attend a private institution, while the remaining 64 (87.7%) are enrolled in public schools. The age group of 25 to 34 year olds has the highest likelihood of being enrolled in private schools, with 2 (100.0% in the age bracket) enrolled. Conversely, the age group of 3 to 4 year olds has the lowest likelihood of being enrolled in a private school, with 10 (100.0% in the age bracket) attending a public institution.
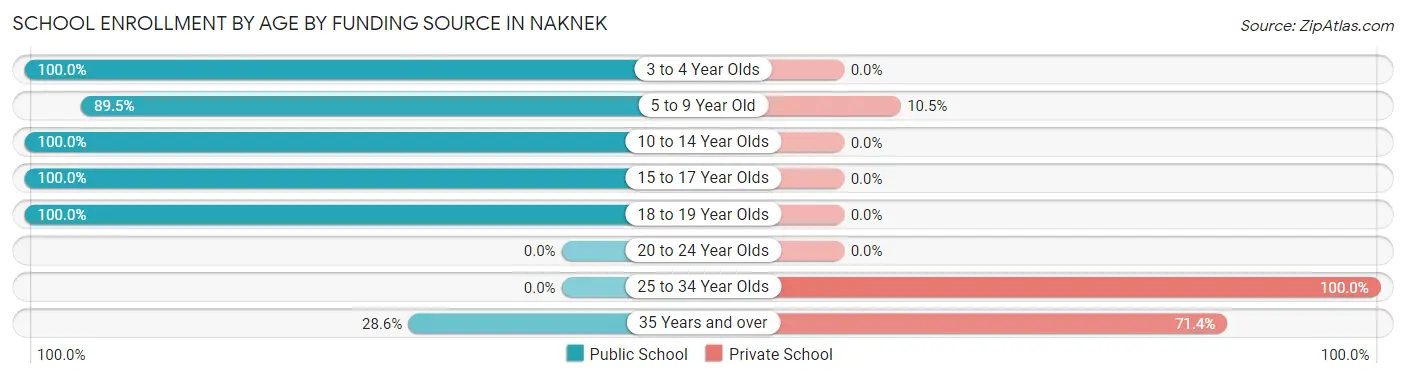
| Age Bracket | Public School | Private School |
| 3 to 4 Year Olds | 10 (100.0%) | 0 (0.0%) |
| 5 to 9 Year Old | 17 (89.5%) | 2 (10.5%) |
| 10 to 14 Year Olds | 19 (100.0%) | 0 (0.0%) |
| 15 to 17 Year Olds | 12 (100.0%) | 0 (0.0%) |
| 18 to 19 Year Olds | 4 (100.0%) | 0 (0.0%) |
| 20 to 24 Year Olds | 0 (0.0%) | 0 (0.0%) |
| 25 to 34 Year Olds | 0 (0.0%) | 2 (100.0%) |
| 35 Years and over | 2 (28.6%) | 5 (71.4%) |
| Total | 64 (87.7%) | 9 (12.3%) |
Educational Attainment by Field of Study in Naknek
Social sciences (39 | 41.9%), education (13 | 14.0%), science & technology (7 | 7.5%), business (7 | 7.5%), and arts & humanities (7 | 7.5%) are the most common fields of study among 93 individuals in Naknek who have obtained a bachelor's degree or higher.
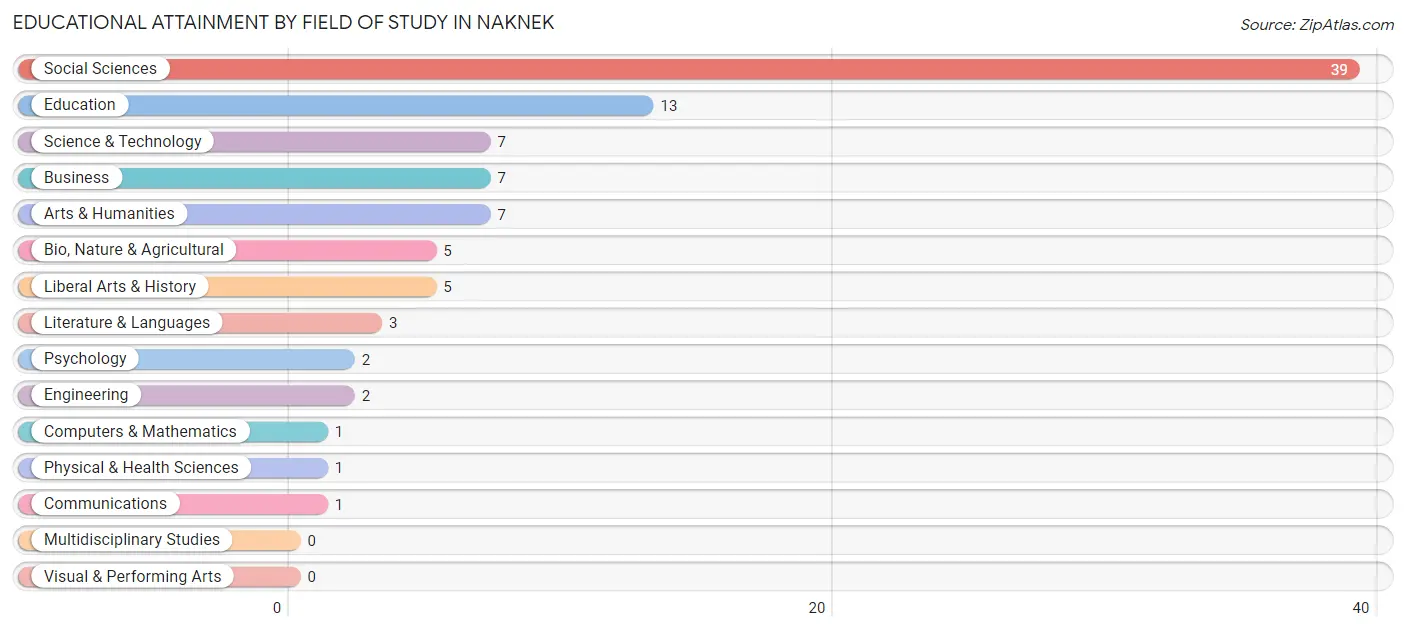
| Field of Study | # Graduates | % Graduates |
| Computers & Mathematics | 1 | 1.1% |
| Bio, Nature & Agricultural | 5 | 5.4% |
| Physical & Health Sciences | 1 | 1.1% |
| Psychology | 2 | 2.1% |
| Social Sciences | 39 | 41.9% |
| Engineering | 2 | 2.1% |
| Multidisciplinary Studies | 0 | 0.0% |
| Science & Technology | 7 | 7.5% |
| Business | 7 | 7.5% |
| Education | 13 | 14.0% |
| Literature & Languages | 3 | 3.2% |
| Liberal Arts & History | 5 | 5.4% |
| Visual & Performing Arts | 0 | 0.0% |
| Communications | 1 | 1.1% |
| Arts & Humanities | 7 | 7.5% |
| Total | 93 | 100.0% |
Transportation & Commute in Naknek
Vehicle Availability by Sex in Naknek
The most prevalent vehicle ownership categories in Naknek are males with 2 vehicles (23, accounting for 25.3%) and females with 2 vehicles (27, making up 30.3%).
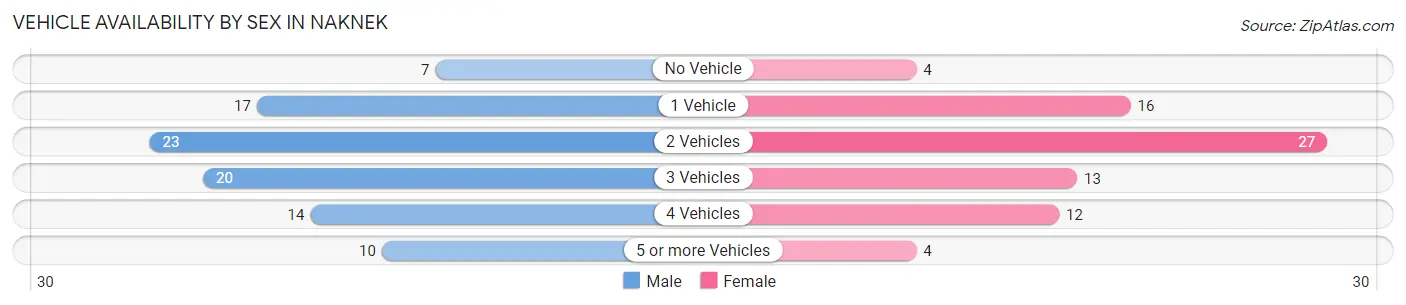
| Vehicles Available | Male | Female |
| No Vehicle | 7 (7.7%) | 4 (5.3%) |
| 1 Vehicle | 17 (18.7%) | 16 (21.0%) |
| 2 Vehicles | 23 (25.3%) | 27 (35.5%) |
| 3 Vehicles | 20 (22.0%) | 13 (17.1%) |
| 4 Vehicles | 14 (15.4%) | 12 (15.8%) |
| 5 or more Vehicles | 10 (11.0%) | 4 (5.3%) |
| Total | 91 (100.0%) | 76 (100.0%) |
Commute Time in Naknek
The most frequently occuring commute durations in Naknek are 5 to 9 minutes (93 commuters, 50.0%), 10 to 14 minutes (30 commuters, 16.1%), and less than 5 minutes (20 commuters, 10.7%).
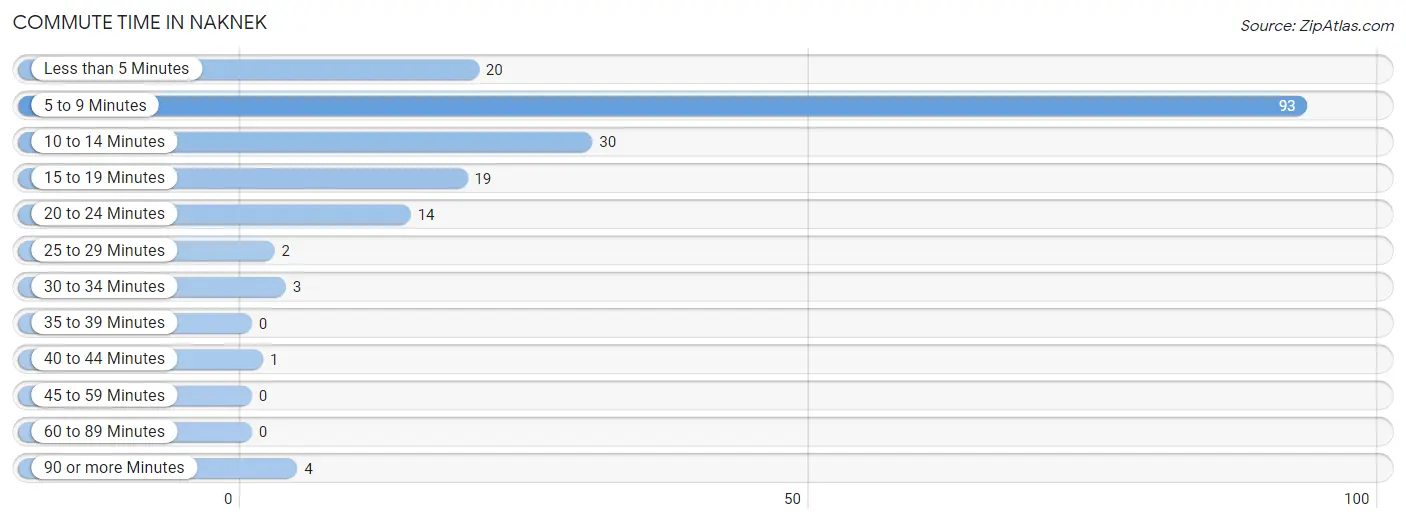
| Commute Time | # Commuters | % Commuters |
| Less than 5 Minutes | 20 | 10.7% |
| 5 to 9 Minutes | 93 | 50.0% |
| 10 to 14 Minutes | 30 | 16.1% |
| 15 to 19 Minutes | 19 | 10.2% |
| 20 to 24 Minutes | 14 | 7.5% |
| 25 to 29 Minutes | 2 | 1.1% |
| 30 to 34 Minutes | 3 | 1.6% |
| 35 to 39 Minutes | 0 | 0.0% |
| 40 to 44 Minutes | 1 | 0.5% |
| 45 to 59 Minutes | 0 | 0.0% |
| 60 to 89 Minutes | 0 | 0.0% |
| 90 or more Minutes | 4 | 2.1% |
Commute Time by Sex in Naknek
The most common commute times in Naknek are 5 to 9 minutes (66 commuters, 55.9%) for males and 5 to 9 minutes (27 commuters, 39.7%) for females.
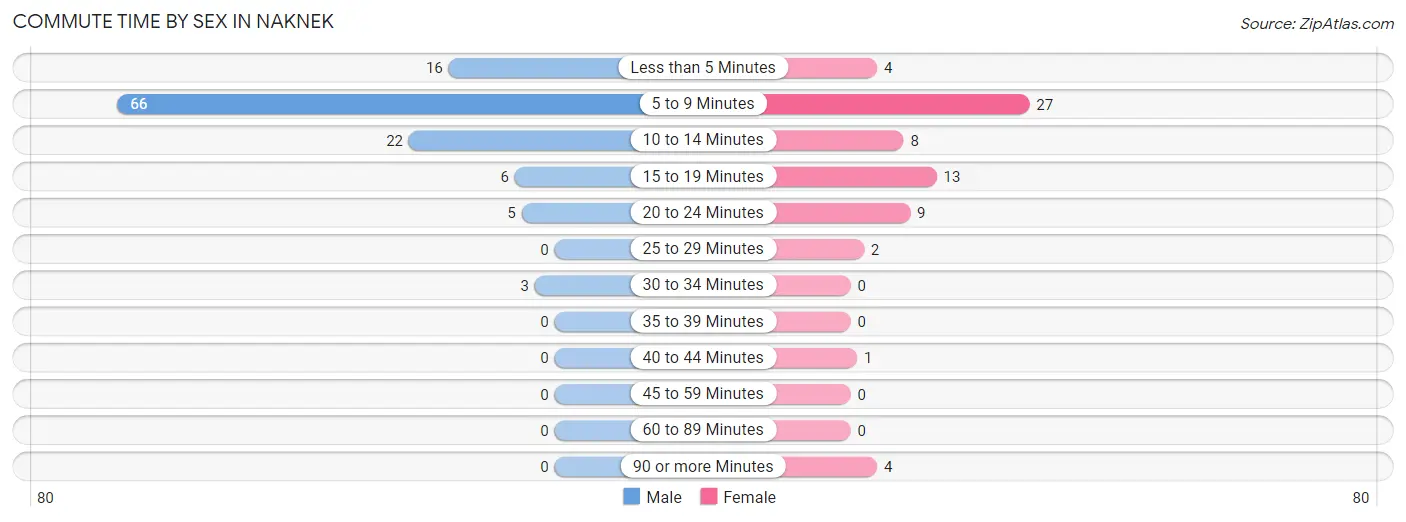
| Commute Time | Male | Female |
| Less than 5 Minutes | 16 (13.6%) | 4 (5.9%) |
| 5 to 9 Minutes | 66 (55.9%) | 27 (39.7%) |
| 10 to 14 Minutes | 22 (18.6%) | 8 (11.8%) |
| 15 to 19 Minutes | 6 (5.1%) | 13 (19.1%) |
| 20 to 24 Minutes | 5 (4.2%) | 9 (13.2%) |
| 25 to 29 Minutes | 0 (0.0%) | 2 (2.9%) |
| 30 to 34 Minutes | 3 (2.5%) | 0 (0.0%) |
| 35 to 39 Minutes | 0 (0.0%) | 0 (0.0%) |
| 40 to 44 Minutes | 0 (0.0%) | 1 (1.5%) |
| 45 to 59 Minutes | 0 (0.0%) | 0 (0.0%) |
| 60 to 89 Minutes | 0 (0.0%) | 0 (0.0%) |
| 90 or more Minutes | 0 (0.0%) | 4 (5.9%) |
Time of Departure to Work by Sex in Naknek
The most frequent times of departure to work in Naknek are 5:00 AM to 5:29 AM (27, 22.9%) for males and 7:30 AM to 7:59 AM (30, 44.1%) for females.
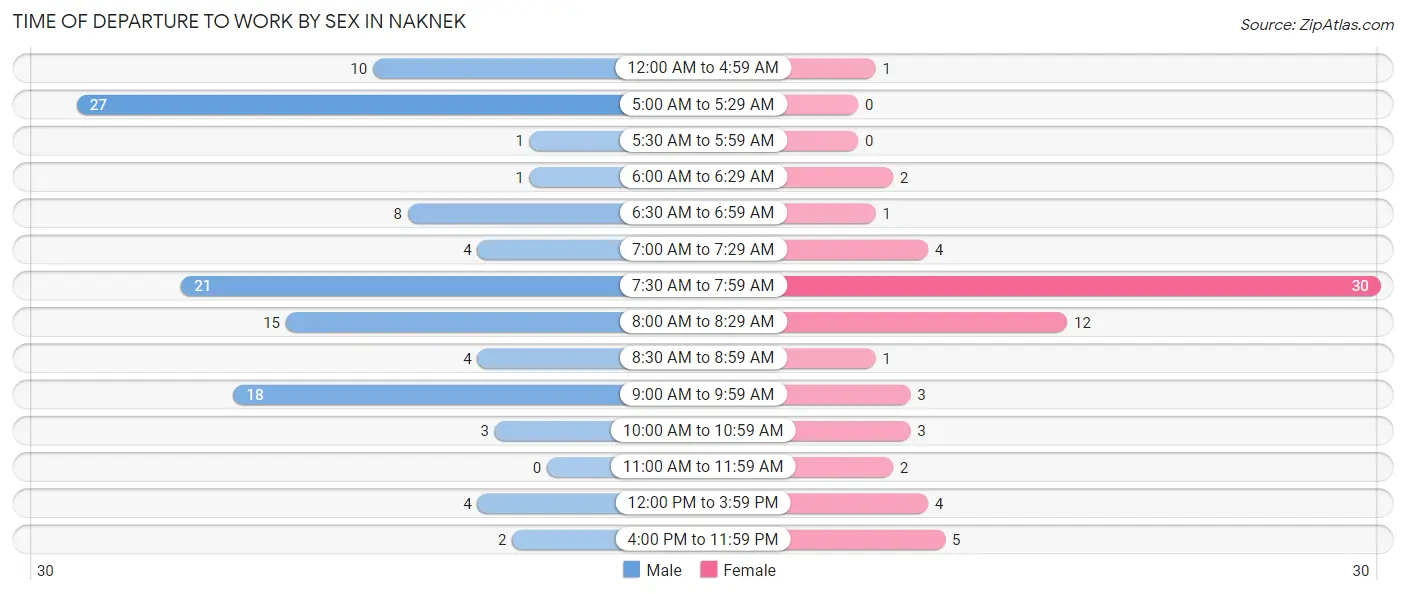
| Time of Departure | Male | Female |
| 12:00 AM to 4:59 AM | 10 (8.5%) | 1 (1.5%) |
| 5:00 AM to 5:29 AM | 27 (22.9%) | 0 (0.0%) |
| 5:30 AM to 5:59 AM | 1 (0.9%) | 0 (0.0%) |
| 6:00 AM to 6:29 AM | 1 (0.9%) | 2 (2.9%) |
| 6:30 AM to 6:59 AM | 8 (6.8%) | 1 (1.5%) |
| 7:00 AM to 7:29 AM | 4 (3.4%) | 4 (5.9%) |
| 7:30 AM to 7:59 AM | 21 (17.8%) | 30 (44.1%) |
| 8:00 AM to 8:29 AM | 15 (12.7%) | 12 (17.6%) |
| 8:30 AM to 8:59 AM | 4 (3.4%) | 1 (1.5%) |
| 9:00 AM to 9:59 AM | 18 (15.2%) | 3 (4.4%) |
| 10:00 AM to 10:59 AM | 3 (2.5%) | 3 (4.4%) |
| 11:00 AM to 11:59 AM | 0 (0.0%) | 2 (2.9%) |
| 12:00 PM to 3:59 PM | 4 (3.4%) | 4 (5.9%) |
| 4:00 PM to 11:59 PM | 2 (1.7%) | 5 (7.3%) |
| Total | 118 (100.0%) | 68 (100.0%) |
Housing Occupancy in Naknek
Occupancy by Ownership in Naknek
Of the total 132 dwellings in Naknek, owner-occupied units account for 72 (54.5%), while renter-occupied units make up 60 (45.5%).
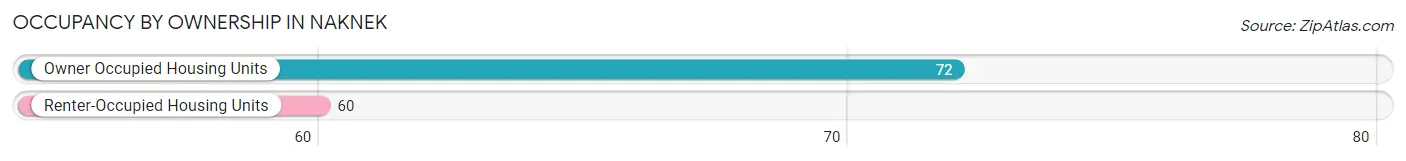
| Occupancy | # Housing Units | % Housing Units |
| Owner Occupied Housing Units | 72 | 54.5% |
| Renter-Occupied Housing Units | 60 | 45.5% |
| Total Occupied Housing Units | 132 | 100.0% |
Occupancy by Household Size in Naknek
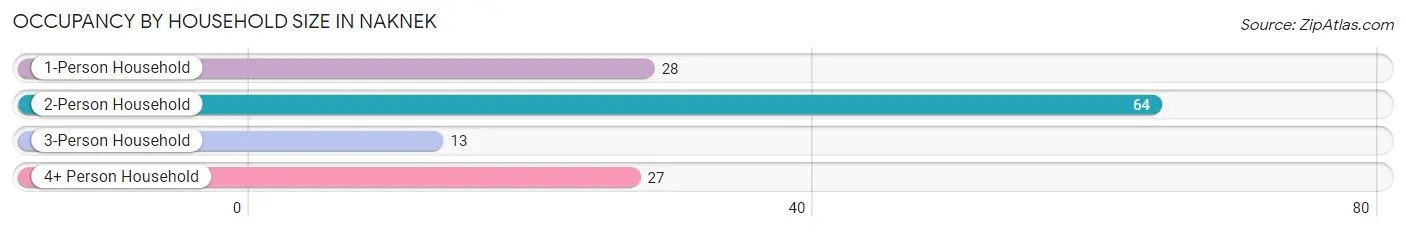
| Household Size | # Housing Units | % Housing Units |
| 1-Person Household | 28 | 21.2% |
| 2-Person Household | 64 | 48.5% |
| 3-Person Household | 13 | 9.9% |
| 4+ Person Household | 27 | 20.4% |
| Total Housing Units | 132 | 100.0% |
Occupancy by Ownership by Household Size in Naknek
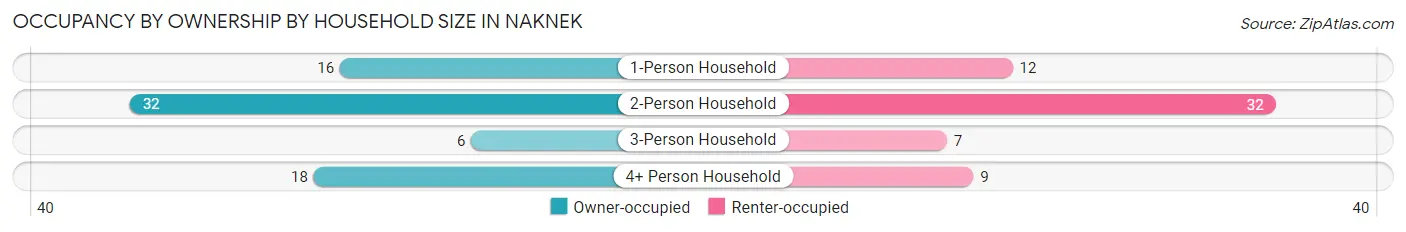
| Household Size | Owner-occupied | Renter-occupied |
| 1-Person Household | 16 (57.1%) | 12 (42.9%) |
| 2-Person Household | 32 (50.0%) | 32 (50.0%) |
| 3-Person Household | 6 (46.2%) | 7 (53.8%) |
| 4+ Person Household | 18 (66.7%) | 9 (33.3%) |
| Total Housing Units | 72 (54.5%) | 60 (45.5%) |
Occupancy by Educational Attainment in Naknek
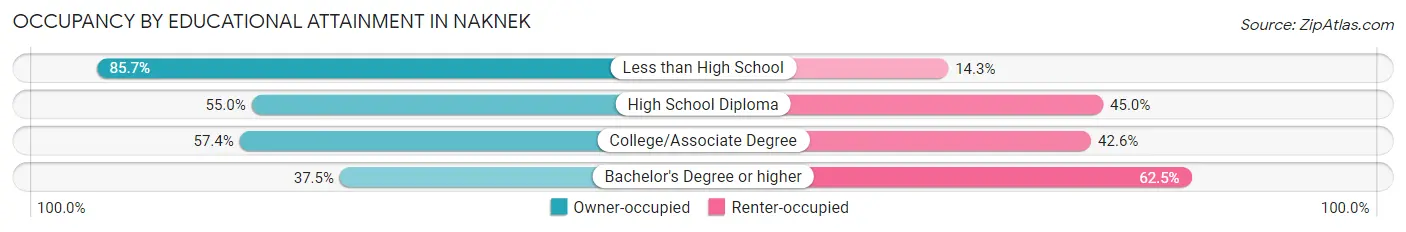
| Household Size | Owner-occupied | Renter-occupied |
| Less than High School | 6 (85.7%) | 1 (14.3%) |
| High School Diploma | 22 (55.0%) | 18 (45.0%) |
| College/Associate Degree | 35 (57.4%) | 26 (42.6%) |
| Bachelor's Degree or higher | 9 (37.5%) | 15 (62.5%) |
Occupancy by Age of Householder in Naknek
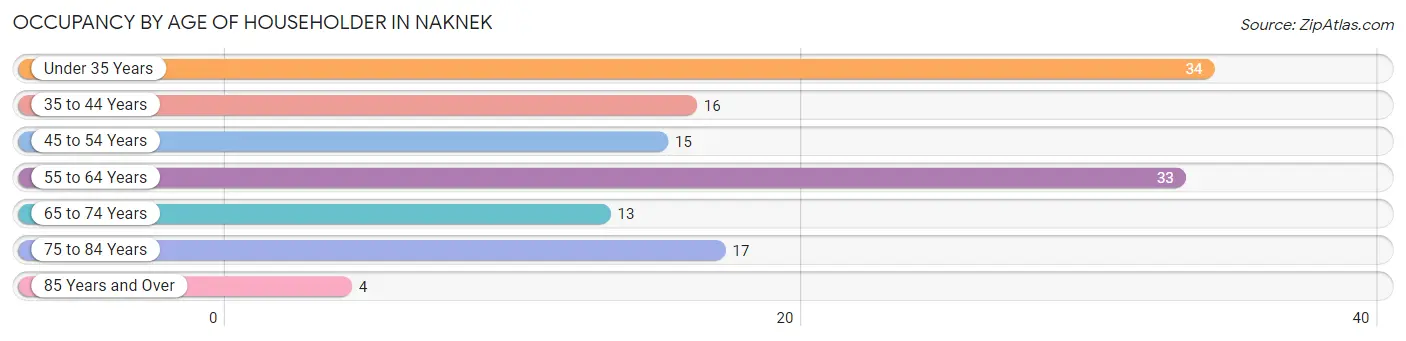
| Age Bracket | # Households | % Households |
| Under 35 Years | 34 | 25.8% |
| 35 to 44 Years | 16 | 12.1% |
| 45 to 54 Years | 15 | 11.4% |
| 55 to 64 Years | 33 | 25.0% |
| 65 to 74 Years | 13 | 9.9% |
| 75 to 84 Years | 17 | 12.9% |
| 85 Years and Over | 4 | 3.0% |
| Total | 132 | 100.0% |
Housing Finances in Naknek
Median Income by Occupancy in Naknek
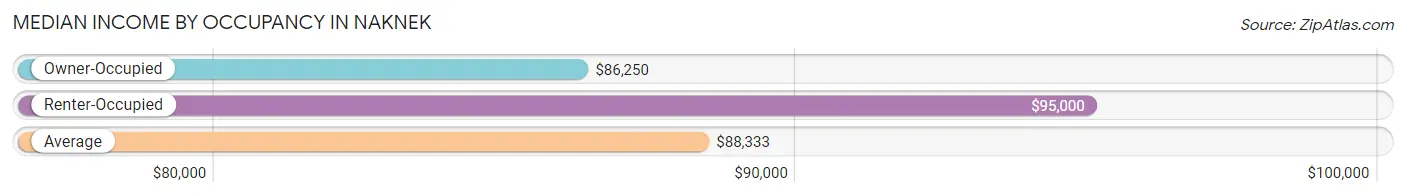
| Occupancy Type | # Households | Median Income |
| Owner-Occupied | 72 (54.5%) | $86,250 |
| Renter-Occupied | 60 (45.5%) | $95,000 |
| Average | 132 (100.0%) | $88,333 |
Occupancy by Householder Income Bracket in Naknek
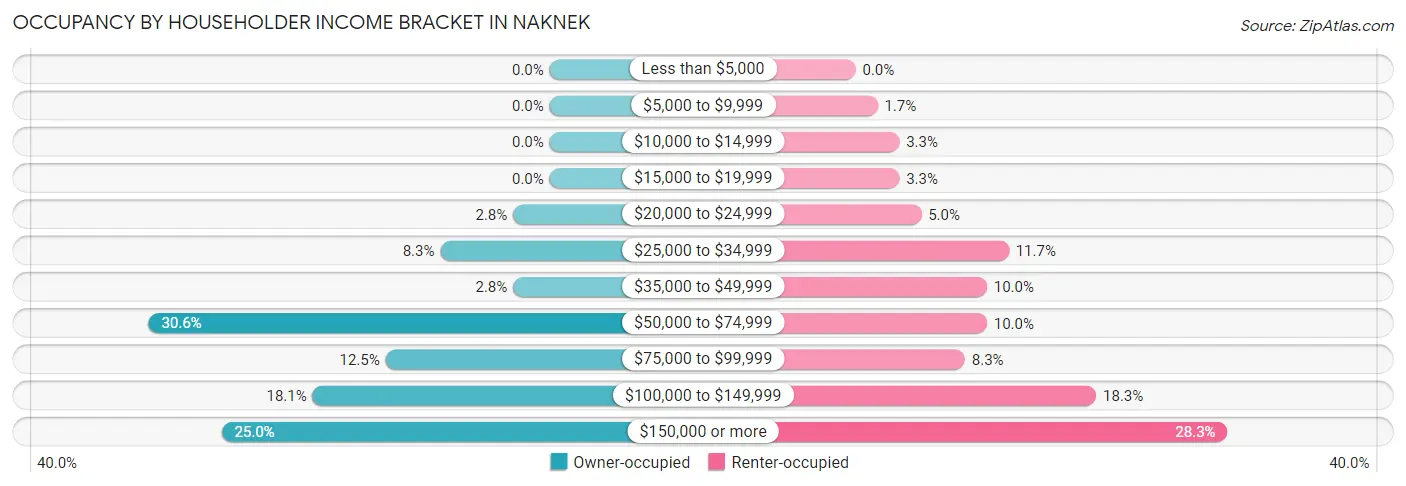
| Income Bracket | Owner-occupied | Renter-occupied |
| Less than $5,000 | 0 (0.0%) | 0 (0.0%) |
| $5,000 to $9,999 | 0 (0.0%) | 1 (1.7%) |
| $10,000 to $14,999 | 0 (0.0%) | 2 (3.3%) |
| $15,000 to $19,999 | 0 (0.0%) | 2 (3.3%) |
| $20,000 to $24,999 | 2 (2.8%) | 3 (5.0%) |
| $25,000 to $34,999 | 6 (8.3%) | 7 (11.7%) |
| $35,000 to $49,999 | 2 (2.8%) | 6 (10.0%) |
| $50,000 to $74,999 | 22 (30.6%) | 6 (10.0%) |
| $75,000 to $99,999 | 9 (12.5%) | 5 (8.3%) |
| $100,000 to $149,999 | 13 (18.1%) | 11 (18.3%) |
| $150,000 or more | 18 (25.0%) | 17 (28.3%) |
| Total | 72 (100.0%) | 60 (100.0%) |
Monthly Housing Cost Tiers in Naknek
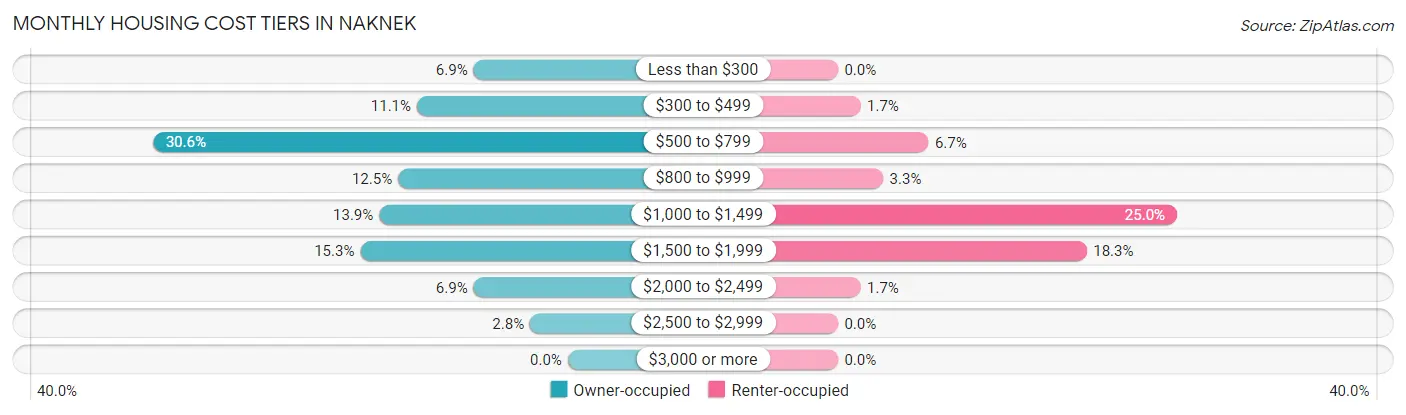
| Monthly Cost | Owner-occupied | Renter-occupied |
| Less than $300 | 5 (6.9%) | 0 (0.0%) |
| $300 to $499 | 8 (11.1%) | 1 (1.7%) |
| $500 to $799 | 22 (30.6%) | 4 (6.7%) |
| $800 to $999 | 9 (12.5%) | 2 (3.3%) |
| $1,000 to $1,499 | 10 (13.9%) | 15 (25.0%) |
| $1,500 to $1,999 | 11 (15.3%) | 11 (18.3%) |
| $2,000 to $2,499 | 5 (6.9%) | 1 (1.7%) |
| $2,500 to $2,999 | 2 (2.8%) | 0 (0.0%) |
| $3,000 or more | 0 (0.0%) | 0 (0.0%) |
| Total | 72 (100.0%) | 60 (100.0%) |
Physical Housing Characteristics in Naknek
Housing Structures in Naknek
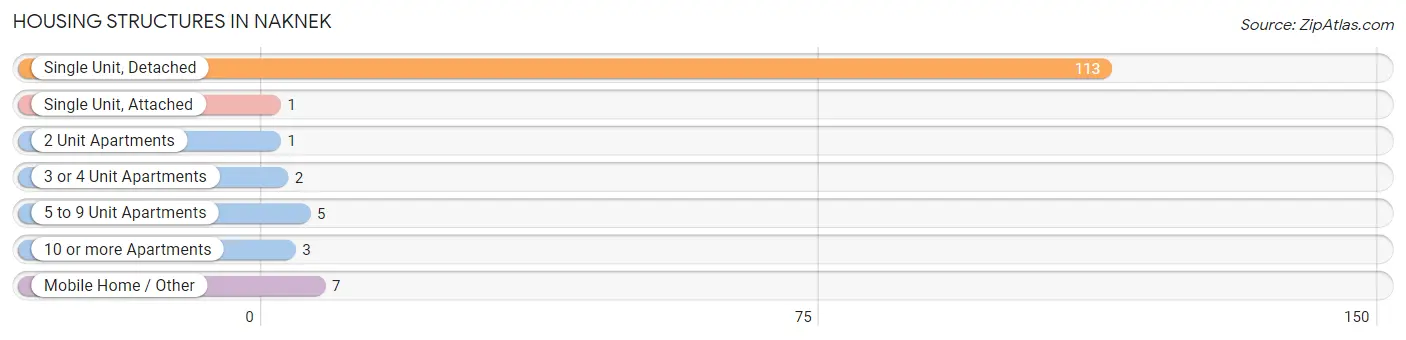
| Structure Type | # Housing Units | % Housing Units |
| Single Unit, Detached | 113 | 85.6% |
| Single Unit, Attached | 1 | 0.8% |
| 2 Unit Apartments | 1 | 0.8% |
| 3 or 4 Unit Apartments | 2 | 1.5% |
| 5 to 9 Unit Apartments | 5 | 3.8% |
| 10 or more Apartments | 3 | 2.3% |
| Mobile Home / Other | 7 | 5.3% |
| Total | 132 | 100.0% |
Housing Structures by Occupancy in Naknek
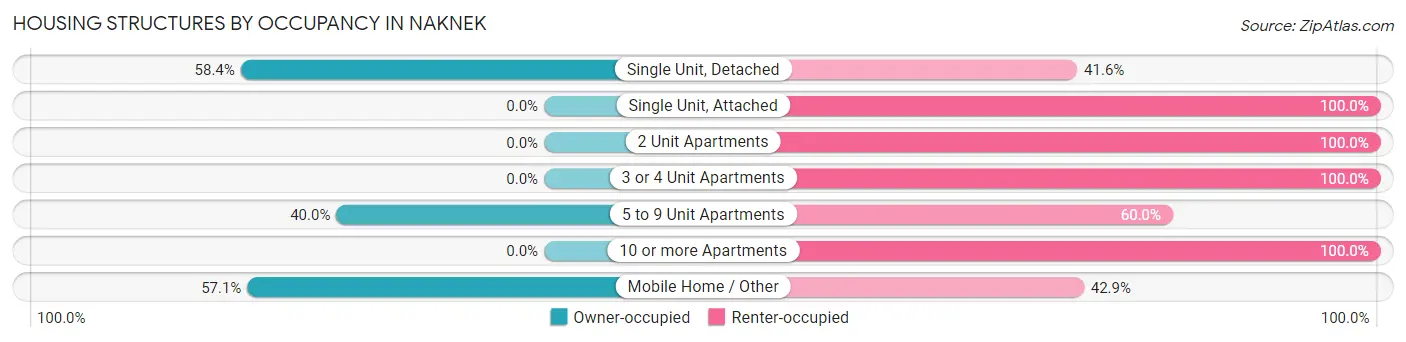
| Structure Type | Owner-occupied | Renter-occupied |
| Single Unit, Detached | 66 (58.4%) | 47 (41.6%) |
| Single Unit, Attached | 0 (0.0%) | 1 (100.0%) |
| 2 Unit Apartments | 0 (0.0%) | 1 (100.0%) |
| 3 or 4 Unit Apartments | 0 (0.0%) | 2 (100.0%) |
| 5 to 9 Unit Apartments | 2 (40.0%) | 3 (60.0%) |
| 10 or more Apartments | 0 (0.0%) | 3 (100.0%) |
| Mobile Home / Other | 4 (57.1%) | 3 (42.9%) |
| Total | 72 (54.5%) | 60 (45.5%) |
Housing Structures by Number of Rooms in Naknek
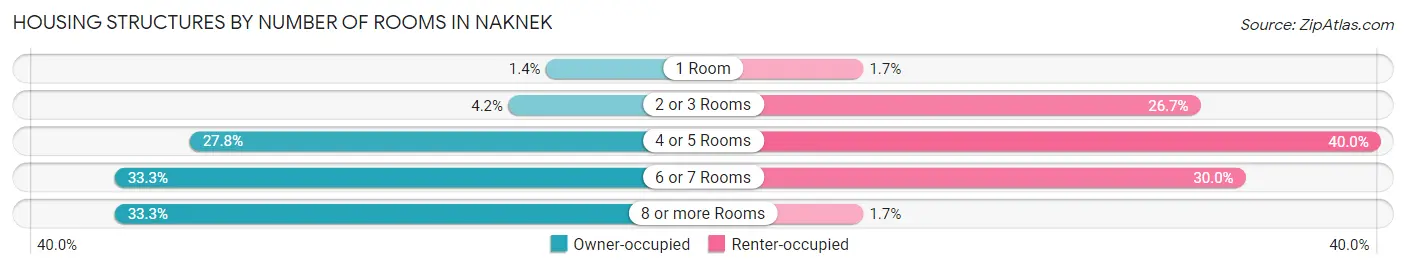
| Number of Rooms | Owner-occupied | Renter-occupied |
| 1 Room | 1 (1.4%) | 1 (1.7%) |
| 2 or 3 Rooms | 3 (4.2%) | 16 (26.7%) |
| 4 or 5 Rooms | 20 (27.8%) | 24 (40.0%) |
| 6 or 7 Rooms | 24 (33.3%) | 18 (30.0%) |
| 8 or more Rooms | 24 (33.3%) | 1 (1.7%) |
| Total | 72 (100.0%) | 60 (100.0%) |
Housing Structure by Heating Type in Naknek
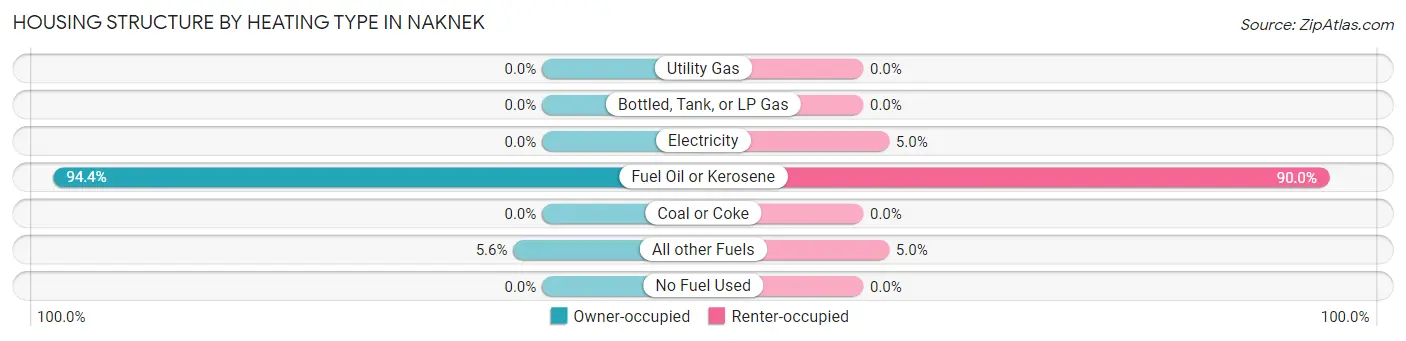
| Heating Type | Owner-occupied | Renter-occupied |
| Utility Gas | 0 (0.0%) | 0 (0.0%) |
| Bottled, Tank, or LP Gas | 0 (0.0%) | 0 (0.0%) |
| Electricity | 0 (0.0%) | 3 (5.0%) |
| Fuel Oil or Kerosene | 68 (94.4%) | 54 (90.0%) |
| Coal or Coke | 0 (0.0%) | 0 (0.0%) |
| All other Fuels | 4 (5.6%) | 3 (5.0%) |
| No Fuel Used | 0 (0.0%) | 0 (0.0%) |
| Total | 72 (100.0%) | 60 (100.0%) |
Household Vehicle Usage in Naknek
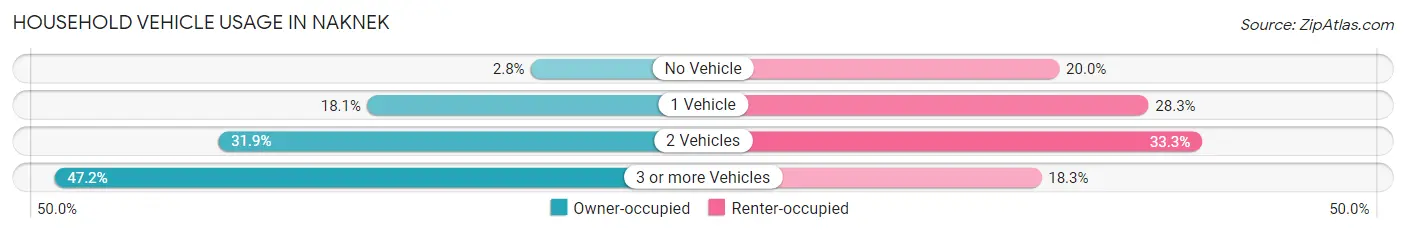
| Vehicles per Household | Owner-occupied | Renter-occupied |
| No Vehicle | 2 (2.8%) | 12 (20.0%) |
| 1 Vehicle | 13 (18.1%) | 17 (28.3%) |
| 2 Vehicles | 23 (31.9%) | 20 (33.3%) |
| 3 or more Vehicles | 34 (47.2%) | 11 (18.3%) |
| Total | 72 (100.0%) | 60 (100.0%) |
Real Estate & Mortgages in Naknek
Real Estate and Mortgage Overview in Naknek
| Characteristic | Without Mortgage | With Mortgage |
| Housing Units | 54 | 18 |
| Median Property Value | $268,200 | $250,000 |
| Median Household Income | $73,333 | $7 |
| Monthly Housing Costs | $593 | $0 |
| Real Estate Taxes | $2,167 | $2 |
Property Value by Mortgage Status in Naknek
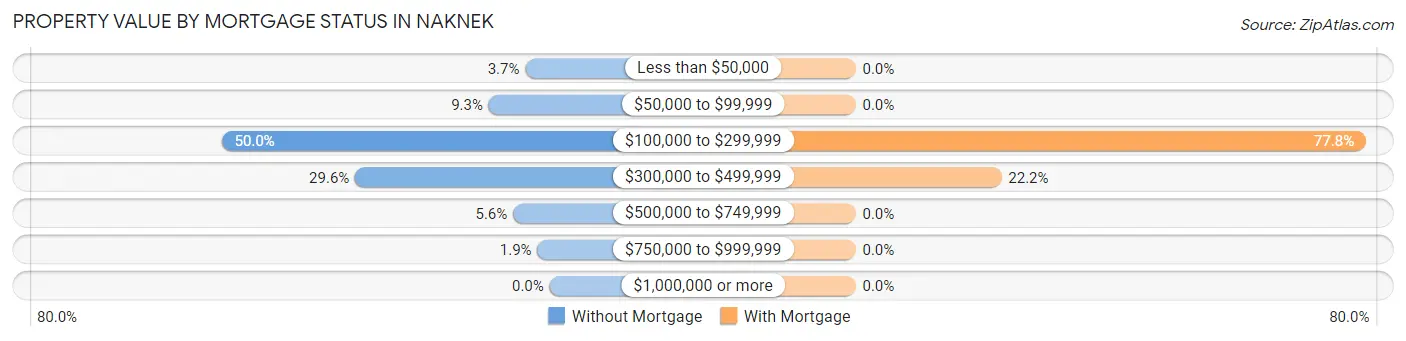
| Property Value | Without Mortgage | With Mortgage |
| Less than $50,000 | 2 (3.7%) | 0 (0.0%) |
| $50,000 to $99,999 | 5 (9.3%) | 0 (0.0%) |
| $100,000 to $299,999 | 27 (50.0%) | 14 (77.8%) |
| $300,000 to $499,999 | 16 (29.6%) | 4 (22.2%) |
| $500,000 to $749,999 | 3 (5.6%) | 0 (0.0%) |
| $750,000 to $999,999 | 1 (1.8%) | 0 (0.0%) |
| $1,000,000 or more | 0 (0.0%) | 0 (0.0%) |
| Total | 54 (100.0%) | 18 (100.0%) |
Household Income by Mortgage Status in Naknek
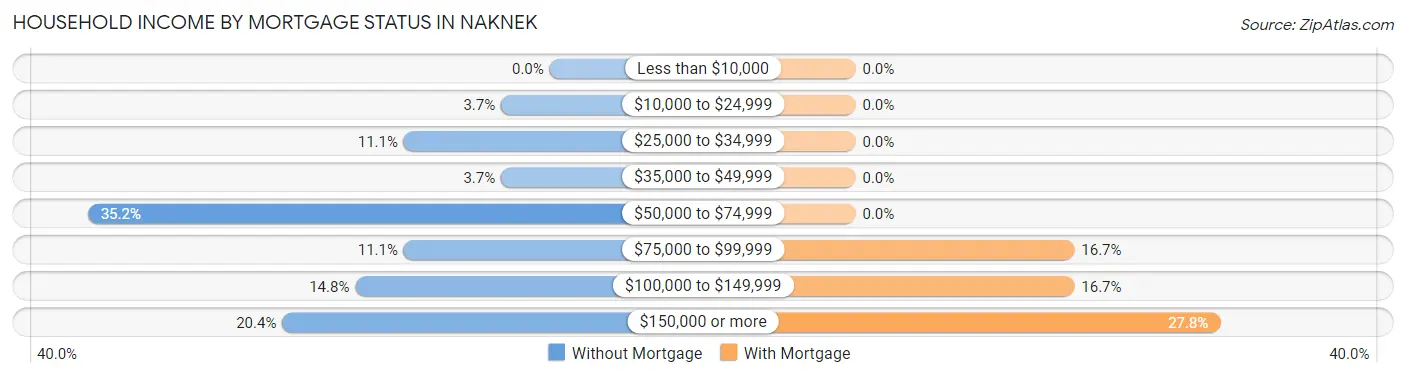
| Household Income | Without Mortgage | With Mortgage |
| Less than $10,000 | 0 (0.0%) | 0 (0.0%) |
| $10,000 to $24,999 | 2 (3.7%) | 0 (0.0%) |
| $25,000 to $34,999 | 6 (11.1%) | 0 (0.0%) |
| $35,000 to $49,999 | 2 (3.7%) | 0 (0.0%) |
| $50,000 to $74,999 | 19 (35.2%) | 0 (0.0%) |
| $75,000 to $99,999 | 6 (11.1%) | 3 (16.7%) |
| $100,000 to $149,999 | 8 (14.8%) | 3 (16.7%) |
| $150,000 or more | 11 (20.4%) | 5 (27.8%) |
| Total | 54 (100.0%) | 18 (100.0%) |
Property Value to Household Income Ratio in Naknek
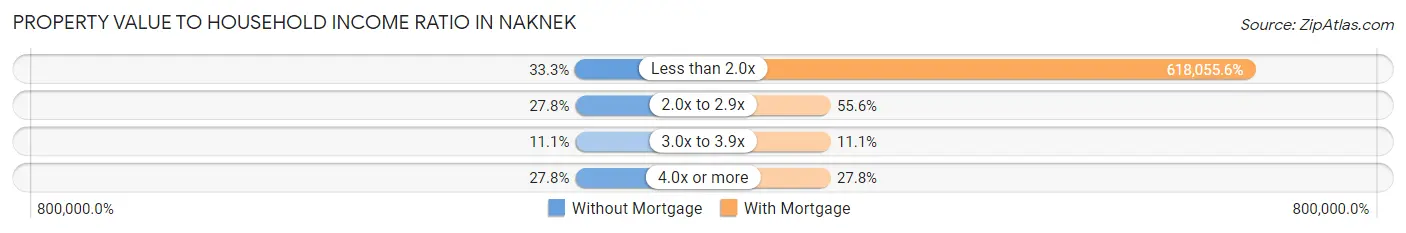
| Value-to-Income Ratio | Without Mortgage | With Mortgage |
| Less than 2.0x | 18 (33.3%) | 111,250 (618,055.6%) |
| 2.0x to 2.9x | 15 (27.8%) | 10 (55.6%) |
| 3.0x to 3.9x | 6 (11.1%) | 2 (11.1%) |
| 4.0x or more | 15 (27.8%) | 5 (27.8%) |
| Total | 54 (100.0%) | 18 (100.0%) |
Real Estate Taxes by Mortgage Status in Naknek
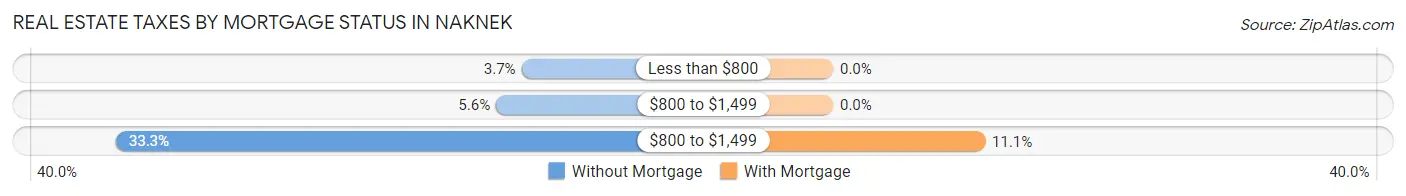
| Property Taxes | Without Mortgage | With Mortgage |
| Less than $800 | 2 (3.7%) | 0 (0.0%) |
| $800 to $1,499 | 3 (5.6%) | 0 (0.0%) |
| $800 to $1,499 | 18 (33.3%) | 2 (11.1%) |
| Total | 54 (100.0%) | 18 (100.0%) |
Health & Disability in Naknek
Health Insurance Coverage by Age in Naknek
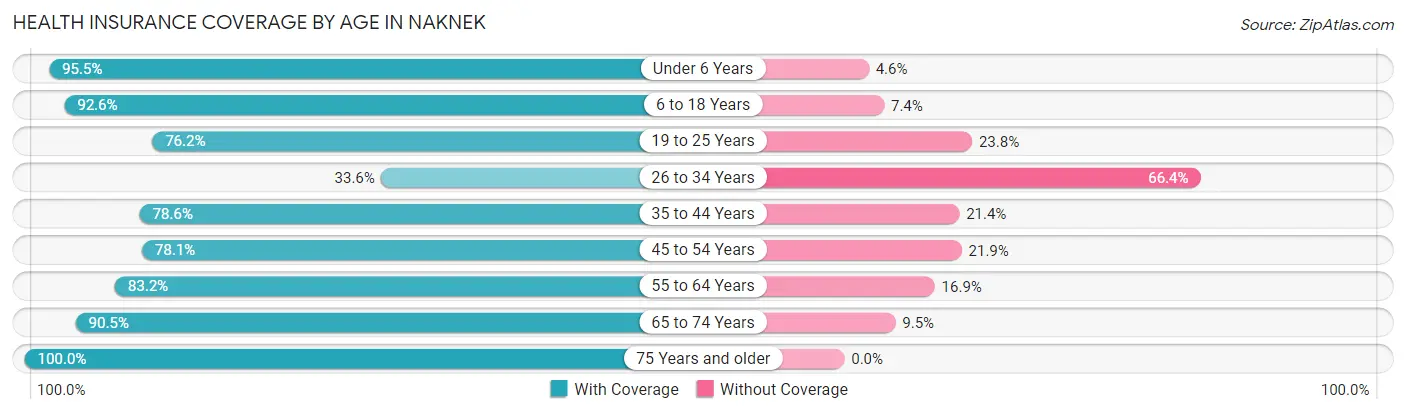
| Age Bracket | With Coverage | Without Coverage |
| Under 6 Years | 21 (95.5%) | 1 (4.5%) |
| 6 to 18 Years | 50 (92.6%) | 4 (7.4%) |
| 19 to 25 Years | 16 (76.2%) | 5 (23.8%) |
| 26 to 34 Years | 40 (33.6%) | 79 (66.4%) |
| 35 to 44 Years | 22 (78.6%) | 6 (21.4%) |
| 45 to 54 Years | 25 (78.1%) | 7 (21.9%) |
| 55 to 64 Years | 74 (83.2%) | 15 (16.9%) |
| 65 to 74 Years | 19 (90.5%) | 2 (9.5%) |
| 75 Years and older | 27 (100.0%) | 0 (0.0%) |
| Total | 294 (71.2%) | 119 (28.8%) |
Health Insurance Coverage by Citizenship Status in Naknek
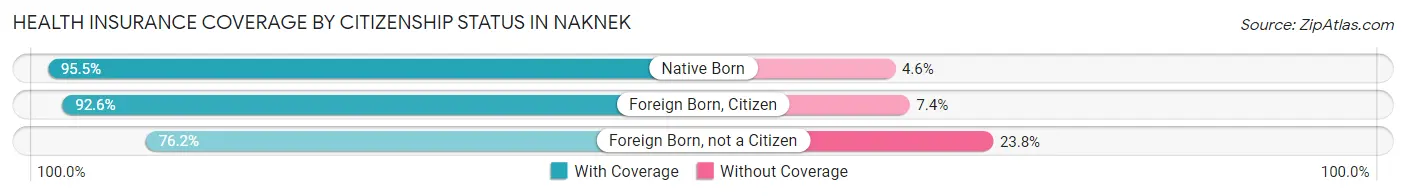
| Citizenship Status | With Coverage | Without Coverage |
| Native Born | 21 (95.5%) | 1 (4.5%) |
| Foreign Born, Citizen | 50 (92.6%) | 4 (7.4%) |
| Foreign Born, not a Citizen | 16 (76.2%) | 5 (23.8%) |
Health Insurance Coverage by Household Income in Naknek
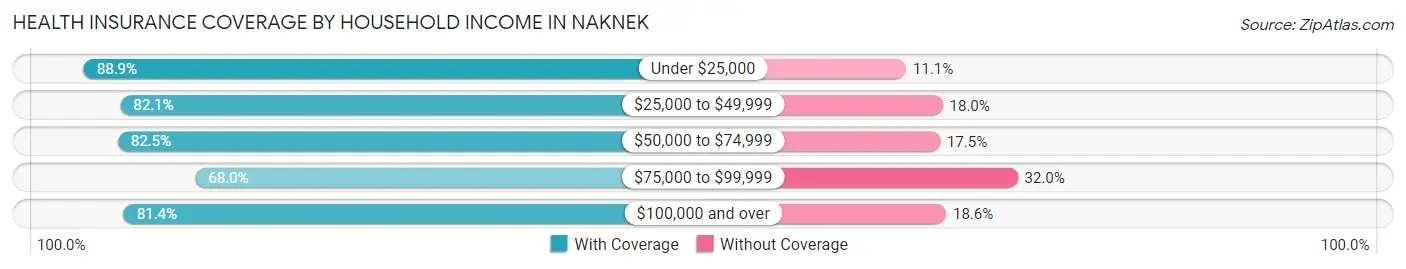
| Household Income | With Coverage | Without Coverage |
| Under $25,000 | 16 (88.9%) | 2 (11.1%) |
| $25,000 to $49,999 | 32 (82.1%) | 7 (17.9%) |
| $50,000 to $74,999 | 52 (82.5%) | 11 (17.5%) |
| $75,000 to $99,999 | 17 (68.0%) | 8 (32.0%) |
| $100,000 and over | 140 (81.4%) | 32 (18.6%) |
Public vs Private Health Insurance Coverage by Age in Naknek
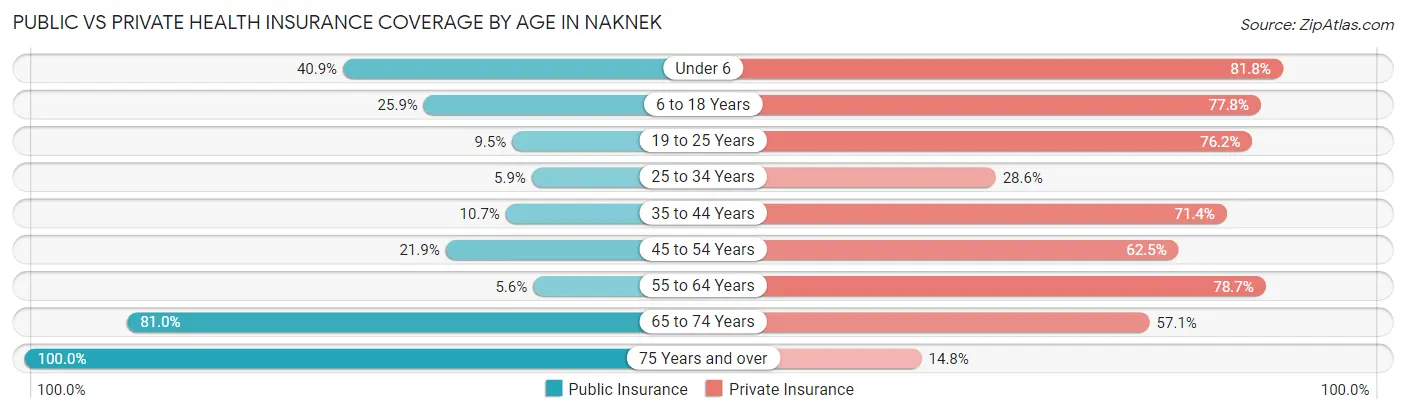
| Age Bracket | Public Insurance | Private Insurance |
| Under 6 | 9 (40.9%) | 18 (81.8%) |
| 6 to 18 Years | 14 (25.9%) | 42 (77.8%) |
| 19 to 25 Years | 2 (9.5%) | 16 (76.2%) |
| 25 to 34 Years | 7 (5.9%) | 34 (28.6%) |
| 35 to 44 Years | 3 (10.7%) | 20 (71.4%) |
| 45 to 54 Years | 7 (21.9%) | 20 (62.5%) |
| 55 to 64 Years | 5 (5.6%) | 70 (78.6%) |
| 65 to 74 Years | 17 (80.9%) | 12 (57.1%) |
| 75 Years and over | 27 (100.0%) | 4 (14.8%) |
| Total | 91 (22.0%) | 236 (57.1%) |
Disability Status by Sex by Age in Naknek
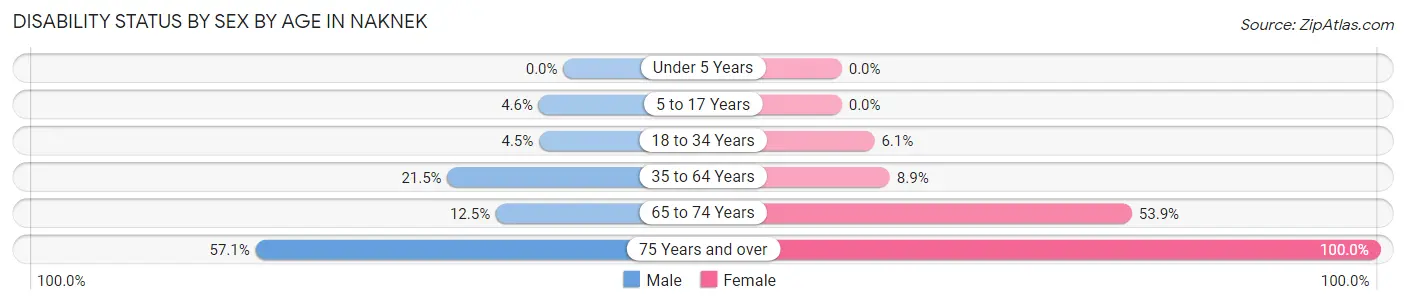
| Age Bracket | Male | Female |
| Under 5 Years | 0 (0.0%) | 0 (0.0%) |
| 5 to 17 Years | 1 (4.5%) | 0 (0.0%) |
| 18 to 34 Years | 5 (4.5%) | 2 (6.1%) |
| 35 to 64 Years | 20 (21.5%) | 5 (8.9%) |
| 65 to 74 Years | 1 (12.5%) | 7 (53.8%) |
| 75 Years and over | 8 (57.1%) | 13 (100.0%) |
Disability Class by Sex by Age in Naknek
Disability Class: Hearing Difficulty
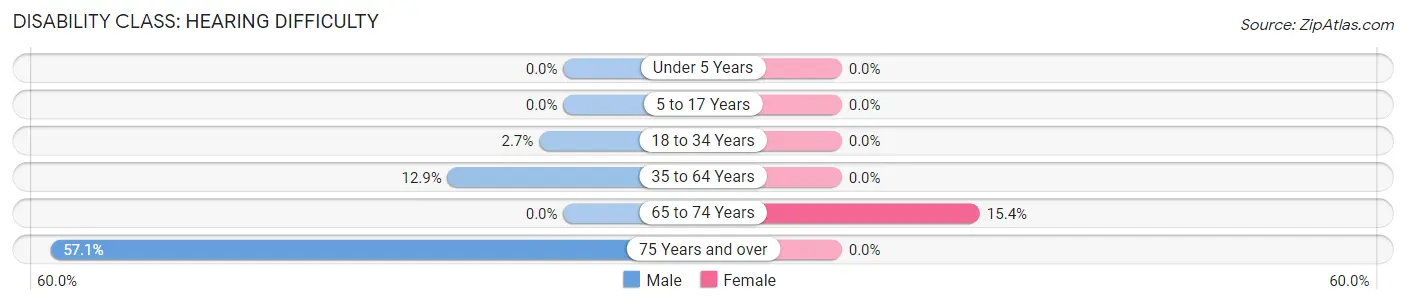
| Age Bracket | Male | Female |
| Under 5 Years | 0 (0.0%) | 0 (0.0%) |
| 5 to 17 Years | 0 (0.0%) | 0 (0.0%) |
| 18 to 34 Years | 3 (2.7%) | 0 (0.0%) |
| 35 to 64 Years | 12 (12.9%) | 0 (0.0%) |
| 65 to 74 Years | 0 (0.0%) | 2 (15.4%) |
| 75 Years and over | 8 (57.1%) | 0 (0.0%) |
Disability Class: Vision Difficulty
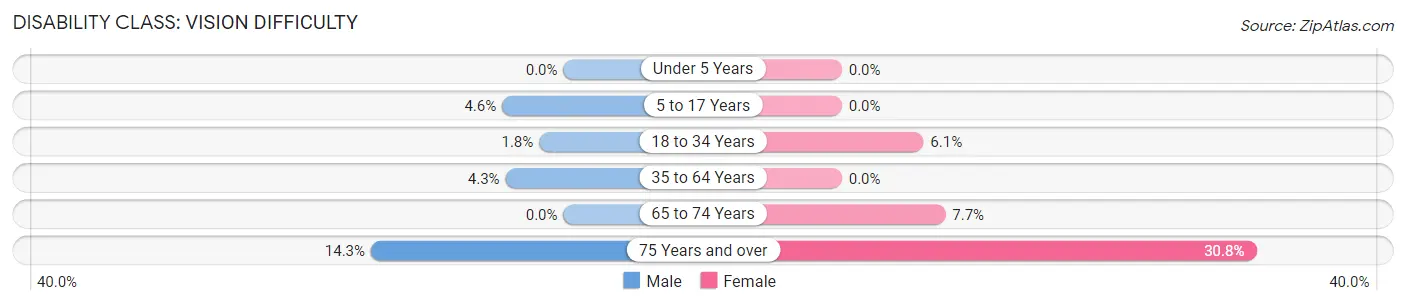
| Age Bracket | Male | Female |
| Under 5 Years | 0 (0.0%) | 0 (0.0%) |
| 5 to 17 Years | 1 (4.5%) | 0 (0.0%) |
| 18 to 34 Years | 2 (1.8%) | 2 (6.1%) |
| 35 to 64 Years | 4 (4.3%) | 0 (0.0%) |
| 65 to 74 Years | 0 (0.0%) | 1 (7.7%) |
| 75 Years and over | 2 (14.3%) | 4 (30.8%) |
Disability Class: Cognitive Difficulty
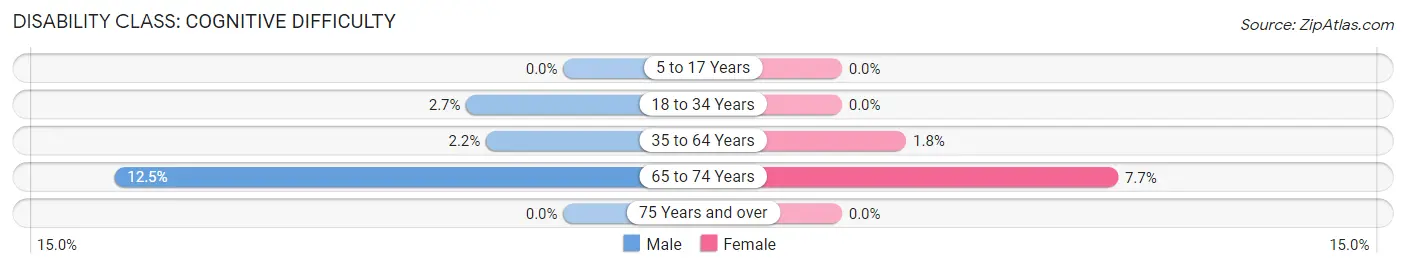
| Age Bracket | Male | Female |
| 5 to 17 Years | 0 (0.0%) | 0 (0.0%) |
| 18 to 34 Years | 3 (2.7%) | 0 (0.0%) |
| 35 to 64 Years | 2 (2.1%) | 1 (1.8%) |
| 65 to 74 Years | 1 (12.5%) | 1 (7.7%) |
| 75 Years and over | 0 (0.0%) | 0 (0.0%) |
Disability Class: Ambulatory Difficulty
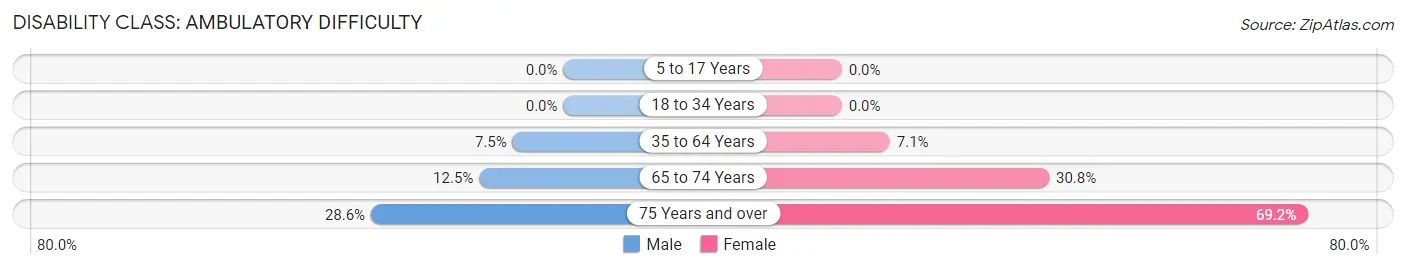
| Age Bracket | Male | Female |
| 5 to 17 Years | 0 (0.0%) | 0 (0.0%) |
| 18 to 34 Years | 0 (0.0%) | 0 (0.0%) |
| 35 to 64 Years | 7 (7.5%) | 4 (7.1%) |
| 65 to 74 Years | 1 (12.5%) | 4 (30.8%) |
| 75 Years and over | 4 (28.6%) | 9 (69.2%) |
Disability Class: Self-Care Difficulty
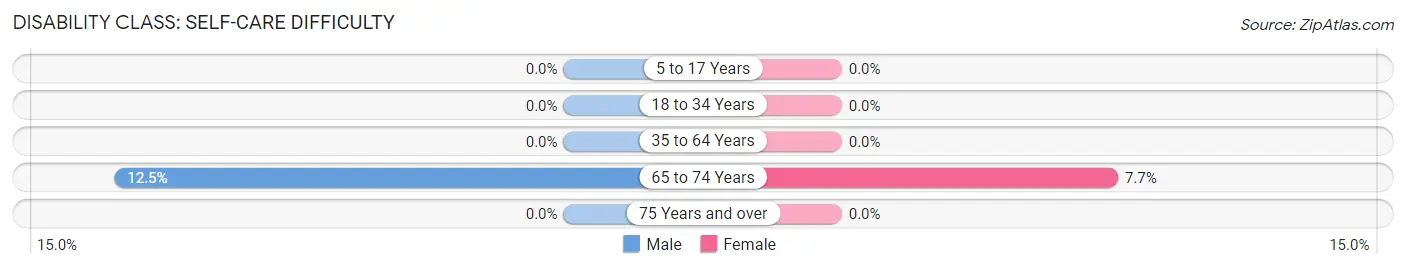
| Age Bracket | Male | Female |
| 5 to 17 Years | 0 (0.0%) | 0 (0.0%) |
| 18 to 34 Years | 0 (0.0%) | 0 (0.0%) |
| 35 to 64 Years | 0 (0.0%) | 0 (0.0%) |
| 65 to 74 Years | 1 (12.5%) | 1 (7.7%) |
| 75 Years and over | 0 (0.0%) | 0 (0.0%) |
Technology Access in Naknek
Computing Device Access in Naknek
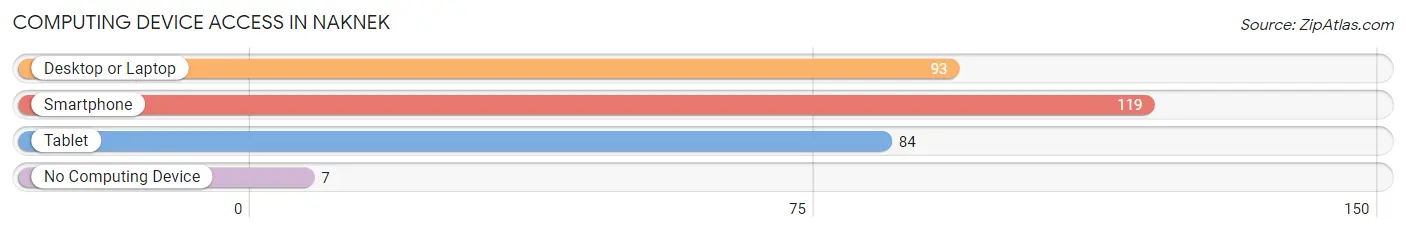
| Device Type | # Households | % Households |
| Desktop or Laptop | 93 | 70.5% |
| Smartphone | 119 | 90.1% |
| Tablet | 84 | 63.6% |
| No Computing Device | 7 | 5.3% |
| Total | 132 | 100.0% |
Internet Access in Naknek
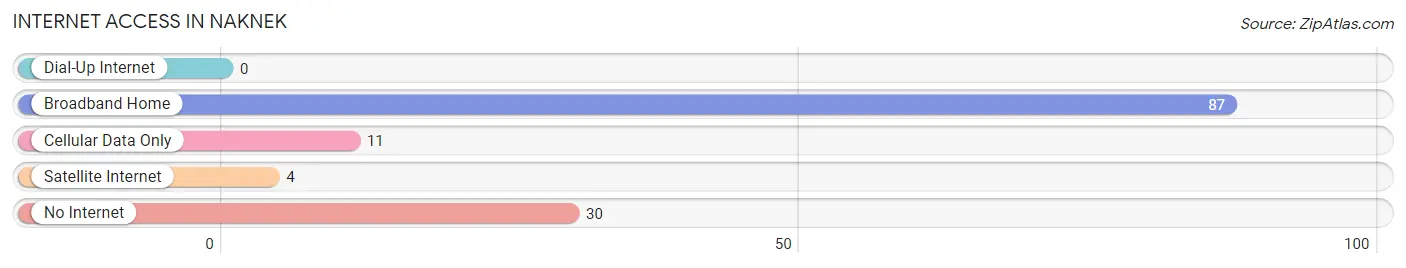
| Internet Type | # Households | % Households |
| Dial-Up Internet | 0 | 0.0% |
| Broadband Home | 87 | 65.9% |
| Cellular Data Only | 11 | 8.3% |
| Satellite Internet | 4 | 3.0% |
| No Internet | 30 | 22.7% |
| Total | 132 | 100.0% |
Naknek Summary
Naknek is a small city located in the Bristol Bay Borough of Alaska. It is situated on the north shore of Naknek Lake, which is part of the larger Bristol Bay watershed. The city is home to a population of approximately 500 people, most of whom are of Yup'ik Eskimo descent.
Geography
Naknek is located in the southwestern part of Alaska, on the north shore of Naknek Lake. The lake is part of the larger Bristol Bay watershed, which is fed by the Kvichak and Nushagak Rivers. The city is surrounded by the Togiak National Wildlife Refuge, which is home to a variety of wildlife, including caribou, moose, and bears. The area is also known for its salmon runs, which attract fishermen from all over the world.
The climate in Naknek is subarctic, with cold winters and mild summers. The average temperature in January is -7°F (-22°C), while the average temperature in July is 57°F (14°C). The area receives an average of 20 inches (51 cm) of precipitation per year, with most of it falling in the form of snow.
Economy
The economy of Naknek is largely based on fishing and subsistence activities. The city is home to several commercial fishing operations, which harvest salmon, halibut, and other species from the nearby waters. The city also has a cannery, which processes the fish for sale in markets around the world.
In addition to fishing, the city is also home to a number of small businesses, including a grocery store, a hardware store, and a restaurant. The city also has a small airport, which serves as a hub for air travel to and from the region.
Demographics
As of the 2010 census, the population of Naknek was 498, of which 97.2% were Native American or Alaska Native. The largest ethnic group in the city is Yup'ik Eskimo, which makes up 94.2% of the population. The remaining 5.8% of the population is made up of other ethnic groups, including White, Asian, and Hispanic.
The median household income in Naknek is $41,250, which is lower than the state average of $51,914. The median home value in the city is $125,000, which is also lower than the state average of $219,000. The unemployment rate in the city is 8.2%, which is higher than the state average of 6.7%.
Conclusion
Naknek is a small city located in the Bristol Bay Borough of Alaska. It is home to a population of approximately 500 people, most of whom are of Yup'ik Eskimo descent. The economy of the city is largely based on fishing and subsistence activities, and the city is also home to a number of small businesses. The median household income in Naknek is lower than the state average, and the unemployment rate is higher than the state average. Despite these challenges, the city is a vibrant and welcoming community, and it is a great place to live and work.
Common Questions
What is Per Capita Income in Naknek?
Per Capita income in Naknek is $43,602.
What is the Median Family Income in Naknek?
Median Family Income in Naknek is $93,750.
What is the Median Household income in Naknek?
Median Household Income in Naknek is $88,333.
What is Income or Wage Gap in Naknek?
Income or Wage Gap in Naknek is 21.8%.
Women in Naknek earn 78.2 cents for every dollar earned by a man.
What is Inequality or Gini Index in Naknek?
Inequality or Gini Index in Naknek is 0.40.
What is the Total Population of Naknek?
Total Population of Naknek is 418.
What is the Total Male Population of Naknek?
Total Male Population of Naknek is 261.
What is the Total Female Population of Naknek?
Total Female Population of Naknek is 157.
What is the Ratio of Males per 100 Females in Naknek?
There are 166.24 Males per 100 Females in Naknek.
What is the Ratio of Females per 100 Males in Naknek?
There are 60.15 Females per 100 Males in Naknek.
What is the Median Population Age in Naknek?
Median Population Age in Naknek is 32.6 Years.
What is the Average Family Size in Naknek
Average Family Size in Naknek is 2.9 People.
What is the Average Household Size in Naknek
Average Household Size in Naknek is 2.4 People.
How Large is the Labor Force in Naknek?
There are 210 People in the Labor Forcein in Naknek.
What is the Percentage of People in the Labor Force in Naknek?
59.5% of People are in the Labor Force in Naknek.
What is the Unemployment Rate in Naknek?
Unemployment Rate in Naknek is 2.9%.