Port Graham, AK Map & Demographics
Port Graham Map
Port Graham Overview
$24,794
PER CAPITA INCOME
$105,625
AVG FAMILY INCOME
$58,438
AVG HOUSEHOLD INCOME
55.2%
WAGE / INCOME GAP [ % ]
44.8¢/ $1
WAGE / INCOME GAP [ $ ]
$11,355
FAMILY INCOME DEFICIT
0.49
INEQUALITY / GINI INDEX
142
TOTAL POPULATION
97
MALE POPULATION
45
FEMALE POPULATION
215.56
MALES / 100 FEMALES
46.39
FEMALES / 100 MALES
34.3
MEDIAN AGE
3.4
AVG FAMILY SIZE
3.0
AVG HOUSEHOLD SIZE
68
LABOR FORCE [ PEOPLE ]
68.7%
PERCENT IN LABOR FORCE
Port Graham Area Codes
Income in Port Graham
Income Overview in Port Graham
Per Capita Income in Port Graham is $24,794, while median incomes of families and households are $105,625 and $58,438 respectively.
| Characteristic | Number | Measure |
| Per Capita Income | 142 | $24,794 |
| Median Family Income | 32 | $105,625 |
| Mean Family Income | 32 | $97,800 |
| Median Household Income | 45 | $58,438 |
| Mean Household Income | 45 | $81,147 |
| Income Deficit | 32 | $11,355 |
| Wage / Income Gap (%) | 142 | 55.17% |
| Wage / Income Gap ($) | 142 | 44.83¢ per $1 |
| Gini / Inequality Index | 142 | 0.49 |
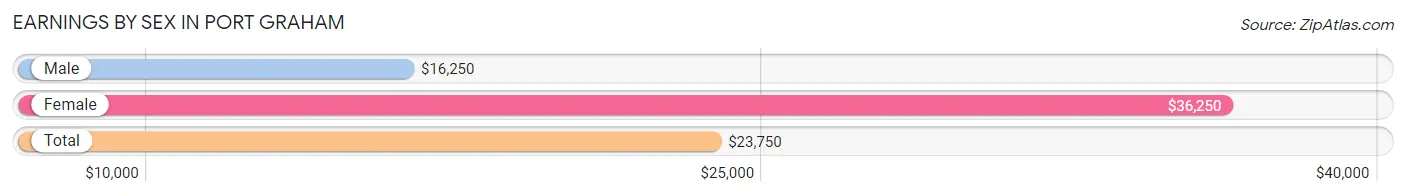
Earnings by Sex in Port Graham
Average Earnings in Port Graham are $23,750, $16,250 for men and $36,250 for women, a difference of 55.2%.
| Sex | Number | Average Earnings |
| Male | 44 (62.0%) | $16,250 |
| Female | 27 (38.0%) | $36,250 |
| Total | 71 (100.0%) | $23,750 |
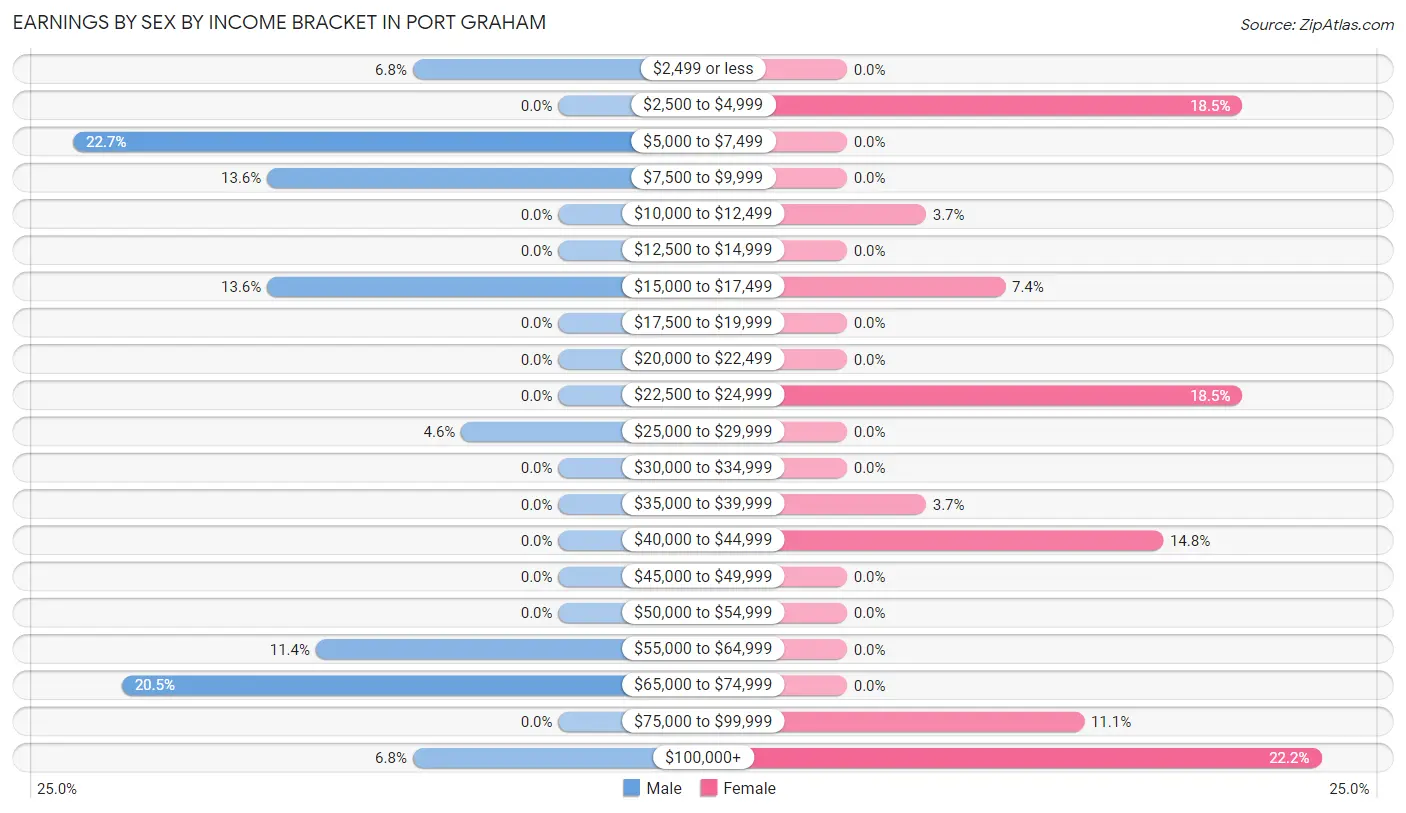
Earnings by Sex by Income Bracket in Port Graham
The most common earnings brackets in Port Graham are $5,000 to $7,499 for men (10 | 22.7%) and $100,000+ for women (6 | 22.2%).
| Income | Male | Female |
| $2,499 or less | 3 (6.8%) | 0 (0.0%) |
| $2,500 to $4,999 | 0 (0.0%) | 5 (18.5%) |
| $5,000 to $7,499 | 10 (22.7%) | 0 (0.0%) |
| $7,500 to $9,999 | 6 (13.6%) | 0 (0.0%) |
| $10,000 to $12,499 | 0 (0.0%) | 1 (3.7%) |
| $12,500 to $14,999 | 0 (0.0%) | 0 (0.0%) |
| $15,000 to $17,499 | 6 (13.6%) | 2 (7.4%) |
| $17,500 to $19,999 | 0 (0.0%) | 0 (0.0%) |
| $20,000 to $22,499 | 0 (0.0%) | 0 (0.0%) |
| $22,500 to $24,999 | 0 (0.0%) | 5 (18.5%) |
| $25,000 to $29,999 | 2 (4.5%) | 0 (0.0%) |
| $30,000 to $34,999 | 0 (0.0%) | 0 (0.0%) |
| $35,000 to $39,999 | 0 (0.0%) | 1 (3.7%) |
| $40,000 to $44,999 | 0 (0.0%) | 4 (14.8%) |
| $45,000 to $49,999 | 0 (0.0%) | 0 (0.0%) |
| $50,000 to $54,999 | 0 (0.0%) | 0 (0.0%) |
| $55,000 to $64,999 | 5 (11.4%) | 0 (0.0%) |
| $65,000 to $74,999 | 9 (20.4%) | 0 (0.0%) |
| $75,000 to $99,999 | 0 (0.0%) | 3 (11.1%) |
| $100,000+ | 3 (6.8%) | 6 (22.2%) |
| Total | 44 (100.0%) | 27 (100.0%) |
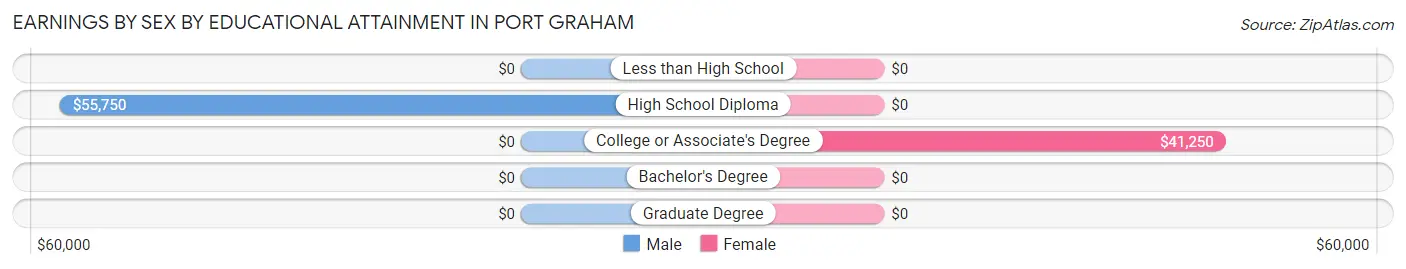
Earnings by Sex by Educational Attainment in Port Graham
| Educational Attainment | Male Income | Female Income |
| Less than High School | - | - |
| High School Diploma | $55,750 | $0 |
| College or Associate's Degree | - | - |
| Bachelor's Degree | - | - |
| Graduate Degree | - | - |
| Total | - | - |
Family Income in Port Graham
Family Income Brackets in Port Graham
According to the Port Graham family income data, there are 11 families falling into the $100,000 to $149,999 income range, which is the most common income bracket and makes up 34.4% of all families.
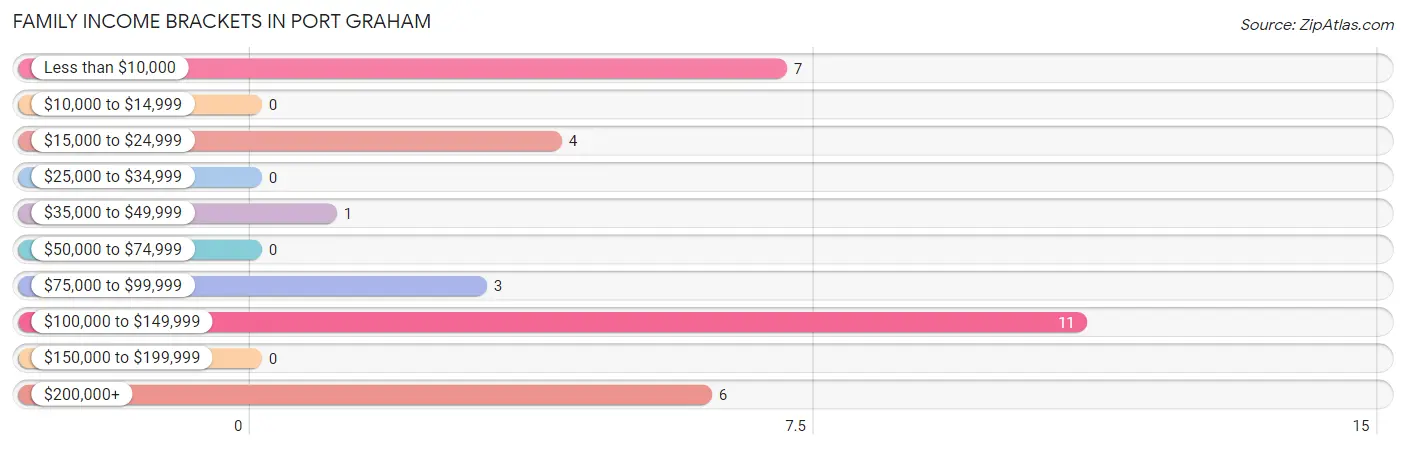
| Income Bracket | # Families | % Families |
| Less than $10,000 | 7 | 21.9% |
| $10,000 to $14,999 | 0 | 0.0% |
| $15,000 to $24,999 | 4 | 12.5% |
| $25,000 to $34,999 | 0 | 0.0% |
| $35,000 to $49,999 | 1 | 3.1% |
| $50,000 to $74,999 | 0 | 0.0% |
| $75,000 to $99,999 | 3 | 9.4% |
| $100,000 to $149,999 | 11 | 34.4% |
| $150,000 to $199,999 | 0 | 0.0% |
| $200,000+ | 6 | 18.8% |
Family Income by Famaliy Size in Port Graham
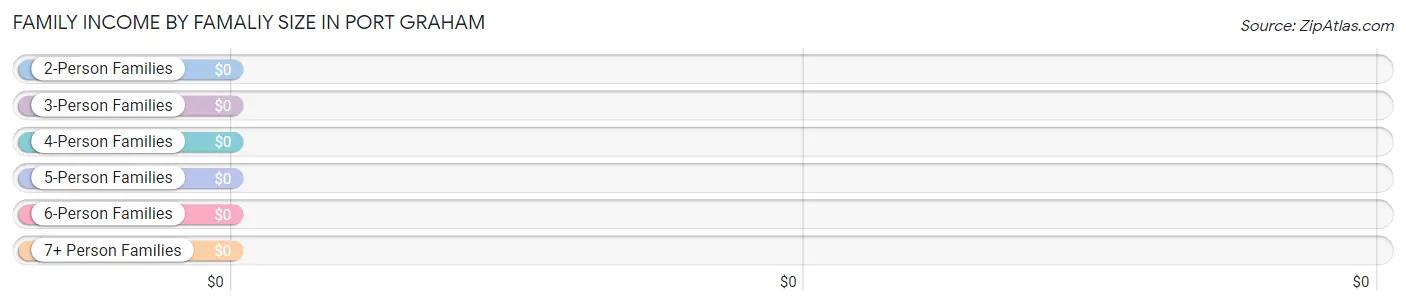
| Income Bracket | # Families | Median Income |
| 2-Person Families | 14 (43.8%) | $0 |
| 3-Person Families | 14 (43.8%) | $0 |
| 4-Person Families | 1 (3.1%) | $0 |
| 5-Person Families | 3 (9.4%) | $0 |
| 6-Person Families | 0 (0.0%) | $0 |
| 7+ Person Families | 0 (0.0%) | $0 |
| Total | 32 (100.0%) | $105,625 |
Family Income by Number of Earners in Port Graham
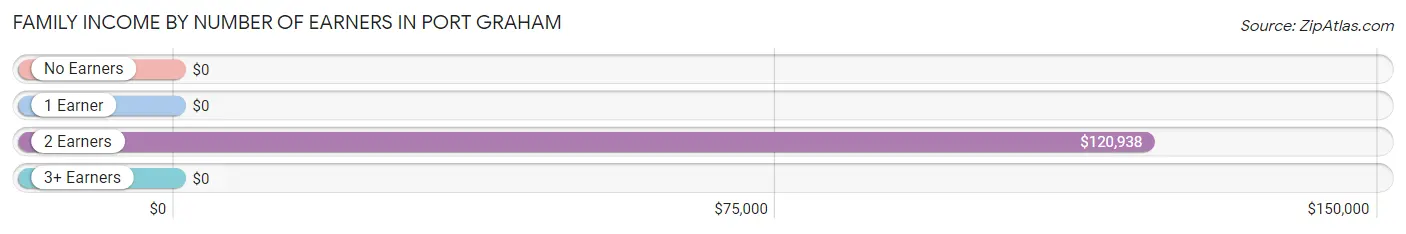
| Number of Earners | # Families | Median Income |
| No Earners | 6 (18.8%) | $0 |
| 1 Earner | 3 (9.4%) | $0 |
| 2 Earners | 23 (71.9%) | $120,938 |
| 3+ Earners | 0 (0.0%) | $0 |
| Total | 32 (100.0%) | $105,625 |
Household Income in Port Graham
Household Income Brackets in Port Graham
With 11 households falling in the category, the $15,000 to $24,999 income range is the most frequent in Port Graham, accounting for 24.4% of all households.
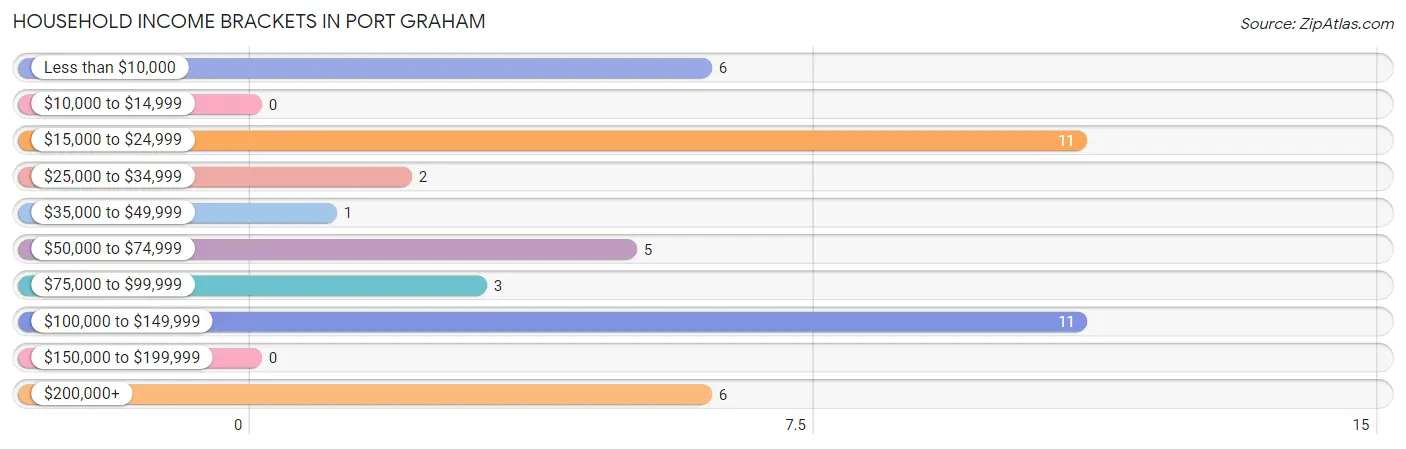
| Income Bracket | # Households | % Households |
| Less than $10,000 | 6 | 13.3% |
| $10,000 to $14,999 | 0 | 0.0% |
| $15,000 to $24,999 | 11 | 24.4% |
| $25,000 to $34,999 | 2 | 4.4% |
| $35,000 to $49,999 | 1 | 2.2% |
| $50,000 to $74,999 | 5 | 11.1% |
| $75,000 to $99,999 | 3 | 6.7% |
| $100,000 to $149,999 | 11 | 24.4% |
| $150,000 to $199,999 | 0 | 0.0% |
| $200,000+ | 6 | 13.3% |
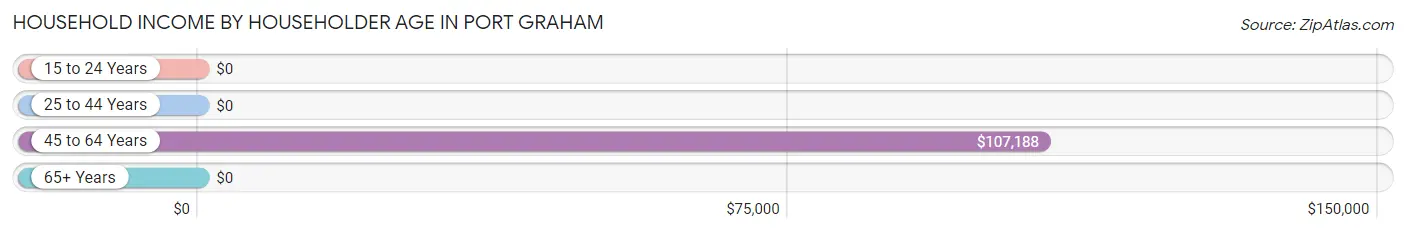
Household Income by Householder Age in Port Graham
The median household income in Port Graham is $58,438, with the highest median household income of $107,188 found in the 45 to 64 years age bracket for the primary householder. A total of 21 households (46.7%) fall into this category.
| Income Bracket | # Households | Median Income |
| 15 to 24 Years | 0 (0.0%) | $0 |
| 25 to 44 Years | 15 (33.3%) | $0 |
| 45 to 64 Years | 21 (46.7%) | $107,188 |
| 65+ Years | 9 (20.0%) | $0 |
| Total | 45 (100.0%) | $58,438 |
Poverty in Port Graham
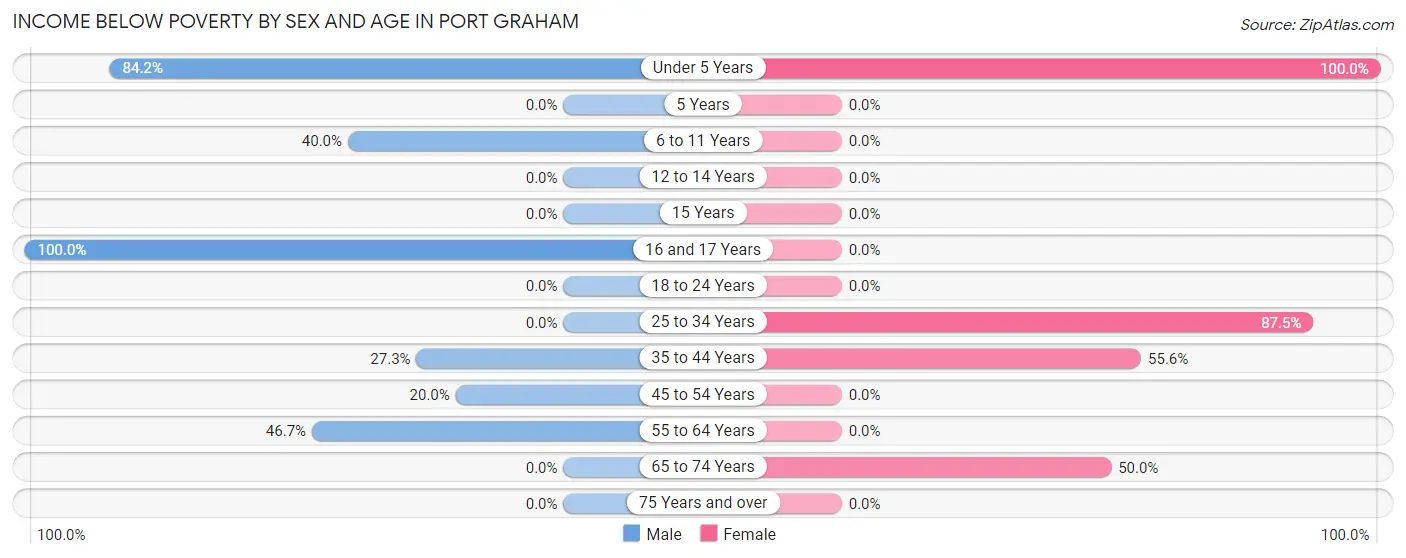
Income Below Poverty by Sex and Age in Port Graham
With 35.0% poverty level for males and 44.4% for females among the residents of Port Graham, 16 and 17 year old males and under 5 year old females are the most vulnerable to poverty, with 3 males (100.0%) and 6 females (100.0%) in their respective age groups living below the poverty level.
| Age Bracket | Male | Female |
| Under 5 Years | 16 (84.2%) | 6 (100.0%) |
| 5 Years | 0 (0.0%) | 0 (0.0%) |
| 6 to 11 Years | 4 (40.0%) | 0 (0.0%) |
| 12 to 14 Years | 0 (0.0%) | 0 (0.0%) |
| 15 Years | 0 (0.0%) | 0 (0.0%) |
| 16 and 17 Years | 3 (100.0%) | 0 (0.0%) |
| 18 to 24 Years | 0 (0.0%) | 0 (0.0%) |
| 25 to 34 Years | 0 (0.0%) | 7 (87.5%) |
| 35 to 44 Years | 3 (27.3%) | 5 (55.6%) |
| 45 to 54 Years | 1 (20.0%) | 0 (0.0%) |
| 55 to 64 Years | 7 (46.7%) | 0 (0.0%) |
| 65 to 74 Years | 0 (0.0%) | 2 (50.0%) |
| 75 Years and over | 0 (0.0%) | 0 (0.0%) |
| Total | 34 (35.0%) | 20 (44.4%) |
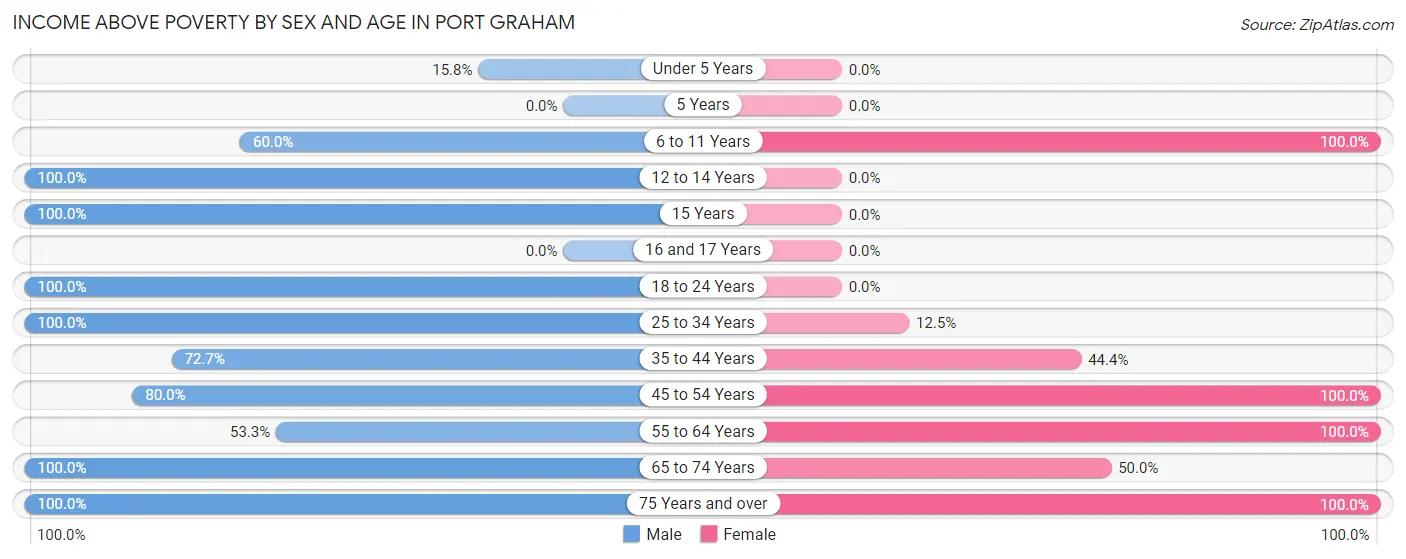
Income Above Poverty by Sex and Age in Port Graham
According to the poverty statistics in Port Graham, males aged 12 to 14 years and females aged 6 to 11 years are the age groups that are most secure financially, with 100.0% of males and 100.0% of females in these age groups living above the poverty line.
| Age Bracket | Male | Female |
| Under 5 Years | 3 (15.8%) | 0 (0.0%) |
| 5 Years | 0 (0.0%) | 0 (0.0%) |
| 6 to 11 Years | 6 (60.0%) | 1 (100.0%) |
| 12 to 14 Years | 4 (100.0%) | 0 (0.0%) |
| 15 Years | 3 (100.0%) | 0 (0.0%) |
| 16 and 17 Years | 0 (0.0%) | 0 (0.0%) |
| 18 to 24 Years | 10 (100.0%) | 0 (0.0%) |
| 25 to 34 Years | 9 (100.0%) | 1 (12.5%) |
| 35 to 44 Years | 8 (72.7%) | 4 (44.4%) |
| 45 to 54 Years | 4 (80.0%) | 4 (100.0%) |
| 55 to 64 Years | 8 (53.3%) | 11 (100.0%) |
| 65 to 74 Years | 5 (100.0%) | 2 (50.0%) |
| 75 Years and over | 3 (100.0%) | 2 (100.0%) |
| Total | 63 (64.9%) | 25 (55.6%) |
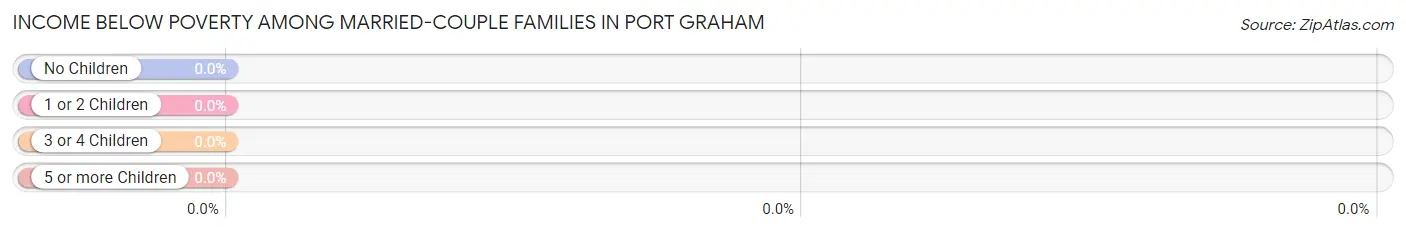
Income Below Poverty Among Married-Couple Families in Port Graham
| Children | Above Poverty | Below Poverty |
| No Children | 14 (100.0%) | 0 (0.0%) |
| 1 or 2 Children | 0 (0.0%) | 0 (0.0%) |
| 3 or 4 Children | 3 (100.0%) | 0 (0.0%) |
| 5 or more Children | 0 (0.0%) | 0 (0.0%) |
| Total | 17 (100.0%) | 0 (0.0%) |
Income Below Poverty Among Single-Parent Households in Port Graham
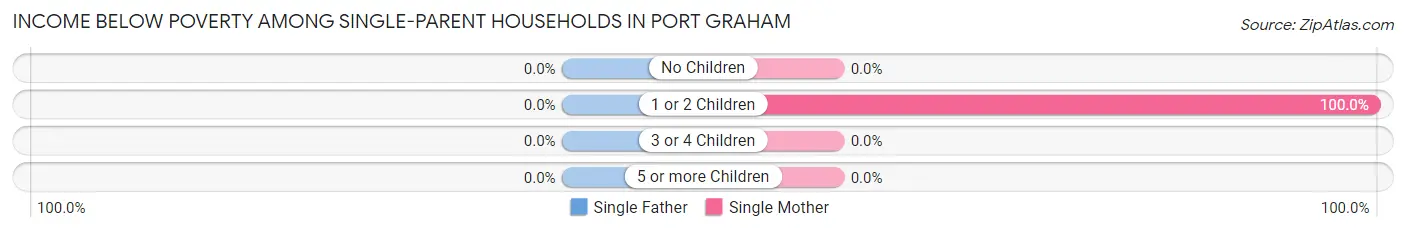
| Children | Single Father | Single Mother |
| No Children | 0 (0.0%) | 0 (0.0%) |
| 1 or 2 Children | 0 (0.0%) | 11 (100.0%) |
| 3 or 4 Children | 0 (0.0%) | 0 (0.0%) |
| 5 or more Children | 0 (0.0%) | 0 (0.0%) |
| Total | 0 (0.0%) | 11 (91.7%) |
Income Below Poverty Among Married-Couple vs Single-Parent Households in Port Graham
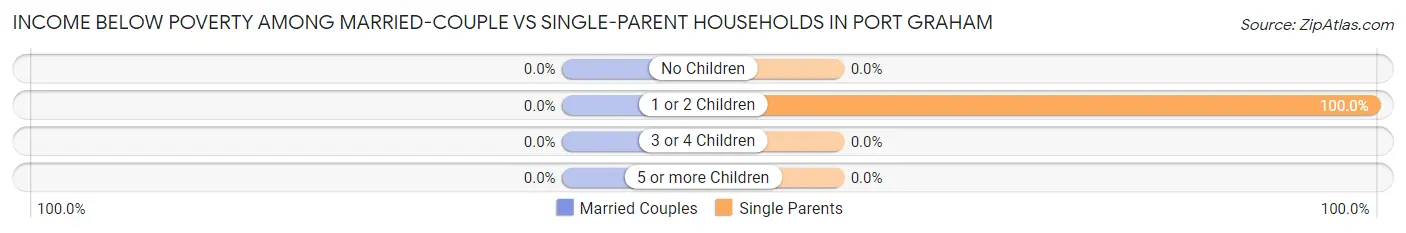
| Children | Married-Couple Families | Single-Parent Households |
| No Children | 0 (0.0%) | 0 (0.0%) |
| 1 or 2 Children | 0 (0.0%) | 11 (100.0%) |
| 3 or 4 Children | 0 (0.0%) | 0 (0.0%) |
| 5 or more Children | 0 (0.0%) | 0 (0.0%) |
| Total | 0 (0.0%) | 11 (73.3%) |
Race in Port Graham
The most populous races in Port Graham are Native / Alaskan (121 | 85.2%), White / Caucasian (11 | 7.7%), and Two or more Races (10 | 7.0%).
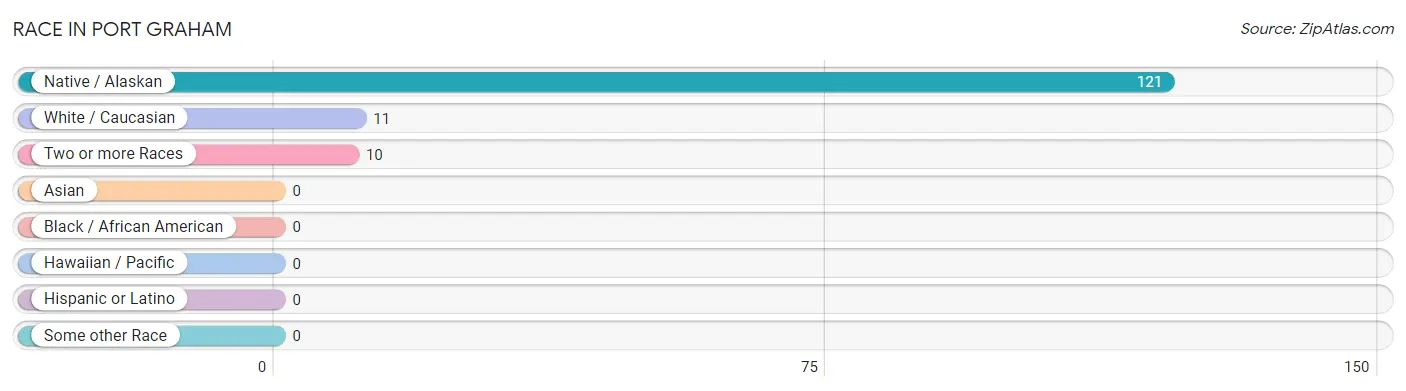
| Race | # Population | % Population |
| Asian | 0 | 0.0% |
| Black / African American | 0 | 0.0% |
| Hawaiian / Pacific | 0 | 0.0% |
| Hispanic or Latino | 0 | 0.0% |
| Native / Alaskan | 121 | 85.2% |
| White / Caucasian | 11 | 7.7% |
| Two or more Races | 10 | 7.0% |
| Some other Race | 0 | 0.0% |
| Total | 142 | 100.0% |
Ancestry in Port Graham
The most populous ancestries reported in Port Graham are Aleut (119 | 83.8%), Russian (8 | 5.6%), Inupiat (6 | 4.2%), Alaska Native (4 | 2.8%), and Alaskan Athabascan (4 | 2.8%), together accounting for 99.3% of all Port Graham residents.
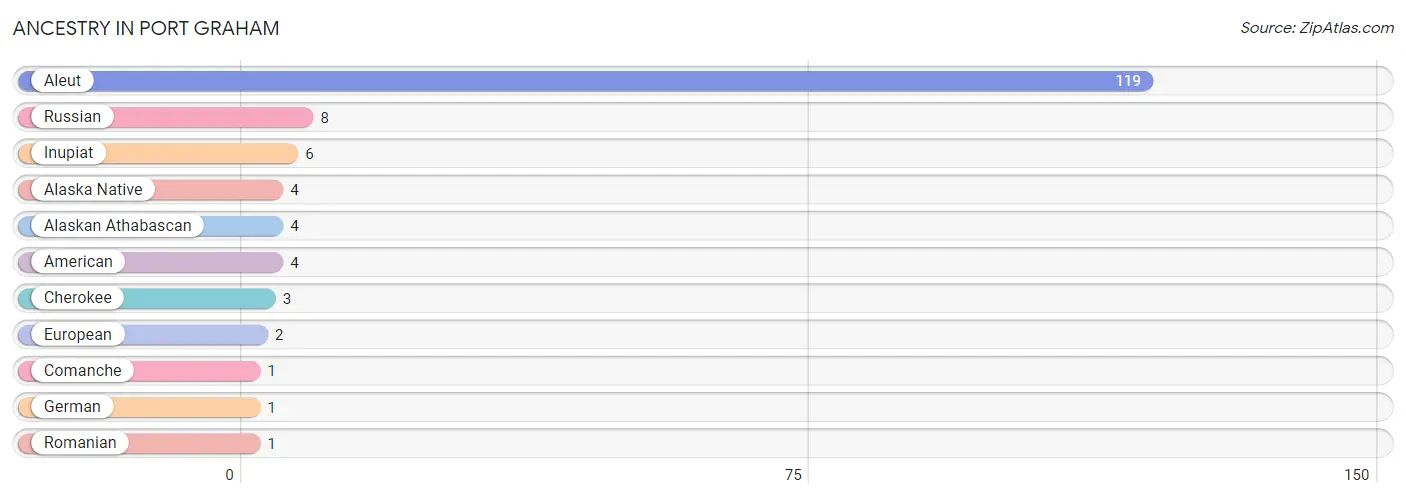
| Ancestry | # Population | % Population |
| Alaska Native | 4 | 2.8% |
| Alaskan Athabascan | 4 | 2.8% |
| Aleut | 119 | 83.8% |
| American | 4 | 2.8% |
| Cherokee | 3 | 2.1% |
| Comanche | 1 | 0.7% |
| European | 2 | 1.4% |
| German | 1 | 0.7% |
| Inupiat | 6 | 4.2% |
| Romanian | 1 | 0.7% |
| Russian | 8 | 5.6% | View All 11 Rows |
Immigrants in Port Graham

| Immigration Origin | # Population | % Population | View All 0 Rows |
Sex and Age in Port Graham
Sex and Age in Port Graham
The most populous age groups in Port Graham are Under 5 Years (19 | 19.6%) for men and 60 to 64 Years (11 | 24.4%) for women.
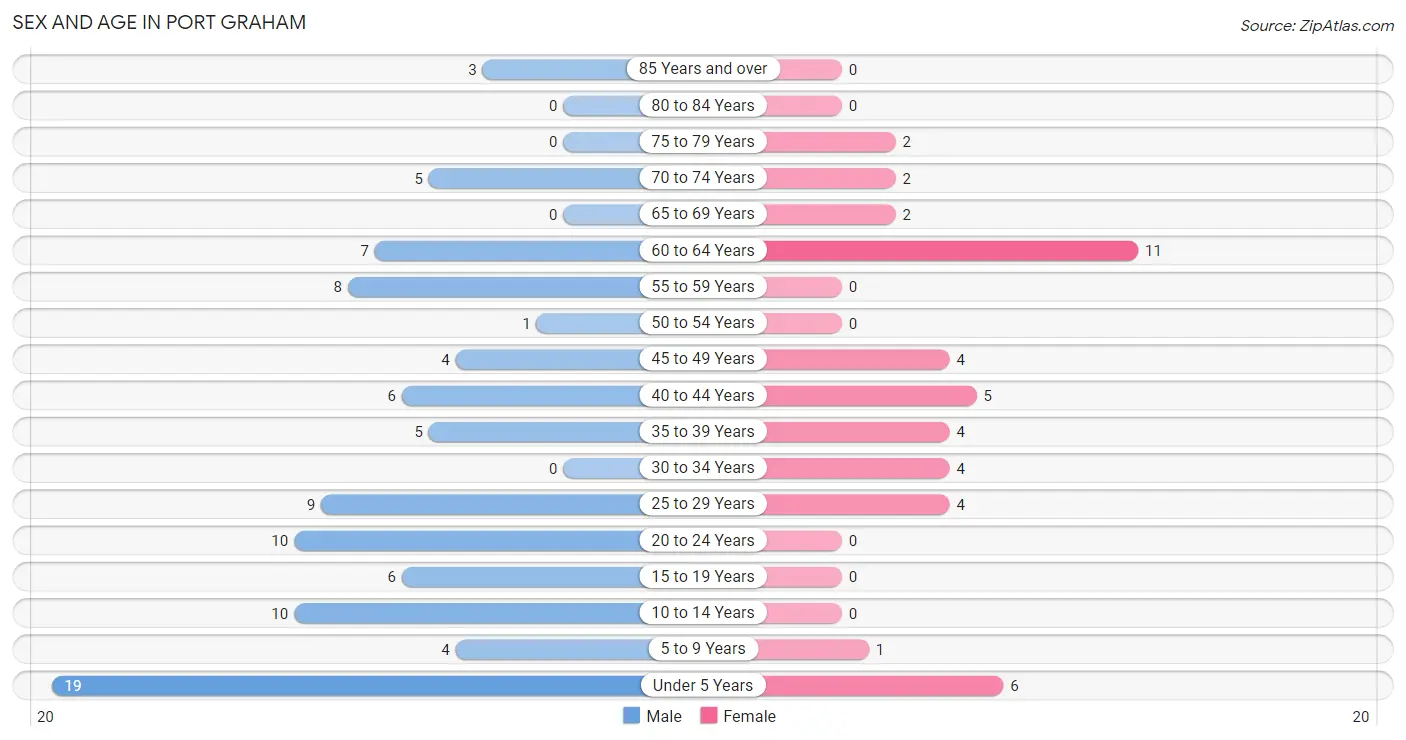
| Age Bracket | Male | Female |
| Under 5 Years | 19 (19.6%) | 6 (13.3%) |
| 5 to 9 Years | 4 (4.1%) | 1 (2.2%) |
| 10 to 14 Years | 10 (10.3%) | 0 (0.0%) |
| 15 to 19 Years | 6 (6.2%) | 0 (0.0%) |
| 20 to 24 Years | 10 (10.3%) | 0 (0.0%) |
| 25 to 29 Years | 9 (9.3%) | 4 (8.9%) |
| 30 to 34 Years | 0 (0.0%) | 4 (8.9%) |
| 35 to 39 Years | 5 (5.1%) | 4 (8.9%) |
| 40 to 44 Years | 6 (6.2%) | 5 (11.1%) |
| 45 to 49 Years | 4 (4.1%) | 4 (8.9%) |
| 50 to 54 Years | 1 (1.0%) | 0 (0.0%) |
| 55 to 59 Years | 8 (8.3%) | 0 (0.0%) |
| 60 to 64 Years | 7 (7.2%) | 11 (24.4%) |
| 65 to 69 Years | 0 (0.0%) | 2 (4.4%) |
| 70 to 74 Years | 5 (5.1%) | 2 (4.4%) |
| 75 to 79 Years | 0 (0.0%) | 2 (4.4%) |
| 80 to 84 Years | 0 (0.0%) | 0 (0.0%) |
| 85 Years and over | 3 (3.1%) | 0 (0.0%) |
| Total | 97 (100.0%) | 45 (100.0%) |
Families and Households in Port Graham
Median Family Size in Port Graham
The median family size in Port Graham is 3.41 persons per family, with single male/father families (3 | 9.4%) accounting for the largest median family size of 4.33 persons per family. On the other hand, married-couple families (17 | 53.1%) represent the smallest median family size with 2.88 persons per family.
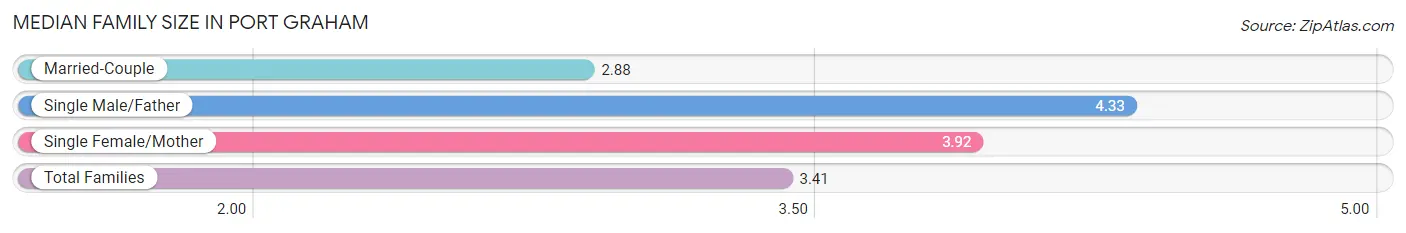
| Family Type | # Families | Family Size |
| Married-Couple | 17 (53.1%) | 2.88 |
| Single Male/Father | 3 (9.4%) | 4.33 |
| Single Female/Mother | 12 (37.5%) | 3.92 |
| Total Families | 32 (100.0%) | 3.41 |
Median Household Size in Port Graham
The median household size in Port Graham is 3.02 persons per household, with single female/mother households (12 | 26.7%) accounting for the largest median household size of 4.75 persons per household. non-family households (13 | 28.9%) represent the smallest median household size with 1.31 persons per household.
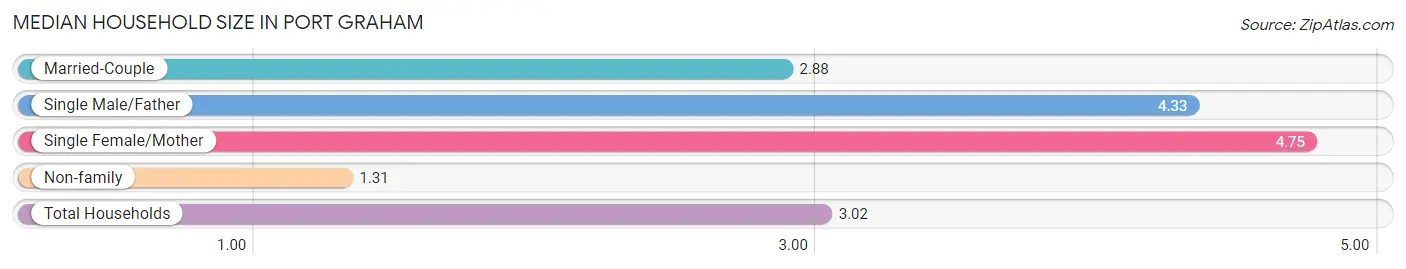
| Household Type | # Households | Household Size |
| Married-Couple | 17 (37.8%) | 2.88 |
| Single Male/Father | 3 (6.7%) | 4.33 |
| Single Female/Mother | 12 (26.7%) | 4.75 |
| Non-family | 13 (28.9%) | 1.31 |
| Total Households | 45 (100.0%) | 3.02 |
Household Size by Marriage Status in Port Graham
Out of a total of 45 households in Port Graham, 32 (71.1%) are family households, while 13 (28.9%) are nonfamily households. The most numerous type of family households are 2-person households, comprising 12, and the most common type of nonfamily households are 1-person households, comprising 11.
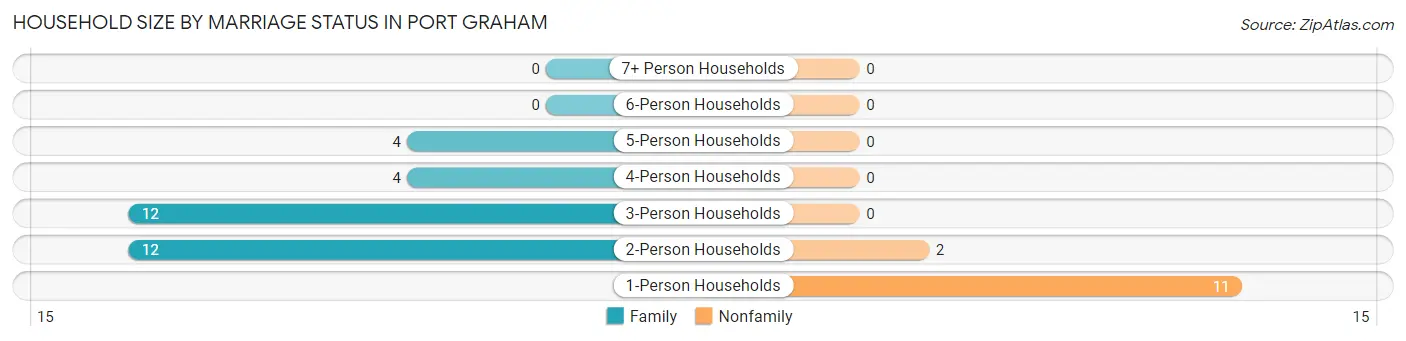
| Household Size | Family Households | Nonfamily Households |
| 1-Person Households | - | 11 (24.4%) |
| 2-Person Households | 12 (26.7%) | 2 (4.4%) |
| 3-Person Households | 12 (26.7%) | 0 (0.0%) |
| 4-Person Households | 4 (8.9%) | 0 (0.0%) |
| 5-Person Households | 4 (8.9%) | 0 (0.0%) |
| 6-Person Households | 0 (0.0%) | 0 (0.0%) |
| 7+ Person Households | 0 (0.0%) | 0 (0.0%) |
| Total | 32 (71.1%) | 13 (28.9%) |
Female Fertility in Port Graham
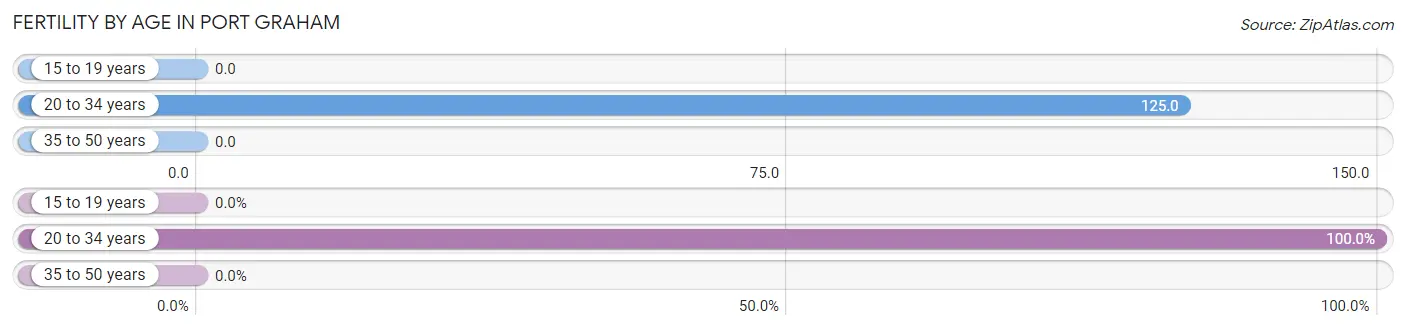
Fertility by Age in Port Graham
Average fertility rate in Port Graham is 48.0 births per 1,000 women. Women in the age bracket of 20 to 34 years have the highest fertility rate with 125.0 births per 1,000 women. Women in the age bracket of 20 to 34 years acount for 100.0% of all women with births.
| Age Bracket | Women with Births | Births / 1,000 Women |
| 15 to 19 years | 0 (0.0%) | 0.0 |
| 20 to 34 years | 1 (100.0%) | 125.0 |
| 35 to 50 years | 0 (0.0%) | 0.0 |
| Total | 1 (100.0%) | 48.0 |
Fertility by Age by Marriage Status in Port Graham
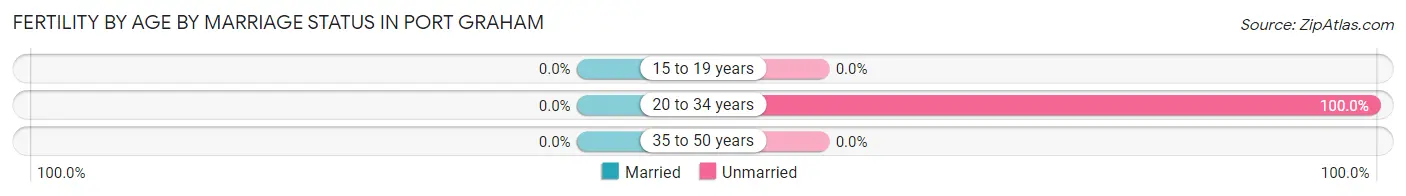
| Age Bracket | Married | Unmarried |
| 15 to 19 years | 0 (0.0%) | 0 (0.0%) |
| 20 to 34 years | 0 (0.0%) | 1 (100.0%) |
| 35 to 50 years | 0 (0.0%) | 0 (0.0%) |
| Total | 0 (0.0%) | 1 (100.0%) |
Fertility by Education in Port Graham
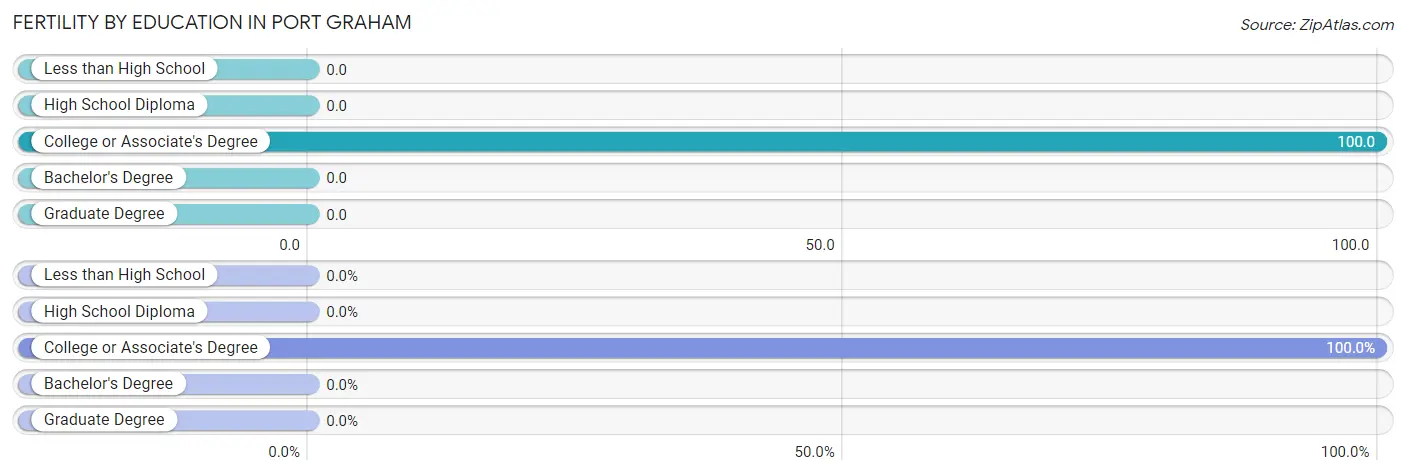
| Educational Attainment | Women with Births | Births / 1,000 Women |
| Less than High School | 0 (0.0%) | 0.0 |
| High School Diploma | 0 (0.0%) | 0.0 |
| College or Associate's Degree | 1 (100.0%) | 100.0 |
| Bachelor's Degree | 0 (0.0%) | 0.0 |
| Graduate Degree | 0 (0.0%) | 0.0 |
| Total | 1 (100.0%) | 48.0 |
Fertility by Education by Marriage Status in Port Graham
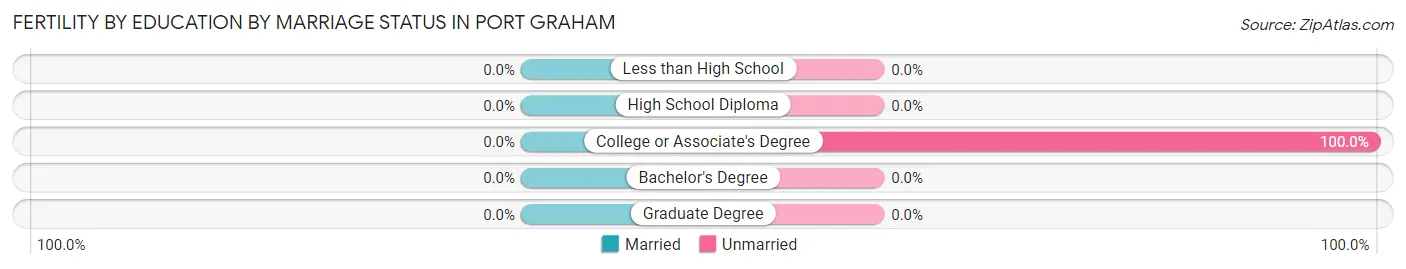
| Educational Attainment | Married | Unmarried |
| Less than High School | 0 (0.0%) | 0 (0.0%) |
| High School Diploma | 0 (0.0%) | 0 (0.0%) |
| College or Associate's Degree | 0 (0.0%) | 1 (100.0%) |
| Bachelor's Degree | 0 (0.0%) | 0 (0.0%) |
| Graduate Degree | 0 (0.0%) | 0 (0.0%) |
| Total | 0 (0.0%) | 1 (100.0%) |
Employment Characteristics in Port Graham
Employment by Class of Employer in Port Graham
Among the 68 employed individuals in Port Graham, not-for-profit organizations (27 | 39.7%), private company employees (16 | 23.5%), and local government employees (11 | 16.2%) make up the most common classes of employment.
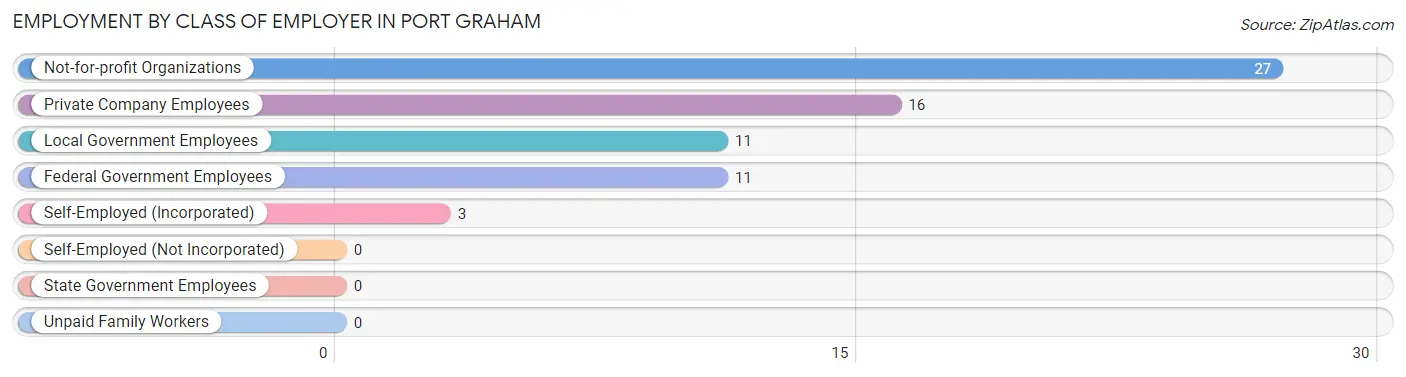
| Employer Class | # Employees | % Employees |
| Private Company Employees | 16 | 23.5% |
| Self-Employed (Incorporated) | 3 | 4.4% |
| Self-Employed (Not Incorporated) | 0 | 0.0% |
| Not-for-profit Organizations | 27 | 39.7% |
| Local Government Employees | 11 | 16.2% |
| State Government Employees | 0 | 0.0% |
| Federal Government Employees | 11 | 16.2% |
| Unpaid Family Workers | 0 | 0.0% |
| Total | 68 | 100.0% |
Employment Status by Age in Port Graham
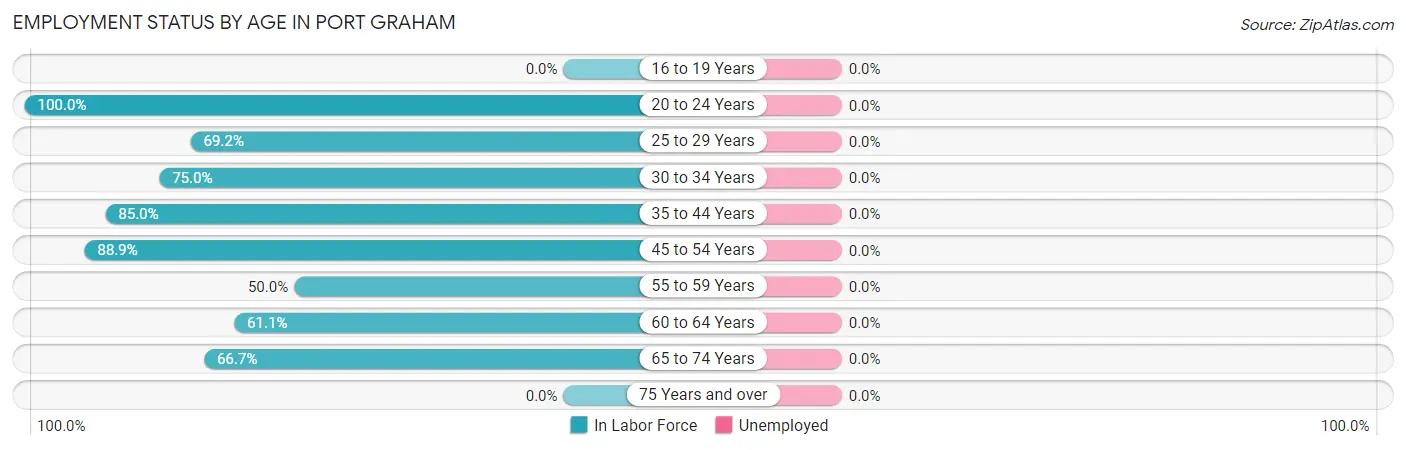
| Age Bracket | In Labor Force | Unemployed |
| 16 to 19 Years | 0 (0.0%) | 0 (0.0%) |
| 20 to 24 Years | 10 (100.0%) | 0 (0.0%) |
| 25 to 29 Years | 9 (69.2%) | 0 (0.0%) |
| 30 to 34 Years | 3 (75.0%) | 0 (0.0%) |
| 35 to 44 Years | 17 (85.0%) | 0 (0.0%) |
| 45 to 54 Years | 8 (88.9%) | 0 (0.0%) |
| 55 to 59 Years | 4 (50.0%) | 0 (0.0%) |
| 60 to 64 Years | 11 (61.1%) | 0 (0.0%) |
| 65 to 74 Years | 6 (66.7%) | 0 (0.0%) |
| 75 Years and over | 0 (0.0%) | 0 (0.0%) |
| Total | 68 (68.7%) | 0 (0.0%) |
Employment Status by Educational Attainment in Port Graham
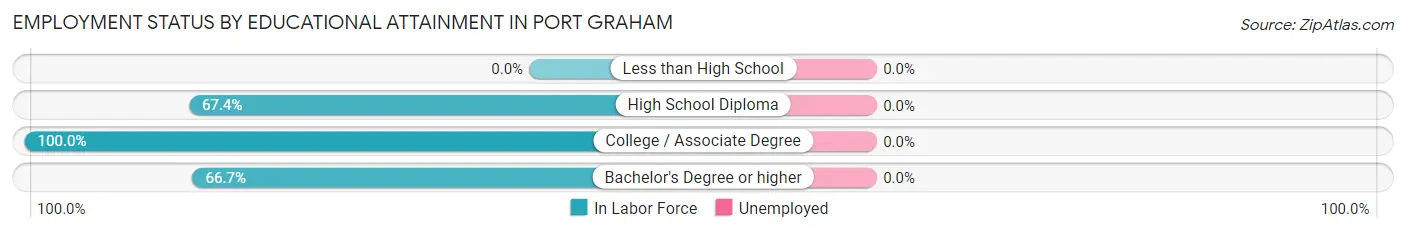
| Educational Attainment | In Labor Force | Unemployed |
| Less than High School | 0 (0.0%) | 0 (0.0%) |
| High School Diploma | 31 (67.4%) | 0 (0.0%) |
| College / Associate Degree | 19 (100.0%) | 0 (0.0%) |
| Bachelor's Degree or higher | 2 (66.7%) | 0 (0.0%) |
| Total | 52 (72.2%) | 0 (0.0%) |
Employment Occupations by Sex in Port Graham
Management, Business, Science and Arts Occupations
The most common Management, Business, Science and Arts occupations in Port Graham are Management (21 | 30.9%), Community & Social Service (3 | 4.4%), Education, Arts & Media (2 | 2.9%), and Education Instruction & Library (1 | 1.5%).
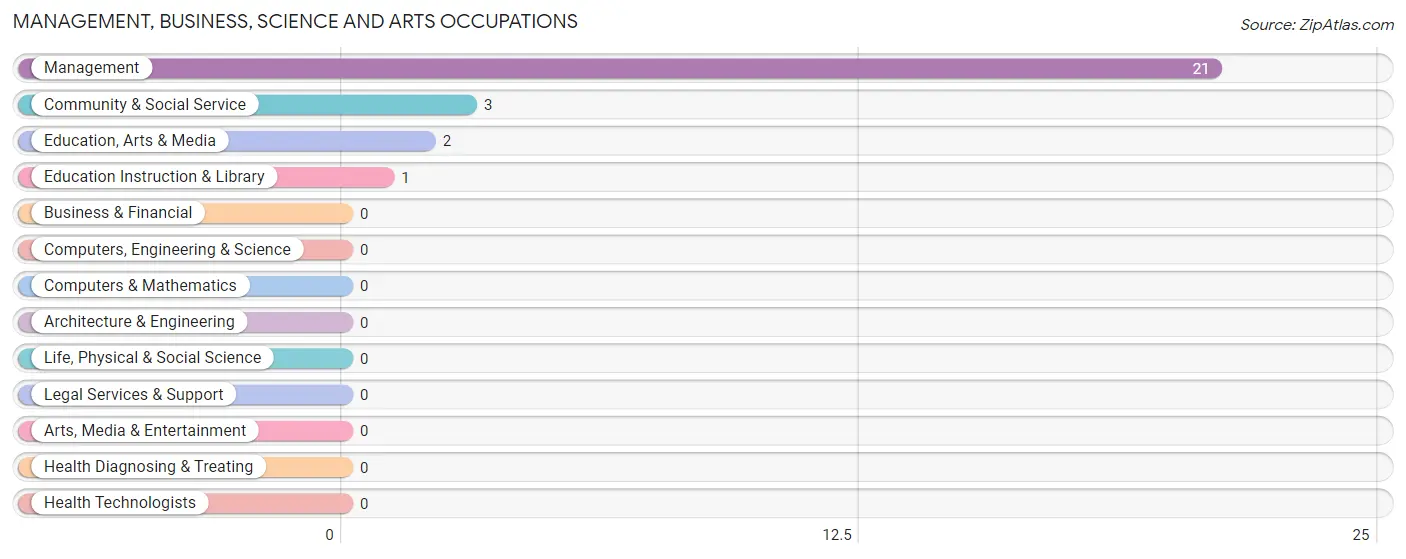
Management, Business, Science and Arts Occupations by Sex
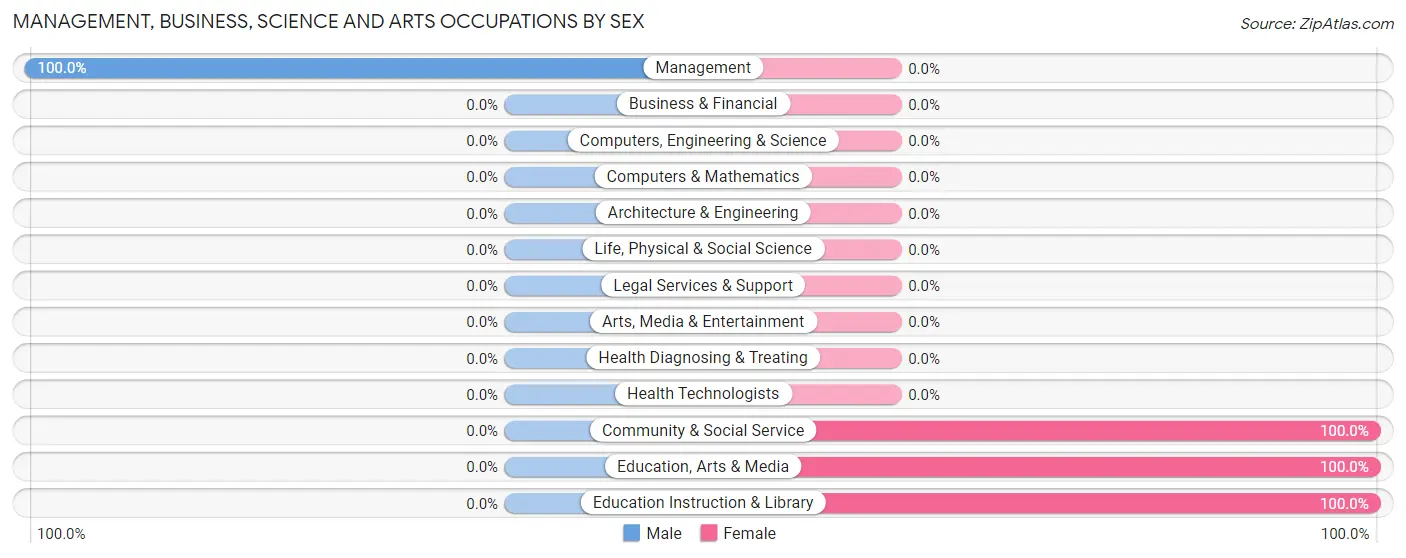
| Occupation | Male | Female |
| Management | 21 (100.0%) | 0 (0.0%) |
| Business & Financial | 0 (0.0%) | 0 (0.0%) |
| Computers, Engineering & Science | 0 (0.0%) | 0 (0.0%) |
| Computers & Mathematics | 0 (0.0%) | 0 (0.0%) |
| Architecture & Engineering | 0 (0.0%) | 0 (0.0%) |
| Life, Physical & Social Science | 0 (0.0%) | 0 (0.0%) |
| Community & Social Service | 0 (0.0%) | 3 (100.0%) |
| Education, Arts & Media | 0 (0.0%) | 2 (100.0%) |
| Legal Services & Support | 0 (0.0%) | 0 (0.0%) |
| Education Instruction & Library | 0 (0.0%) | 1 (100.0%) |
| Arts, Media & Entertainment | 0 (0.0%) | 0 (0.0%) |
| Health Diagnosing & Treating | 0 (0.0%) | 0 (0.0%) |
| Health Technologists | 0 (0.0%) | 0 (0.0%) |
| Total (Category) | 21 (87.5%) | 3 (12.5%) |
| Total (Overall) | 41 (60.3%) | 27 (39.7%) |
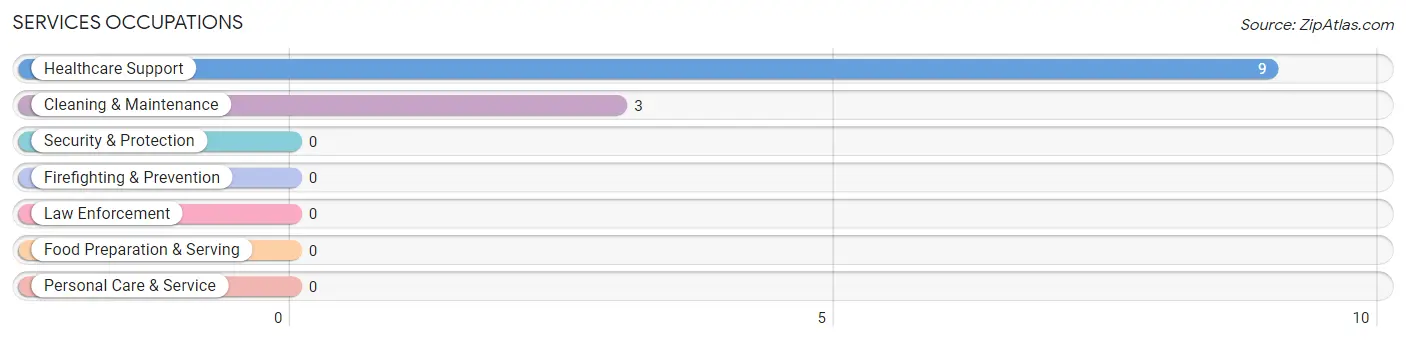
Services Occupations
The most common Services occupations in Port Graham are Healthcare Support (9 | 13.2%), and Cleaning & Maintenance (3 | 4.4%).
Services Occupations by Sex
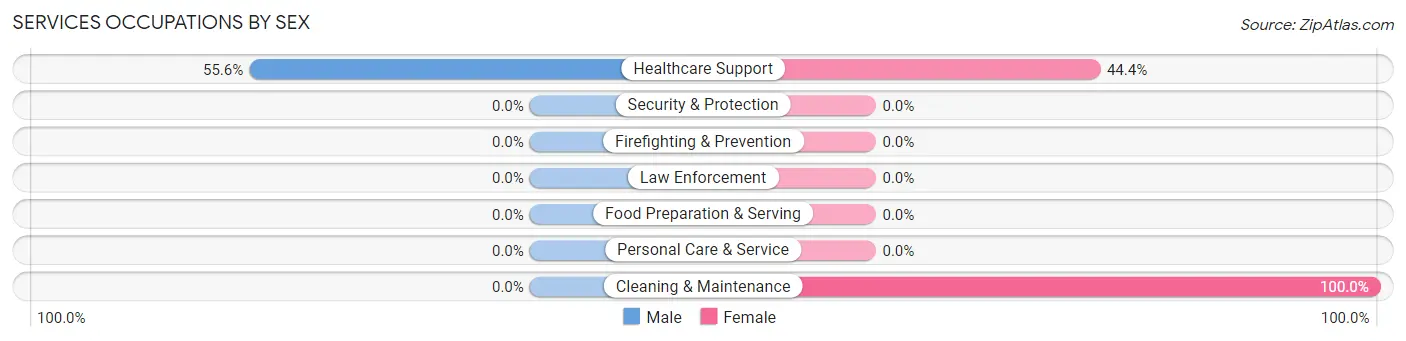
| Occupation | Male | Female |
| Healthcare Support | 5 (55.6%) | 4 (44.4%) |
| Security & Protection | 0 (0.0%) | 0 (0.0%) |
| Firefighting & Prevention | 0 (0.0%) | 0 (0.0%) |
| Law Enforcement | 0 (0.0%) | 0 (0.0%) |
| Food Preparation & Serving | 0 (0.0%) | 0 (0.0%) |
| Cleaning & Maintenance | 0 (0.0%) | 3 (100.0%) |
| Personal Care & Service | 0 (0.0%) | 0 (0.0%) |
| Total (Category) | 5 (41.7%) | 7 (58.3%) |
| Total (Overall) | 41 (60.3%) | 27 (39.7%) |
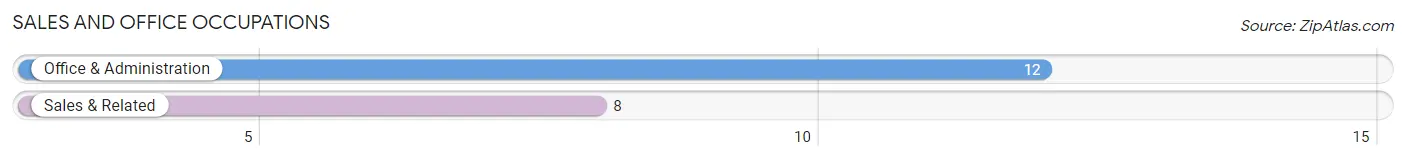
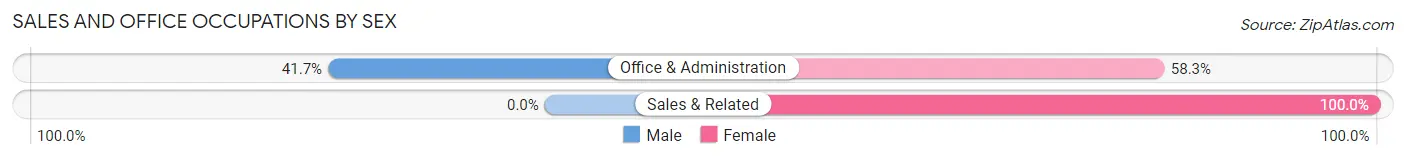
Sales and Office Occupations
The most common Sales and Office occupations in Port Graham are Office & Administration (12 | 17.6%), and Sales & Related (8 | 11.8%).
Sales and Office Occupations by Sex
| Occupation | Male | Female |
| Sales & Related | 0 (0.0%) | 8 (100.0%) |
| Office & Administration | 5 (41.7%) | 7 (58.3%) |
| Total (Category) | 5 (25.0%) | 15 (75.0%) |
| Total (Overall) | 41 (60.3%) | 27 (39.7%) |
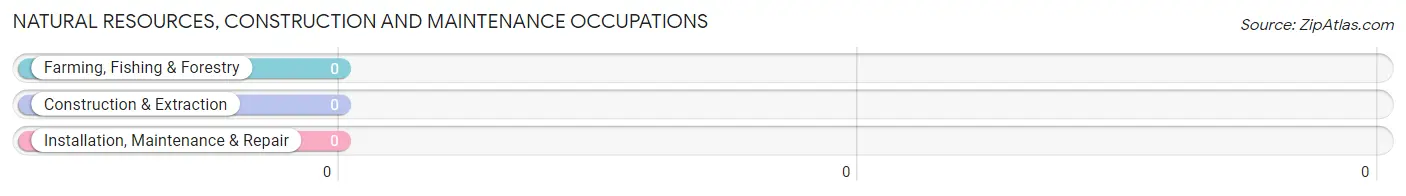
Natural Resources, Construction and Maintenance Occupations
Natural Resources, Construction and Maintenance Occupations by Sex
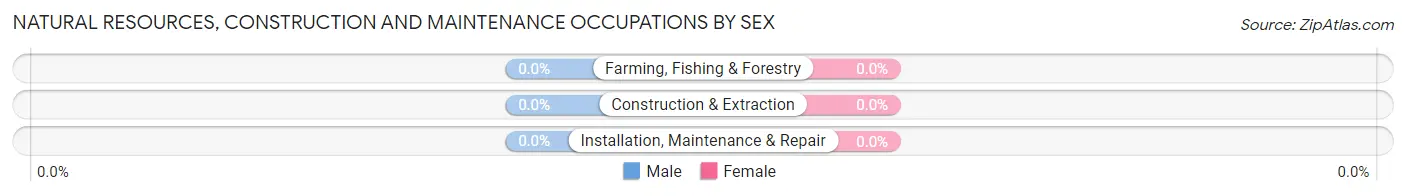
| Occupation | Male | Female |
| Farming, Fishing & Forestry | 0 (0.0%) | 0 (0.0%) |
| Construction & Extraction | 0 (0.0%) | 0 (0.0%) |
| Installation, Maintenance & Repair | 0 (0.0%) | 0 (0.0%) |
| Total (Category) | 0 (0.0%) | 0 (0.0%) |
| Total (Overall) | 41 (60.3%) | 27 (39.7%) |
Production, Transportation and Moving Occupations
The most common Production, Transportation and Moving occupations in Port Graham are Material Moving (7 | 10.3%), and Production (5 | 7.3%).
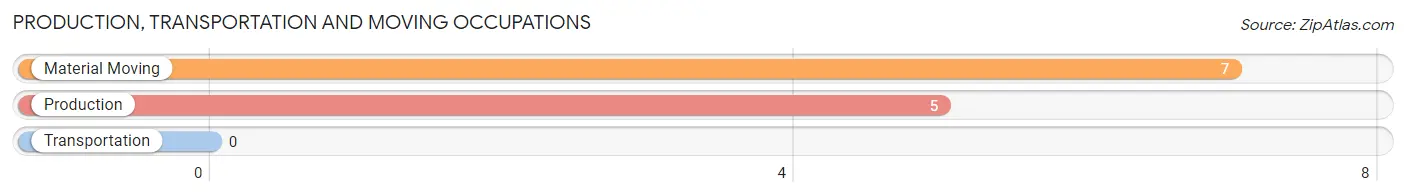
Production, Transportation and Moving Occupations by Sex
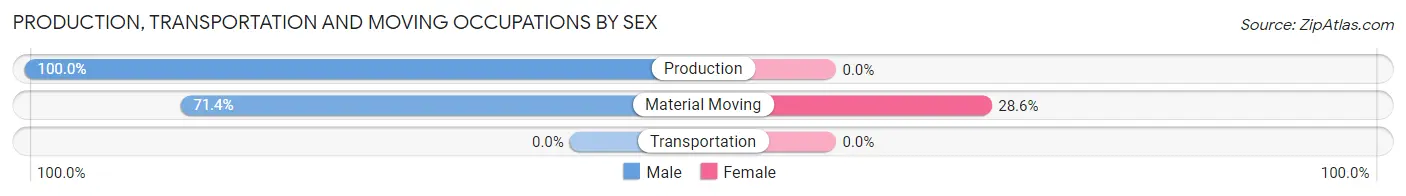
| Occupation | Male | Female |
| Production | 5 (100.0%) | 0 (0.0%) |
| Transportation | 0 (0.0%) | 0 (0.0%) |
| Material Moving | 5 (71.4%) | 2 (28.6%) |
| Total (Category) | 10 (83.3%) | 2 (16.7%) |
| Total (Overall) | 41 (60.3%) | 27 (39.7%) |
Employment Industries by Sex in Port Graham
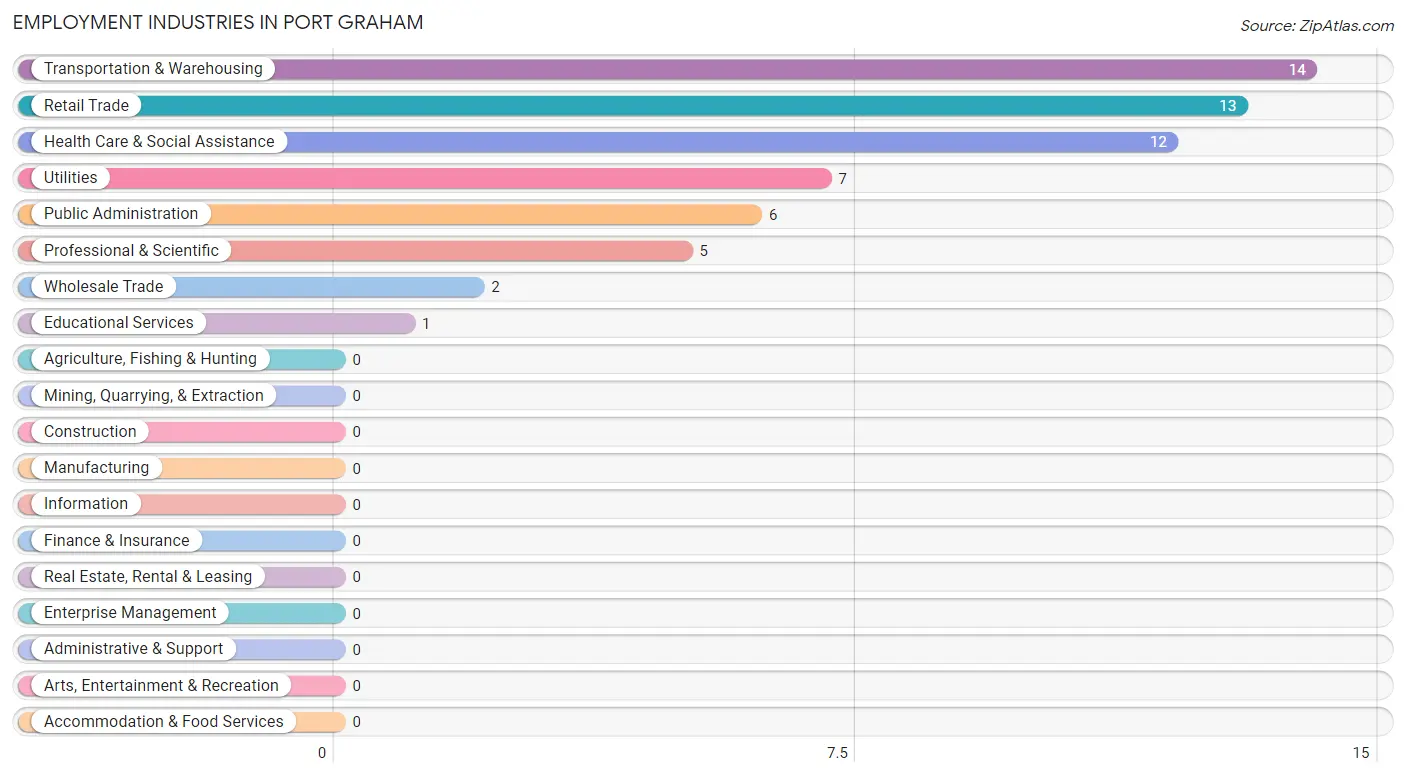
Employment Industries in Port Graham
The major employment industries in Port Graham include Transportation & Warehousing (14 | 20.6%), Retail Trade (13 | 19.1%), Health Care & Social Assistance (12 | 17.6%), Utilities (7 | 10.3%), and Public Administration (6 | 8.8%).
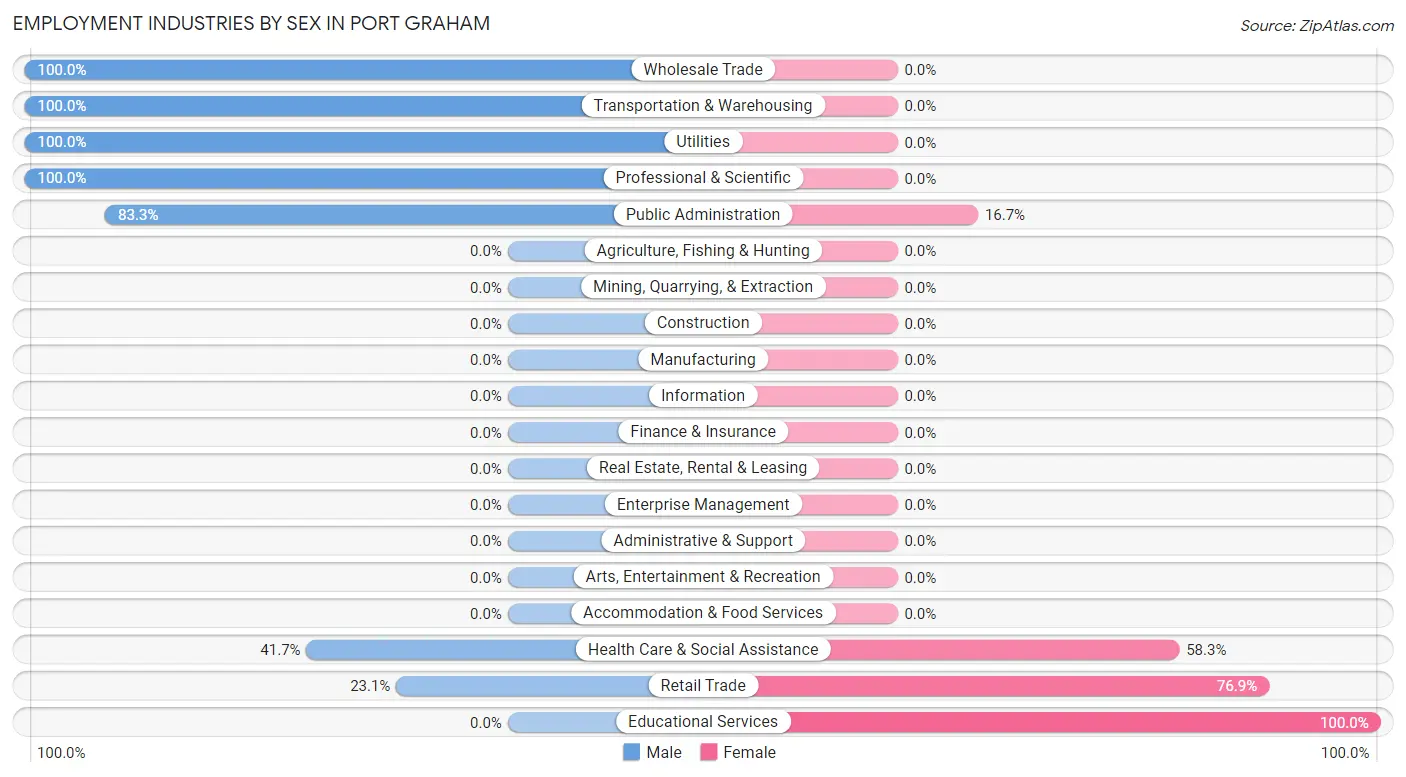
Employment Industries by Sex in Port Graham
The Port Graham industries that see more men than women are Wholesale Trade (100.0%), Transportation & Warehousing (100.0%), and Utilities (100.0%), whereas the industries that tend to have a higher number of women are Educational Services (100.0%), Retail Trade (76.9%), and Health Care & Social Assistance (58.3%).
| Industry | Male | Female |
| Agriculture, Fishing & Hunting | 0 (0.0%) | 0 (0.0%) |
| Mining, Quarrying, & Extraction | 0 (0.0%) | 0 (0.0%) |
| Construction | 0 (0.0%) | 0 (0.0%) |
| Manufacturing | 0 (0.0%) | 0 (0.0%) |
| Wholesale Trade | 2 (100.0%) | 0 (0.0%) |
| Retail Trade | 3 (23.1%) | 10 (76.9%) |
| Transportation & Warehousing | 14 (100.0%) | 0 (0.0%) |
| Utilities | 7 (100.0%) | 0 (0.0%) |
| Information | 0 (0.0%) | 0 (0.0%) |
| Finance & Insurance | 0 (0.0%) | 0 (0.0%) |
| Real Estate, Rental & Leasing | 0 (0.0%) | 0 (0.0%) |
| Professional & Scientific | 5 (100.0%) | 0 (0.0%) |
| Enterprise Management | 0 (0.0%) | 0 (0.0%) |
| Administrative & Support | 0 (0.0%) | 0 (0.0%) |
| Educational Services | 0 (0.0%) | 1 (100.0%) |
| Health Care & Social Assistance | 5 (41.7%) | 7 (58.3%) |
| Arts, Entertainment & Recreation | 0 (0.0%) | 0 (0.0%) |
| Accommodation & Food Services | 0 (0.0%) | 0 (0.0%) |
| Public Administration | 5 (83.3%) | 1 (16.7%) |
| Total | 41 (60.3%) | 27 (39.7%) |
Education in Port Graham
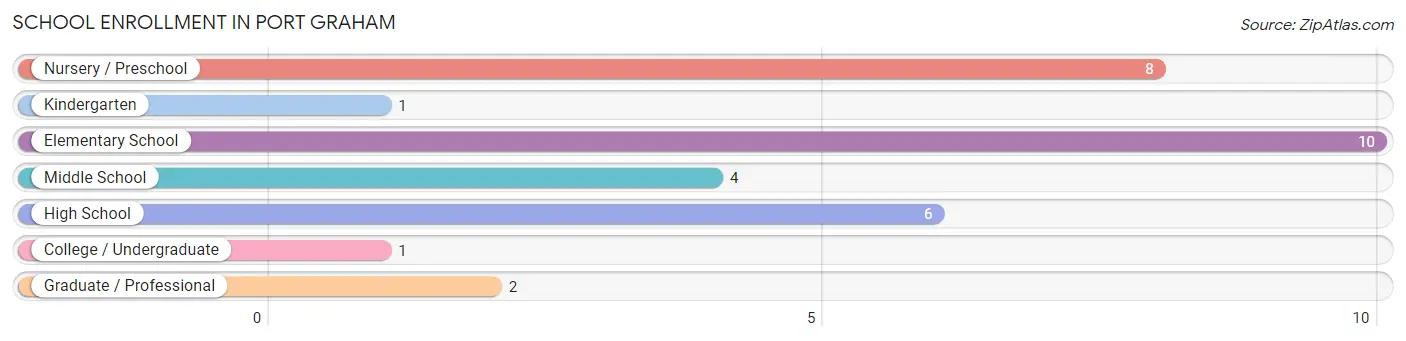
School Enrollment in Port Graham
The most common levels of schooling among the 32 students in Port Graham are elementary school (10 | 31.2%), nursery / preschool (8 | 25.0%), and high school (6 | 18.8%).
| School Level | # Students | % Students |
| Nursery / Preschool | 8 | 25.0% |
| Kindergarten | 1 | 3.1% |
| Elementary School | 10 | 31.2% |
| Middle School | 4 | 12.5% |
| High School | 6 | 18.8% |
| College / Undergraduate | 1 | 3.1% |
| Graduate / Professional | 2 | 6.2% |
| Total | 32 | 100.0% |
School Enrollment by Age by Funding Source in Port Graham
Out of a total of 32 students who are enrolled in schools in Port Graham, 5 (15.6%) attend a private institution, while the remaining 27 (84.4%) are enrolled in public schools. The age group of 25 to 34 year olds has the highest likelihood of being enrolled in private schools, with 2 (66.7% in the age bracket) enrolled. Conversely, the age group of 3 to 4 year olds has the lowest likelihood of being enrolled in a private school, with 8 (100.0% in the age bracket) attending a public institution.
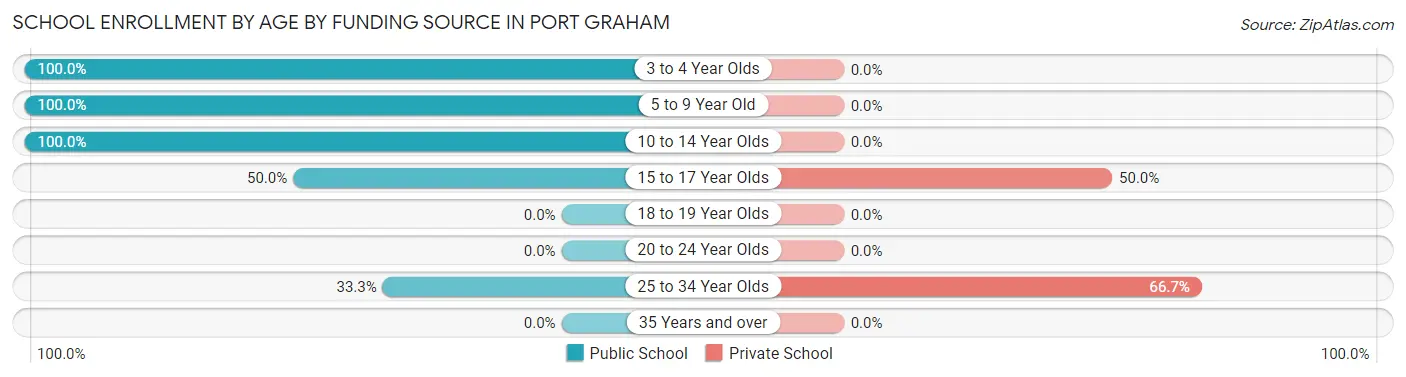
| Age Bracket | Public School | Private School |
| 3 to 4 Year Olds | 8 (100.0%) | 0 (0.0%) |
| 5 to 9 Year Old | 5 (100.0%) | 0 (0.0%) |
| 10 to 14 Year Olds | 10 (100.0%) | 0 (0.0%) |
| 15 to 17 Year Olds | 3 (50.0%) | 3 (50.0%) |
| 18 to 19 Year Olds | 0 (0.0%) | 0 (0.0%) |
| 20 to 24 Year Olds | 0 (0.0%) | 0 (0.0%) |
| 25 to 34 Year Olds | 1 (33.3%) | 2 (66.7%) |
| 35 Years and over | 0 (0.0%) | 0 (0.0%) |
| Total | 27 (84.4%) | 5 (15.6%) |
Educational Attainment by Field of Study in Port Graham
Social sciences (2 | 66.7%), and psychology (1 | 33.3%) are the most common fields of study among 3 individuals in Port Graham who have obtained a bachelor's degree or higher.
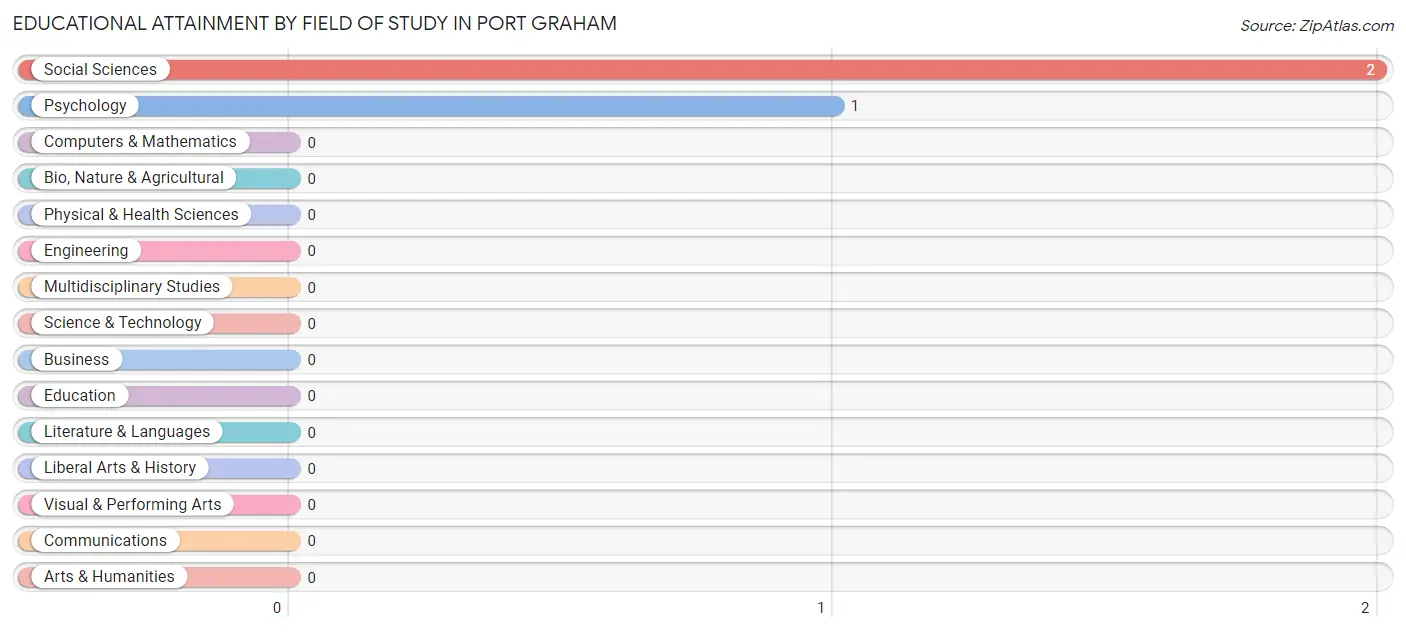
| Field of Study | # Graduates | % Graduates |
| Computers & Mathematics | 0 | 0.0% |
| Bio, Nature & Agricultural | 0 | 0.0% |
| Physical & Health Sciences | 0 | 0.0% |
| Psychology | 1 | 33.3% |
| Social Sciences | 2 | 66.7% |
| Engineering | 0 | 0.0% |
| Multidisciplinary Studies | 0 | 0.0% |
| Science & Technology | 0 | 0.0% |
| Business | 0 | 0.0% |
| Education | 0 | 0.0% |
| Literature & Languages | 0 | 0.0% |
| Liberal Arts & History | 0 | 0.0% |
| Visual & Performing Arts | 0 | 0.0% |
| Communications | 0 | 0.0% |
| Arts & Humanities | 0 | 0.0% |
| Total | 3 | 100.0% |
Transportation & Commute in Port Graham
Vehicle Availability by Sex in Port Graham
The most prevalent vehicle ownership categories in Port Graham are males with 1 vehicle (24, accounting for 58.5%) and females with 1 vehicle (9, making up 96.0%).
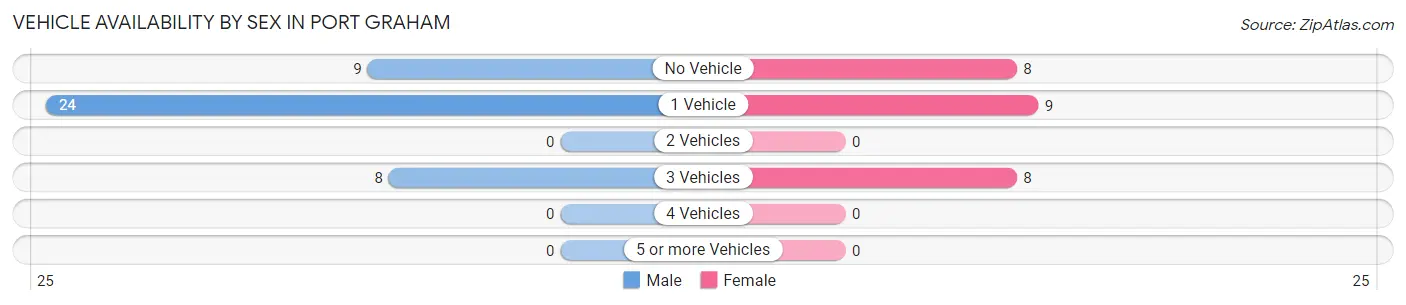
| Vehicles Available | Male | Female |
| No Vehicle | 9 (22.0%) | 8 (32.0%) |
| 1 Vehicle | 24 (58.5%) | 9 (36.0%) |
| 2 Vehicles | 0 (0.0%) | 0 (0.0%) |
| 3 Vehicles | 8 (19.5%) | 8 (32.0%) |
| 4 Vehicles | 0 (0.0%) | 0 (0.0%) |
| 5 or more Vehicles | 0 (0.0%) | 0 (0.0%) |
| Total | 41 (100.0%) | 25 (100.0%) |
Commute Time in Port Graham
The most frequently occuring commute durations in Port Graham are less than 5 minutes (26 commuters, 43.3%), 5 to 9 minutes (16 commuters, 26.7%), and 10 to 14 minutes (12 commuters, 20.0%).
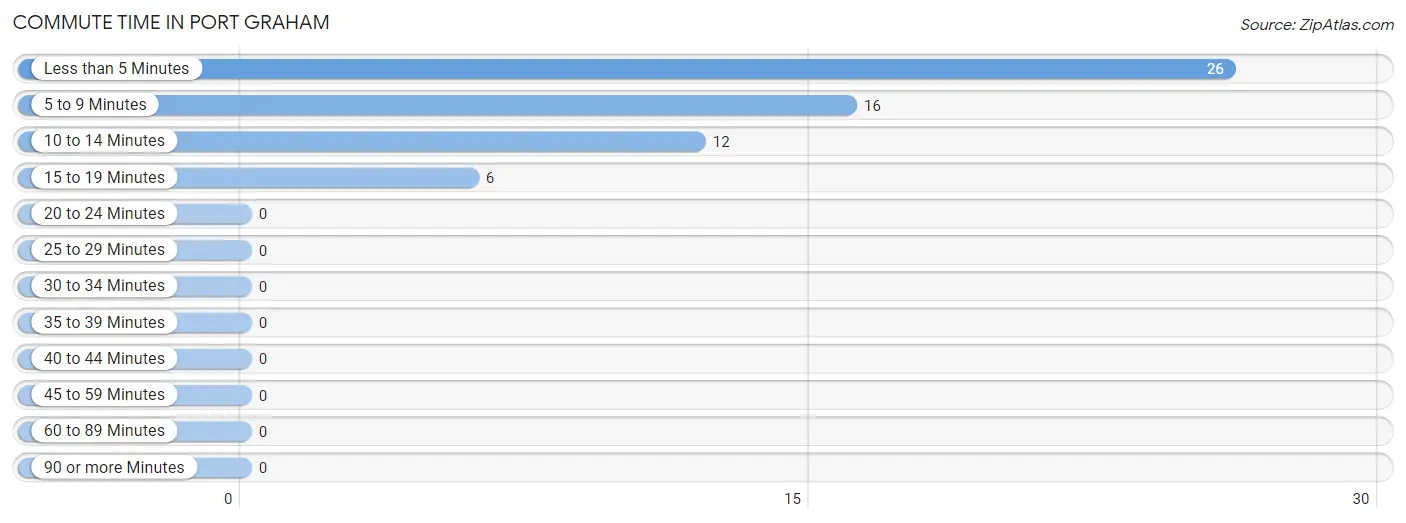
| Commute Time | # Commuters | % Commuters |
| Less than 5 Minutes | 26 | 43.3% |
| 5 to 9 Minutes | 16 | 26.7% |
| 10 to 14 Minutes | 12 | 20.0% |
| 15 to 19 Minutes | 6 | 10.0% |
| 20 to 24 Minutes | 0 | 0.0% |
| 25 to 29 Minutes | 0 | 0.0% |
| 30 to 34 Minutes | 0 | 0.0% |
| 35 to 39 Minutes | 0 | 0.0% |
| 40 to 44 Minutes | 0 | 0.0% |
| 45 to 59 Minutes | 0 | 0.0% |
| 60 to 89 Minutes | 0 | 0.0% |
| 90 or more Minutes | 0 | 0.0% |
Commute Time by Sex in Port Graham
The most common commute times in Port Graham are less than 5 minutes (18 commuters, 52.9%) for males and less than 5 minutes (8 commuters, 30.8%) for females.
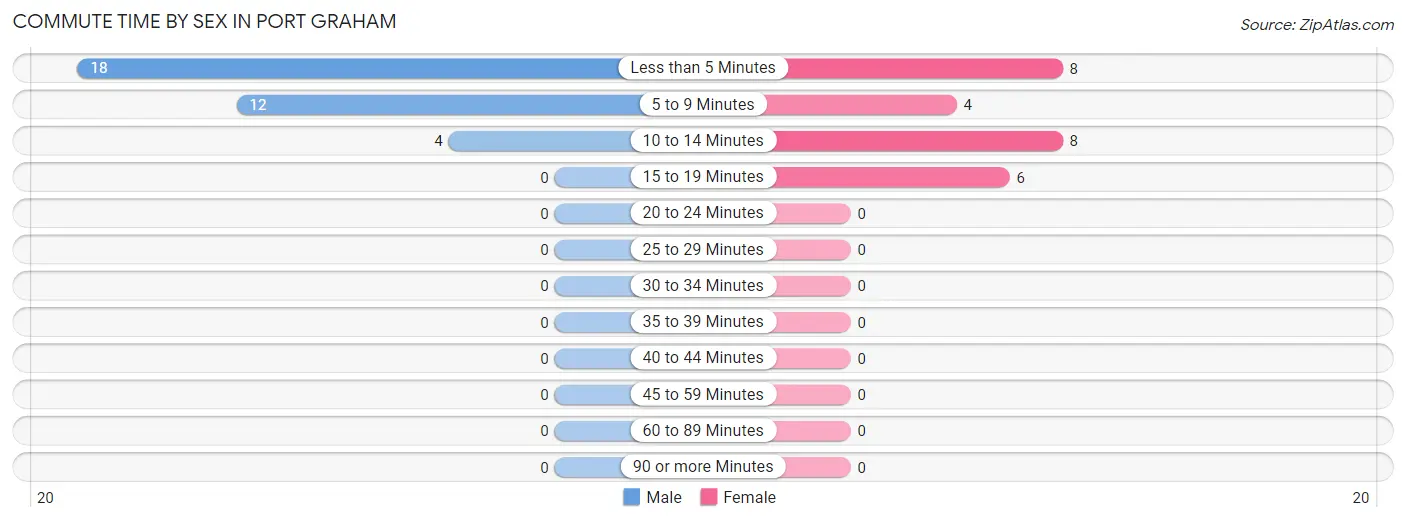
| Commute Time | Male | Female |
| Less than 5 Minutes | 18 (52.9%) | 8 (30.8%) |
| 5 to 9 Minutes | 12 (35.3%) | 4 (15.4%) |
| 10 to 14 Minutes | 4 (11.8%) | 8 (30.8%) |
| 15 to 19 Minutes | 0 (0.0%) | 6 (23.1%) |
| 20 to 24 Minutes | 0 (0.0%) | 0 (0.0%) |
| 25 to 29 Minutes | 0 (0.0%) | 0 (0.0%) |
| 30 to 34 Minutes | 0 (0.0%) | 0 (0.0%) |
| 35 to 39 Minutes | 0 (0.0%) | 0 (0.0%) |
| 40 to 44 Minutes | 0 (0.0%) | 0 (0.0%) |
| 45 to 59 Minutes | 0 (0.0%) | 0 (0.0%) |
| 60 to 89 Minutes | 0 (0.0%) | 0 (0.0%) |
| 90 or more Minutes | 0 (0.0%) | 0 (0.0%) |
Time of Departure to Work by Sex in Port Graham
The most frequent times of departure to work in Port Graham are 9:00 AM to 9:59 AM (26, 76.5%) for males and 9:00 AM to 9:59 AM (11, 42.3%) for females.
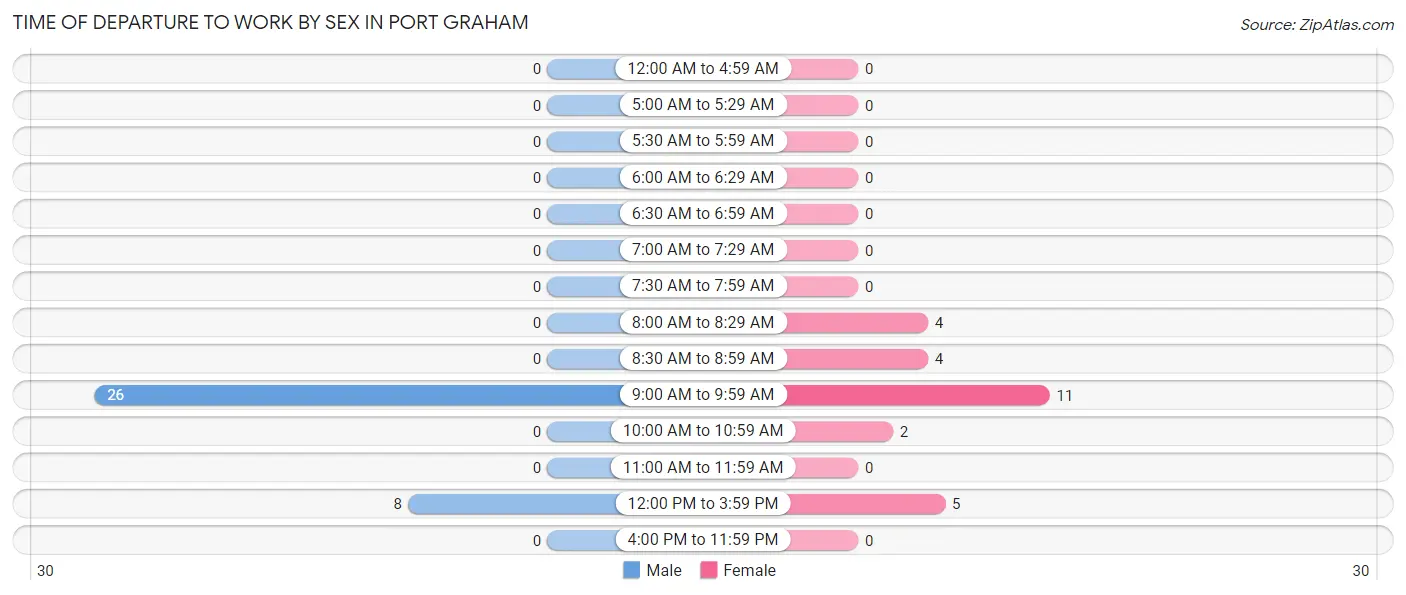
| Time of Departure | Male | Female |
| 12:00 AM to 4:59 AM | 0 (0.0%) | 0 (0.0%) |
| 5:00 AM to 5:29 AM | 0 (0.0%) | 0 (0.0%) |
| 5:30 AM to 5:59 AM | 0 (0.0%) | 0 (0.0%) |
| 6:00 AM to 6:29 AM | 0 (0.0%) | 0 (0.0%) |
| 6:30 AM to 6:59 AM | 0 (0.0%) | 0 (0.0%) |
| 7:00 AM to 7:29 AM | 0 (0.0%) | 0 (0.0%) |
| 7:30 AM to 7:59 AM | 0 (0.0%) | 0 (0.0%) |
| 8:00 AM to 8:29 AM | 0 (0.0%) | 4 (15.4%) |
| 8:30 AM to 8:59 AM | 0 (0.0%) | 4 (15.4%) |
| 9:00 AM to 9:59 AM | 26 (76.5%) | 11 (42.3%) |
| 10:00 AM to 10:59 AM | 0 (0.0%) | 2 (7.7%) |
| 11:00 AM to 11:59 AM | 0 (0.0%) | 0 (0.0%) |
| 12:00 PM to 3:59 PM | 8 (23.5%) | 5 (19.2%) |
| 4:00 PM to 11:59 PM | 0 (0.0%) | 0 (0.0%) |
| Total | 34 (100.0%) | 26 (100.0%) |
Housing Occupancy in Port Graham
Occupancy by Ownership in Port Graham
Of the total 45 dwellings in Port Graham, owner-occupied units account for 28 (62.2%), while renter-occupied units make up 17 (37.8%).
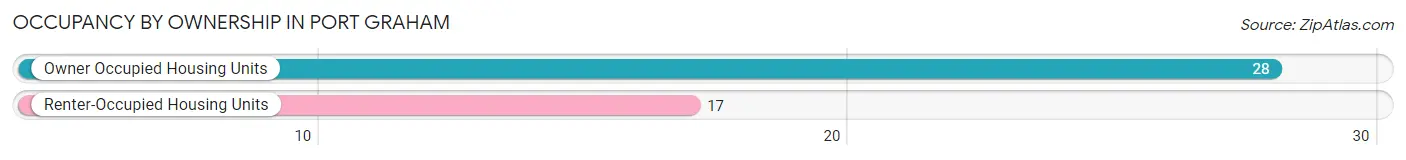
| Occupancy | # Housing Units | % Housing Units |
| Owner Occupied Housing Units | 28 | 62.2% |
| Renter-Occupied Housing Units | 17 | 37.8% |
| Total Occupied Housing Units | 45 | 100.0% |
Occupancy by Household Size in Port Graham
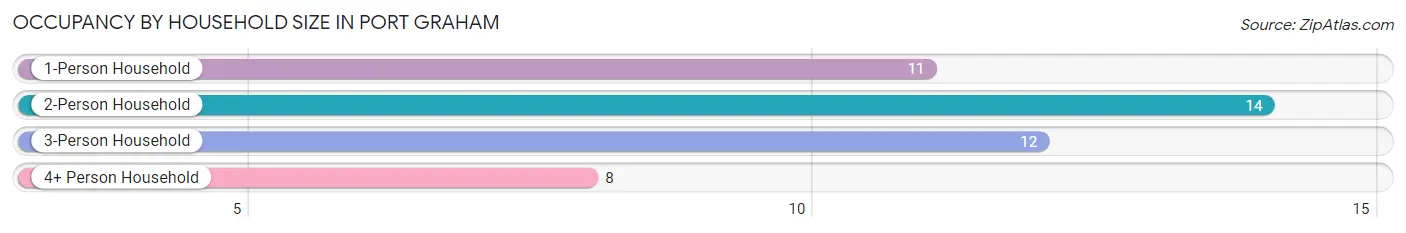
| Household Size | # Housing Units | % Housing Units |
| 1-Person Household | 11 | 24.4% |
| 2-Person Household | 14 | 31.1% |
| 3-Person Household | 12 | 26.7% |
| 4+ Person Household | 8 | 17.8% |
| Total Housing Units | 45 | 100.0% |
Occupancy by Ownership by Household Size in Port Graham
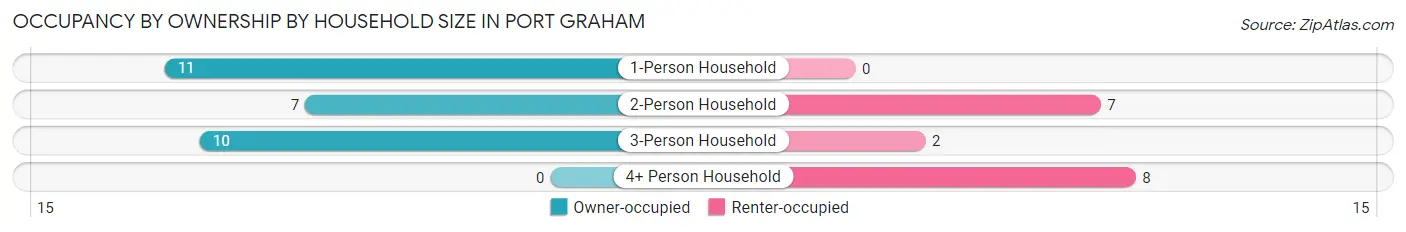
| Household Size | Owner-occupied | Renter-occupied |
| 1-Person Household | 11 (100.0%) | 0 (0.0%) |
| 2-Person Household | 7 (50.0%) | 7 (50.0%) |
| 3-Person Household | 10 (83.3%) | 2 (16.7%) |
| 4+ Person Household | 0 (0.0%) | 8 (100.0%) |
| Total Housing Units | 28 (62.2%) | 17 (37.8%) |
Occupancy by Educational Attainment in Port Graham
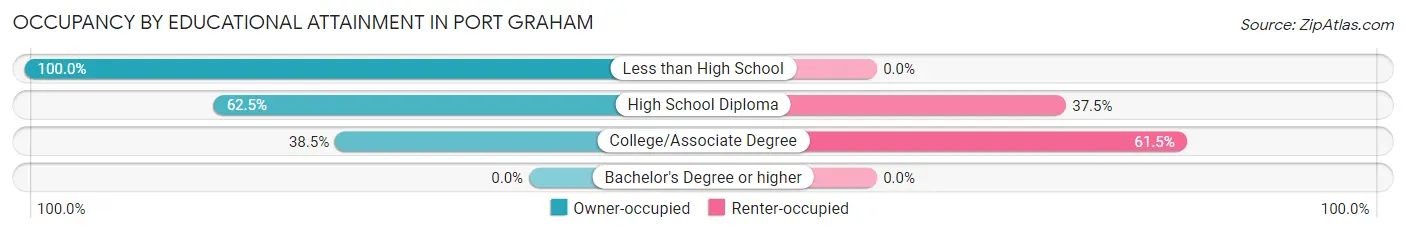
| Household Size | Owner-occupied | Renter-occupied |
| Less than High School | 8 (100.0%) | 0 (0.0%) |
| High School Diploma | 15 (62.5%) | 9 (37.5%) |
| College/Associate Degree | 5 (38.5%) | 8 (61.5%) |
| Bachelor's Degree or higher | 0 (0.0%) | 0 (0.0%) |
Occupancy by Age of Householder in Port Graham
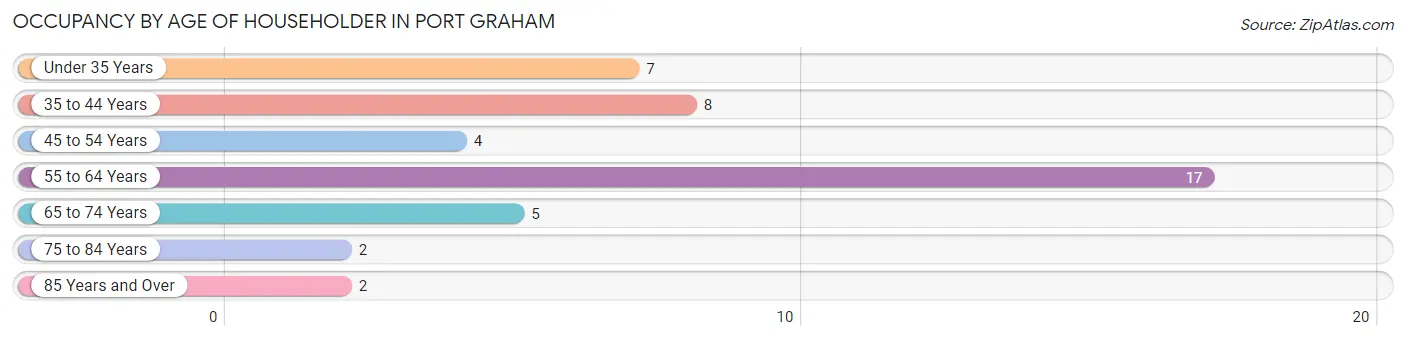
| Age Bracket | # Households | % Households |
| Under 35 Years | 7 | 15.6% |
| 35 to 44 Years | 8 | 17.8% |
| 45 to 54 Years | 4 | 8.9% |
| 55 to 64 Years | 17 | 37.8% |
| 65 to 74 Years | 5 | 11.1% |
| 75 to 84 Years | 2 | 4.4% |
| 85 Years and Over | 2 | 4.4% |
| Total | 45 | 100.0% |
Housing Finances in Port Graham
Median Income by Occupancy in Port Graham
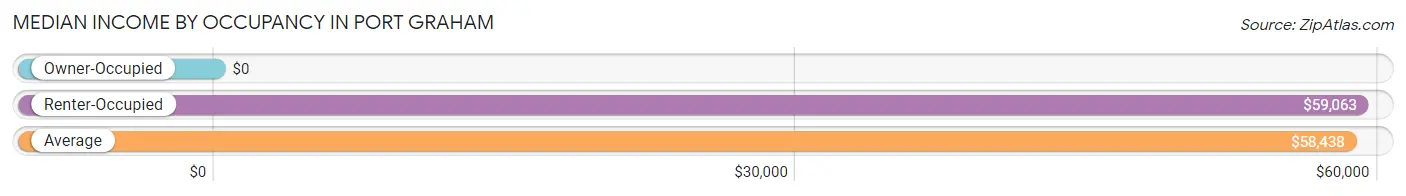
| Occupancy Type | # Households | Median Income |
| Owner-Occupied | 28 (62.2%) | $0 |
| Renter-Occupied | 17 (37.8%) | $59,063 |
| Average | 45 (100.0%) | $58,438 |
Occupancy by Householder Income Bracket in Port Graham
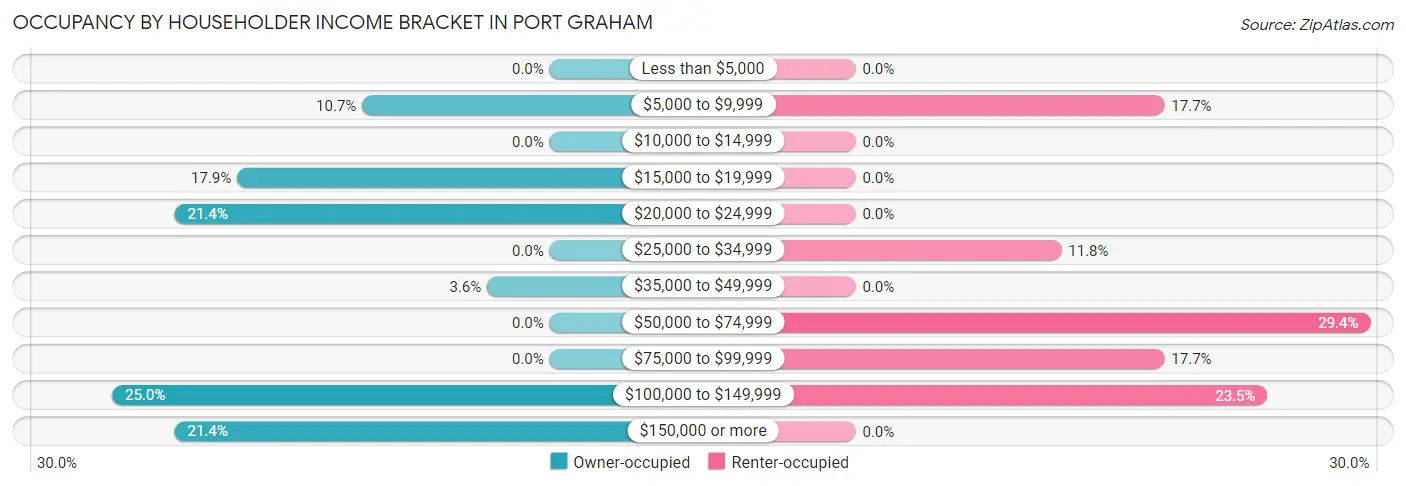
| Income Bracket | Owner-occupied | Renter-occupied |
| Less than $5,000 | 0 (0.0%) | 0 (0.0%) |
| $5,000 to $9,999 | 3 (10.7%) | 3 (17.6%) |
| $10,000 to $14,999 | 0 (0.0%) | 0 (0.0%) |
| $15,000 to $19,999 | 5 (17.9%) | 0 (0.0%) |
| $20,000 to $24,999 | 6 (21.4%) | 0 (0.0%) |
| $25,000 to $34,999 | 0 (0.0%) | 2 (11.8%) |
| $35,000 to $49,999 | 1 (3.6%) | 0 (0.0%) |
| $50,000 to $74,999 | 0 (0.0%) | 5 (29.4%) |
| $75,000 to $99,999 | 0 (0.0%) | 3 (17.6%) |
| $100,000 to $149,999 | 7 (25.0%) | 4 (23.5%) |
| $150,000 or more | 6 (21.4%) | 0 (0.0%) |
| Total | 28 (100.0%) | 17 (100.0%) |
Monthly Housing Cost Tiers in Port Graham
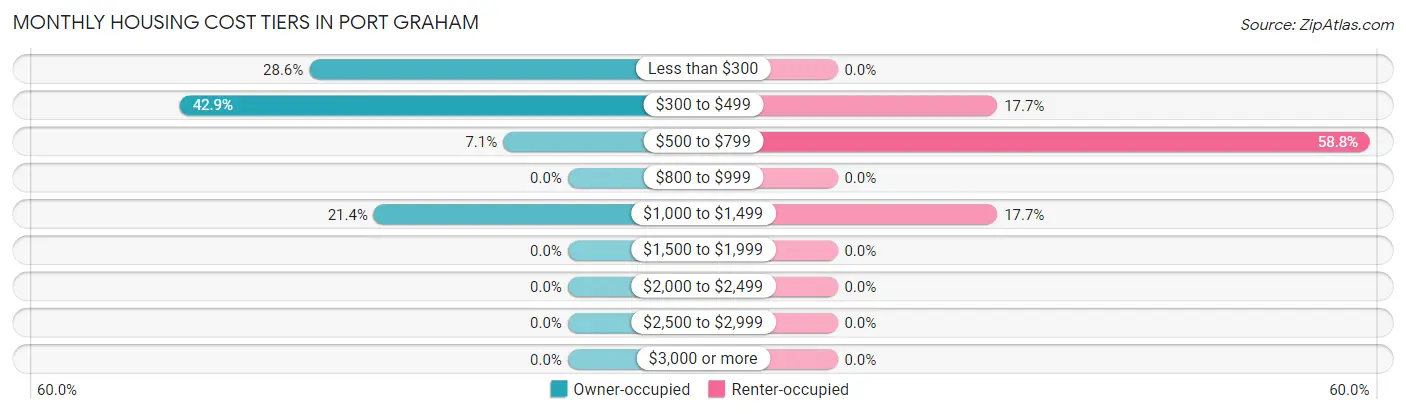
| Monthly Cost | Owner-occupied | Renter-occupied |
| Less than $300 | 8 (28.6%) | 0 (0.0%) |
| $300 to $499 | 12 (42.9%) | 3 (17.6%) |
| $500 to $799 | 2 (7.1%) | 10 (58.8%) |
| $800 to $999 | 0 (0.0%) | 0 (0.0%) |
| $1,000 to $1,499 | 6 (21.4%) | 3 (17.6%) |
| $1,500 to $1,999 | 0 (0.0%) | 0 (0.0%) |
| $2,000 to $2,499 | 0 (0.0%) | 0 (0.0%) |
| $2,500 to $2,999 | 0 (0.0%) | 0 (0.0%) |
| $3,000 or more | 0 (0.0%) | 0 (0.0%) |
| Total | 28 (100.0%) | 17 (100.0%) |
Physical Housing Characteristics in Port Graham
Housing Structures in Port Graham
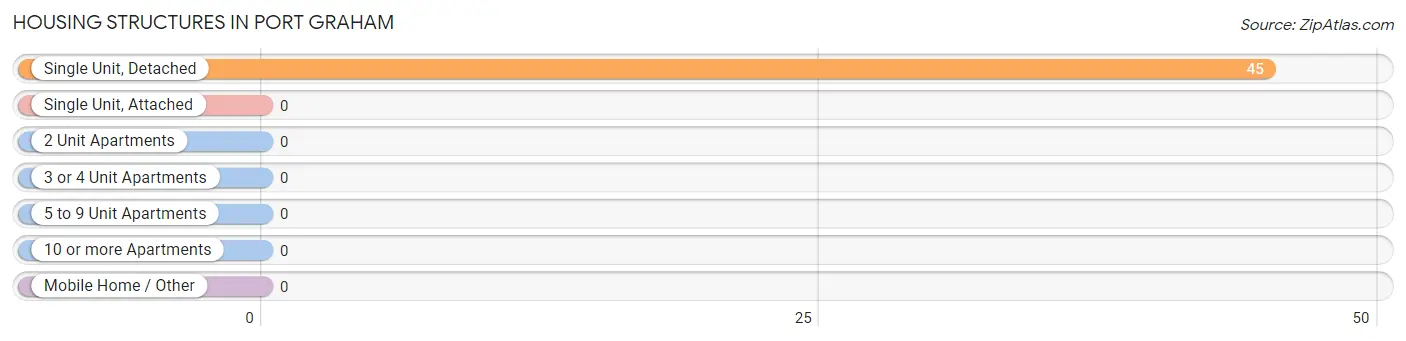
| Structure Type | # Housing Units | % Housing Units |
| Single Unit, Detached | 45 | 100.0% |
| Single Unit, Attached | 0 | 0.0% |
| 2 Unit Apartments | 0 | 0.0% |
| 3 or 4 Unit Apartments | 0 | 0.0% |
| 5 to 9 Unit Apartments | 0 | 0.0% |
| 10 or more Apartments | 0 | 0.0% |
| Mobile Home / Other | 0 | 0.0% |
| Total | 45 | 100.0% |
Housing Structures by Occupancy in Port Graham
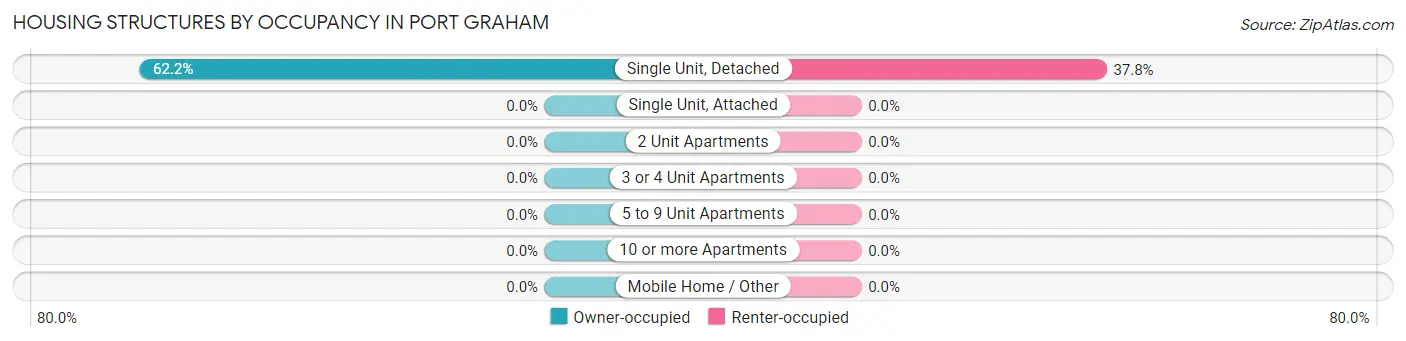
| Structure Type | Owner-occupied | Renter-occupied |
| Single Unit, Detached | 28 (62.2%) | 17 (37.8%) |
| Single Unit, Attached | 0 (0.0%) | 0 (0.0%) |
| 2 Unit Apartments | 0 (0.0%) | 0 (0.0%) |
| 3 or 4 Unit Apartments | 0 (0.0%) | 0 (0.0%) |
| 5 to 9 Unit Apartments | 0 (0.0%) | 0 (0.0%) |
| 10 or more Apartments | 0 (0.0%) | 0 (0.0%) |
| Mobile Home / Other | 0 (0.0%) | 0 (0.0%) |
| Total | 28 (62.2%) | 17 (37.8%) |
Housing Structures by Number of Rooms in Port Graham
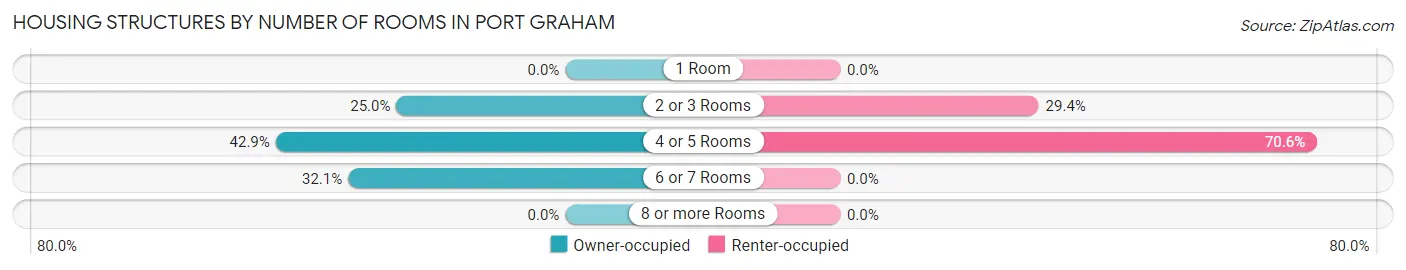
| Number of Rooms | Owner-occupied | Renter-occupied |
| 1 Room | 0 (0.0%) | 0 (0.0%) |
| 2 or 3 Rooms | 7 (25.0%) | 5 (29.4%) |
| 4 or 5 Rooms | 12 (42.9%) | 12 (70.6%) |
| 6 or 7 Rooms | 9 (32.1%) | 0 (0.0%) |
| 8 or more Rooms | 0 (0.0%) | 0 (0.0%) |
| Total | 28 (100.0%) | 17 (100.0%) |
Housing Structure by Heating Type in Port Graham
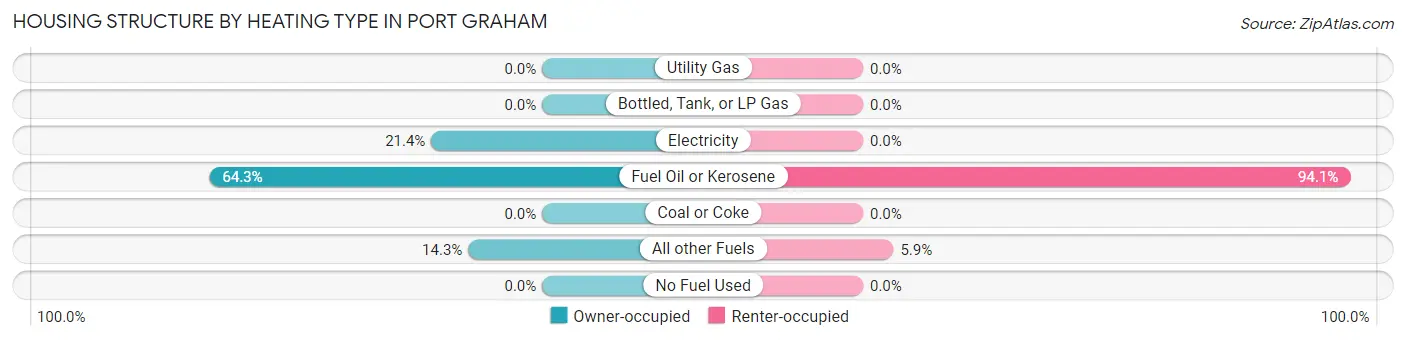
| Heating Type | Owner-occupied | Renter-occupied |
| Utility Gas | 0 (0.0%) | 0 (0.0%) |
| Bottled, Tank, or LP Gas | 0 (0.0%) | 0 (0.0%) |
| Electricity | 6 (21.4%) | 0 (0.0%) |
| Fuel Oil or Kerosene | 18 (64.3%) | 16 (94.1%) |
| Coal or Coke | 0 (0.0%) | 0 (0.0%) |
| All other Fuels | 4 (14.3%) | 1 (5.9%) |
| No Fuel Used | 0 (0.0%) | 0 (0.0%) |
| Total | 28 (100.0%) | 17 (100.0%) |
Household Vehicle Usage in Port Graham
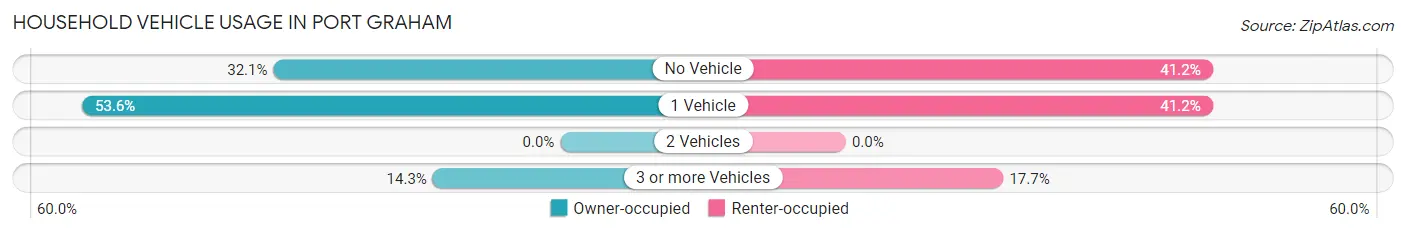
| Vehicles per Household | Owner-occupied | Renter-occupied |
| No Vehicle | 9 (32.1%) | 7 (41.2%) |
| 1 Vehicle | 15 (53.6%) | 7 (41.2%) |
| 2 Vehicles | 0 (0.0%) | 0 (0.0%) |
| 3 or more Vehicles | 4 (14.3%) | 3 (17.6%) |
| Total | 28 (100.0%) | 17 (100.0%) |
Real Estate & Mortgages in Port Graham
Real Estate and Mortgage Overview in Port Graham
| Characteristic | Without Mortgage | With Mortgage |
| Housing Units | 28 | 0 |
| Median Property Value | $87,100 | $0 |
| Median Household Income | - | - |
| Monthly Housing Costs | $375 | $0 |
| Real Estate Taxes | - | - |
Property Value by Mortgage Status in Port Graham
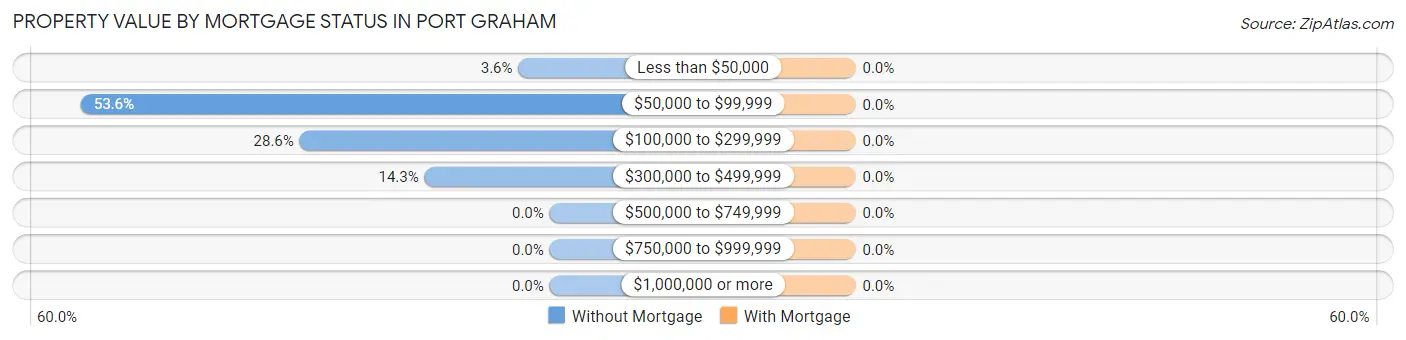
| Property Value | Without Mortgage | With Mortgage |
| Less than $50,000 | 1 (3.6%) | 0 (0.0%) |
| $50,000 to $99,999 | 15 (53.6%) | 0 (0.0%) |
| $100,000 to $299,999 | 8 (28.6%) | 0 (0.0%) |
| $300,000 to $499,999 | 4 (14.3%) | 0 (0.0%) |
| $500,000 to $749,999 | 0 (0.0%) | 0 (0.0%) |
| $750,000 to $999,999 | 0 (0.0%) | 0 (0.0%) |
| $1,000,000 or more | 0 (0.0%) | 0 (0.0%) |
| Total | 28 (100.0%) | 0 (0.0%) |
Household Income by Mortgage Status in Port Graham
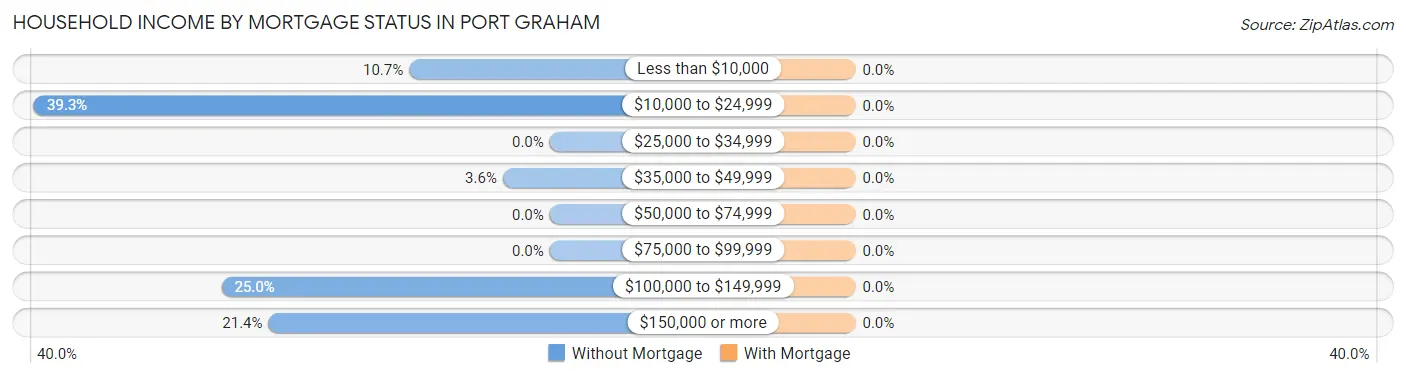
| Household Income | Without Mortgage | With Mortgage |
| Less than $10,000 | 3 (10.7%) | 0 (0.0%) |
| $10,000 to $24,999 | 11 (39.3%) | 0 (0.0%) |
| $25,000 to $34,999 | 0 (0.0%) | 0 (0.0%) |
| $35,000 to $49,999 | 1 (3.6%) | 0 (0.0%) |
| $50,000 to $74,999 | 0 (0.0%) | 0 (0.0%) |
| $75,000 to $99,999 | 0 (0.0%) | 0 (0.0%) |
| $100,000 to $149,999 | 7 (25.0%) | 0 (0.0%) |
| $150,000 or more | 6 (21.4%) | 0 (0.0%) |
| Total | 28 (100.0%) | 0 (0.0%) |
Property Value to Household Income Ratio in Port Graham
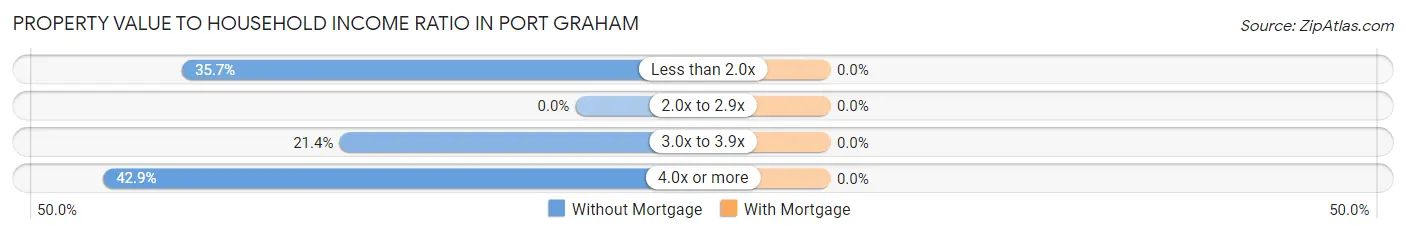
| Value-to-Income Ratio | Without Mortgage | With Mortgage |
| Less than 2.0x | 10 (35.7%) | 0 (0.0%) |
| 2.0x to 2.9x | 0 (0.0%) | 0 (0.0%) |
| 3.0x to 3.9x | 6 (21.4%) | 0 (0.0%) |
| 4.0x or more | 12 (42.9%) | 0 (0.0%) |
| Total | 28 (100.0%) | 0 (0.0%) |
Real Estate Taxes by Mortgage Status in Port Graham
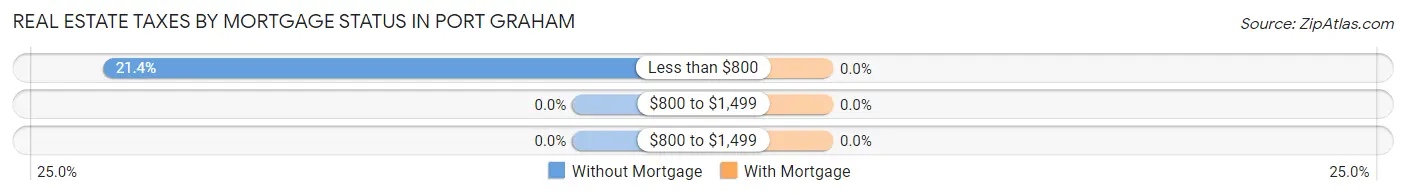
| Property Taxes | Without Mortgage | With Mortgage |
| Less than $800 | 6 (21.4%) | 0 (0.0%) |
| $800 to $1,499 | 0 (0.0%) | 0 (0.0%) |
| $800 to $1,499 | 0 (0.0%) | 0 (0.0%) |
| Total | 28 (100.0%) | 0 (0.0%) |
Health & Disability in Port Graham
Health Insurance Coverage by Age in Port Graham
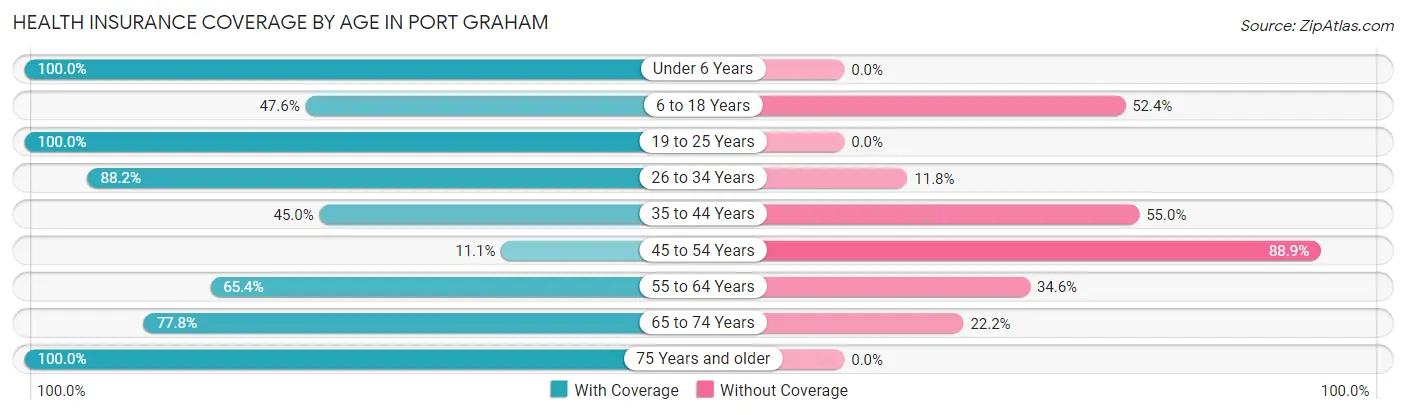
| Age Bracket | With Coverage | Without Coverage |
| Under 6 Years | 25 (100.0%) | 0 (0.0%) |
| 6 to 18 Years | 10 (47.6%) | 11 (52.4%) |
| 19 to 25 Years | 10 (100.0%) | 0 (0.0%) |
| 26 to 34 Years | 15 (88.2%) | 2 (11.8%) |
| 35 to 44 Years | 9 (45.0%) | 11 (55.0%) |
| 45 to 54 Years | 1 (11.1%) | 8 (88.9%) |
| 55 to 64 Years | 17 (65.4%) | 9 (34.6%) |
| 65 to 74 Years | 7 (77.8%) | 2 (22.2%) |
| 75 Years and older | 5 (100.0%) | 0 (0.0%) |
| Total | 99 (69.7%) | 43 (30.3%) |
Health Insurance Coverage by Citizenship Status in Port Graham
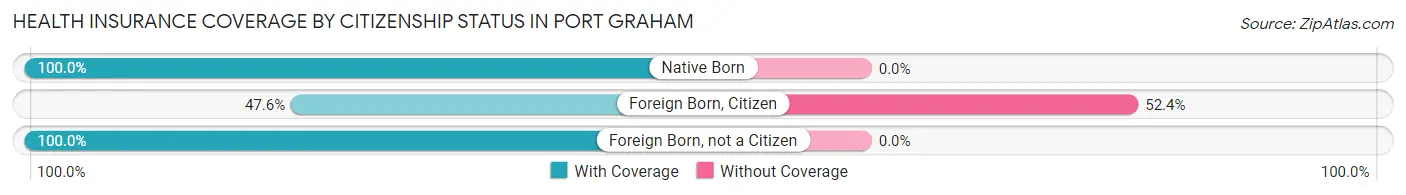
| Citizenship Status | With Coverage | Without Coverage |
| Native Born | 25 (100.0%) | 0 (0.0%) |
| Foreign Born, Citizen | 10 (47.6%) | 11 (52.4%) |
| Foreign Born, not a Citizen | 10 (100.0%) | 0 (0.0%) |
Health Insurance Coverage by Household Income in Port Graham
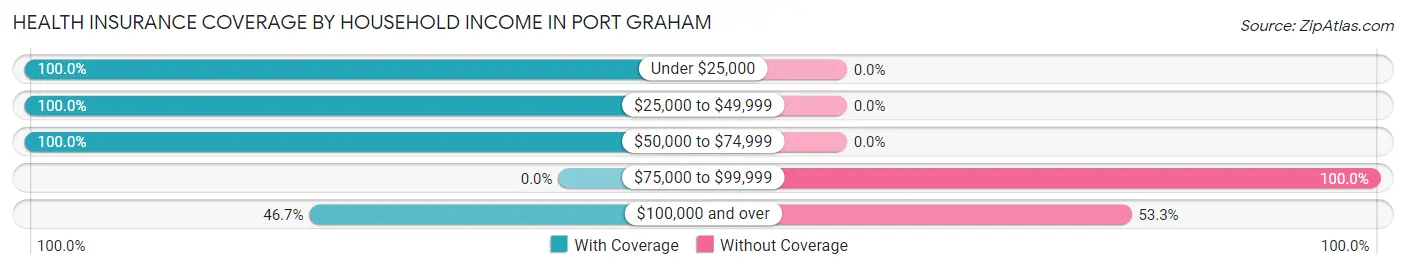
| Household Income | With Coverage | Without Coverage |
| Under $25,000 | 30 (100.0%) | 0 (0.0%) |
| $25,000 to $49,999 | 10 (100.0%) | 0 (0.0%) |
| $50,000 to $74,999 | 34 (100.0%) | 0 (0.0%) |
| $75,000 to $99,999 | 0 (0.0%) | 17 (100.0%) |
| $100,000 and over | 21 (46.7%) | 24 (53.3%) |
Public vs Private Health Insurance Coverage by Age in Port Graham
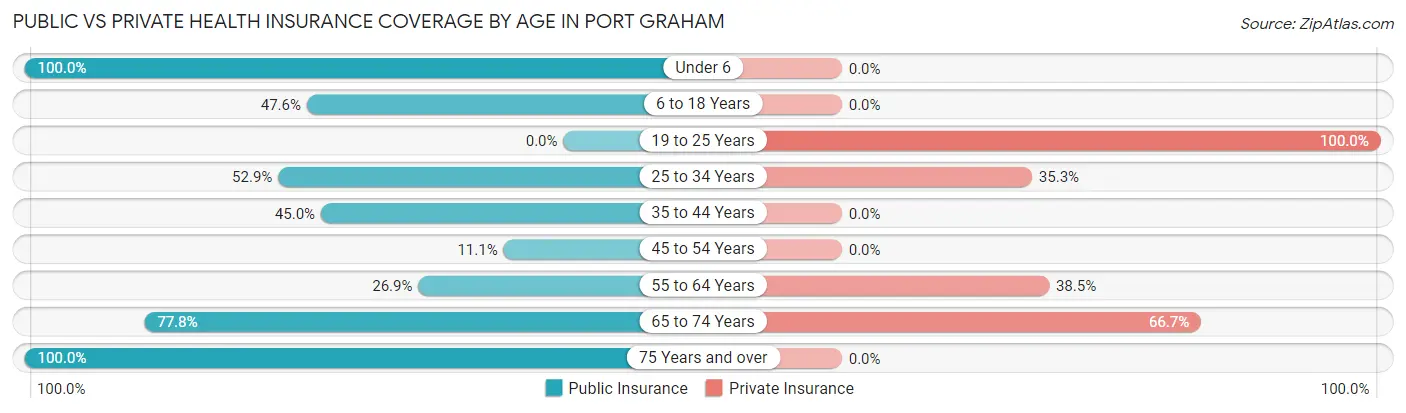
| Age Bracket | Public Insurance | Private Insurance |
| Under 6 | 25 (100.0%) | 0 (0.0%) |
| 6 to 18 Years | 10 (47.6%) | 0 (0.0%) |
| 19 to 25 Years | 0 (0.0%) | 10 (100.0%) |
| 25 to 34 Years | 9 (52.9%) | 6 (35.3%) |
| 35 to 44 Years | 9 (45.0%) | 0 (0.0%) |
| 45 to 54 Years | 1 (11.1%) | 0 (0.0%) |
| 55 to 64 Years | 7 (26.9%) | 10 (38.5%) |
| 65 to 74 Years | 7 (77.8%) | 6 (66.7%) |
| 75 Years and over | 5 (100.0%) | 0 (0.0%) |
| Total | 73 (51.4%) | 32 (22.5%) |
Disability Status by Sex by Age in Port Graham
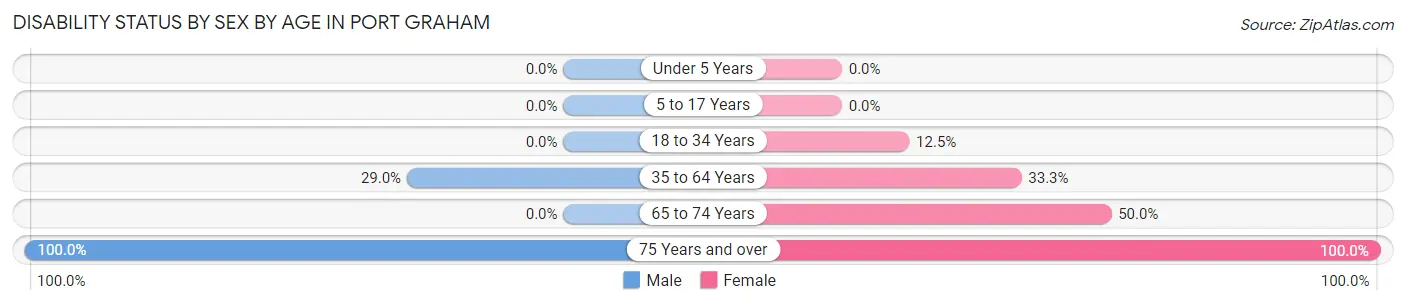
| Age Bracket | Male | Female |
| Under 5 Years | 0 (0.0%) | 0 (0.0%) |
| 5 to 17 Years | 0 (0.0%) | 0 (0.0%) |
| 18 to 34 Years | 0 (0.0%) | 1 (12.5%) |
| 35 to 64 Years | 9 (29.0%) | 8 (33.3%) |
| 65 to 74 Years | 0 (0.0%) | 2 (50.0%) |
| 75 Years and over | 3 (100.0%) | 2 (100.0%) |
Disability Class by Sex by Age in Port Graham
Disability Class: Hearing Difficulty
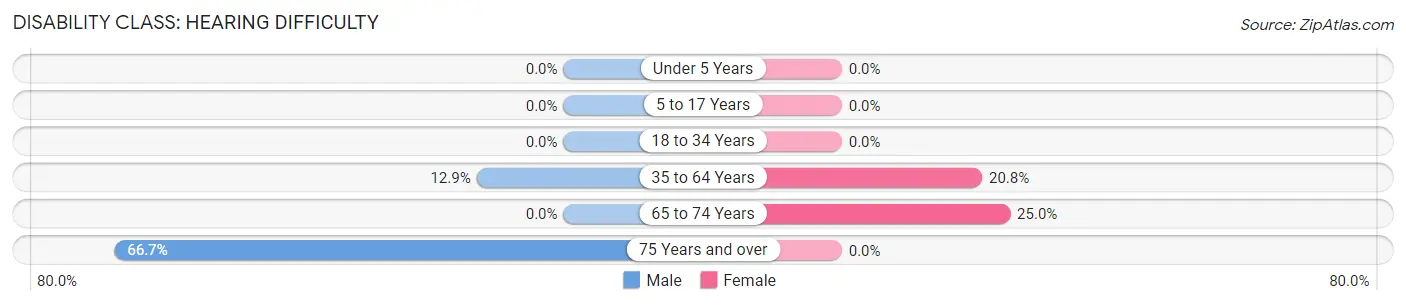
| Age Bracket | Male | Female |
| Under 5 Years | 0 (0.0%) | 0 (0.0%) |
| 5 to 17 Years | 0 (0.0%) | 0 (0.0%) |
| 18 to 34 Years | 0 (0.0%) | 0 (0.0%) |
| 35 to 64 Years | 4 (12.9%) | 5 (20.8%) |
| 65 to 74 Years | 0 (0.0%) | 1 (25.0%) |
| 75 Years and over | 2 (66.7%) | 0 (0.0%) |
Disability Class: Vision Difficulty
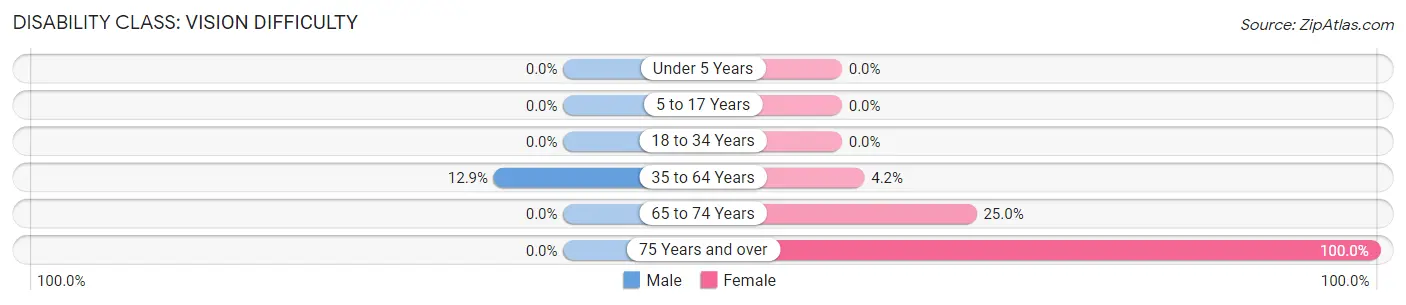
| Age Bracket | Male | Female |
| Under 5 Years | 0 (0.0%) | 0 (0.0%) |
| 5 to 17 Years | 0 (0.0%) | 0 (0.0%) |
| 18 to 34 Years | 0 (0.0%) | 0 (0.0%) |
| 35 to 64 Years | 4 (12.9%) | 1 (4.2%) |
| 65 to 74 Years | 0 (0.0%) | 1 (25.0%) |
| 75 Years and over | 0 (0.0%) | 2 (100.0%) |
Disability Class: Cognitive Difficulty
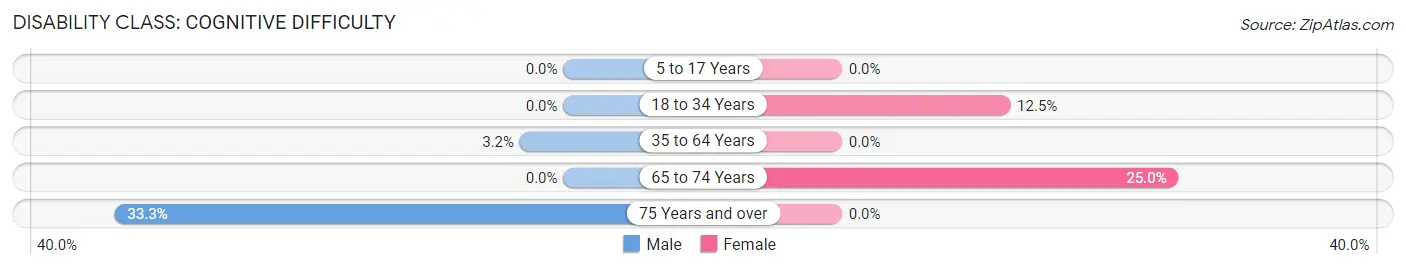
| Age Bracket | Male | Female |
| 5 to 17 Years | 0 (0.0%) | 0 (0.0%) |
| 18 to 34 Years | 0 (0.0%) | 1 (12.5%) |
| 35 to 64 Years | 1 (3.2%) | 0 (0.0%) |
| 65 to 74 Years | 0 (0.0%) | 1 (25.0%) |
| 75 Years and over | 1 (33.3%) | 0 (0.0%) |
Disability Class: Ambulatory Difficulty
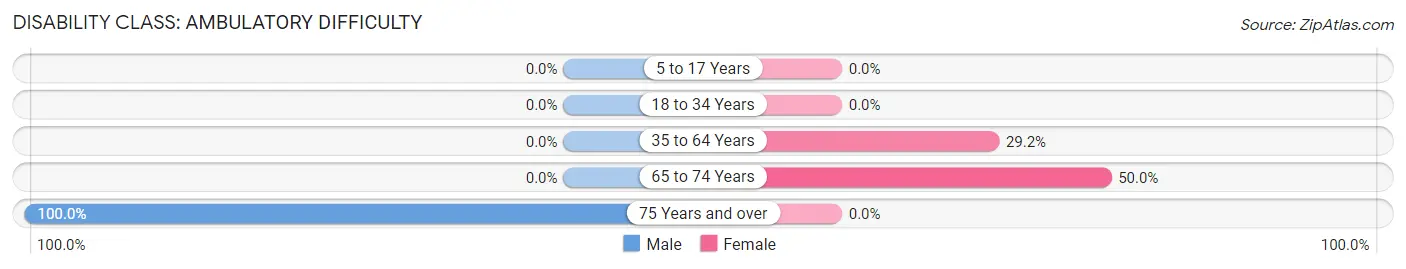
| Age Bracket | Male | Female |
| 5 to 17 Years | 0 (0.0%) | 0 (0.0%) |
| 18 to 34 Years | 0 (0.0%) | 0 (0.0%) |
| 35 to 64 Years | 0 (0.0%) | 7 (29.2%) |
| 65 to 74 Years | 0 (0.0%) | 2 (50.0%) |
| 75 Years and over | 3 (100.0%) | 0 (0.0%) |
Disability Class: Self-Care Difficulty
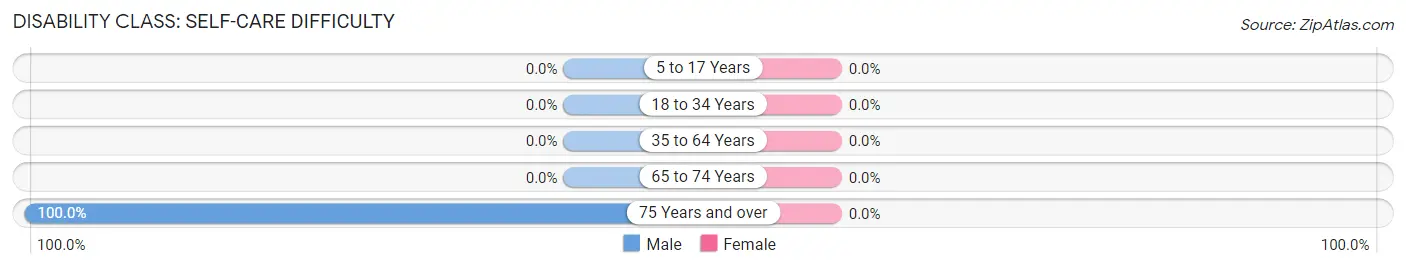
| Age Bracket | Male | Female |
| 5 to 17 Years | 0 (0.0%) | 0 (0.0%) |
| 18 to 34 Years | 0 (0.0%) | 0 (0.0%) |
| 35 to 64 Years | 0 (0.0%) | 0 (0.0%) |
| 65 to 74 Years | 0 (0.0%) | 0 (0.0%) |
| 75 Years and over | 3 (100.0%) | 0 (0.0%) |
Technology Access in Port Graham
Computing Device Access in Port Graham
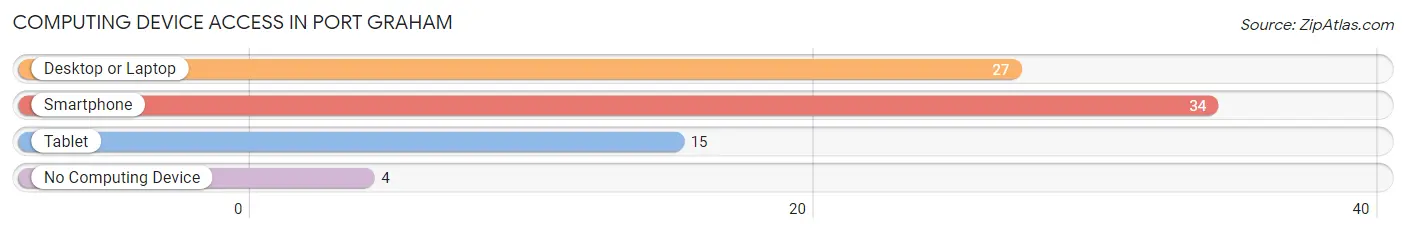
| Device Type | # Households | % Households |
| Desktop or Laptop | 27 | 60.0% |
| Smartphone | 34 | 75.6% |
| Tablet | 15 | 33.3% |
| No Computing Device | 4 | 8.9% |
| Total | 45 | 100.0% |
Internet Access in Port Graham
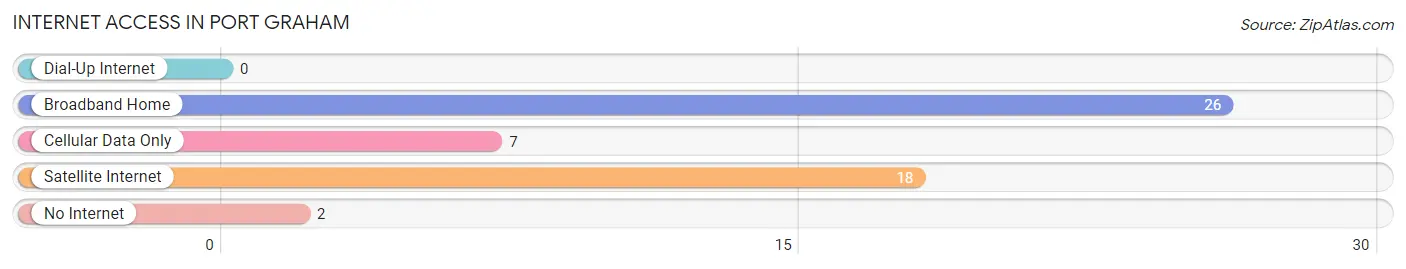
| Internet Type | # Households | % Households |
| Dial-Up Internet | 0 | 0.0% |
| Broadband Home | 26 | 57.8% |
| Cellular Data Only | 7 | 15.6% |
| Satellite Internet | 18 | 40.0% |
| No Internet | 2 | 4.4% |
| Total | 45 | 100.0% |
Port Graham Summary
History
Port Graham is a small unincorporated community located on the Kenai Peninsula in the U.S. state of Alaska. It is located on the north shore of Kachemak Bay, about 25 miles southwest of Homer. The community was established in the early 1900s by Russian settlers who were attracted to the area by its abundant salmon and halibut fishing. The name “Port Graham” was derived from the Russian word “graf”, which means “harbor”.
The area was first inhabited by the Dena’ina Athabascan people, who had lived in the area for thousands of years. The Dena’ina were a semi-nomadic people who relied on fishing, hunting, and gathering for their subsistence. They were also known for their pottery and basketry.
In the early 1900s, Russian settlers began to move into the area, attracted by the abundant salmon and halibut fishing. The first permanent settlement was established in 1906, and the community was named Port Graham after the Russian word “graf”, which means “harbor”.
The community grew slowly over the years, and by the 1950s, it had a population of about 200 people. The economy was based primarily on fishing, and the community was home to several canneries and fish processing plants.
Geography
Port Graham is located on the north shore of Kachemak Bay, about 25 miles southwest of Homer. The community is situated on a small peninsula, surrounded by the waters of Kachemak Bay and Cook Inlet. The area is characterized by rugged, mountainous terrain, with several small islands located nearby.
The climate in Port Graham is mild and temperate, with cool summers and mild winters. The average annual temperature is around 40°F, and the average annual precipitation is around 30 inches.
Economy
The economy of Port Graham is based primarily on fishing and fish processing. The community is home to several canneries and fish processing plants, which employ many of the local residents. The area is also known for its abundant salmon and halibut fishing, and many of the local residents make their living as commercial fishermen.
In addition to fishing, the community is also home to several small businesses, including a general store, a post office, and a restaurant. Tourism is also an important part of the local economy, with many visitors coming to the area to enjoy the scenery and to take part in recreational activities such as fishing, hunting, and hiking.
Demographics
As of the 2010 census, the population of Port Graham was 517. The racial makeup of the community was 95.3% Native American, 2.3% White, 0.4% Asian, and 1.9% from two or more races. The median household income was $37,500, and the median family income was $41,250.
The majority of the population (90.3%) spoke English as their primary language, while 4.3% spoke Spanish and 2.3% spoke Dena’ina. The median age of the population was 33.7 years, and the median age of the population was 37.7 years.
Conclusion
Port Graham is a small unincorporated community located on the Kenai Peninsula in the U.S. state of Alaska. It is located on the north shore of Kachemak Bay, about 25 miles southwest of Homer. The community was established in the early 1900s by Russian settlers who were attracted to the area by its abundant salmon and halibut fishing. The economy of Port Graham is based primarily on fishing and fish processing, and the community is home to several canneries and fish processing plants. The population of Port Graham was 517 as of the 2010 census, and the majority of the population spoke English as their primary language. Tourism is also an important part of the local economy, with many visitors coming to the area to enjoy the scenery and to take part in recreational activities such as fishing, hunting, and hiking.
Common Questions
What is Per Capita Income in Port Graham?
Per Capita income in Port Graham is $24,794.
What is the Median Family Income in Port Graham?
Median Family Income in Port Graham is $105,625.
What is the Median Household income in Port Graham?
Median Household Income in Port Graham is $58,438.
What is Income or Wage Gap in Port Graham?
Income or Wage Gap in Port Graham is 55.2%.
Women in Port Graham earn 44.8 cents for every dollar earned by a man.
What is Family Income Deficit in Port Graham?
Family Income Deficit in Port Graham is $11,355.
Families that are below poverty line in Port Graham earn $11,355 less on average than the poverty threshold level.
What is Inequality or Gini Index in Port Graham?
Inequality or Gini Index in Port Graham is 0.49.
What is the Total Population of Port Graham?
Total Population of Port Graham is 142.
What is the Total Male Population of Port Graham?
Total Male Population of Port Graham is 97.
What is the Total Female Population of Port Graham?
Total Female Population of Port Graham is 45.
What is the Ratio of Males per 100 Females in Port Graham?
There are 215.56 Males per 100 Females in Port Graham.
What is the Ratio of Females per 100 Males in Port Graham?
There are 46.39 Females per 100 Males in Port Graham.
What is the Median Population Age in Port Graham?
Median Population Age in Port Graham is 34.3 Years.
What is the Average Family Size in Port Graham
Average Family Size in Port Graham is 3.4 People.
What is the Average Household Size in Port Graham
Average Household Size in Port Graham is 3.0 People.
How Large is the Labor Force in Port Graham?
There are 68 People in the Labor Forcein in Port Graham.
What is the Percentage of People in the Labor Force in Port Graham?
68.7% of People are in the Labor Force in Port Graham.