False Pass, AK Map & Demographics
False Pass Map
False Pass Overview
$34,500
PER CAPITA INCOME
$98,333
AVG FAMILY INCOME
$62,083
AVG HOUSEHOLD INCOME
11.4%
WAGE / INCOME GAP [ % ]
88.6¢/ $1
WAGE / INCOME GAP [ $ ]
0.37
INEQUALITY / GINI INDEX
103
TOTAL POPULATION
62
MALE POPULATION
41
FEMALE POPULATION
151.22
MALES / 100 FEMALES
66.13
FEMALES / 100 MALES
32.1
MEDIAN AGE
4.7
AVG FAMILY SIZE
3.1
AVG HOUSEHOLD SIZE
53
LABOR FORCE [ PEOPLE ]
71.6%
PERCENT IN LABOR FORCE
False Pass Zip Codes
False Pass Area Codes
Income in False Pass
Income Overview in False Pass
Per Capita Income in False Pass is $34,500, while median incomes of families and households are $98,333 and $62,083 respectively.
| Characteristic | Number | Measure |
| Per Capita Income | 103 | $34,500 |
| Median Family Income | 16 | $98,333 |
| Mean Family Income | 16 | $106,431 |
| Median Household Income | 33 | $62,083 |
| Mean Household Income | 33 | $82,848 |
| Income Deficit | 16 | $0 |
| Wage / Income Gap (%) | 103 | 11.43% |
| Wage / Income Gap ($) | 103 | 88.57¢ per $1 |
| Gini / Inequality Index | 103 | 0.37 |
Earnings by Sex in False Pass
Average Earnings in False Pass are $38,750, $38,750 for men and $43,750 for women, a difference of 11.4%.
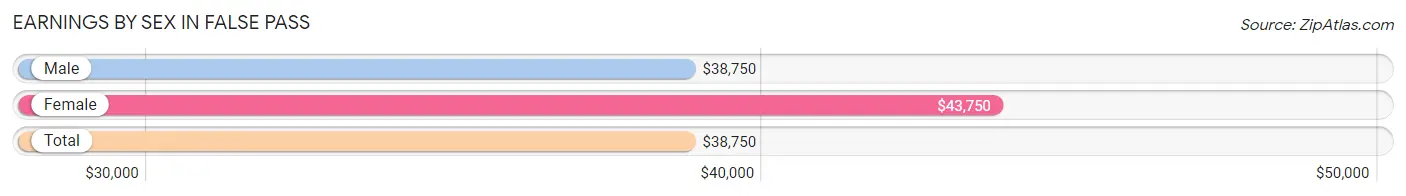
| Sex | Number | Average Earnings |
| Male | 50 (67.6%) | $38,750 |
| Female | 24 (32.4%) | $43,750 |
| Total | 74 (100.0%) | $38,750 |
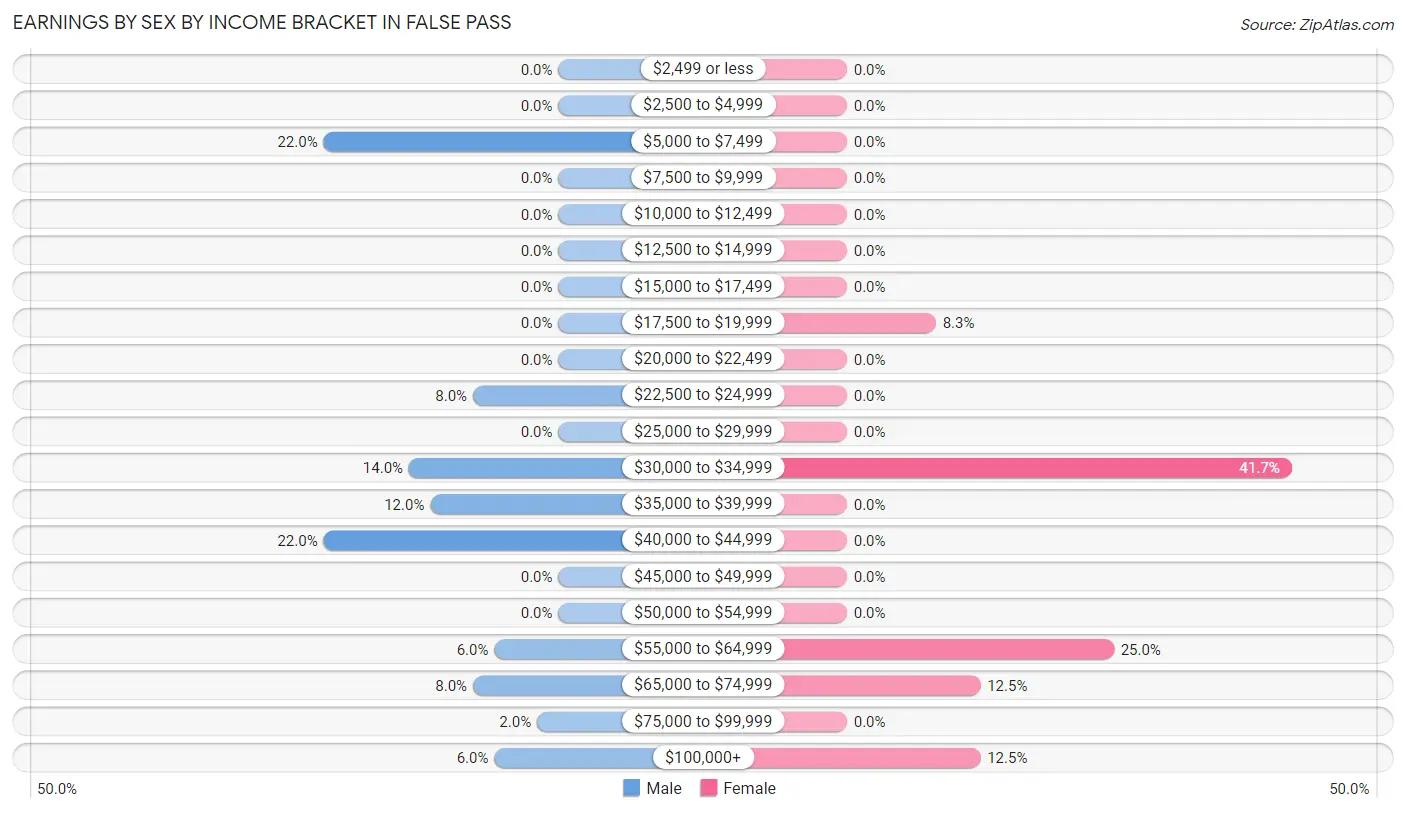
Earnings by Sex by Income Bracket in False Pass
The most common earnings brackets in False Pass are $5,000 to $7,499 for men (11 | 22.0%) and $30,000 to $34,999 for women (10 | 41.7%).
| Income | Male | Female |
| $2,499 or less | 0 (0.0%) | 0 (0.0%) |
| $2,500 to $4,999 | 0 (0.0%) | 0 (0.0%) |
| $5,000 to $7,499 | 11 (22.0%) | 0 (0.0%) |
| $7,500 to $9,999 | 0 (0.0%) | 0 (0.0%) |
| $10,000 to $12,499 | 0 (0.0%) | 0 (0.0%) |
| $12,500 to $14,999 | 0 (0.0%) | 0 (0.0%) |
| $15,000 to $17,499 | 0 (0.0%) | 0 (0.0%) |
| $17,500 to $19,999 | 0 (0.0%) | 2 (8.3%) |
| $20,000 to $22,499 | 0 (0.0%) | 0 (0.0%) |
| $22,500 to $24,999 | 4 (8.0%) | 0 (0.0%) |
| $25,000 to $29,999 | 0 (0.0%) | 0 (0.0%) |
| $30,000 to $34,999 | 7 (14.0%) | 10 (41.7%) |
| $35,000 to $39,999 | 6 (12.0%) | 0 (0.0%) |
| $40,000 to $44,999 | 11 (22.0%) | 0 (0.0%) |
| $45,000 to $49,999 | 0 (0.0%) | 0 (0.0%) |
| $50,000 to $54,999 | 0 (0.0%) | 0 (0.0%) |
| $55,000 to $64,999 | 3 (6.0%) | 6 (25.0%) |
| $65,000 to $74,999 | 4 (8.0%) | 3 (12.5%) |
| $75,000 to $99,999 | 1 (2.0%) | 0 (0.0%) |
| $100,000+ | 3 (6.0%) | 3 (12.5%) |
| Total | 50 (100.0%) | 24 (100.0%) |
Earnings by Sex by Educational Attainment in False Pass
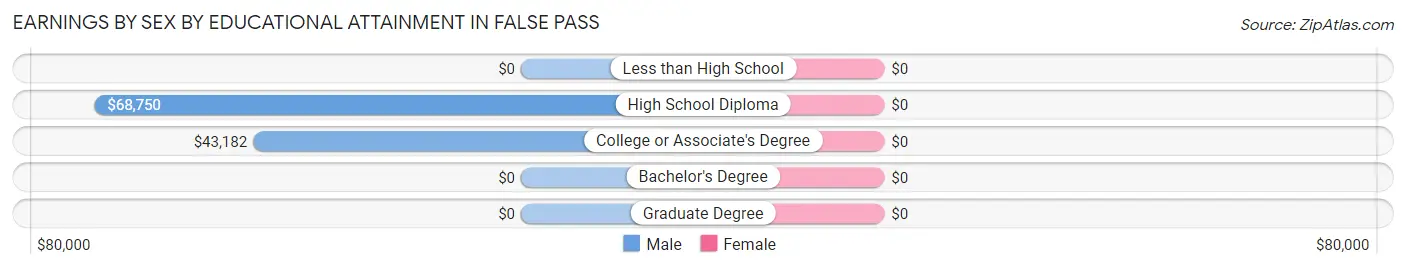
| Educational Attainment | Male Income | Female Income |
| Less than High School | - | - |
| High School Diploma | $68,750 | $0 |
| College or Associate's Degree | $43,182 | $0 |
| Bachelor's Degree | - | - |
| Graduate Degree | - | - |
| Total | $44,318 | $43,750 |
Family Income in False Pass
Family Income Brackets in False Pass
According to the False Pass family income data, there are 7 families falling into the $50,000 to $74,999 income range, which is the most common income bracket and makes up 43.8% of all families.
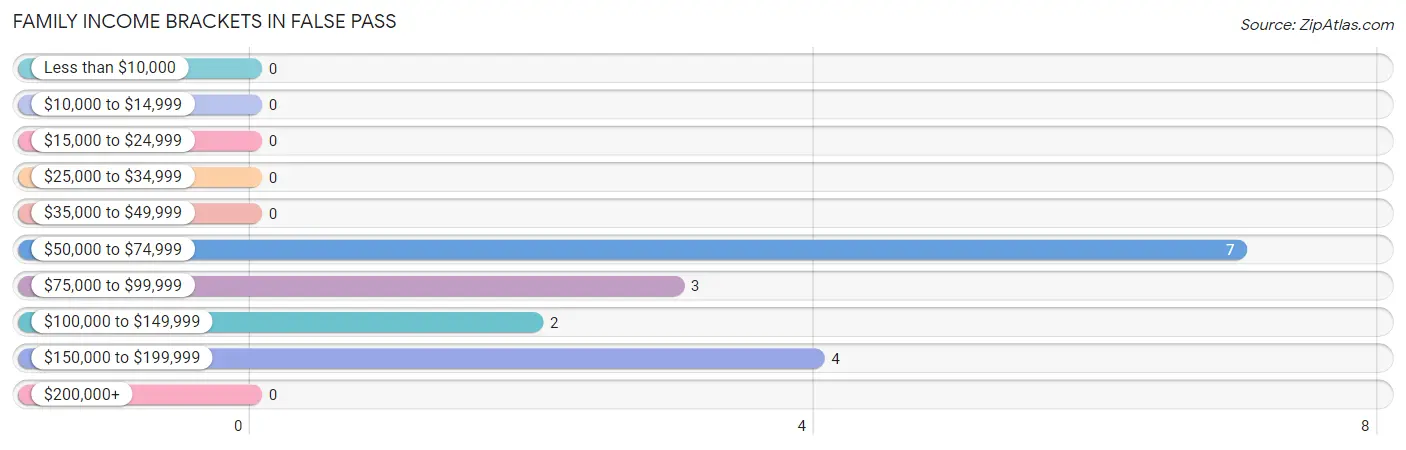
| Income Bracket | # Families | % Families |
| Less than $10,000 | 0 | 0.0% |
| $10,000 to $14,999 | 0 | 0.0% |
| $15,000 to $24,999 | 0 | 0.0% |
| $25,000 to $34,999 | 0 | 0.0% |
| $35,000 to $49,999 | 0 | 0.0% |
| $50,000 to $74,999 | 7 | 43.8% |
| $75,000 to $99,999 | 3 | 18.8% |
| $100,000 to $149,999 | 2 | 12.5% |
| $150,000 to $199,999 | 4 | 25.0% |
| $200,000+ | 0 | 0.0% |
Family Income by Famaliy Size in False Pass
2-person families (6 | 37.5%) account for the highest median family income in False Pass with $83,750 per family, while 2-person families (6 | 37.5%) have the highest median income of $41,875 per family member.
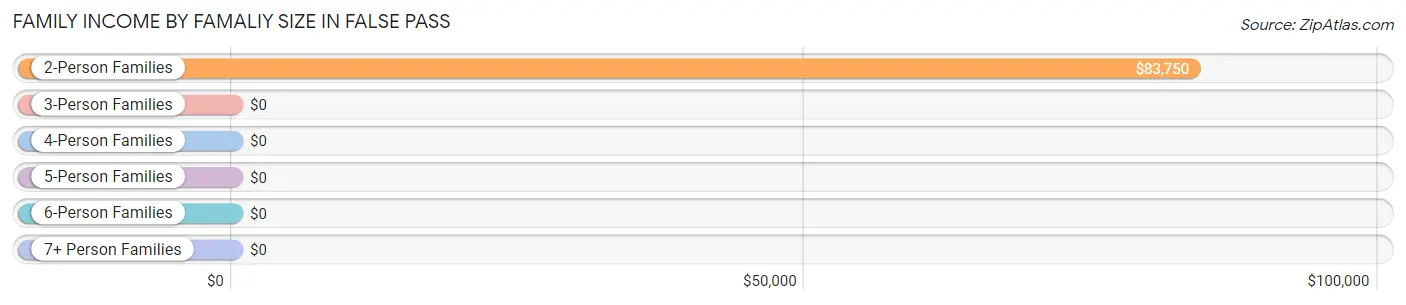
| Income Bracket | # Families | Median Income |
| 2-Person Families | 6 (37.5%) | $83,750 |
| 3-Person Families | 4 (25.0%) | $0 |
| 4-Person Families | 0 (0.0%) | $0 |
| 5-Person Families | 3 (18.8%) | $0 |
| 6-Person Families | 3 (18.8%) | $0 |
| 7+ Person Families | 0 (0.0%) | $0 |
| Total | 16 (100.0%) | $98,333 |
Family Income by Number of Earners in False Pass
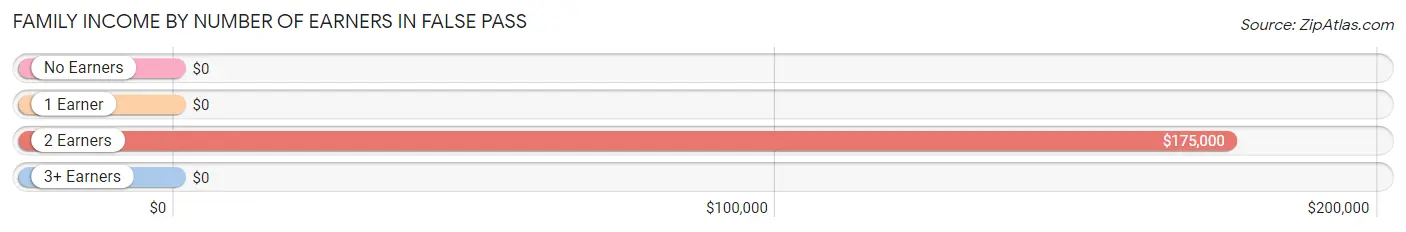
| Number of Earners | # Families | Median Income |
| No Earners | 0 (0.0%) | $0 |
| 1 Earner | 7 (43.8%) | $0 |
| 2 Earners | 6 (37.5%) | $175,000 |
| 3+ Earners | 3 (18.8%) | $0 |
| Total | 16 (100.0%) | $98,333 |
Household Income in False Pass
Household Income Brackets in False Pass
With 14 households falling in the category, the $25,000 to $34,999 income range is the most frequent in False Pass, accounting for 42.4% of all households.
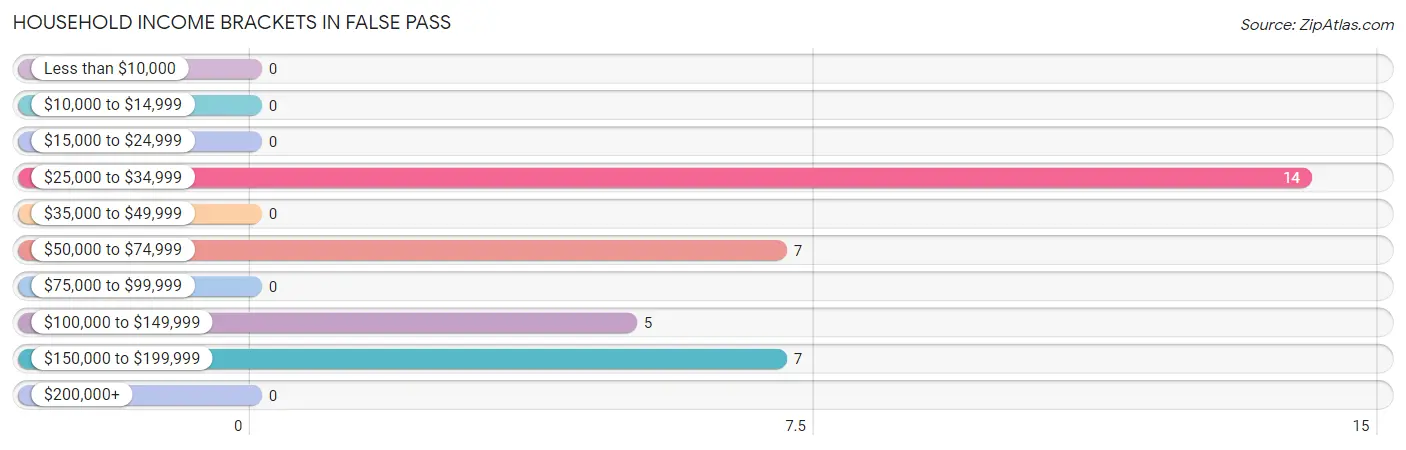
| Income Bracket | # Households | % Households |
| Less than $10,000 | 0 | 0.0% |
| $10,000 to $14,999 | 0 | 0.0% |
| $15,000 to $24,999 | 0 | 0.0% |
| $25,000 to $34,999 | 14 | 42.4% |
| $35,000 to $49,999 | 0 | 0.0% |
| $50,000 to $74,999 | 7 | 21.2% |
| $75,000 to $99,999 | 0 | 0.0% |
| $100,000 to $149,999 | 5 | 15.2% |
| $150,000 to $199,999 | 7 | 21.2% |
| $200,000+ | 0 | 0.0% |
Household Income by Householder Age in False Pass
| Income Bracket | # Households | Median Income |
| 15 to 24 Years | 4 (12.1%) | $0 |
| 25 to 44 Years | 13 (39.4%) | $0 |
| 45 to 64 Years | 13 (39.4%) | $0 |
| 65+ Years | 3 (9.1%) | $0 |
| Total | 33 (100.0%) | $62,083 |
Poverty in False Pass
Income Below Poverty by Sex and Age in False Pass
| Age Bracket | Male | Female |
| Under 5 Years | 0 (0.0%) | 0 (0.0%) |
| 5 Years | 0 (0.0%) | 0 (0.0%) |
| 6 to 11 Years | 0 (0.0%) | 0 (0.0%) |
| 12 to 14 Years | 0 (0.0%) | 0 (0.0%) |
| 15 Years | 0 (0.0%) | 0 (0.0%) |
| 16 and 17 Years | 0 (0.0%) | 0 (0.0%) |
| 18 to 24 Years | 0 (0.0%) | 0 (0.0%) |
| 25 to 34 Years | 0 (0.0%) | 0 (0.0%) |
| 35 to 44 Years | 0 (0.0%) | 0 (0.0%) |
| 45 to 54 Years | 0 (0.0%) | 0 (0.0%) |
| 55 to 64 Years | 0 (0.0%) | 0 (0.0%) |
| 65 to 74 Years | 0 (0.0%) | 0 (0.0%) |
| 75 Years and over | 0 (0.0%) | 0 (0.0%) |
| Total | 0 (0.0%) | 0 (0.0%) |
Income Above Poverty by Sex and Age in False Pass
According to the poverty statistics in False Pass, males aged under 5 years and females aged under 5 years are the age groups that are most secure financially, with 100.0% of males and 100.0% of females in these age groups living above the poverty line.
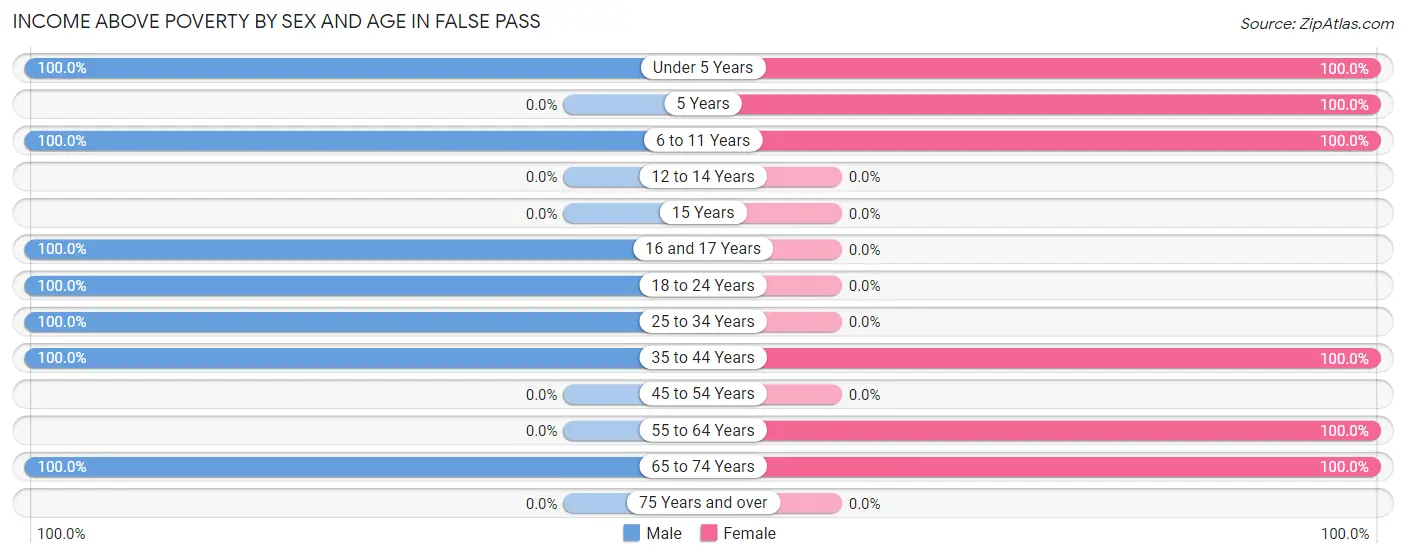
| Age Bracket | Male | Female |
| Under 5 Years | 10 (100.0%) | 11 (100.0%) |
| 5 Years | 0 (0.0%) | 2 (100.0%) |
| 6 to 11 Years | 2 (100.0%) | 4 (100.0%) |
| 12 to 14 Years | 0 (0.0%) | 0 (0.0%) |
| 15 Years | 0 (0.0%) | 0 (0.0%) |
| 16 and 17 Years | 11 (100.0%) | 0 (0.0%) |
| 18 to 24 Years | 11 (100.0%) | 0 (0.0%) |
| 25 to 34 Years | 15 (100.0%) | 0 (0.0%) |
| 35 to 44 Years | 9 (100.0%) | 9 (100.0%) |
| 45 to 54 Years | 0 (0.0%) | 0 (0.0%) |
| 55 to 64 Years | 0 (0.0%) | 13 (100.0%) |
| 65 to 74 Years | 4 (100.0%) | 2 (100.0%) |
| 75 Years and over | 0 (0.0%) | 0 (0.0%) |
| Total | 62 (100.0%) | 41 (100.0%) |
Income Below Poverty Among Married-Couple Families in False Pass
| Children | Above Poverty | Below Poverty |
| No Children | 2 (100.0%) | 0 (0.0%) |
| 1 or 2 Children | 0 (0.0%) | 0 (0.0%) |
| 3 or 4 Children | 3 (100.0%) | 0 (0.0%) |
| 5 or more Children | 0 (0.0%) | 0 (0.0%) |
| Total | 5 (100.0%) | 0 (0.0%) |
Income Below Poverty Among Single-Parent Households in False Pass
| Children | Single Father | Single Mother |
| No Children | 0 (0.0%) | 0 (0.0%) |
| 1 or 2 Children | 0 (0.0%) | 0 (0.0%) |
| 3 or 4 Children | 0 (0.0%) | 0 (0.0%) |
| 5 or more Children | 0 (0.0%) | 0 (0.0%) |
| Total | 0 (0.0%) | 0 (0.0%) |
Income Below Poverty Among Married-Couple vs Single-Parent Households in False Pass
| Children | Married-Couple Families | Single-Parent Households |
| No Children | 0 (0.0%) | 0 (0.0%) |
| 1 or 2 Children | 0 (0.0%) | 0 (0.0%) |
| 3 or 4 Children | 0 (0.0%) | 0 (0.0%) |
| 5 or more Children | 0 (0.0%) | 0 (0.0%) |
| Total | 0 (0.0%) | 0 (0.0%) |
Race in False Pass
The most populous races in False Pass are Native / Alaskan (75 | 72.8%), Hispanic or Latino (26 | 25.2%), and White / Caucasian (17 | 16.5%).
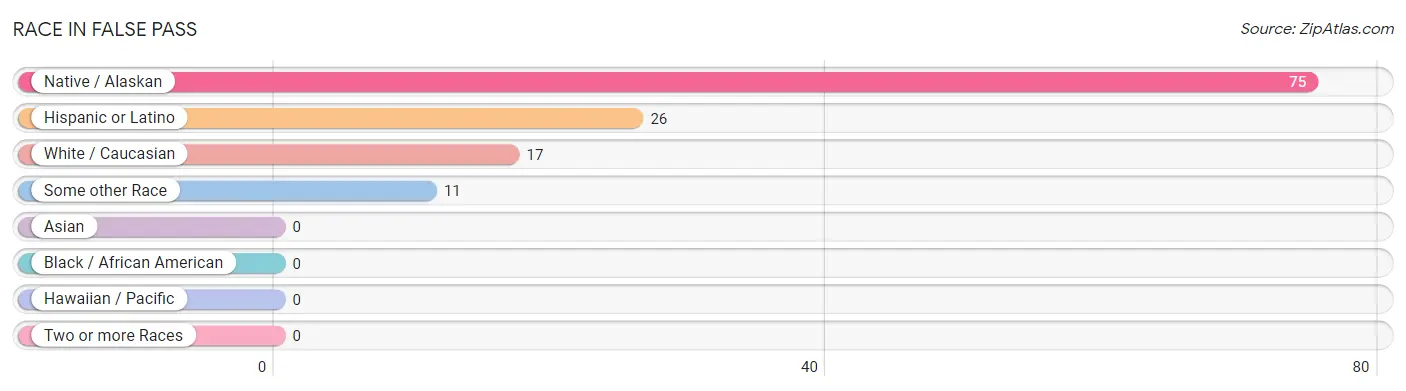
| Race | # Population | % Population |
| Asian | 0 | 0.0% |
| Black / African American | 0 | 0.0% |
| Hawaiian / Pacific | 0 | 0.0% |
| Hispanic or Latino | 26 | 25.2% |
| Native / Alaskan | 75 | 72.8% |
| White / Caucasian | 17 | 16.5% |
| Two or more Races | 0 | 0.0% |
| Some other Race | 11 | 10.7% |
| Total | 103 | 100.0% |
Ancestry in False Pass
The most populous ancestries reported in False Pass are Aleut (72 | 69.9%), Danish (29 | 28.2%), Mexican (26 | 25.2%), English (10 | 9.7%), and German (10 | 9.7%), together accounting for 142.7% of all False Pass residents.
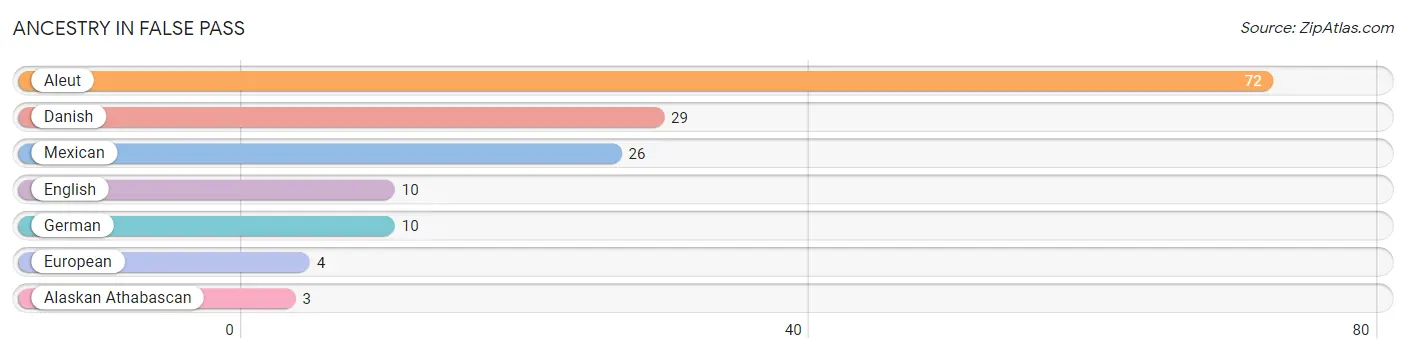
| Ancestry | # Population | % Population |
| Alaskan Athabascan | 3 | 2.9% |
| Aleut | 72 | 69.9% |
| Danish | 29 | 28.2% |
| English | 10 | 9.7% |
| European | 4 | 3.9% |
| German | 10 | 9.7% |
| Mexican | 26 | 25.2% | View All 7 Rows |
Immigrants in False Pass

| Immigration Origin | # Population | % Population | View All 0 Rows |
Sex and Age in False Pass
Sex and Age in False Pass
The most populous age groups in False Pass are 15 to 19 Years (15 | 24.2%) for men and 55 to 59 Years (13 | 31.7%) for women.
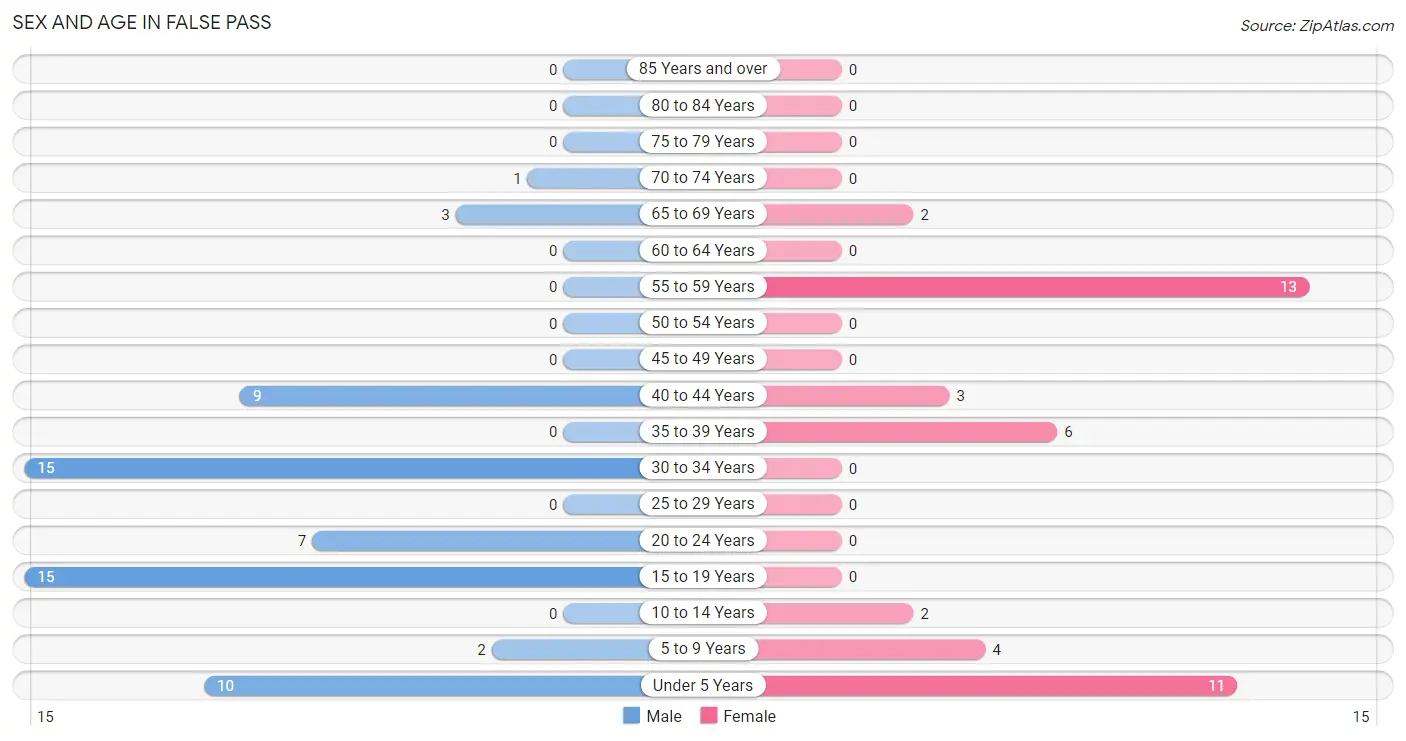
| Age Bracket | Male | Female |
| Under 5 Years | 10 (16.1%) | 11 (26.8%) |
| 5 to 9 Years | 2 (3.2%) | 4 (9.8%) |
| 10 to 14 Years | 0 (0.0%) | 2 (4.9%) |
| 15 to 19 Years | 15 (24.2%) | 0 (0.0%) |
| 20 to 24 Years | 7 (11.3%) | 0 (0.0%) |
| 25 to 29 Years | 0 (0.0%) | 0 (0.0%) |
| 30 to 34 Years | 15 (24.2%) | 0 (0.0%) |
| 35 to 39 Years | 0 (0.0%) | 6 (14.6%) |
| 40 to 44 Years | 9 (14.5%) | 3 (7.3%) |
| 45 to 49 Years | 0 (0.0%) | 0 (0.0%) |
| 50 to 54 Years | 0 (0.0%) | 0 (0.0%) |
| 55 to 59 Years | 0 (0.0%) | 13 (31.7%) |
| 60 to 64 Years | 0 (0.0%) | 0 (0.0%) |
| 65 to 69 Years | 3 (4.8%) | 2 (4.9%) |
| 70 to 74 Years | 1 (1.6%) | 0 (0.0%) |
| 75 to 79 Years | 0 (0.0%) | 0 (0.0%) |
| 80 to 84 Years | 0 (0.0%) | 0 (0.0%) |
| 85 Years and over | 0 (0.0%) | 0 (0.0%) |
| Total | 62 (100.0%) | 41 (100.0%) |
Families and Households in False Pass
Median Family Size in False Pass
The median family size in False Pass is 4.69 persons per family, with single female/mother families (6 | 37.5%) accounting for the largest median family size of 5.67 persons per family. On the other hand, married-couple families (5 | 31.2%) represent the smallest median family size with 3.60 persons per family.
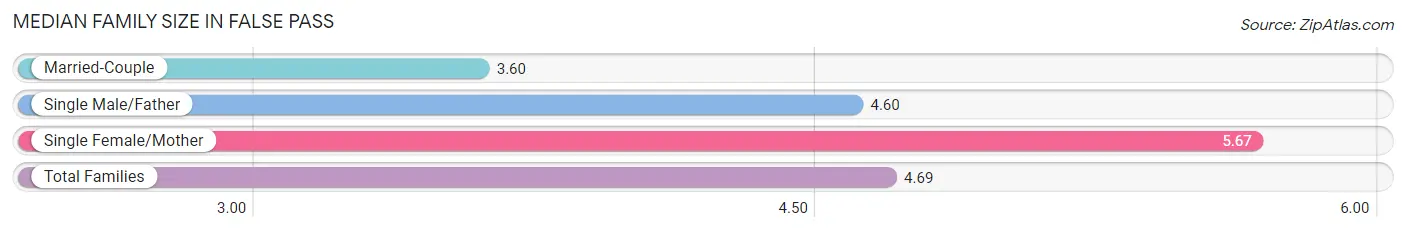
| Family Type | # Families | Family Size |
| Married-Couple | 5 (31.2%) | 3.60 |
| Single Male/Father | 5 (31.2%) | 4.60 |
| Single Female/Mother | 6 (37.5%) | 5.67 |
| Total Families | 16 (100.0%) | 4.69 |
Median Household Size in False Pass
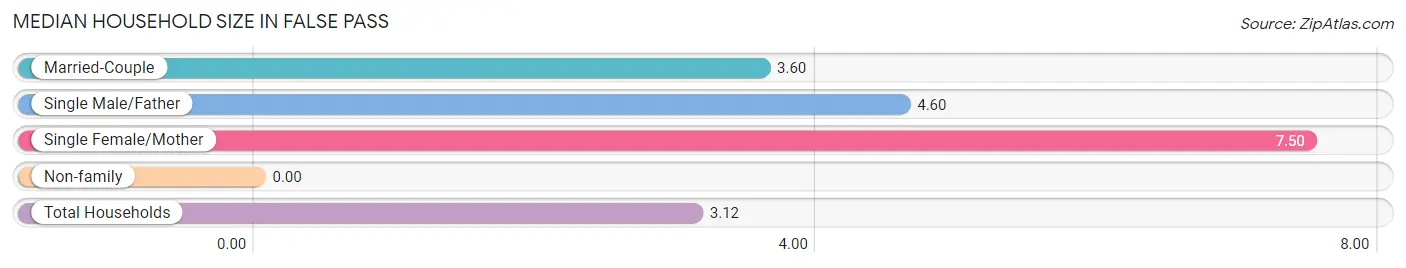
| Household Type | # Households | Household Size |
| Married-Couple | 5 (15.1%) | 3.60 |
| Single Male/Father | 5 (15.1%) | 4.60 |
| Single Female/Mother | 6 (18.2%) | 7.50 |
| Non-family | 17 (51.5%) | - |
| Total Households | 33 (100.0%) | 3.12 |
Household Size by Marriage Status in False Pass
Out of a total of 33 households in False Pass, 16 (48.5%) are family households, while 17 (51.5%) are nonfamily households. The most numerous type of family households are 2-person households, comprising 6, and the most common type of nonfamily households are 1-person households, comprising 17.
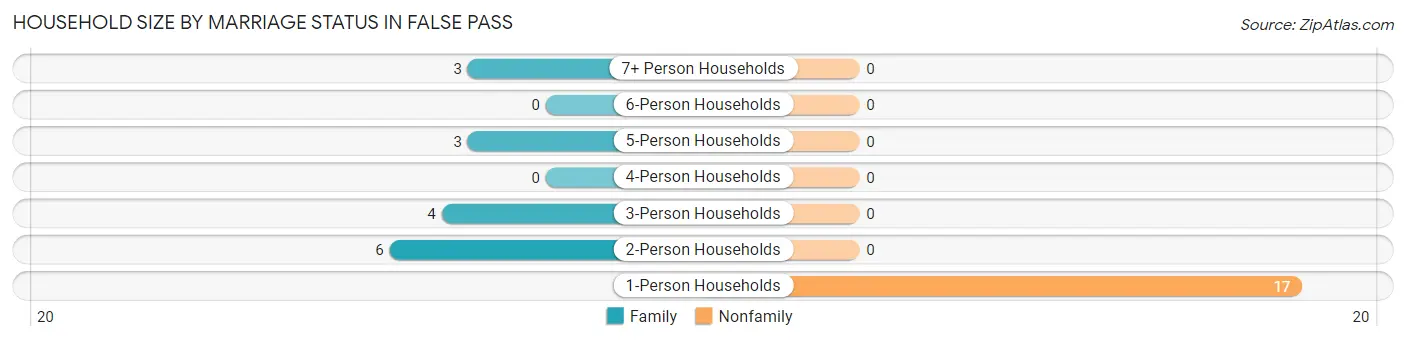
| Household Size | Family Households | Nonfamily Households |
| 1-Person Households | - | 17 (51.5%) |
| 2-Person Households | 6 (18.2%) | 0 (0.0%) |
| 3-Person Households | 4 (12.1%) | 0 (0.0%) |
| 4-Person Households | 0 (0.0%) | 0 (0.0%) |
| 5-Person Households | 3 (9.1%) | 0 (0.0%) |
| 6-Person Households | 0 (0.0%) | 0 (0.0%) |
| 7+ Person Households | 3 (9.1%) | 0 (0.0%) |
| Total | 16 (48.5%) | 17 (51.5%) |
Female Fertility in False Pass
Fertility by Age in False Pass
Average fertility rate in False Pass is 333.0 births per 1,000 women. Women in the age bracket of 35 to 50 years have the highest fertility rate with 333.0 births per 1,000 women. Women in the age bracket of 35 to 50 years acount for 100.0% of all women with births.
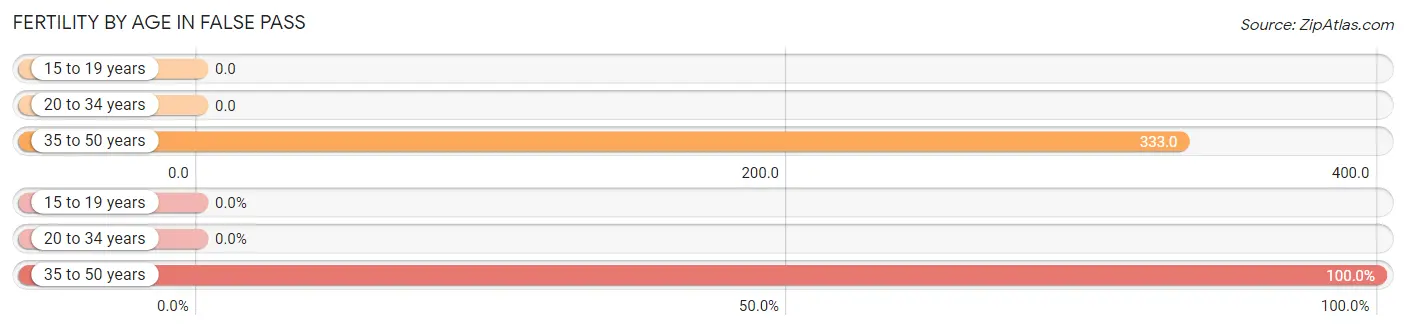
| Age Bracket | Women with Births | Births / 1,000 Women |
| 15 to 19 years | 0 (0.0%) | 0.0 |
| 20 to 34 years | 0 (0.0%) | 0.0 |
| 35 to 50 years | 3 (100.0%) | 333.0 |
| Total | 3 (100.0%) | 333.0 |
Fertility by Age by Marriage Status in False Pass
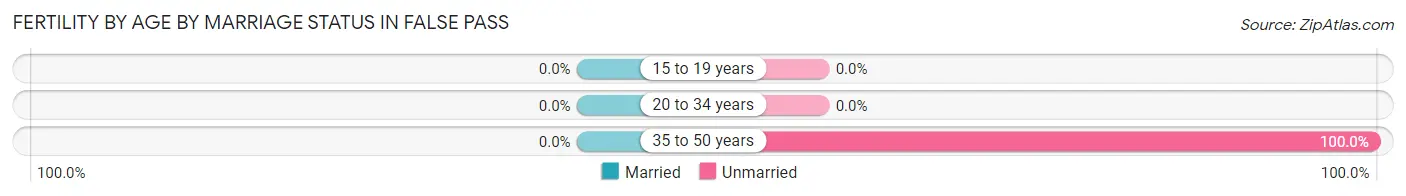
| Age Bracket | Married | Unmarried |
| 15 to 19 years | 0 (0.0%) | 0 (0.0%) |
| 20 to 34 years | 0 (0.0%) | 0 (0.0%) |
| 35 to 50 years | 0 (0.0%) | 3 (100.0%) |
| Total | 0 (0.0%) | 3 (100.0%) |
Fertility by Education in False Pass
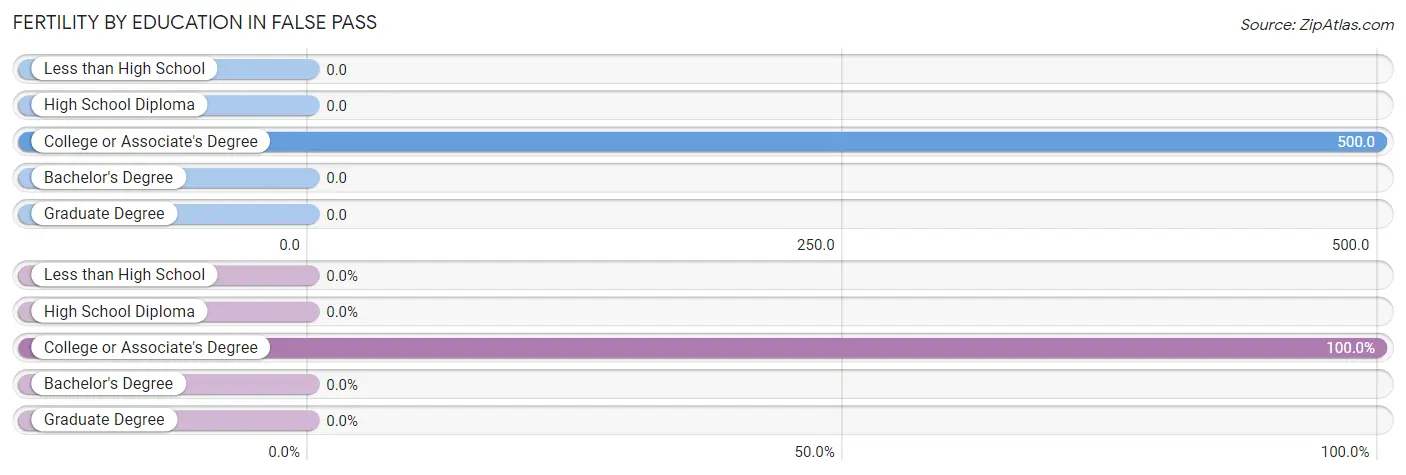
| Educational Attainment | Women with Births | Births / 1,000 Women |
| Less than High School | 0 (0.0%) | 0.0 |
| High School Diploma | 0 (0.0%) | 0.0 |
| College or Associate's Degree | 3 (100.0%) | 500.0 |
| Bachelor's Degree | 0 (0.0%) | 0.0 |
| Graduate Degree | 0 (0.0%) | 0.0 |
| Total | 3 (100.0%) | 333.0 |
Fertility by Education by Marriage Status in False Pass
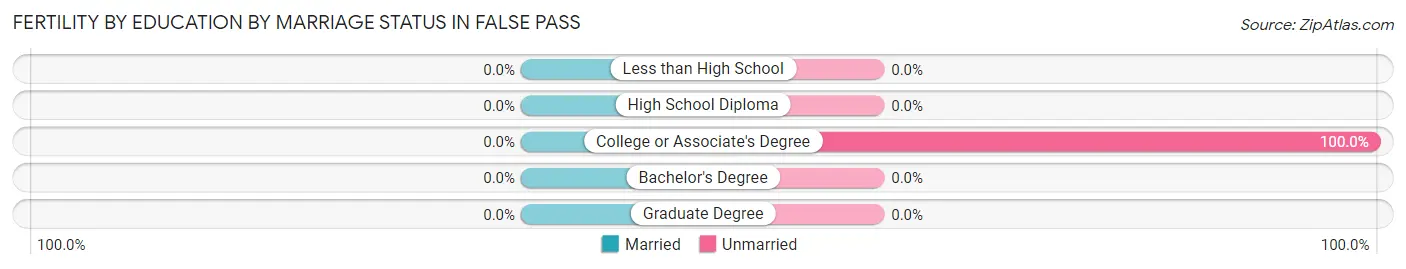
| Educational Attainment | Married | Unmarried |
| Less than High School | 0 (0.0%) | 0 (0.0%) |
| High School Diploma | 0 (0.0%) | 0 (0.0%) |
| College or Associate's Degree | 0 (0.0%) | 3 (100.0%) |
| Bachelor's Degree | 0 (0.0%) | 0 (0.0%) |
| Graduate Degree | 0 (0.0%) | 0 (0.0%) |
| Total | 0 (0.0%) | 3 (100.0%) |
Employment Characteristics in False Pass
Employment by Class of Employer in False Pass
Among the 53 employed individuals in False Pass, private company employees (21 | 39.6%), local government employees (19 | 35.8%), and self-employed (incorporated) (6 | 11.3%) make up the most common classes of employment.
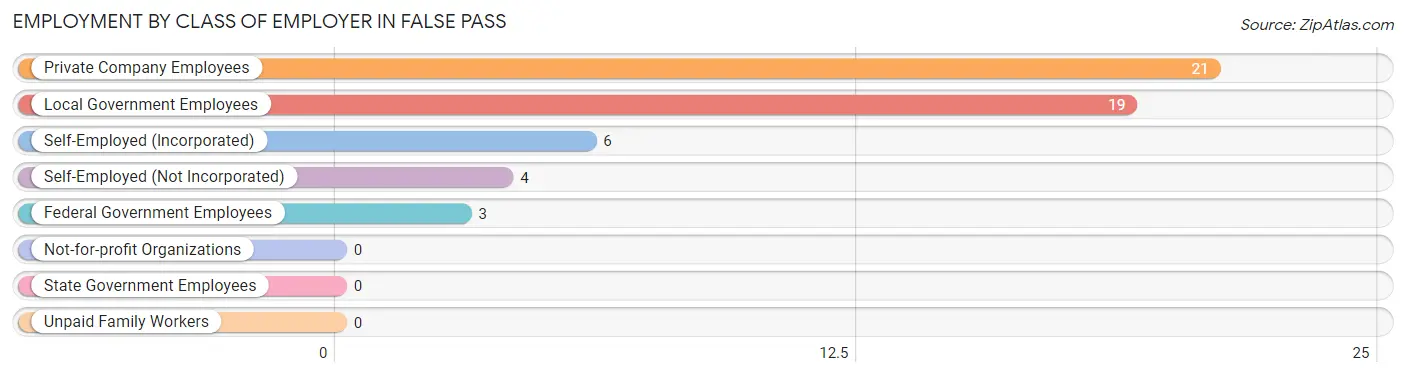
| Employer Class | # Employees | % Employees |
| Private Company Employees | 21 | 39.6% |
| Self-Employed (Incorporated) | 6 | 11.3% |
| Self-Employed (Not Incorporated) | 4 | 7.5% |
| Not-for-profit Organizations | 0 | 0.0% |
| Local Government Employees | 19 | 35.8% |
| State Government Employees | 0 | 0.0% |
| Federal Government Employees | 3 | 5.7% |
| Unpaid Family Workers | 0 | 0.0% |
| Total | 53 | 100.0% |
Employment Status by Age in False Pass
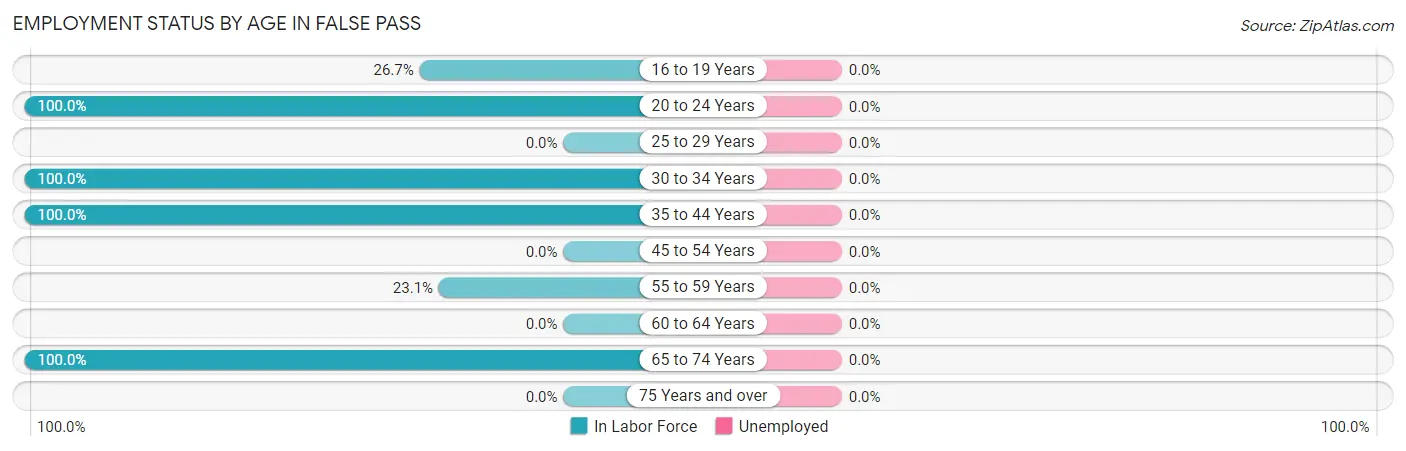
| Age Bracket | In Labor Force | Unemployed |
| 16 to 19 Years | 4 (26.7%) | 0 (0.0%) |
| 20 to 24 Years | 7 (100.0%) | 0 (0.0%) |
| 25 to 29 Years | 0 (0.0%) | 0 (0.0%) |
| 30 to 34 Years | 15 (100.0%) | 0 (0.0%) |
| 35 to 44 Years | 18 (100.0%) | 0 (0.0%) |
| 45 to 54 Years | 0 (0.0%) | 0 (0.0%) |
| 55 to 59 Years | 3 (23.1%) | 0 (0.0%) |
| 60 to 64 Years | 0 (0.0%) | 0 (0.0%) |
| 65 to 74 Years | 6 (100.0%) | 0 (0.0%) |
| 75 Years and over | 0 (0.0%) | 0 (0.0%) |
| Total | 53 (71.6%) | 0 (0.0%) |
Employment Status by Educational Attainment in False Pass
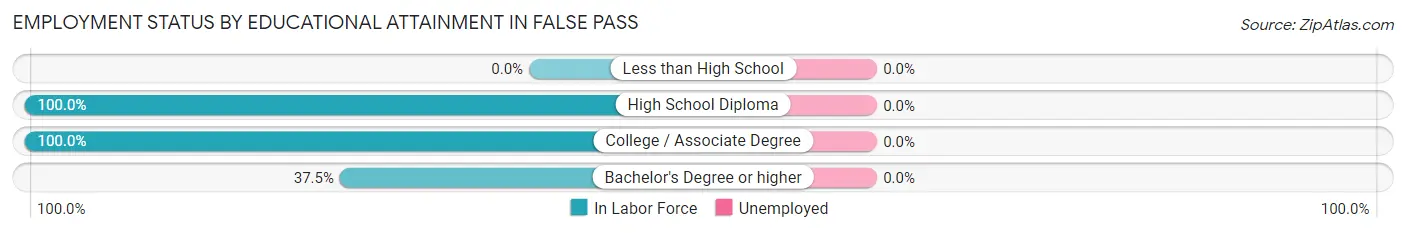
| Educational Attainment | In Labor Force | Unemployed |
| Less than High School | 0 (0.0%) | 0 (0.0%) |
| High School Diploma | 7 (100.0%) | 0 (0.0%) |
| College / Associate Degree | 23 (100.0%) | 0 (0.0%) |
| Bachelor's Degree or higher | 6 (37.5%) | 0 (0.0%) |
| Total | 36 (78.3%) | 0 (0.0%) |
Employment Occupations by Sex in False Pass
Management, Business, Science and Arts Occupations
The most common Management, Business, Science and Arts occupations in False Pass are , and Management (18 | 34.0%).
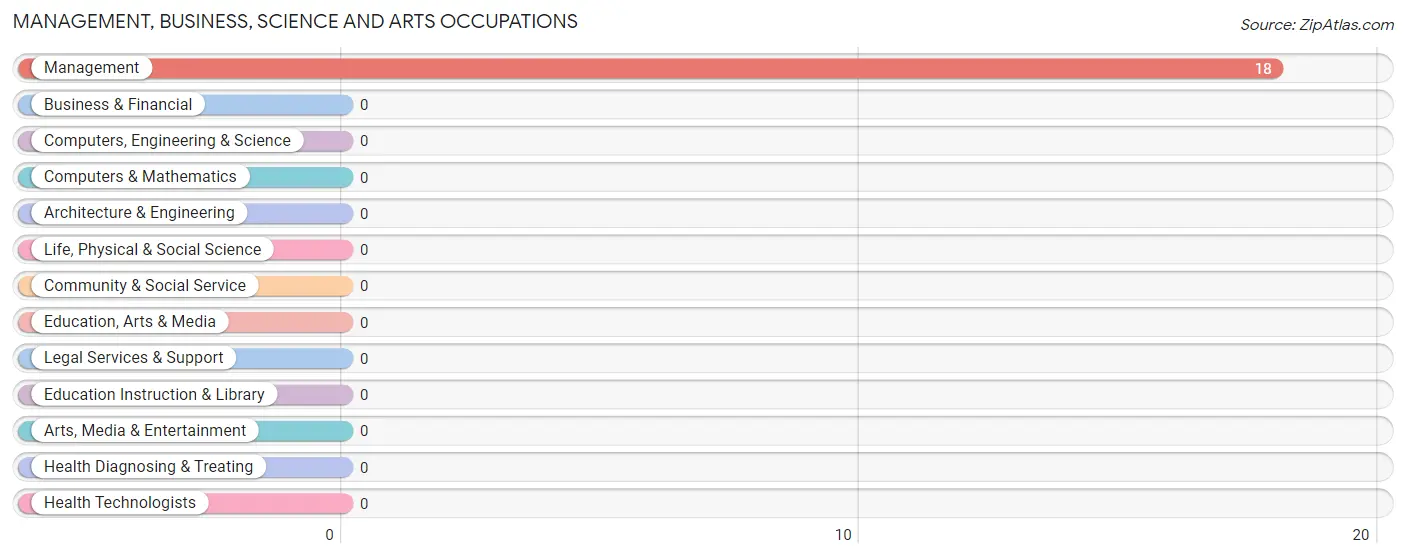
Management, Business, Science and Arts Occupations by Sex
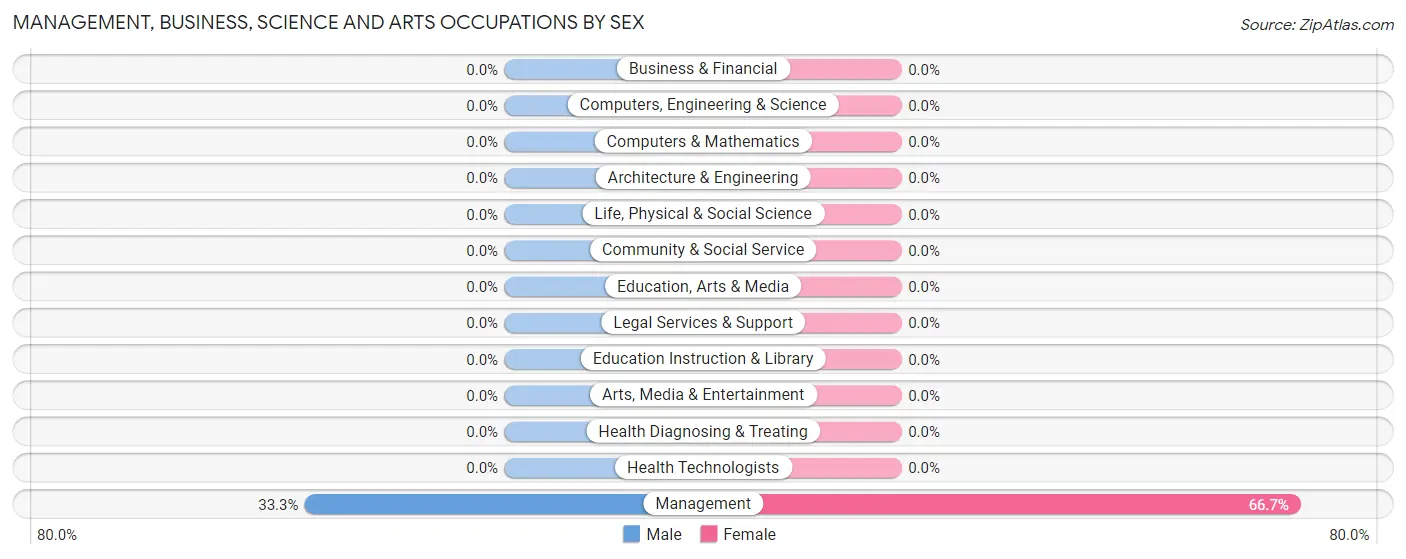
| Occupation | Male | Female |
| Management | 6 (33.3%) | 12 (66.7%) |
| Business & Financial | 0 (0.0%) | 0 (0.0%) |
| Computers, Engineering & Science | 0 (0.0%) | 0 (0.0%) |
| Computers & Mathematics | 0 (0.0%) | 0 (0.0%) |
| Architecture & Engineering | 0 (0.0%) | 0 (0.0%) |
| Life, Physical & Social Science | 0 (0.0%) | 0 (0.0%) |
| Community & Social Service | 0 (0.0%) | 0 (0.0%) |
| Education, Arts & Media | 0 (0.0%) | 0 (0.0%) |
| Legal Services & Support | 0 (0.0%) | 0 (0.0%) |
| Education Instruction & Library | 0 (0.0%) | 0 (0.0%) |
| Arts, Media & Entertainment | 0 (0.0%) | 0 (0.0%) |
| Health Diagnosing & Treating | 0 (0.0%) | 0 (0.0%) |
| Health Technologists | 0 (0.0%) | 0 (0.0%) |
| Total (Category) | 6 (33.3%) | 12 (66.7%) |
| Total (Overall) | 39 (73.6%) | 14 (26.4%) |
Services Occupations
Services Occupations by Sex
| Occupation | Male | Female |
| Healthcare Support | 0 (0.0%) | 0 (0.0%) |
| Security & Protection | 0 (0.0%) | 0 (0.0%) |
| Firefighting & Prevention | 0 (0.0%) | 0 (0.0%) |
| Law Enforcement | 0 (0.0%) | 0 (0.0%) |
| Food Preparation & Serving | 0 (0.0%) | 0 (0.0%) |
| Cleaning & Maintenance | 0 (0.0%) | 0 (0.0%) |
| Personal Care & Service | 0 (0.0%) | 0 (0.0%) |
| Total (Category) | 0 (0.0%) | 0 (0.0%) |
| Total (Overall) | 39 (73.6%) | 14 (26.4%) |
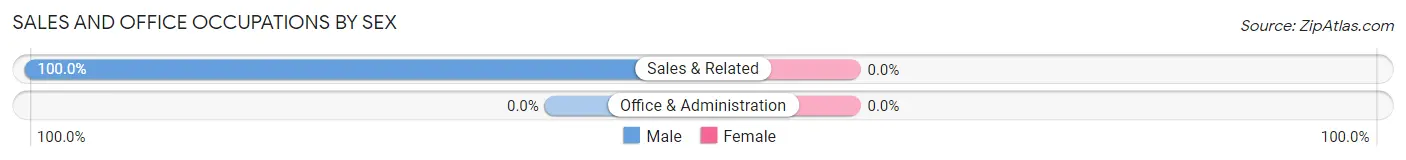
Sales and Office Occupations
The most common Sales and Office occupations in False Pass are , and Sales & Related (12 | 22.6%).
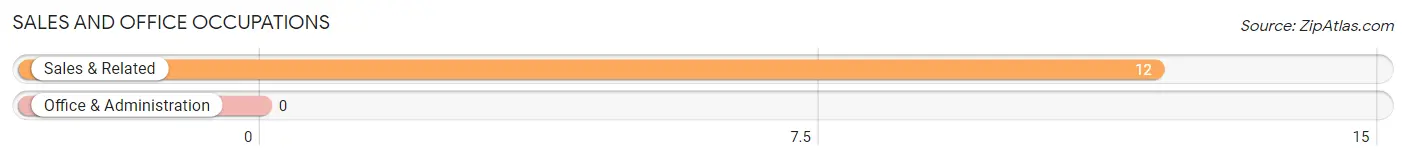
Sales and Office Occupations by Sex
| Occupation | Male | Female |
| Sales & Related | 12 (100.0%) | 0 (0.0%) |
| Office & Administration | 0 (0.0%) | 0 (0.0%) |
| Total (Category) | 12 (100.0%) | 0 (0.0%) |
| Total (Overall) | 39 (73.6%) | 14 (26.4%) |
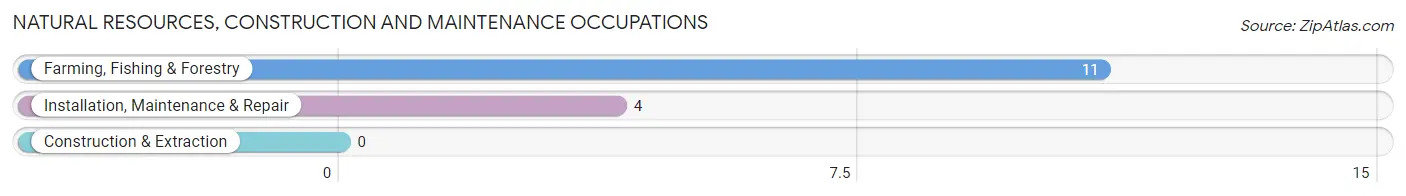
Natural Resources, Construction and Maintenance Occupations
The most common Natural Resources, Construction and Maintenance occupations in False Pass are Farming, Fishing & Forestry (11 | 20.7%), and Installation, Maintenance & Repair (4 | 7.5%).
Natural Resources, Construction and Maintenance Occupations by Sex
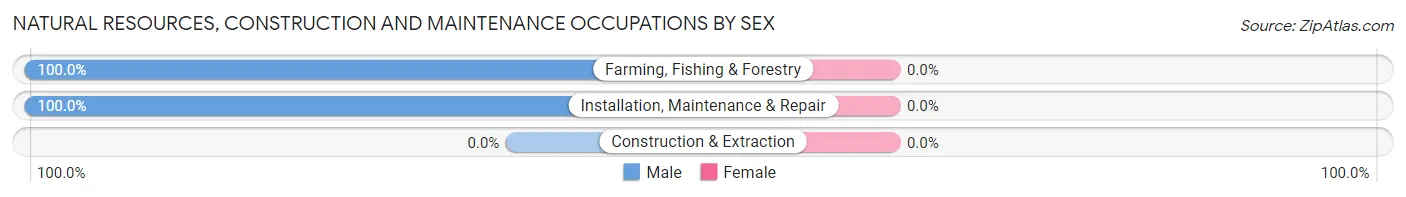
| Occupation | Male | Female |
| Farming, Fishing & Forestry | 11 (100.0%) | 0 (0.0%) |
| Construction & Extraction | 0 (0.0%) | 0 (0.0%) |
| Installation, Maintenance & Repair | 4 (100.0%) | 0 (0.0%) |
| Total (Category) | 15 (100.0%) | 0 (0.0%) |
| Total (Overall) | 39 (73.6%) | 14 (26.4%) |
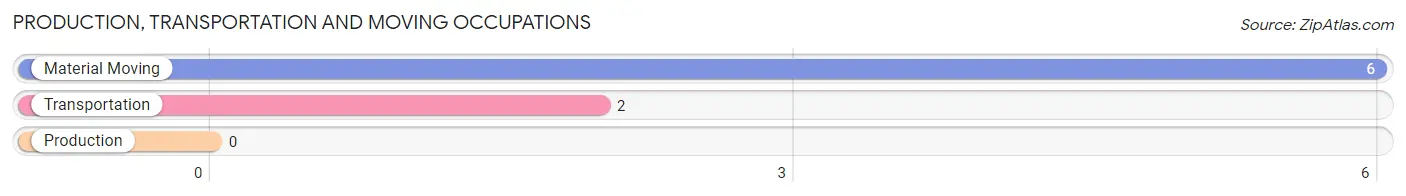
Production, Transportation and Moving Occupations
The most common Production, Transportation and Moving occupations in False Pass are Material Moving (6 | 11.3%), and Transportation (2 | 3.8%).
Production, Transportation and Moving Occupations by Sex
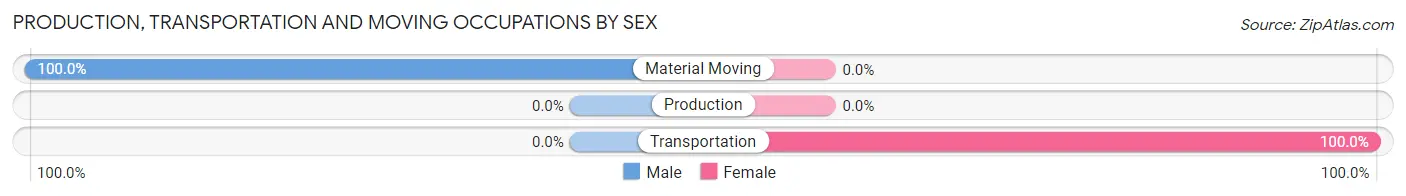
| Occupation | Male | Female |
| Production | 0 (0.0%) | 0 (0.0%) |
| Transportation | 0 (0.0%) | 2 (100.0%) |
| Material Moving | 6 (100.0%) | 0 (0.0%) |
| Total (Category) | 6 (75.0%) | 2 (25.0%) |
| Total (Overall) | 39 (73.6%) | 14 (26.4%) |
Employment Industries by Sex in False Pass
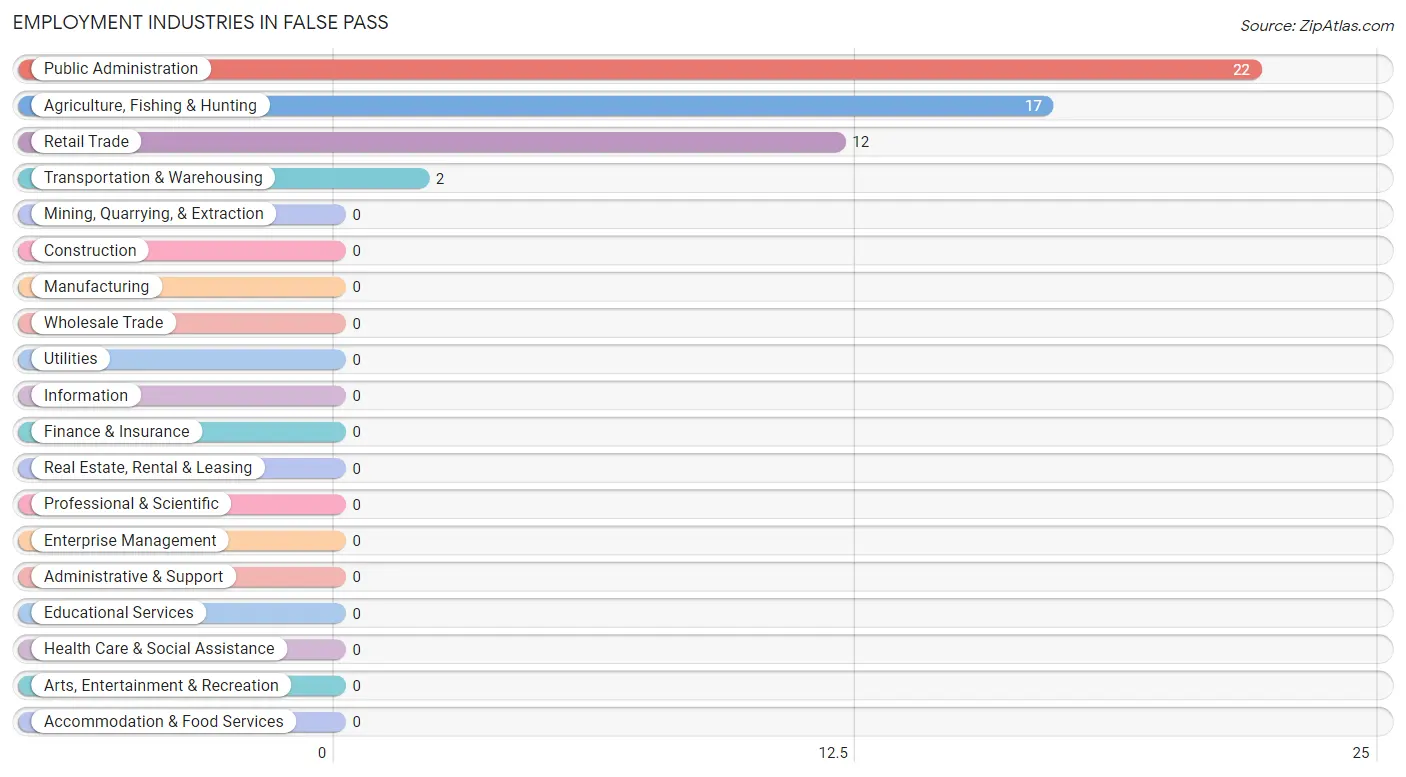
Employment Industries in False Pass
The major employment industries in False Pass include Public Administration (22 | 41.5%), Agriculture, Fishing & Hunting (17 | 32.1%), Retail Trade (12 | 22.6%), and Transportation & Warehousing (2 | 3.8%).
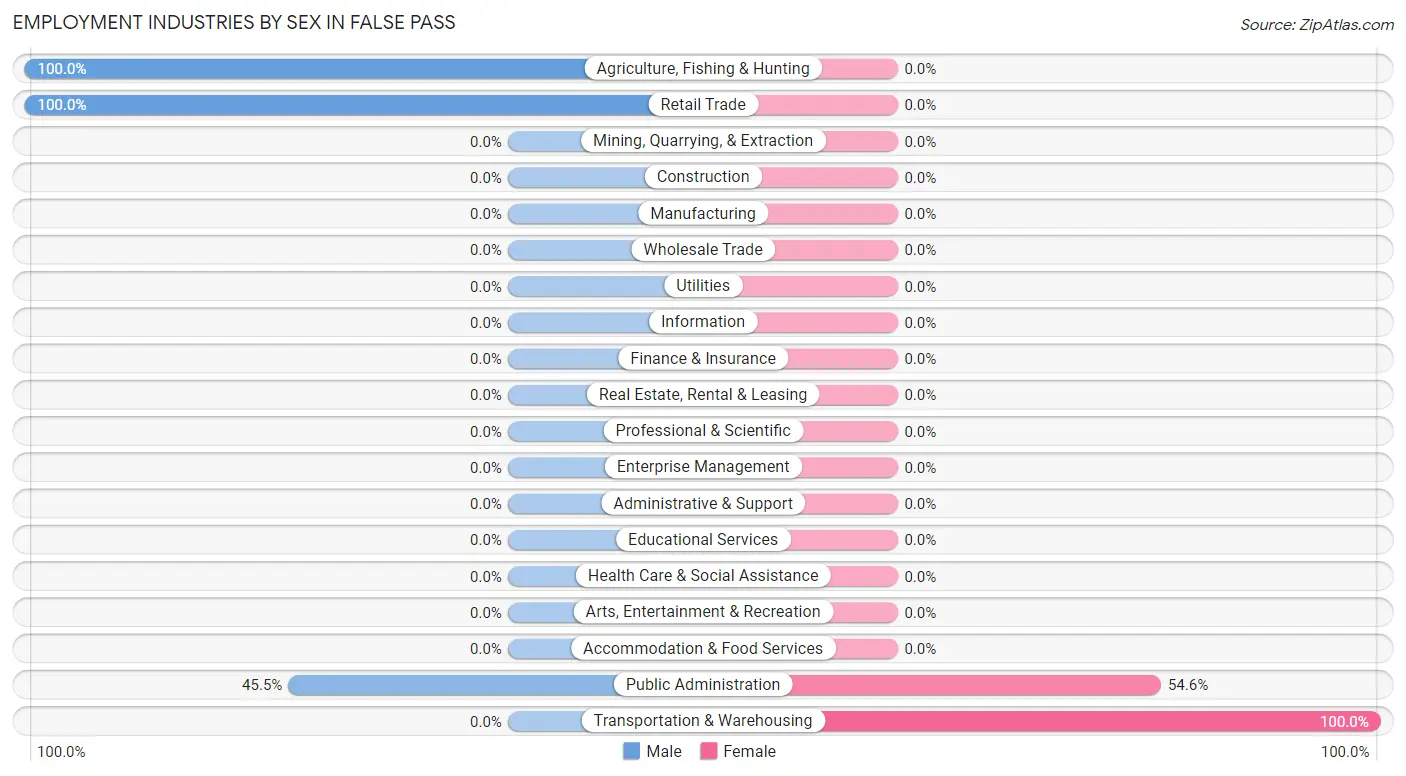
Employment Industries by Sex in False Pass
The False Pass industries that see more men than women are Agriculture, Fishing & Hunting (100.0%), Retail Trade (100.0%), and Public Administration (45.5%), whereas the industries that tend to have a higher number of women are Transportation & Warehousing (100.0%), and Public Administration (54.5%).
| Industry | Male | Female |
| Agriculture, Fishing & Hunting | 17 (100.0%) | 0 (0.0%) |
| Mining, Quarrying, & Extraction | 0 (0.0%) | 0 (0.0%) |
| Construction | 0 (0.0%) | 0 (0.0%) |
| Manufacturing | 0 (0.0%) | 0 (0.0%) |
| Wholesale Trade | 0 (0.0%) | 0 (0.0%) |
| Retail Trade | 12 (100.0%) | 0 (0.0%) |
| Transportation & Warehousing | 0 (0.0%) | 2 (100.0%) |
| Utilities | 0 (0.0%) | 0 (0.0%) |
| Information | 0 (0.0%) | 0 (0.0%) |
| Finance & Insurance | 0 (0.0%) | 0 (0.0%) |
| Real Estate, Rental & Leasing | 0 (0.0%) | 0 (0.0%) |
| Professional & Scientific | 0 (0.0%) | 0 (0.0%) |
| Enterprise Management | 0 (0.0%) | 0 (0.0%) |
| Administrative & Support | 0 (0.0%) | 0 (0.0%) |
| Educational Services | 0 (0.0%) | 0 (0.0%) |
| Health Care & Social Assistance | 0 (0.0%) | 0 (0.0%) |
| Arts, Entertainment & Recreation | 0 (0.0%) | 0 (0.0%) |
| Accommodation & Food Services | 0 (0.0%) | 0 (0.0%) |
| Public Administration | 10 (45.5%) | 12 (54.5%) |
| Total | 39 (73.6%) | 14 (26.4%) |
Education in False Pass
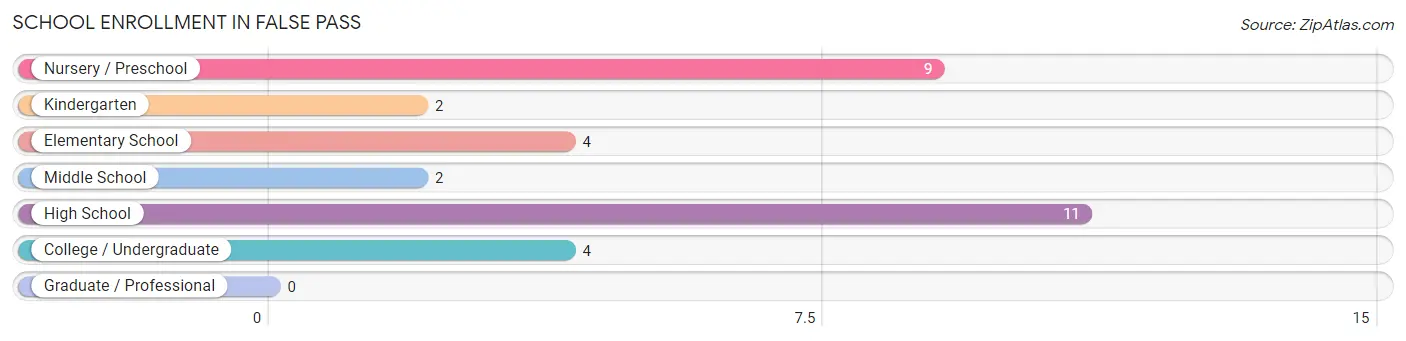
School Enrollment in False Pass
The most common levels of schooling among the 32 students in False Pass are high school (11 | 34.4%), nursery / preschool (9 | 28.1%), and elementary school (4 | 12.5%).
| School Level | # Students | % Students |
| Nursery / Preschool | 9 | 28.1% |
| Kindergarten | 2 | 6.2% |
| Elementary School | 4 | 12.5% |
| Middle School | 2 | 6.2% |
| High School | 11 | 34.4% |
| College / Undergraduate | 4 | 12.5% |
| Graduate / Professional | 0 | 0.0% |
| Total | 32 | 100.0% |
School Enrollment by Age by Funding Source in False Pass
Out of a total of 32 students who are enrolled in schools in False Pass, 24 (75.0%) attend a private institution, while the remaining 8 (25.0%) are enrolled in public schools. The age group of 3 to 4 year olds has the highest likelihood of being enrolled in private schools, with 9 (100.0% in the age bracket) enrolled. Conversely, the age group of 5 to 9 year old has the lowest likelihood of being enrolled in a private school, with 6 (100.0% in the age bracket) attending a public institution.
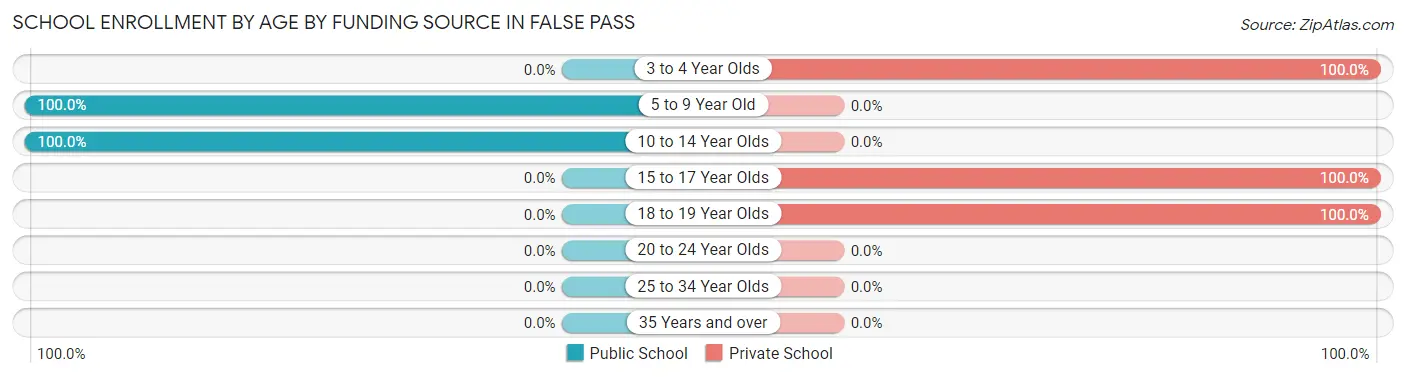
| Age Bracket | Public School | Private School |
| 3 to 4 Year Olds | 0 (0.0%) | 9 (100.0%) |
| 5 to 9 Year Old | 6 (100.0%) | 0 (0.0%) |
| 10 to 14 Year Olds | 2 (100.0%) | 0 (0.0%) |
| 15 to 17 Year Olds | 0 (0.0%) | 11 (100.0%) |
| 18 to 19 Year Olds | 0 (0.0%) | 4 (100.0%) |
| 20 to 24 Year Olds | 0 (0.0%) | 0 (0.0%) |
| 25 to 34 Year Olds | 0 (0.0%) | 0 (0.0%) |
| 35 Years and over | 0 (0.0%) | 0 (0.0%) |
| Total | 8 (25.0%) | 24 (75.0%) |
Educational Attainment by Field of Study in False Pass
Business (13 | 68.4%), social sciences (3 | 15.8%), and visual & performing arts (3 | 15.8%) are the most common fields of study among 19 individuals in False Pass who have obtained a bachelor's degree or higher.
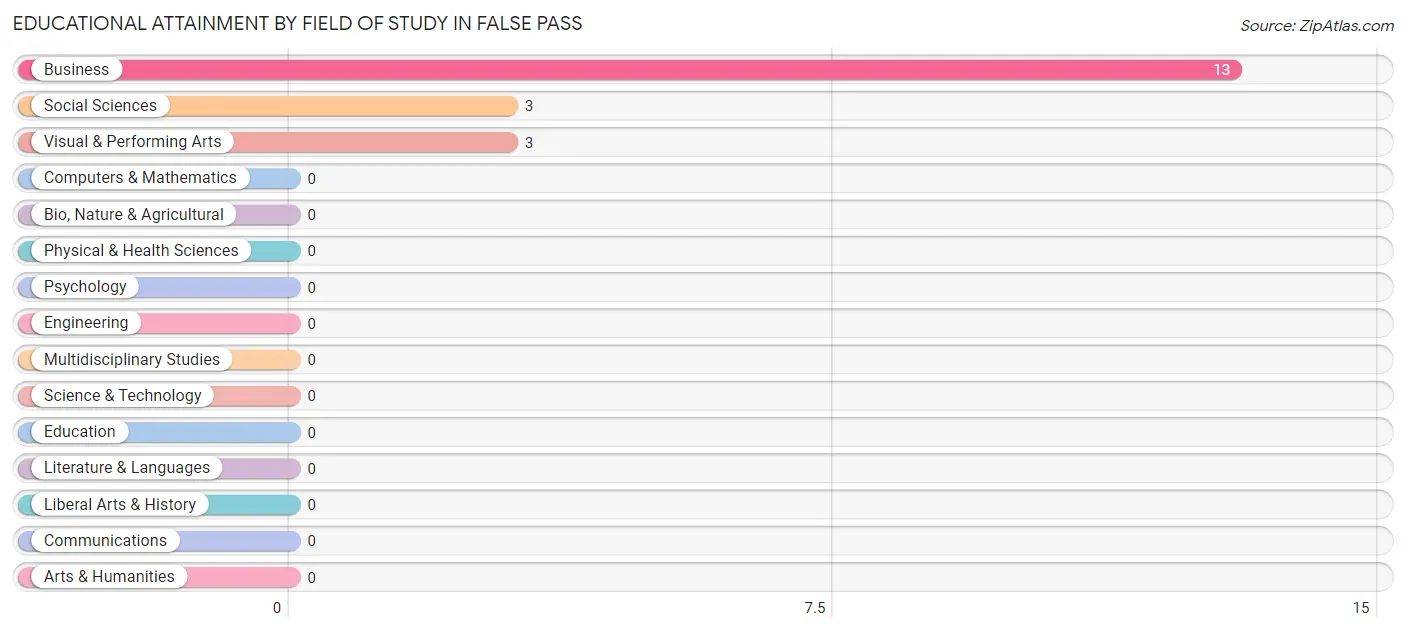
| Field of Study | # Graduates | % Graduates |
| Computers & Mathematics | 0 | 0.0% |
| Bio, Nature & Agricultural | 0 | 0.0% |
| Physical & Health Sciences | 0 | 0.0% |
| Psychology | 0 | 0.0% |
| Social Sciences | 3 | 15.8% |
| Engineering | 0 | 0.0% |
| Multidisciplinary Studies | 0 | 0.0% |
| Science & Technology | 0 | 0.0% |
| Business | 13 | 68.4% |
| Education | 0 | 0.0% |
| Literature & Languages | 0 | 0.0% |
| Liberal Arts & History | 0 | 0.0% |
| Visual & Performing Arts | 3 | 15.8% |
| Communications | 0 | 0.0% |
| Arts & Humanities | 0 | 0.0% |
| Total | 19 | 100.0% |
Transportation & Commute in False Pass
Vehicle Availability by Sex in False Pass
The most prevalent vehicle ownership categories in False Pass are males with 1 vehicle (36, accounting for 92.3%) and females with 1 vehicle (12, making up 257.1%).
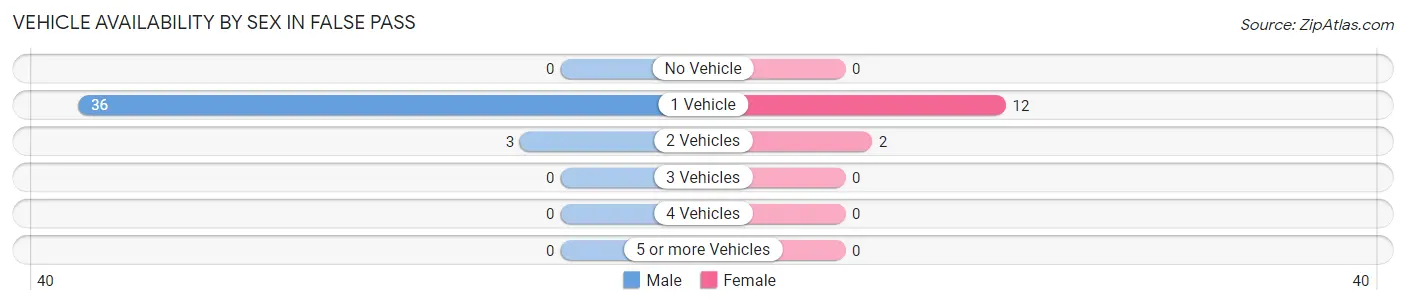
| Vehicles Available | Male | Female |
| No Vehicle | 0 (0.0%) | 0 (0.0%) |
| 1 Vehicle | 36 (92.3%) | 12 (85.7%) |
| 2 Vehicles | 3 (7.7%) | 2 (14.3%) |
| 3 Vehicles | 0 (0.0%) | 0 (0.0%) |
| 4 Vehicles | 0 (0.0%) | 0 (0.0%) |
| 5 or more Vehicles | 0 (0.0%) | 0 (0.0%) |
| Total | 39 (100.0%) | 14 (100.0%) |
Commute Time in False Pass
The most frequently occuring commute durations in False Pass are 5 to 9 minutes (20 commuters, 55.6%), less than 5 minutes (13 commuters, 36.1%), and 10 to 14 minutes (3 commuters, 8.3%).
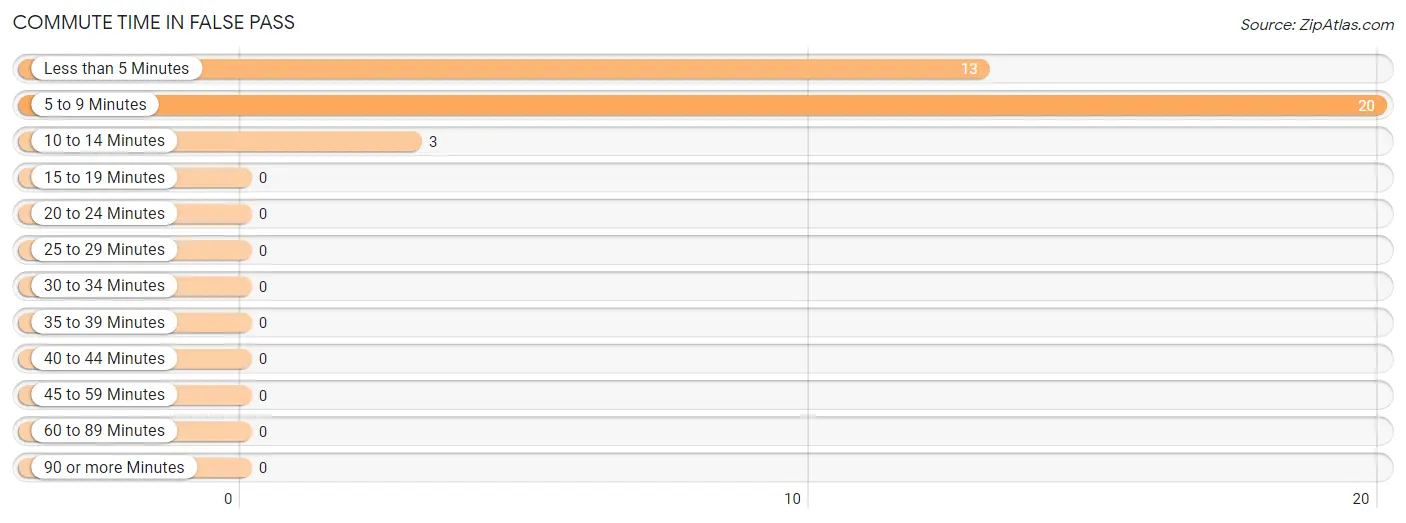
| Commute Time | # Commuters | % Commuters |
| Less than 5 Minutes | 13 | 36.1% |
| 5 to 9 Minutes | 20 | 55.6% |
| 10 to 14 Minutes | 3 | 8.3% |
| 15 to 19 Minutes | 0 | 0.0% |
| 20 to 24 Minutes | 0 | 0.0% |
| 25 to 29 Minutes | 0 | 0.0% |
| 30 to 34 Minutes | 0 | 0.0% |
| 35 to 39 Minutes | 0 | 0.0% |
| 40 to 44 Minutes | 0 | 0.0% |
| 45 to 59 Minutes | 0 | 0.0% |
| 60 to 89 Minutes | 0 | 0.0% |
| 90 or more Minutes | 0 | 0.0% |
Commute Time by Sex in False Pass
The most common commute times in False Pass are 5 to 9 minutes (15 commuters, 53.6%) for males and 5 to 9 minutes (5 commuters, 62.5%) for females.
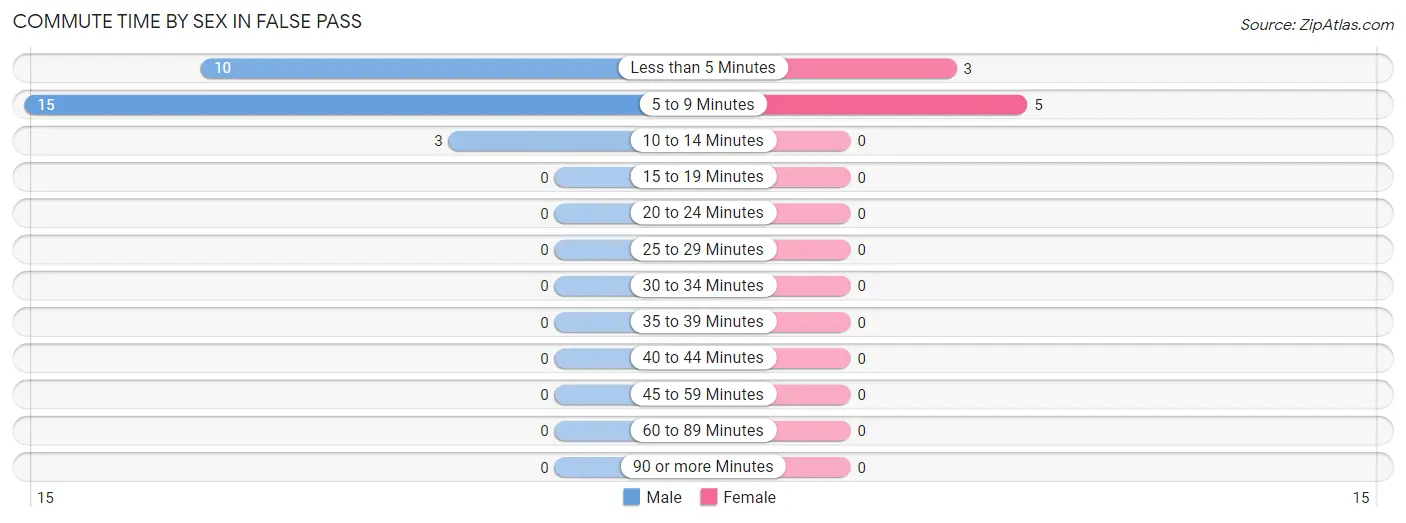
| Commute Time | Male | Female |
| Less than 5 Minutes | 10 (35.7%) | 3 (37.5%) |
| 5 to 9 Minutes | 15 (53.6%) | 5 (62.5%) |
| 10 to 14 Minutes | 3 (10.7%) | 0 (0.0%) |
| 15 to 19 Minutes | 0 (0.0%) | 0 (0.0%) |
| 20 to 24 Minutes | 0 (0.0%) | 0 (0.0%) |
| 25 to 29 Minutes | 0 (0.0%) | 0 (0.0%) |
| 30 to 34 Minutes | 0 (0.0%) | 0 (0.0%) |
| 35 to 39 Minutes | 0 (0.0%) | 0 (0.0%) |
| 40 to 44 Minutes | 0 (0.0%) | 0 (0.0%) |
| 45 to 59 Minutes | 0 (0.0%) | 0 (0.0%) |
| 60 to 89 Minutes | 0 (0.0%) | 0 (0.0%) |
| 90 or more Minutes | 0 (0.0%) | 0 (0.0%) |
Time of Departure to Work by Sex in False Pass
The most frequent times of departure to work in False Pass are 9:00 AM to 9:59 AM (22, 78.6%) for males and 7:30 AM to 7:59 AM (3, 37.5%) for females.
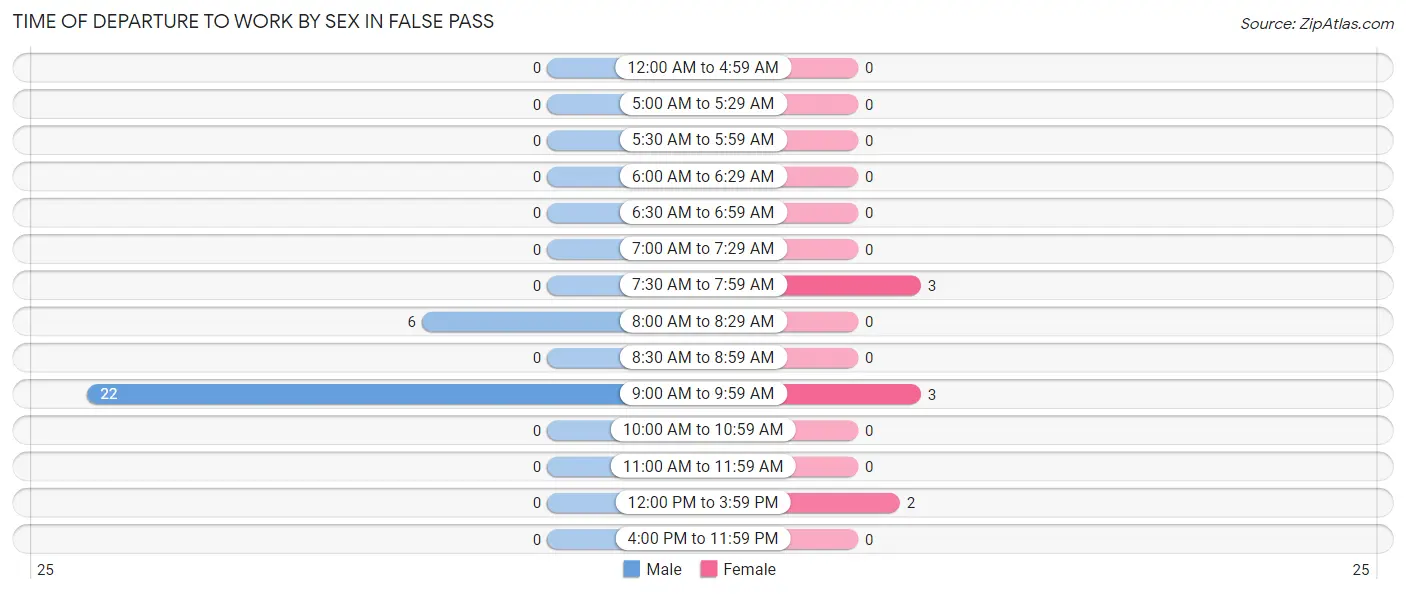
| Time of Departure | Male | Female |
| 12:00 AM to 4:59 AM | 0 (0.0%) | 0 (0.0%) |
| 5:00 AM to 5:29 AM | 0 (0.0%) | 0 (0.0%) |
| 5:30 AM to 5:59 AM | 0 (0.0%) | 0 (0.0%) |
| 6:00 AM to 6:29 AM | 0 (0.0%) | 0 (0.0%) |
| 6:30 AM to 6:59 AM | 0 (0.0%) | 0 (0.0%) |
| 7:00 AM to 7:29 AM | 0 (0.0%) | 0 (0.0%) |
| 7:30 AM to 7:59 AM | 0 (0.0%) | 3 (37.5%) |
| 8:00 AM to 8:29 AM | 6 (21.4%) | 0 (0.0%) |
| 8:30 AM to 8:59 AM | 0 (0.0%) | 0 (0.0%) |
| 9:00 AM to 9:59 AM | 22 (78.6%) | 3 (37.5%) |
| 10:00 AM to 10:59 AM | 0 (0.0%) | 0 (0.0%) |
| 11:00 AM to 11:59 AM | 0 (0.0%) | 0 (0.0%) |
| 12:00 PM to 3:59 PM | 0 (0.0%) | 2 (25.0%) |
| 4:00 PM to 11:59 PM | 0 (0.0%) | 0 (0.0%) |
| Total | 28 (100.0%) | 8 (100.0%) |
Housing Occupancy in False Pass
Occupancy by Ownership in False Pass
Of the total 33 dwellings in False Pass, owner-occupied units account for 12 (36.4%), while renter-occupied units make up 21 (63.6%).
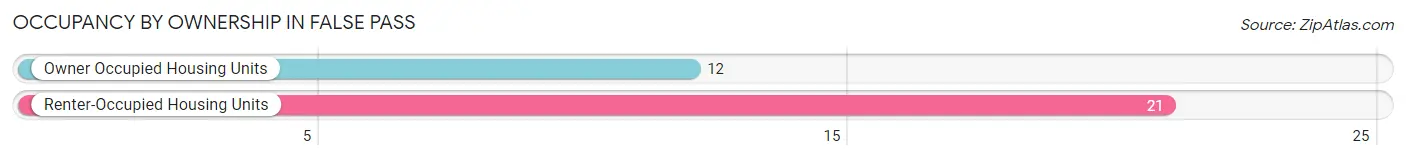
| Occupancy | # Housing Units | % Housing Units |
| Owner Occupied Housing Units | 12 | 36.4% |
| Renter-Occupied Housing Units | 21 | 63.6% |
| Total Occupied Housing Units | 33 | 100.0% |
Occupancy by Household Size in False Pass
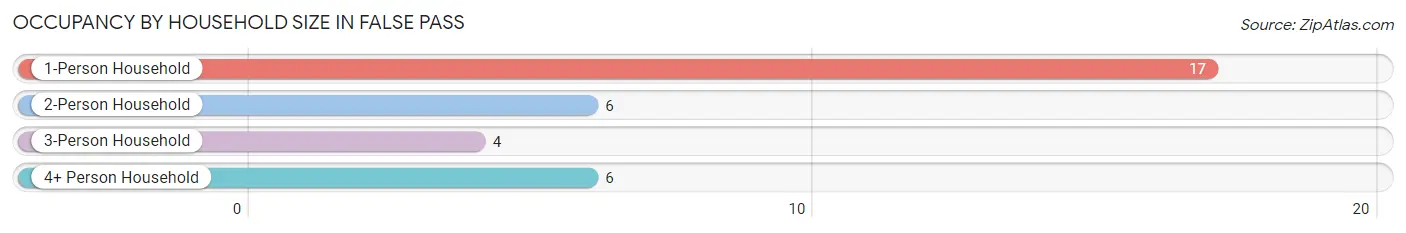
| Household Size | # Housing Units | % Housing Units |
| 1-Person Household | 17 | 51.5% |
| 2-Person Household | 6 | 18.2% |
| 3-Person Household | 4 | 12.1% |
| 4+ Person Household | 6 | 18.2% |
| Total Housing Units | 33 | 100.0% |
Occupancy by Ownership by Household Size in False Pass
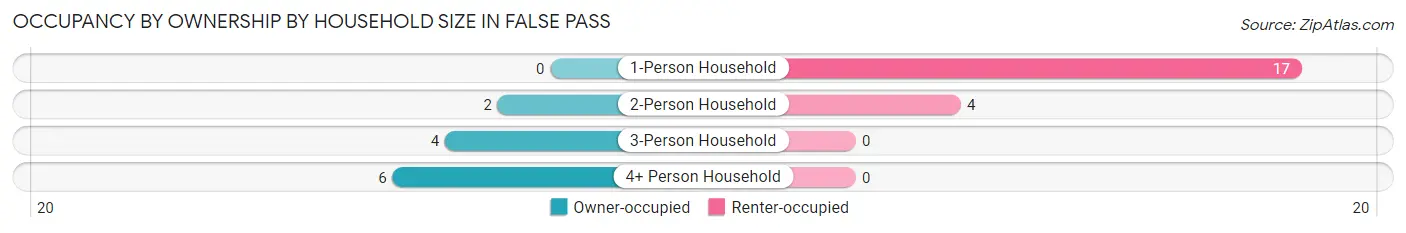
| Household Size | Owner-occupied | Renter-occupied |
| 1-Person Household | 0 (0.0%) | 17 (100.0%) |
| 2-Person Household | 2 (33.3%) | 4 (66.7%) |
| 3-Person Household | 4 (100.0%) | 0 (0.0%) |
| 4+ Person Household | 6 (100.0%) | 0 (0.0%) |
| Total Housing Units | 12 (36.4%) | 21 (63.6%) |
Occupancy by Educational Attainment in False Pass
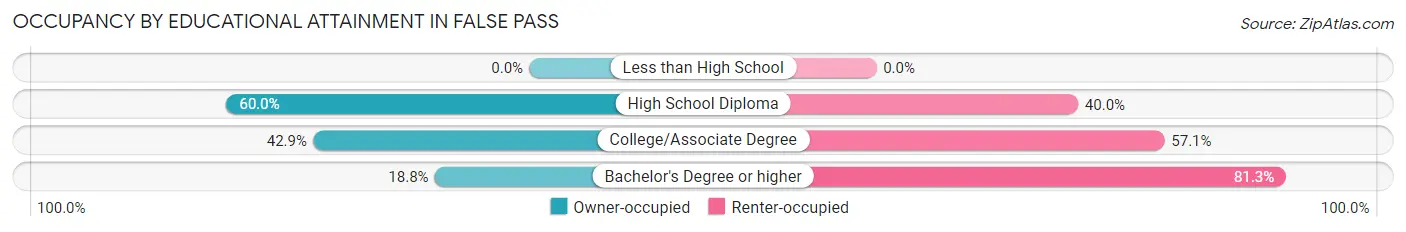
| Household Size | Owner-occupied | Renter-occupied |
| Less than High School | 0 (0.0%) | 0 (0.0%) |
| High School Diploma | 6 (60.0%) | 4 (40.0%) |
| College/Associate Degree | 3 (42.9%) | 4 (57.1%) |
| Bachelor's Degree or higher | 3 (18.8%) | 13 (81.2%) |
Occupancy by Age of Householder in False Pass
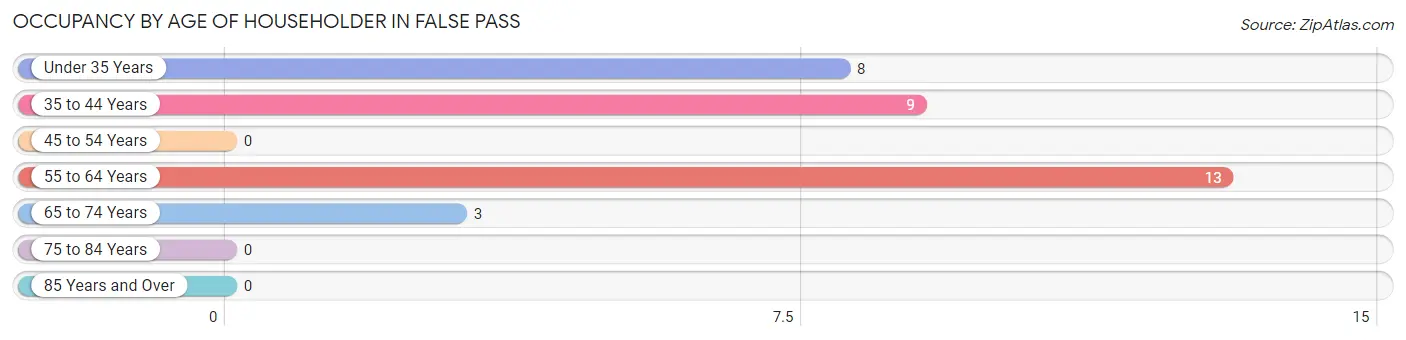
| Age Bracket | # Households | % Households |
| Under 35 Years | 8 | 24.2% |
| 35 to 44 Years | 9 | 27.3% |
| 45 to 54 Years | 0 | 0.0% |
| 55 to 64 Years | 13 | 39.4% |
| 65 to 74 Years | 3 | 9.1% |
| 75 to 84 Years | 0 | 0.0% |
| 85 Years and Over | 0 | 0.0% |
| Total | 33 | 100.0% |
Housing Finances in False Pass
Median Income by Occupancy in False Pass
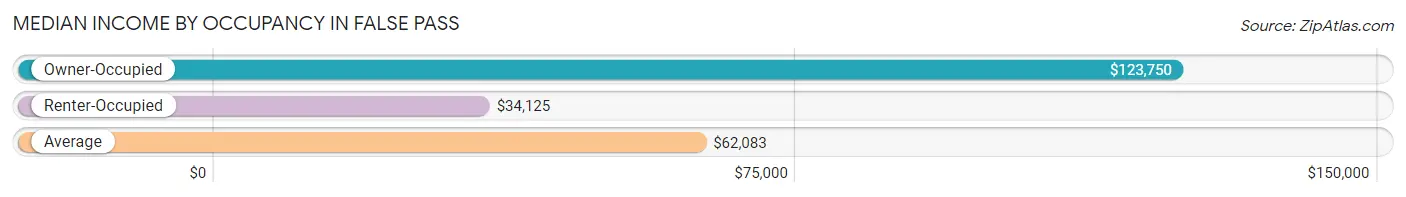
| Occupancy Type | # Households | Median Income |
| Owner-Occupied | 12 (36.4%) | $123,750 |
| Renter-Occupied | 21 (63.6%) | $34,125 |
| Average | 33 (100.0%) | $62,083 |
Occupancy by Householder Income Bracket in False Pass
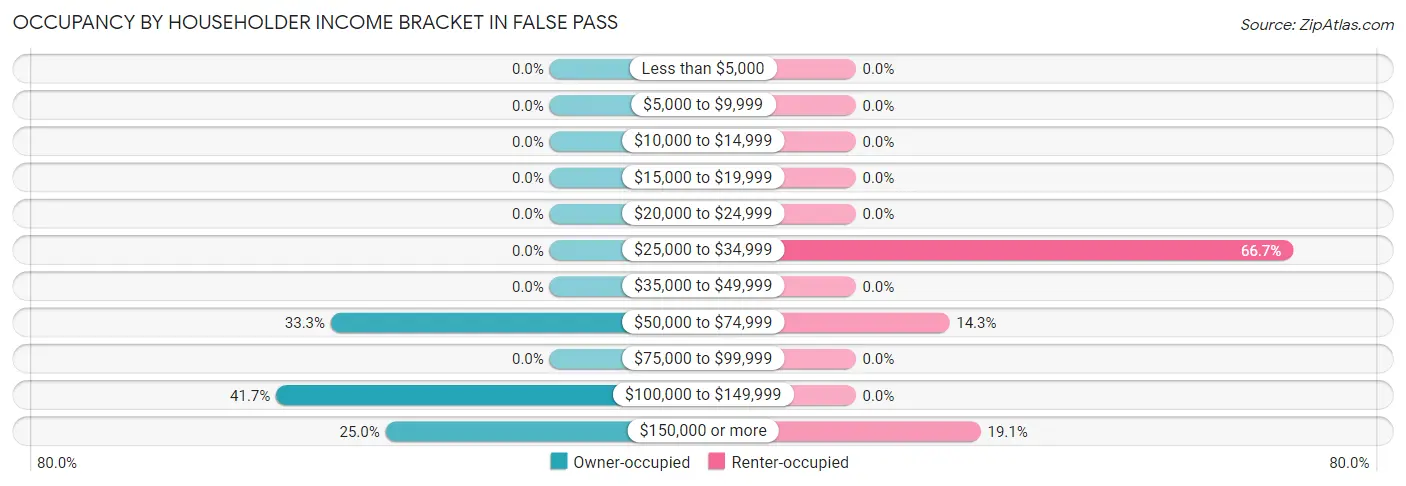
| Income Bracket | Owner-occupied | Renter-occupied |
| Less than $5,000 | 0 (0.0%) | 0 (0.0%) |
| $5,000 to $9,999 | 0 (0.0%) | 0 (0.0%) |
| $10,000 to $14,999 | 0 (0.0%) | 0 (0.0%) |
| $15,000 to $19,999 | 0 (0.0%) | 0 (0.0%) |
| $20,000 to $24,999 | 0 (0.0%) | 0 (0.0%) |
| $25,000 to $34,999 | 0 (0.0%) | 14 (66.7%) |
| $35,000 to $49,999 | 0 (0.0%) | 0 (0.0%) |
| $50,000 to $74,999 | 4 (33.3%) | 3 (14.3%) |
| $75,000 to $99,999 | 0 (0.0%) | 0 (0.0%) |
| $100,000 to $149,999 | 5 (41.7%) | 0 (0.0%) |
| $150,000 or more | 3 (25.0%) | 4 (19.1%) |
| Total | 12 (100.0%) | 21 (100.0%) |
Monthly Housing Cost Tiers in False Pass
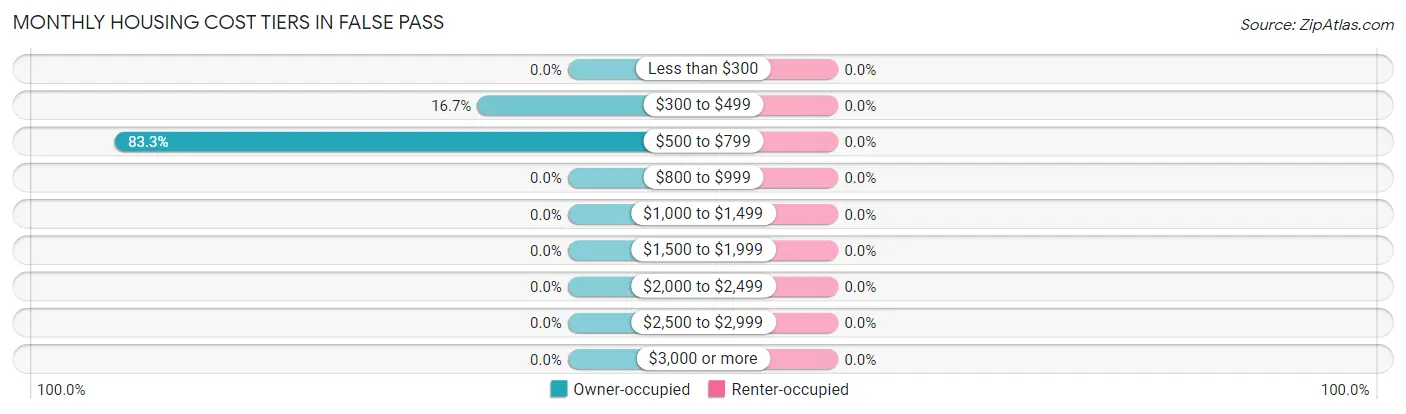
| Monthly Cost | Owner-occupied | Renter-occupied |
| Less than $300 | 0 (0.0%) | 0 (0.0%) |
| $300 to $499 | 2 (16.7%) | 0 (0.0%) |
| $500 to $799 | 10 (83.3%) | 0 (0.0%) |
| $800 to $999 | 0 (0.0%) | 0 (0.0%) |
| $1,000 to $1,499 | 0 (0.0%) | 0 (0.0%) |
| $1,500 to $1,999 | 0 (0.0%) | 0 (0.0%) |
| $2,000 to $2,499 | 0 (0.0%) | 0 (0.0%) |
| $2,500 to $2,999 | 0 (0.0%) | 0 (0.0%) |
| $3,000 or more | 0 (0.0%) | 0 (0.0%) |
| Total | 12 (100.0%) | 21 (100.0%) |
Physical Housing Characteristics in False Pass
Housing Structures in False Pass
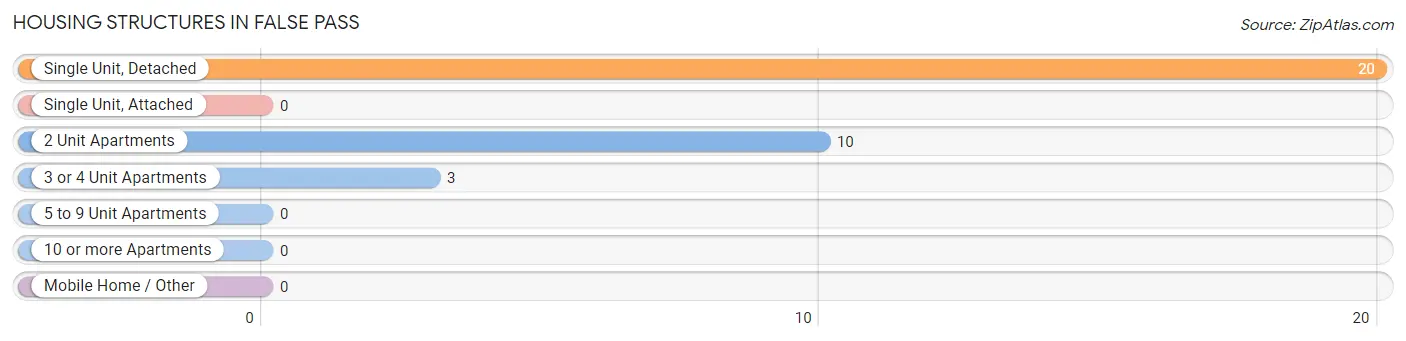
| Structure Type | # Housing Units | % Housing Units |
| Single Unit, Detached | 20 | 60.6% |
| Single Unit, Attached | 0 | 0.0% |
| 2 Unit Apartments | 10 | 30.3% |
| 3 or 4 Unit Apartments | 3 | 9.1% |
| 5 to 9 Unit Apartments | 0 | 0.0% |
| 10 or more Apartments | 0 | 0.0% |
| Mobile Home / Other | 0 | 0.0% |
| Total | 33 | 100.0% |
Housing Structures by Occupancy in False Pass
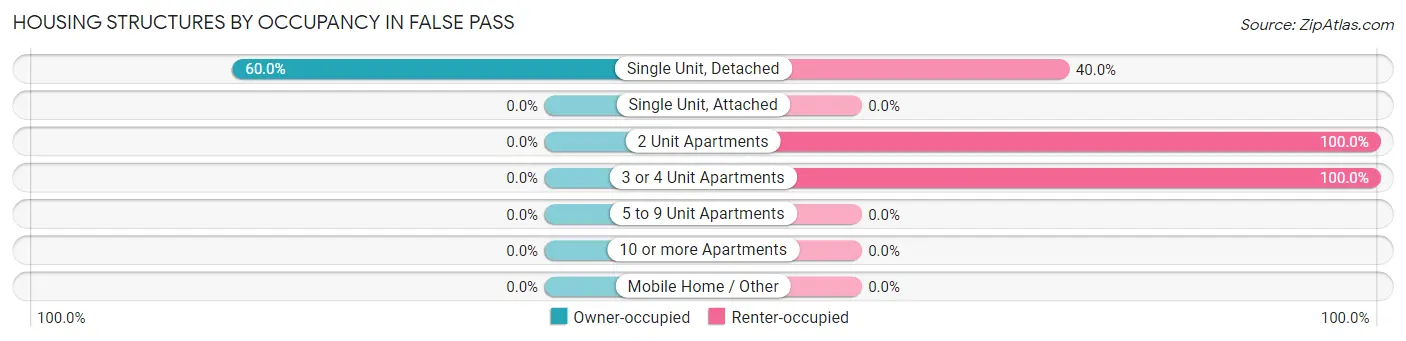
| Structure Type | Owner-occupied | Renter-occupied |
| Single Unit, Detached | 12 (60.0%) | 8 (40.0%) |
| Single Unit, Attached | 0 (0.0%) | 0 (0.0%) |
| 2 Unit Apartments | 0 (0.0%) | 10 (100.0%) |
| 3 or 4 Unit Apartments | 0 (0.0%) | 3 (100.0%) |
| 5 to 9 Unit Apartments | 0 (0.0%) | 0 (0.0%) |
| 10 or more Apartments | 0 (0.0%) | 0 (0.0%) |
| Mobile Home / Other | 0 (0.0%) | 0 (0.0%) |
| Total | 12 (36.4%) | 21 (63.6%) |
Housing Structures by Number of Rooms in False Pass
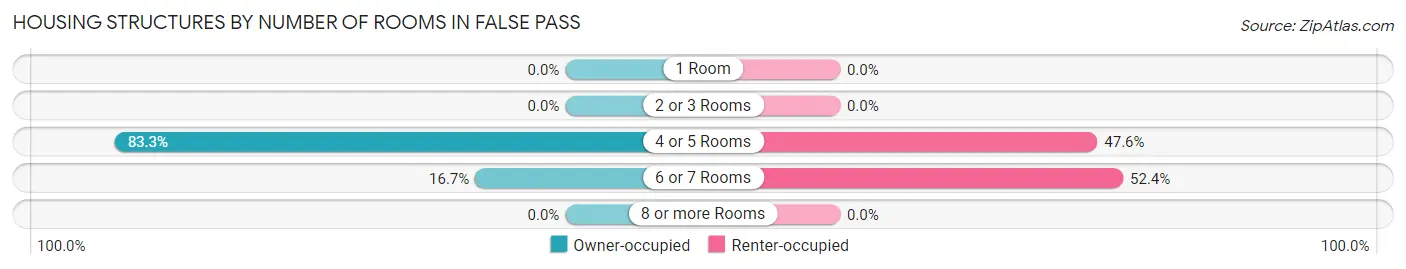
| Number of Rooms | Owner-occupied | Renter-occupied |
| 1 Room | 0 (0.0%) | 0 (0.0%) |
| 2 or 3 Rooms | 0 (0.0%) | 0 (0.0%) |
| 4 or 5 Rooms | 10 (83.3%) | 10 (47.6%) |
| 6 or 7 Rooms | 2 (16.7%) | 11 (52.4%) |
| 8 or more Rooms | 0 (0.0%) | 0 (0.0%) |
| Total | 12 (100.0%) | 21 (100.0%) |
Housing Structure by Heating Type in False Pass
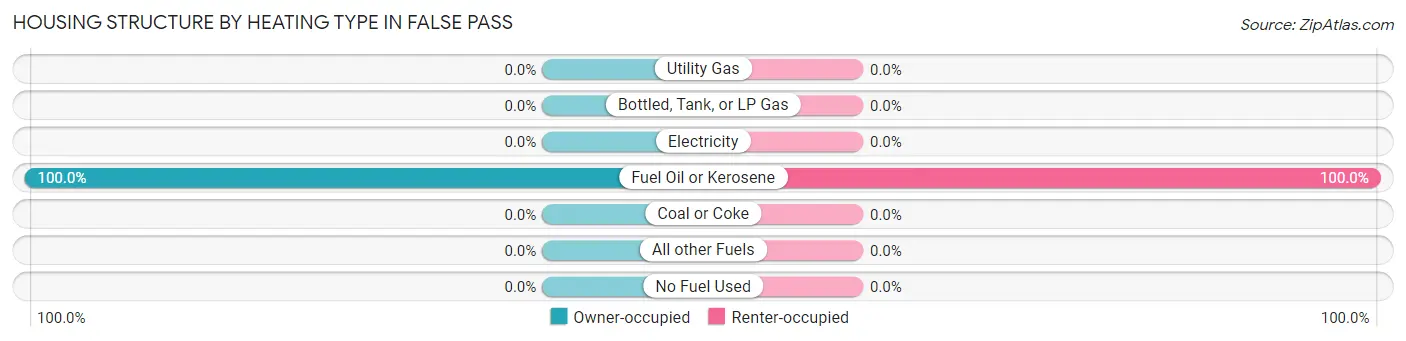
| Heating Type | Owner-occupied | Renter-occupied |
| Utility Gas | 0 (0.0%) | 0 (0.0%) |
| Bottled, Tank, or LP Gas | 0 (0.0%) | 0 (0.0%) |
| Electricity | 0 (0.0%) | 0 (0.0%) |
| Fuel Oil or Kerosene | 12 (100.0%) | 21 (100.0%) |
| Coal or Coke | 0 (0.0%) | 0 (0.0%) |
| All other Fuels | 0 (0.0%) | 0 (0.0%) |
| No Fuel Used | 0 (0.0%) | 0 (0.0%) |
| Total | 12 (100.0%) | 21 (100.0%) |
Household Vehicle Usage in False Pass
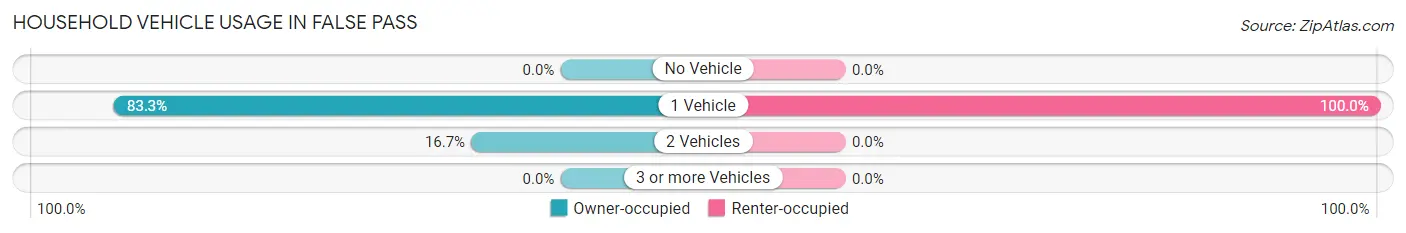
| Vehicles per Household | Owner-occupied | Renter-occupied |
| No Vehicle | 0 (0.0%) | 0 (0.0%) |
| 1 Vehicle | 10 (83.3%) | 21 (100.0%) |
| 2 Vehicles | 2 (16.7%) | 0 (0.0%) |
| 3 or more Vehicles | 0 (0.0%) | 0 (0.0%) |
| Total | 12 (100.0%) | 21 (100.0%) |
Real Estate & Mortgages in False Pass
Real Estate and Mortgage Overview in False Pass
| Characteristic | Without Mortgage | With Mortgage |
| Housing Units | 12 | 0 |
| Median Property Value | $158,300 | $0 |
| Median Household Income | $123,750 | $0 |
| Monthly Housing Costs | $567 | $0 |
| Real Estate Taxes | - | - |
Property Value by Mortgage Status in False Pass
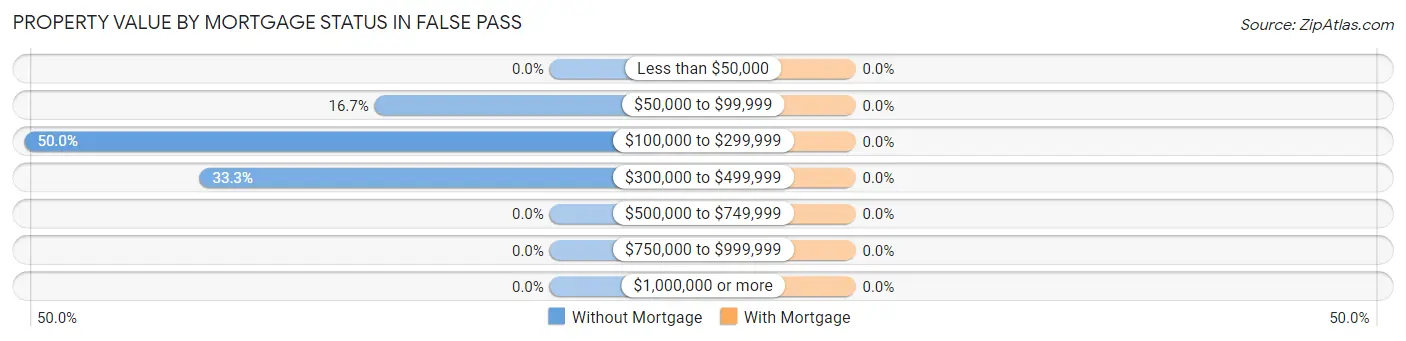
| Property Value | Without Mortgage | With Mortgage |
| Less than $50,000 | 0 (0.0%) | 0 (0.0%) |
| $50,000 to $99,999 | 2 (16.7%) | 0 (0.0%) |
| $100,000 to $299,999 | 6 (50.0%) | 0 (0.0%) |
| $300,000 to $499,999 | 4 (33.3%) | 0 (0.0%) |
| $500,000 to $749,999 | 0 (0.0%) | 0 (0.0%) |
| $750,000 to $999,999 | 0 (0.0%) | 0 (0.0%) |
| $1,000,000 or more | 0 (0.0%) | 0 (0.0%) |
| Total | 12 (100.0%) | 0 (0.0%) |
Household Income by Mortgage Status in False Pass
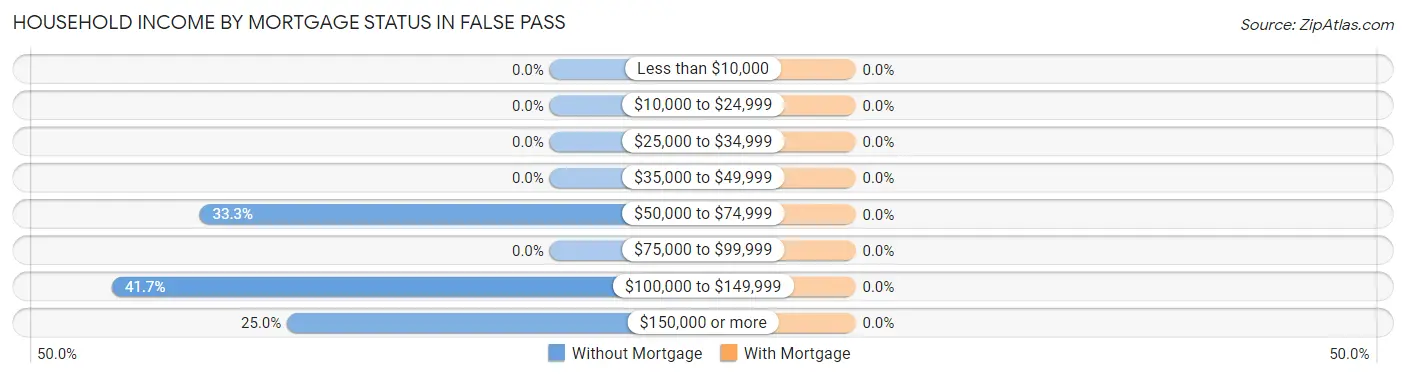
| Household Income | Without Mortgage | With Mortgage |
| Less than $10,000 | 0 (0.0%) | 0 (0.0%) |
| $10,000 to $24,999 | 0 (0.0%) | 0 (0.0%) |
| $25,000 to $34,999 | 0 (0.0%) | 0 (0.0%) |
| $35,000 to $49,999 | 0 (0.0%) | 0 (0.0%) |
| $50,000 to $74,999 | 4 (33.3%) | 0 (0.0%) |
| $75,000 to $99,999 | 0 (0.0%) | 0 (0.0%) |
| $100,000 to $149,999 | 5 (41.7%) | 0 (0.0%) |
| $150,000 or more | 3 (25.0%) | 0 (0.0%) |
| Total | 12 (100.0%) | 0 (0.0%) |
Property Value to Household Income Ratio in False Pass
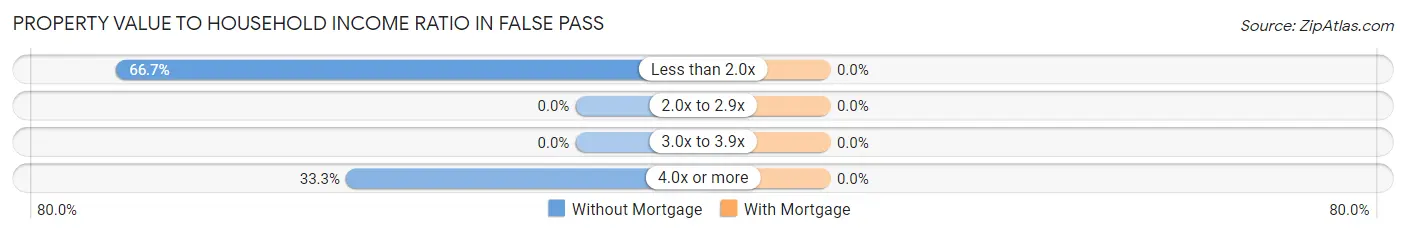
| Value-to-Income Ratio | Without Mortgage | With Mortgage |
| Less than 2.0x | 8 (66.7%) | 0 (0.0%) |
| 2.0x to 2.9x | 0 (0.0%) | 0 (0.0%) |
| 3.0x to 3.9x | 0 (0.0%) | 0 (0.0%) |
| 4.0x or more | 4 (33.3%) | 0 (0.0%) |
| Total | 12 (100.0%) | 0 (0.0%) |
Real Estate Taxes by Mortgage Status in False Pass
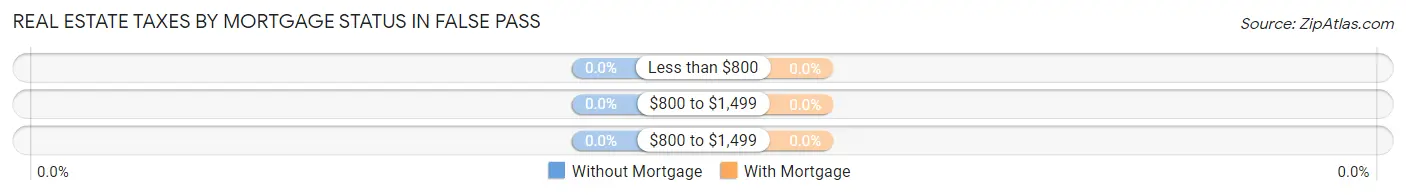
| Property Taxes | Without Mortgage | With Mortgage |
| Less than $800 | 0 (0.0%) | 0 (0.0%) |
| $800 to $1,499 | 0 (0.0%) | 0 (0.0%) |
| $800 to $1,499 | 0 (0.0%) | 0 (0.0%) |
| Total | 12 (100.0%) | 0 (0.0%) |
Health & Disability in False Pass
Health Insurance Coverage by Age in False Pass
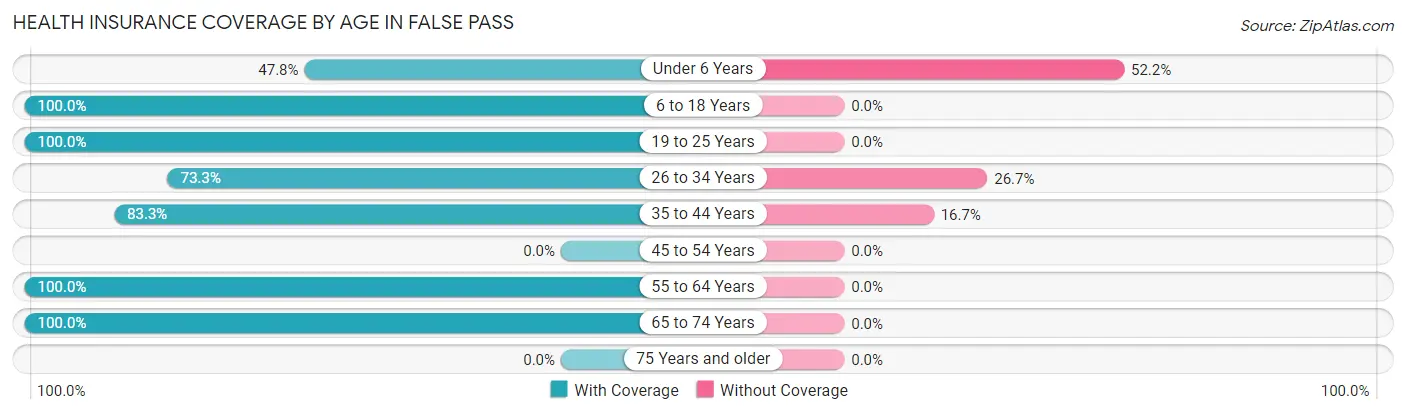
| Age Bracket | With Coverage | Without Coverage |
| Under 6 Years | 11 (47.8%) | 12 (52.2%) |
| 6 to 18 Years | 17 (100.0%) | 0 (0.0%) |
| 19 to 25 Years | 11 (100.0%) | 0 (0.0%) |
| 26 to 34 Years | 11 (73.3%) | 4 (26.7%) |
| 35 to 44 Years | 15 (83.3%) | 3 (16.7%) |
| 45 to 54 Years | 0 (0.0%) | 0 (0.0%) |
| 55 to 64 Years | 13 (100.0%) | 0 (0.0%) |
| 65 to 74 Years | 6 (100.0%) | 0 (0.0%) |
| 75 Years and older | 0 (0.0%) | 0 (0.0%) |
| Total | 84 (81.6%) | 19 (18.4%) |
Health Insurance Coverage by Citizenship Status in False Pass
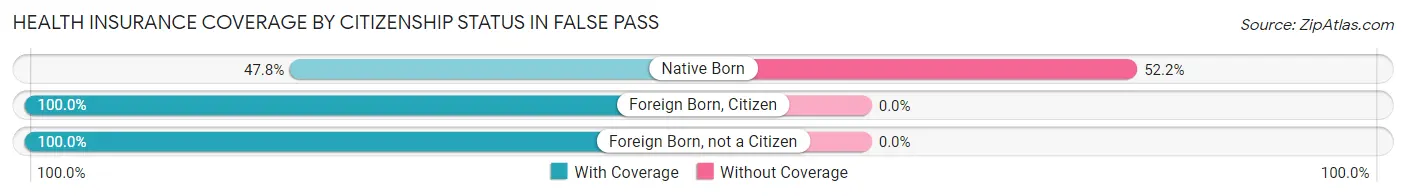
| Citizenship Status | With Coverage | Without Coverage |
| Native Born | 11 (47.8%) | 12 (52.2%) |
| Foreign Born, Citizen | 17 (100.0%) | 0 (0.0%) |
| Foreign Born, not a Citizen | 11 (100.0%) | 0 (0.0%) |
Health Insurance Coverage by Household Income in False Pass
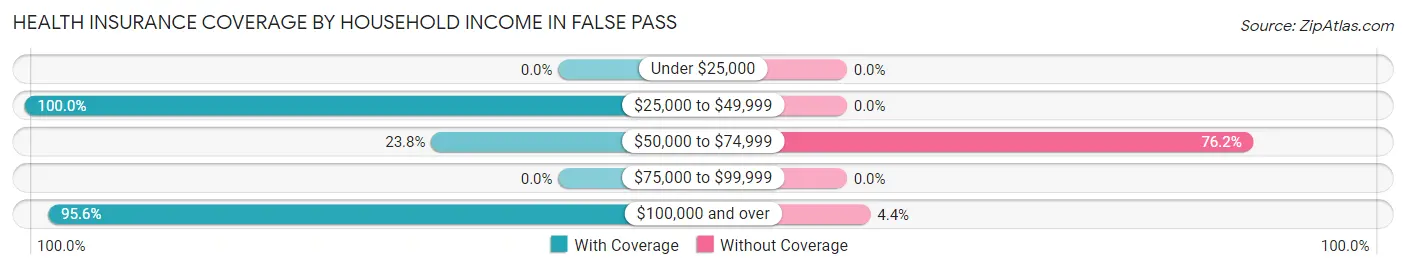
| Household Income | With Coverage | Without Coverage |
| Under $25,000 | 0 (0.0%) | 0 (0.0%) |
| $25,000 to $49,999 | 14 (100.0%) | 0 (0.0%) |
| $50,000 to $74,999 | 5 (23.8%) | 16 (76.2%) |
| $75,000 to $99,999 | 0 (0.0%) | 0 (0.0%) |
| $100,000 and over | 65 (95.6%) | 3 (4.4%) |
Public vs Private Health Insurance Coverage by Age in False Pass
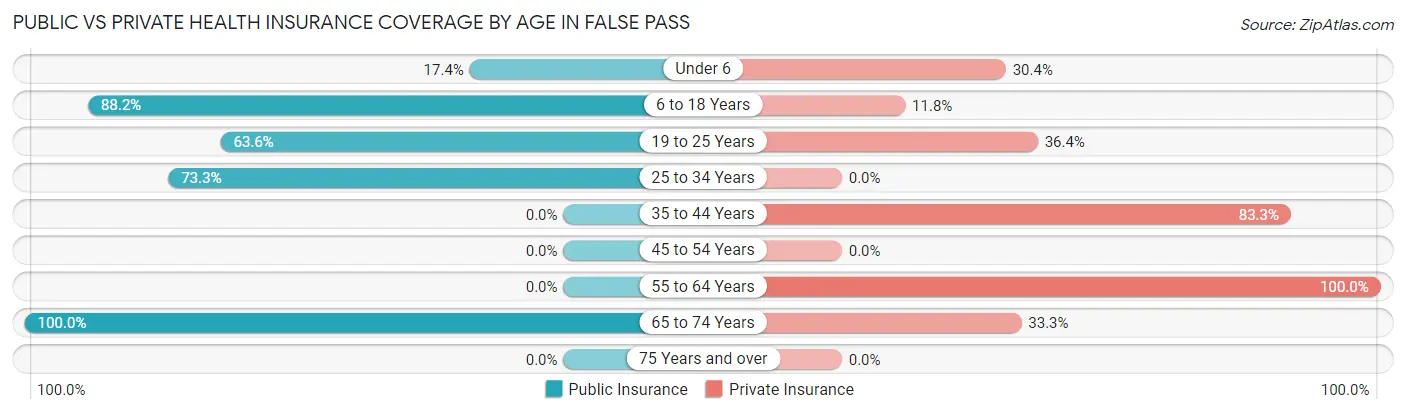
| Age Bracket | Public Insurance | Private Insurance |
| Under 6 | 4 (17.4%) | 7 (30.4%) |
| 6 to 18 Years | 15 (88.2%) | 2 (11.8%) |
| 19 to 25 Years | 7 (63.6%) | 4 (36.4%) |
| 25 to 34 Years | 11 (73.3%) | 0 (0.0%) |
| 35 to 44 Years | 0 (0.0%) | 15 (83.3%) |
| 45 to 54 Years | 0 (0.0%) | 0 (0.0%) |
| 55 to 64 Years | 0 (0.0%) | 13 (100.0%) |
| 65 to 74 Years | 6 (100.0%) | 2 (33.3%) |
| 75 Years and over | 0 (0.0%) | 0 (0.0%) |
| Total | 43 (41.7%) | 43 (41.7%) |
Disability Status by Sex by Age in False Pass
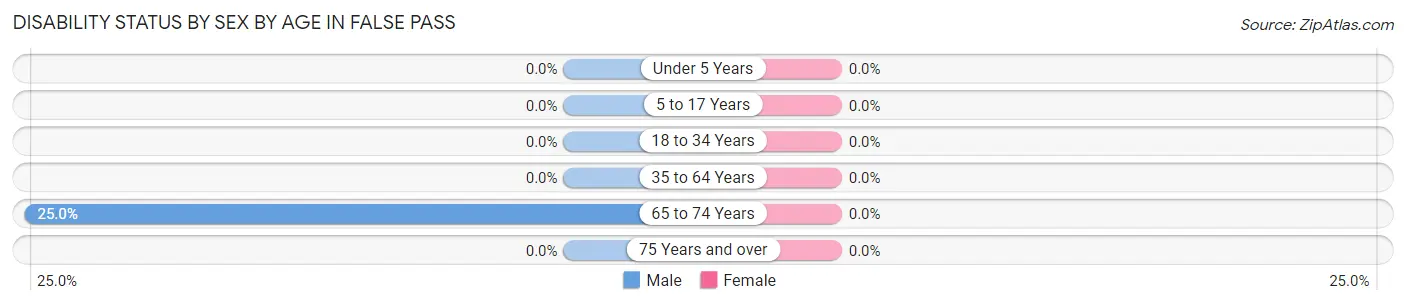
| Age Bracket | Male | Female |
| Under 5 Years | 0 (0.0%) | 0 (0.0%) |
| 5 to 17 Years | 0 (0.0%) | 0 (0.0%) |
| 18 to 34 Years | 0 (0.0%) | 0 (0.0%) |
| 35 to 64 Years | 0 (0.0%) | 0 (0.0%) |
| 65 to 74 Years | 1 (25.0%) | 0 (0.0%) |
| 75 Years and over | 0 (0.0%) | 0 (0.0%) |
Disability Class by Sex by Age in False Pass
Disability Class: Hearing Difficulty
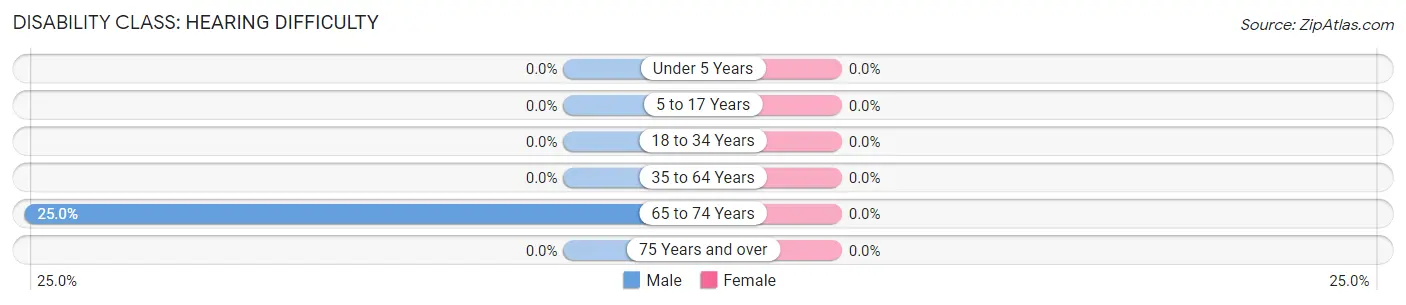
| Age Bracket | Male | Female |
| Under 5 Years | 0 (0.0%) | 0 (0.0%) |
| 5 to 17 Years | 0 (0.0%) | 0 (0.0%) |
| 18 to 34 Years | 0 (0.0%) | 0 (0.0%) |
| 35 to 64 Years | 0 (0.0%) | 0 (0.0%) |
| 65 to 74 Years | 1 (25.0%) | 0 (0.0%) |
| 75 Years and over | 0 (0.0%) | 0 (0.0%) |
Disability Class: Vision Difficulty
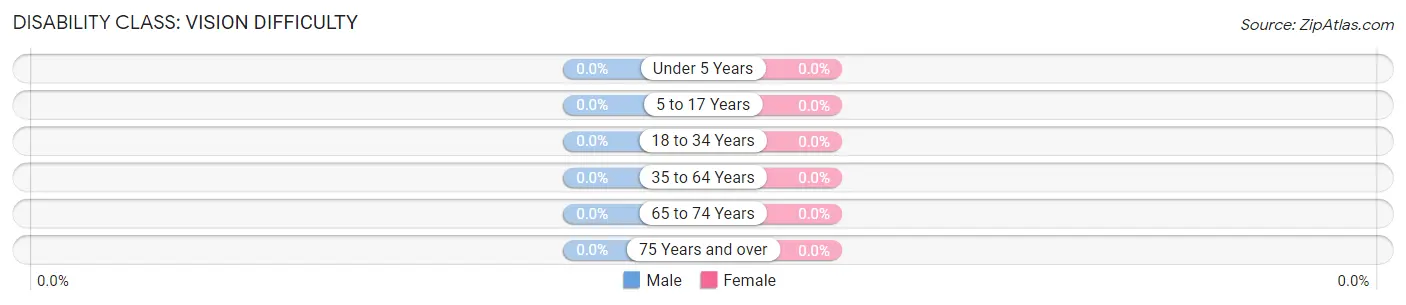
| Age Bracket | Male | Female |
| Under 5 Years | 0 (0.0%) | 0 (0.0%) |
| 5 to 17 Years | 0 (0.0%) | 0 (0.0%) |
| 18 to 34 Years | 0 (0.0%) | 0 (0.0%) |
| 35 to 64 Years | 0 (0.0%) | 0 (0.0%) |
| 65 to 74 Years | 0 (0.0%) | 0 (0.0%) |
| 75 Years and over | 0 (0.0%) | 0 (0.0%) |
Disability Class: Cognitive Difficulty
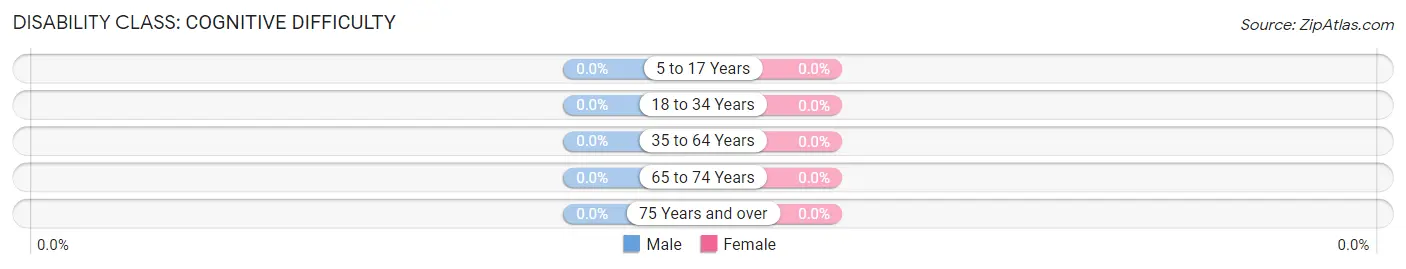
| Age Bracket | Male | Female |
| 5 to 17 Years | 0 (0.0%) | 0 (0.0%) |
| 18 to 34 Years | 0 (0.0%) | 0 (0.0%) |
| 35 to 64 Years | 0 (0.0%) | 0 (0.0%) |
| 65 to 74 Years | 0 (0.0%) | 0 (0.0%) |
| 75 Years and over | 0 (0.0%) | 0 (0.0%) |
Disability Class: Ambulatory Difficulty
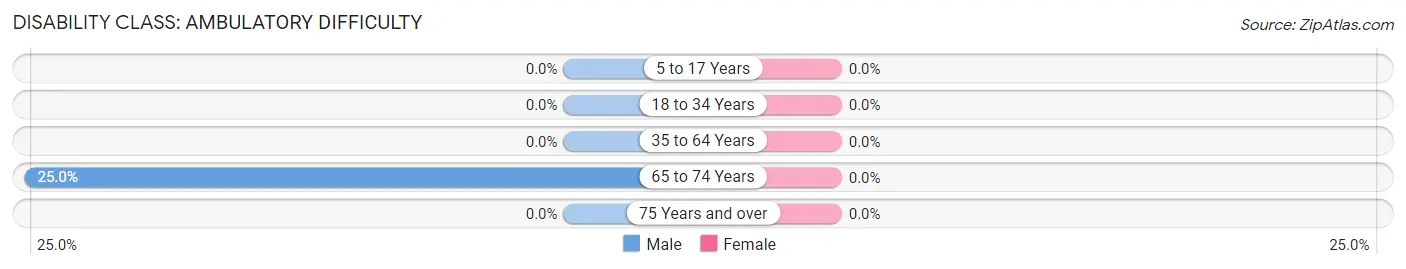
| Age Bracket | Male | Female |
| 5 to 17 Years | 0 (0.0%) | 0 (0.0%) |
| 18 to 34 Years | 0 (0.0%) | 0 (0.0%) |
| 35 to 64 Years | 0 (0.0%) | 0 (0.0%) |
| 65 to 74 Years | 1 (25.0%) | 0 (0.0%) |
| 75 Years and over | 0 (0.0%) | 0 (0.0%) |
Disability Class: Self-Care Difficulty
| Age Bracket | Male | Female |
| 5 to 17 Years | 0 (0.0%) | 0 (0.0%) |
| 18 to 34 Years | 0 (0.0%) | 0 (0.0%) |
| 35 to 64 Years | 0 (0.0%) | 0 (0.0%) |
| 65 to 74 Years | 0 (0.0%) | 0 (0.0%) |
| 75 Years and over | 0 (0.0%) | 0 (0.0%) |
Technology Access in False Pass
Computing Device Access in False Pass
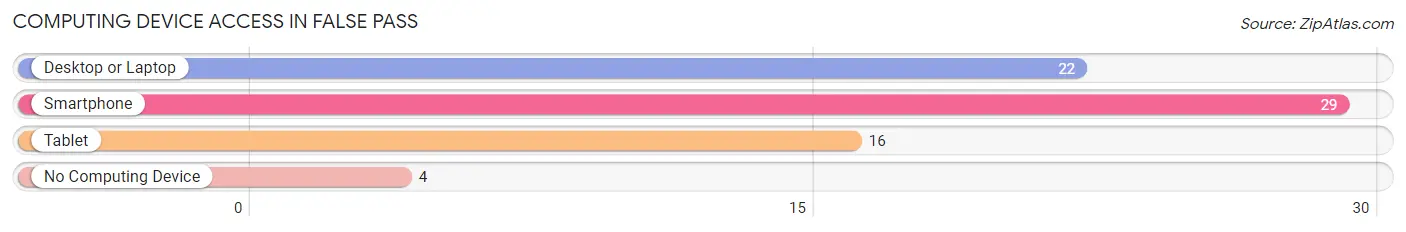
| Device Type | # Households | % Households |
| Desktop or Laptop | 22 | 66.7% |
| Smartphone | 29 | 87.9% |
| Tablet | 16 | 48.5% |
| No Computing Device | 4 | 12.1% |
| Total | 33 | 100.0% |
Internet Access in False Pass
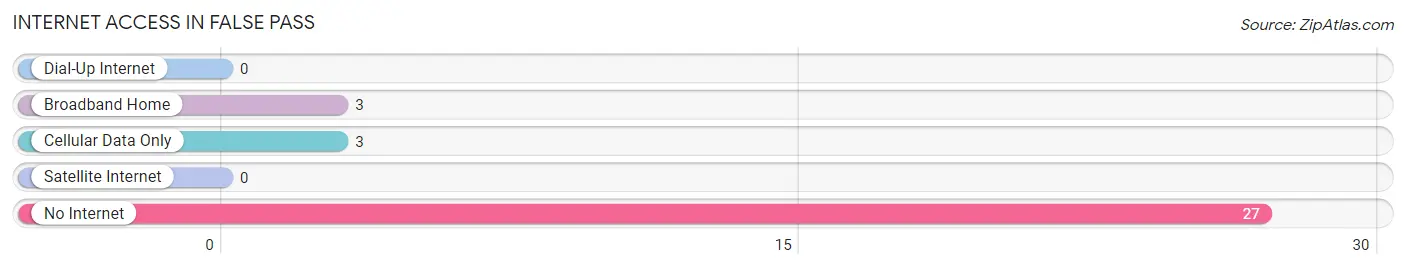
| Internet Type | # Households | % Households |
| Dial-Up Internet | 0 | 0.0% |
| Broadband Home | 3 | 9.1% |
| Cellular Data Only | 3 | 9.1% |
| Satellite Internet | 0 | 0.0% |
| No Internet | 27 | 81.8% |
| Total | 33 | 100.0% |
False Pass Summary
Pass, Alaska is a small unincorporated community located in the Aleutians East Borough of Alaska. It is located on the eastern side of Unimak Island, the largest island in the Aleutian chain. Pass is situated on the north shore of Unimak Pass, a narrow strait that separates Unimak Island from the mainland of Alaska. The community is accessible only by boat or plane.
History
The area around Pass has been inhabited by the Unangan people for thousands of years. The Unangan people were the first to settle in the Aleutian Islands and were known for their skill in hunting and fishing. The first recorded European contact with the Unangan people was in 1741 when the Russian explorer Vitus Bering sailed through the area.
In the late 1800s, the area around Pass was settled by Russian fur traders and fishermen. The settlement was known as False Pass, named after the nearby strait. The settlement was a hub for the fur trade and fishing industry in the area.
In the early 1900s, the United States purchased Alaska from Russia and the area around False Pass became part of the newly formed Alaska Territory. In the 1920s, the Alaska Territorial Government established a post office in False Pass and the settlement was officially incorporated as a village in 1929.
Geography
Pass is located on the eastern side of Unimak Island, the largest island in the Aleutian chain. The community is situated on the north shore of Unimak Pass, a narrow strait that separates Unimak Island from the mainland of Alaska. The area around Pass is mountainous and heavily forested. The climate is cold and wet, with temperatures rarely rising above freezing in the winter months.
Economy
The economy of Pass is largely based on fishing and tourism. The area is known for its abundant salmon and halibut fisheries, and the local economy is heavily reliant on the fishing industry. The community also has a small tourism industry, with visitors coming to the area to experience the unique wildlife and scenery.
Demographics
As of the 2010 census, the population of Pass was 391. The racial makeup of the community was 95.2% White, 0.3% Native American, 0.3% Asian, 0.3% Pacific Islander, and 3.9% from two or more races. The median household income was $45,000 and the median family income was $50,000. The per capita income was $20,000. The unemployment rate was 8.3%.
Common Questions
What is Per Capita Income in False Pass?
Per Capita income in False Pass is $34,500.
What is the Median Family Income in False Pass?
Median Family Income in False Pass is $98,333.
What is the Median Household income in False Pass?
Median Household Income in False Pass is $62,083.
What is Income or Wage Gap in False Pass?
Income or Wage Gap in False Pass is 11.4%.
Women in False Pass earn 88.6 cents for every dollar earned by a man.
What is Inequality or Gini Index in False Pass?
Inequality or Gini Index in False Pass is 0.37.
What is the Total Population of False Pass?
Total Population of False Pass is 103.
What is the Total Male Population of False Pass?
Total Male Population of False Pass is 62.
What is the Total Female Population of False Pass?
Total Female Population of False Pass is 41.
What is the Ratio of Males per 100 Females in False Pass?
There are 151.22 Males per 100 Females in False Pass.
What is the Ratio of Females per 100 Males in False Pass?
There are 66.13 Females per 100 Males in False Pass.
What is the Median Population Age in False Pass?
Median Population Age in False Pass is 32.1 Years.
What is the Average Family Size in False Pass
Average Family Size in False Pass is 4.7 People.
What is the Average Household Size in False Pass
Average Household Size in False Pass is 3.1 People.
How Large is the Labor Force in False Pass?
There are 53 People in the Labor Forcein in False Pass.
What is the Percentage of People in the Labor Force in False Pass?
71.6% of People are in the Labor Force in False Pass.