Pilot Point, AK Map & Demographics
Pilot Point Map
Pilot Point Overview
$29,958
PER CAPITA INCOME
$104,375
AVG FAMILY INCOME
$59,375
AVG HOUSEHOLD INCOME
45.8%
WAGE / INCOME GAP [ % ]
54.2¢/ $1
WAGE / INCOME GAP [ $ ]
0.40
INEQUALITY / GINI INDEX
72
TOTAL POPULATION
44
MALE POPULATION
28
FEMALE POPULATION
157.14
MALES / 100 FEMALES
63.64
FEMALES / 100 MALES
35.0
MEDIAN AGE
3.1
AVG FAMILY SIZE
2.7
AVG HOUSEHOLD SIZE
35
LABOR FORCE [ PEOPLE ]
67.3%
PERCENT IN LABOR FORCE
Pilot Point Zip Codes
Pilot Point Area Codes
Income in Pilot Point
Income Overview in Pilot Point
Per Capita Income in Pilot Point is $29,958, while median incomes of families and households are $104,375 and $59,375 respectively.
| Characteristic | Number | Measure |
| Per Capita Income | 72 | $29,958 |
| Median Family Income | 19 | $104,375 |
| Mean Family Income | 19 | $102,479 |
| Median Household Income | 27 | $59,375 |
| Mean Household Income | 27 | $87,307 |
| Income Deficit | 19 | $0 |
| Wage / Income Gap (%) | 72 | 45.83% |
| Wage / Income Gap ($) | 72 | 54.17¢ per $1 |
| Gini / Inequality Index | 72 | 0.40 |
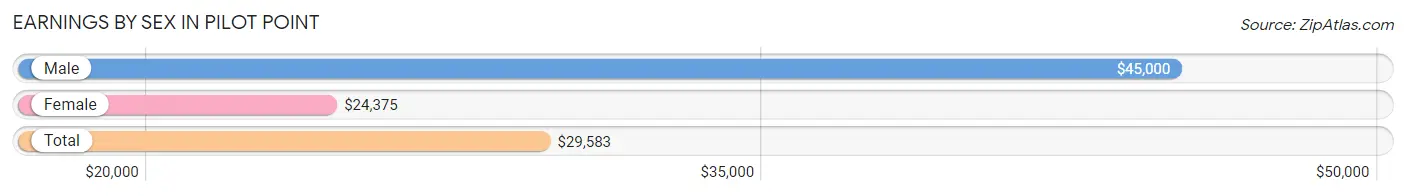
Earnings by Sex in Pilot Point
Average Earnings in Pilot Point are $29,583, $45,000 for men and $24,375 for women, a difference of 45.8%.
| Sex | Number | Average Earnings |
| Male | 20 (51.3%) | $45,000 |
| Female | 19 (48.7%) | $24,375 |
| Total | 39 (100.0%) | $29,583 |
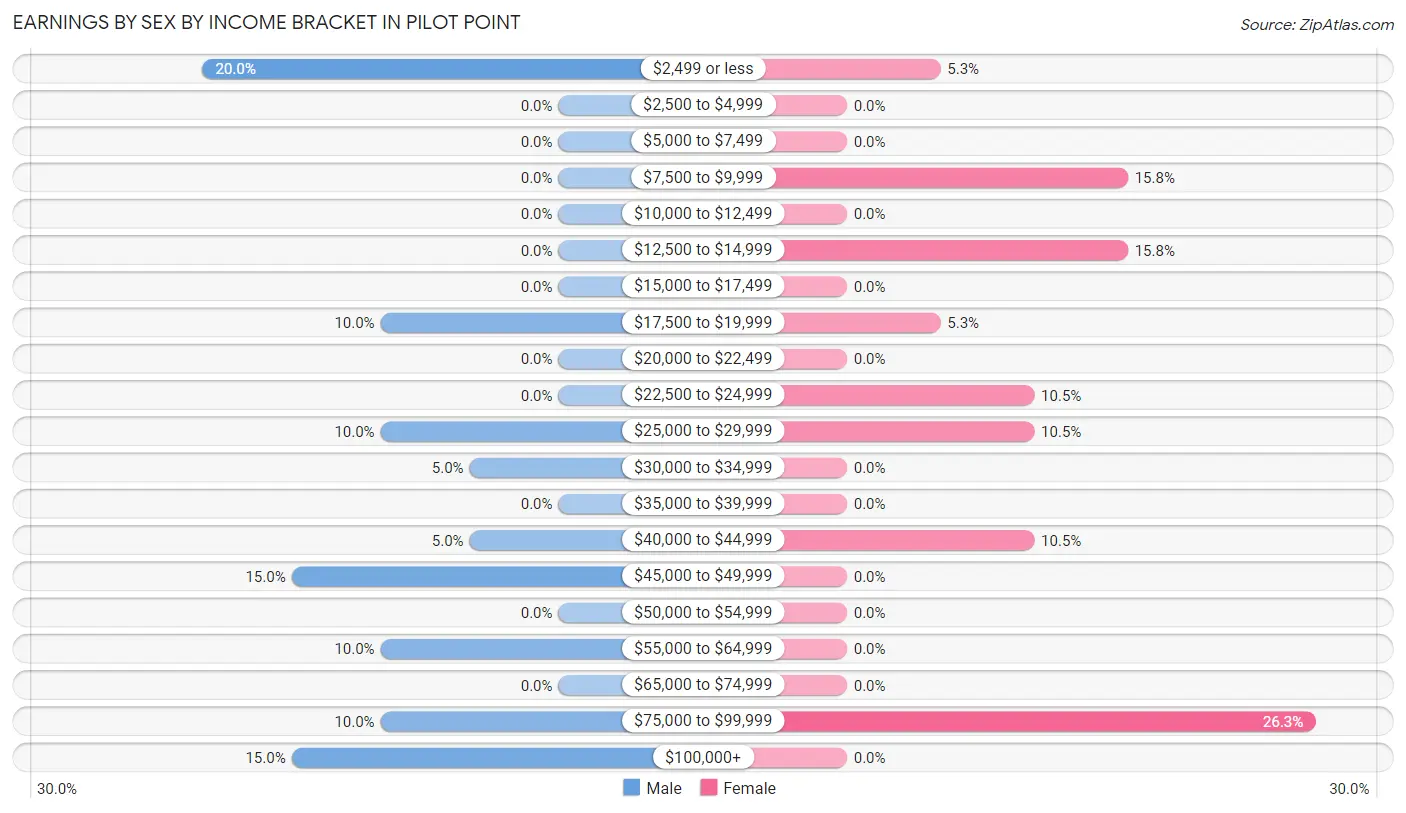
Earnings by Sex by Income Bracket in Pilot Point
The most common earnings brackets in Pilot Point are $2,499 or less for men (4 | 20.0%) and $75,000 to $99,999 for women (5 | 26.3%).
| Income | Male | Female |
| $2,499 or less | 4 (20.0%) | 1 (5.3%) |
| $2,500 to $4,999 | 0 (0.0%) | 0 (0.0%) |
| $5,000 to $7,499 | 0 (0.0%) | 0 (0.0%) |
| $7,500 to $9,999 | 0 (0.0%) | 3 (15.8%) |
| $10,000 to $12,499 | 0 (0.0%) | 0 (0.0%) |
| $12,500 to $14,999 | 0 (0.0%) | 3 (15.8%) |
| $15,000 to $17,499 | 0 (0.0%) | 0 (0.0%) |
| $17,500 to $19,999 | 2 (10.0%) | 1 (5.3%) |
| $20,000 to $22,499 | 0 (0.0%) | 0 (0.0%) |
| $22,500 to $24,999 | 0 (0.0%) | 2 (10.5%) |
| $25,000 to $29,999 | 2 (10.0%) | 2 (10.5%) |
| $30,000 to $34,999 | 1 (5.0%) | 0 (0.0%) |
| $35,000 to $39,999 | 0 (0.0%) | 0 (0.0%) |
| $40,000 to $44,999 | 1 (5.0%) | 2 (10.5%) |
| $45,000 to $49,999 | 3 (15.0%) | 0 (0.0%) |
| $50,000 to $54,999 | 0 (0.0%) | 0 (0.0%) |
| $55,000 to $64,999 | 2 (10.0%) | 0 (0.0%) |
| $65,000 to $74,999 | 0 (0.0%) | 0 (0.0%) |
| $75,000 to $99,999 | 2 (10.0%) | 5 (26.3%) |
| $100,000+ | 3 (15.0%) | 0 (0.0%) |
| Total | 20 (100.0%) | 19 (100.0%) |
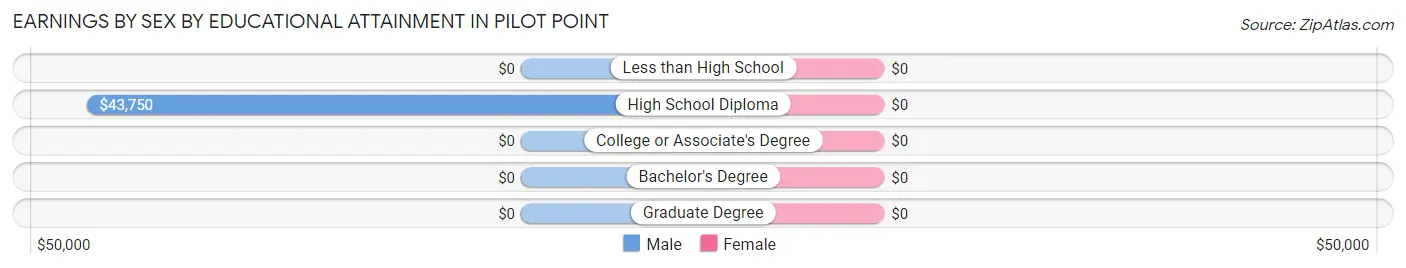
Earnings by Sex by Educational Attainment in Pilot Point
| Educational Attainment | Male Income | Female Income |
| Less than High School | - | - |
| High School Diploma | $43,750 | $0 |
| College or Associate's Degree | - | - |
| Bachelor's Degree | - | - |
| Graduate Degree | - | - |
| Total | $46,667 | $24,375 |
Family Income in Pilot Point
Family Income Brackets in Pilot Point
According to the Pilot Point family income data, there are 6 families falling into the $150,000 to $199,999 income range, which is the most common income bracket and makes up 31.6% of all families.
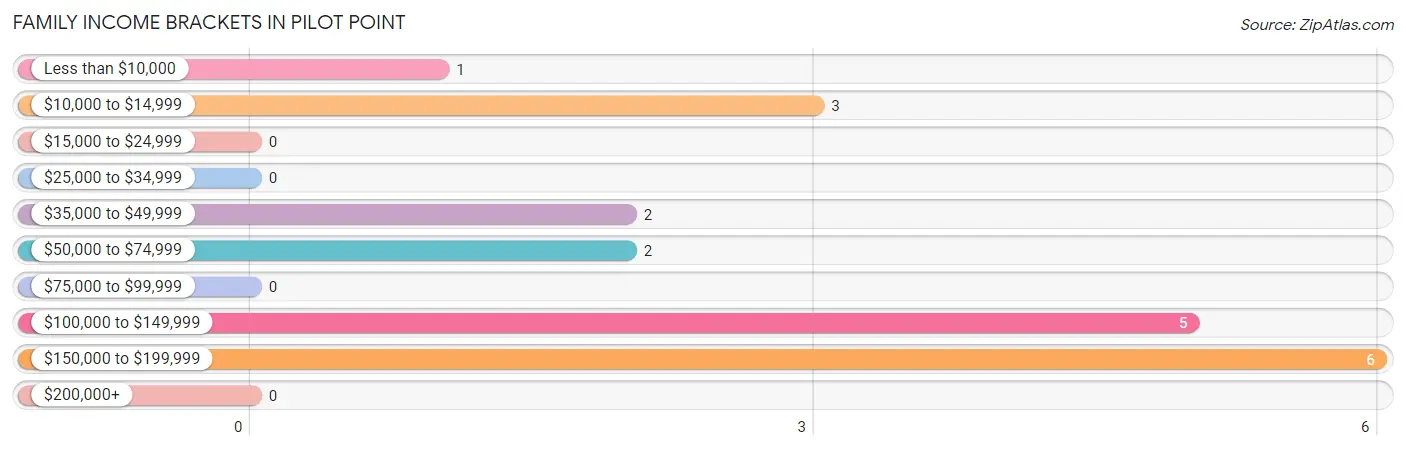
| Income Bracket | # Families | % Families |
| Less than $10,000 | 1 | 5.3% |
| $10,000 to $14,999 | 3 | 15.8% |
| $15,000 to $24,999 | 0 | 0.0% |
| $25,000 to $34,999 | 0 | 0.0% |
| $35,000 to $49,999 | 2 | 10.5% |
| $50,000 to $74,999 | 2 | 10.5% |
| $75,000 to $99,999 | 0 | 0.0% |
| $100,000 to $149,999 | 5 | 26.3% |
| $150,000 to $199,999 | 6 | 31.6% |
| $200,000+ | 0 | 0.0% |
Family Income by Famaliy Size in Pilot Point
2-person families (9 | 47.4%) account for the highest median family income in Pilot Point with $135,625 per family, while 2-person families (9 | 47.4%) have the highest median income of $67,812 per family member.
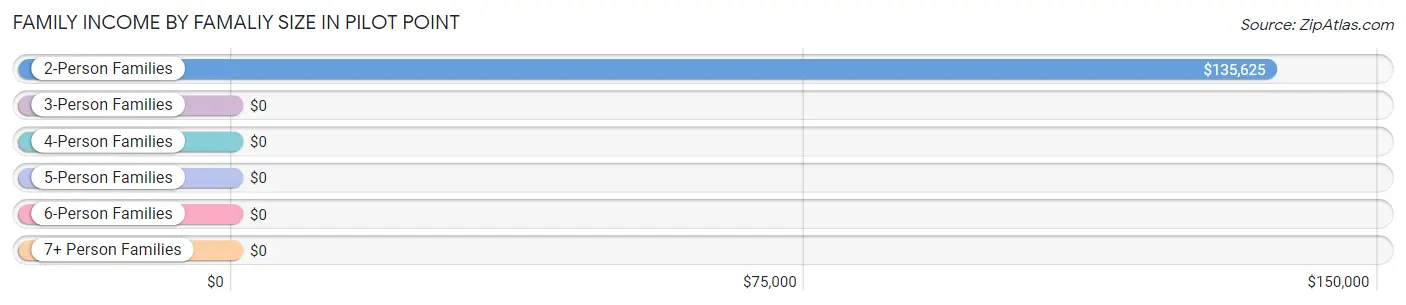
| Income Bracket | # Families | Median Income |
| 2-Person Families | 9 (47.4%) | $135,625 |
| 3-Person Families | 0 (0.0%) | $0 |
| 4-Person Families | 8 (42.1%) | $0 |
| 5-Person Families | 0 (0.0%) | $0 |
| 6-Person Families | 1 (5.3%) | $0 |
| 7+ Person Families | 1 (5.3%) | $0 |
| Total | 19 (100.0%) | $104,375 |
Family Income by Number of Earners in Pilot Point
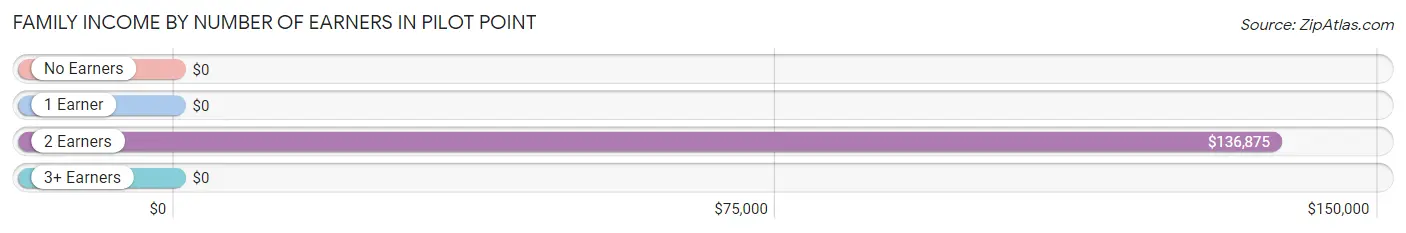
| Number of Earners | # Families | Median Income |
| No Earners | 2 (10.5%) | $0 |
| 1 Earner | 3 (15.8%) | $0 |
| 2 Earners | 13 (68.4%) | $136,875 |
| 3+ Earners | 1 (5.3%) | $0 |
| Total | 19 (100.0%) | $104,375 |
Household Income in Pilot Point
Household Income Brackets in Pilot Point
With 6 households falling in the category, the $150,000 to $199,999 income range is the most frequent in Pilot Point, accounting for 22.2% of all households.
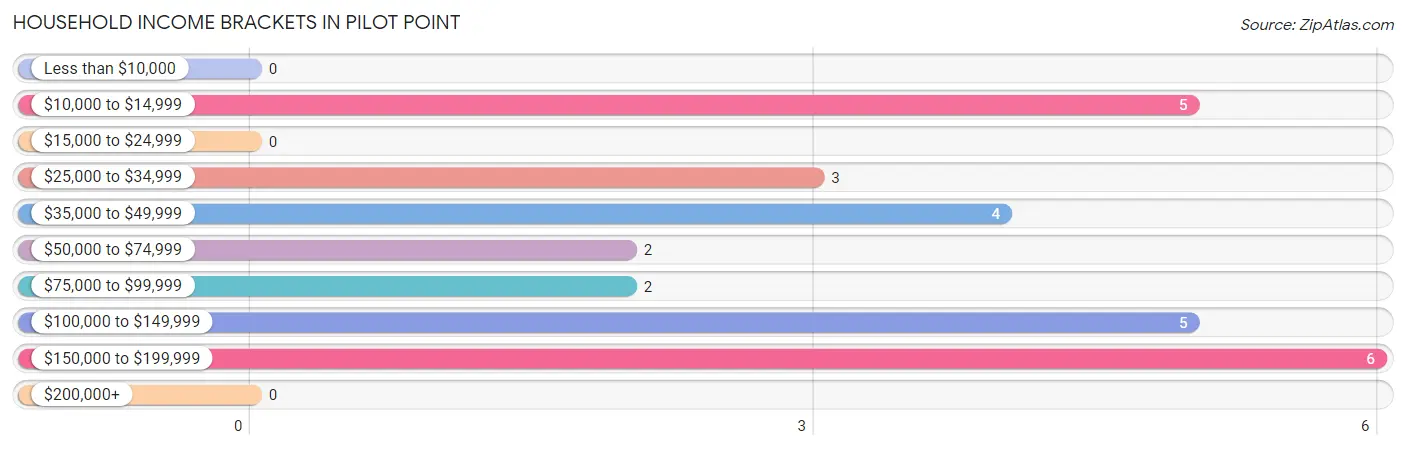
| Income Bracket | # Households | % Households |
| Less than $10,000 | 0 | 0.0% |
| $10,000 to $14,999 | 5 | 18.5% |
| $15,000 to $24,999 | 0 | 0.0% |
| $25,000 to $34,999 | 3 | 11.1% |
| $35,000 to $49,999 | 4 | 14.8% |
| $50,000 to $74,999 | 2 | 7.4% |
| $75,000 to $99,999 | 2 | 7.4% |
| $100,000 to $149,999 | 5 | 18.5% |
| $150,000 to $199,999 | 6 | 22.2% |
| $200,000+ | 0 | 0.0% |
Household Income by Householder Age in Pilot Point
The median household income in Pilot Point is $59,375, with the highest median household income of $93,125 found in the 25 to 44 years age bracket for the primary householder. A total of 9 households (33.3%) fall into this category.
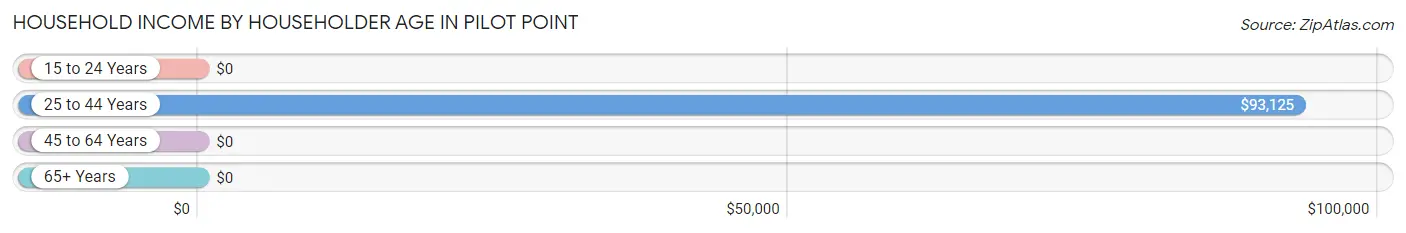
| Income Bracket | # Households | Median Income |
| 15 to 24 Years | 0 (0.0%) | $0 |
| 25 to 44 Years | 9 (33.3%) | $93,125 |
| 45 to 64 Years | 6 (22.2%) | $0 |
| 65+ Years | 12 (44.4%) | $0 |
| Total | 27 (100.0%) | $59,375 |
Poverty in Pilot Point
Income Below Poverty by Sex and Age in Pilot Point
With 27.3% poverty level for males and 35.7% for females among the residents of Pilot Point, 12 to 14 year old males and 6 to 11 year old females are the most vulnerable to poverty, with 4 males (100.0%) and 1 females (100.0%) in their respective age groups living below the poverty level.
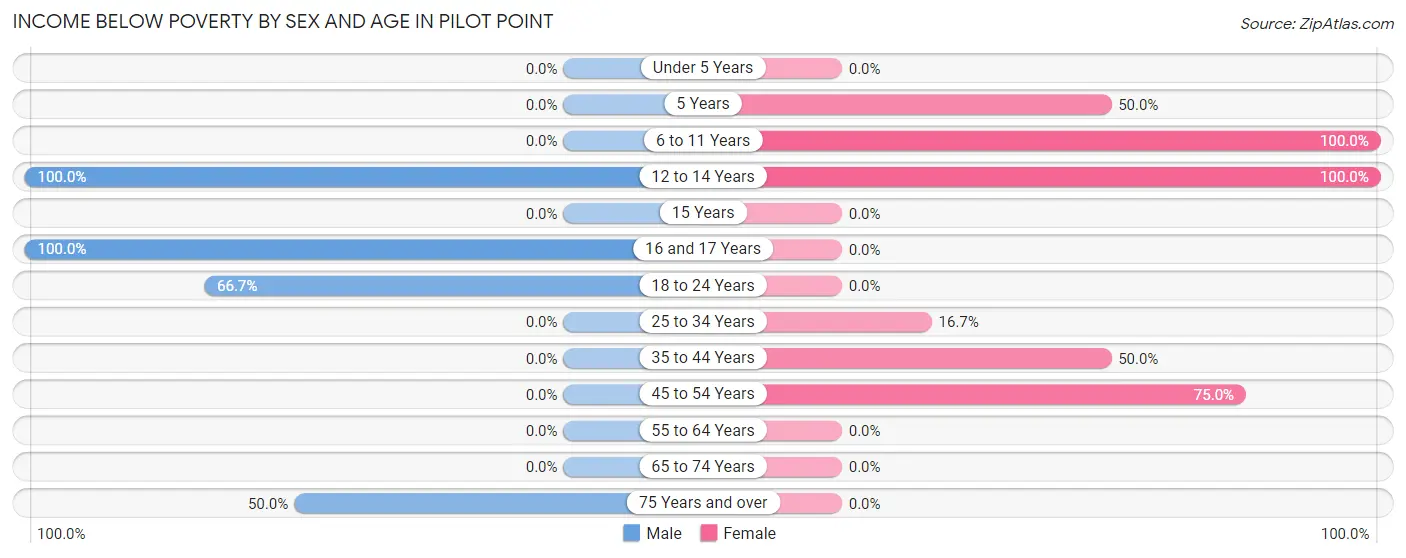
| Age Bracket | Male | Female |
| Under 5 Years | 0 (0.0%) | 0 (0.0%) |
| 5 Years | 0 (0.0%) | 1 (50.0%) |
| 6 to 11 Years | 0 (0.0%) | 1 (100.0%) |
| 12 to 14 Years | 4 (100.0%) | 1 (100.0%) |
| 15 Years | 0 (0.0%) | 0 (0.0%) |
| 16 and 17 Years | 2 (100.0%) | 0 (0.0%) |
| 18 to 24 Years | 4 (66.7%) | 0 (0.0%) |
| 25 to 34 Years | 0 (0.0%) | 1 (16.7%) |
| 35 to 44 Years | 0 (0.0%) | 3 (50.0%) |
| 45 to 54 Years | 0 (0.0%) | 3 (75.0%) |
| 55 to 64 Years | 0 (0.0%) | 0 (0.0%) |
| 65 to 74 Years | 0 (0.0%) | 0 (0.0%) |
| 75 Years and over | 2 (50.0%) | 0 (0.0%) |
| Total | 12 (27.3%) | 10 (35.7%) |
Income Above Poverty by Sex and Age in Pilot Point
According to the poverty statistics in Pilot Point, males aged under 5 years and females aged under 5 years are the age groups that are most secure financially, with 100.0% of males and 100.0% of females in these age groups living above the poverty line.
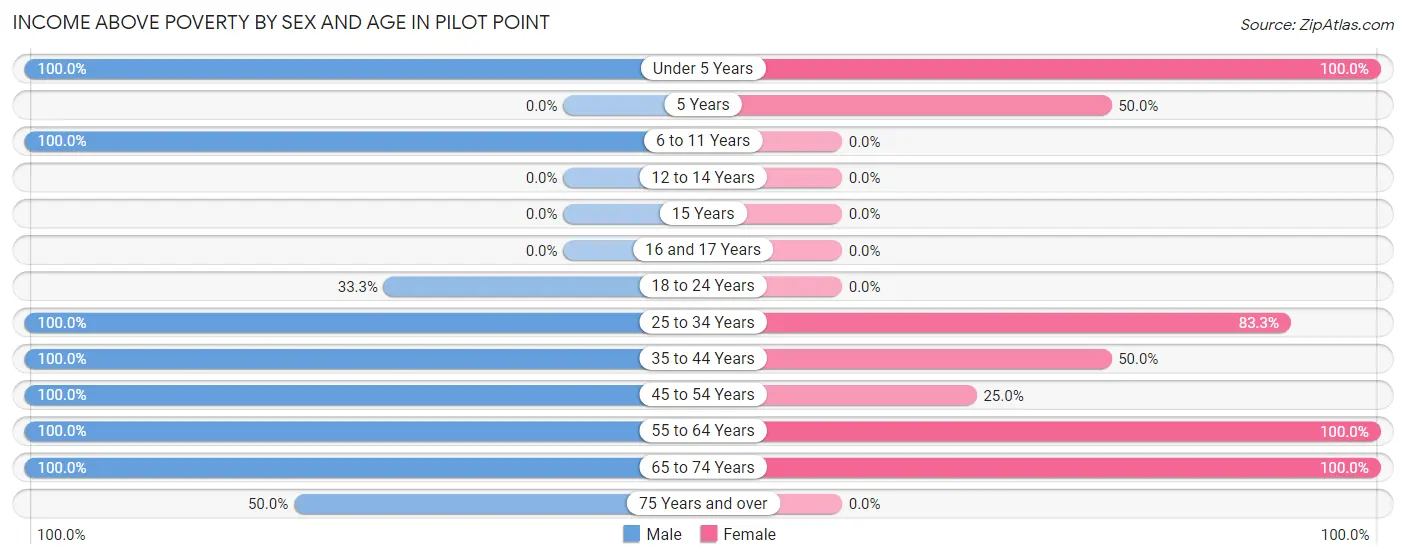
| Age Bracket | Male | Female |
| Under 5 Years | 7 (100.0%) | 2 (100.0%) |
| 5 Years | 0 (0.0%) | 1 (50.0%) |
| 6 to 11 Years | 3 (100.0%) | 0 (0.0%) |
| 12 to 14 Years | 0 (0.0%) | 0 (0.0%) |
| 15 Years | 0 (0.0%) | 0 (0.0%) |
| 16 and 17 Years | 0 (0.0%) | 0 (0.0%) |
| 18 to 24 Years | 2 (33.3%) | 0 (0.0%) |
| 25 to 34 Years | 2 (100.0%) | 5 (83.3%) |
| 35 to 44 Years | 2 (100.0%) | 3 (50.0%) |
| 45 to 54 Years | 4 (100.0%) | 1 (25.0%) |
| 55 to 64 Years | 3 (100.0%) | 3 (100.0%) |
| 65 to 74 Years | 7 (100.0%) | 3 (100.0%) |
| 75 Years and over | 2 (50.0%) | 0 (0.0%) |
| Total | 32 (72.7%) | 18 (64.3%) |
Income Below Poverty Among Married-Couple Families in Pilot Point
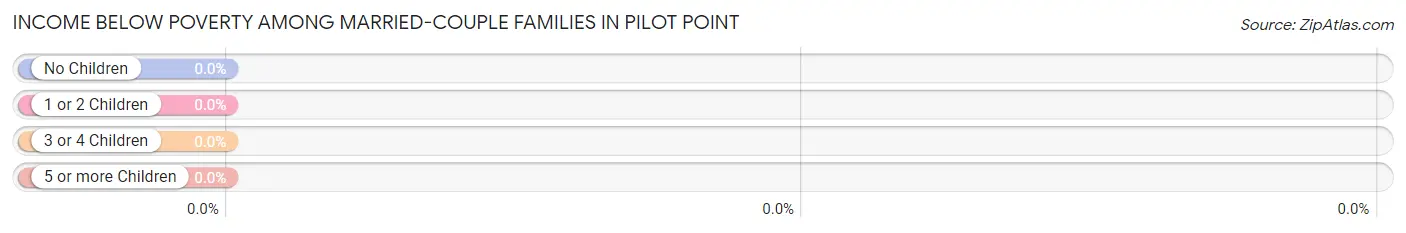
| Children | Above Poverty | Below Poverty |
| No Children | 6 (100.0%) | 0 (0.0%) |
| 1 or 2 Children | 4 (100.0%) | 0 (0.0%) |
| 3 or 4 Children | 0 (0.0%) | 0 (0.0%) |
| 5 or more Children | 0 (0.0%) | 0 (0.0%) |
| Total | 10 (100.0%) | 0 (0.0%) |
Income Below Poverty Among Single-Parent Households in Pilot Point
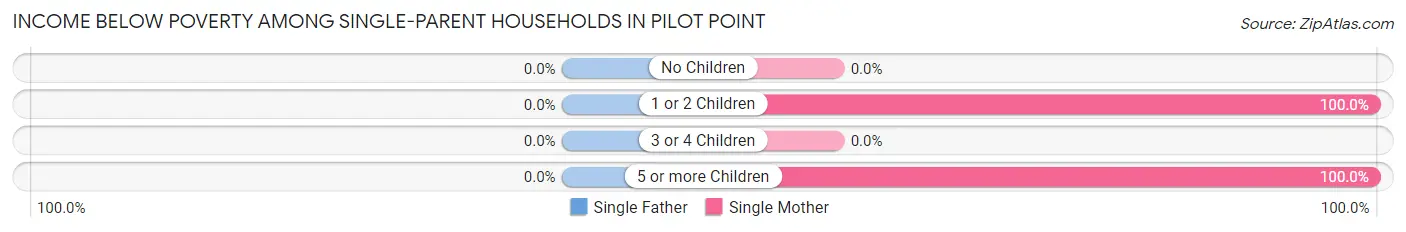
| Children | Single Father | Single Mother |
| No Children | 0 (0.0%) | 0 (0.0%) |
| 1 or 2 Children | 0 (0.0%) | 3 (100.0%) |
| 3 or 4 Children | 0 (0.0%) | 0 (0.0%) |
| 5 or more Children | 0 (0.0%) | 1 (100.0%) |
| Total | 0 (0.0%) | 4 (66.7%) |
Income Below Poverty Among Married-Couple vs Single-Parent Households in Pilot Point
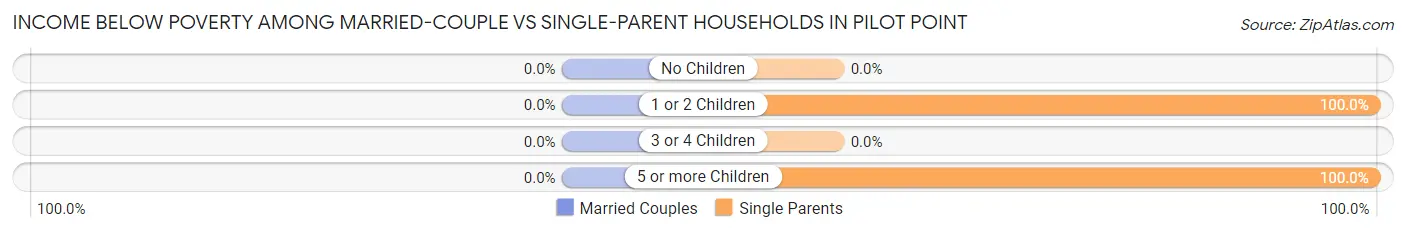
| Children | Married-Couple Families | Single-Parent Households |
| No Children | 0 (0.0%) | 0 (0.0%) |
| 1 or 2 Children | 0 (0.0%) | 3 (100.0%) |
| 3 or 4 Children | 0 (0.0%) | 0 (0.0%) |
| 5 or more Children | 0 (0.0%) | 1 (100.0%) |
| Total | 0 (0.0%) | 4 (44.4%) |
Race in Pilot Point
The most populous races in Pilot Point are Native / Alaskan (60 | 83.3%), Two or more Races (7 | 9.7%), and White / Caucasian (5 | 6.9%).
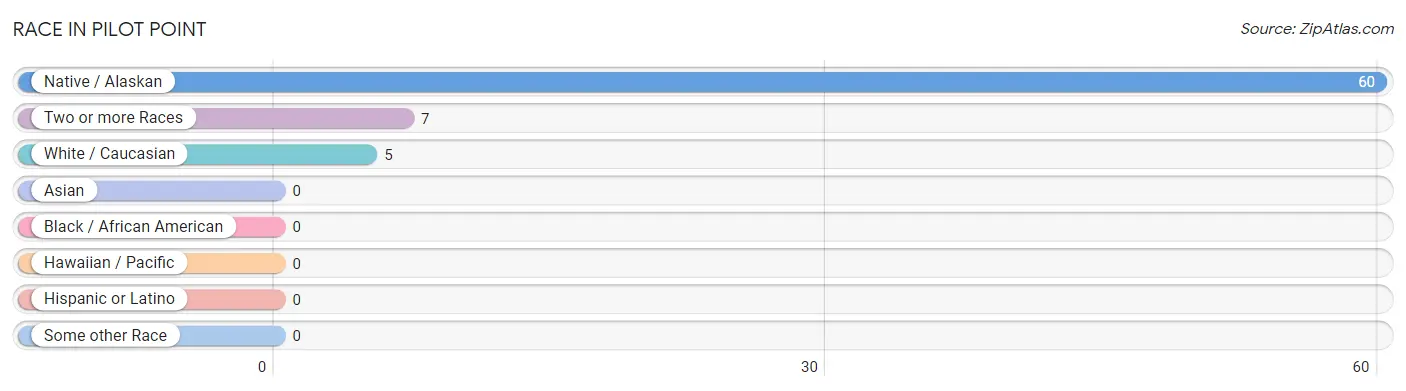
| Race | # Population | % Population |
| Asian | 0 | 0.0% |
| Black / African American | 0 | 0.0% |
| Hawaiian / Pacific | 0 | 0.0% |
| Hispanic or Latino | 0 | 0.0% |
| Native / Alaskan | 60 | 83.3% |
| White / Caucasian | 5 | 6.9% |
| Two or more Races | 7 | 9.7% |
| Some other Race | 0 | 0.0% |
| Total | 72 | 100.0% |
Ancestry in Pilot Point
The most populous ancestries reported in Pilot Point are Aleut (58 | 80.6%), Alaska Native (8 | 11.1%), Yup'ik (4 | 5.6%), Scottish (2 | 2.8%), and Norwegian (1 | 1.4%), together accounting for 101.4% of all Pilot Point residents.
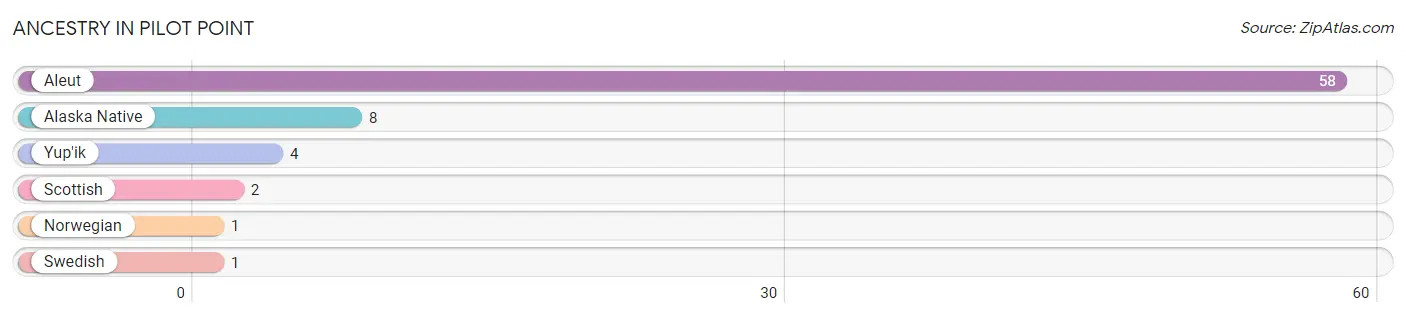
| Ancestry | # Population | % Population |
| Alaska Native | 8 | 11.1% |
| Aleut | 58 | 80.6% |
| Norwegian | 1 | 1.4% |
| Scottish | 2 | 2.8% |
| Swedish | 1 | 1.4% |
| Yup'ik | 4 | 5.6% | View All 6 Rows |
Immigrants in Pilot Point

| Immigration Origin | # Population | % Population | View All 0 Rows |
Sex and Age in Pilot Point
Sex and Age in Pilot Point
The most populous age groups in Pilot Point are 15 to 19 Years (8 | 18.2%) for men and 50 to 54 Years (4 | 14.3%) for women.
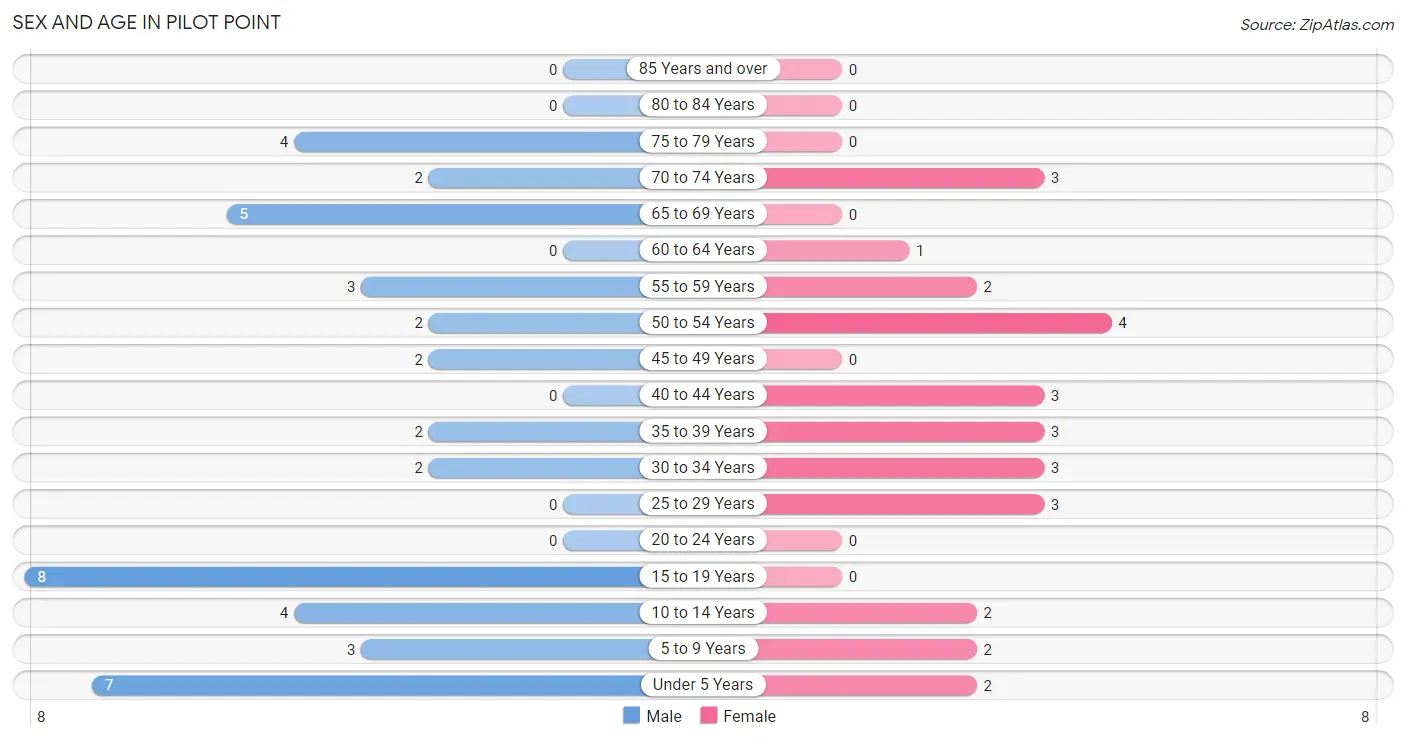
| Age Bracket | Male | Female |
| Under 5 Years | 7 (15.9%) | 2 (7.1%) |
| 5 to 9 Years | 3 (6.8%) | 2 (7.1%) |
| 10 to 14 Years | 4 (9.1%) | 2 (7.1%) |
| 15 to 19 Years | 8 (18.2%) | 0 (0.0%) |
| 20 to 24 Years | 0 (0.0%) | 0 (0.0%) |
| 25 to 29 Years | 0 (0.0%) | 3 (10.7%) |
| 30 to 34 Years | 2 (4.5%) | 3 (10.7%) |
| 35 to 39 Years | 2 (4.5%) | 3 (10.7%) |
| 40 to 44 Years | 0 (0.0%) | 3 (10.7%) |
| 45 to 49 Years | 2 (4.5%) | 0 (0.0%) |
| 50 to 54 Years | 2 (4.5%) | 4 (14.3%) |
| 55 to 59 Years | 3 (6.8%) | 2 (7.1%) |
| 60 to 64 Years | 0 (0.0%) | 1 (3.6%) |
| 65 to 69 Years | 5 (11.4%) | 0 (0.0%) |
| 70 to 74 Years | 2 (4.5%) | 3 (10.7%) |
| 75 to 79 Years | 4 (9.1%) | 0 (0.0%) |
| 80 to 84 Years | 0 (0.0%) | 0 (0.0%) |
| 85 Years and over | 0 (0.0%) | 0 (0.0%) |
| Total | 44 (100.0%) | 28 (100.0%) |
Families and Households in Pilot Point
Median Family Size in Pilot Point
The median family size in Pilot Point is 3.11 persons per family, with single female/mother families (6 | 31.6%) accounting for the largest median family size of 4.17 persons per family. On the other hand, single male/father families (3 | 15.8%) represent the smallest median family size with 1.33 persons per family.
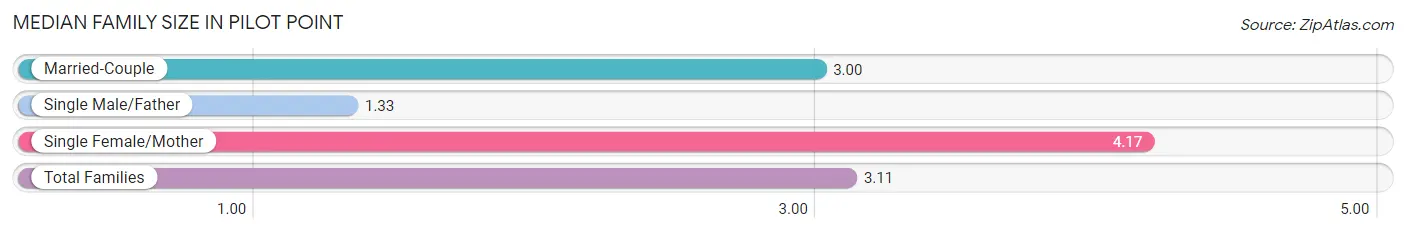
| Family Type | # Families | Family Size |
| Married-Couple | 10 (52.6%) | 3.00 |
| Single Male/Father | 3 (15.8%) | 1.33 |
| Single Female/Mother | 6 (31.6%) | 4.17 |
| Total Families | 19 (100.0%) | 3.11 |
Median Household Size in Pilot Point
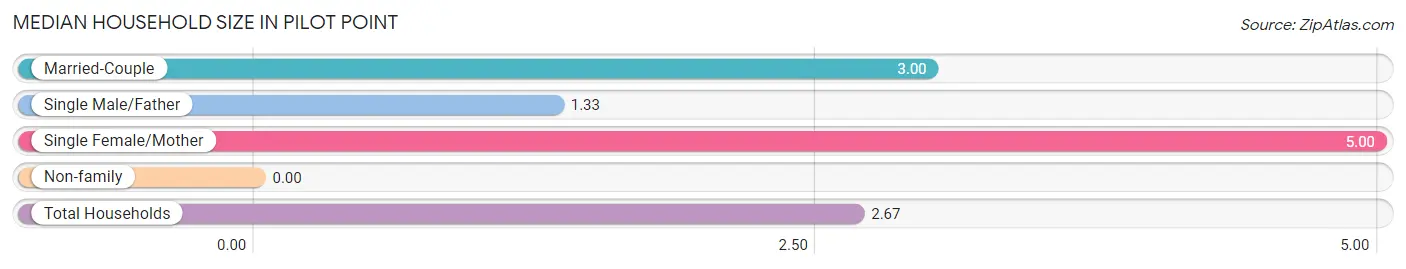
| Household Type | # Households | Household Size |
| Married-Couple | 10 (37.0%) | 3.00 |
| Single Male/Father | 3 (11.1%) | 1.33 |
| Single Female/Mother | 6 (22.2%) | 5.00 |
| Non-family | 8 (29.6%) | - |
| Total Households | 27 (100.0%) | 2.67 |
Household Size by Marriage Status in Pilot Point
Out of a total of 27 households in Pilot Point, 19 (70.4%) are family households, while 8 (29.6%) are nonfamily households. The most numerous type of family households are 2-person households, comprising 9, and the most common type of nonfamily households are 1-person households, comprising 8.
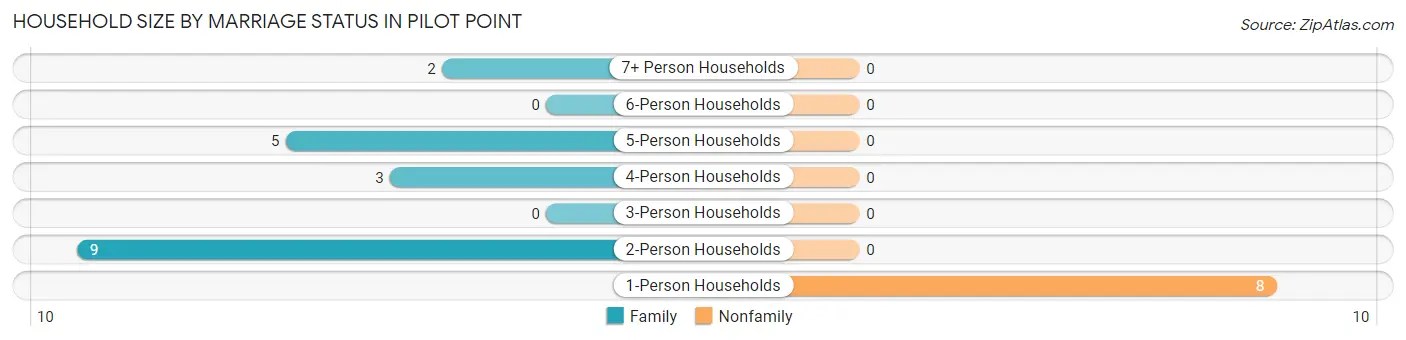
| Household Size | Family Households | Nonfamily Households |
| 1-Person Households | - | 8 (29.6%) |
| 2-Person Households | 9 (33.3%) | 0 (0.0%) |
| 3-Person Households | 0 (0.0%) | 0 (0.0%) |
| 4-Person Households | 3 (11.1%) | 0 (0.0%) |
| 5-Person Households | 5 (18.5%) | 0 (0.0%) |
| 6-Person Households | 0 (0.0%) | 0 (0.0%) |
| 7+ Person Households | 2 (7.4%) | 0 (0.0%) |
| Total | 19 (70.4%) | 8 (29.6%) |
Female Fertility in Pilot Point
Fertility by Age in Pilot Point
| Age Bracket | Women with Births | Births / 1,000 Women |
| 15 to 19 years | 0 (0.0%) | 0.0 |
| 20 to 34 years | 0 (0.0%) | 0.0 |
| 35 to 50 years | 0 (0.0%) | 0.0 |
| Total | 0 (0.0%) | 0.0 |
Fertility by Age by Marriage Status in Pilot Point
| Age Bracket | Married | Unmarried |
| 15 to 19 years | 0 (0.0%) | 0 (0.0%) |
| 20 to 34 years | 0 (0.0%) | 0 (0.0%) |
| 35 to 50 years | 0 (0.0%) | 0 (0.0%) |
| Total | 0 (0.0%) | 0 (0.0%) |
Fertility by Education in Pilot Point
| Educational Attainment | Women with Births | Births / 1,000 Women |
| Less than High School | 0 (0.0%) | 0.0 |
| High School Diploma | 0 (0.0%) | 0.0 |
| College or Associate's Degree | 0 (0.0%) | 0.0 |
| Bachelor's Degree | 0 (0.0%) | 0.0 |
| Graduate Degree | 0 (0.0%) | 0.0 |
| Total | 0 (0.0%) | 0.0 |
Fertility by Education by Marriage Status in Pilot Point
| Educational Attainment | Married | Unmarried |
| Less than High School | 0 (0.0%) | 0 (0.0%) |
| High School Diploma | 0 (0.0%) | 0 (0.0%) |
| College or Associate's Degree | 0 (0.0%) | 0 (0.0%) |
| Bachelor's Degree | 0 (0.0%) | 0 (0.0%) |
| Graduate Degree | 0 (0.0%) | 0 (0.0%) |
| Total | 0 (0.0%) | 0 (0.0%) |
Employment Characteristics in Pilot Point
Employment by Class of Employer in Pilot Point
Among the 34 employed individuals in Pilot Point, local government employees (24 | 70.6%), federal government employees (5 | 14.7%), and private company employees (2 | 5.9%) make up the most common classes of employment.
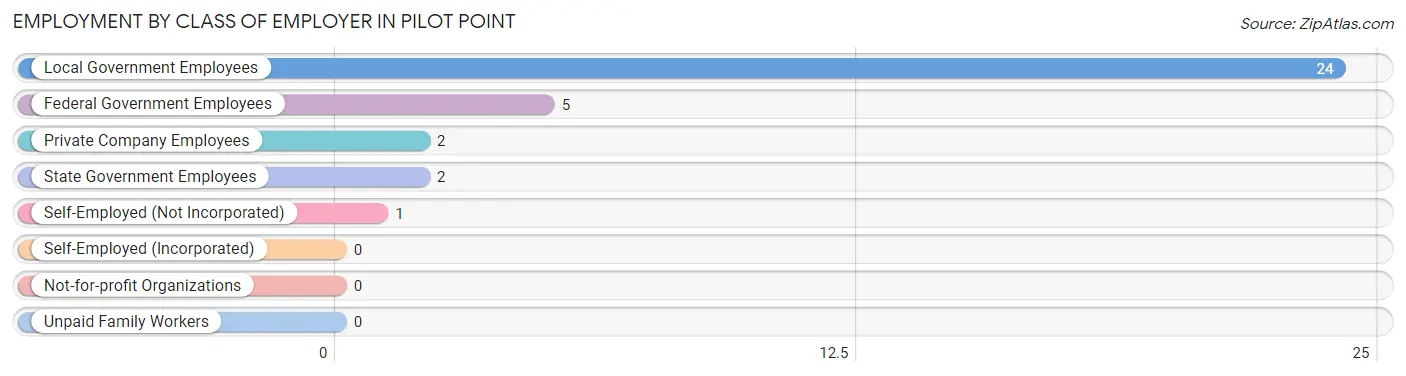
| Employer Class | # Employees | % Employees |
| Private Company Employees | 2 | 5.9% |
| Self-Employed (Incorporated) | 0 | 0.0% |
| Self-Employed (Not Incorporated) | 1 | 2.9% |
| Not-for-profit Organizations | 0 | 0.0% |
| Local Government Employees | 24 | 70.6% |
| State Government Employees | 2 | 5.9% |
| Federal Government Employees | 5 | 14.7% |
| Unpaid Family Workers | 0 | 0.0% |
| Total | 34 | 100.0% |
Employment Status by Age in Pilot Point
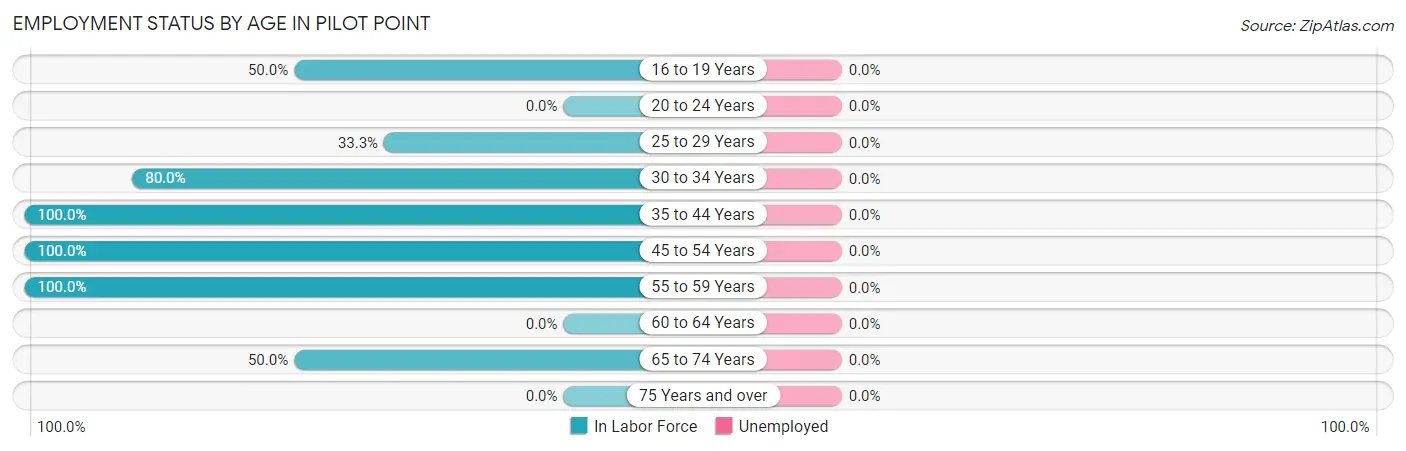
| Age Bracket | In Labor Force | Unemployed |
| 16 to 19 Years | 4 (50.0%) | 0 (0.0%) |
| 20 to 24 Years | 0 (0.0%) | 0 (0.0%) |
| 25 to 29 Years | 1 (33.3%) | 0 (0.0%) |
| 30 to 34 Years | 4 (80.0%) | 0 (0.0%) |
| 35 to 44 Years | 8 (100.0%) | 0 (0.0%) |
| 45 to 54 Years | 8 (100.0%) | 0 (0.0%) |
| 55 to 59 Years | 5 (100.0%) | 0 (0.0%) |
| 60 to 64 Years | 0 (0.0%) | 0 (0.0%) |
| 65 to 74 Years | 5 (50.0%) | 0 (0.0%) |
| 75 Years and over | 0 (0.0%) | 0 (0.0%) |
| Total | 35 (67.3%) | 0 (0.0%) |
Employment Status by Educational Attainment in Pilot Point
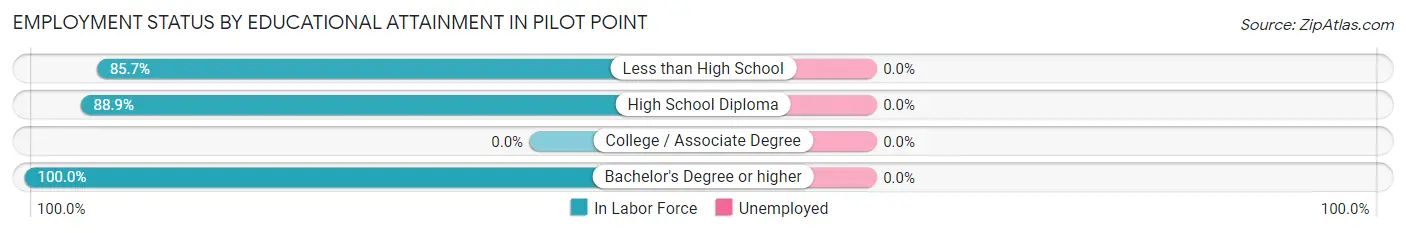
| Educational Attainment | In Labor Force | Unemployed |
| Less than High School | 6 (85.7%) | 0 (0.0%) |
| High School Diploma | 16 (88.9%) | 0 (0.0%) |
| College / Associate Degree | 0 (0.0%) | 0 (0.0%) |
| Bachelor's Degree or higher | 4 (100.0%) | 0 (0.0%) |
| Total | 26 (86.7%) | 0 (0.0%) |
Employment Occupations by Sex in Pilot Point
Management, Business, Science and Arts Occupations
The most common Management, Business, Science and Arts occupations in Pilot Point are Management (12 | 34.3%), Community & Social Service (2 | 5.7%), and Education Instruction & Library (2 | 5.7%).
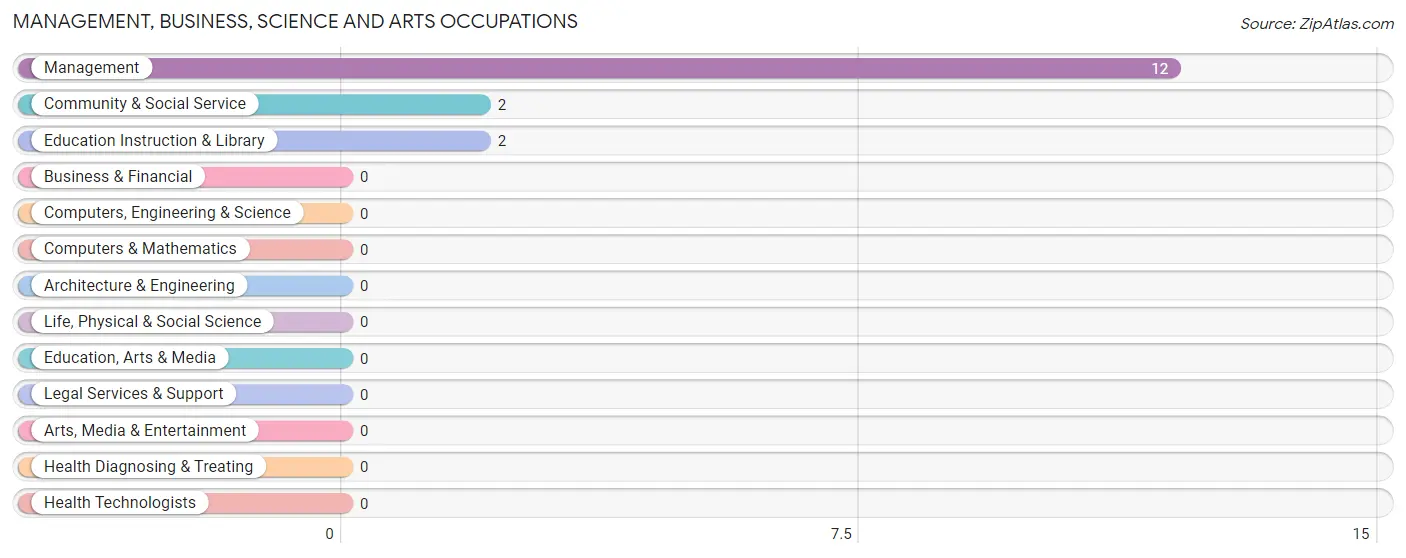
Management, Business, Science and Arts Occupations by Sex
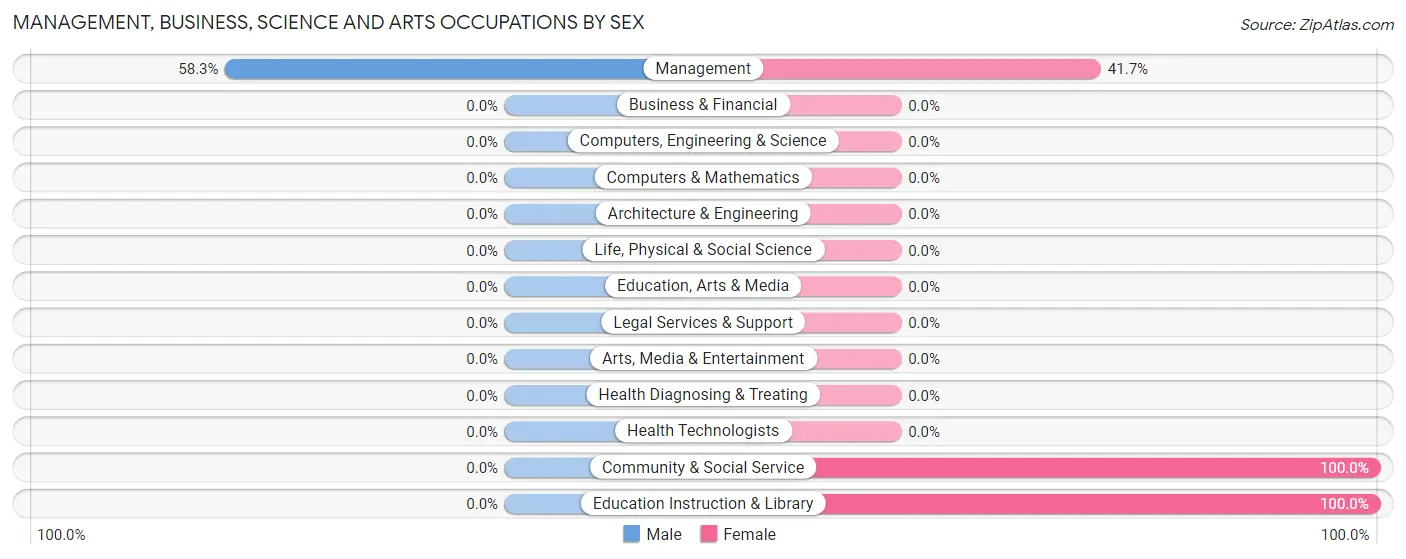
| Occupation | Male | Female |
| Management | 7 (58.3%) | 5 (41.7%) |
| Business & Financial | 0 (0.0%) | 0 (0.0%) |
| Computers, Engineering & Science | 0 (0.0%) | 0 (0.0%) |
| Computers & Mathematics | 0 (0.0%) | 0 (0.0%) |
| Architecture & Engineering | 0 (0.0%) | 0 (0.0%) |
| Life, Physical & Social Science | 0 (0.0%) | 0 (0.0%) |
| Community & Social Service | 0 (0.0%) | 2 (100.0%) |
| Education, Arts & Media | 0 (0.0%) | 0 (0.0%) |
| Legal Services & Support | 0 (0.0%) | 0 (0.0%) |
| Education Instruction & Library | 0 (0.0%) | 2 (100.0%) |
| Arts, Media & Entertainment | 0 (0.0%) | 0 (0.0%) |
| Health Diagnosing & Treating | 0 (0.0%) | 0 (0.0%) |
| Health Technologists | 0 (0.0%) | 0 (0.0%) |
| Total (Category) | 7 (50.0%) | 7 (50.0%) |
| Total (Overall) | 20 (57.1%) | 15 (42.9%) |
Services Occupations
The most common Services occupations in Pilot Point are , and Cleaning & Maintenance (11 | 31.4%).
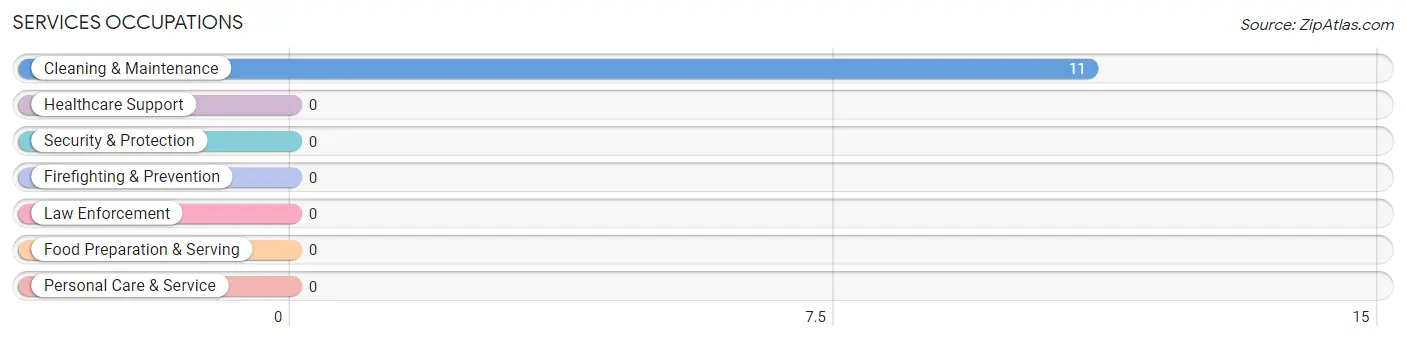
Services Occupations by Sex
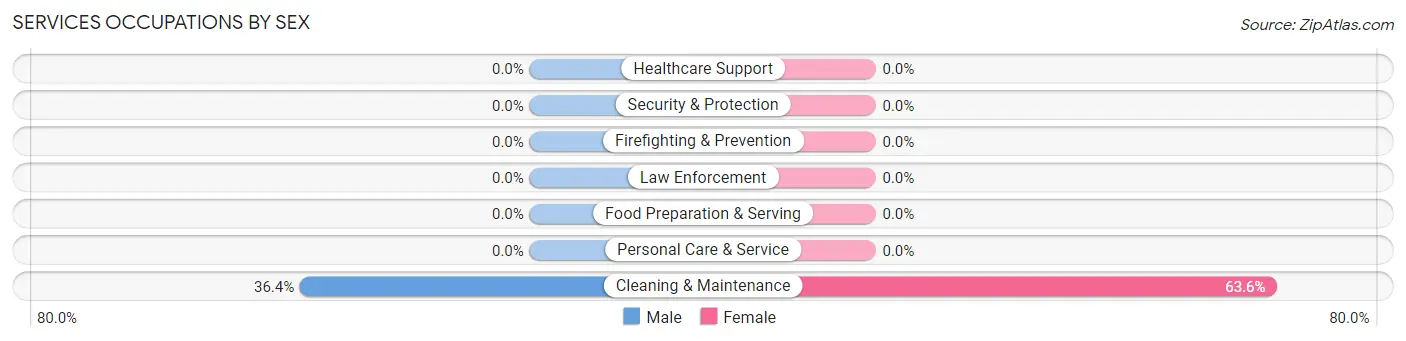
| Occupation | Male | Female |
| Healthcare Support | 0 (0.0%) | 0 (0.0%) |
| Security & Protection | 0 (0.0%) | 0 (0.0%) |
| Firefighting & Prevention | 0 (0.0%) | 0 (0.0%) |
| Law Enforcement | 0 (0.0%) | 0 (0.0%) |
| Food Preparation & Serving | 0 (0.0%) | 0 (0.0%) |
| Cleaning & Maintenance | 4 (36.4%) | 7 (63.6%) |
| Personal Care & Service | 0 (0.0%) | 0 (0.0%) |
| Total (Category) | 4 (36.4%) | 7 (63.6%) |
| Total (Overall) | 20 (57.1%) | 15 (42.9%) |
Sales and Office Occupations

Sales and Office Occupations by Sex
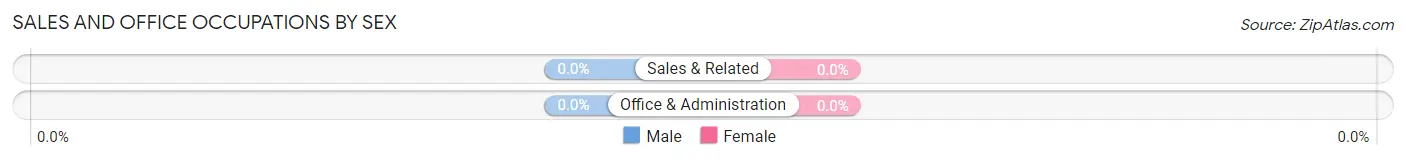
| Occupation | Male | Female |
| Sales & Related | 0 (0.0%) | 0 (0.0%) |
| Office & Administration | 0 (0.0%) | 0 (0.0%) |
| Total (Category) | 0 (0.0%) | 0 (0.0%) |
| Total (Overall) | 20 (57.1%) | 15 (42.9%) |
Natural Resources, Construction and Maintenance Occupations
The most common Natural Resources, Construction and Maintenance occupations in Pilot Point are , and Farming, Fishing & Forestry (1 | 2.9%).
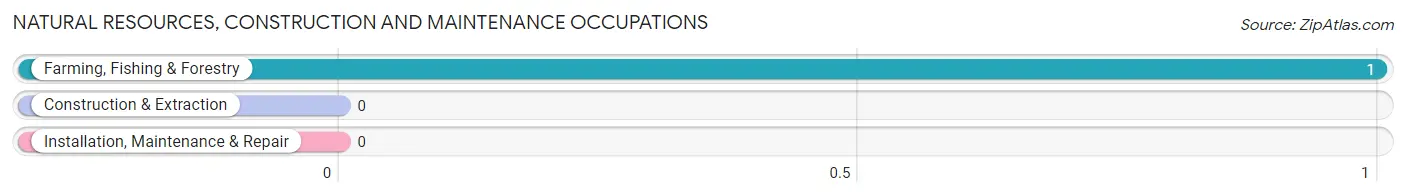
Natural Resources, Construction and Maintenance Occupations by Sex

| Occupation | Male | Female |
| Farming, Fishing & Forestry | 1 (100.0%) | 0 (0.0%) |
| Construction & Extraction | 0 (0.0%) | 0 (0.0%) |
| Installation, Maintenance & Repair | 0 (0.0%) | 0 (0.0%) |
| Total (Category) | 1 (100.0%) | 0 (0.0%) |
| Total (Overall) | 20 (57.1%) | 15 (42.9%) |
Production, Transportation and Moving Occupations
The most common Production, Transportation and Moving occupations in Pilot Point are Material Moving (8 | 22.9%), and Transportation (1 | 2.9%).
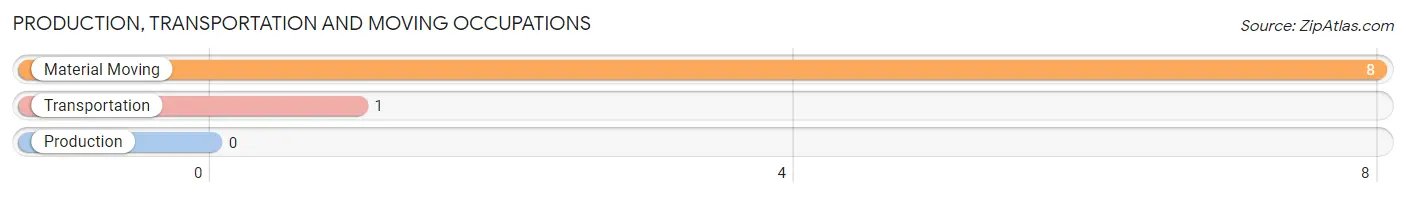
Production, Transportation and Moving Occupations by Sex
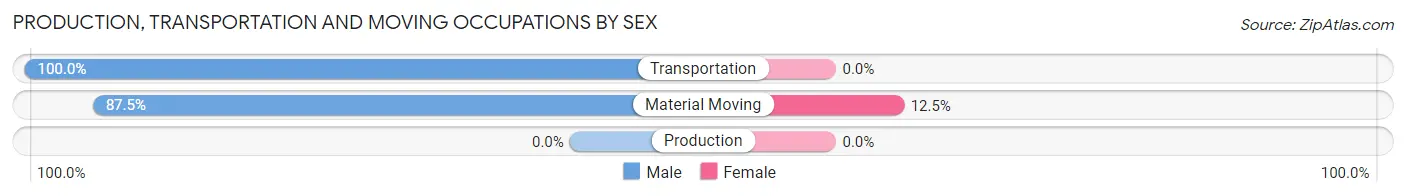
| Occupation | Male | Female |
| Production | 0 (0.0%) | 0 (0.0%) |
| Transportation | 1 (100.0%) | 0 (0.0%) |
| Material Moving | 7 (87.5%) | 1 (12.5%) |
| Total (Category) | 8 (88.9%) | 1 (11.1%) |
| Total (Overall) | 20 (57.1%) | 15 (42.9%) |
Employment Industries by Sex in Pilot Point
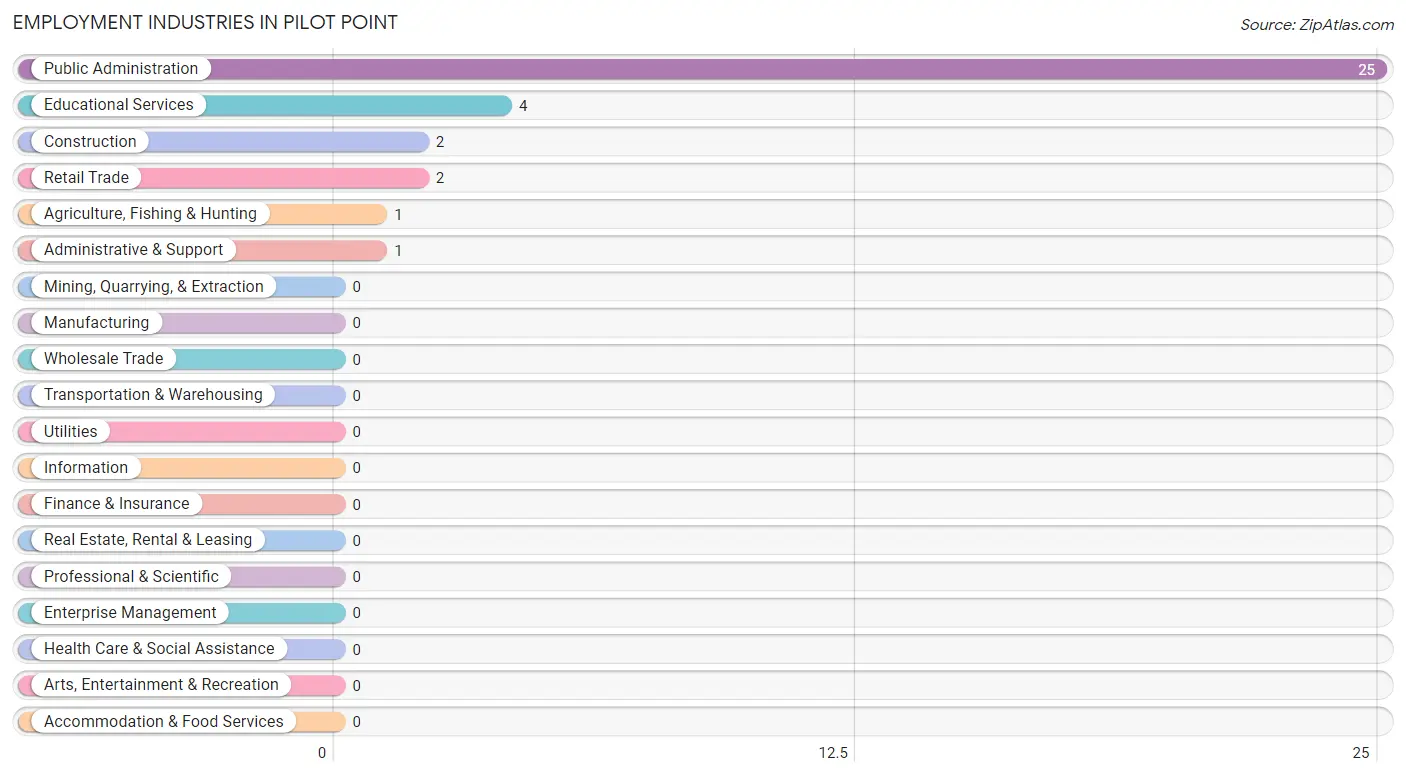
Employment Industries in Pilot Point
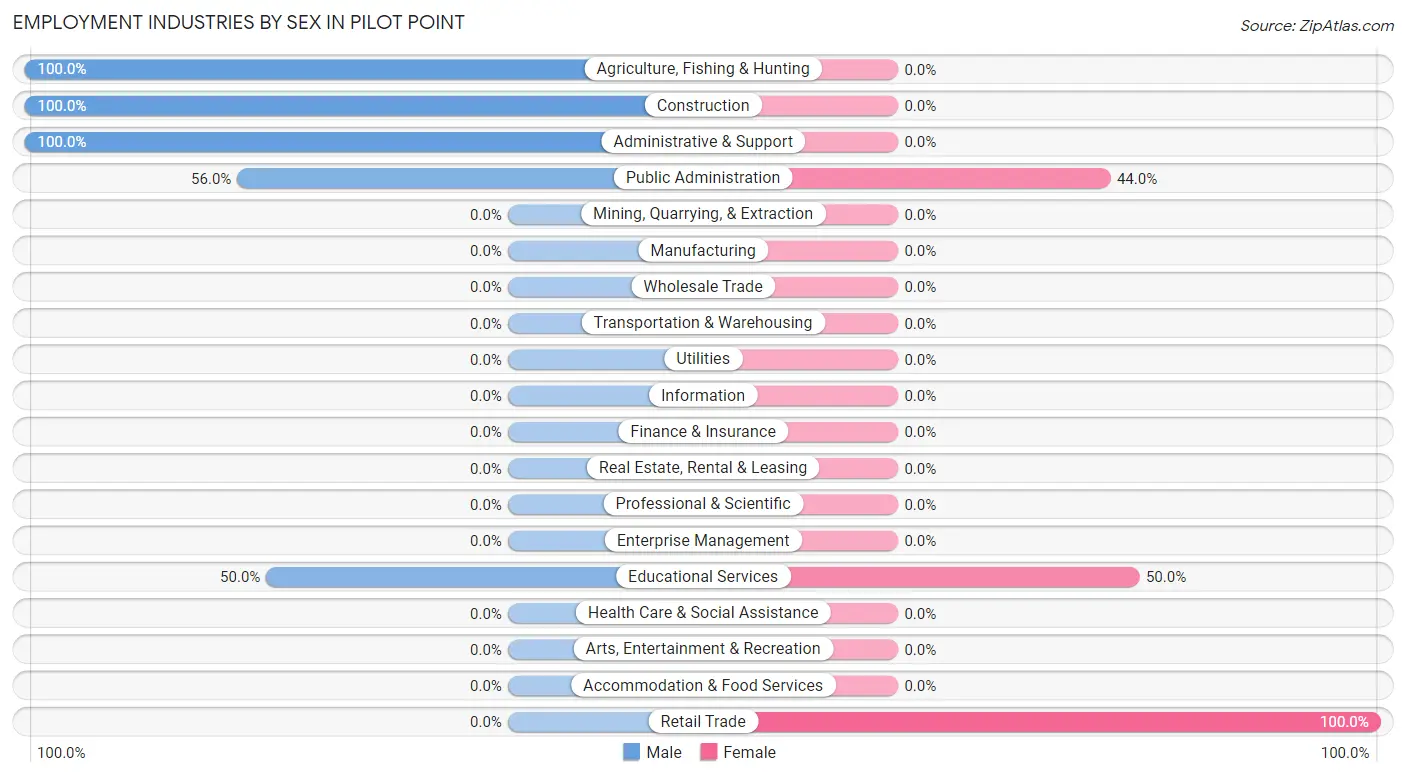
The major employment industries in Pilot Point include Public Administration (25 | 71.4%), Educational Services (4 | 11.4%), Construction (2 | 5.7%), Retail Trade (2 | 5.7%), and Agriculture, Fishing & Hunting (1 | 2.9%).
Employment Industries by Sex in Pilot Point
The Pilot Point industries that see more men than women are Agriculture, Fishing & Hunting (100.0%), Construction (100.0%), and Administrative & Support (100.0%), whereas the industries that tend to have a higher number of women are Retail Trade (100.0%), Educational Services (50.0%), and Public Administration (44.0%).
| Industry | Male | Female |
| Agriculture, Fishing & Hunting | 1 (100.0%) | 0 (0.0%) |
| Mining, Quarrying, & Extraction | 0 (0.0%) | 0 (0.0%) |
| Construction | 2 (100.0%) | 0 (0.0%) |
| Manufacturing | 0 (0.0%) | 0 (0.0%) |
| Wholesale Trade | 0 (0.0%) | 0 (0.0%) |
| Retail Trade | 0 (0.0%) | 2 (100.0%) |
| Transportation & Warehousing | 0 (0.0%) | 0 (0.0%) |
| Utilities | 0 (0.0%) | 0 (0.0%) |
| Information | 0 (0.0%) | 0 (0.0%) |
| Finance & Insurance | 0 (0.0%) | 0 (0.0%) |
| Real Estate, Rental & Leasing | 0 (0.0%) | 0 (0.0%) |
| Professional & Scientific | 0 (0.0%) | 0 (0.0%) |
| Enterprise Management | 0 (0.0%) | 0 (0.0%) |
| Administrative & Support | 1 (100.0%) | 0 (0.0%) |
| Educational Services | 2 (50.0%) | 2 (50.0%) |
| Health Care & Social Assistance | 0 (0.0%) | 0 (0.0%) |
| Arts, Entertainment & Recreation | 0 (0.0%) | 0 (0.0%) |
| Accommodation & Food Services | 0 (0.0%) | 0 (0.0%) |
| Public Administration | 14 (56.0%) | 11 (44.0%) |
| Total | 20 (57.1%) | 15 (42.9%) |
Education in Pilot Point
School Enrollment in Pilot Point
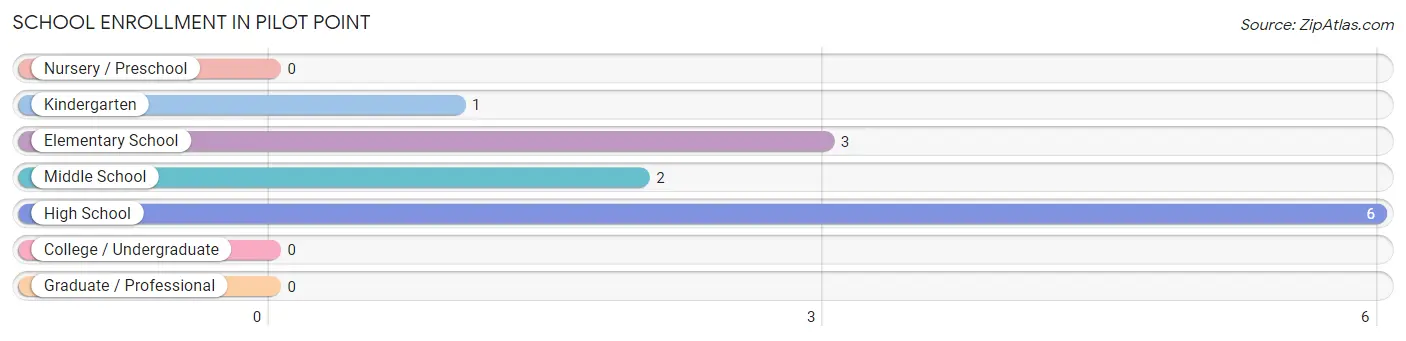
The most common levels of schooling among the 12 students in Pilot Point are high school (6 | 50.0%), elementary school (3 | 25.0%), and middle school (2 | 16.7%).
| School Level | # Students | % Students |
| Nursery / Preschool | 0 | 0.0% |
| Kindergarten | 1 | 8.3% |
| Elementary School | 3 | 25.0% |
| Middle School | 2 | 16.7% |
| High School | 6 | 50.0% |
| College / Undergraduate | 0 | 0.0% |
| Graduate / Professional | 0 | 0.0% |
| Total | 12 | 100.0% |
School Enrollment by Age by Funding Source in Pilot Point
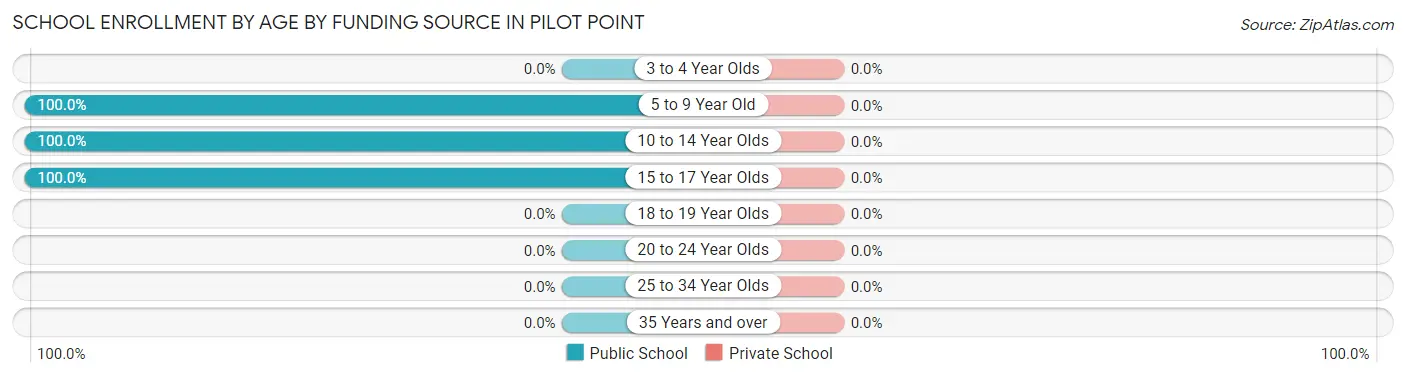
| Age Bracket | Public School | Private School |
| 3 to 4 Year Olds | 0 (0.0%) | 0 (0.0%) |
| 5 to 9 Year Old | 4 (100.0%) | 0 (0.0%) |
| 10 to 14 Year Olds | 6 (100.0%) | 0 (0.0%) |
| 15 to 17 Year Olds | 2 (100.0%) | 0 (0.0%) |
| 18 to 19 Year Olds | 0 (0.0%) | 0 (0.0%) |
| 20 to 24 Year Olds | 0 (0.0%) | 0 (0.0%) |
| 25 to 34 Year Olds | 0 (0.0%) | 0 (0.0%) |
| 35 Years and over | 0 (0.0%) | 0 (0.0%) |
| Total | 12 (100.0%) | 0 (0.0%) |
Educational Attainment by Field of Study in Pilot Point
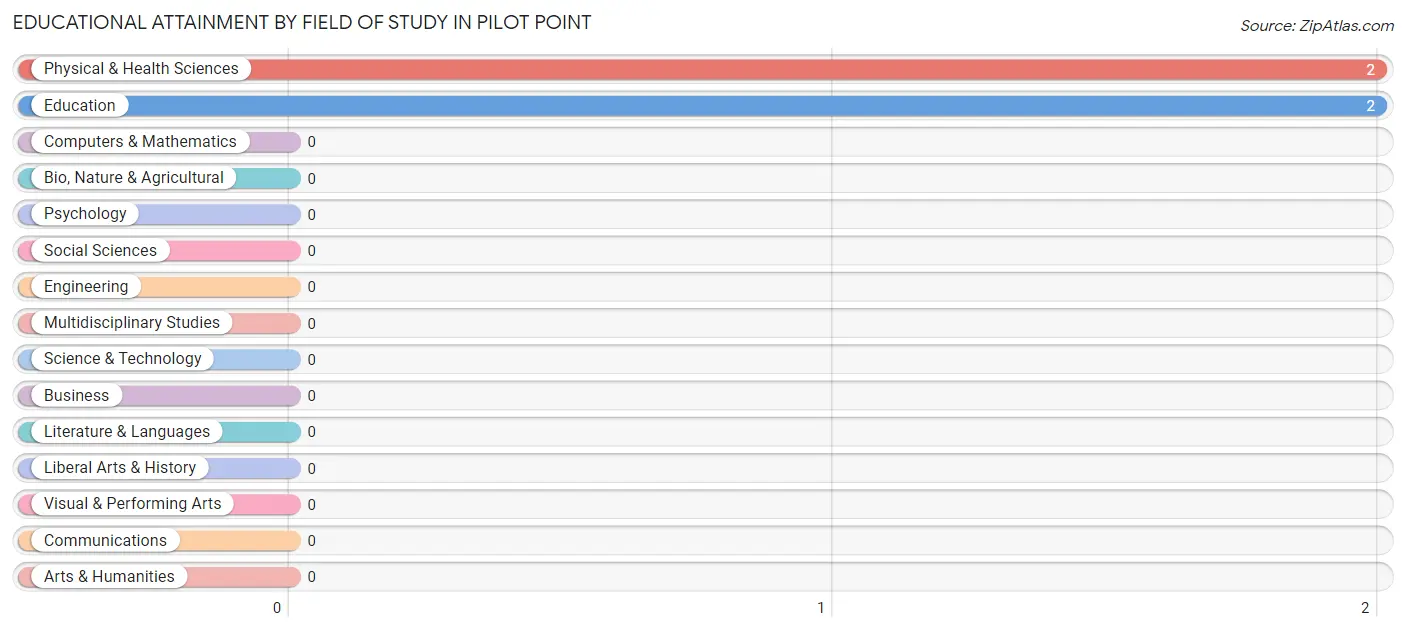
Physical & health sciences (2 | 50.0%), and education (2 | 50.0%) are the most common fields of study among 4 individuals in Pilot Point who have obtained a bachelor's degree or higher.
| Field of Study | # Graduates | % Graduates |
| Computers & Mathematics | 0 | 0.0% |
| Bio, Nature & Agricultural | 0 | 0.0% |
| Physical & Health Sciences | 2 | 50.0% |
| Psychology | 0 | 0.0% |
| Social Sciences | 0 | 0.0% |
| Engineering | 0 | 0.0% |
| Multidisciplinary Studies | 0 | 0.0% |
| Science & Technology | 0 | 0.0% |
| Business | 0 | 0.0% |
| Education | 2 | 50.0% |
| Literature & Languages | 0 | 0.0% |
| Liberal Arts & History | 0 | 0.0% |
| Visual & Performing Arts | 0 | 0.0% |
| Communications | 0 | 0.0% |
| Arts & Humanities | 0 | 0.0% |
| Total | 4 | 100.0% |
Transportation & Commute in Pilot Point
Vehicle Availability by Sex in Pilot Point
The most prevalent vehicle ownership categories in Pilot Point are males with 2 vehicles (15, accounting for 78.9%) and females with 2 vehicles (10, making up 100.0%).
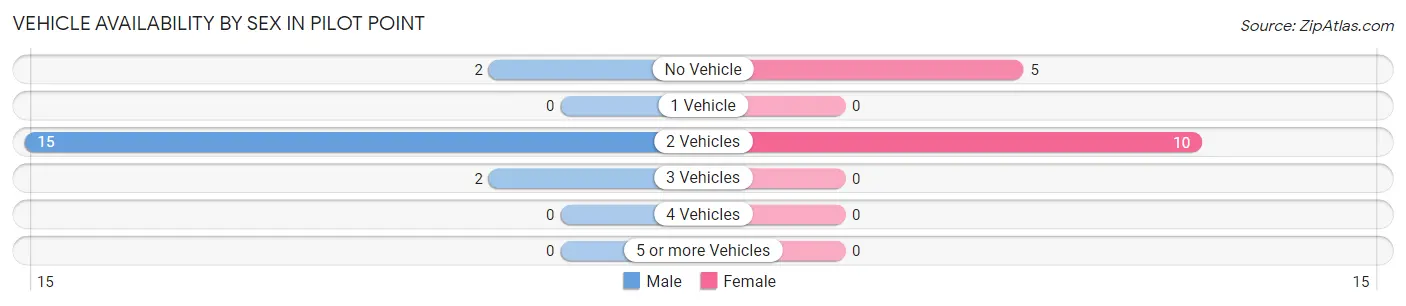
| Vehicles Available | Male | Female |
| No Vehicle | 2 (10.5%) | 5 (33.3%) |
| 1 Vehicle | 0 (0.0%) | 0 (0.0%) |
| 2 Vehicles | 15 (78.9%) | 10 (66.7%) |
| 3 Vehicles | 2 (10.5%) | 0 (0.0%) |
| 4 Vehicles | 0 (0.0%) | 0 (0.0%) |
| 5 or more Vehicles | 0 (0.0%) | 0 (0.0%) |
| Total | 19 (100.0%) | 15 (100.0%) |
Commute Time in Pilot Point
The most frequently occuring commute durations in Pilot Point are 5 to 9 minutes (15 commuters, 46.9%), less than 5 minutes (14 commuters, 43.8%), and 15 to 19 minutes (3 commuters, 9.4%).
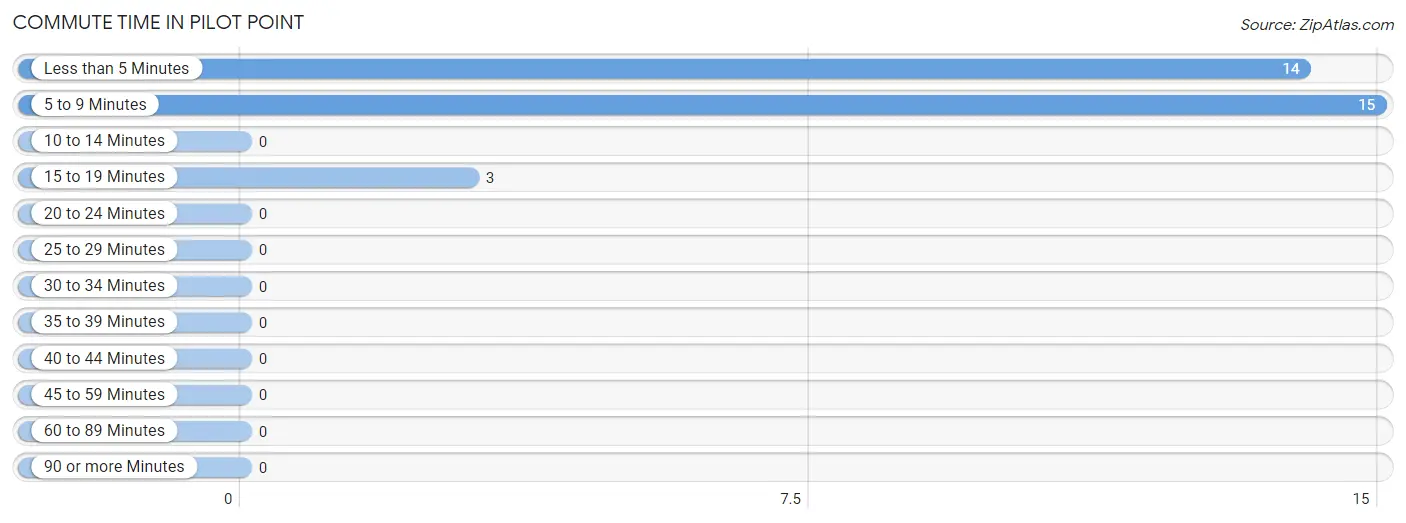
| Commute Time | # Commuters | % Commuters |
| Less than 5 Minutes | 14 | 43.8% |
| 5 to 9 Minutes | 15 | 46.9% |
| 10 to 14 Minutes | 0 | 0.0% |
| 15 to 19 Minutes | 3 | 9.4% |
| 20 to 24 Minutes | 0 | 0.0% |
| 25 to 29 Minutes | 0 | 0.0% |
| 30 to 34 Minutes | 0 | 0.0% |
| 35 to 39 Minutes | 0 | 0.0% |
| 40 to 44 Minutes | 0 | 0.0% |
| 45 to 59 Minutes | 0 | 0.0% |
| 60 to 89 Minutes | 0 | 0.0% |
| 90 or more Minutes | 0 | 0.0% |
Commute Time by Sex in Pilot Point
The most common commute times in Pilot Point are 5 to 9 minutes (9 commuters, 52.9%) for males and less than 5 minutes (6 commuters, 40.0%) for females.
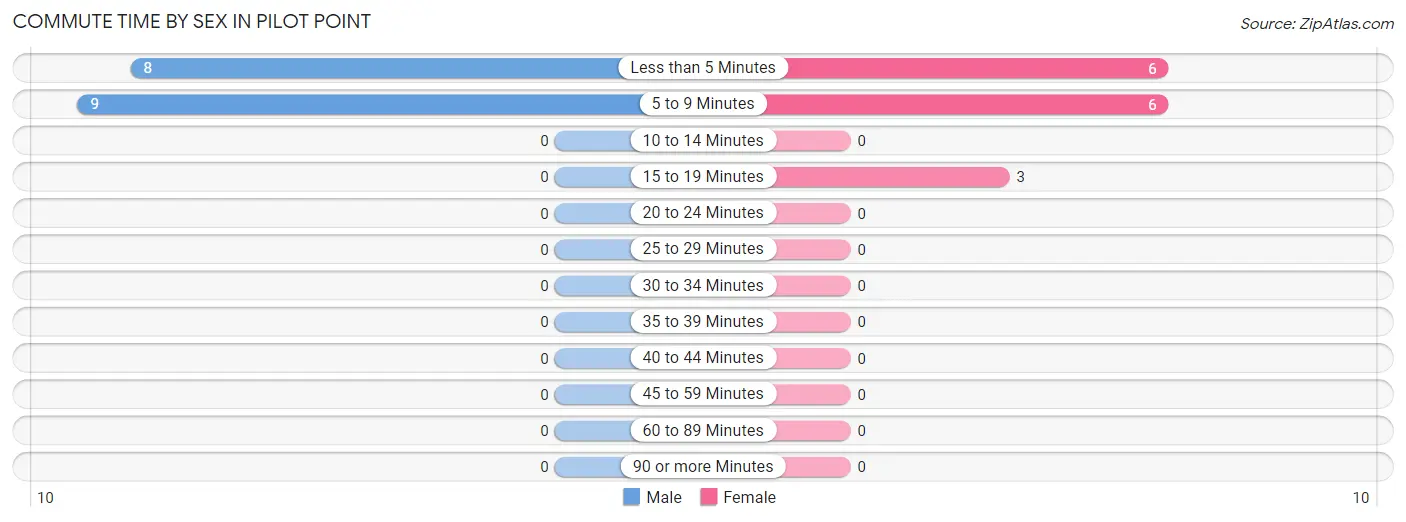
| Commute Time | Male | Female |
| Less than 5 Minutes | 8 (47.1%) | 6 (40.0%) |
| 5 to 9 Minutes | 9 (52.9%) | 6 (40.0%) |
| 10 to 14 Minutes | 0 (0.0%) | 0 (0.0%) |
| 15 to 19 Minutes | 0 (0.0%) | 3 (20.0%) |
| 20 to 24 Minutes | 0 (0.0%) | 0 (0.0%) |
| 25 to 29 Minutes | 0 (0.0%) | 0 (0.0%) |
| 30 to 34 Minutes | 0 (0.0%) | 0 (0.0%) |
| 35 to 39 Minutes | 0 (0.0%) | 0 (0.0%) |
| 40 to 44 Minutes | 0 (0.0%) | 0 (0.0%) |
| 45 to 59 Minutes | 0 (0.0%) | 0 (0.0%) |
| 60 to 89 Minutes | 0 (0.0%) | 0 (0.0%) |
| 90 or more Minutes | 0 (0.0%) | 0 (0.0%) |
Time of Departure to Work by Sex in Pilot Point
The most frequent times of departure to work in Pilot Point are 9:00 AM to 9:59 AM (7, 41.2%) for males and 12:00 PM to 3:59 PM (4, 26.7%) for females.
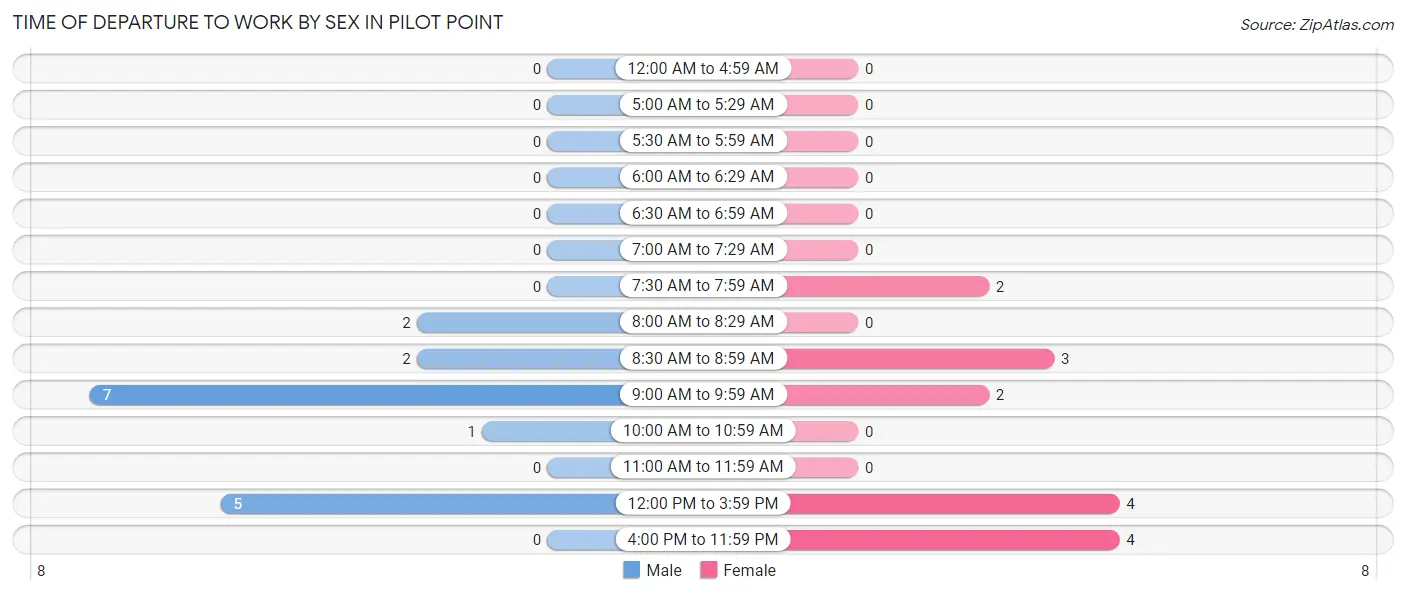
| Time of Departure | Male | Female |
| 12:00 AM to 4:59 AM | 0 (0.0%) | 0 (0.0%) |
| 5:00 AM to 5:29 AM | 0 (0.0%) | 0 (0.0%) |
| 5:30 AM to 5:59 AM | 0 (0.0%) | 0 (0.0%) |
| 6:00 AM to 6:29 AM | 0 (0.0%) | 0 (0.0%) |
| 6:30 AM to 6:59 AM | 0 (0.0%) | 0 (0.0%) |
| 7:00 AM to 7:29 AM | 0 (0.0%) | 0 (0.0%) |
| 7:30 AM to 7:59 AM | 0 (0.0%) | 2 (13.3%) |
| 8:00 AM to 8:29 AM | 2 (11.8%) | 0 (0.0%) |
| 8:30 AM to 8:59 AM | 2 (11.8%) | 3 (20.0%) |
| 9:00 AM to 9:59 AM | 7 (41.2%) | 2 (13.3%) |
| 10:00 AM to 10:59 AM | 1 (5.9%) | 0 (0.0%) |
| 11:00 AM to 11:59 AM | 0 (0.0%) | 0 (0.0%) |
| 12:00 PM to 3:59 PM | 5 (29.4%) | 4 (26.7%) |
| 4:00 PM to 11:59 PM | 0 (0.0%) | 4 (26.7%) |
| Total | 17 (100.0%) | 15 (100.0%) |
Housing Occupancy in Pilot Point
Occupancy by Ownership in Pilot Point
Of the total 27 dwellings in Pilot Point, owner-occupied units account for 20 (74.1%), while renter-occupied units make up 7 (25.9%).
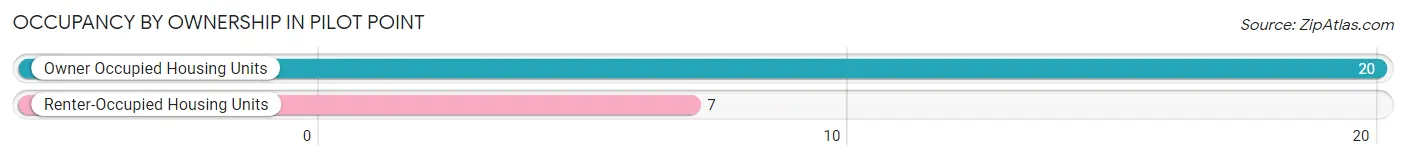
| Occupancy | # Housing Units | % Housing Units |
| Owner Occupied Housing Units | 20 | 74.1% |
| Renter-Occupied Housing Units | 7 | 25.9% |
| Total Occupied Housing Units | 27 | 100.0% |
Occupancy by Household Size in Pilot Point
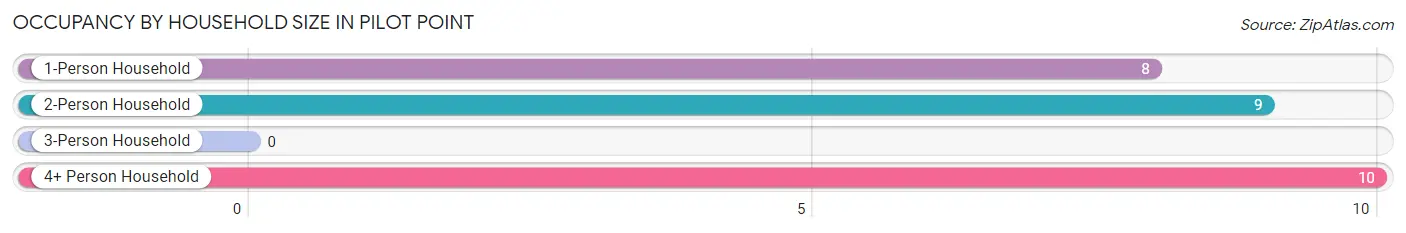
| Household Size | # Housing Units | % Housing Units |
| 1-Person Household | 8 | 29.6% |
| 2-Person Household | 9 | 33.3% |
| 3-Person Household | 0 | 0.0% |
| 4+ Person Household | 10 | 37.0% |
| Total Housing Units | 27 | 100.0% |
Occupancy by Ownership by Household Size in Pilot Point
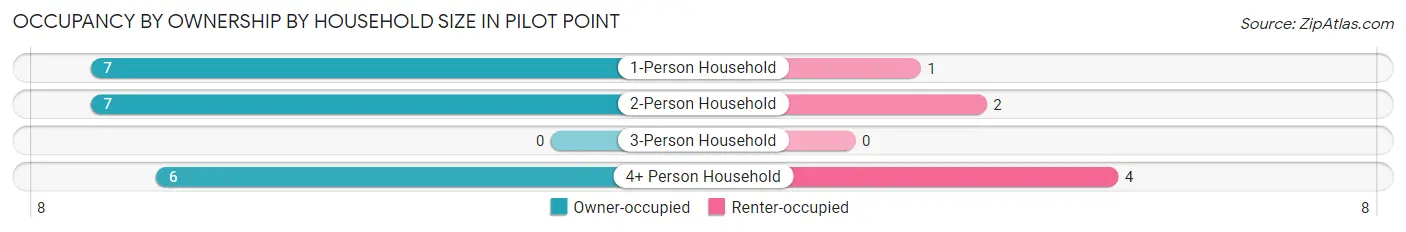
| Household Size | Owner-occupied | Renter-occupied |
| 1-Person Household | 7 (87.5%) | 1 (12.5%) |
| 2-Person Household | 7 (77.8%) | 2 (22.2%) |
| 3-Person Household | 0 (0.0%) | 0 (0.0%) |
| 4+ Person Household | 6 (60.0%) | 4 (40.0%) |
| Total Housing Units | 20 (74.1%) | 7 (25.9%) |
Occupancy by Educational Attainment in Pilot Point
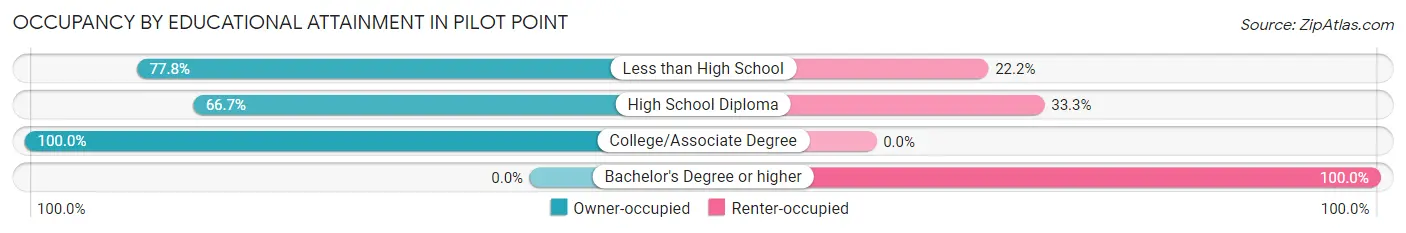
| Household Size | Owner-occupied | Renter-occupied |
| Less than High School | 7 (77.8%) | 2 (22.2%) |
| High School Diploma | 6 (66.7%) | 3 (33.3%) |
| College/Associate Degree | 7 (100.0%) | 0 (0.0%) |
| Bachelor's Degree or higher | 0 (0.0%) | 2 (100.0%) |
Occupancy by Age of Householder in Pilot Point
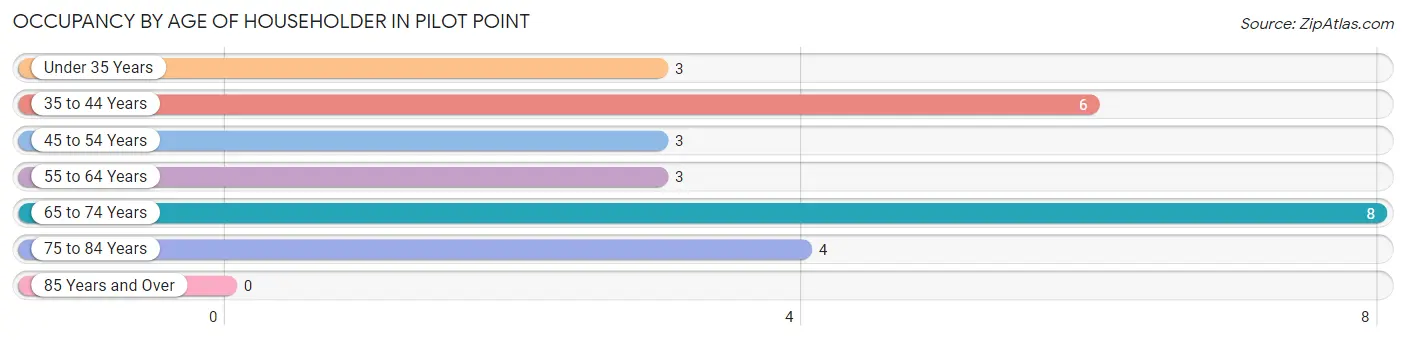
| Age Bracket | # Households | % Households |
| Under 35 Years | 3 | 11.1% |
| 35 to 44 Years | 6 | 22.2% |
| 45 to 54 Years | 3 | 11.1% |
| 55 to 64 Years | 3 | 11.1% |
| 65 to 74 Years | 8 | 29.6% |
| 75 to 84 Years | 4 | 14.8% |
| 85 Years and Over | 0 | 0.0% |
| Total | 27 | 100.0% |
Housing Finances in Pilot Point
Median Income by Occupancy in Pilot Point
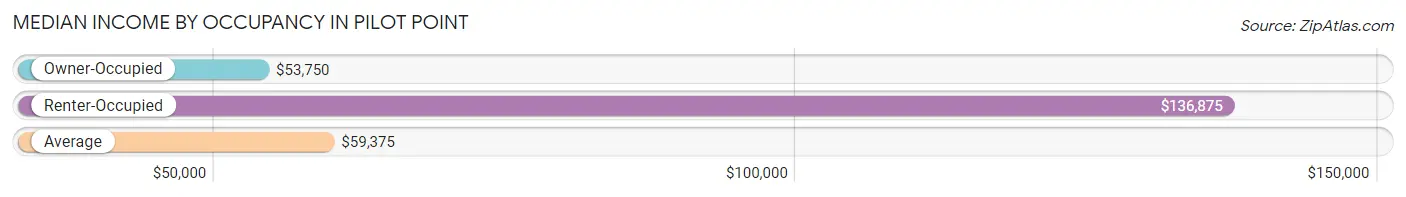
| Occupancy Type | # Households | Median Income |
| Owner-Occupied | 20 (74.1%) | $53,750 |
| Renter-Occupied | 7 (25.9%) | $136,875 |
| Average | 27 (100.0%) | $59,375 |
Occupancy by Householder Income Bracket in Pilot Point
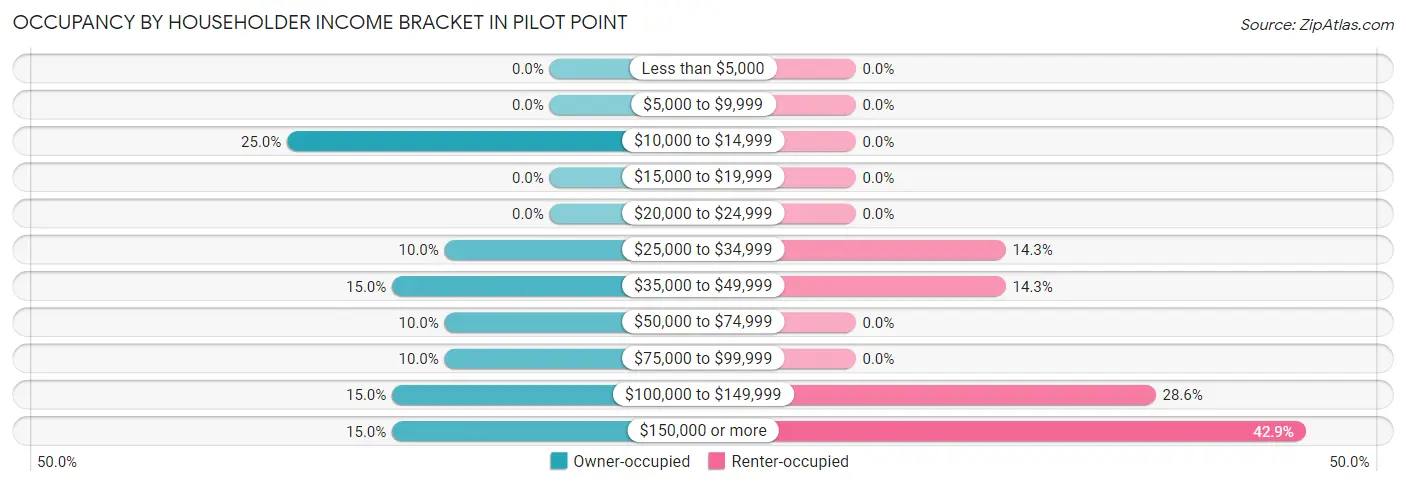
| Income Bracket | Owner-occupied | Renter-occupied |
| Less than $5,000 | 0 (0.0%) | 0 (0.0%) |
| $5,000 to $9,999 | 0 (0.0%) | 0 (0.0%) |
| $10,000 to $14,999 | 5 (25.0%) | 0 (0.0%) |
| $15,000 to $19,999 | 0 (0.0%) | 0 (0.0%) |
| $20,000 to $24,999 | 0 (0.0%) | 0 (0.0%) |
| $25,000 to $34,999 | 2 (10.0%) | 1 (14.3%) |
| $35,000 to $49,999 | 3 (15.0%) | 1 (14.3%) |
| $50,000 to $74,999 | 2 (10.0%) | 0 (0.0%) |
| $75,000 to $99,999 | 2 (10.0%) | 0 (0.0%) |
| $100,000 to $149,999 | 3 (15.0%) | 2 (28.6%) |
| $150,000 or more | 3 (15.0%) | 3 (42.9%) |
| Total | 20 (100.0%) | 7 (100.0%) |
Monthly Housing Cost Tiers in Pilot Point
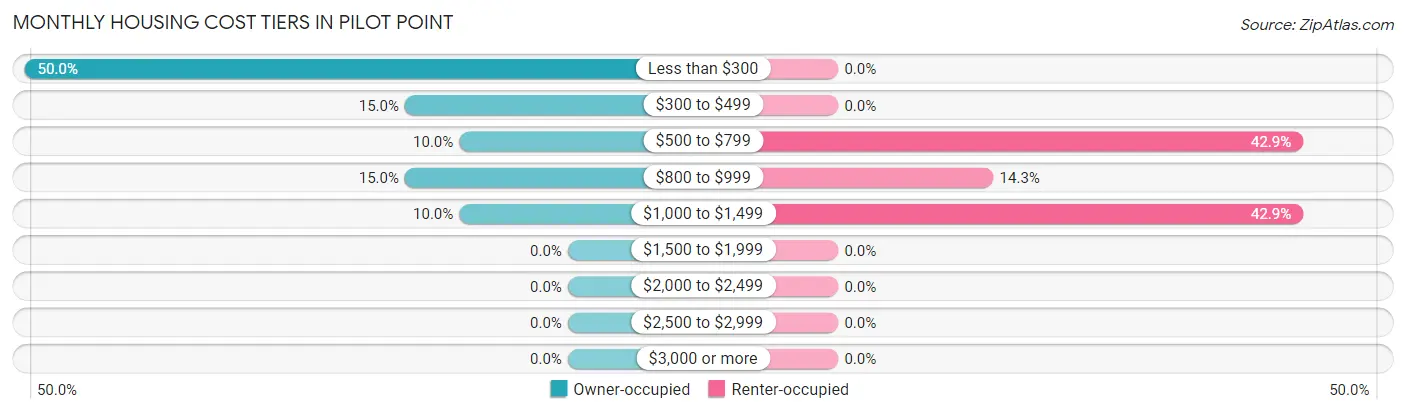
| Monthly Cost | Owner-occupied | Renter-occupied |
| Less than $300 | 10 (50.0%) | 0 (0.0%) |
| $300 to $499 | 3 (15.0%) | 0 (0.0%) |
| $500 to $799 | 2 (10.0%) | 3 (42.9%) |
| $800 to $999 | 3 (15.0%) | 1 (14.3%) |
| $1,000 to $1,499 | 2 (10.0%) | 3 (42.9%) |
| $1,500 to $1,999 | 0 (0.0%) | 0 (0.0%) |
| $2,000 to $2,499 | 0 (0.0%) | 0 (0.0%) |
| $2,500 to $2,999 | 0 (0.0%) | 0 (0.0%) |
| $3,000 or more | 0 (0.0%) | 0 (0.0%) |
| Total | 20 (100.0%) | 7 (100.0%) |
Physical Housing Characteristics in Pilot Point
Housing Structures in Pilot Point
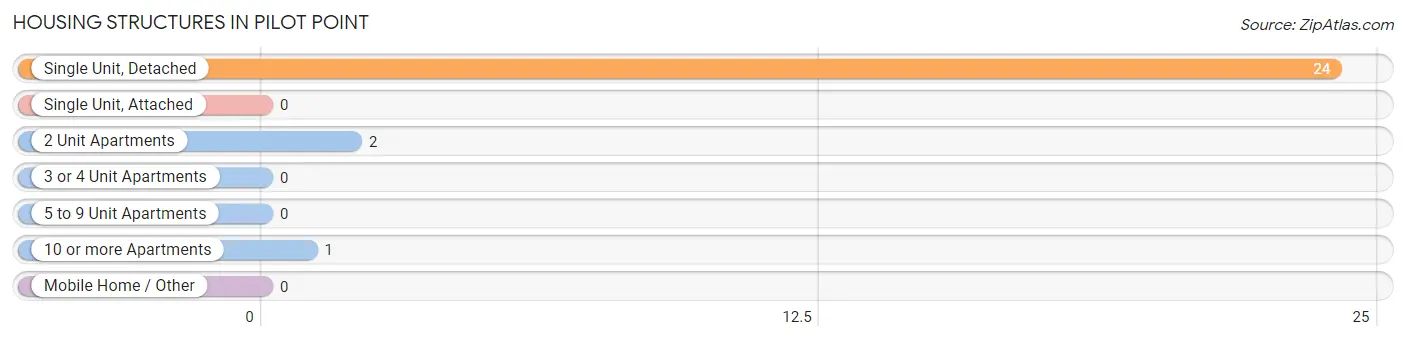
| Structure Type | # Housing Units | % Housing Units |
| Single Unit, Detached | 24 | 88.9% |
| Single Unit, Attached | 0 | 0.0% |
| 2 Unit Apartments | 2 | 7.4% |
| 3 or 4 Unit Apartments | 0 | 0.0% |
| 5 to 9 Unit Apartments | 0 | 0.0% |
| 10 or more Apartments | 1 | 3.7% |
| Mobile Home / Other | 0 | 0.0% |
| Total | 27 | 100.0% |
Housing Structures by Occupancy in Pilot Point
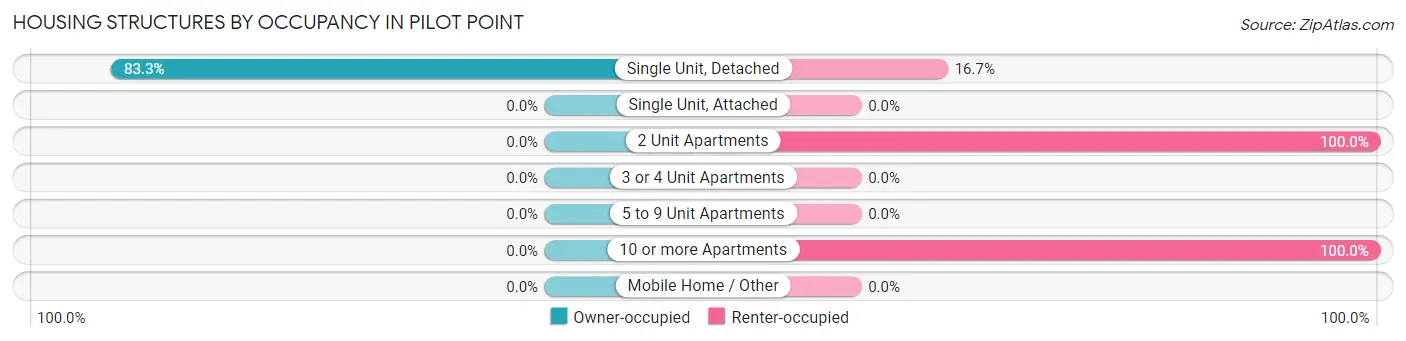
| Structure Type | Owner-occupied | Renter-occupied |
| Single Unit, Detached | 20 (83.3%) | 4 (16.7%) |
| Single Unit, Attached | 0 (0.0%) | 0 (0.0%) |
| 2 Unit Apartments | 0 (0.0%) | 2 (100.0%) |
| 3 or 4 Unit Apartments | 0 (0.0%) | 0 (0.0%) |
| 5 to 9 Unit Apartments | 0 (0.0%) | 0 (0.0%) |
| 10 or more Apartments | 0 (0.0%) | 1 (100.0%) |
| Mobile Home / Other | 0 (0.0%) | 0 (0.0%) |
| Total | 20 (74.1%) | 7 (25.9%) |
Housing Structures by Number of Rooms in Pilot Point
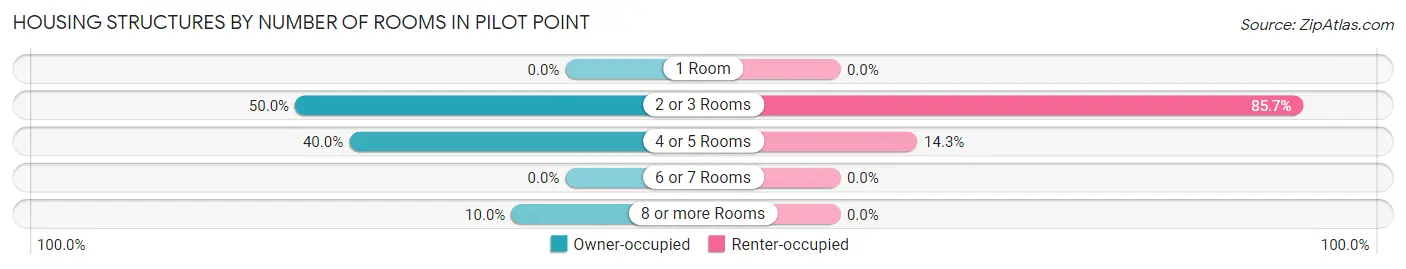
| Number of Rooms | Owner-occupied | Renter-occupied |
| 1 Room | 0 (0.0%) | 0 (0.0%) |
| 2 or 3 Rooms | 10 (50.0%) | 6 (85.7%) |
| 4 or 5 Rooms | 8 (40.0%) | 1 (14.3%) |
| 6 or 7 Rooms | 0 (0.0%) | 0 (0.0%) |
| 8 or more Rooms | 2 (10.0%) | 0 (0.0%) |
| Total | 20 (100.0%) | 7 (100.0%) |
Housing Structure by Heating Type in Pilot Point
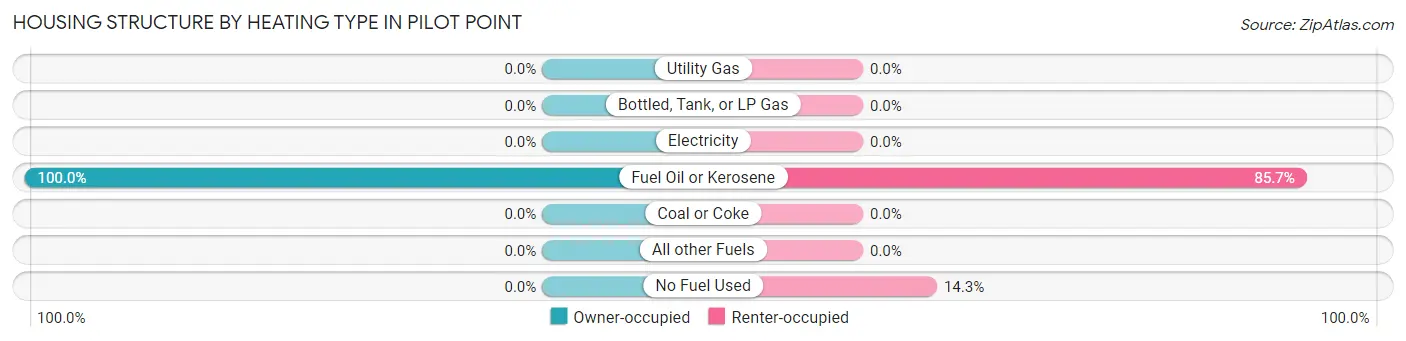
| Heating Type | Owner-occupied | Renter-occupied |
| Utility Gas | 0 (0.0%) | 0 (0.0%) |
| Bottled, Tank, or LP Gas | 0 (0.0%) | 0 (0.0%) |
| Electricity | 0 (0.0%) | 0 (0.0%) |
| Fuel Oil or Kerosene | 20 (100.0%) | 6 (85.7%) |
| Coal or Coke | 0 (0.0%) | 0 (0.0%) |
| All other Fuels | 0 (0.0%) | 0 (0.0%) |
| No Fuel Used | 0 (0.0%) | 1 (14.3%) |
| Total | 20 (100.0%) | 7 (100.0%) |
Household Vehicle Usage in Pilot Point
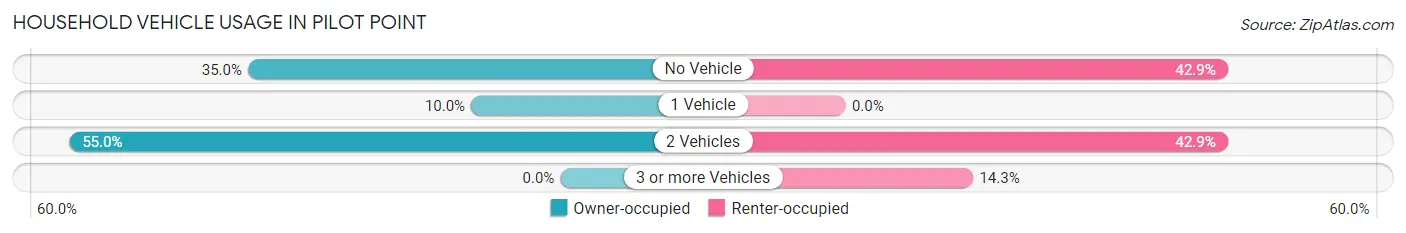
| Vehicles per Household | Owner-occupied | Renter-occupied |
| No Vehicle | 7 (35.0%) | 3 (42.9%) |
| 1 Vehicle | 2 (10.0%) | 0 (0.0%) |
| 2 Vehicles | 11 (55.0%) | 3 (42.9%) |
| 3 or more Vehicles | 0 (0.0%) | 1 (14.3%) |
| Total | 20 (100.0%) | 7 (100.0%) |
Real Estate & Mortgages in Pilot Point
Real Estate and Mortgage Overview in Pilot Point
| Characteristic | Without Mortgage | With Mortgage |
| Housing Units | 18 | 2 |
| Median Property Value | - | - |
| Median Household Income | $49,167 | $0 |
| Monthly Housing Costs | $225 | $0 |
| Real Estate Taxes | - | - |
Property Value by Mortgage Status in Pilot Point
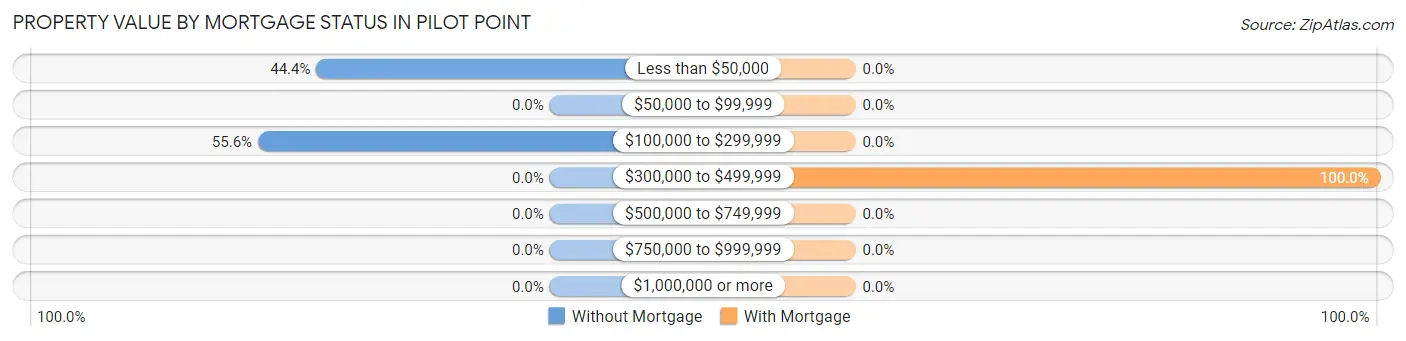
| Property Value | Without Mortgage | With Mortgage |
| Less than $50,000 | 8 (44.4%) | 0 (0.0%) |
| $50,000 to $99,999 | 0 (0.0%) | 0 (0.0%) |
| $100,000 to $299,999 | 10 (55.6%) | 0 (0.0%) |
| $300,000 to $499,999 | 0 (0.0%) | 2 (100.0%) |
| $500,000 to $749,999 | 0 (0.0%) | 0 (0.0%) |
| $750,000 to $999,999 | 0 (0.0%) | 0 (0.0%) |
| $1,000,000 or more | 0 (0.0%) | 0 (0.0%) |
| Total | 18 (100.0%) | 2 (100.0%) |
Household Income by Mortgage Status in Pilot Point
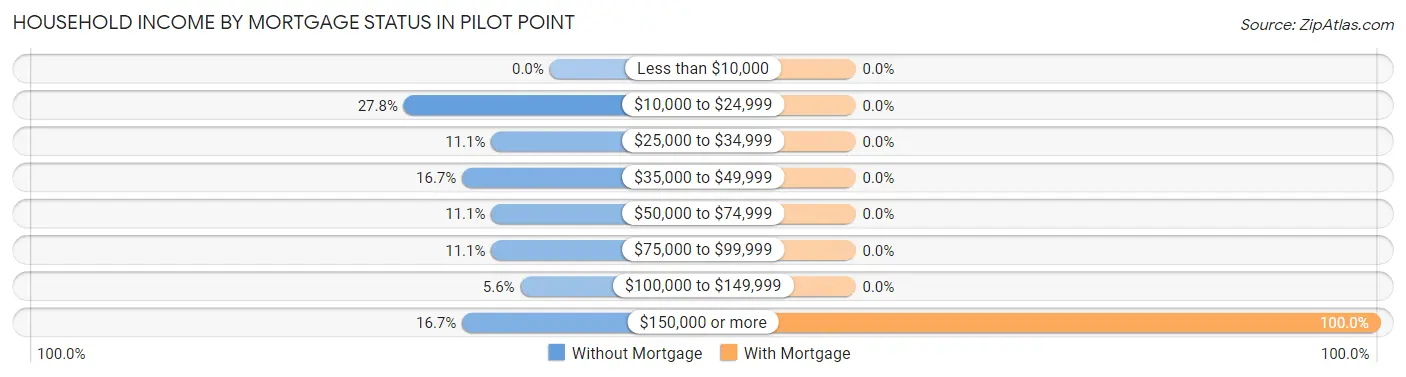
| Household Income | Without Mortgage | With Mortgage |
| Less than $10,000 | 0 (0.0%) | 0 (0.0%) |
| $10,000 to $24,999 | 5 (27.8%) | 0 (0.0%) |
| $25,000 to $34,999 | 2 (11.1%) | 0 (0.0%) |
| $35,000 to $49,999 | 3 (16.7%) | 0 (0.0%) |
| $50,000 to $74,999 | 2 (11.1%) | 0 (0.0%) |
| $75,000 to $99,999 | 2 (11.1%) | 0 (0.0%) |
| $100,000 to $149,999 | 1 (5.6%) | 0 (0.0%) |
| $150,000 or more | 3 (16.7%) | 2 (100.0%) |
| Total | 18 (100.0%) | 2 (100.0%) |
Property Value to Household Income Ratio in Pilot Point
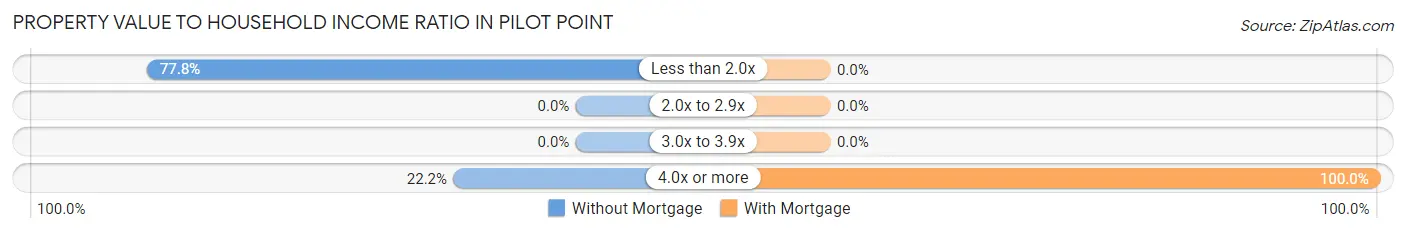
| Value-to-Income Ratio | Without Mortgage | With Mortgage |
| Less than 2.0x | 14 (77.8%) | 0 (0.0%) |
| 2.0x to 2.9x | 0 (0.0%) | 0 (0.0%) |
| 3.0x to 3.9x | 0 (0.0%) | 0 (0.0%) |
| 4.0x or more | 4 (22.2%) | 2 (100.0%) |
| Total | 18 (100.0%) | 2 (100.0%) |
Real Estate Taxes by Mortgage Status in Pilot Point
| Property Taxes | Without Mortgage | With Mortgage |
| Less than $800 | 0 (0.0%) | 0 (0.0%) |
| $800 to $1,499 | 0 (0.0%) | 0 (0.0%) |
| $800 to $1,499 | 0 (0.0%) | 0 (0.0%) |
| Total | 18 (100.0%) | 2 (100.0%) |
Health & Disability in Pilot Point
Health Insurance Coverage by Age in Pilot Point
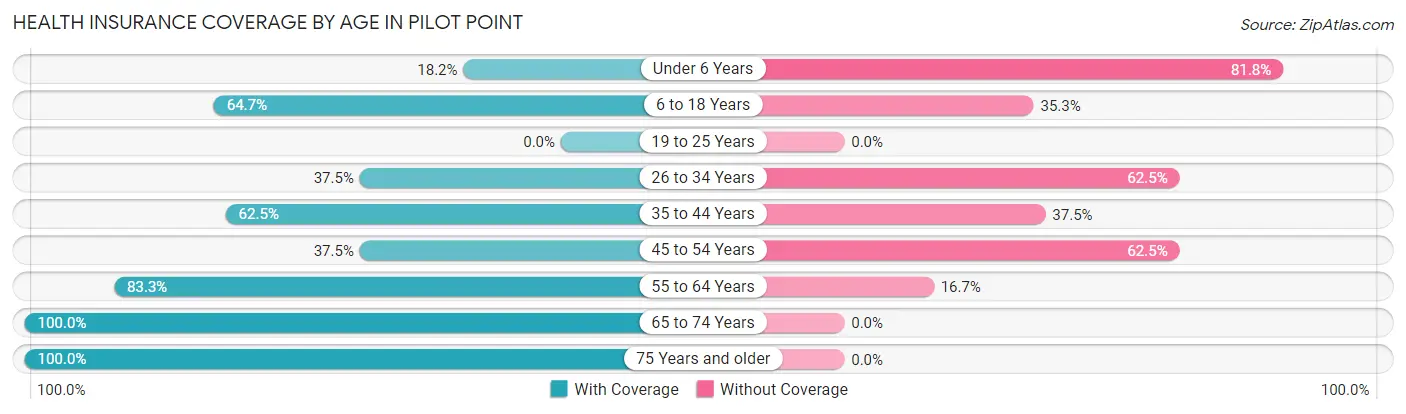
| Age Bracket | With Coverage | Without Coverage |
| Under 6 Years | 2 (18.2%) | 9 (81.8%) |
| 6 to 18 Years | 11 (64.7%) | 6 (35.3%) |
| 19 to 25 Years | 0 (0.0%) | 0 (0.0%) |
| 26 to 34 Years | 3 (37.5%) | 5 (62.5%) |
| 35 to 44 Years | 5 (62.5%) | 3 (37.5%) |
| 45 to 54 Years | 3 (37.5%) | 5 (62.5%) |
| 55 to 64 Years | 5 (83.3%) | 1 (16.7%) |
| 65 to 74 Years | 10 (100.0%) | 0 (0.0%) |
| 75 Years and older | 4 (100.0%) | 0 (0.0%) |
| Total | 43 (59.7%) | 29 (40.3%) |
Health Insurance Coverage by Citizenship Status in Pilot Point
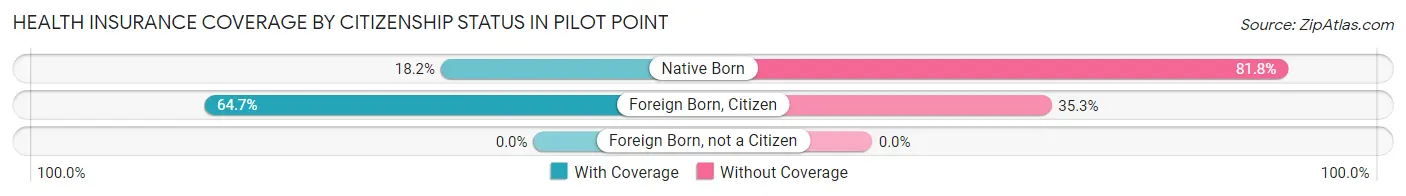
| Citizenship Status | With Coverage | Without Coverage |
| Native Born | 2 (18.2%) | 9 (81.8%) |
| Foreign Born, Citizen | 11 (64.7%) | 6 (35.3%) |
| Foreign Born, not a Citizen | 0 (0.0%) | 0 (0.0%) |
Health Insurance Coverage by Household Income in Pilot Point
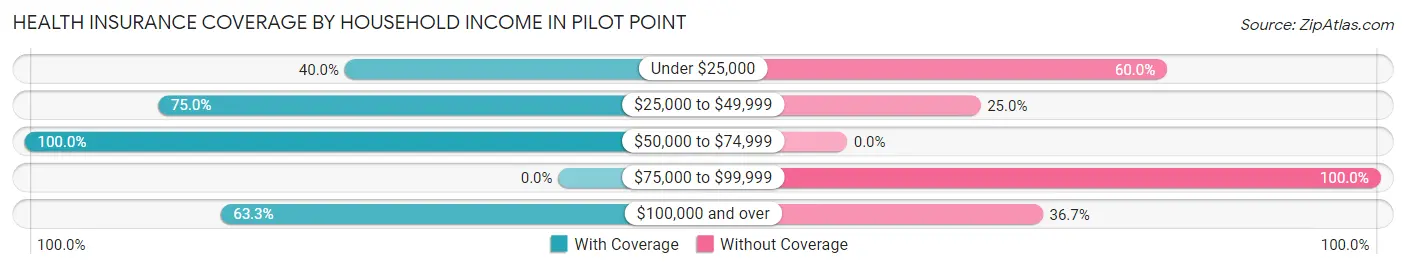
| Household Income | With Coverage | Without Coverage |
| Under $25,000 | 2 (40.0%) | 3 (60.0%) |
| $25,000 to $49,999 | 18 (75.0%) | 6 (25.0%) |
| $50,000 to $74,999 | 4 (100.0%) | 0 (0.0%) |
| $75,000 to $99,999 | 0 (0.0%) | 9 (100.0%) |
| $100,000 and over | 19 (63.3%) | 11 (36.7%) |
Public vs Private Health Insurance Coverage by Age in Pilot Point
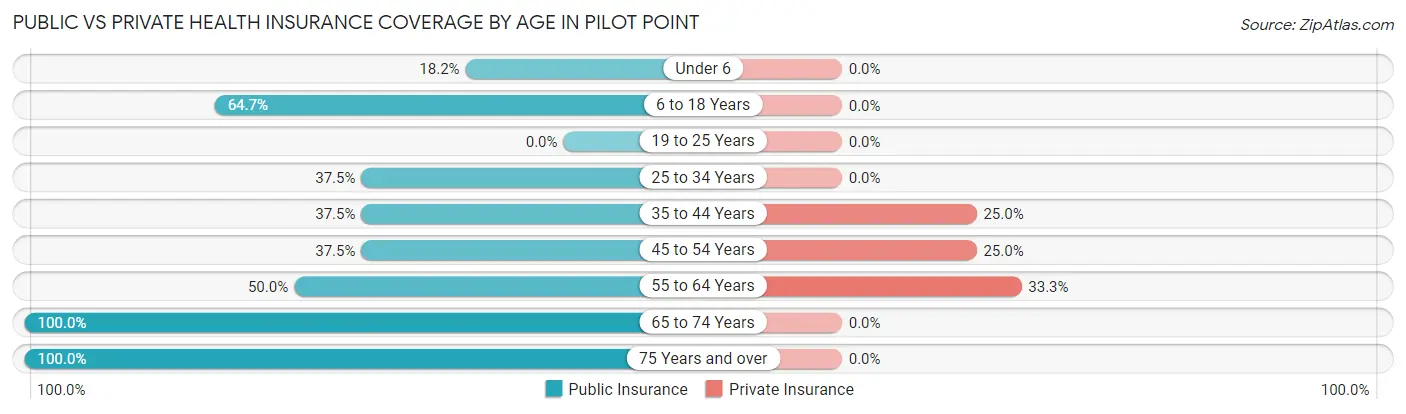
| Age Bracket | Public Insurance | Private Insurance |
| Under 6 | 2 (18.2%) | 0 (0.0%) |
| 6 to 18 Years | 11 (64.7%) | 0 (0.0%) |
| 19 to 25 Years | 0 (0.0%) | 0 (0.0%) |
| 25 to 34 Years | 3 (37.5%) | 0 (0.0%) |
| 35 to 44 Years | 3 (37.5%) | 2 (25.0%) |
| 45 to 54 Years | 3 (37.5%) | 2 (25.0%) |
| 55 to 64 Years | 3 (50.0%) | 2 (33.3%) |
| 65 to 74 Years | 10 (100.0%) | 0 (0.0%) |
| 75 Years and over | 4 (100.0%) | 0 (0.0%) |
| Total | 39 (54.2%) | 6 (8.3%) |
Disability Status by Sex by Age in Pilot Point
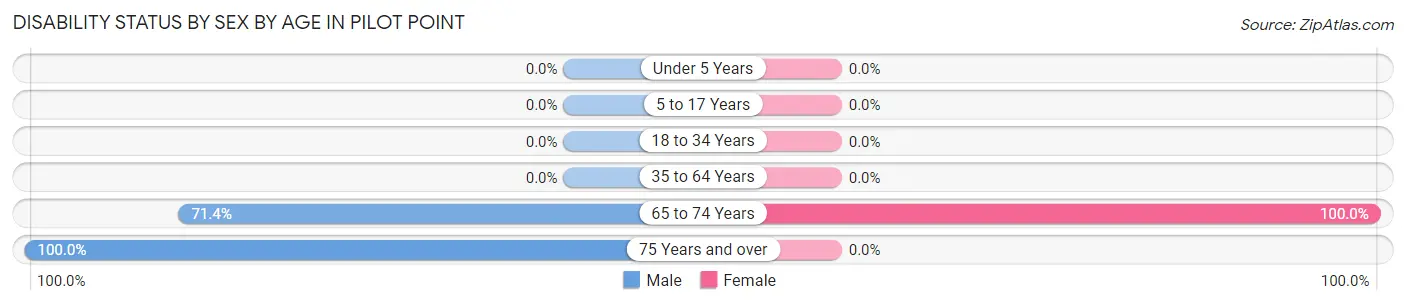
| Age Bracket | Male | Female |
| Under 5 Years | 0 (0.0%) | 0 (0.0%) |
| 5 to 17 Years | 0 (0.0%) | 0 (0.0%) |
| 18 to 34 Years | 0 (0.0%) | 0 (0.0%) |
| 35 to 64 Years | 0 (0.0%) | 0 (0.0%) |
| 65 to 74 Years | 5 (71.4%) | 3 (100.0%) |
| 75 Years and over | 4 (100.0%) | 0 (0.0%) |
Disability Class by Sex by Age in Pilot Point
Disability Class: Hearing Difficulty
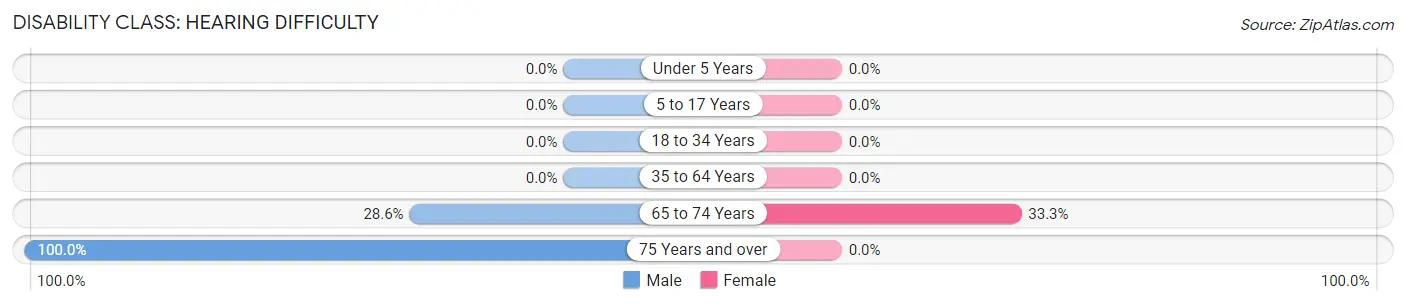
| Age Bracket | Male | Female |
| Under 5 Years | 0 (0.0%) | 0 (0.0%) |
| 5 to 17 Years | 0 (0.0%) | 0 (0.0%) |
| 18 to 34 Years | 0 (0.0%) | 0 (0.0%) |
| 35 to 64 Years | 0 (0.0%) | 0 (0.0%) |
| 65 to 74 Years | 2 (28.6%) | 1 (33.3%) |
| 75 Years and over | 4 (100.0%) | 0 (0.0%) |
Disability Class: Vision Difficulty
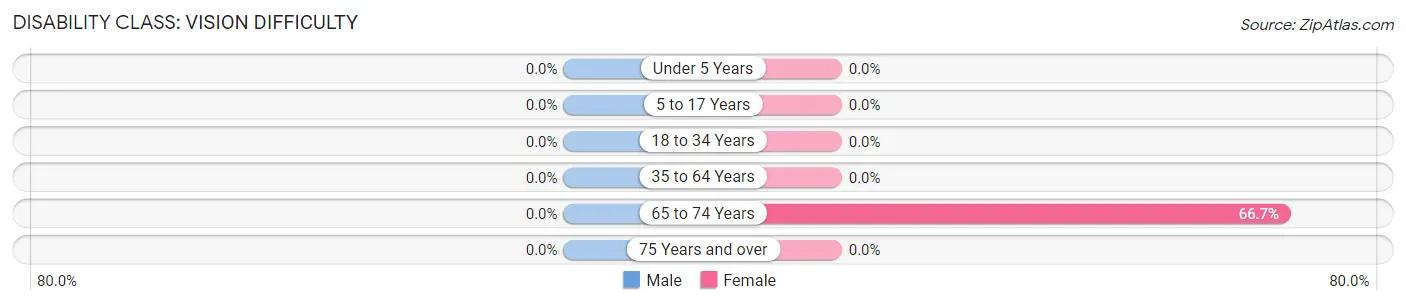
| Age Bracket | Male | Female |
| Under 5 Years | 0 (0.0%) | 0 (0.0%) |
| 5 to 17 Years | 0 (0.0%) | 0 (0.0%) |
| 18 to 34 Years | 0 (0.0%) | 0 (0.0%) |
| 35 to 64 Years | 0 (0.0%) | 0 (0.0%) |
| 65 to 74 Years | 0 (0.0%) | 2 (66.7%) |
| 75 Years and over | 0 (0.0%) | 0 (0.0%) |
Disability Class: Cognitive Difficulty
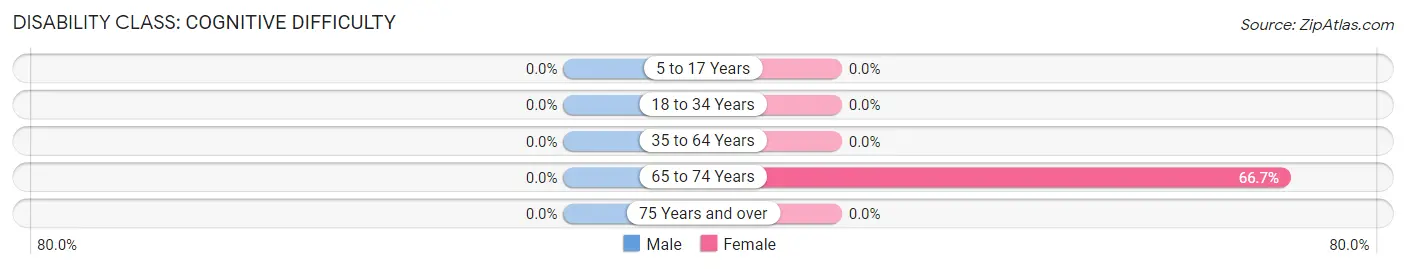
| Age Bracket | Male | Female |
| 5 to 17 Years | 0 (0.0%) | 0 (0.0%) |
| 18 to 34 Years | 0 (0.0%) | 0 (0.0%) |
| 35 to 64 Years | 0 (0.0%) | 0 (0.0%) |
| 65 to 74 Years | 0 (0.0%) | 2 (66.7%) |
| 75 Years and over | 0 (0.0%) | 0 (0.0%) |
Disability Class: Ambulatory Difficulty
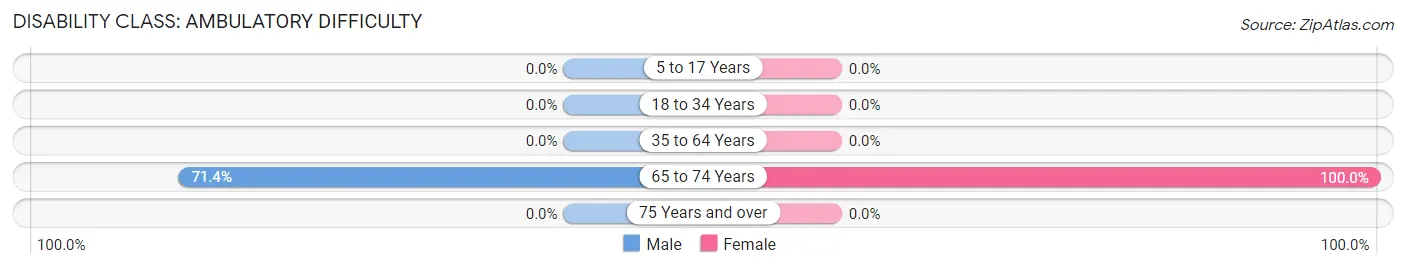
| Age Bracket | Male | Female |
| 5 to 17 Years | 0 (0.0%) | 0 (0.0%) |
| 18 to 34 Years | 0 (0.0%) | 0 (0.0%) |
| 35 to 64 Years | 0 (0.0%) | 0 (0.0%) |
| 65 to 74 Years | 5 (71.4%) | 3 (100.0%) |
| 75 Years and over | 0 (0.0%) | 0 (0.0%) |
Disability Class: Self-Care Difficulty
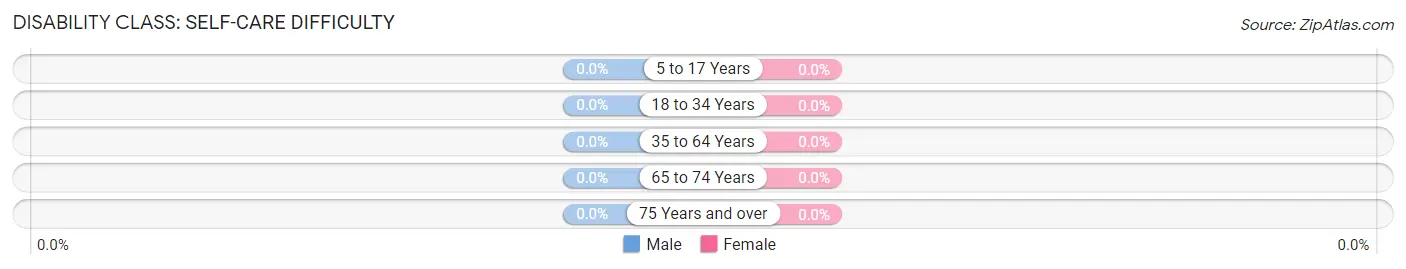
| Age Bracket | Male | Female |
| 5 to 17 Years | 0 (0.0%) | 0 (0.0%) |
| 18 to 34 Years | 0 (0.0%) | 0 (0.0%) |
| 35 to 64 Years | 0 (0.0%) | 0 (0.0%) |
| 65 to 74 Years | 0 (0.0%) | 0 (0.0%) |
| 75 Years and over | 0 (0.0%) | 0 (0.0%) |
Technology Access in Pilot Point
Computing Device Access in Pilot Point
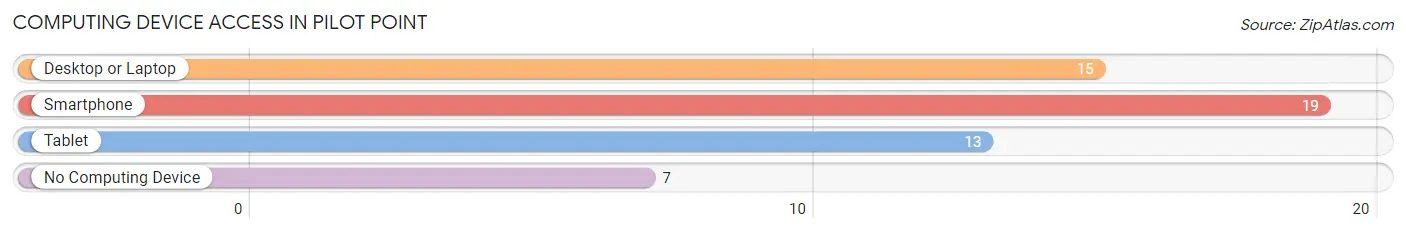
| Device Type | # Households | % Households |
| Desktop or Laptop | 15 | 55.6% |
| Smartphone | 19 | 70.4% |
| Tablet | 13 | 48.1% |
| No Computing Device | 7 | 25.9% |
| Total | 27 | 100.0% |
Internet Access in Pilot Point
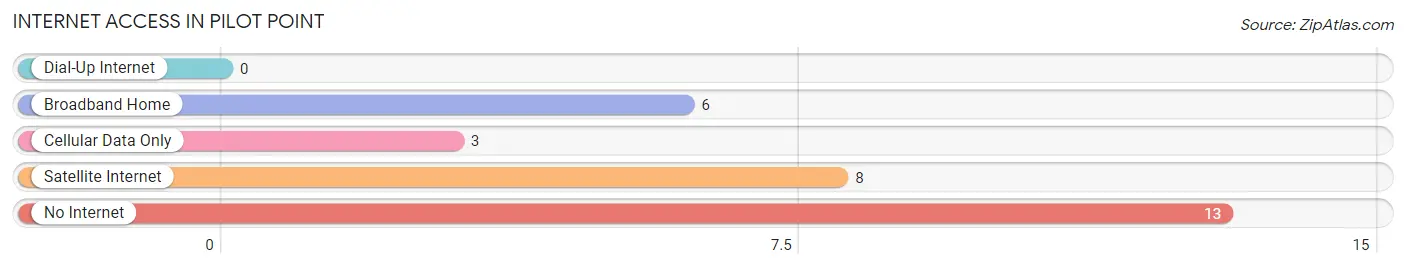
| Internet Type | # Households | % Households |
| Dial-Up Internet | 0 | 0.0% |
| Broadband Home | 6 | 22.2% |
| Cellular Data Only | 3 | 11.1% |
| Satellite Internet | 8 | 29.6% |
| No Internet | 13 | 48.1% |
| Total | 27 | 100.0% |
Pilot Point Summary
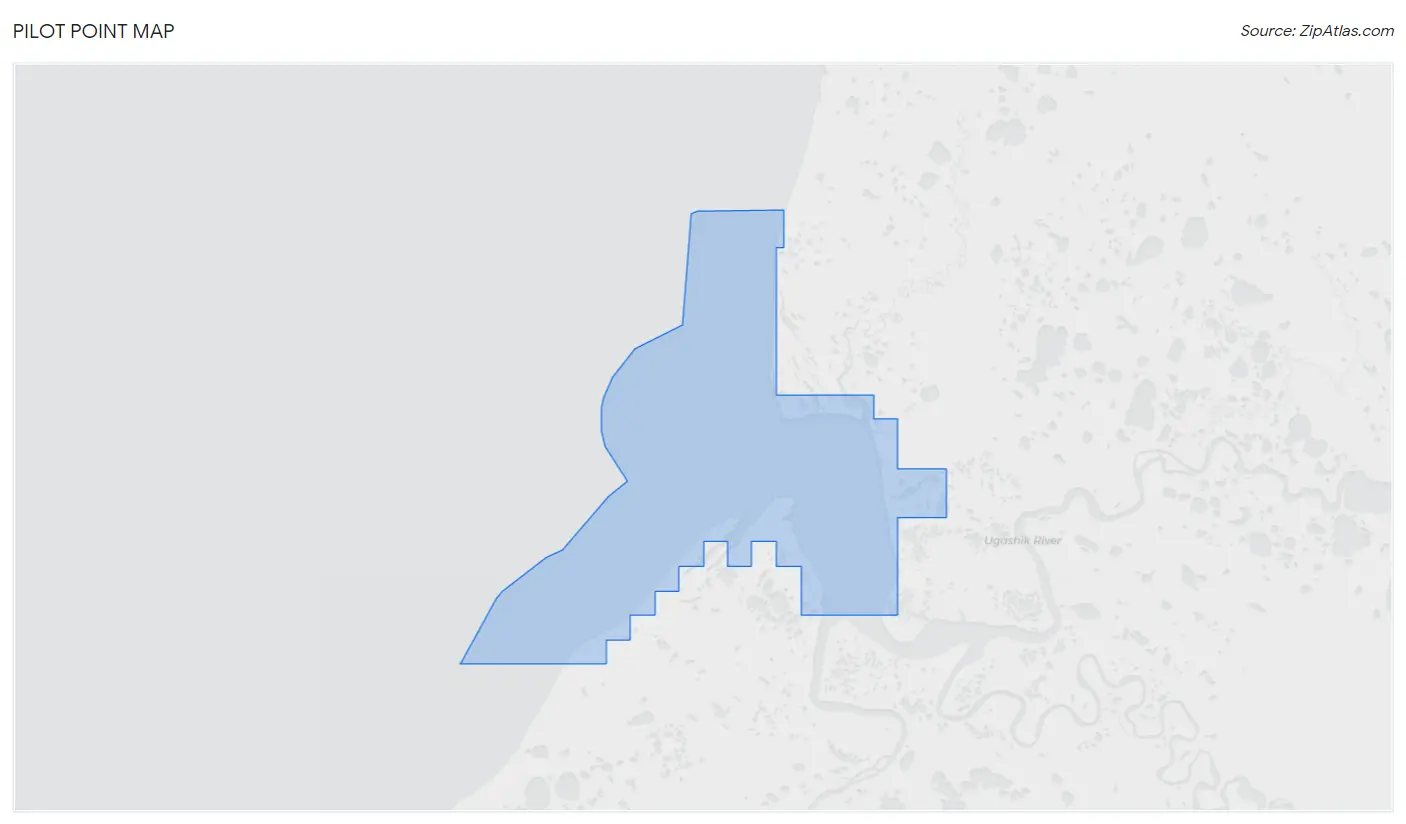
Pilot Point is a small unincorporated community located in the Aleutians East Borough of Alaska. It is situated on the eastern shore of the Alaska Peninsula, approximately 200 miles southwest of Anchorage. The community is located on the northern tip of the Alaska Peninsula, and is surrounded by the Bering Sea to the north and the Pacific Ocean to the south. Pilot Point is home to approximately 200 people, and is the only community in the Aleutians East Borough.
History
The area around Pilot Point has been inhabited by the Unangan people for thousands of years. The Unangan people are the indigenous people of the Aleutian Islands, and are believed to have first arrived in the area around 10,000 years ago. The Unangan people were semi-nomadic hunter-gatherers, and relied heavily on the abundant marine life in the area for sustenance.
The first European contact with the Unangan people in the area occurred in 1741, when the Russian explorer Vitus Bering arrived in the area. Bering and his crew were the first Europeans to set foot on the Alaska Peninsula, and they established a trading post in the area. The Unangan people were heavily impacted by the arrival of the Russians, and many of their traditional ways of life were disrupted.
In the late 1800s, the area around Pilot Point was settled by American and European fishermen. The fishermen were attracted to the area due to the abundance of fish in the waters around the Alaska Peninsula. The fishermen established a small fishing village in the area, which eventually became known as Pilot Point.
Geography
Pilot Point is located on the eastern shore of the Alaska Peninsula, approximately 200 miles southwest of Anchorage. The community is situated on a small peninsula, which is surrounded by the Bering Sea to the north and the Pacific Ocean to the south. The area around Pilot Point is mostly flat, with some low hills and mountains in the distance. The climate in the area is subarctic, with cold winters and mild summers.
Economy
The economy of Pilot Point is largely based on fishing and subsistence activities. The waters around the Alaska Peninsula are abundant with fish, and the local fishermen are able to make a living by harvesting the fish. The fish are then sold to local markets and restaurants, or exported to other parts of the state.
In addition to fishing, the local economy is also supported by subsistence activities. The Unangan people in the area rely heavily on subsistence activities, such as hunting and gathering, to supplement their diets. The Unangan people also rely on the local marine life for sustenance, and are able to harvest a variety of fish, shellfish, and other marine life from the waters around the Alaska Peninsula.
Demographics
As of the 2010 census, the population of Pilot Point was estimated to be around 200 people. The majority of the population is of Unangan descent, and the Unangan language is the primary language spoken in the community. The population is also largely Christian, with the majority of the population belonging to the Russian Orthodox Church.
The median household income in Pilot Point is around $30,000, which is significantly lower than the median household income in the state of Alaska. The poverty rate in the community is also higher than the state average, with around 25% of the population living below the poverty line.
Common Questions
What is Per Capita Income in Pilot Point?
Per Capita income in Pilot Point is $29,958.
What is the Median Family Income in Pilot Point?
Median Family Income in Pilot Point is $104,375.
What is the Median Household income in Pilot Point?
Median Household Income in Pilot Point is $59,375.
What is Income or Wage Gap in Pilot Point?
Income or Wage Gap in Pilot Point is 45.8%.
Women in Pilot Point earn 54.2 cents for every dollar earned by a man.
What is Inequality or Gini Index in Pilot Point?
Inequality or Gini Index in Pilot Point is 0.40.
What is the Total Population of Pilot Point?
Total Population of Pilot Point is 72.
What is the Total Male Population of Pilot Point?
Total Male Population of Pilot Point is 44.
What is the Total Female Population of Pilot Point?
Total Female Population of Pilot Point is 28.
What is the Ratio of Males per 100 Females in Pilot Point?
There are 157.14 Males per 100 Females in Pilot Point.
What is the Ratio of Females per 100 Males in Pilot Point?
There are 63.64 Females per 100 Males in Pilot Point.
What is the Median Population Age in Pilot Point?
Median Population Age in Pilot Point is 35.0 Years.
What is the Average Family Size in Pilot Point
Average Family Size in Pilot Point is 3.1 People.
What is the Average Household Size in Pilot Point
Average Household Size in Pilot Point is 2.7 People.
How Large is the Labor Force in Pilot Point?
There are 35 People in the Labor Forcein in Pilot Point.
What is the Percentage of People in the Labor Force in Pilot Point?
67.3% of People are in the Labor Force in Pilot Point.