Wrangell city and borough, AK Map & Demographics
Wrangell city and borough Overview
$35,421
PER CAPITA INCOME
$77,500
AVG FAMILY INCOME
$61,000
AVG HOUSEHOLD INCOME
4.1%
WAGE / INCOME GAP [ % ]
95.9¢/ $1
WAGE / INCOME GAP [ $ ]
0.41
INEQUALITY / GINI INDEX
2,134
TOTAL POPULATION
1,136
MALE POPULATION
998
FEMALE POPULATION
113.83
MALES / 100 FEMALES
87.85
FEMALES / 100 MALES
48.9
MEDIAN AGE
3.1
AVG FAMILY SIZE
2.2
AVG HOUSEHOLD SIZE
844
LABOR FORCE [ PEOPLE ]
49.3%
PERCENT IN LABOR FORCE
3.4%
UNEMPLOYMENT RATE
Income in Wrangell city and borough
Income Overview in Wrangell city and borough
Per Capita Income in Wrangell city and borough is $35,421, while median incomes of families and households are $77,500 and $61,000 respectively.
| Characteristic | Number | Measure |
| Per Capita Income | 2,134 | $35,421 |
| Median Family Income | 498 | $77,500 |
| Mean Family Income | 498 | $100,313 |
| Median Household Income | 928 | $61,000 |
| Mean Household Income | 928 | $80,656 |
| Income Deficit | 498 | $0 |
| Wage / Income Gap (%) | 2,134 | 4.14% |
| Wage / Income Gap ($) | 2,134 | 95.86¢ per $1 |
| Gini / Inequality Index | 2,134 | 0.41 |
Earnings by Sex in Wrangell city and borough
Average Earnings in Wrangell city and borough are $43,664, $44,226 for men and $42,396 for women, a difference of 4.1%.
| Sex | Number | Average Earnings |
| Male | 551 (53.5%) | $44,226 |
| Female | 478 (46.5%) | $42,396 |
| Total | 1,029 (100.0%) | $43,664 |
Earnings by Sex by Income Bracket in Wrangell city and borough
The most common earnings brackets in Wrangell city and borough are $100,000+ for men (92 | 16.7%) and $55,000 to $64,999 for women (58 | 12.1%).
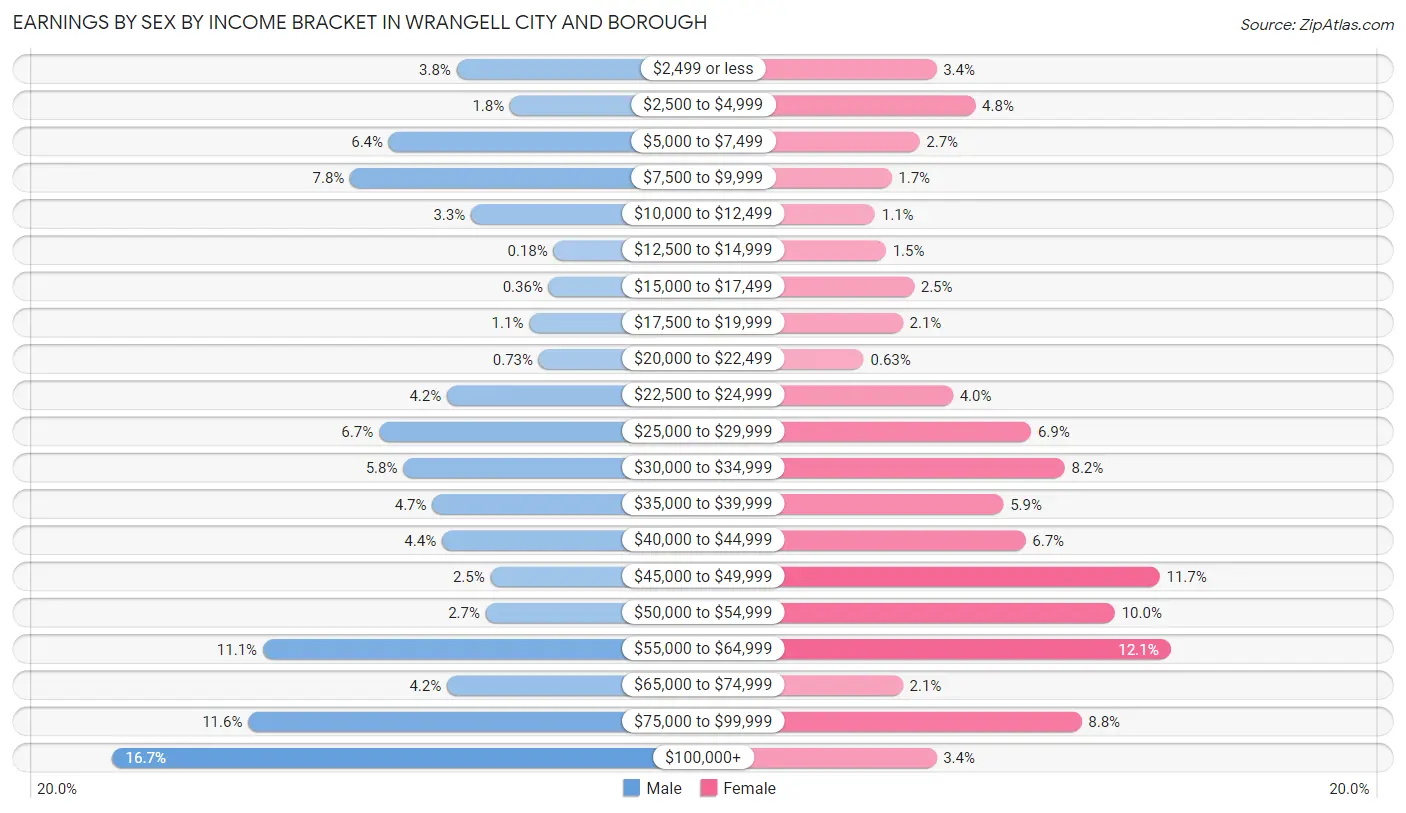
| Income | Male | Female |
| $2,499 or less | 21 (3.8%) | 16 (3.4%) |
| $2,500 to $4,999 | 10 (1.8%) | 23 (4.8%) |
| $5,000 to $7,499 | 35 (6.4%) | 13 (2.7%) |
| $7,500 to $9,999 | 43 (7.8%) | 8 (1.7%) |
| $10,000 to $12,499 | 18 (3.3%) | 5 (1.1%) |
| $12,500 to $14,999 | 1 (0.2%) | 7 (1.5%) |
| $15,000 to $17,499 | 2 (0.4%) | 12 (2.5%) |
| $17,500 to $19,999 | 6 (1.1%) | 10 (2.1%) |
| $20,000 to $22,499 | 4 (0.7%) | 3 (0.6%) |
| $22,500 to $24,999 | 23 (4.2%) | 19 (4.0%) |
| $25,000 to $29,999 | 37 (6.7%) | 33 (6.9%) |
| $30,000 to $34,999 | 32 (5.8%) | 39 (8.2%) |
| $35,000 to $39,999 | 26 (4.7%) | 28 (5.9%) |
| $40,000 to $44,999 | 24 (4.4%) | 32 (6.7%) |
| $45,000 to $49,999 | 14 (2.5%) | 56 (11.7%) |
| $50,000 to $54,999 | 15 (2.7%) | 48 (10.0%) |
| $55,000 to $64,999 | 61 (11.1%) | 58 (12.1%) |
| $65,000 to $74,999 | 23 (4.2%) | 10 (2.1%) |
| $75,000 to $99,999 | 64 (11.6%) | 42 (8.8%) |
| $100,000+ | 92 (16.7%) | 16 (3.4%) |
| Total | 551 (100.0%) | 478 (100.0%) |
Earnings by Sex by Educational Attainment in Wrangell city and borough
Average earnings in Wrangell city and borough are $54,821 for men and $45,750 for women, a difference of 16.6%. Men with an educational attainment of graduate degree enjoy the highest average annual earnings of $86,250, while those with college or associate's degree education earn the least with $55,703. Women with an educational attainment of graduate degree earn the most with the average annual earnings of $50,417, while those with less than high school education have the smallest earnings of $15,417.
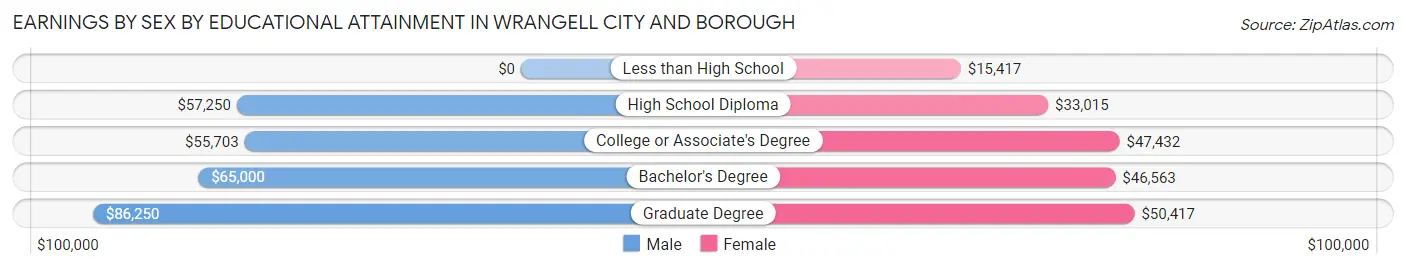
| Educational Attainment | Male Income | Female Income |
| Less than High School | - | - |
| High School Diploma | $57,250 | $33,015 |
| College or Associate's Degree | $55,703 | $47,432 |
| Bachelor's Degree | $65,000 | $46,563 |
| Graduate Degree | $86,250 | $50,417 |
| Total | $54,821 | $45,750 |
Family Income in Wrangell city and borough
Family Income Brackets in Wrangell city and borough
According to the Wrangell city and borough family income data, there are 99 families falling into the $35,000 to $49,999 income range, which is the most common income bracket and makes up 19.9% of all families. Conversely, the $10,000 to $14,999 income bracket is the least frequent group with only 1 families (0.2%) belonging to this category.
| Income Bracket | # Families | % Families |
| Less than $10,000 | 22 | 4.4% |
| $10,000 to $14,999 | 1 | 0.2% |
| $15,000 to $24,999 | 8 | 1.6% |
| $25,000 to $34,999 | 21 | 4.2% |
| $35,000 to $49,999 | 99 | 19.9% |
| $50,000 to $74,999 | 95 | 19.1% |
| $75,000 to $99,999 | 72 | 14.5% |
| $100,000 to $149,999 | 81 | 16.3% |
| $150,000 to $199,999 | 55 | 11.0% |
| $200,000+ | 44 | 8.8% |
Family Income by Famaliy Size in Wrangell city and borough
5-person families (53 | 10.6%) account for the highest median family income in Wrangell city and borough with $148,047 per family, while 2-person families (283 | 56.8%) have the highest median income of $33,958 per family member.
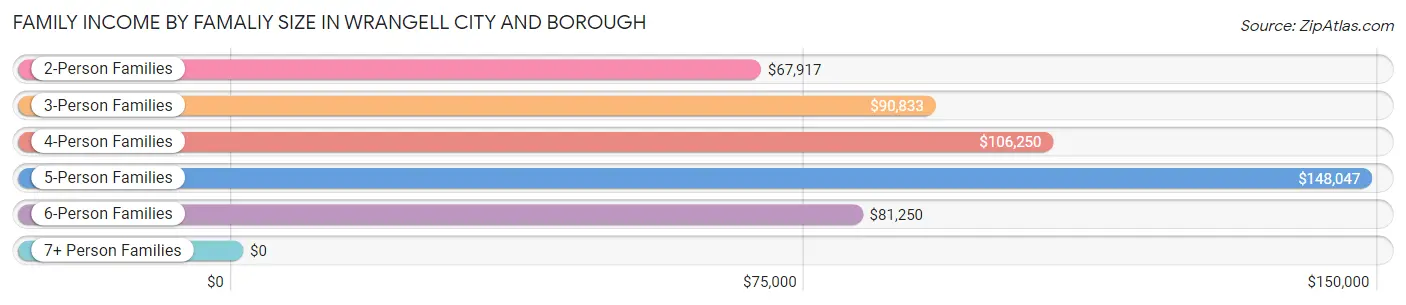
| Income Bracket | # Families | Median Income |
| 2-Person Families | 283 (56.8%) | $67,917 |
| 3-Person Families | 106 (21.3%) | $90,833 |
| 4-Person Families | 49 (9.8%) | $106,250 |
| 5-Person Families | 53 (10.6%) | $148,047 |
| 6-Person Families | 7 (1.4%) | $81,250 |
| 7+ Person Families | 0 (0.0%) | $0 |
| Total | 498 (100.0%) | $77,500 |
Family Income by Number of Earners in Wrangell city and borough
The median family income in Wrangell city and borough is $77,500, with families comprising 3+ earners (59) having the highest median family income of $165,893, while families with no earners (126) have the lowest median family income of $49,318, accounting for 11.8% and 25.3% of families, respectively.
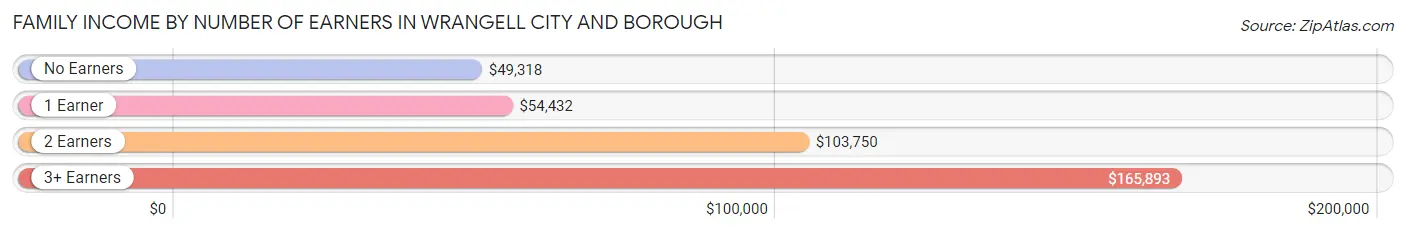
| Number of Earners | # Families | Median Income |
| No Earners | 126 (25.3%) | $49,318 |
| 1 Earner | 161 (32.3%) | $54,432 |
| 2 Earners | 152 (30.5%) | $103,750 |
| 3+ Earners | 59 (11.8%) | $165,893 |
| Total | 498 (100.0%) | $77,500 |
Household Income in Wrangell city and borough
Household Income Brackets in Wrangell city and borough
With 169 households falling in the category, the $35,000 to $49,999 income range is the most frequent in Wrangell city and borough, accounting for 18.2% of all households. In contrast, only 8 households (0.9%) fall into the $10,000 to $14,999 income bracket, making it the least populous group.
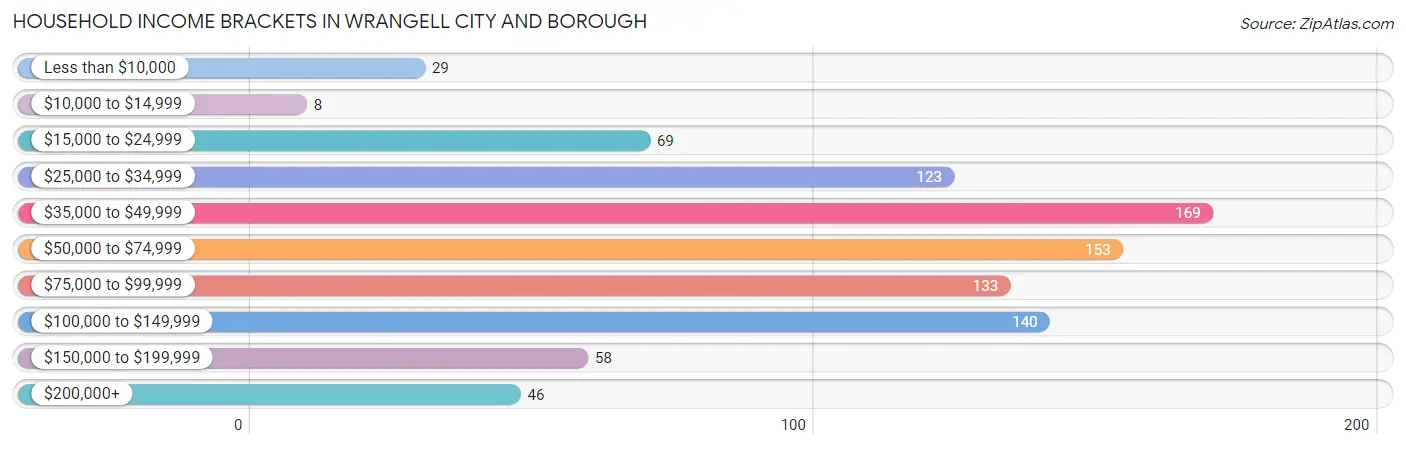
| Income Bracket | # Households | % Households |
| Less than $10,000 | 29 | 3.1% |
| $10,000 to $14,999 | 8 | 0.9% |
| $15,000 to $24,999 | 69 | 7.4% |
| $25,000 to $34,999 | 123 | 13.3% |
| $35,000 to $49,999 | 169 | 18.2% |
| $50,000 to $74,999 | 153 | 16.5% |
| $75,000 to $99,999 | 133 | 14.3% |
| $100,000 to $149,999 | 140 | 15.1% |
| $150,000 to $199,999 | 58 | 6.3% |
| $200,000+ | 46 | 5.0% |
Household Income by Householder Age in Wrangell city and borough
The median household income in Wrangell city and borough is $61,000, with the highest median household income of $82,708 found in the 45 to 64 years age bracket for the primary householder. A total of 325 households (35.0%) fall into this category. Meanwhile, the 15 to 24 years age bracket for the primary householder has the lowest median household income of $0, with 23 households (2.5%) in this group.
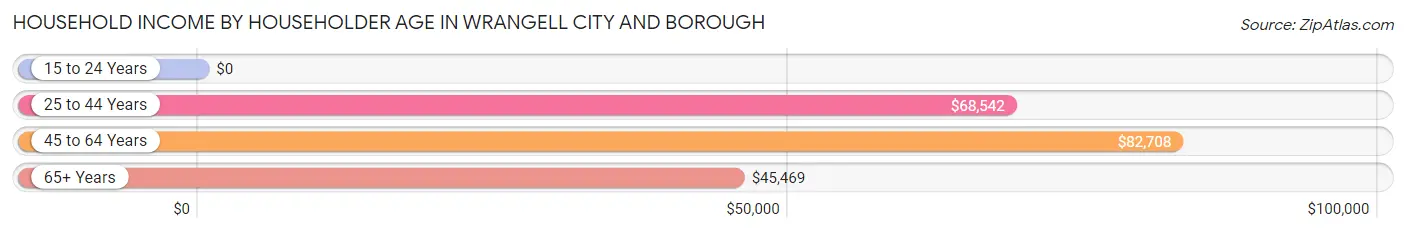
| Income Bracket | # Households | Median Income |
| 15 to 24 Years | 23 (2.5%) | $0 |
| 25 to 44 Years | 207 (22.3%) | $68,542 |
| 45 to 64 Years | 325 (35.0%) | $82,708 |
| 65+ Years | 373 (40.2%) | $45,469 |
| Total | 928 (100.0%) | $61,000 |
Poverty in Wrangell city and borough
Income Below Poverty by Sex and Age in Wrangell city and borough
With 8.5% poverty level for males and 11.9% for females among the residents of Wrangell city and borough, 5 year old males and 6 to 11 year old females are the most vulnerable to poverty, with 6 males (75.0%) and 28 females (32.9%) in their respective age groups living below the poverty level.
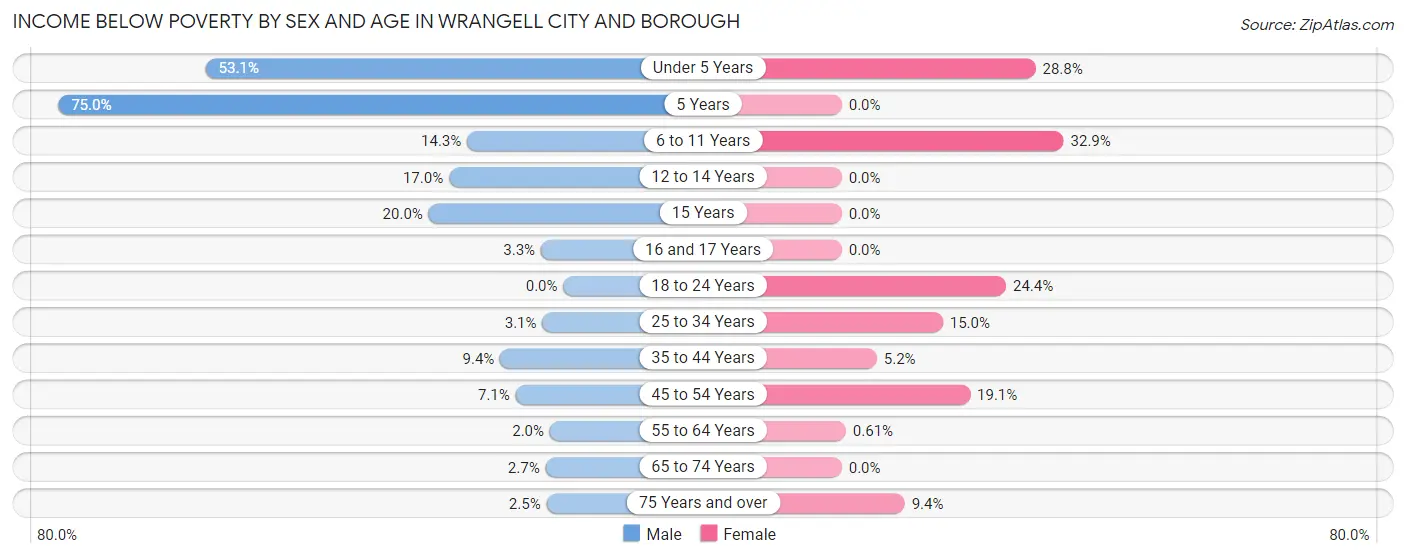
| Age Bracket | Male | Female |
| Under 5 Years | 34 (53.1%) | 21 (28.8%) |
| 5 Years | 6 (75.0%) | 0 (0.0%) |
| 6 to 11 Years | 9 (14.3%) | 28 (32.9%) |
| 12 to 14 Years | 9 (17.0%) | 0 (0.0%) |
| 15 Years | 6 (20.0%) | 0 (0.0%) |
| 16 and 17 Years | 1 (3.3%) | 0 (0.0%) |
| 18 to 24 Years | 0 (0.0%) | 10 (24.4%) |
| 25 to 34 Years | 4 (3.1%) | 18 (15.0%) |
| 35 to 44 Years | 6 (9.4%) | 5 (5.2%) |
| 45 to 54 Years | 9 (7.1%) | 24 (19.1%) |
| 55 to 64 Years | 3 (2.0%) | 1 (0.6%) |
| 65 to 74 Years | 5 (2.6%) | 0 (0.0%) |
| 75 Years and over | 4 (2.5%) | 10 (9.3%) |
| Total | 96 (8.5%) | 117 (11.9%) |
Income Above Poverty by Sex and Age in Wrangell city and borough
According to the poverty statistics in Wrangell city and borough, males aged 18 to 24 years and females aged 5 years are the age groups that are most secure financially, with 100.0% of males and 100.0% of females in these age groups living above the poverty line.
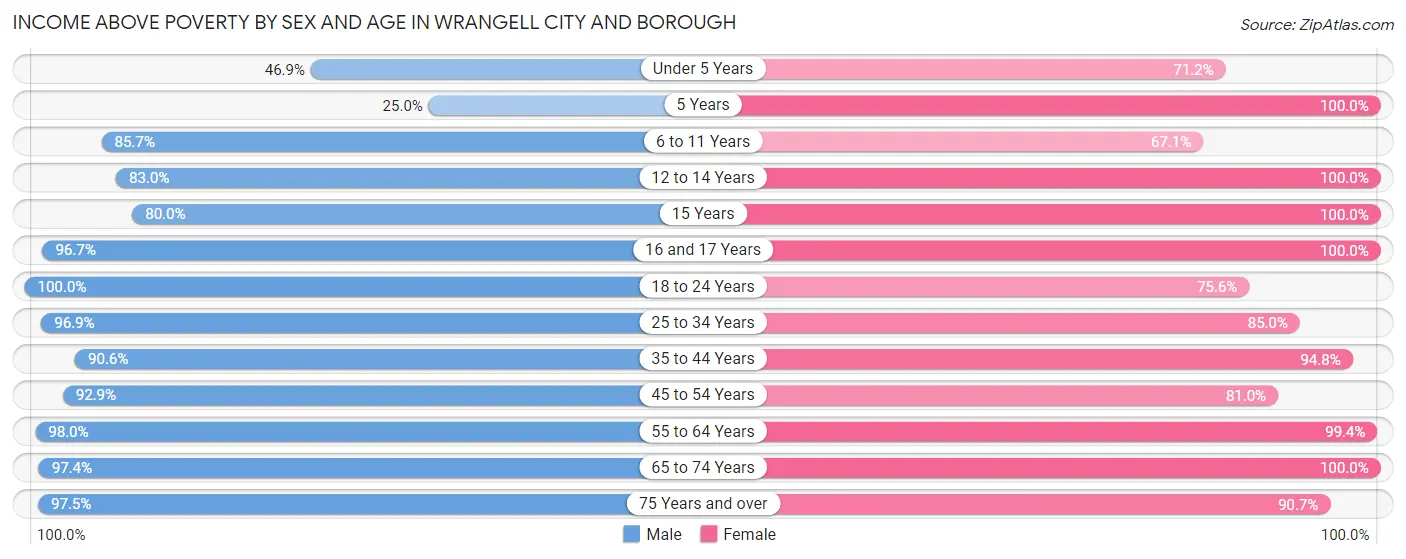
| Age Bracket | Male | Female |
| Under 5 Years | 30 (46.9%) | 52 (71.2%) |
| 5 Years | 2 (25.0%) | 5 (100.0%) |
| 6 to 11 Years | 54 (85.7%) | 57 (67.1%) |
| 12 to 14 Years | 44 (83.0%) | 32 (100.0%) |
| 15 Years | 24 (80.0%) | 5 (100.0%) |
| 16 and 17 Years | 29 (96.7%) | 19 (100.0%) |
| 18 to 24 Years | 62 (100.0%) | 31 (75.6%) |
| 25 to 34 Years | 124 (96.9%) | 102 (85.0%) |
| 35 to 44 Years | 58 (90.6%) | 91 (94.8%) |
| 45 to 54 Years | 118 (92.9%) | 102 (80.9%) |
| 55 to 64 Years | 147 (98.0%) | 162 (99.4%) |
| 65 to 74 Years | 184 (97.4%) | 110 (100.0%) |
| 75 Years and over | 156 (97.5%) | 97 (90.6%) |
| Total | 1,032 (91.5%) | 865 (88.1%) |
Income Below Poverty Among Married-Couple Families in Wrangell city and borough
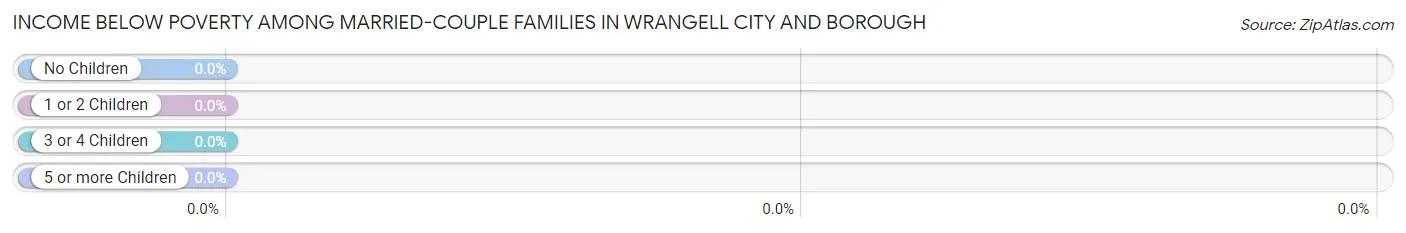
| Children | Above Poverty | Below Poverty |
| No Children | 282 (100.0%) | 0 (0.0%) |
| 1 or 2 Children | 81 (100.0%) | 0 (0.0%) |
| 3 or 4 Children | 31 (100.0%) | 0 (0.0%) |
| 5 or more Children | 0 (0.0%) | 0 (0.0%) |
| Total | 394 (100.0%) | 0 (0.0%) |
Income Below Poverty Among Single-Parent Households in Wrangell city and borough
According to the poverty data in Wrangell city and borough, 39.1% or 9 single-father households and 22.2% or 18 single-mother households are living below the poverty line. Among single-father households, those with 1 or 2 children have the highest poverty rate, with 9 households (56.2%) experiencing poverty. Likewise, among single-mother households, those with 3 or 4 children have the highest poverty rate, with 16 households (88.9%) falling below the poverty line.
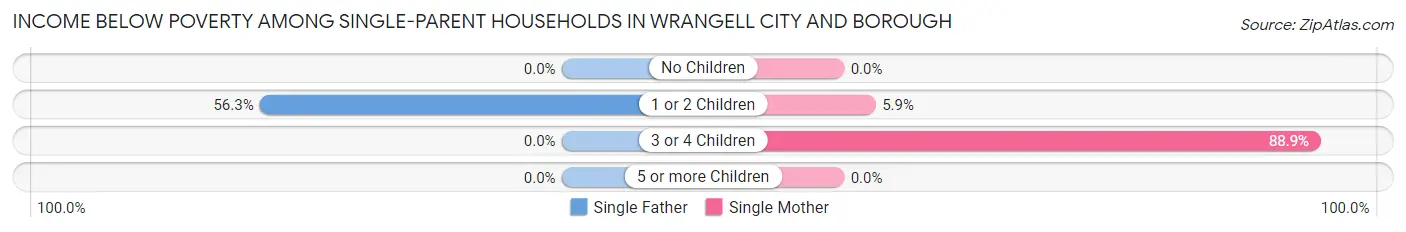
| Children | Single Father | Single Mother |
| No Children | 0 (0.0%) | 0 (0.0%) |
| 1 or 2 Children | 9 (56.2%) | 2 (5.9%) |
| 3 or 4 Children | 0 (0.0%) | 16 (88.9%) |
| 5 or more Children | 0 (0.0%) | 0 (0.0%) |
| Total | 9 (39.1%) | 18 (22.2%) |
Income Below Poverty Among Married-Couple vs Single-Parent Households in Wrangell city and borough
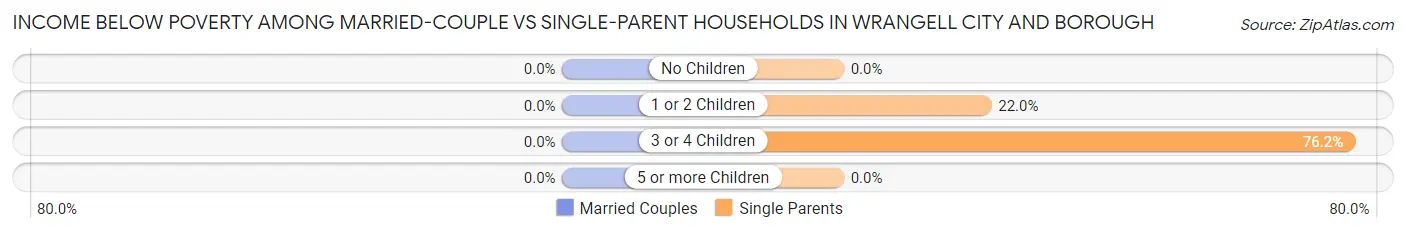
| Children | Married-Couple Families | Single-Parent Households |
| No Children | 0 (0.0%) | 0 (0.0%) |
| 1 or 2 Children | 0 (0.0%) | 11 (22.0%) |
| 3 or 4 Children | 0 (0.0%) | 16 (76.2%) |
| 5 or more Children | 0 (0.0%) | 0 (0.0%) |
| Total | 0 (0.0%) | 27 (26.0%) |
Race in Wrangell city and borough
The most populous races in Wrangell city and borough are White / Caucasian (1,216 | 57.0%), Native / Alaskan (488 | 22.9%), and Two or more Races (344 | 16.1%).
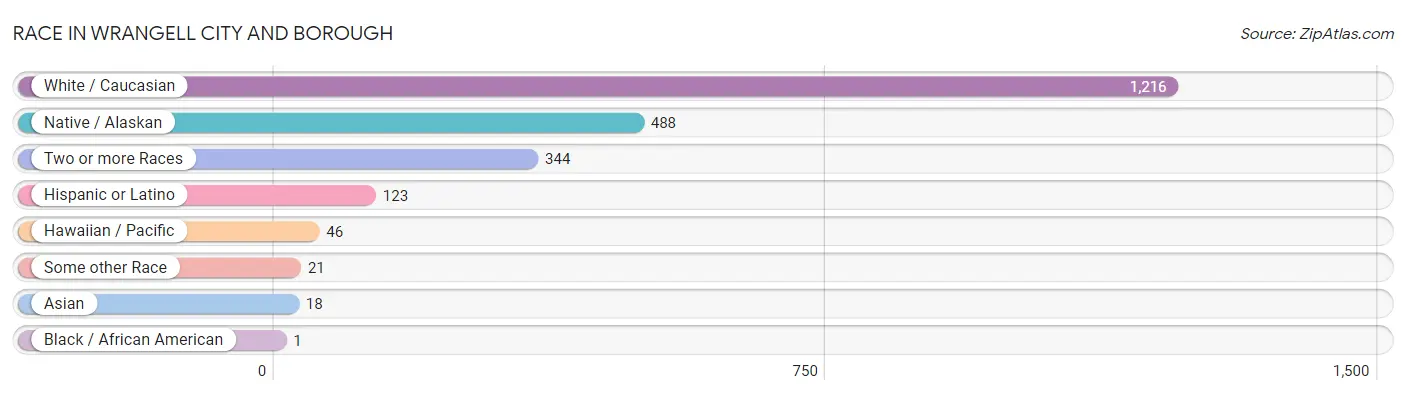
| Race | # Population | % Population |
| Asian | 18 | 0.8% |
| Black / African American | 1 | 0.1% |
| Hawaiian / Pacific | 46 | 2.2% |
| Hispanic or Latino | 123 | 5.8% |
| Native / Alaskan | 488 | 22.9% |
| White / Caucasian | 1,216 | 57.0% |
| Two or more Races | 344 | 16.1% |
| Some other Race | 21 | 1.0% |
| Total | 2,134 | 100.0% |
Ancestry in Wrangell city and borough
The most populous ancestries reported in Wrangell city and borough are Tlingit-Haida (453 | 21.2%), German (384 | 18.0%), English (251 | 11.8%), Irish (221 | 10.4%), and Norwegian (203 | 9.5%), together accounting for 70.9% of all Wrangell city and borough residents.
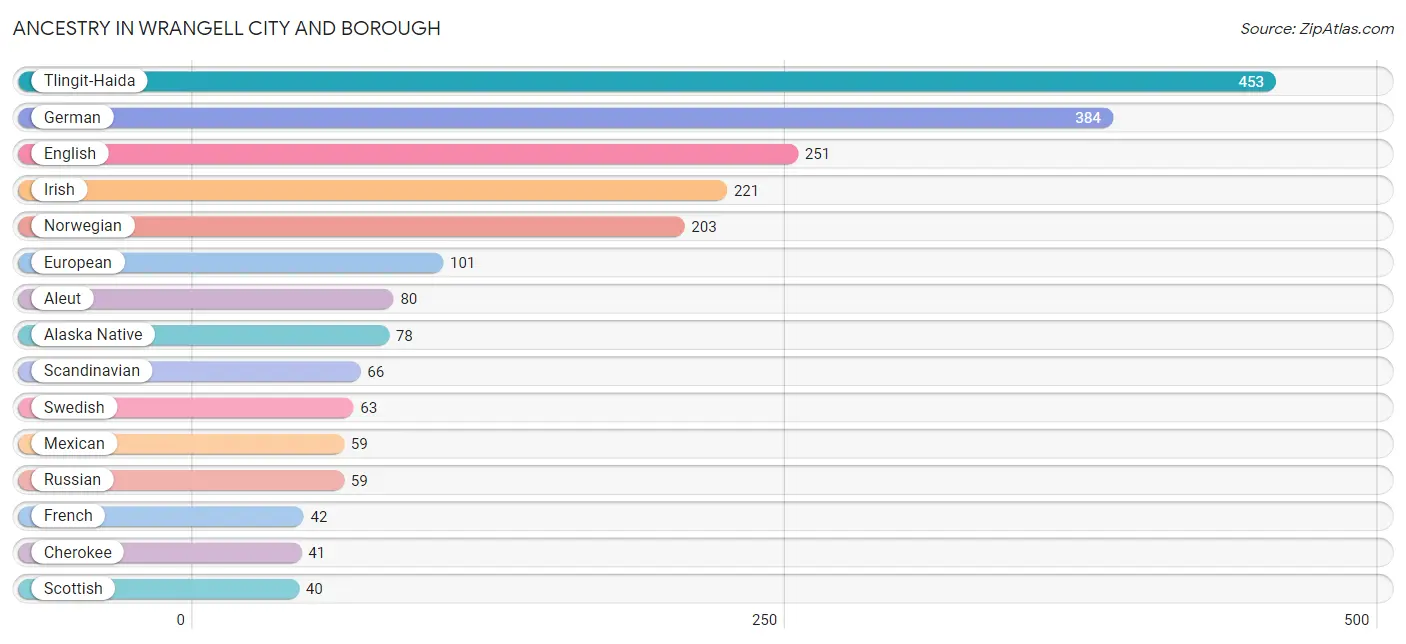
| Ancestry | # Population | % Population |
| Alaska Native | 78 | 3.7% |
| Alaskan Athabascan | 7 | 0.3% |
| Aleut | 80 | 3.7% |
| American | 21 | 1.0% |
| Arab | 4 | 0.2% |
| Austrian | 3 | 0.1% |
| Belgian | 7 | 0.3% |
| Blackfeet | 23 | 1.1% |
| British | 14 | 0.7% |
| Burmese | 11 | 0.5% |
| Canadian | 20 | 0.9% |
| Central American | 16 | 0.7% |
| Cherokee | 41 | 1.9% |
| Chippewa | 17 | 0.8% |
| Choctaw | 7 | 0.3% |
| Croatian | 3 | 0.1% |
| Cuban | 13 | 0.6% |
| Czech | 37 | 1.7% |
| Danish | 7 | 0.3% |
| Dutch | 31 | 1.5% |
| Eastern European | 8 | 0.4% |
| English | 251 | 11.8% |
| Ethiopian | 1 | 0.1% |
| European | 101 | 4.7% |
| Finnish | 9 | 0.4% |
| French | 42 | 2.0% |
| French American Indian | 38 | 1.8% |
| French Canadian | 10 | 0.5% |
| German | 384 | 18.0% |
| Greek | 8 | 0.4% |
| Hungarian | 2 | 0.1% |
| Indian (Asian) | 3 | 0.1% |
| Inupiat | 2 | 0.1% |
| Irish | 221 | 10.4% |
| Italian | 9 | 0.4% |
| Korean | 24 | 1.1% |
| Menominee | 6 | 0.3% |
| Mexican | 59 | 2.8% |
| Mexican American Indian | 5 | 0.2% |
| Native Hawaiian | 14 | 0.7% |
| New Zealander | 5 | 0.2% |
| Norwegian | 203 | 9.5% |
| Pakistani | 10 | 0.5% |
| Polish | 9 | 0.4% |
| Puerto Rican | 6 | 0.3% |
| Russian | 59 | 2.8% |
| Salvadoran | 16 | 0.7% |
| Samoan | 1 | 0.1% |
| Scandinavian | 66 | 3.1% |
| Scotch-Irish | 35 | 1.6% |
| Scottish | 40 | 1.9% |
| Sioux | 2 | 0.1% |
| Slavic | 3 | 0.1% |
| Spaniard | 18 | 0.8% |
| Spanish | 10 | 0.5% |
| Subsaharan African | 1 | 0.1% |
| Swedish | 63 | 2.9% |
| Swiss | 5 | 0.2% |
| Syrian | 2 | 0.1% |
| Thai | 1 | 0.1% |
| Tlingit-Haida | 453 | 21.2% |
| Tsimshian | 16 | 0.7% |
| Ukrainian | 4 | 0.2% |
| Welsh | 9 | 0.4% |
| Yakama | 2 | 0.1% |
| Yup'ik | 6 | 0.3% | View All 66 Rows |
Immigrants in Wrangell city and borough
The most numerous immigrant groups reported in Wrangell city and borough came from Latin America (32 | 1.5%), Central America (19 | 0.9%), Mexico (18 | 0.8%), Asia (17 | 0.8%), and South Eastern Asia (17 | 0.8%), together accounting for 4.8% of all Wrangell city and borough residents.
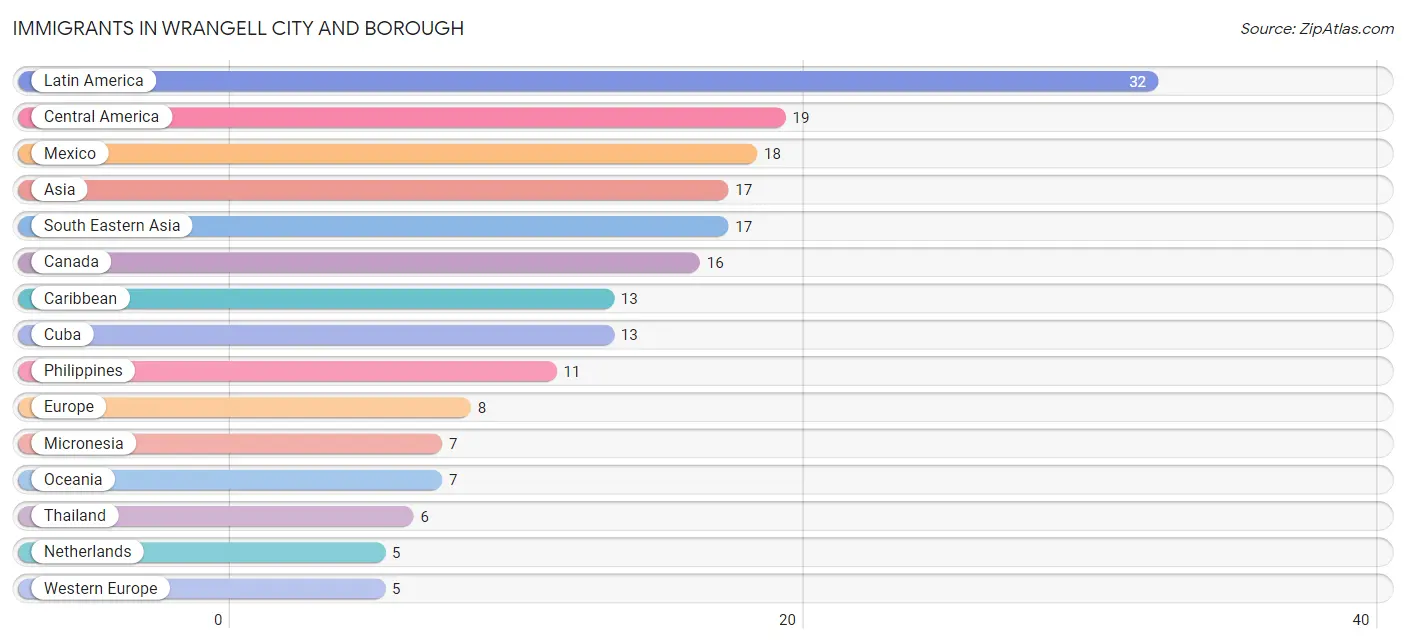
| Immigration Origin | # Population | % Population |
| Asia | 17 | 0.8% |
| Canada | 16 | 0.7% |
| Caribbean | 13 | 0.6% |
| Central America | 19 | 0.9% |
| Cuba | 13 | 0.6% |
| El Salvador | 1 | 0.1% |
| Europe | 8 | 0.4% |
| Latin America | 32 | 1.5% |
| Mexico | 18 | 0.8% |
| Micronesia | 7 | 0.3% |
| Netherlands | 5 | 0.2% |
| Northern Europe | 1 | 0.1% |
| Oceania | 7 | 0.3% |
| Philippines | 11 | 0.5% |
| South Eastern Asia | 17 | 0.8% |
| Southern Europe | 2 | 0.1% |
| Spain | 2 | 0.1% |
| Thailand | 6 | 0.3% |
| Western Europe | 5 | 0.2% | View All 19 Rows |
Sex and Age in Wrangell city and borough
Sex and Age in Wrangell city and borough
The most populous age groups in Wrangell city and borough are 65 to 69 Years (104 | 9.1%) for men and 55 to 59 Years (85 | 8.5%) for women.
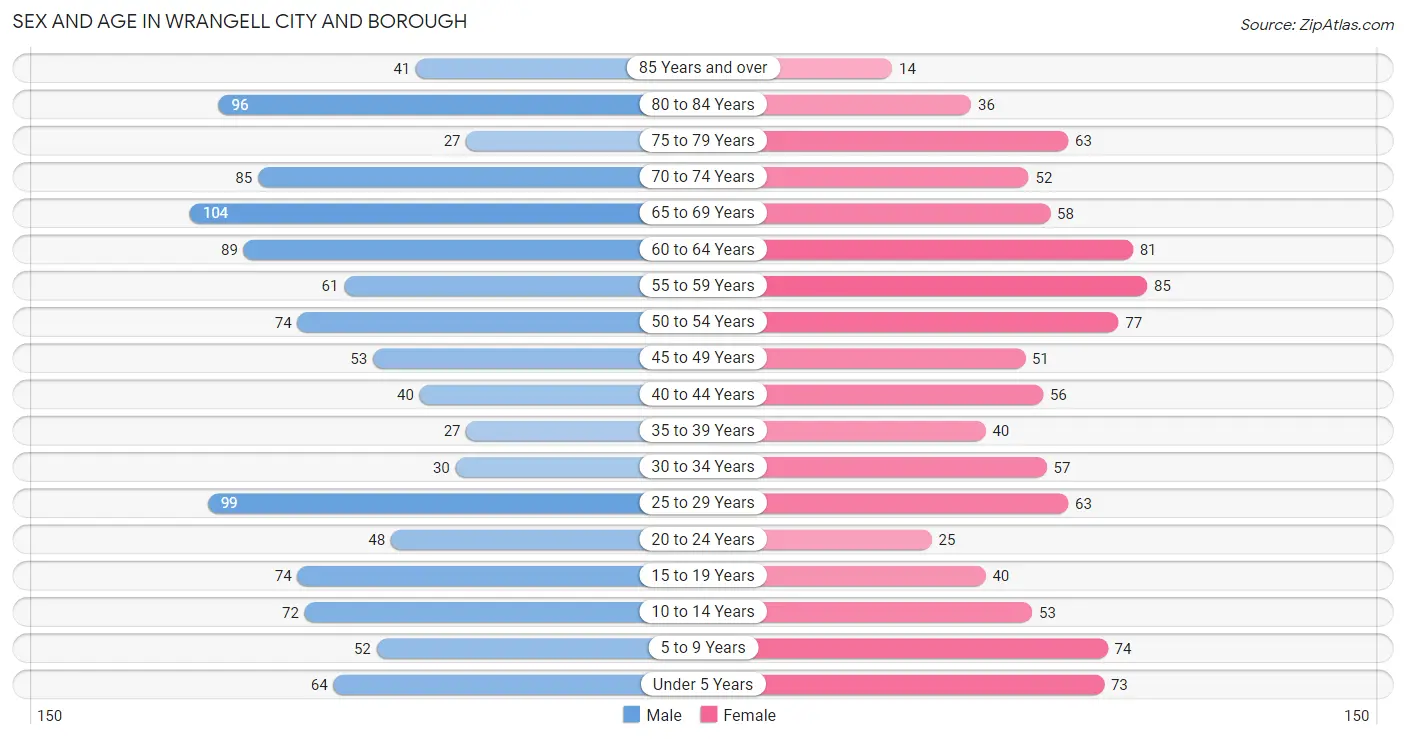
| Age Bracket | Male | Female |
| Under 5 Years | 64 (5.6%) | 73 (7.3%) |
| 5 to 9 Years | 52 (4.6%) | 74 (7.4%) |
| 10 to 14 Years | 72 (6.3%) | 53 (5.3%) |
| 15 to 19 Years | 74 (6.5%) | 40 (4.0%) |
| 20 to 24 Years | 48 (4.2%) | 25 (2.5%) |
| 25 to 29 Years | 99 (8.7%) | 63 (6.3%) |
| 30 to 34 Years | 30 (2.6%) | 57 (5.7%) |
| 35 to 39 Years | 27 (2.4%) | 40 (4.0%) |
| 40 to 44 Years | 40 (3.5%) | 56 (5.6%) |
| 45 to 49 Years | 53 (4.7%) | 51 (5.1%) |
| 50 to 54 Years | 74 (6.5%) | 77 (7.7%) |
| 55 to 59 Years | 61 (5.4%) | 85 (8.5%) |
| 60 to 64 Years | 89 (7.8%) | 81 (8.1%) |
| 65 to 69 Years | 104 (9.1%) | 58 (5.8%) |
| 70 to 74 Years | 85 (7.5%) | 52 (5.2%) |
| 75 to 79 Years | 27 (2.4%) | 63 (6.3%) |
| 80 to 84 Years | 96 (8.5%) | 36 (3.6%) |
| 85 Years and over | 41 (3.6%) | 14 (1.4%) |
| Total | 1,136 (100.0%) | 998 (100.0%) |
Families and Households in Wrangell city and borough
Median Family Size in Wrangell city and borough
The median family size in Wrangell city and borough is 3.08 persons per family, with single male/father families (23 | 4.6%) accounting for the largest median family size of 4.17 persons per family. On the other hand, married-couple families (394 | 79.1%) represent the smallest median family size with 2.84 persons per family.
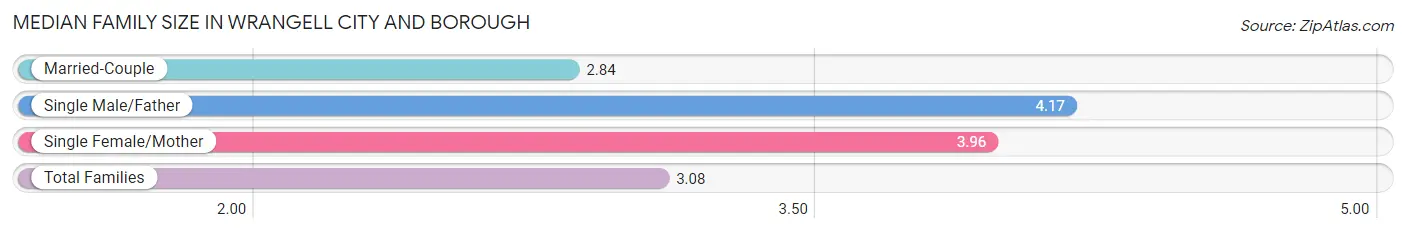
| Family Type | # Families | Family Size |
| Married-Couple | 394 (79.1%) | 2.84 |
| Single Male/Father | 23 (4.6%) | 4.17 |
| Single Female/Mother | 81 (16.3%) | 3.96 |
| Total Families | 498 (100.0%) | 3.08 |
Median Household Size in Wrangell city and borough
The median household size in Wrangell city and borough is 2.24 persons per household, with single male/father households (23 | 2.5%) accounting for the largest median household size of 4.39 persons per household. non-family households (430 | 46.3%) represent the smallest median household size with 1.17 persons per household.
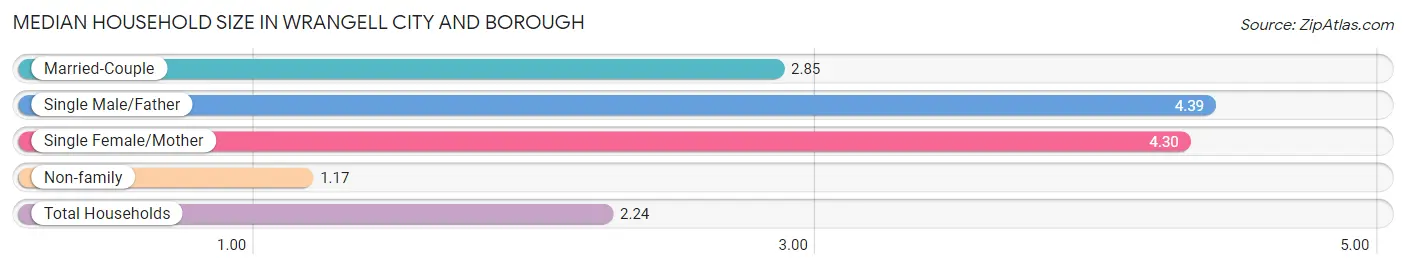
| Household Type | # Households | Household Size |
| Married-Couple | 394 (42.5%) | 2.85 |
| Single Male/Father | 23 (2.5%) | 4.39 |
| Single Female/Mother | 81 (8.7%) | 4.30 |
| Non-family | 430 (46.3%) | 1.17 |
| Total Households | 928 (100.0%) | 2.24 |
Household Size by Marriage Status in Wrangell city and borough
Out of a total of 928 households in Wrangell city and borough, 498 (53.7%) are family households, while 430 (46.3%) are nonfamily households. The most numerous type of family households are 2-person households, comprising 273, and the most common type of nonfamily households are 1-person households, comprising 343.
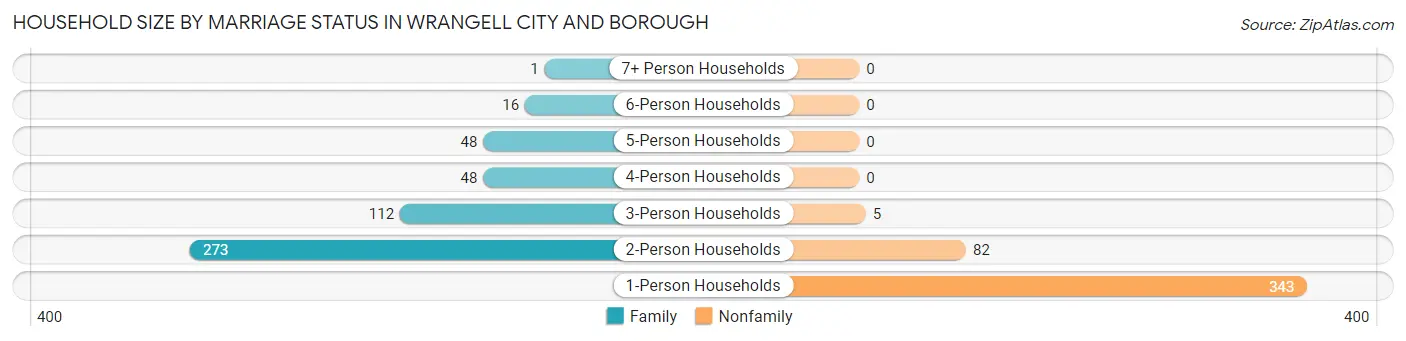
| Household Size | Family Households | Nonfamily Households |
| 1-Person Households | - | 343 (37.0%) |
| 2-Person Households | 273 (29.4%) | 82 (8.8%) |
| 3-Person Households | 112 (12.1%) | 5 (0.5%) |
| 4-Person Households | 48 (5.2%) | 0 (0.0%) |
| 5-Person Households | 48 (5.2%) | 0 (0.0%) |
| 6-Person Households | 16 (1.7%) | 0 (0.0%) |
| 7+ Person Households | 1 (0.1%) | 0 (0.0%) |
| Total | 498 (53.7%) | 430 (46.3%) |
Female Fertility in Wrangell city and borough
Fertility by Age in Wrangell city and borough
Average fertility rate in Wrangell city and borough is 49.0 births per 1,000 women. Women in the age bracket of 20 to 34 years have the highest fertility rate with 117.0 births per 1,000 women. Women in the age bracket of 20 to 34 years acount for 100.0% of all women with births.
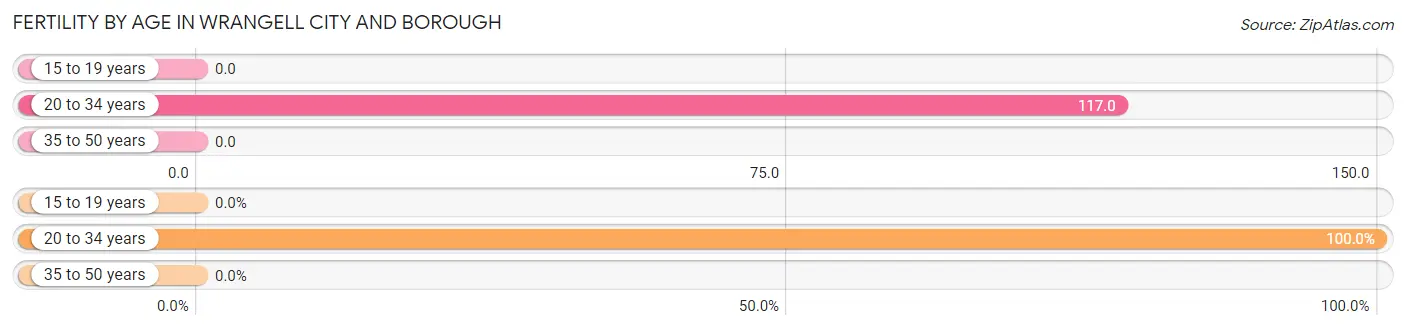
| Age Bracket | Women with Births | Births / 1,000 Women |
| 15 to 19 years | 0 (0.0%) | 0.0 |
| 20 to 34 years | 17 (100.0%) | 117.0 |
| 35 to 50 years | 0 (0.0%) | 0.0 |
| Total | 17 (100.0%) | 49.0 |
Fertility by Age by Marriage Status in Wrangell city and borough
47.1% of women with births (17) in Wrangell city and borough are married. The highest percentage of unmarried women with births falls into 20 to 34 years age bracket with 52.9% of them unmarried at the time of birth, while the lowest percentage of unmarried women with births belong to 20 to 34 years age bracket with 52.9% of them unmarried.
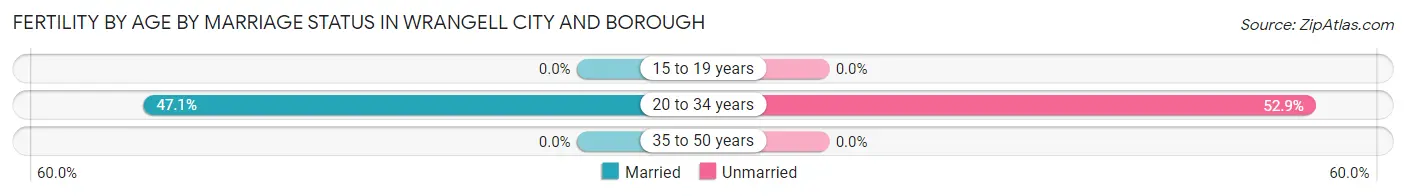
| Age Bracket | Married | Unmarried |
| 15 to 19 years | 0 (0.0%) | 0 (0.0%) |
| 20 to 34 years | 8 (47.1%) | 9 (52.9%) |
| 35 to 50 years | 0 (0.0%) | 0 (0.0%) |
| Total | 8 (47.1%) | 9 (52.9%) |
Fertility by Education in Wrangell city and borough
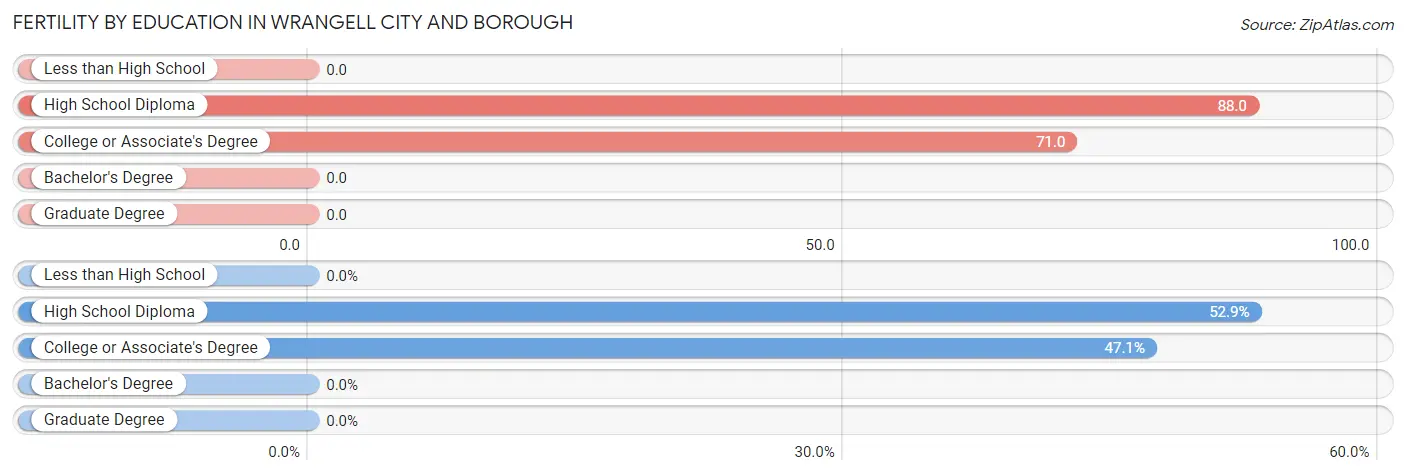
| Educational Attainment | Women with Births | Births / 1,000 Women |
| Less than High School | 0 (0.0%) | 0.0 |
| High School Diploma | 9 (52.9%) | 88.0 |
| College or Associate's Degree | 8 (47.1%) | 71.0 |
| Bachelor's Degree | 0 (0.0%) | 0.0 |
| Graduate Degree | 0 (0.0%) | 0.0 |
| Total | 17 (100.0%) | 49.0 |
Fertility by Education by Marriage Status in Wrangell city and borough
52.9% of women with births in Wrangell city and borough are unmarried. Women with the educational attainment of college or associate's degree are most likely to be married with 100.0% of them married at childbirth, while women with the educational attainment of high school diploma are least likely to be married with 100.0% of them unmarried at childbirth.
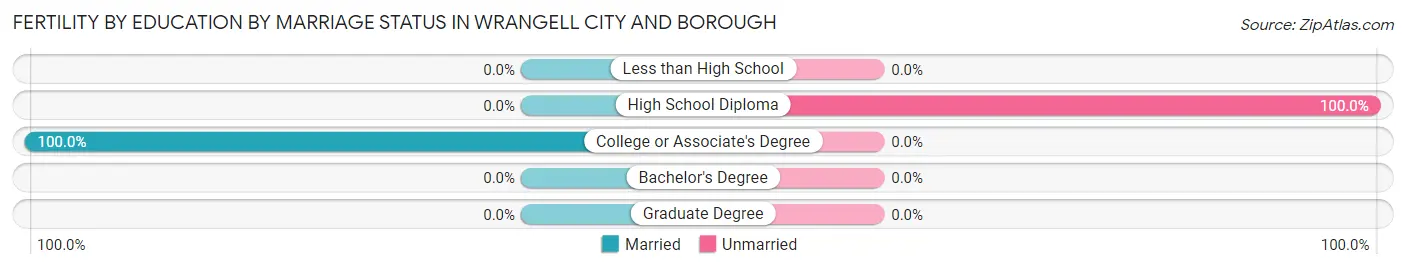
| Educational Attainment | Married | Unmarried |
| Less than High School | 0 (0.0%) | 0 (0.0%) |
| High School Diploma | 0 (0.0%) | 9 (100.0%) |
| College or Associate's Degree | 8 (100.0%) | 0 (0.0%) |
| Bachelor's Degree | 0 (0.0%) | 0 (0.0%) |
| Graduate Degree | 0 (0.0%) | 0 (0.0%) |
| Total | 8 (47.1%) | 9 (52.9%) |
Employment Characteristics in Wrangell city and borough
Employment by Class of Employer in Wrangell city and borough
Among the 798 employed individuals in Wrangell city and borough, private company employees (294 | 36.8%), local government employees (127 | 15.9%), and not-for-profit organizations (108 | 13.5%) make up the most common classes of employment.
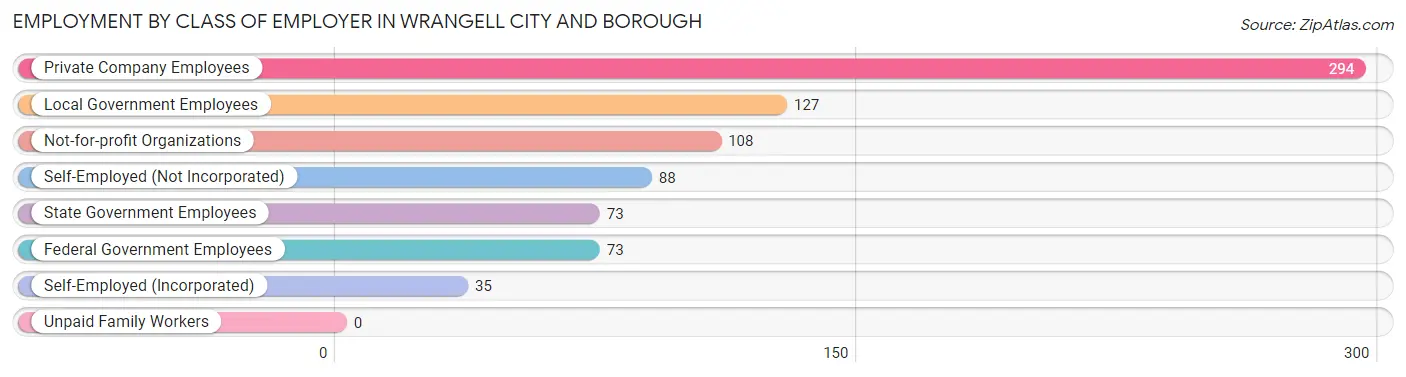
| Employer Class | # Employees | % Employees |
| Private Company Employees | 294 | 36.8% |
| Self-Employed (Incorporated) | 35 | 4.4% |
| Self-Employed (Not Incorporated) | 88 | 11.0% |
| Not-for-profit Organizations | 108 | 13.5% |
| Local Government Employees | 127 | 15.9% |
| State Government Employees | 73 | 9.1% |
| Federal Government Employees | 73 | 9.1% |
| Unpaid Family Workers | 0 | 0.0% |
| Total | 798 | 100.0% |
Employment Status by Age in Wrangell city and borough
According to the labor force statistics for Wrangell city and borough, out of the total population over 16 years of age (1,711), 49.3% or 844 individuals are in the labor force, with 3.4% or 29 of them unemployed. The age group with the highest labor force participation rate is 25 to 29 years, with 82.7% or 134 individuals in the labor force. Within the labor force, the 20 to 24 years age range has the highest percentage of unemployed individuals, with 20.5% or 9 of them being unemployed.
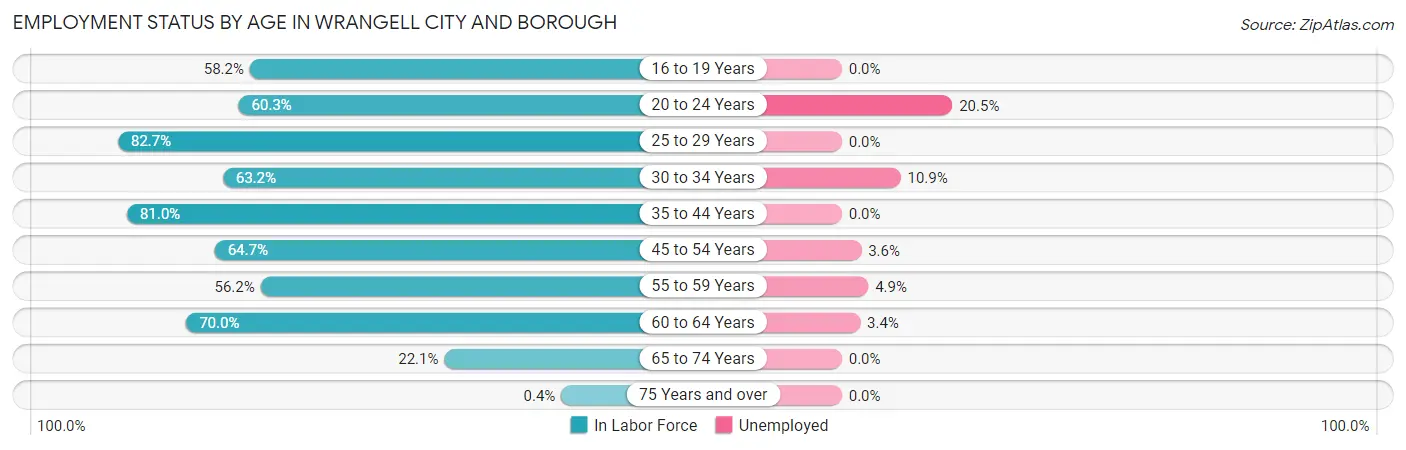
| Age Bracket | In Labor Force | Unemployed |
| 16 to 19 Years | 46 (58.2%) | 0 (0.0%) |
| 20 to 24 Years | 44 (60.3%) | 9 (20.5%) |
| 25 to 29 Years | 134 (82.7%) | 0 (0.0%) |
| 30 to 34 Years | 55 (63.2%) | 6 (10.9%) |
| 35 to 44 Years | 132 (81.0%) | 0 (0.0%) |
| 45 to 54 Years | 165 (64.7%) | 6 (3.6%) |
| 55 to 59 Years | 82 (56.2%) | 4 (4.9%) |
| 60 to 64 Years | 119 (70.0%) | 4 (3.4%) |
| 65 to 74 Years | 66 (22.1%) | 0 (0.0%) |
| 75 Years and over | 1 (0.4%) | 0 (0.0%) |
| Total | 844 (49.3%) | 29 (3.4%) |
Employment Status by Educational Attainment in Wrangell city and borough
According to labor force statistics for Wrangell city and borough, 69.9% of individuals (687) out of the total population between 25 and 64 years of age (983) are in the labor force, with 2.9% or 20 of them being unemployed. The group with the highest labor force participation rate are those with the educational attainment of bachelor's degree or higher, with 85.2% or 178 individuals in the labor force. Within the labor force, individuals with high school diploma education have the highest percentage of unemployment, with 5.3% or 8 of them being unemployed.
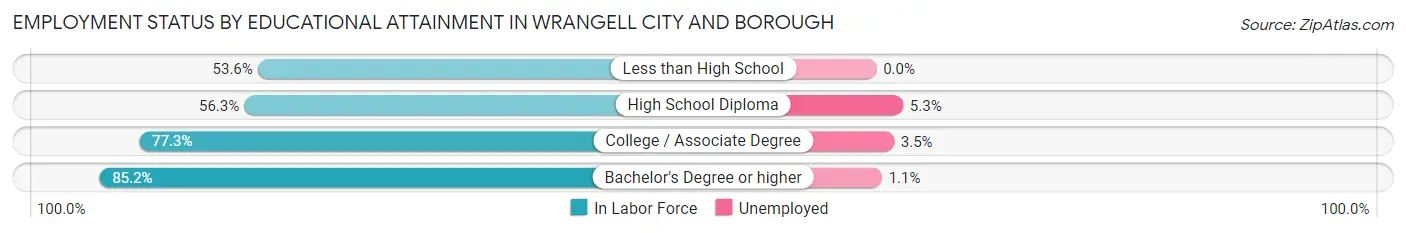
| Educational Attainment | In Labor Force | Unemployed |
| Less than High School | 74 (53.6%) | 0 (0.0%) |
| High School Diploma | 152 (56.3%) | 14 (5.3%) |
| College / Associate Degree | 283 (77.3%) | 13 (3.5%) |
| Bachelor's Degree or higher | 178 (85.2%) | 2 (1.1%) |
| Total | 687 (69.9%) | 29 (2.9%) |
Employment Occupations by Sex in Wrangell city and borough
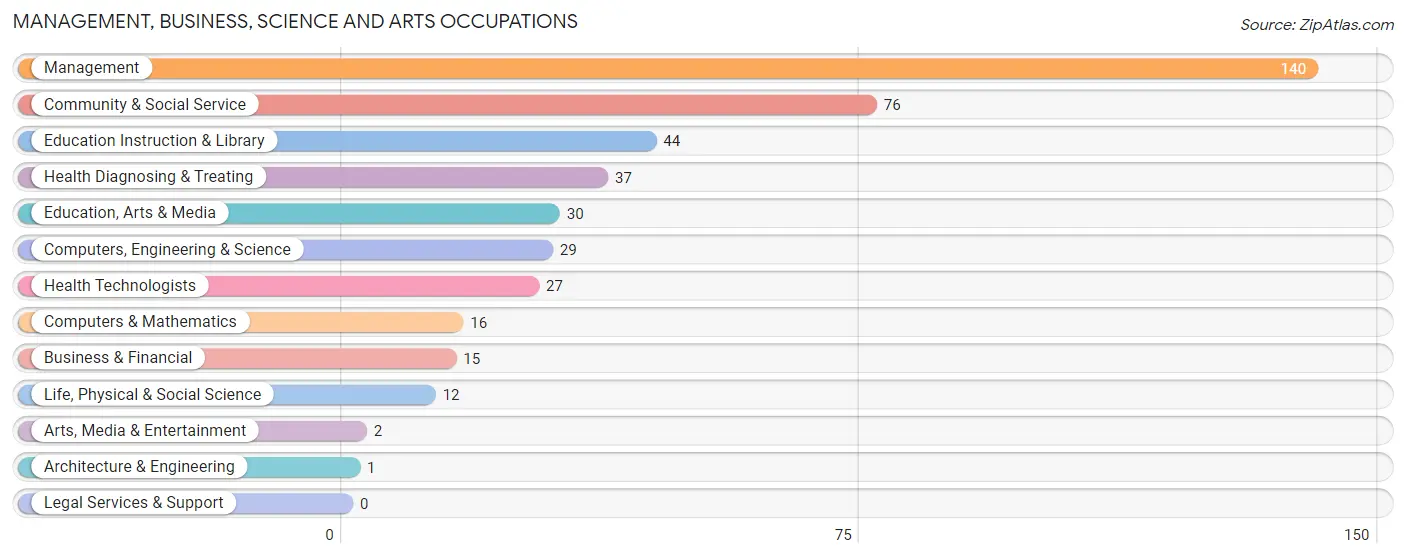
Management, Business, Science and Arts Occupations
The most common Management, Business, Science and Arts occupations in Wrangell city and borough are Management (140 | 17.2%), Community & Social Service (76 | 9.3%), Education Instruction & Library (44 | 5.4%), Health Diagnosing & Treating (37 | 4.5%), and Education, Arts & Media (30 | 3.7%).
Management, Business, Science and Arts Occupations by Sex
Within the Management, Business, Science and Arts occupations in Wrangell city and borough, the most male-oriented occupations are Computers & Mathematics (100.0%), Computers, Engineering & Science (65.5%), and Management (51.4%), while the most female-oriented occupations are Architecture & Engineering (100.0%), Arts, Media & Entertainment (100.0%), and Health Technologists (100.0%).
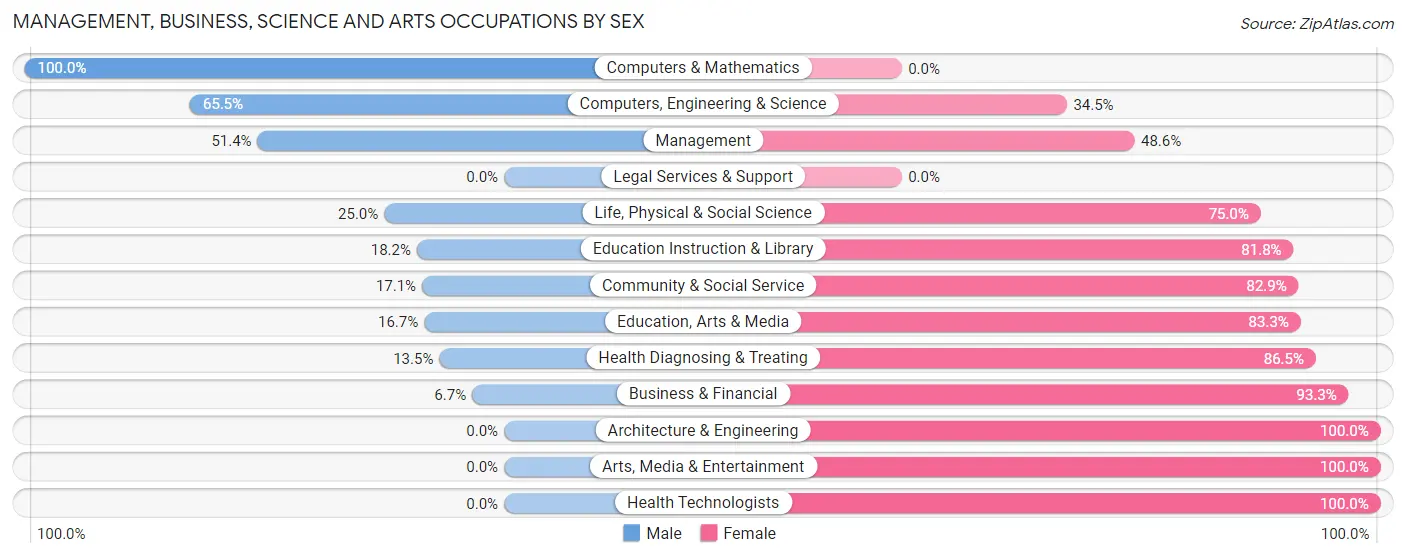
| Occupation | Male | Female |
| Management | 72 (51.4%) | 68 (48.6%) |
| Business & Financial | 1 (6.7%) | 14 (93.3%) |
| Computers, Engineering & Science | 19 (65.5%) | 10 (34.5%) |
| Computers & Mathematics | 16 (100.0%) | 0 (0.0%) |
| Architecture & Engineering | 0 (0.0%) | 1 (100.0%) |
| Life, Physical & Social Science | 3 (25.0%) | 9 (75.0%) |
| Community & Social Service | 13 (17.1%) | 63 (82.9%) |
| Education, Arts & Media | 5 (16.7%) | 25 (83.3%) |
| Legal Services & Support | 0 (0.0%) | 0 (0.0%) |
| Education Instruction & Library | 8 (18.2%) | 36 (81.8%) |
| Arts, Media & Entertainment | 0 (0.0%) | 2 (100.0%) |
| Health Diagnosing & Treating | 5 (13.5%) | 32 (86.5%) |
| Health Technologists | 0 (0.0%) | 27 (100.0%) |
| Total (Category) | 110 (37.0%) | 187 (63.0%) |
| Total (Overall) | 434 (53.2%) | 381 (46.8%) |
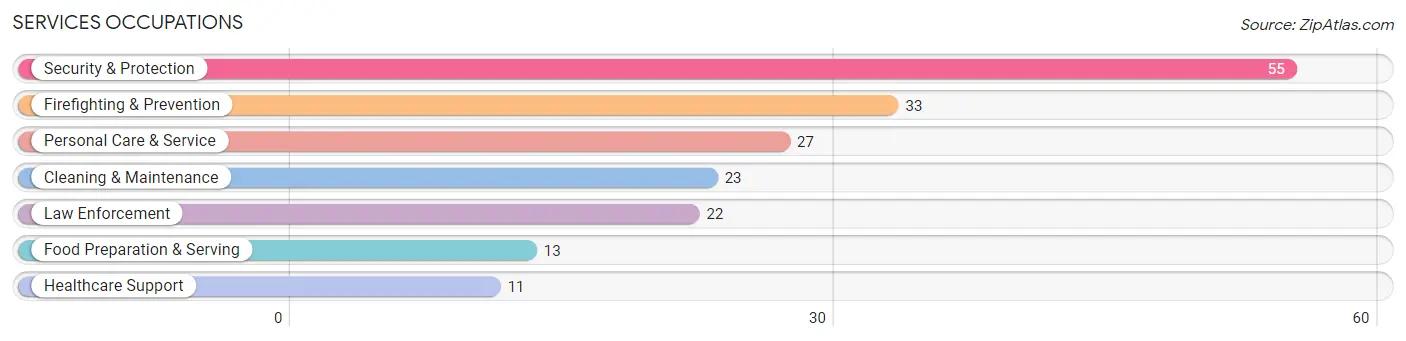
Services Occupations
The most common Services occupations in Wrangell city and borough are Security & Protection (55 | 6.8%), Firefighting & Prevention (33 | 4.1%), Personal Care & Service (27 | 3.3%), Cleaning & Maintenance (23 | 2.8%), and Law Enforcement (22 | 2.7%).
Services Occupations by Sex
Within the Services occupations in Wrangell city and borough, the most male-oriented occupations are Law Enforcement (100.0%), Food Preparation & Serving (69.2%), and Cleaning & Maintenance (52.2%), while the most female-oriented occupations are Personal Care & Service (85.2%), Firefighting & Prevention (84.9%), and Healthcare Support (81.8%).
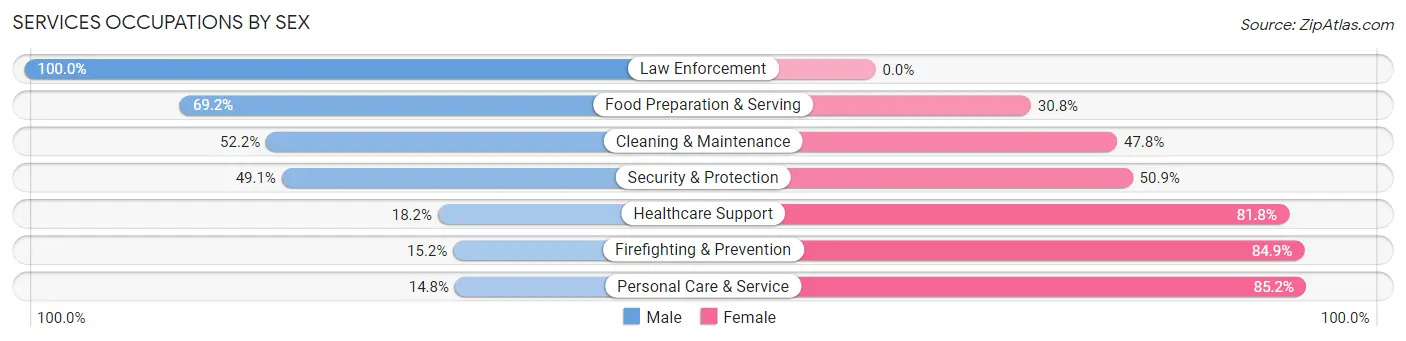
| Occupation | Male | Female |
| Healthcare Support | 2 (18.2%) | 9 (81.8%) |
| Security & Protection | 27 (49.1%) | 28 (50.9%) |
| Firefighting & Prevention | 5 (15.1%) | 28 (84.9%) |
| Law Enforcement | 22 (100.0%) | 0 (0.0%) |
| Food Preparation & Serving | 9 (69.2%) | 4 (30.8%) |
| Cleaning & Maintenance | 12 (52.2%) | 11 (47.8%) |
| Personal Care & Service | 4 (14.8%) | 23 (85.2%) |
| Total (Category) | 54 (41.9%) | 75 (58.1%) |
| Total (Overall) | 434 (53.2%) | 381 (46.8%) |
Sales and Office Occupations
The most common Sales and Office occupations in Wrangell city and borough are Office & Administration (67 | 8.2%), and Sales & Related (56 | 6.9%).
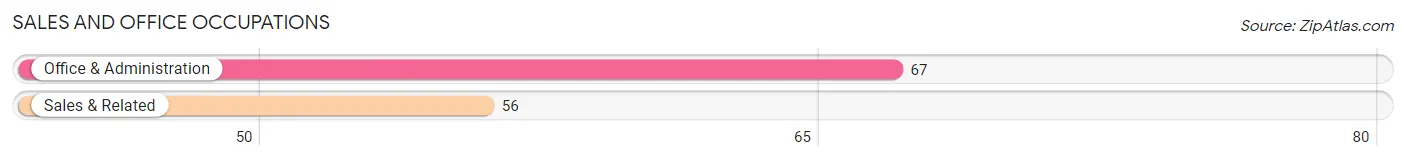
Sales and Office Occupations by Sex
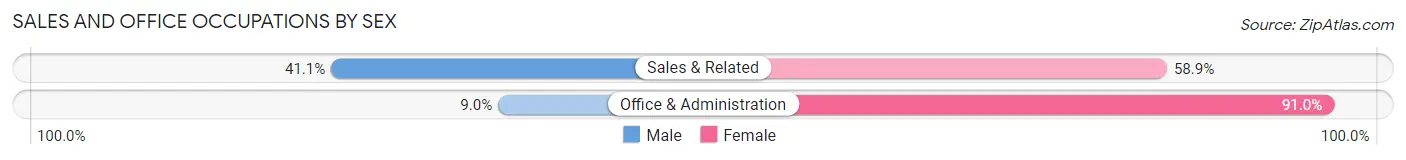
| Occupation | Male | Female |
| Sales & Related | 23 (41.1%) | 33 (58.9%) |
| Office & Administration | 6 (9.0%) | 61 (91.0%) |
| Total (Category) | 29 (23.6%) | 94 (76.4%) |
| Total (Overall) | 434 (53.2%) | 381 (46.8%) |
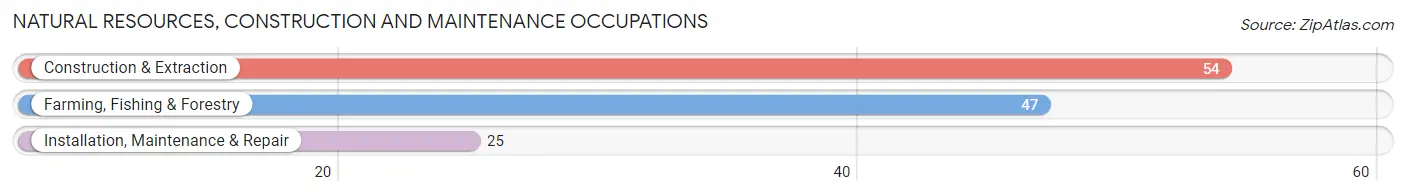
Natural Resources, Construction and Maintenance Occupations
The most common Natural Resources, Construction and Maintenance occupations in Wrangell city and borough are Construction & Extraction (54 | 6.6%), Farming, Fishing & Forestry (47 | 5.8%), and Installation, Maintenance & Repair (25 | 3.1%).
Natural Resources, Construction and Maintenance Occupations by Sex
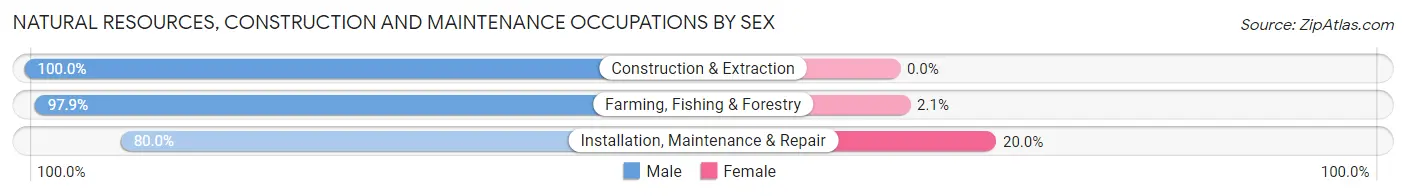
| Occupation | Male | Female |
| Farming, Fishing & Forestry | 46 (97.9%) | 1 (2.1%) |
| Construction & Extraction | 54 (100.0%) | 0 (0.0%) |
| Installation, Maintenance & Repair | 20 (80.0%) | 5 (20.0%) |
| Total (Category) | 120 (95.2%) | 6 (4.8%) |
| Total (Overall) | 434 (53.2%) | 381 (46.8%) |
Production, Transportation and Moving Occupations
The most common Production, Transportation and Moving occupations in Wrangell city and borough are Material Moving (69 | 8.5%), Transportation (41 | 5.0%), and Production (30 | 3.7%).
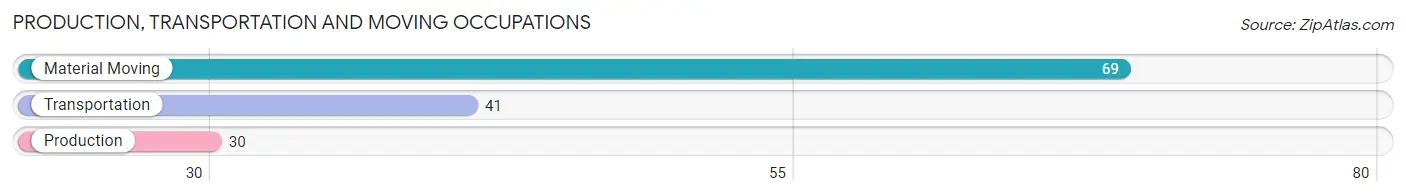
Production, Transportation and Moving Occupations by Sex
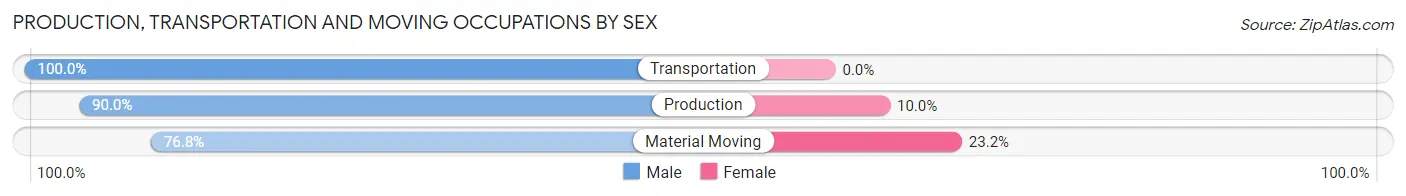
| Occupation | Male | Female |
| Production | 27 (90.0%) | 3 (10.0%) |
| Transportation | 41 (100.0%) | 0 (0.0%) |
| Material Moving | 53 (76.8%) | 16 (23.2%) |
| Total (Category) | 121 (86.4%) | 19 (13.6%) |
| Total (Overall) | 434 (53.2%) | 381 (46.8%) |
Employment Industries by Sex in Wrangell city and borough
Employment Industries in Wrangell city and borough
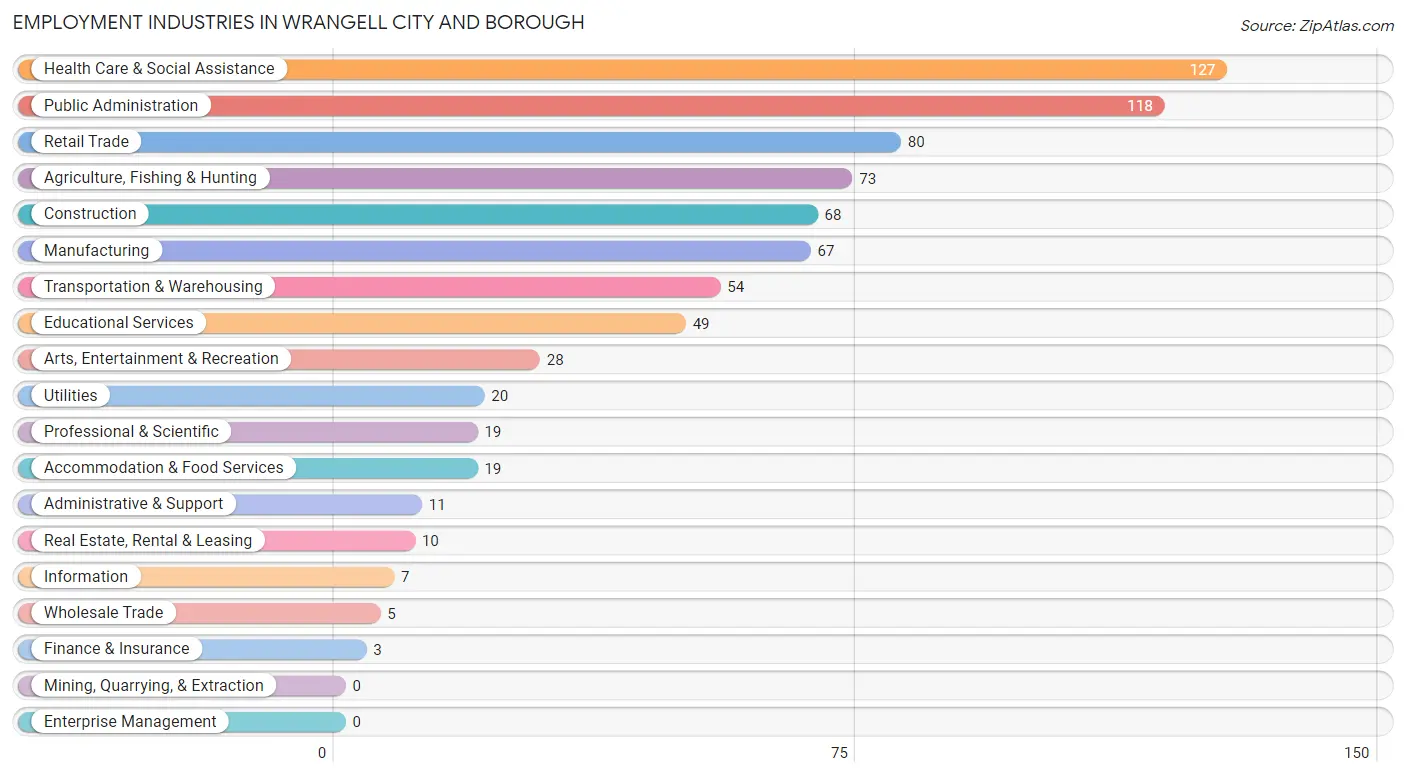
The major employment industries in Wrangell city and borough include Health Care & Social Assistance (127 | 15.6%), Public Administration (118 | 14.5%), Retail Trade (80 | 9.8%), Agriculture, Fishing & Hunting (73 | 9.0%), and Construction (68 | 8.3%).
Employment Industries by Sex in Wrangell city and borough
The Wrangell city and borough industries that see more men than women are Construction (92.6%), Manufacturing (92.5%), and Utilities (90.0%), whereas the industries that tend to have a higher number of women are Wholesale Trade (100.0%), Information (100.0%), and Finance & Insurance (100.0%).
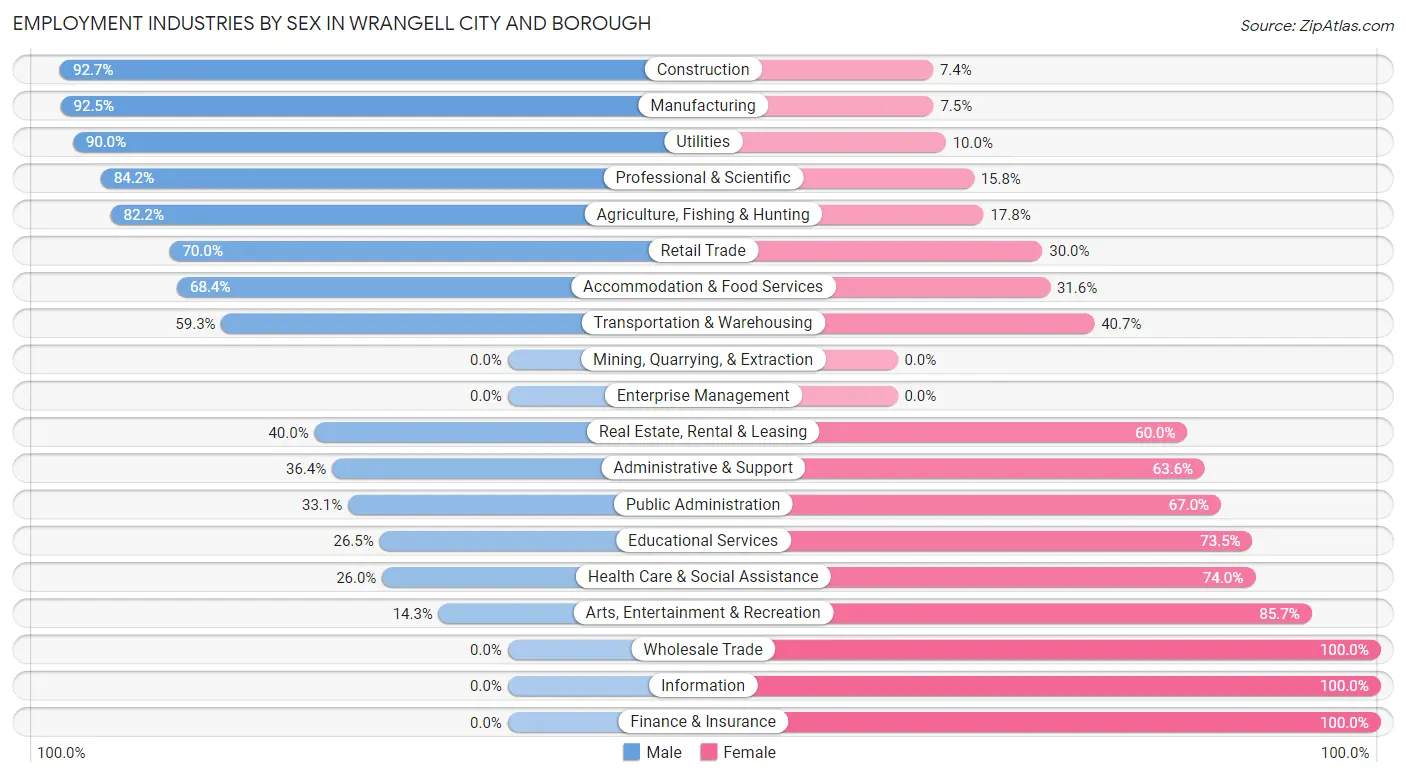
| Industry | Male | Female |
| Agriculture, Fishing & Hunting | 60 (82.2%) | 13 (17.8%) |
| Mining, Quarrying, & Extraction | 0 (0.0%) | 0 (0.0%) |
| Construction | 63 (92.6%) | 5 (7.3%) |
| Manufacturing | 62 (92.5%) | 5 (7.5%) |
| Wholesale Trade | 0 (0.0%) | 5 (100.0%) |
| Retail Trade | 56 (70.0%) | 24 (30.0%) |
| Transportation & Warehousing | 32 (59.3%) | 22 (40.7%) |
| Utilities | 18 (90.0%) | 2 (10.0%) |
| Information | 0 (0.0%) | 7 (100.0%) |
| Finance & Insurance | 0 (0.0%) | 3 (100.0%) |
| Real Estate, Rental & Leasing | 4 (40.0%) | 6 (60.0%) |
| Professional & Scientific | 16 (84.2%) | 3 (15.8%) |
| Enterprise Management | 0 (0.0%) | 0 (0.0%) |
| Administrative & Support | 4 (36.4%) | 7 (63.6%) |
| Educational Services | 13 (26.5%) | 36 (73.5%) |
| Health Care & Social Assistance | 33 (26.0%) | 94 (74.0%) |
| Arts, Entertainment & Recreation | 4 (14.3%) | 24 (85.7%) |
| Accommodation & Food Services | 13 (68.4%) | 6 (31.6%) |
| Public Administration | 39 (33.1%) | 79 (66.9%) |
| Total | 434 (53.2%) | 381 (46.8%) |
Education in Wrangell city and borough
School Enrollment in Wrangell city and borough
The most common levels of schooling among the 372 students in Wrangell city and borough are high school (122 | 32.8%), elementary school (121 | 32.5%), and middle school (75 | 20.2%).
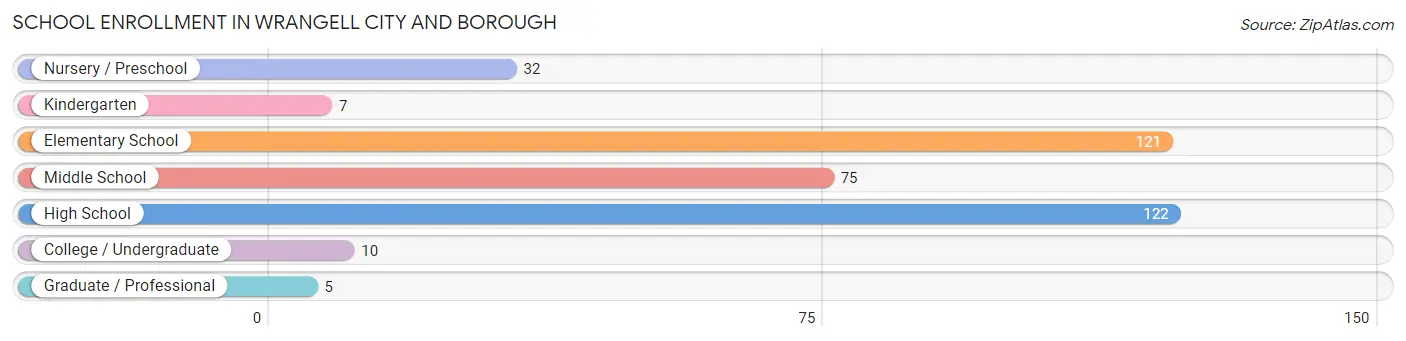
| School Level | # Students | % Students |
| Nursery / Preschool | 32 | 8.6% |
| Kindergarten | 7 | 1.9% |
| Elementary School | 121 | 32.5% |
| Middle School | 75 | 20.2% |
| High School | 122 | 32.8% |
| College / Undergraduate | 10 | 2.7% |
| Graduate / Professional | 5 | 1.3% |
| Total | 372 | 100.0% |
School Enrollment by Age by Funding Source in Wrangell city and borough
Out of a total of 372 students who are enrolled in schools in Wrangell city and borough, 23 (6.2%) attend a private institution, while the remaining 349 (93.8%) are enrolled in public schools. The age group of 3 to 4 year olds has the highest likelihood of being enrolled in private schools, with 20 (74.1% in the age bracket) enrolled. Conversely, the age group of 5 to 9 year old has the lowest likelihood of being enrolled in a private school, with 120 (100.0% in the age bracket) attending a public institution.
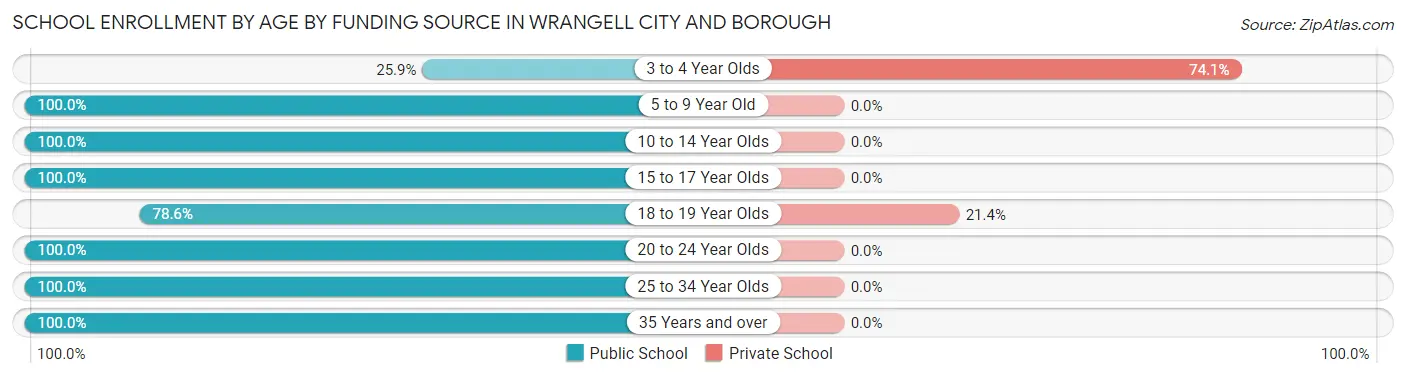
| Age Bracket | Public School | Private School |
| 3 to 4 Year Olds | 7 (25.9%) | 20 (74.1%) |
| 5 to 9 Year Old | 120 (100.0%) | 0 (0.0%) |
| 10 to 14 Year Olds | 123 (100.0%) | 0 (0.0%) |
| 15 to 17 Year Olds | 71 (100.0%) | 0 (0.0%) |
| 18 to 19 Year Olds | 11 (78.6%) | 3 (21.4%) |
| 20 to 24 Year Olds | 9 (100.0%) | 0 (0.0%) |
| 25 to 34 Year Olds | 2 (100.0%) | 0 (0.0%) |
| 35 Years and over | 6 (100.0%) | 0 (0.0%) |
| Total | 349 (93.8%) | 23 (6.2%) |
Educational Attainment by Field of Study in Wrangell city and borough
Education (73 | 22.9%), social sciences (56 | 17.5%), science & technology (31 | 9.7%), business (29 | 9.1%), and bio, nature & agricultural (28 | 8.8%) are the most common fields of study among 319 individuals in Wrangell city and borough who have obtained a bachelor's degree or higher.
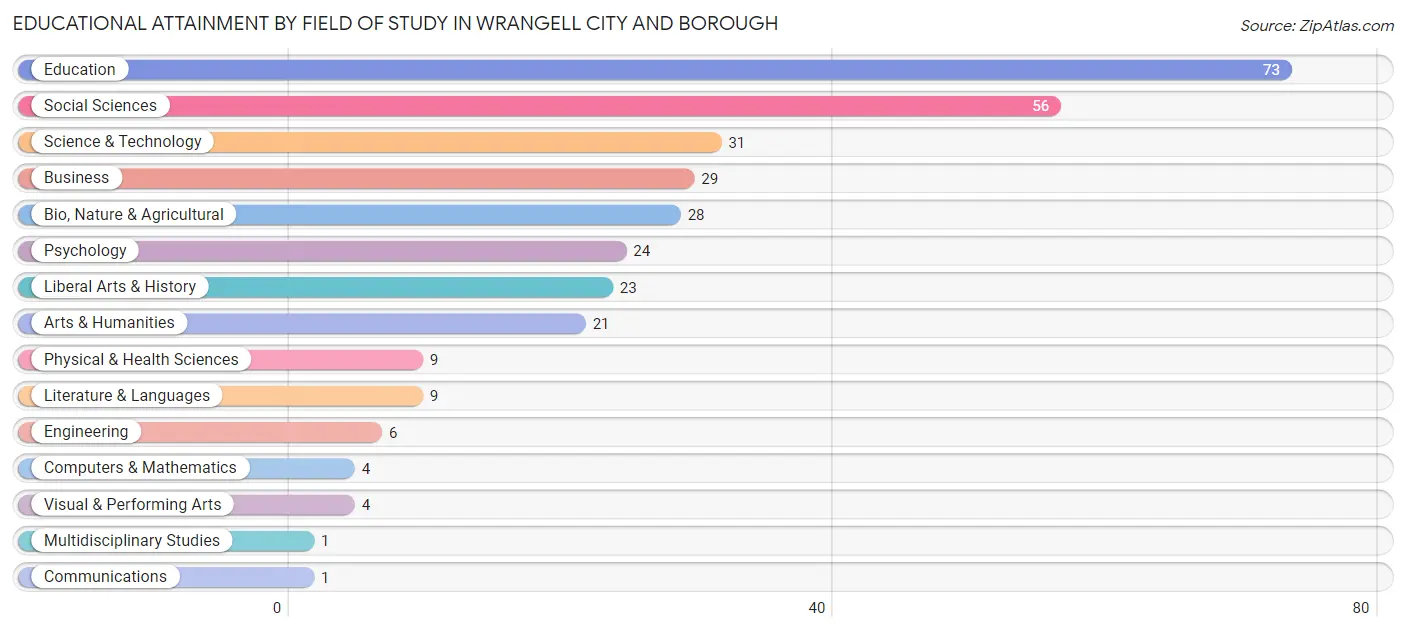
| Field of Study | # Graduates | % Graduates |
| Computers & Mathematics | 4 | 1.3% |
| Bio, Nature & Agricultural | 28 | 8.8% |
| Physical & Health Sciences | 9 | 2.8% |
| Psychology | 24 | 7.5% |
| Social Sciences | 56 | 17.5% |
| Engineering | 6 | 1.9% |
| Multidisciplinary Studies | 1 | 0.3% |
| Science & Technology | 31 | 9.7% |
| Business | 29 | 9.1% |
| Education | 73 | 22.9% |
| Literature & Languages | 9 | 2.8% |
| Liberal Arts & History | 23 | 7.2% |
| Visual & Performing Arts | 4 | 1.3% |
| Communications | 1 | 0.3% |
| Arts & Humanities | 21 | 6.6% |
| Total | 319 | 100.0% |
Transportation & Commute in Wrangell city and borough
Vehicle Availability by Sex in Wrangell city and borough
The most prevalent vehicle ownership categories in Wrangell city and borough are males with 2 vehicles (178, accounting for 44.8%) and females with 2 vehicles (120, making up 47.5%).
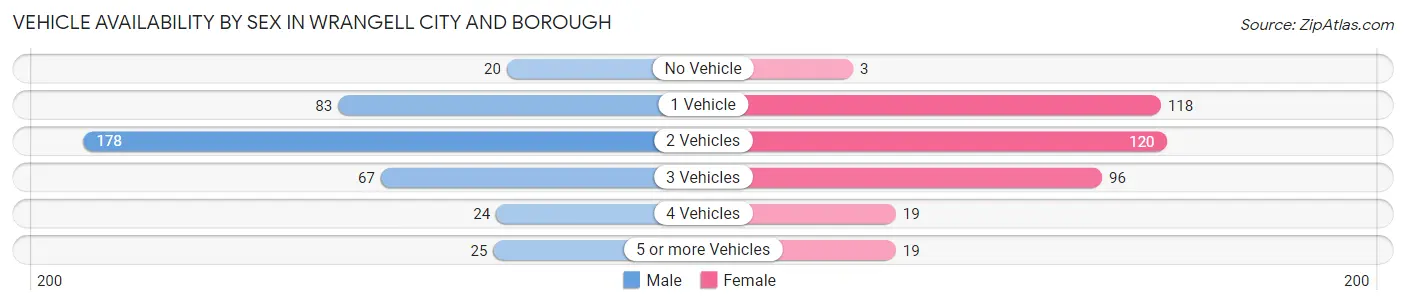
| Vehicles Available | Male | Female |
| No Vehicle | 20 (5.0%) | 3 (0.8%) |
| 1 Vehicle | 83 (20.9%) | 118 (31.5%) |
| 2 Vehicles | 178 (44.8%) | 120 (32.0%) |
| 3 Vehicles | 67 (16.9%) | 96 (25.6%) |
| 4 Vehicles | 24 (6.0%) | 19 (5.1%) |
| 5 or more Vehicles | 25 (6.3%) | 19 (5.1%) |
| Total | 397 (100.0%) | 375 (100.0%) |
Commute Time in Wrangell city and borough
The most frequently occuring commute durations in Wrangell city and borough are 5 to 9 minutes (304 commuters, 43.2%), less than 5 minutes (270 commuters, 38.4%), and 10 to 14 minutes (58 commuters, 8.3%).
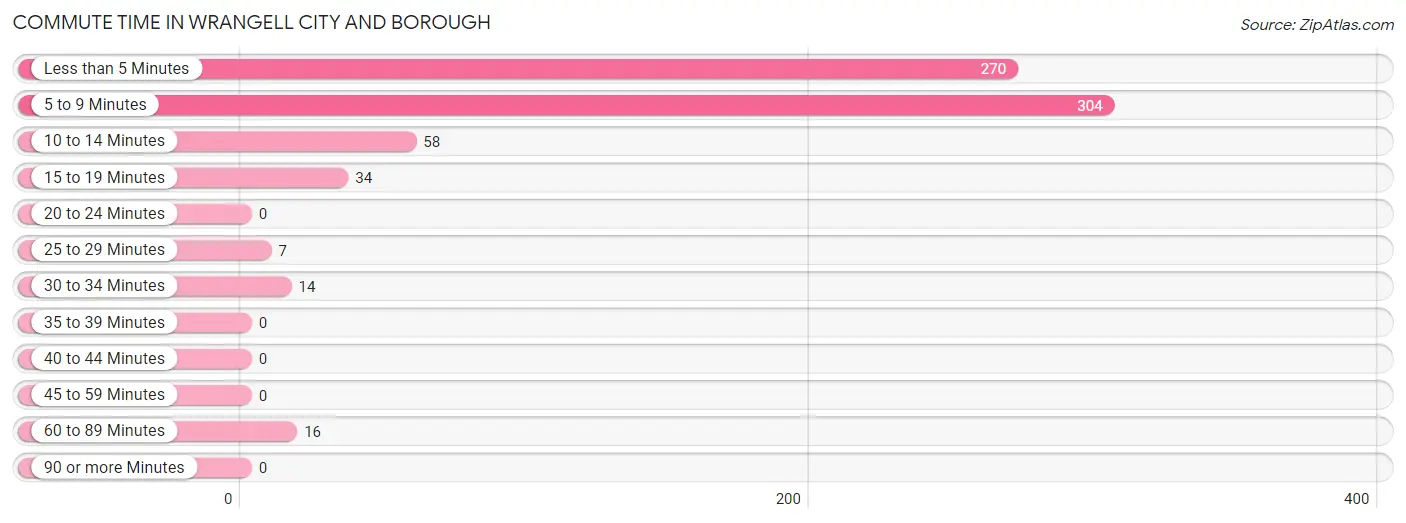
| Commute Time | # Commuters | % Commuters |
| Less than 5 Minutes | 270 | 38.4% |
| 5 to 9 Minutes | 304 | 43.2% |
| 10 to 14 Minutes | 58 | 8.3% |
| 15 to 19 Minutes | 34 | 4.8% |
| 20 to 24 Minutes | 0 | 0.0% |
| 25 to 29 Minutes | 7 | 1.0% |
| 30 to 34 Minutes | 14 | 2.0% |
| 35 to 39 Minutes | 0 | 0.0% |
| 40 to 44 Minutes | 0 | 0.0% |
| 45 to 59 Minutes | 0 | 0.0% |
| 60 to 89 Minutes | 16 | 2.3% |
| 90 or more Minutes | 0 | 0.0% |
Commute Time by Sex in Wrangell city and borough
The most common commute times in Wrangell city and borough are 5 to 9 minutes (157 commuters, 41.9%) for males and 5 to 9 minutes (147 commuters, 44.8%) for females.
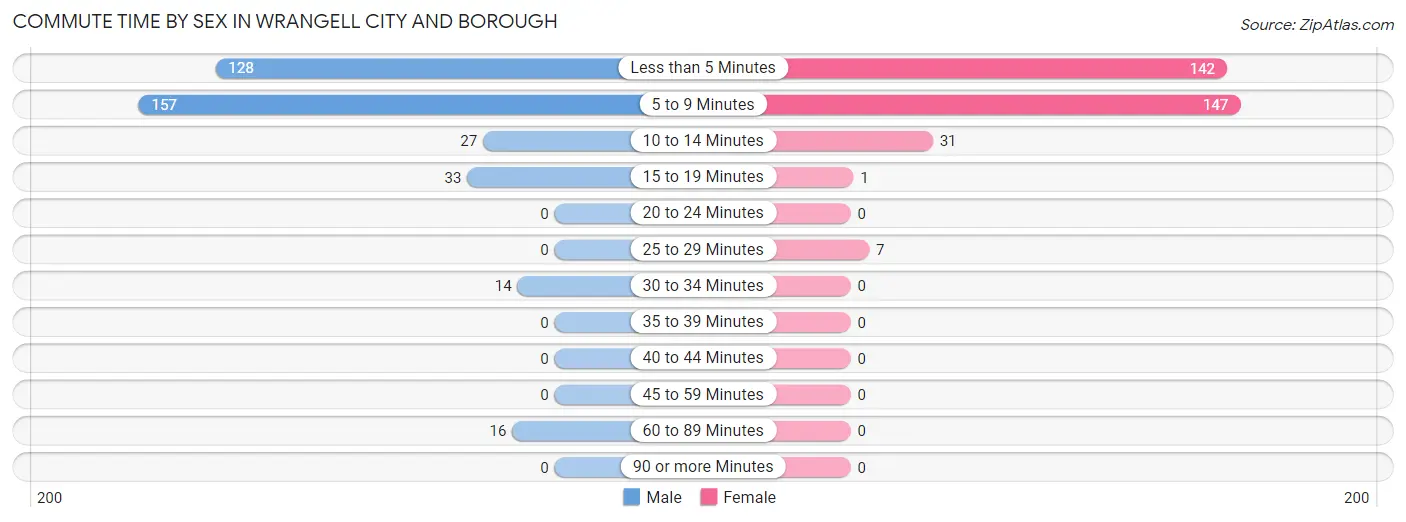
| Commute Time | Male | Female |
| Less than 5 Minutes | 128 (34.1%) | 142 (43.3%) |
| 5 to 9 Minutes | 157 (41.9%) | 147 (44.8%) |
| 10 to 14 Minutes | 27 (7.2%) | 31 (9.5%) |
| 15 to 19 Minutes | 33 (8.8%) | 1 (0.3%) |
| 20 to 24 Minutes | 0 (0.0%) | 0 (0.0%) |
| 25 to 29 Minutes | 0 (0.0%) | 7 (2.1%) |
| 30 to 34 Minutes | 14 (3.7%) | 0 (0.0%) |
| 35 to 39 Minutes | 0 (0.0%) | 0 (0.0%) |
| 40 to 44 Minutes | 0 (0.0%) | 0 (0.0%) |
| 45 to 59 Minutes | 0 (0.0%) | 0 (0.0%) |
| 60 to 89 Minutes | 16 (4.3%) | 0 (0.0%) |
| 90 or more Minutes | 0 (0.0%) | 0 (0.0%) |
Time of Departure to Work by Sex in Wrangell city and borough
The most frequent times of departure to work in Wrangell city and borough are 7:30 AM to 7:59 AM (102, 27.2%) for males and 7:30 AM to 7:59 AM (87, 26.5%) for females.
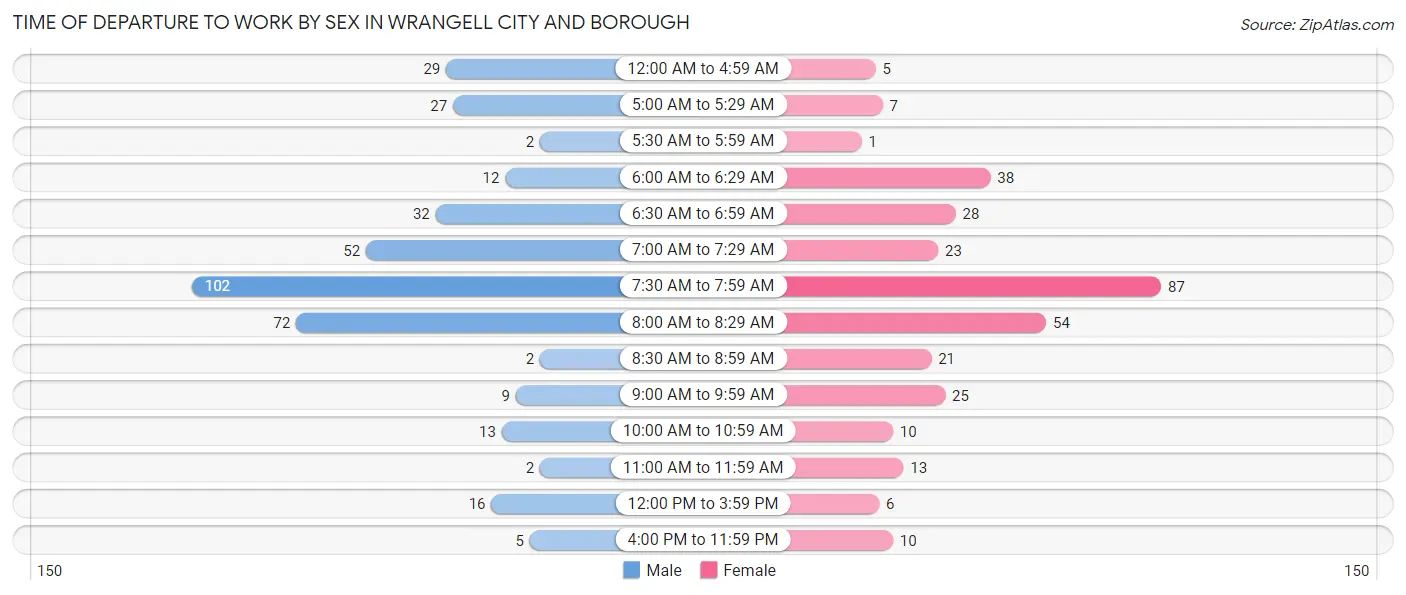
| Time of Departure | Male | Female |
| 12:00 AM to 4:59 AM | 29 (7.7%) | 5 (1.5%) |
| 5:00 AM to 5:29 AM | 27 (7.2%) | 7 (2.1%) |
| 5:30 AM to 5:59 AM | 2 (0.5%) | 1 (0.3%) |
| 6:00 AM to 6:29 AM | 12 (3.2%) | 38 (11.6%) |
| 6:30 AM to 6:59 AM | 32 (8.5%) | 28 (8.5%) |
| 7:00 AM to 7:29 AM | 52 (13.9%) | 23 (7.0%) |
| 7:30 AM to 7:59 AM | 102 (27.2%) | 87 (26.5%) |
| 8:00 AM to 8:29 AM | 72 (19.2%) | 54 (16.5%) |
| 8:30 AM to 8:59 AM | 2 (0.5%) | 21 (6.4%) |
| 9:00 AM to 9:59 AM | 9 (2.4%) | 25 (7.6%) |
| 10:00 AM to 10:59 AM | 13 (3.5%) | 10 (3.0%) |
| 11:00 AM to 11:59 AM | 2 (0.5%) | 13 (4.0%) |
| 12:00 PM to 3:59 PM | 16 (4.3%) | 6 (1.8%) |
| 4:00 PM to 11:59 PM | 5 (1.3%) | 10 (3.0%) |
| Total | 375 (100.0%) | 328 (100.0%) |
Housing Occupancy in Wrangell city and borough
Occupancy by Ownership in Wrangell city and borough
Of the total 928 dwellings in Wrangell city and borough, owner-occupied units account for 605 (65.2%), while renter-occupied units make up 323 (34.8%).
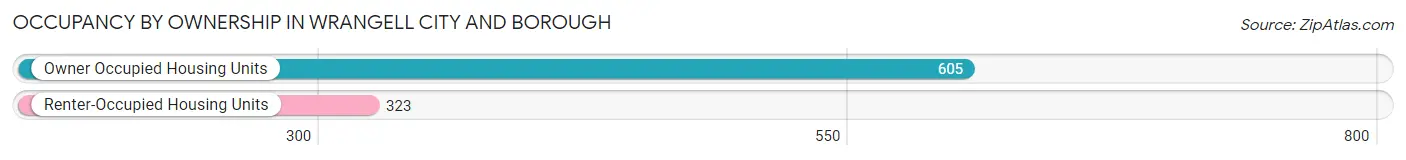
| Occupancy | # Housing Units | % Housing Units |
| Owner Occupied Housing Units | 605 | 65.2% |
| Renter-Occupied Housing Units | 323 | 34.8% |
| Total Occupied Housing Units | 928 | 100.0% |
Occupancy by Household Size in Wrangell city and borough
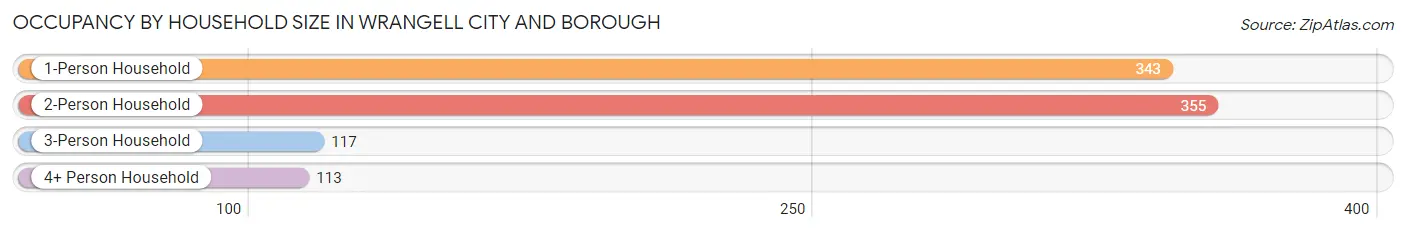
| Household Size | # Housing Units | % Housing Units |
| 1-Person Household | 343 | 37.0% |
| 2-Person Household | 355 | 38.3% |
| 3-Person Household | 117 | 12.6% |
| 4+ Person Household | 113 | 12.2% |
| Total Housing Units | 928 | 100.0% |
Occupancy by Ownership by Household Size in Wrangell city and borough
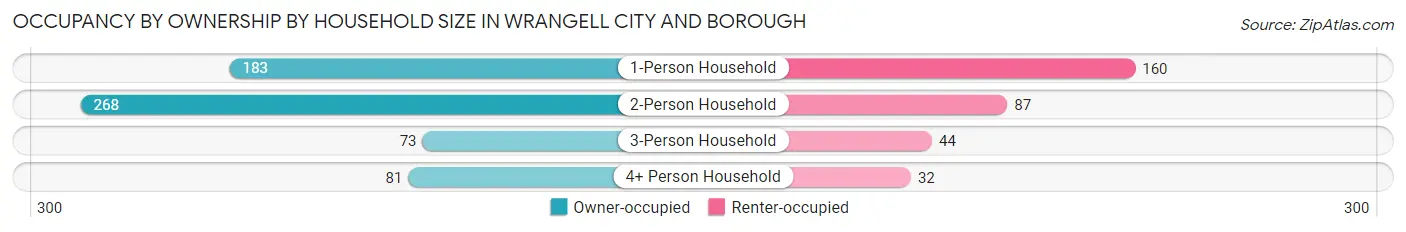
| Household Size | Owner-occupied | Renter-occupied |
| 1-Person Household | 183 (53.3%) | 160 (46.7%) |
| 2-Person Household | 268 (75.5%) | 87 (24.5%) |
| 3-Person Household | 73 (62.4%) | 44 (37.6%) |
| 4+ Person Household | 81 (71.7%) | 32 (28.3%) |
| Total Housing Units | 605 (65.2%) | 323 (34.8%) |
Occupancy by Educational Attainment in Wrangell city and borough
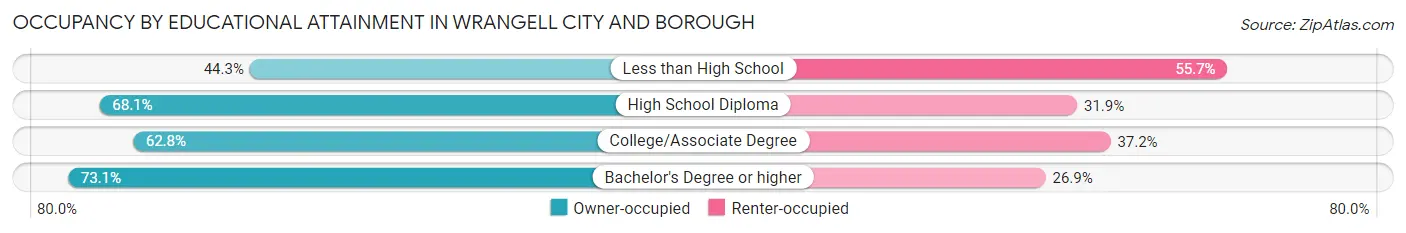
| Household Size | Owner-occupied | Renter-occupied |
| Less than High School | 31 (44.3%) | 39 (55.7%) |
| High School Diploma | 216 (68.1%) | 101 (31.9%) |
| College/Associate Degree | 230 (62.8%) | 136 (37.2%) |
| Bachelor's Degree or higher | 128 (73.1%) | 47 (26.9%) |
Occupancy by Age of Householder in Wrangell city and borough
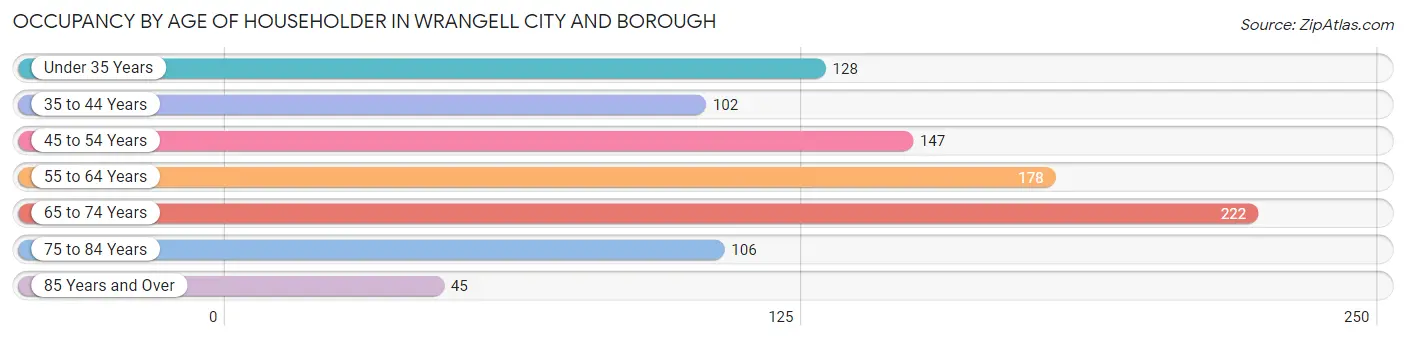
| Age Bracket | # Households | % Households |
| Under 35 Years | 128 | 13.8% |
| 35 to 44 Years | 102 | 11.0% |
| 45 to 54 Years | 147 | 15.8% |
| 55 to 64 Years | 178 | 19.2% |
| 65 to 74 Years | 222 | 23.9% |
| 75 to 84 Years | 106 | 11.4% |
| 85 Years and Over | 45 | 4.9% |
| Total | 928 | 100.0% |
Housing Finances in Wrangell city and borough
Median Income by Occupancy in Wrangell city and borough
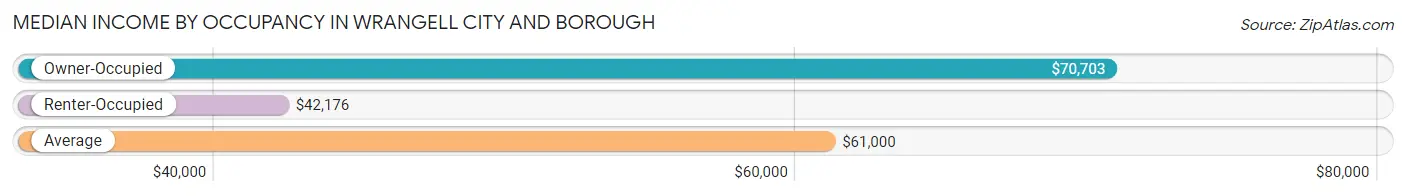
| Occupancy Type | # Households | Median Income |
| Owner-Occupied | 605 (65.2%) | $70,703 |
| Renter-Occupied | 323 (34.8%) | $42,176 |
| Average | 928 (100.0%) | $61,000 |
Occupancy by Householder Income Bracket in Wrangell city and borough
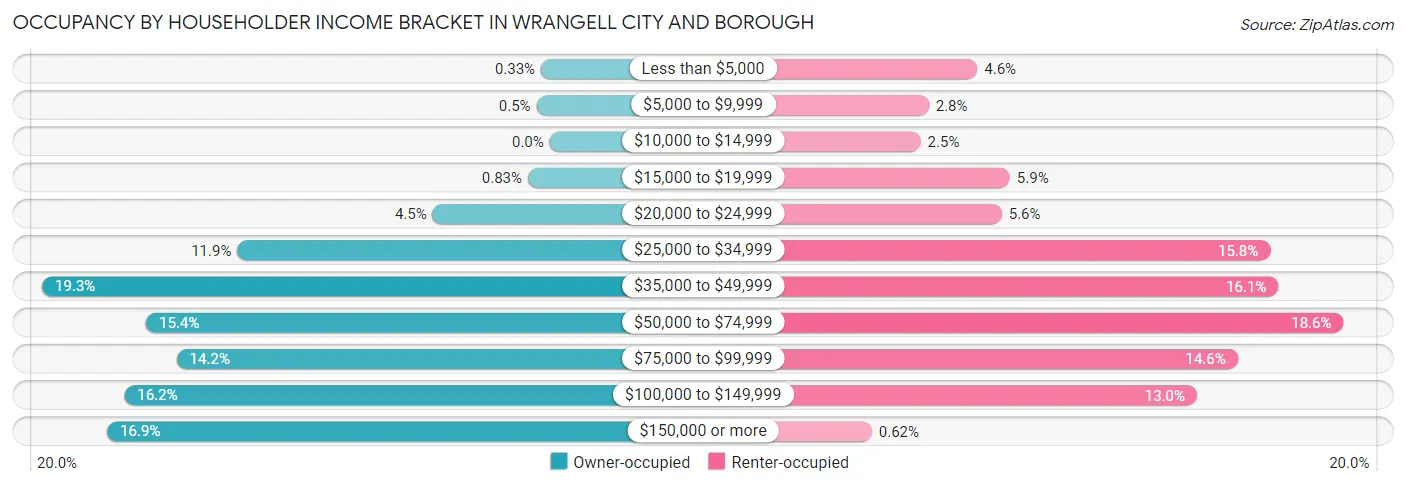
| Income Bracket | Owner-occupied | Renter-occupied |
| Less than $5,000 | 2 (0.3%) | 15 (4.6%) |
| $5,000 to $9,999 | 3 (0.5%) | 9 (2.8%) |
| $10,000 to $14,999 | 0 (0.0%) | 8 (2.5%) |
| $15,000 to $19,999 | 5 (0.8%) | 19 (5.9%) |
| $20,000 to $24,999 | 27 (4.5%) | 18 (5.6%) |
| $25,000 to $34,999 | 72 (11.9%) | 51 (15.8%) |
| $35,000 to $49,999 | 117 (19.3%) | 52 (16.1%) |
| $50,000 to $74,999 | 93 (15.4%) | 60 (18.6%) |
| $75,000 to $99,999 | 86 (14.2%) | 47 (14.5%) |
| $100,000 to $149,999 | 98 (16.2%) | 42 (13.0%) |
| $150,000 or more | 102 (16.9%) | 2 (0.6%) |
| Total | 605 (100.0%) | 323 (100.0%) |
Monthly Housing Cost Tiers in Wrangell city and borough
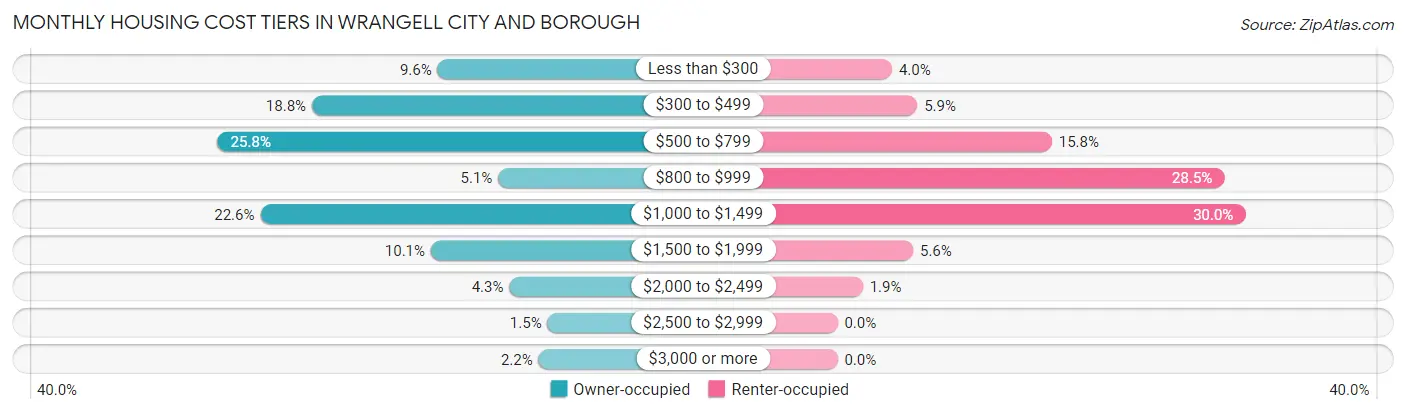
| Monthly Cost | Owner-occupied | Renter-occupied |
| Less than $300 | 58 (9.6%) | 13 (4.0%) |
| $300 to $499 | 114 (18.8%) | 19 (5.9%) |
| $500 to $799 | 156 (25.8%) | 51 (15.8%) |
| $800 to $999 | 31 (5.1%) | 92 (28.5%) |
| $1,000 to $1,499 | 137 (22.6%) | 97 (30.0%) |
| $1,500 to $1,999 | 61 (10.1%) | 18 (5.6%) |
| $2,000 to $2,499 | 26 (4.3%) | 6 (1.9%) |
| $2,500 to $2,999 | 9 (1.5%) | 0 (0.0%) |
| $3,000 or more | 13 (2.1%) | 0 (0.0%) |
| Total | 605 (100.0%) | 323 (100.0%) |
Physical Housing Characteristics in Wrangell city and borough
Housing Structures in Wrangell city and borough
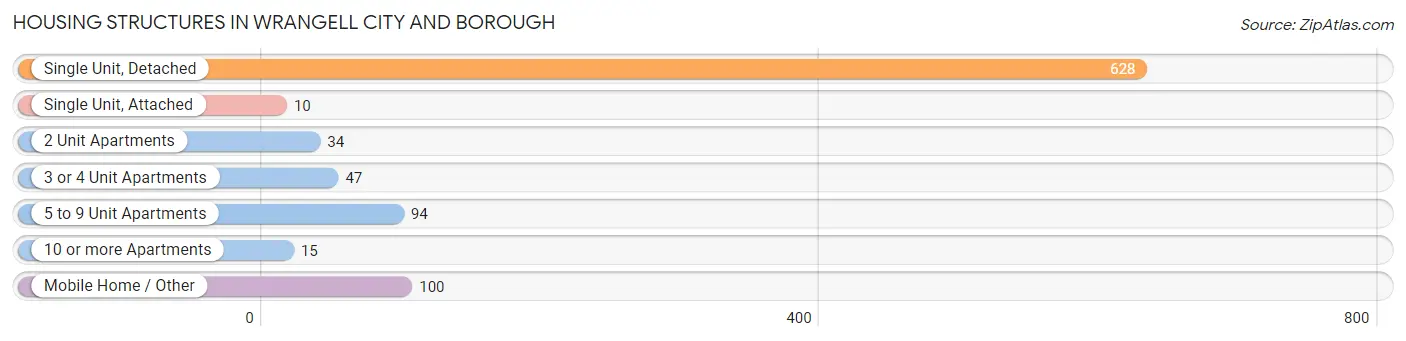
| Structure Type | # Housing Units | % Housing Units |
| Single Unit, Detached | 628 | 67.7% |
| Single Unit, Attached | 10 | 1.1% |
| 2 Unit Apartments | 34 | 3.7% |
| 3 or 4 Unit Apartments | 47 | 5.1% |
| 5 to 9 Unit Apartments | 94 | 10.1% |
| 10 or more Apartments | 15 | 1.6% |
| Mobile Home / Other | 100 | 10.8% |
| Total | 928 | 100.0% |
Housing Structures by Occupancy in Wrangell city and borough
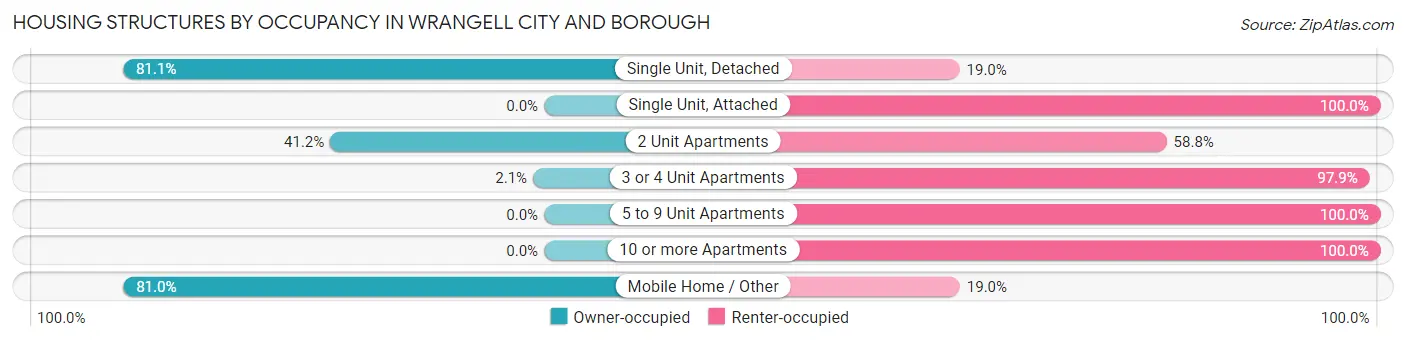
| Structure Type | Owner-occupied | Renter-occupied |
| Single Unit, Detached | 509 (81.0%) | 119 (19.0%) |
| Single Unit, Attached | 0 (0.0%) | 10 (100.0%) |
| 2 Unit Apartments | 14 (41.2%) | 20 (58.8%) |
| 3 or 4 Unit Apartments | 1 (2.1%) | 46 (97.9%) |
| 5 to 9 Unit Apartments | 0 (0.0%) | 94 (100.0%) |
| 10 or more Apartments | 0 (0.0%) | 15 (100.0%) |
| Mobile Home / Other | 81 (81.0%) | 19 (19.0%) |
| Total | 605 (65.2%) | 323 (34.8%) |
Housing Structures by Number of Rooms in Wrangell city and borough
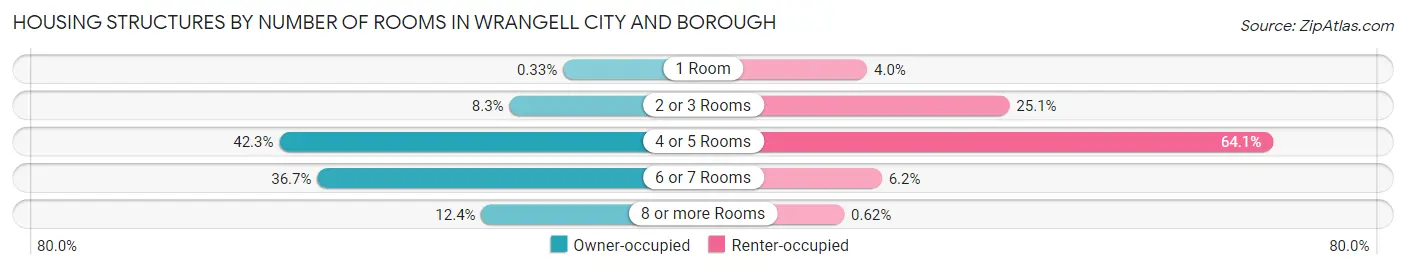
| Number of Rooms | Owner-occupied | Renter-occupied |
| 1 Room | 2 (0.3%) | 13 (4.0%) |
| 2 or 3 Rooms | 50 (8.3%) | 81 (25.1%) |
| 4 or 5 Rooms | 256 (42.3%) | 207 (64.1%) |
| 6 or 7 Rooms | 222 (36.7%) | 20 (6.2%) |
| 8 or more Rooms | 75 (12.4%) | 2 (0.6%) |
| Total | 605 (100.0%) | 323 (100.0%) |
Housing Structure by Heating Type in Wrangell city and borough
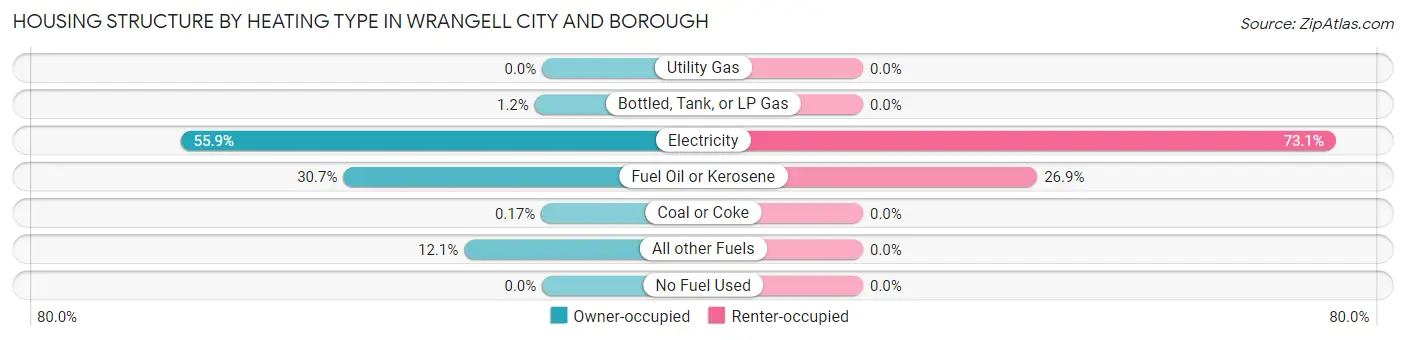
| Heating Type | Owner-occupied | Renter-occupied |
| Utility Gas | 0 (0.0%) | 0 (0.0%) |
| Bottled, Tank, or LP Gas | 7 (1.2%) | 0 (0.0%) |
| Electricity | 338 (55.9%) | 236 (73.1%) |
| Fuel Oil or Kerosene | 186 (30.7%) | 87 (26.9%) |
| Coal or Coke | 1 (0.2%) | 0 (0.0%) |
| All other Fuels | 73 (12.1%) | 0 (0.0%) |
| No Fuel Used | 0 (0.0%) | 0 (0.0%) |
| Total | 605 (100.0%) | 323 (100.0%) |
Household Vehicle Usage in Wrangell city and borough
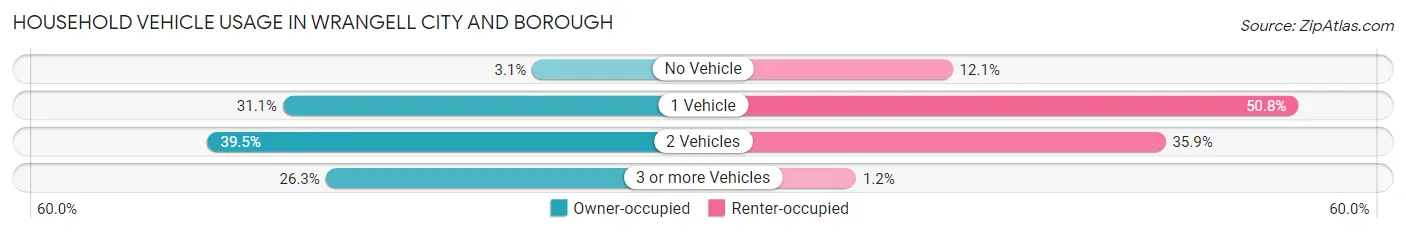
| Vehicles per Household | Owner-occupied | Renter-occupied |
| No Vehicle | 19 (3.1%) | 39 (12.1%) |
| 1 Vehicle | 188 (31.1%) | 164 (50.8%) |
| 2 Vehicles | 239 (39.5%) | 116 (35.9%) |
| 3 or more Vehicles | 159 (26.3%) | 4 (1.2%) |
| Total | 605 (100.0%) | 323 (100.0%) |
Real Estate & Mortgages in Wrangell city and borough
Real Estate and Mortgage Overview in Wrangell city and borough
| Characteristic | Without Mortgage | With Mortgage |
| Housing Units | 363 | 242 |
| Median Property Value | $264,400 | $284,500 |
| Median Household Income | $49,448 | $64 |
| Monthly Housing Costs | $515 | $13 |
| Real Estate Taxes | $1,750 | $49 |
Property Value by Mortgage Status in Wrangell city and borough
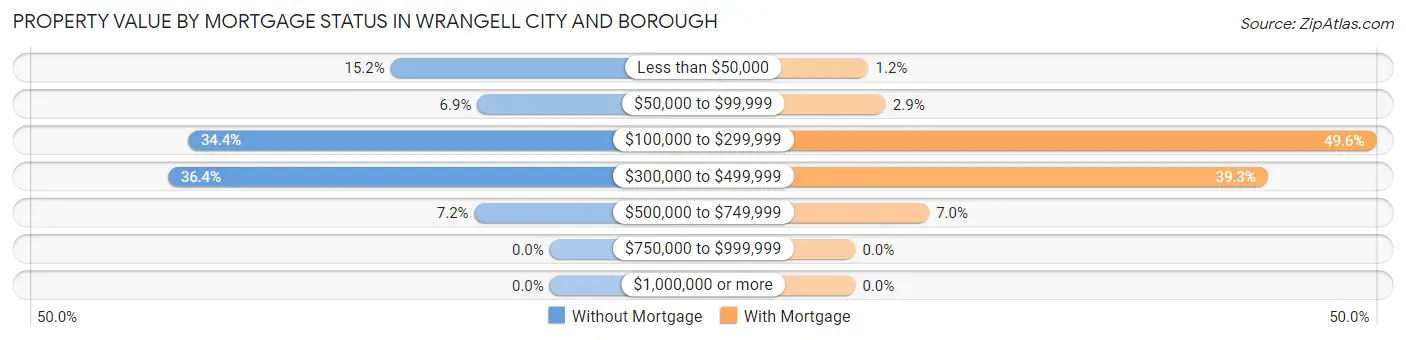
| Property Value | Without Mortgage | With Mortgage |
| Less than $50,000 | 55 (15.1%) | 3 (1.2%) |
| $50,000 to $99,999 | 25 (6.9%) | 7 (2.9%) |
| $100,000 to $299,999 | 125 (34.4%) | 120 (49.6%) |
| $300,000 to $499,999 | 132 (36.4%) | 95 (39.3%) |
| $500,000 to $749,999 | 26 (7.2%) | 17 (7.0%) |
| $750,000 to $999,999 | 0 (0.0%) | 0 (0.0%) |
| $1,000,000 or more | 0 (0.0%) | 0 (0.0%) |
| Total | 363 (100.0%) | 242 (100.0%) |
Household Income by Mortgage Status in Wrangell city and borough
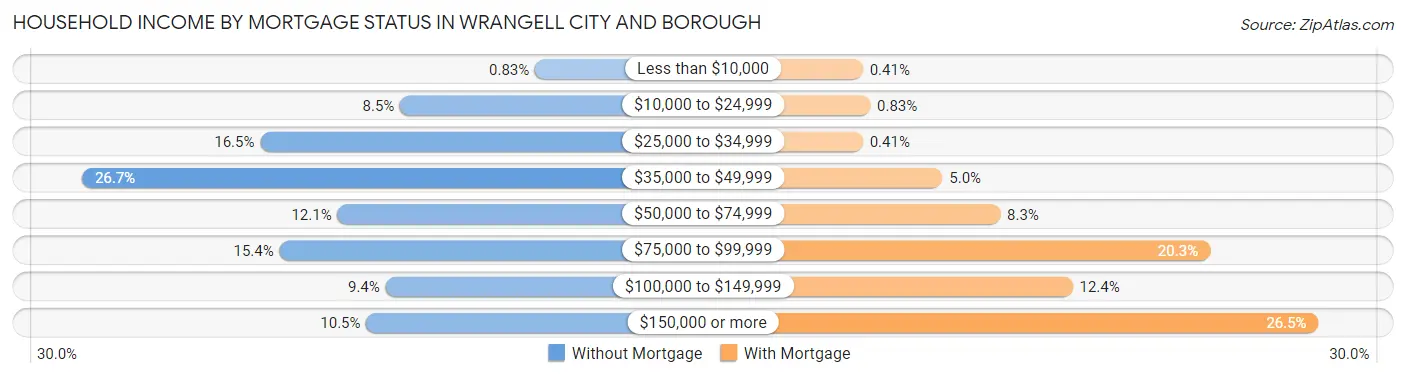
| Household Income | Without Mortgage | With Mortgage |
| Less than $10,000 | 3 (0.8%) | 1 (0.4%) |
| $10,000 to $24,999 | 31 (8.5%) | 2 (0.8%) |
| $25,000 to $34,999 | 60 (16.5%) | 1 (0.4%) |
| $35,000 to $49,999 | 97 (26.7%) | 12 (5.0%) |
| $50,000 to $74,999 | 44 (12.1%) | 20 (8.3%) |
| $75,000 to $99,999 | 56 (15.4%) | 49 (20.3%) |
| $100,000 to $149,999 | 34 (9.4%) | 30 (12.4%) |
| $150,000 or more | 38 (10.5%) | 64 (26.5%) |
| Total | 363 (100.0%) | 242 (100.0%) |
Property Value to Household Income Ratio in Wrangell city and borough
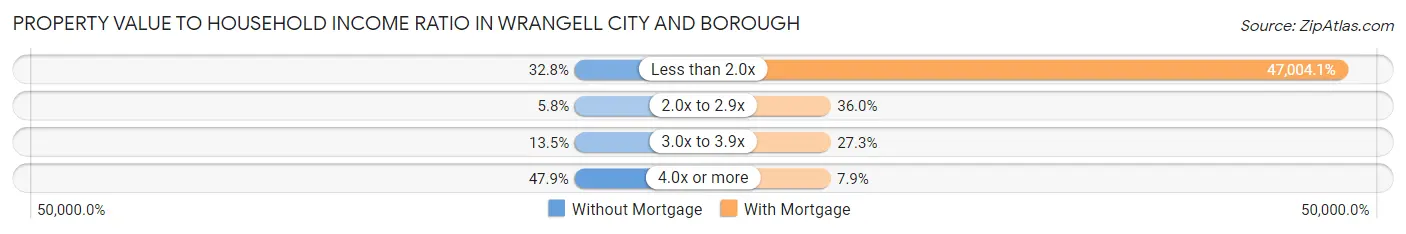
| Value-to-Income Ratio | Without Mortgage | With Mortgage |
| Less than 2.0x | 119 (32.8%) | 113,750 (47,004.1%) |
| 2.0x to 2.9x | 21 (5.8%) | 87 (35.9%) |
| 3.0x to 3.9x | 49 (13.5%) | 66 (27.3%) |
| 4.0x or more | 174 (47.9%) | 19 (7.9%) |
| Total | 363 (100.0%) | 242 (100.0%) |
Real Estate Taxes by Mortgage Status in Wrangell city and borough
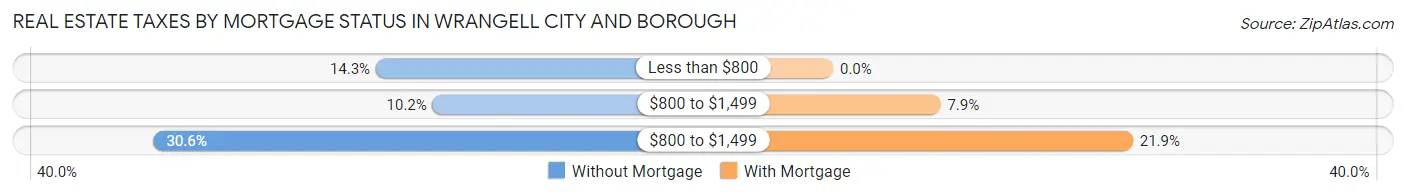
| Property Taxes | Without Mortgage | With Mortgage |
| Less than $800 | 52 (14.3%) | 0 (0.0%) |
| $800 to $1,499 | 37 (10.2%) | 19 (7.9%) |
| $800 to $1,499 | 111 (30.6%) | 53 (21.9%) |
| Total | 363 (100.0%) | 242 (100.0%) |
Health & Disability in Wrangell city and borough
Health Insurance Coverage by Age in Wrangell city and borough
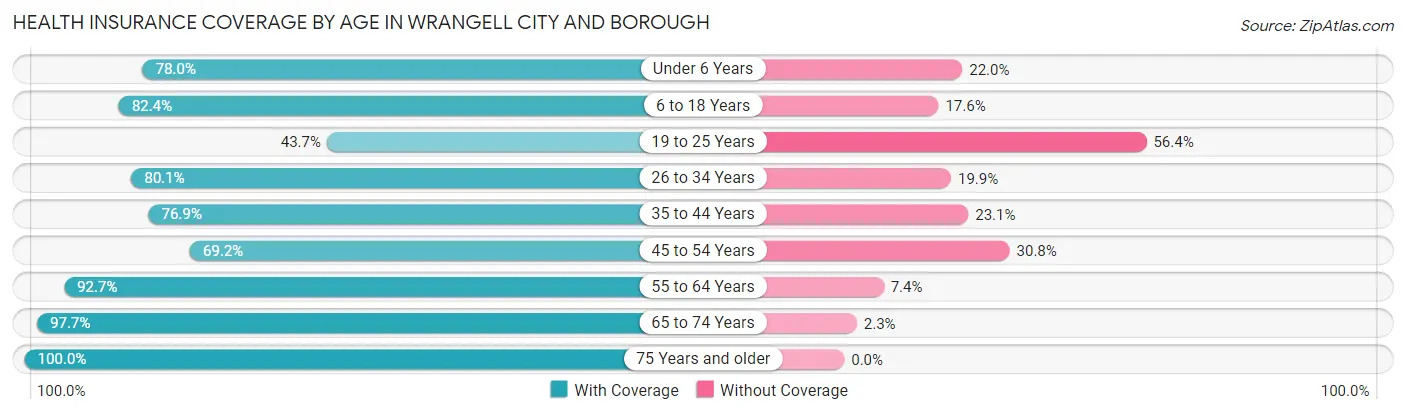
| Age Bracket | With Coverage | Without Coverage |
| Under 6 Years | 117 (78.0%) | 33 (22.0%) |
| 6 to 18 Years | 277 (82.4%) | 59 (17.6%) |
| 19 to 25 Years | 55 (43.6%) | 71 (56.4%) |
| 26 to 34 Years | 169 (80.1%) | 42 (19.9%) |
| 35 to 44 Years | 123 (76.9%) | 37 (23.1%) |
| 45 to 54 Years | 175 (69.2%) | 78 (30.8%) |
| 55 to 64 Years | 290 (92.6%) | 23 (7.3%) |
| 65 to 74 Years | 292 (97.7%) | 7 (2.3%) |
| 75 Years and older | 267 (100.0%) | 0 (0.0%) |
| Total | 1,765 (83.5%) | 350 (16.6%) |
Health Insurance Coverage by Citizenship Status in Wrangell city and borough
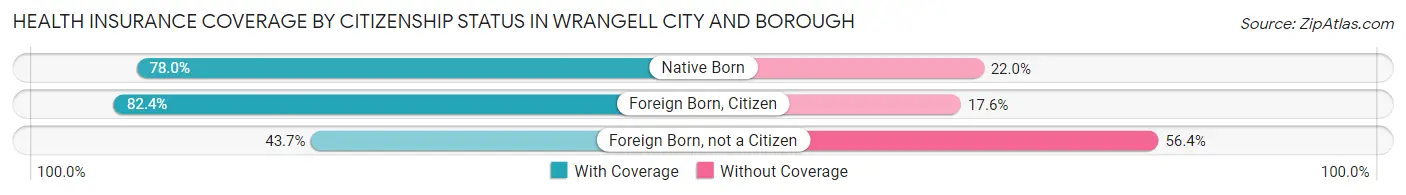
| Citizenship Status | With Coverage | Without Coverage |
| Native Born | 117 (78.0%) | 33 (22.0%) |
| Foreign Born, Citizen | 277 (82.4%) | 59 (17.6%) |
| Foreign Born, not a Citizen | 55 (43.6%) | 71 (56.4%) |
Health Insurance Coverage by Household Income in Wrangell city and borough
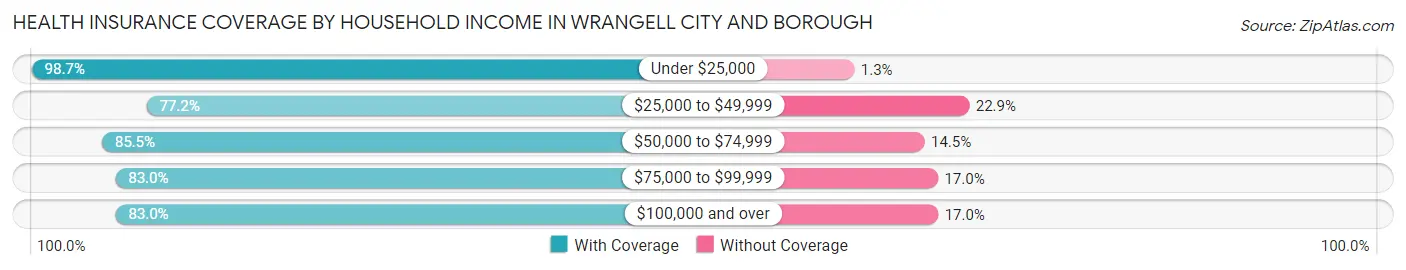
| Household Income | With Coverage | Without Coverage |
| Under $25,000 | 150 (98.7%) | 2 (1.3%) |
| $25,000 to $49,999 | 395 (77.1%) | 117 (22.9%) |
| $50,000 to $74,999 | 325 (85.5%) | 55 (14.5%) |
| $75,000 to $99,999 | 254 (83.0%) | 52 (17.0%) |
| $100,000 and over | 604 (83.0%) | 124 (17.0%) |
Public vs Private Health Insurance Coverage by Age in Wrangell city and borough
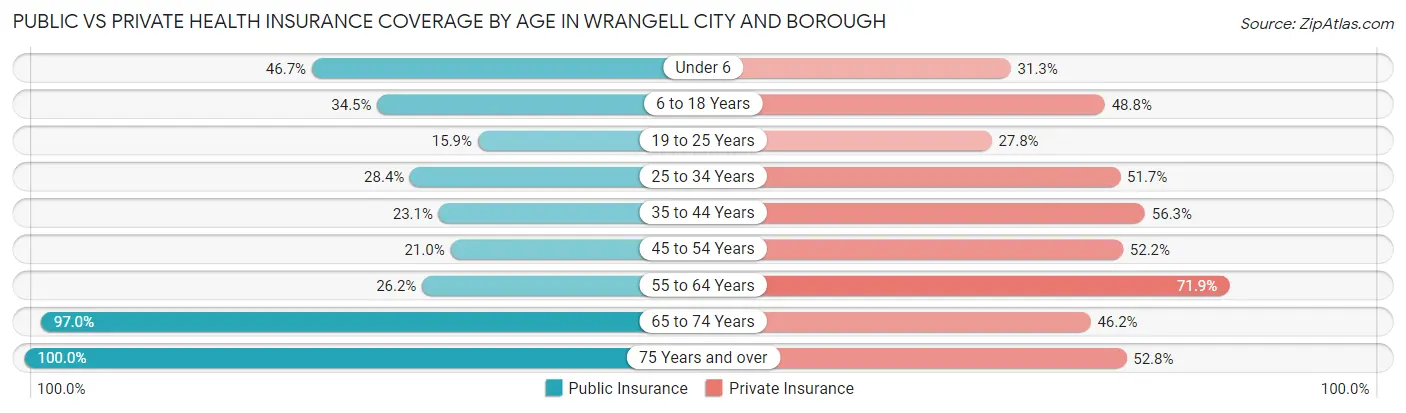
| Age Bracket | Public Insurance | Private Insurance |
| Under 6 | 70 (46.7%) | 47 (31.3%) |
| 6 to 18 Years | 116 (34.5%) | 164 (48.8%) |
| 19 to 25 Years | 20 (15.9%) | 35 (27.8%) |
| 25 to 34 Years | 60 (28.4%) | 109 (51.7%) |
| 35 to 44 Years | 37 (23.1%) | 90 (56.2%) |
| 45 to 54 Years | 53 (20.9%) | 132 (52.2%) |
| 55 to 64 Years | 82 (26.2%) | 225 (71.9%) |
| 65 to 74 Years | 290 (97.0%) | 138 (46.2%) |
| 75 Years and over | 267 (100.0%) | 141 (52.8%) |
| Total | 995 (47.0%) | 1,081 (51.1%) |
Disability Status by Sex by Age in Wrangell city and borough
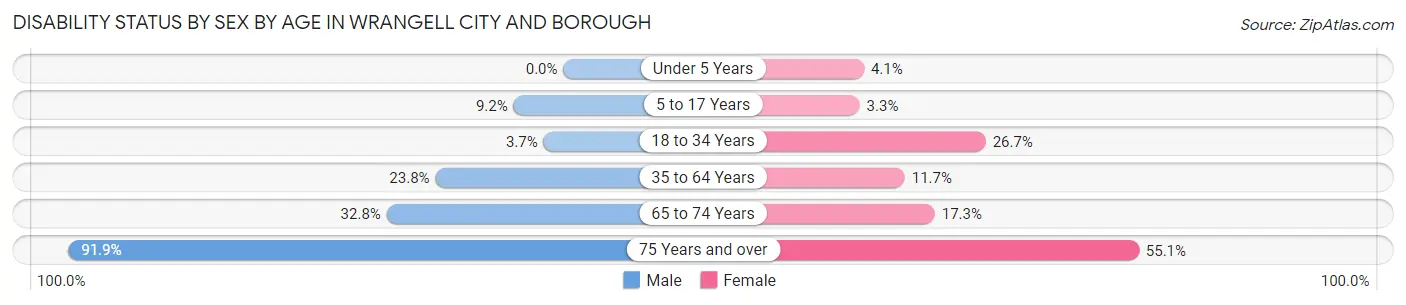
| Age Bracket | Male | Female |
| Under 5 Years | 0 (0.0%) | 3 (4.1%) |
| 5 to 17 Years | 17 (9.2%) | 5 (3.3%) |
| 18 to 34 Years | 7 (3.7%) | 43 (26.7%) |
| 35 to 64 Years | 81 (23.7%) | 45 (11.7%) |
| 65 to 74 Years | 62 (32.8%) | 19 (17.3%) |
| 75 Years and over | 147 (91.9%) | 59 (55.1%) |
Disability Class by Sex by Age in Wrangell city and borough
Disability Class: Hearing Difficulty
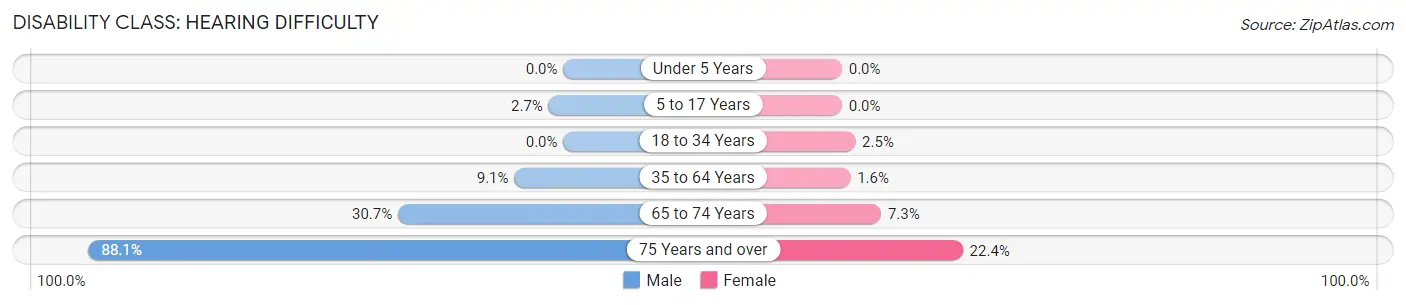
| Age Bracket | Male | Female |
| Under 5 Years | 0 (0.0%) | 0 (0.0%) |
| 5 to 17 Years | 5 (2.7%) | 0 (0.0%) |
| 18 to 34 Years | 0 (0.0%) | 4 (2.5%) |
| 35 to 64 Years | 31 (9.1%) | 6 (1.6%) |
| 65 to 74 Years | 58 (30.7%) | 8 (7.3%) |
| 75 Years and over | 141 (88.1%) | 24 (22.4%) |
Disability Class: Vision Difficulty
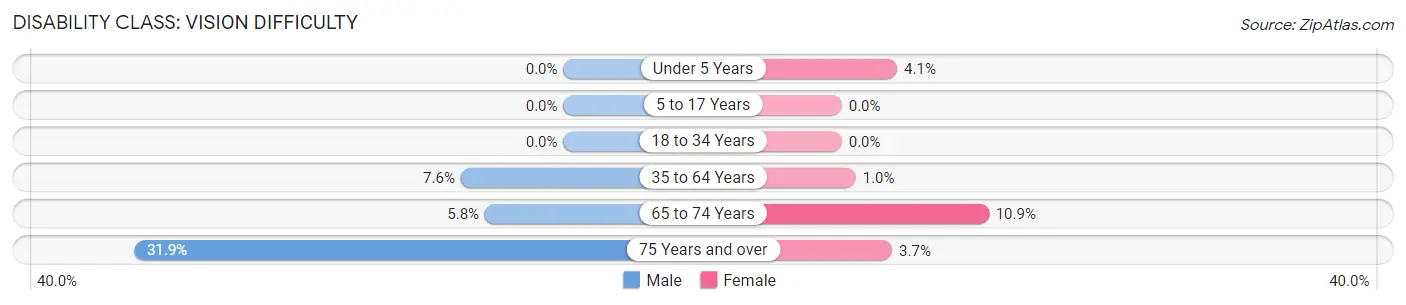
| Age Bracket | Male | Female |
| Under 5 Years | 0 (0.0%) | 3 (4.1%) |
| 5 to 17 Years | 0 (0.0%) | 0 (0.0%) |
| 18 to 34 Years | 0 (0.0%) | 0 (0.0%) |
| 35 to 64 Years | 26 (7.6%) | 4 (1.0%) |
| 65 to 74 Years | 11 (5.8%) | 12 (10.9%) |
| 75 Years and over | 51 (31.9%) | 4 (3.7%) |
Disability Class: Cognitive Difficulty
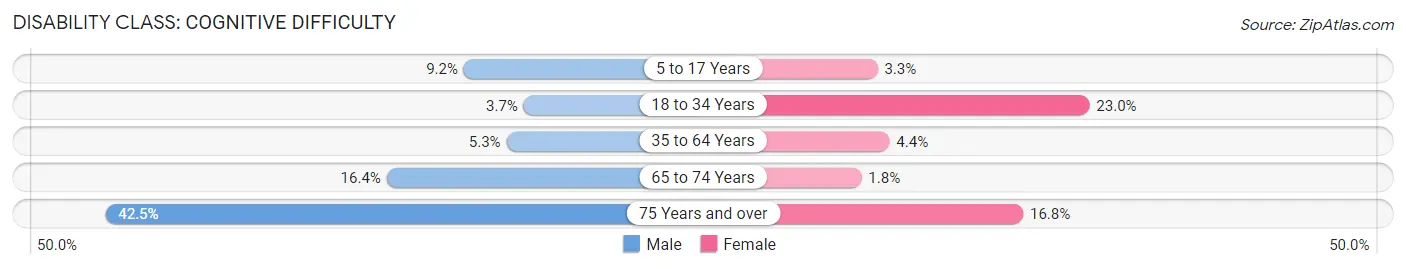
| Age Bracket | Male | Female |
| 5 to 17 Years | 17 (9.2%) | 5 (3.3%) |
| 18 to 34 Years | 7 (3.7%) | 37 (23.0%) |
| 35 to 64 Years | 18 (5.3%) | 17 (4.4%) |
| 65 to 74 Years | 31 (16.4%) | 2 (1.8%) |
| 75 Years and over | 68 (42.5%) | 18 (16.8%) |
Disability Class: Ambulatory Difficulty
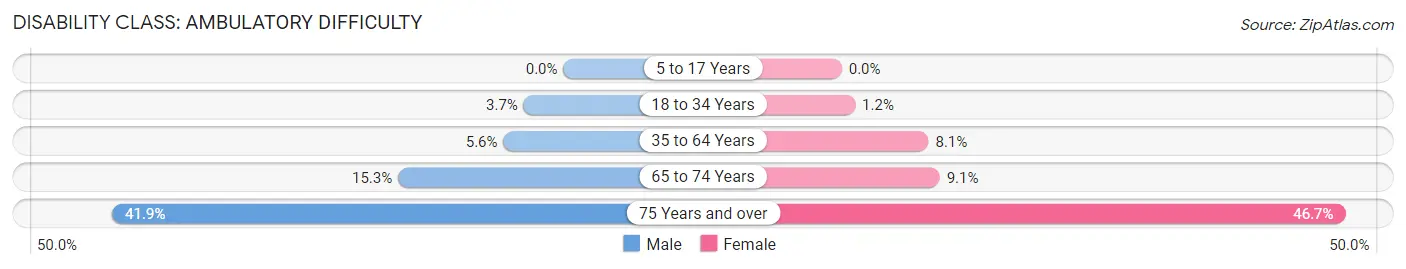
| Age Bracket | Male | Female |
| 5 to 17 Years | 0 (0.0%) | 0 (0.0%) |
| 18 to 34 Years | 7 (3.7%) | 2 (1.2%) |
| 35 to 64 Years | 19 (5.6%) | 31 (8.1%) |
| 65 to 74 Years | 29 (15.3%) | 10 (9.1%) |
| 75 Years and over | 67 (41.9%) | 50 (46.7%) |
Disability Class: Self-Care Difficulty
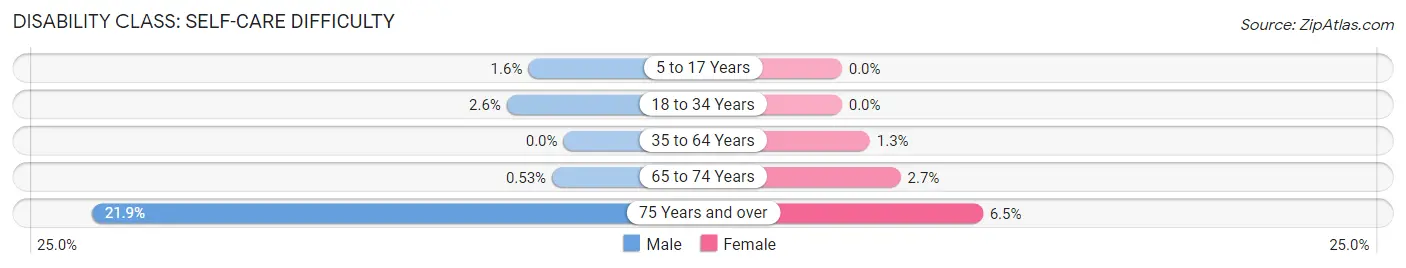
| Age Bracket | Male | Female |
| 5 to 17 Years | 3 (1.6%) | 0 (0.0%) |
| 18 to 34 Years | 5 (2.6%) | 0 (0.0%) |
| 35 to 64 Years | 0 (0.0%) | 5 (1.3%) |
| 65 to 74 Years | 1 (0.5%) | 3 (2.7%) |
| 75 Years and over | 35 (21.9%) | 7 (6.5%) |
Technology Access in Wrangell city and borough
Computing Device Access in Wrangell city and borough
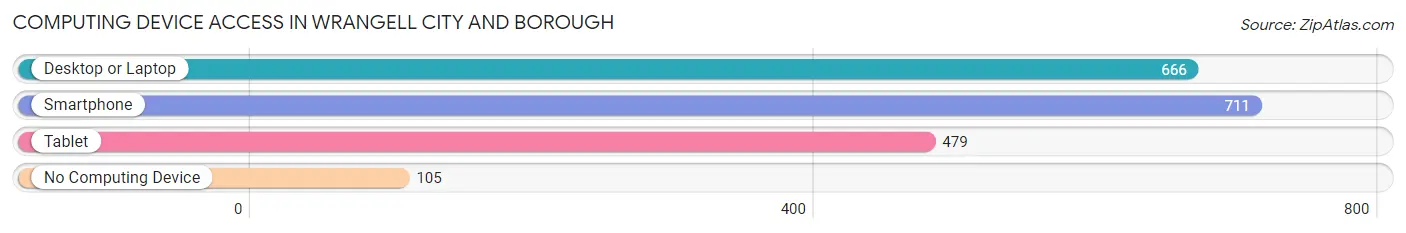
| Device Type | # Households | % Households |
| Desktop or Laptop | 666 | 71.8% |
| Smartphone | 711 | 76.6% |
| Tablet | 479 | 51.6% |
| No Computing Device | 105 | 11.3% |
| Total | 928 | 100.0% |
Internet Access in Wrangell city and borough
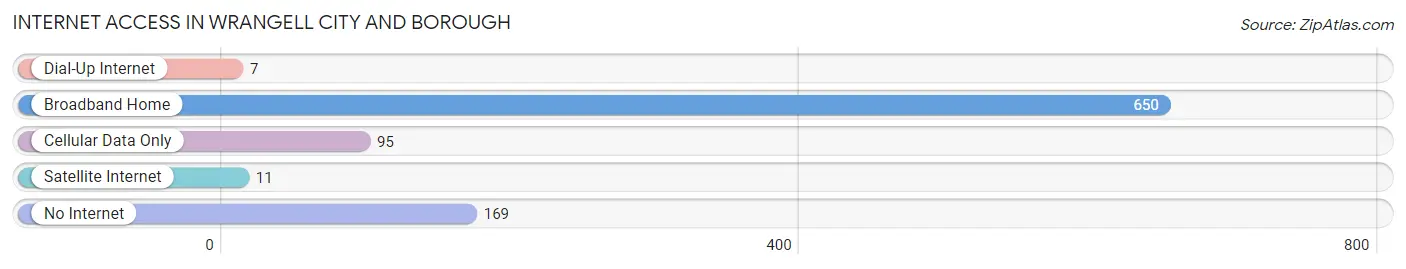
| Internet Type | # Households | % Households |
| Dial-Up Internet | 7 | 0.7% |
| Broadband Home | 650 | 70.0% |
| Cellular Data Only | 95 | 10.2% |
| Satellite Internet | 11 | 1.2% |
| No Internet | 169 | 18.2% |
| Total | 928 | 100.0% |
Wrangell city and borough Summary
Wrangell City and Borough is located in the southeastern part of Alaska, and is the northernmost of the Alexander Archipelago. It is bordered by the Stikine River to the north, the Wrangell Mountains to the east, and the Pacific Ocean to the south and west. The borough covers an area of 8,845 square miles, making it the fourth largest borough in Alaska. The population of the borough was 2,369 at the 2010 census, making it the least populous borough in the state.
History
The area that is now Wrangell City and Borough has been inhabited for thousands of years by the Tlingit people. The Tlingit name for the area is “Shtax’héen Kwáan”, which means “people of the saltwater”. The first Europeans to explore the area were Russian fur traders, who arrived in the early 19th century. The Russians established a trading post at the mouth of the Stikine River in 1834, and the settlement of Wrangell was founded in 1868.
The area was part of the Alaska Purchase in 1867, and became part of the newly formed Alaska Territory in 1912. In 1922, the area was incorporated as the City of Wrangell, and in 1963 it was reincorporated as the City and Borough of Wrangell.
Geography
Wrangell City and Borough is located in the southeastern part of Alaska, and is the northernmost of the Alexander Archipelago. It is bordered by the Stikine River to the north, the Wrangell Mountains to the east, and the Pacific Ocean to the south and west. The borough covers an area of 8,845 square miles, making it the fourth largest borough in Alaska.
The terrain of the borough is mostly mountainous, with the highest point being Mount Jarvis at 8,845 feet. The climate of the area is subarctic, with cold winters and mild summers.
Economy
The economy of Wrangell City and Borough is largely based on fishing, logging, and tourism. The area is home to several fish processing plants, and the timber industry is also an important part of the local economy. Tourism is also a major contributor to the economy, with visitors coming to the area to take advantage of the area’s natural beauty and outdoor recreation opportunities.
Demographics
As of the 2010 census, there were 2,369 people, 945 households, and 590 families residing in the borough. The population density was 0.3 people per square mile. The racial makeup of the borough was 75.3% White, 0.7% Black or African American, 16.2% Native American, 0.3% Asian, 0.1% Pacific Islander, 0.7% from other races, and 6.9% from two or more races. Hispanic or Latino of any race were 2.2% of the population.
The median income for a household in the borough was $45,000, and the median income for a family was $50,000. The per capita income for the borough was $20,000. About 11.2% of families and 14.2% of the population were below the poverty line, including 18.2% of those under age 18 and 8.3% of those age 65 or over.
Common Questions
What is Per Capita Income in Wrangell city and borough?
Per Capita income in Wrangell city and borough is $35,421.
What is the Median Family Income in Wrangell city and borough?
Median Family Income in Wrangell city and borough is $77,500.
What is the Median Household income in Wrangell city and borough?
Median Household Income in Wrangell city and borough is $61,000.
What is Income or Wage Gap in Wrangell city and borough?
Income or Wage Gap in Wrangell city and borough is 4.1%.
Women in Wrangell city and borough earn 95.9 cents for every dollar earned by a man.
What is Inequality or Gini Index in Wrangell city and borough?
Inequality or Gini Index in Wrangell city and borough is 0.41.
What is the Total Population of Wrangell city and borough?
Total Population of Wrangell city and borough is 2,134.
What is the Total Male Population of Wrangell city and borough?
Total Male Population of Wrangell city and borough is 1,136.
What is the Total Female Population of Wrangell city and borough?
Total Female Population of Wrangell city and borough is 998.
What is the Ratio of Males per 100 Females in Wrangell city and borough?
There are 113.83 Males per 100 Females in Wrangell city and borough.
What is the Ratio of Females per 100 Males in Wrangell city and borough?
There are 87.85 Females per 100 Males in Wrangell city and borough.
What is the Median Population Age in Wrangell city and borough?
Median Population Age in Wrangell city and borough is 48.9 Years.
What is the Average Family Size in Wrangell city and borough
Average Family Size in Wrangell city and borough is 3.1 People.
What is the Average Household Size in Wrangell city and borough
Average Household Size in Wrangell city and borough is 2.2 People.
How Large is the Labor Force in Wrangell city and borough?
There are 844 People in the Labor Forcein in Wrangell city and borough.
What is the Percentage of People in the Labor Force in Wrangell city and borough?
49.3% of People are in the Labor Force in Wrangell city and borough.
What is the Unemployment Rate in Wrangell city and borough?
Unemployment Rate in Wrangell city and borough is 3.4%.