Ridgeway, AK Map & Demographics
Ridgeway Map
Ridgeway Overview
$42,951
PER CAPITA INCOME
$125,185
AVG FAMILY INCOME
$101,188
AVG HOUSEHOLD INCOME
53.3%
WAGE / INCOME GAP [ % ]
46.7¢/ $1
WAGE / INCOME GAP [ $ ]
0.39
INEQUALITY / GINI INDEX
2,749
TOTAL POPULATION
1,383
MALE POPULATION
1,366
FEMALE POPULATION
101.24
MALES / 100 FEMALES
98.77
FEMALES / 100 MALES
42.8
MEDIAN AGE
3.3
AVG FAMILY SIZE
2.7
AVG HOUSEHOLD SIZE
1,158
LABOR FORCE [ PEOPLE ]
56.6%
PERCENT IN LABOR FORCE
6.7%
UNEMPLOYMENT RATE
Income in Ridgeway
Income Overview in Ridgeway
Per Capita Income in Ridgeway is $42,951, while median incomes of families and households are $125,185 and $101,188 respectively.
| Characteristic | Number | Measure |
| Per Capita Income | 2,749 | $42,951 |
| Median Family Income | 690 | $125,185 |
| Mean Family Income | 690 | $142,928 |
| Median Household Income | 1,021 | $101,188 |
| Mean Household Income | 1,021 | $120,559 |
| Income Deficit | 690 | $0 |
| Wage / Income Gap (%) | 2,749 | 53.30% |
| Wage / Income Gap ($) | 2,749 | 46.70¢ per $1 |
| Gini / Inequality Index | 2,749 | 0.39 |
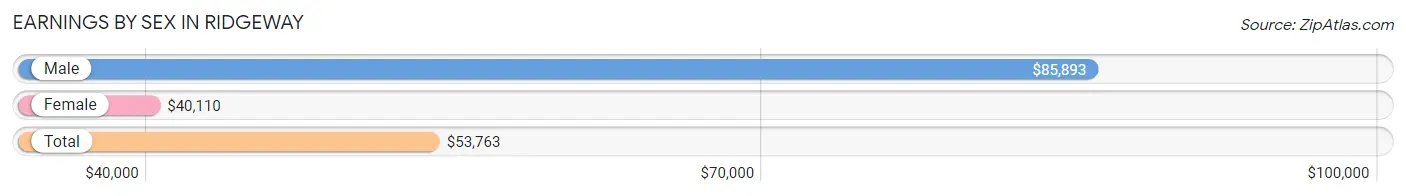
Earnings by Sex in Ridgeway
Average Earnings in Ridgeway are $53,763, $85,893 for men and $40,110 for women, a difference of 53.3%.
| Sex | Number | Average Earnings |
| Male | 692 (52.3%) | $85,893 |
| Female | 631 (47.7%) | $40,110 |
| Total | 1,323 (100.0%) | $53,763 |
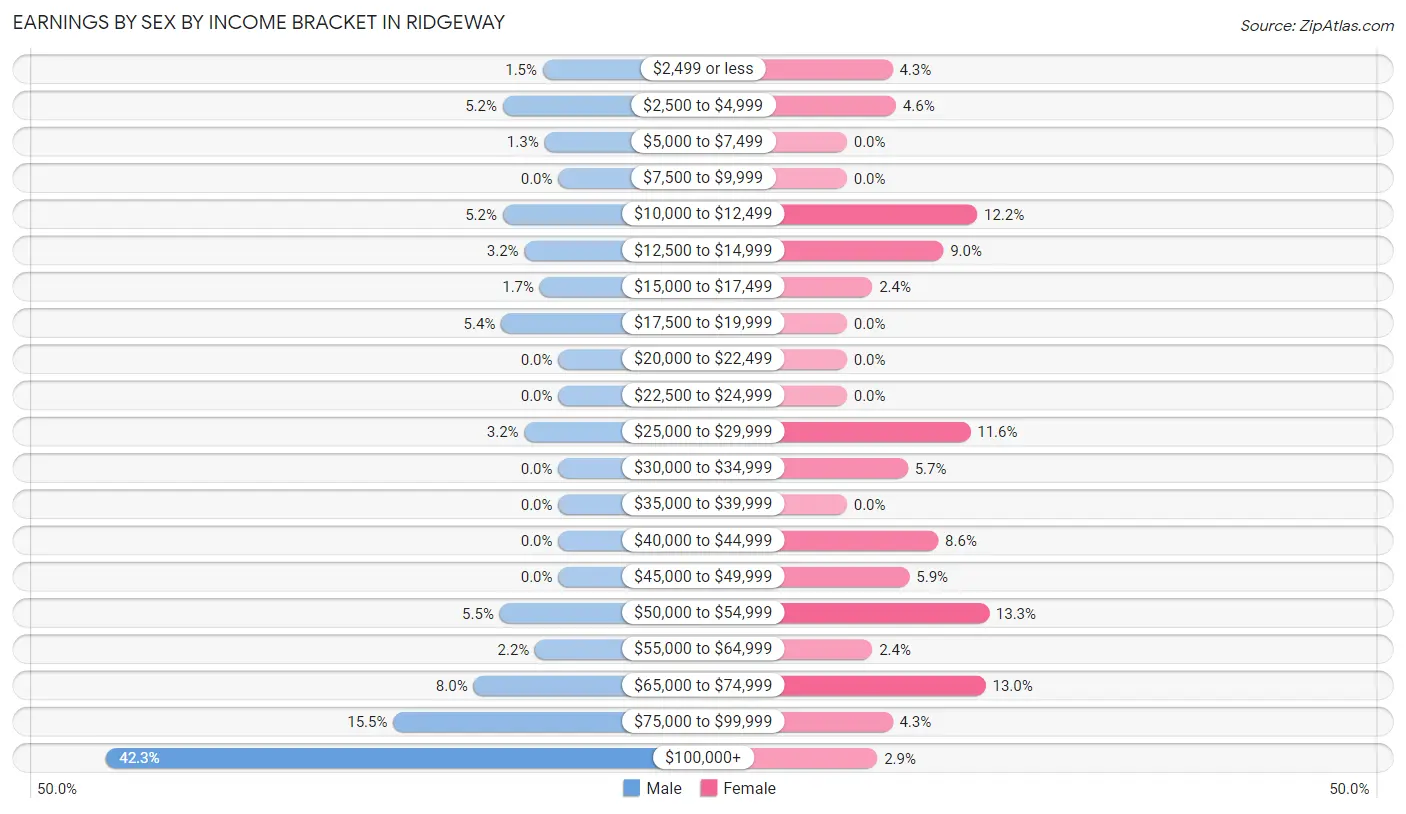
Earnings by Sex by Income Bracket in Ridgeway
The most common earnings brackets in Ridgeway are $100,000+ for men (293 | 42.3%) and $50,000 to $54,999 for women (84 | 13.3%).
| Income | Male | Female |
| $2,499 or less | 10 (1.5%) | 27 (4.3%) |
| $2,500 to $4,999 | 36 (5.2%) | 29 (4.6%) |
| $5,000 to $7,499 | 9 (1.3%) | 0 (0.0%) |
| $7,500 to $9,999 | 0 (0.0%) | 0 (0.0%) |
| $10,000 to $12,499 | 36 (5.2%) | 77 (12.2%) |
| $12,500 to $14,999 | 22 (3.2%) | 57 (9.0%) |
| $15,000 to $17,499 | 12 (1.7%) | 15 (2.4%) |
| $17,500 to $19,999 | 37 (5.3%) | 0 (0.0%) |
| $20,000 to $22,499 | 0 (0.0%) | 0 (0.0%) |
| $22,500 to $24,999 | 0 (0.0%) | 0 (0.0%) |
| $25,000 to $29,999 | 22 (3.2%) | 73 (11.6%) |
| $30,000 to $34,999 | 0 (0.0%) | 36 (5.7%) |
| $35,000 to $39,999 | 0 (0.0%) | 0 (0.0%) |
| $40,000 to $44,999 | 0 (0.0%) | 54 (8.6%) |
| $45,000 to $49,999 | 0 (0.0%) | 37 (5.9%) |
| $50,000 to $54,999 | 38 (5.5%) | 84 (13.3%) |
| $55,000 to $64,999 | 15 (2.2%) | 15 (2.4%) |
| $65,000 to $74,999 | 55 (8.0%) | 82 (13.0%) |
| $75,000 to $99,999 | 107 (15.5%) | 27 (4.3%) |
| $100,000+ | 293 (42.3%) | 18 (2.9%) |
| Total | 692 (100.0%) | 631 (100.0%) |
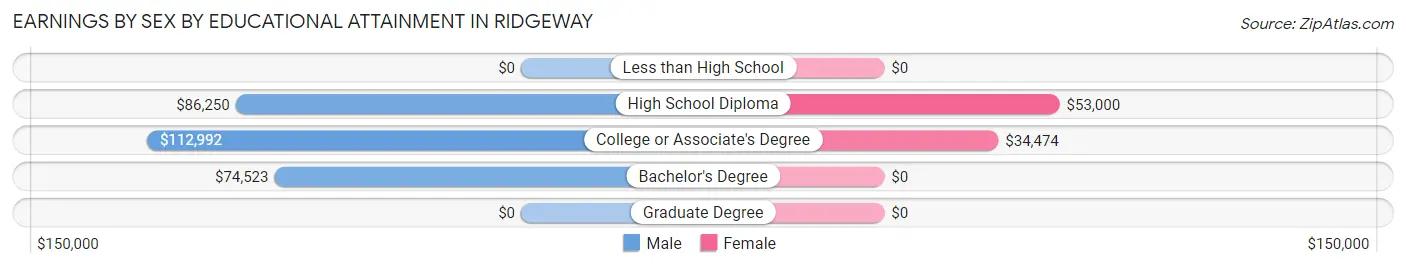
Earnings by Sex by Educational Attainment in Ridgeway
Average earnings in Ridgeway are $91,563 for men and $42,169 for women, a difference of 53.9%. Men with an educational attainment of college or associate's degree enjoy the highest average annual earnings of $112,992, while those with bachelor's degree education earn the least with $74,523. Women with an educational attainment of high school diploma earn the most with the average annual earnings of $53,000, while those with college or associate's degree education have the smallest earnings of $34,474.
| Educational Attainment | Male Income | Female Income |
| Less than High School | - | - |
| High School Diploma | $86,250 | $53,000 |
| College or Associate's Degree | $112,992 | $34,474 |
| Bachelor's Degree | $74,523 | $0 |
| Graduate Degree | - | - |
| Total | $91,563 | $42,169 |
Family Income in Ridgeway
Family Income Brackets in Ridgeway
According to the Ridgeway family income data, there are 204 families falling into the $200,000+ income range, which is the most common income bracket and makes up 29.6% of all families.
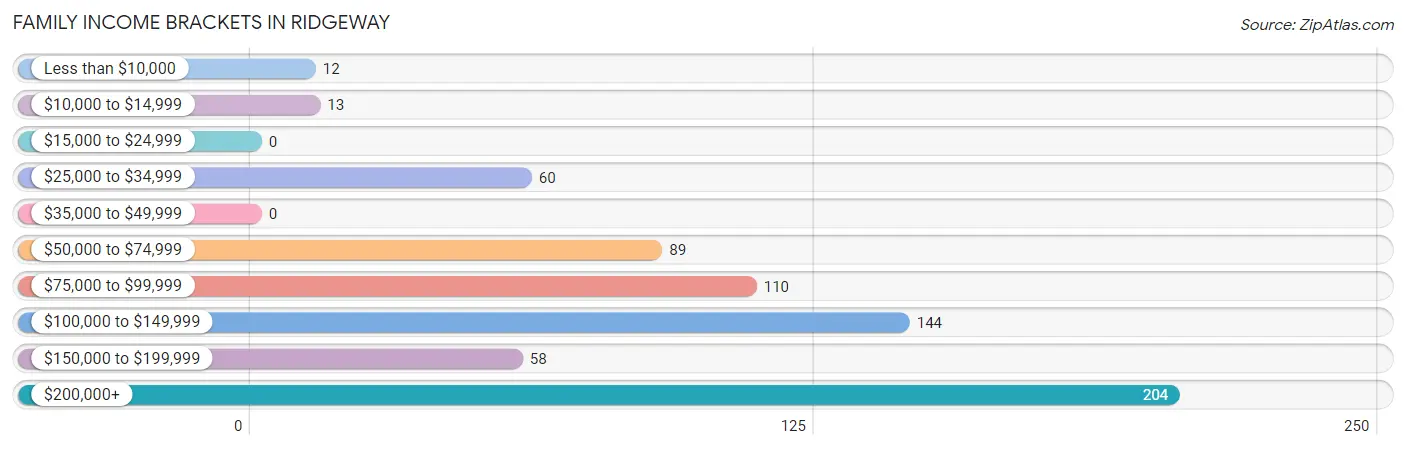
| Income Bracket | # Families | % Families |
| Less than $10,000 | 12 | 1.7% |
| $10,000 to $14,999 | 13 | 1.9% |
| $15,000 to $24,999 | 0 | 0.0% |
| $25,000 to $34,999 | 60 | 8.7% |
| $35,000 to $49,999 | 0 | 0.0% |
| $50,000 to $74,999 | 89 | 12.9% |
| $75,000 to $99,999 | 110 | 15.9% |
| $100,000 to $149,999 | 144 | 20.9% |
| $150,000 to $199,999 | 58 | 8.4% |
| $200,000+ | 204 | 29.6% |
Family Income by Famaliy Size in Ridgeway
5-person families (130 | 18.8%) account for the highest median family income in Ridgeway with $205,652 per family, while 2-person families (344 | 49.9%) have the highest median income of $52,106 per family member.
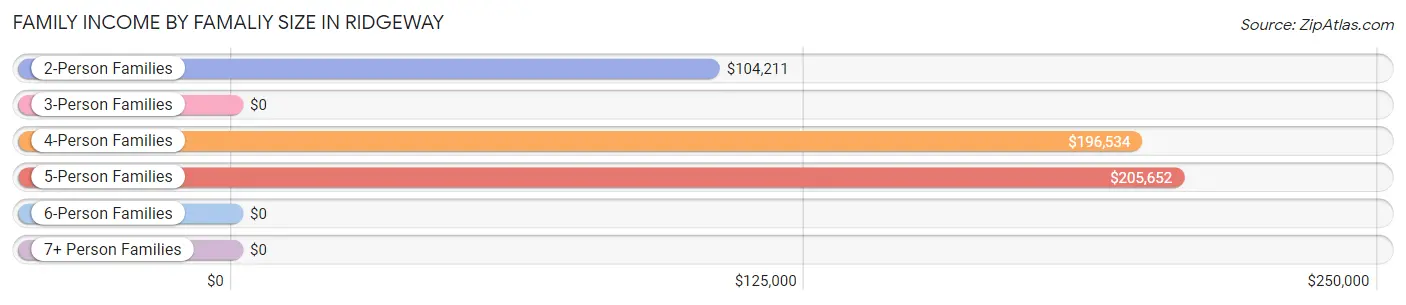
| Income Bracket | # Families | Median Income |
| 2-Person Families | 344 (49.9%) | $104,211 |
| 3-Person Families | 101 (14.6%) | $0 |
| 4-Person Families | 73 (10.6%) | $196,534 |
| 5-Person Families | 130 (18.8%) | $205,652 |
| 6-Person Families | 18 (2.6%) | $0 |
| 7+ Person Families | 24 (3.5%) | $0 |
| Total | 690 (100.0%) | $125,185 |
Family Income by Number of Earners in Ridgeway
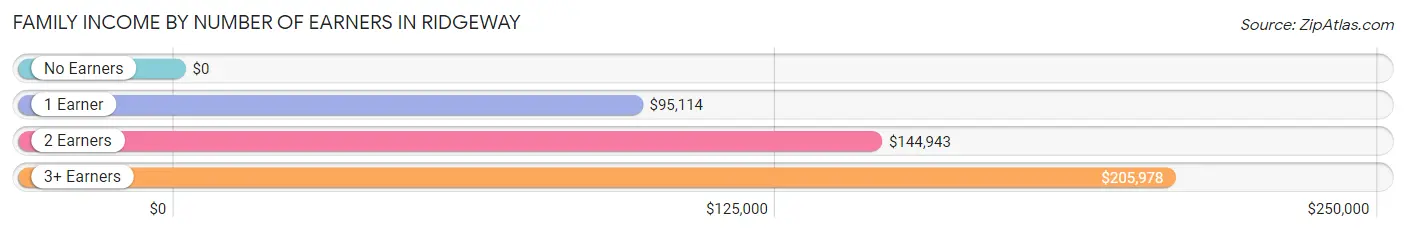
| Number of Earners | # Families | Median Income |
| No Earners | 117 (17.0%) | $0 |
| 1 Earner | 182 (26.4%) | $95,114 |
| 2 Earners | 293 (42.5%) | $144,943 |
| 3+ Earners | 98 (14.2%) | $205,978 |
| Total | 690 (100.0%) | $125,185 |
Household Income in Ridgeway
Household Income Brackets in Ridgeway
With 243 households falling in the category, the $100,000 to $149,999 income range is the most frequent in Ridgeway, accounting for 23.8% of all households. In contrast, only 22 households (2.1%) fall into the $10,000 to $14,999 income bracket, making it the least populous group.
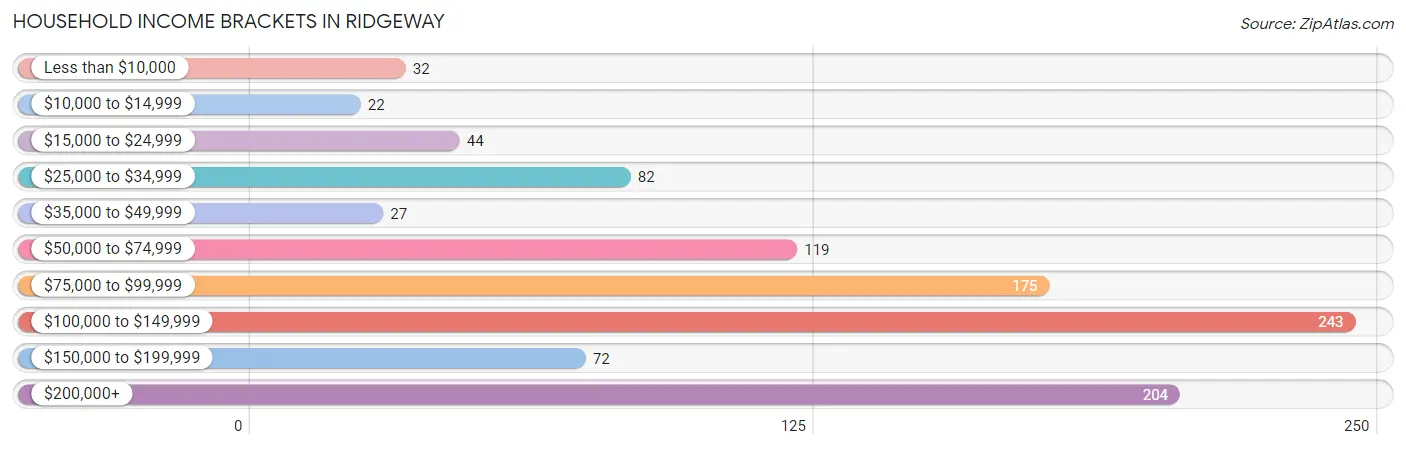
| Income Bracket | # Households | % Households |
| Less than $10,000 | 32 | 3.1% |
| $10,000 to $14,999 | 22 | 2.2% |
| $15,000 to $24,999 | 44 | 4.3% |
| $25,000 to $34,999 | 82 | 8.0% |
| $35,000 to $49,999 | 27 | 2.6% |
| $50,000 to $74,999 | 119 | 11.7% |
| $75,000 to $99,999 | 175 | 17.1% |
| $100,000 to $149,999 | 243 | 23.8% |
| $150,000 to $199,999 | 72 | 7.1% |
| $200,000+ | 204 | 20.0% |
Household Income by Householder Age in Ridgeway
The median household income in Ridgeway is $101,188, with the highest median household income of $140,500 found in the 45 to 64 years age bracket for the primary householder. A total of 454 households (44.5%) fall into this category. Meanwhile, the 15 to 24 years age bracket for the primary householder has the lowest median household income of $0, with 12 households (1.2%) in this group.
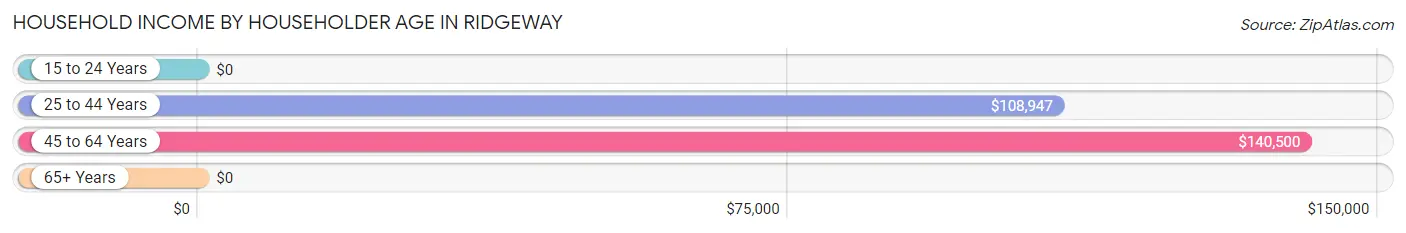
| Income Bracket | # Households | Median Income |
| 15 to 24 Years | 12 (1.2%) | $0 |
| 25 to 44 Years | 258 (25.3%) | $108,947 |
| 45 to 64 Years | 454 (44.5%) | $140,500 |
| 65+ Years | 297 (29.1%) | $0 |
| Total | 1,021 (100.0%) | $101,188 |
Poverty in Ridgeway
Income Below Poverty by Sex and Age in Ridgeway
With 5.9% poverty level for males and 2.1% for females among the residents of Ridgeway, 65 to 74 year old males and 65 to 74 year old females are the most vulnerable to poverty, with 31 males (22.5%) and 16 females (13.1%) in their respective age groups living below the poverty level.
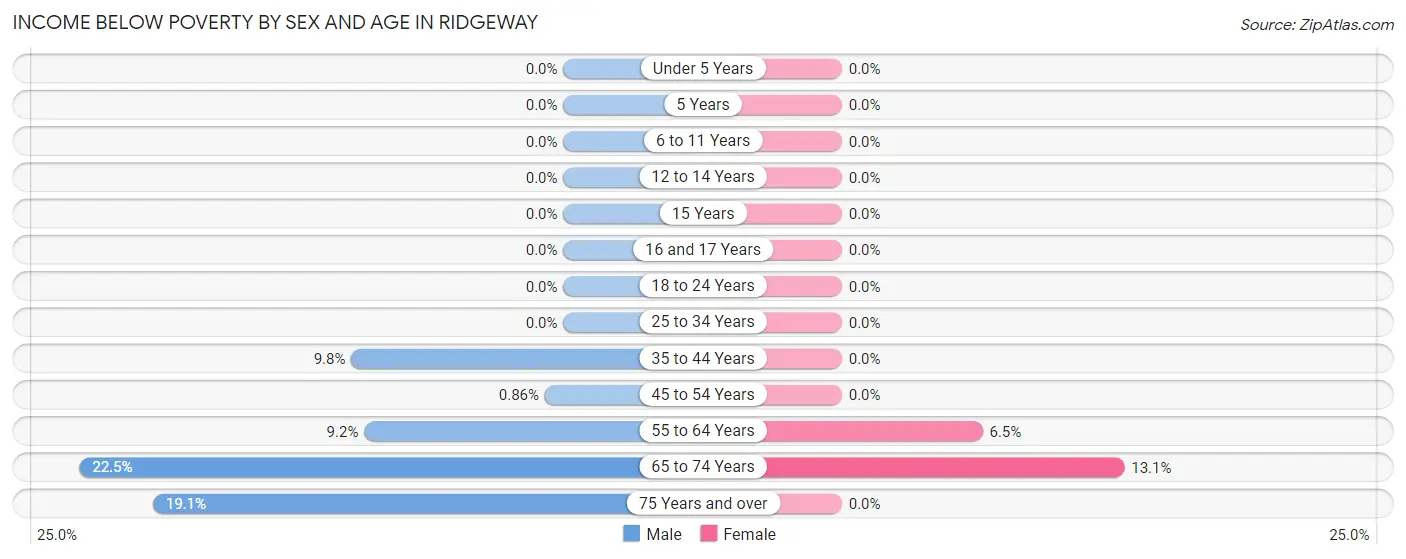
| Age Bracket | Male | Female |
| Under 5 Years | 0 (0.0%) | 0 (0.0%) |
| 5 Years | 0 (0.0%) | 0 (0.0%) |
| 6 to 11 Years | 0 (0.0%) | 0 (0.0%) |
| 12 to 14 Years | 0 (0.0%) | 0 (0.0%) |
| 15 Years | 0 (0.0%) | 0 (0.0%) |
| 16 and 17 Years | 0 (0.0%) | 0 (0.0%) |
| 18 to 24 Years | 0 (0.0%) | 0 (0.0%) |
| 25 to 34 Years | 0 (0.0%) | 0 (0.0%) |
| 35 to 44 Years | 6 (9.8%) | 0 (0.0%) |
| 45 to 54 Years | 2 (0.9%) | 0 (0.0%) |
| 55 to 64 Years | 22 (9.2%) | 13 (6.5%) |
| 65 to 74 Years | 31 (22.5%) | 16 (13.1%) |
| 75 Years and over | 20 (19.1%) | 0 (0.0%) |
| Total | 81 (5.9%) | 29 (2.1%) |
Income Above Poverty by Sex and Age in Ridgeway
According to the poverty statistics in Ridgeway, males aged under 5 years and females aged under 5 years are the age groups that are most secure financially, with 100.0% of males and 100.0% of females in these age groups living above the poverty line.
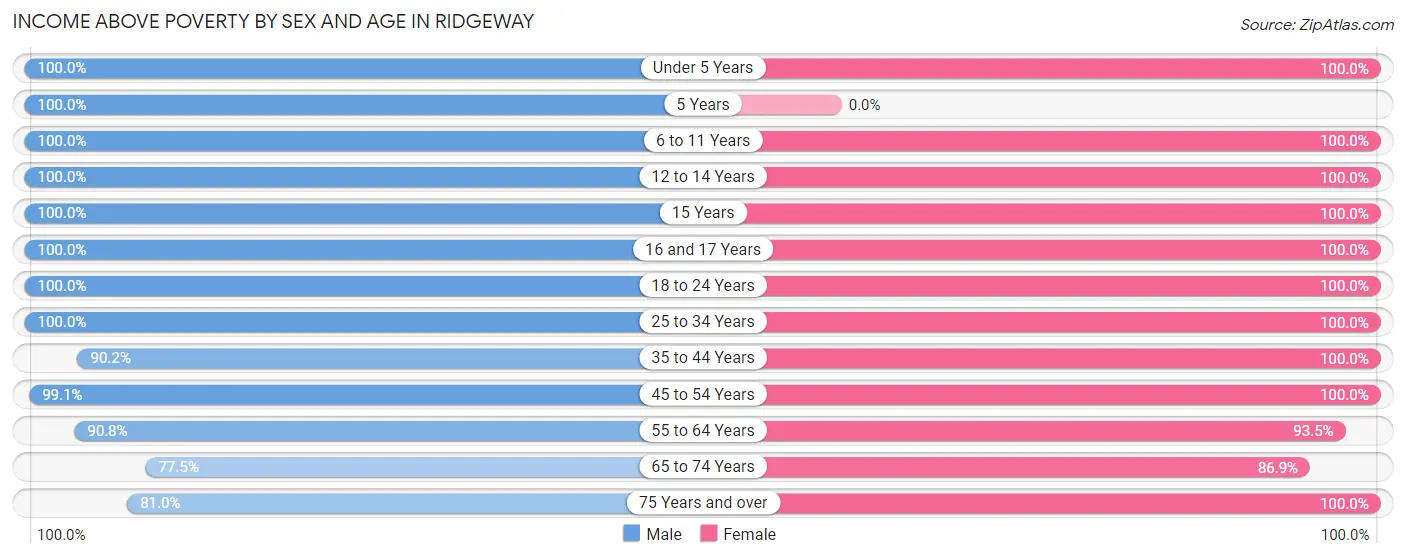
| Age Bracket | Male | Female |
| Under 5 Years | 120 (100.0%) | 115 (100.0%) |
| 5 Years | 36 (100.0%) | 0 (0.0%) |
| 6 to 11 Years | 115 (100.0%) | 86 (100.0%) |
| 12 to 14 Years | 86 (100.0%) | 98 (100.0%) |
| 15 Years | 25 (100.0%) | 22 (100.0%) |
| 16 and 17 Years | 75 (100.0%) | 48 (100.0%) |
| 18 to 24 Years | 12 (100.0%) | 52 (100.0%) |
| 25 to 34 Years | 139 (100.0%) | 169 (100.0%) |
| 35 to 44 Years | 55 (90.2%) | 205 (100.0%) |
| 45 to 54 Years | 231 (99.1%) | 166 (100.0%) |
| 55 to 64 Years | 216 (90.8%) | 186 (93.5%) |
| 65 to 74 Years | 107 (77.5%) | 106 (86.9%) |
| 75 Years and over | 85 (80.9%) | 84 (100.0%) |
| Total | 1,302 (94.1%) | 1,337 (97.9%) |
Income Below Poverty Among Married-Couple Families in Ridgeway
The poverty statistics for married-couple families in Ridgeway show that 4.0% or 25 of the total 630 families live below the poverty line. Families with no children have the highest poverty rate of 7.2%, comprising of 25 families. On the other hand, families with 1 or 2 children have the lowest poverty rate of 0.0%, which includes 0 families.
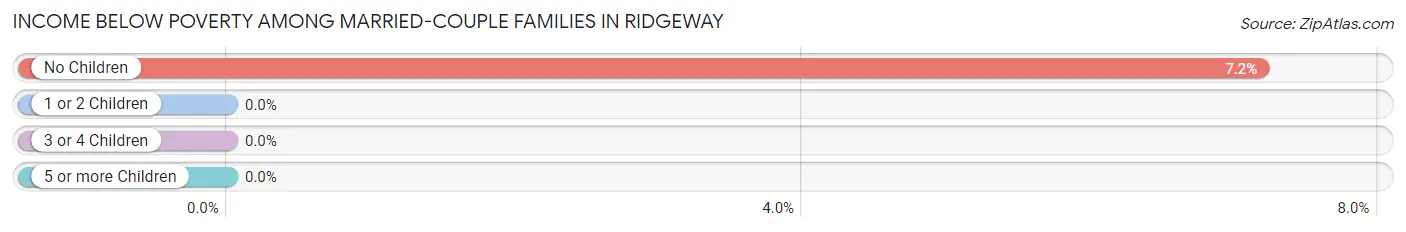
| Children | Above Poverty | Below Poverty |
| No Children | 323 (92.8%) | 25 (7.2%) |
| 1 or 2 Children | 110 (100.0%) | 0 (0.0%) |
| 3 or 4 Children | 148 (100.0%) | 0 (0.0%) |
| 5 or more Children | 24 (100.0%) | 0 (0.0%) |
| Total | 605 (96.0%) | 25 (4.0%) |
Income Below Poverty Among Single-Parent Households in Ridgeway
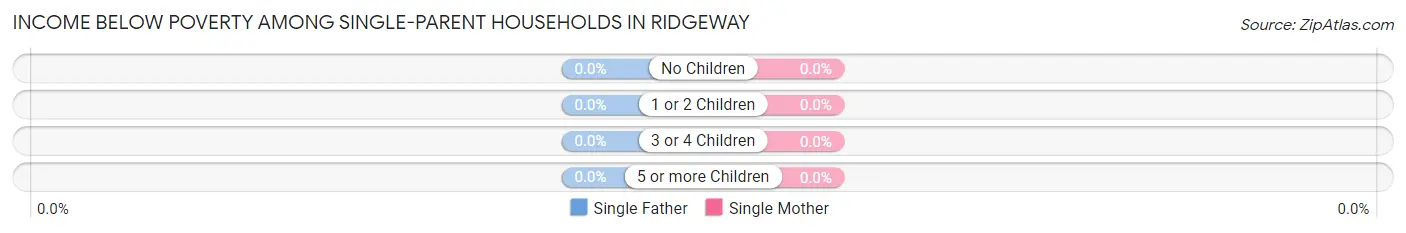
| Children | Single Father | Single Mother |
| No Children | 0 (0.0%) | 0 (0.0%) |
| 1 or 2 Children | 0 (0.0%) | 0 (0.0%) |
| 3 or 4 Children | 0 (0.0%) | 0 (0.0%) |
| 5 or more Children | 0 (0.0%) | 0 (0.0%) |
| Total | 0 (0.0%) | 0 (0.0%) |
Income Below Poverty Among Married-Couple vs Single-Parent Households in Ridgeway
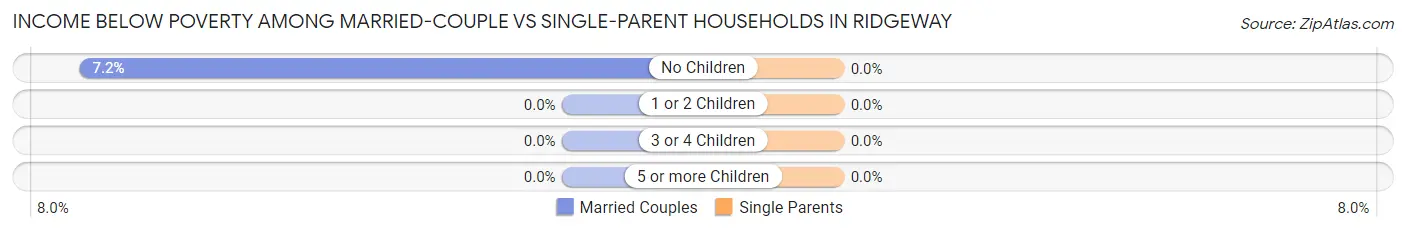
| Children | Married-Couple Families | Single-Parent Households |
| No Children | 25 (7.2%) | 0 (0.0%) |
| 1 or 2 Children | 0 (0.0%) | 0 (0.0%) |
| 3 or 4 Children | 0 (0.0%) | 0 (0.0%) |
| 5 or more Children | 0 (0.0%) | 0 (0.0%) |
| Total | 25 (4.0%) | 0 (0.0%) |
Race in Ridgeway
The most populous races in Ridgeway are White / Caucasian (2,349 | 85.5%), Two or more Races (280 | 10.2%), and Native / Alaskan (91 | 3.3%).
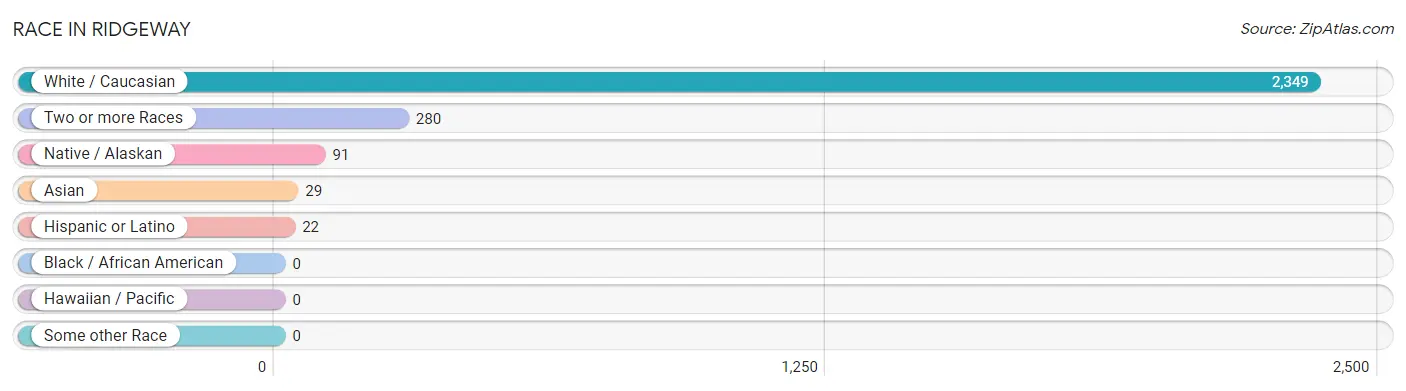
| Race | # Population | % Population |
| Asian | 29 | 1.1% |
| Black / African American | 0 | 0.0% |
| Hawaiian / Pacific | 0 | 0.0% |
| Hispanic or Latino | 22 | 0.8% |
| Native / Alaskan | 91 | 3.3% |
| White / Caucasian | 2,349 | 85.5% |
| Two or more Races | 280 | 10.2% |
| Some other Race | 0 | 0.0% |
| Total | 2,749 | 100.0% |
Ancestry in Ridgeway
The most populous ancestries reported in Ridgeway are German (519 | 18.9%), English (441 | 16.0%), Norwegian (281 | 10.2%), Irish (244 | 8.9%), and French (144 | 5.2%), together accounting for 59.3% of all Ridgeway residents.
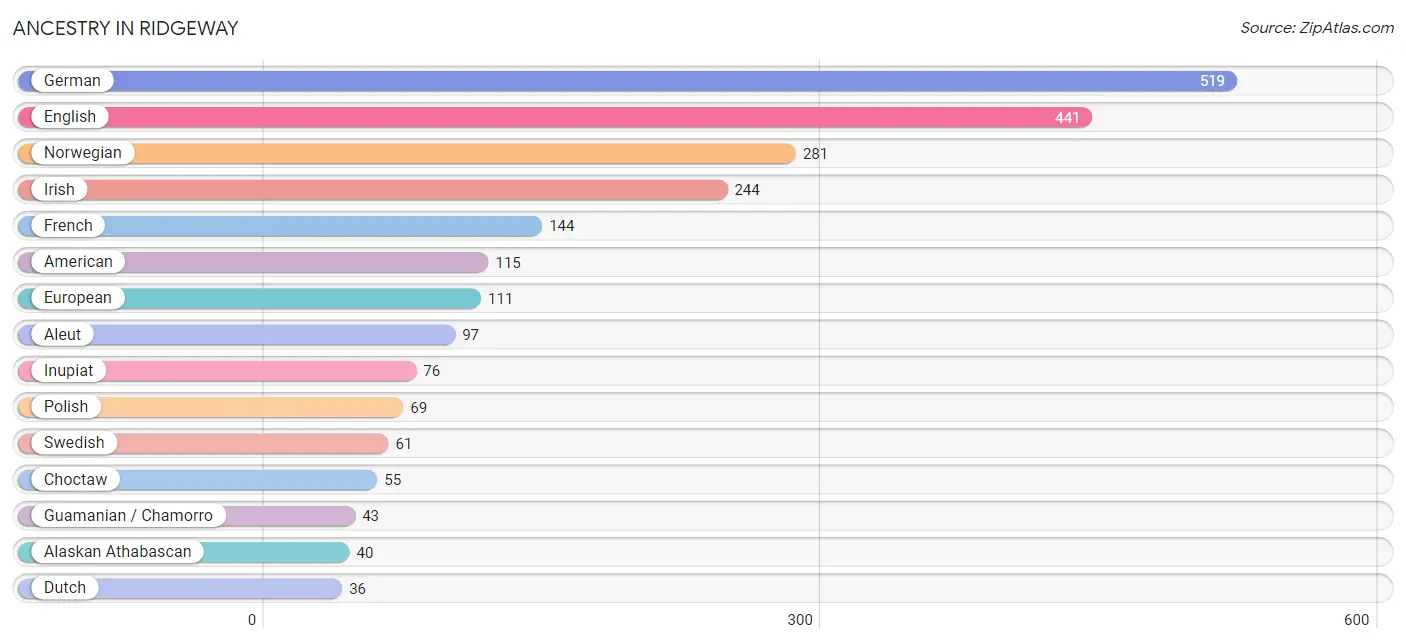
| Ancestry | # Population | % Population |
| Alaska Native | 29 | 1.1% |
| Alaskan Athabascan | 40 | 1.5% |
| Aleut | 97 | 3.5% |
| American | 115 | 4.2% |
| Belgian | 14 | 0.5% |
| Bhutanese | 29 | 1.1% |
| Canadian | 16 | 0.6% |
| Cherokee | 12 | 0.4% |
| Choctaw | 55 | 2.0% |
| Czechoslovakian | 14 | 0.5% |
| Dutch | 36 | 1.3% |
| English | 441 | 16.0% |
| European | 111 | 4.0% |
| French | 144 | 5.2% |
| French Canadian | 25 | 0.9% |
| German | 519 | 18.9% |
| Guamanian / Chamorro | 43 | 1.6% |
| Inupiat | 76 | 2.8% |
| Irish | 244 | 8.9% |
| Italian | 22 | 0.8% |
| Mexican | 22 | 0.8% |
| Northern European | 12 | 0.4% |
| Norwegian | 281 | 10.2% |
| Polish | 69 | 2.5% |
| Russian | 27 | 1.0% |
| Scandinavian | 3 | 0.1% |
| Scottish | 33 | 1.2% |
| Swedish | 61 | 2.2% | View All 28 Rows |
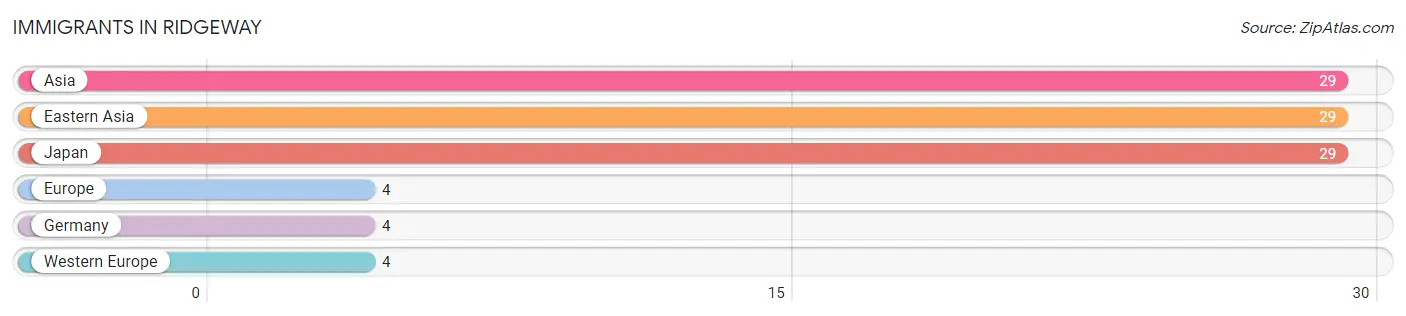
Immigrants in Ridgeway
The most numerous immigrant groups reported in Ridgeway came from Asia (29 | 1.1%), Eastern Asia (29 | 1.1%), Japan (29 | 1.1%), Europe (4 | 0.2%), and Germany (4 | 0.2%), together accounting for 3.5% of all Ridgeway residents.
| Immigration Origin | # Population | % Population |
| Asia | 29 | 1.1% |
| Eastern Asia | 29 | 1.1% |
| Europe | 4 | 0.2% |
| Germany | 4 | 0.2% |
| Japan | 29 | 1.1% |
| Western Europe | 4 | 0.2% | View All 6 Rows |
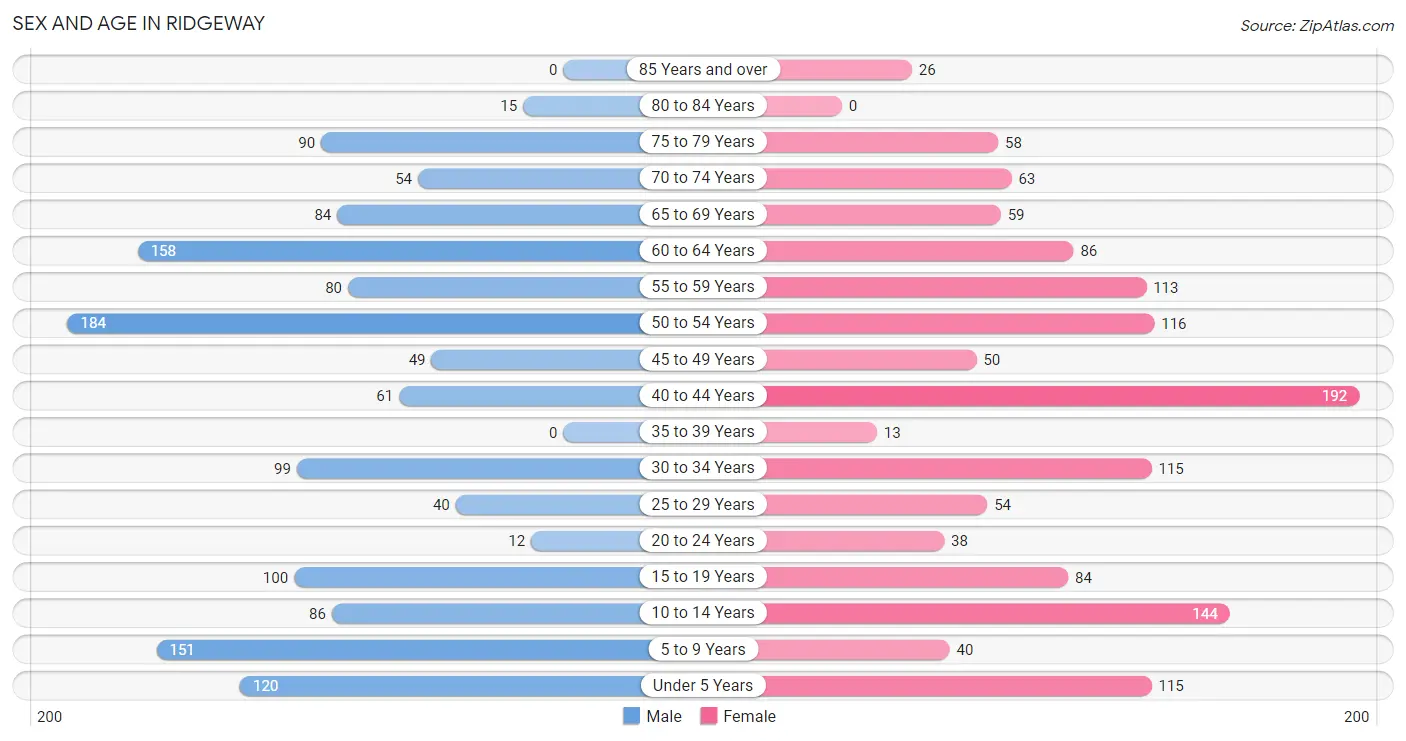
Sex and Age in Ridgeway
Sex and Age in Ridgeway
The most populous age groups in Ridgeway are 50 to 54 Years (184 | 13.3%) for men and 40 to 44 Years (192 | 14.1%) for women.
| Age Bracket | Male | Female |
| Under 5 Years | 120 (8.7%) | 115 (8.4%) |
| 5 to 9 Years | 151 (10.9%) | 40 (2.9%) |
| 10 to 14 Years | 86 (6.2%) | 144 (10.5%) |
| 15 to 19 Years | 100 (7.2%) | 84 (6.1%) |
| 20 to 24 Years | 12 (0.9%) | 38 (2.8%) |
| 25 to 29 Years | 40 (2.9%) | 54 (4.0%) |
| 30 to 34 Years | 99 (7.2%) | 115 (8.4%) |
| 35 to 39 Years | 0 (0.0%) | 13 (0.9%) |
| 40 to 44 Years | 61 (4.4%) | 192 (14.1%) |
| 45 to 49 Years | 49 (3.5%) | 50 (3.7%) |
| 50 to 54 Years | 184 (13.3%) | 116 (8.5%) |
| 55 to 59 Years | 80 (5.8%) | 113 (8.3%) |
| 60 to 64 Years | 158 (11.4%) | 86 (6.3%) |
| 65 to 69 Years | 84 (6.1%) | 59 (4.3%) |
| 70 to 74 Years | 54 (3.9%) | 63 (4.6%) |
| 75 to 79 Years | 90 (6.5%) | 58 (4.3%) |
| 80 to 84 Years | 15 (1.1%) | 0 (0.0%) |
| 85 Years and over | 0 (0.0%) | 26 (1.9%) |
| Total | 1,383 (100.0%) | 1,366 (100.0%) |
Families and Households in Ridgeway
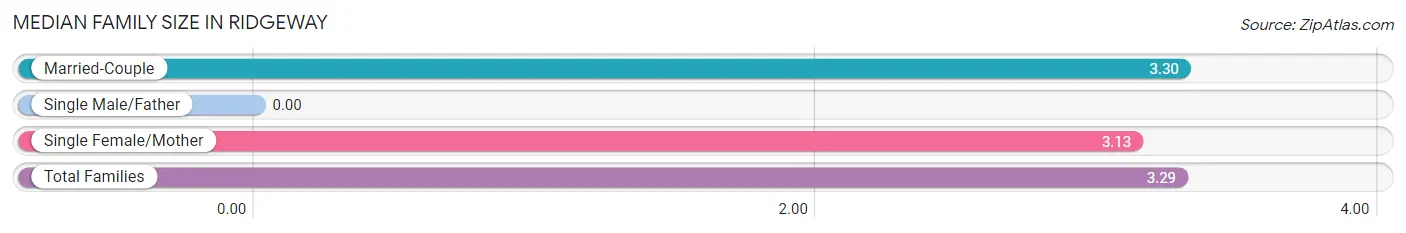
Median Family Size in Ridgeway
| Family Type | # Families | Family Size |
| Married-Couple | 630 (91.3%) | 3.30 |
| Single Male/Father | 0 (0.0%) | - |
| Single Female/Mother | 60 (8.7%) | 3.13 |
| Total Families | 690 (100.0%) | 3.29 |
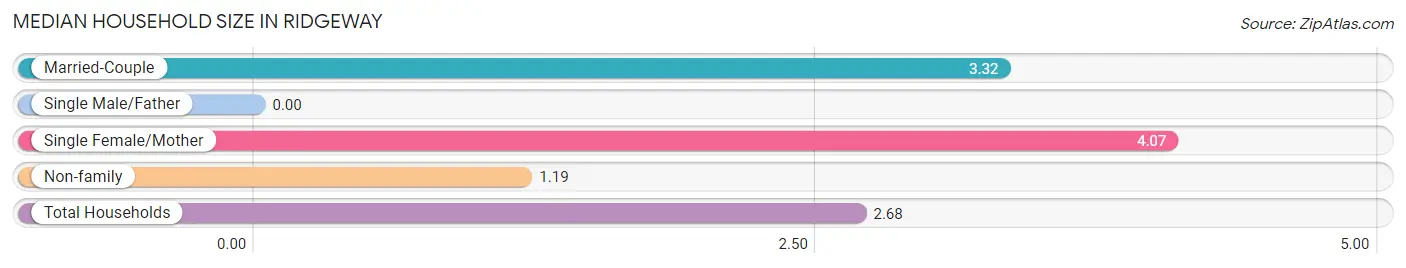
Median Household Size in Ridgeway
| Household Type | # Households | Household Size |
| Married-Couple | 630 (61.7%) | 3.32 |
| Single Male/Father | 0 (0.0%) | - |
| Single Female/Mother | 60 (5.9%) | 4.07 |
| Non-family | 331 (32.4%) | 1.19 |
| Total Households | 1,021 (100.0%) | 2.68 |
Household Size by Marriage Status in Ridgeway
Out of a total of 1,021 households in Ridgeway, 690 (67.6%) are family households, while 331 (32.4%) are nonfamily households. The most numerous type of family households are 2-person households, comprising 318, and the most common type of nonfamily households are 1-person households, comprising 232.
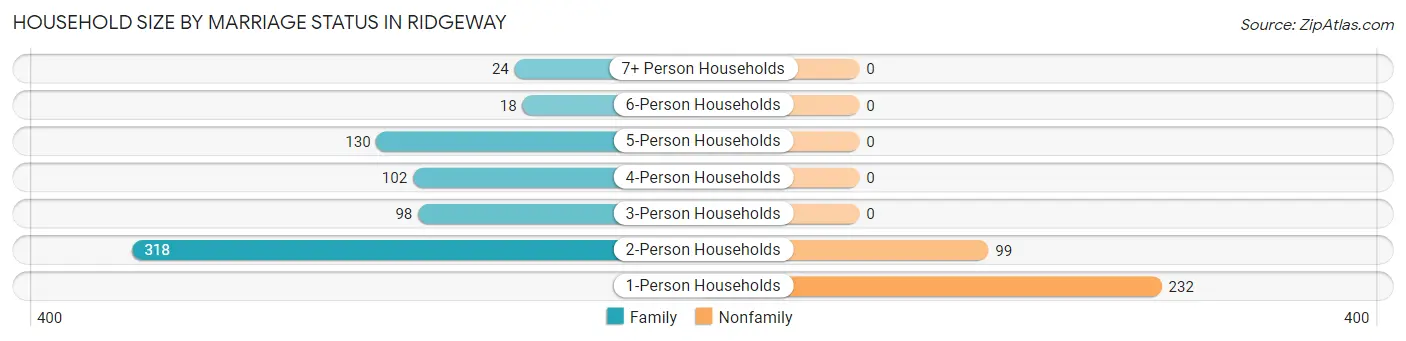
| Household Size | Family Households | Nonfamily Households |
| 1-Person Households | - | 232 (22.7%) |
| 2-Person Households | 318 (31.1%) | 99 (9.7%) |
| 3-Person Households | 98 (9.6%) | 0 (0.0%) |
| 4-Person Households | 102 (10.0%) | 0 (0.0%) |
| 5-Person Households | 130 (12.7%) | 0 (0.0%) |
| 6-Person Households | 18 (1.8%) | 0 (0.0%) |
| 7+ Person Households | 24 (2.4%) | 0 (0.0%) |
| Total | 690 (67.6%) | 331 (32.4%) |
Female Fertility in Ridgeway
Fertility by Age in Ridgeway
Average fertility rate in Ridgeway is 20.0 births per 1,000 women. Women in the age bracket of 20 to 34 years have the highest fertility rate with 53.0 births per 1,000 women. Women in the age bracket of 20 to 34 years acount for 100.0% of all women with births.
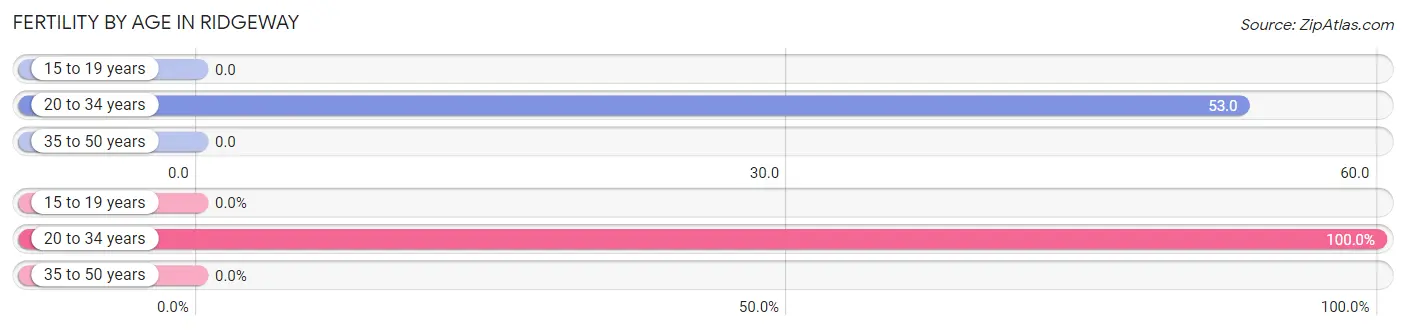
| Age Bracket | Women with Births | Births / 1,000 Women |
| 15 to 19 years | 0 (0.0%) | 0.0 |
| 20 to 34 years | 11 (100.0%) | 53.0 |
| 35 to 50 years | 0 (0.0%) | 0.0 |
| Total | 11 (100.0%) | 20.0 |
Fertility by Age by Marriage Status in Ridgeway
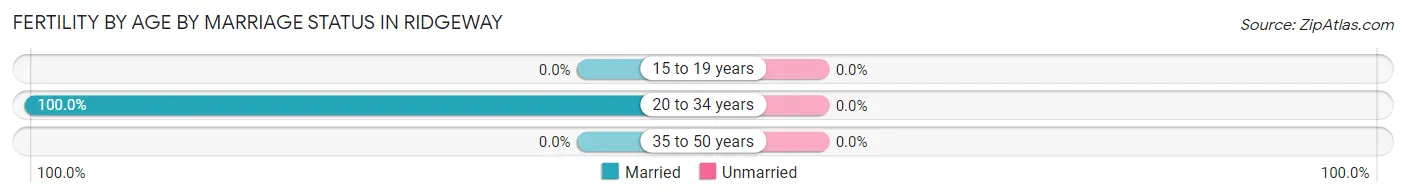
| Age Bracket | Married | Unmarried |
| 15 to 19 years | 0 (0.0%) | 0 (0.0%) |
| 20 to 34 years | 11 (100.0%) | 0 (0.0%) |
| 35 to 50 years | 0 (0.0%) | 0 (0.0%) |
| Total | 11 (100.0%) | 0 (0.0%) |
Fertility by Education in Ridgeway
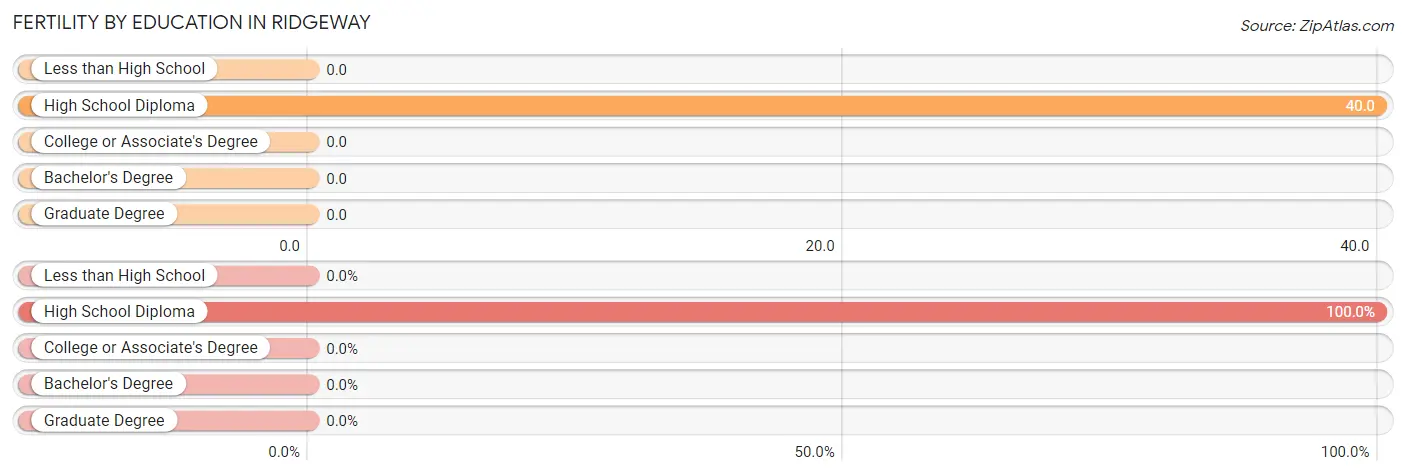
| Educational Attainment | Women with Births | Births / 1,000 Women |
| Less than High School | 0 (0.0%) | 0.0 |
| High School Diploma | 11 (100.0%) | 40.0 |
| College or Associate's Degree | 0 (0.0%) | 0.0 |
| Bachelor's Degree | 0 (0.0%) | 0.0 |
| Graduate Degree | 0 (0.0%) | 0.0 |
| Total | 11 (100.0%) | 20.0 |
Fertility by Education by Marriage Status in Ridgeway
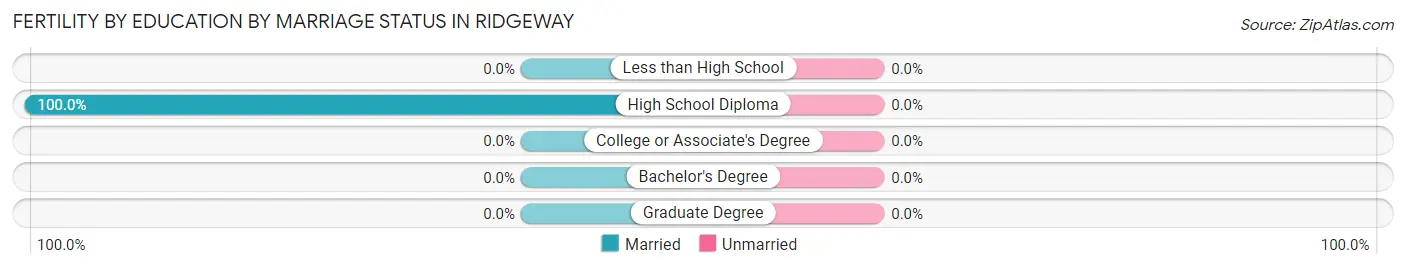
| Educational Attainment | Married | Unmarried |
| Less than High School | 0 (0.0%) | 0 (0.0%) |
| High School Diploma | 11 (100.0%) | 0 (0.0%) |
| College or Associate's Degree | 0 (0.0%) | 0 (0.0%) |
| Bachelor's Degree | 0 (0.0%) | 0 (0.0%) |
| Graduate Degree | 0 (0.0%) | 0 (0.0%) |
| Total | 11 (100.0%) | 0 (0.0%) |
Employment Characteristics in Ridgeway
Employment by Class of Employer in Ridgeway
Among the 991 employed individuals in Ridgeway, private company employees (444 | 44.8%), not-for-profit organizations (182 | 18.4%), and self-employed (incorporated) (147 | 14.8%) make up the most common classes of employment.
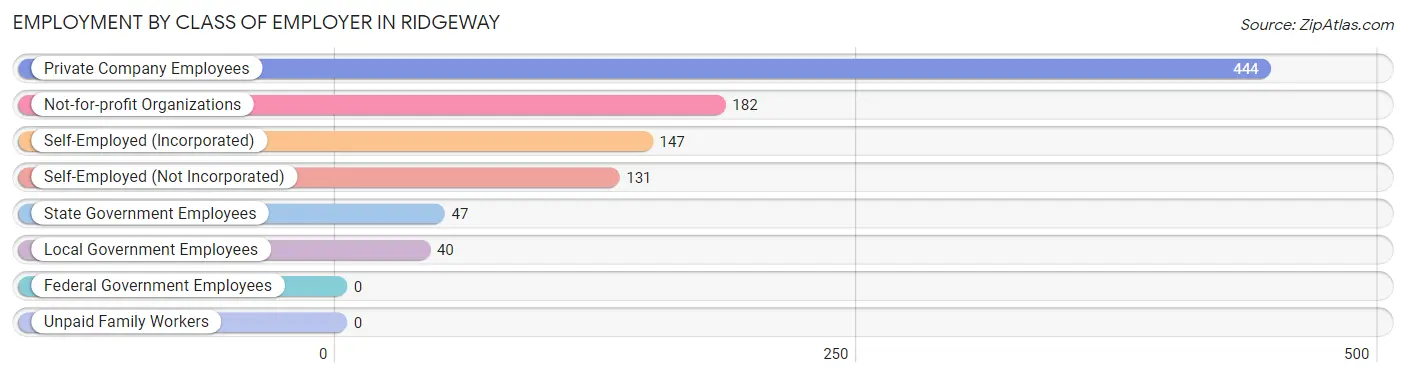
| Employer Class | # Employees | % Employees |
| Private Company Employees | 444 | 44.8% |
| Self-Employed (Incorporated) | 147 | 14.8% |
| Self-Employed (Not Incorporated) | 131 | 13.2% |
| Not-for-profit Organizations | 182 | 18.4% |
| Local Government Employees | 40 | 4.0% |
| State Government Employees | 47 | 4.7% |
| Federal Government Employees | 0 | 0.0% |
| Unpaid Family Workers | 0 | 0.0% |
| Total | 991 | 100.0% |
Employment Status by Age in Ridgeway
According to the labor force statistics for Ridgeway, out of the total population over 16 years of age (2,046), 56.6% or 1,158 individuals are in the labor force, with 6.7% or 78 of them unemployed. The age group with the highest labor force participation rate is 20 to 24 years, with 84.0% or 42 individuals in the labor force. Within the labor force, the 65 to 74 years age range has the highest percentage of unemployed individuals, with 24.2% or 22 of them being unemployed.
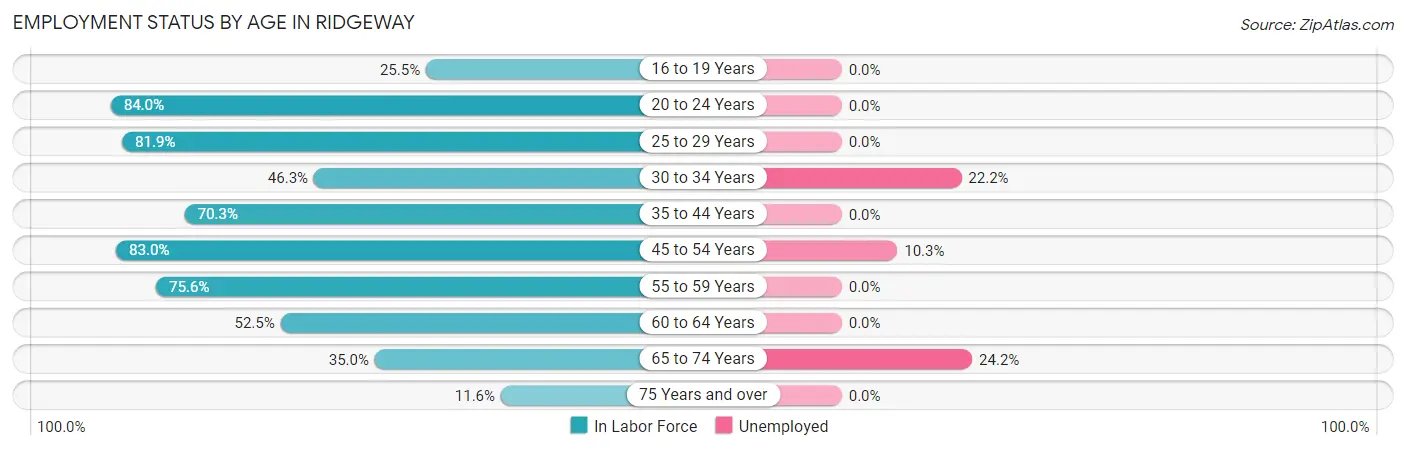
| Age Bracket | In Labor Force | Unemployed |
| 16 to 19 Years | 35 (25.5%) | 0 (0.0%) |
| 20 to 24 Years | 42 (84.0%) | 0 (0.0%) |
| 25 to 29 Years | 77 (81.9%) | 0 (0.0%) |
| 30 to 34 Years | 99 (46.3%) | 22 (22.2%) |
| 35 to 44 Years | 187 (70.3%) | 0 (0.0%) |
| 45 to 54 Years | 331 (83.0%) | 34 (10.3%) |
| 55 to 59 Years | 146 (75.6%) | 0 (0.0%) |
| 60 to 64 Years | 128 (52.5%) | 0 (0.0%) |
| 65 to 74 Years | 91 (35.0%) | 22 (24.2%) |
| 75 Years and over | 22 (11.6%) | 0 (0.0%) |
| Total | 1,158 (56.6%) | 78 (6.7%) |
Employment Status by Educational Attainment in Ridgeway
According to labor force statistics for Ridgeway, 68.7% of individuals (969) out of the total population between 25 and 64 years of age (1,410) are in the labor force, with 5.8% or 56 of them being unemployed. The group with the highest labor force participation rate are those with the educational attainment of bachelor's degree or higher, with 84.3% or 404 individuals in the labor force. Within the labor force, individuals with college / associate degree education have the highest percentage of unemployment, with 8.5% or 22 of them being unemployed.
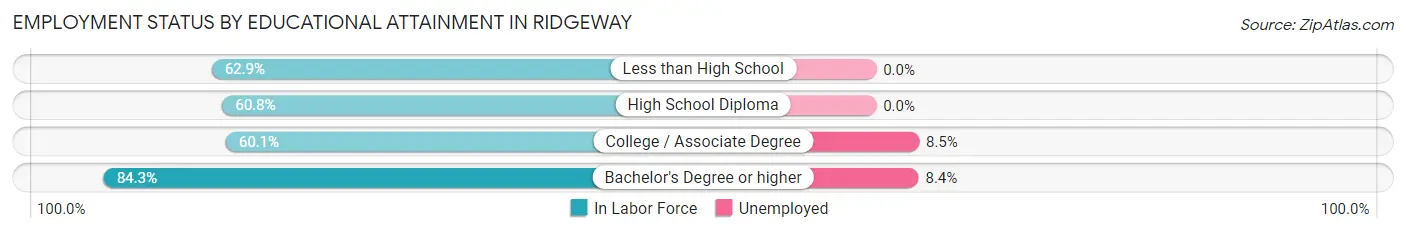
| Educational Attainment | In Labor Force | Unemployed |
| Less than High School | 22 (62.9%) | 0 (0.0%) |
| High School Diploma | 284 (60.8%) | 0 (0.0%) |
| College / Associate Degree | 258 (60.1%) | 36 (8.5%) |
| Bachelor's Degree or higher | 404 (84.3%) | 40 (8.4%) |
| Total | 969 (68.7%) | 82 (5.8%) |
Employment Occupations by Sex in Ridgeway
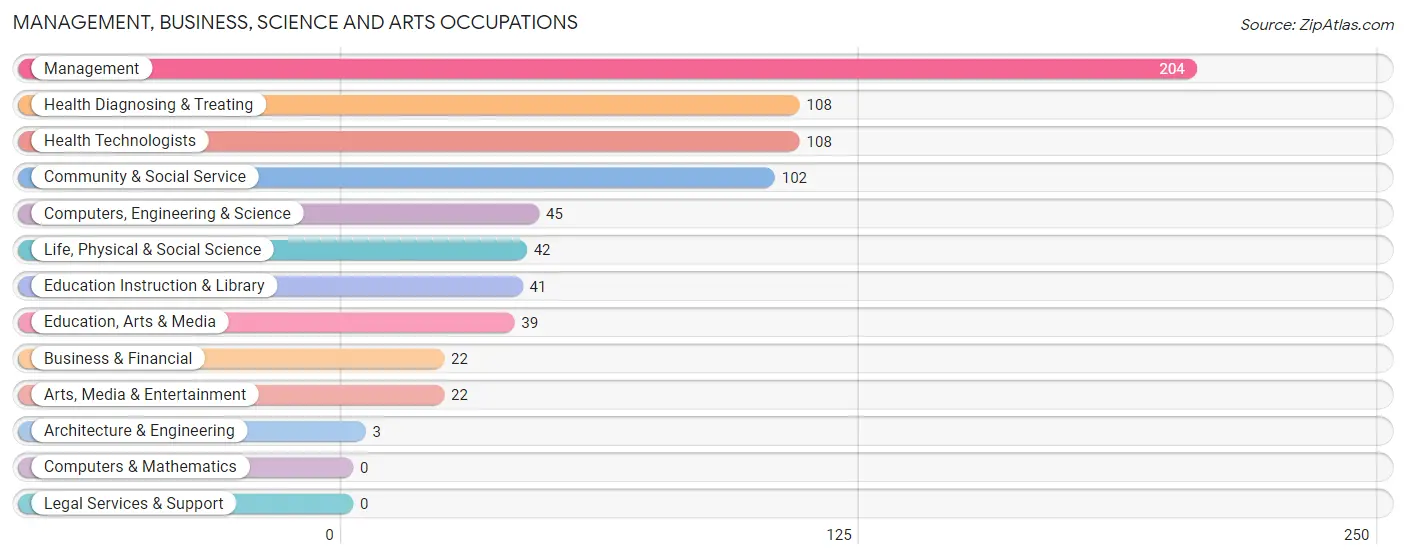
Management, Business, Science and Arts Occupations
The most common Management, Business, Science and Arts occupations in Ridgeway are Management (204 | 18.9%), Health Diagnosing & Treating (108 | 10.0%), Health Technologists (108 | 10.0%), Community & Social Service (102 | 9.4%), and Computers, Engineering & Science (45 | 4.2%).
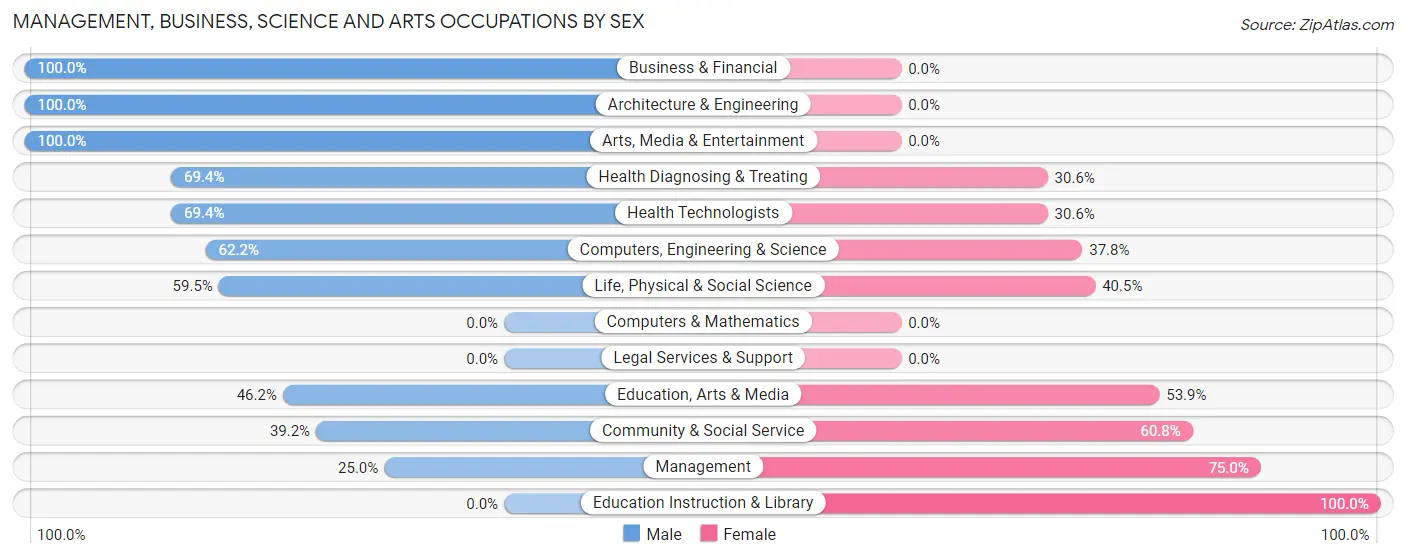
Management, Business, Science and Arts Occupations by Sex
Within the Management, Business, Science and Arts occupations in Ridgeway, the most male-oriented occupations are Business & Financial (100.0%), Architecture & Engineering (100.0%), and Arts, Media & Entertainment (100.0%), while the most female-oriented occupations are Education Instruction & Library (100.0%), Management (75.0%), and Community & Social Service (60.8%).
| Occupation | Male | Female |
| Management | 51 (25.0%) | 153 (75.0%) |
| Business & Financial | 22 (100.0%) | 0 (0.0%) |
| Computers, Engineering & Science | 28 (62.2%) | 17 (37.8%) |
| Computers & Mathematics | 0 (0.0%) | 0 (0.0%) |
| Architecture & Engineering | 3 (100.0%) | 0 (0.0%) |
| Life, Physical & Social Science | 25 (59.5%) | 17 (40.5%) |
| Community & Social Service | 40 (39.2%) | 62 (60.8%) |
| Education, Arts & Media | 18 (46.2%) | 21 (53.8%) |
| Legal Services & Support | 0 (0.0%) | 0 (0.0%) |
| Education Instruction & Library | 0 (0.0%) | 41 (100.0%) |
| Arts, Media & Entertainment | 22 (100.0%) | 0 (0.0%) |
| Health Diagnosing & Treating | 75 (69.4%) | 33 (30.6%) |
| Health Technologists | 75 (69.4%) | 33 (30.6%) |
| Total (Category) | 216 (44.9%) | 265 (55.1%) |
| Total (Overall) | 566 (52.4%) | 514 (47.6%) |
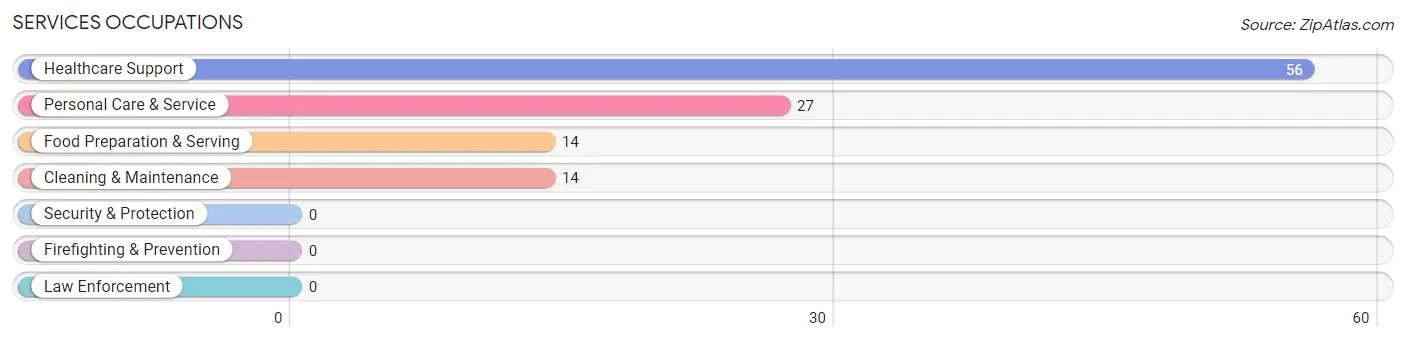
Services Occupations
The most common Services occupations in Ridgeway are Healthcare Support (56 | 5.2%), Personal Care & Service (27 | 2.5%), Food Preparation & Serving (14 | 1.3%), and Cleaning & Maintenance (14 | 1.3%).
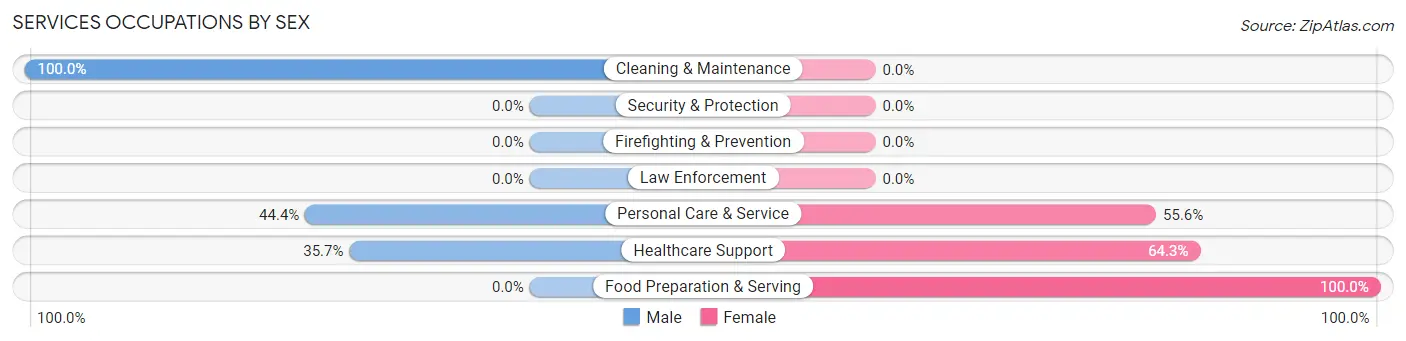
Services Occupations by Sex
Within the Services occupations in Ridgeway, the most male-oriented occupations are Cleaning & Maintenance (100.0%), Personal Care & Service (44.4%), and Healthcare Support (35.7%), while the most female-oriented occupations are Food Preparation & Serving (100.0%), Healthcare Support (64.3%), and Personal Care & Service (55.6%).
| Occupation | Male | Female |
| Healthcare Support | 20 (35.7%) | 36 (64.3%) |
| Security & Protection | 0 (0.0%) | 0 (0.0%) |
| Firefighting & Prevention | 0 (0.0%) | 0 (0.0%) |
| Law Enforcement | 0 (0.0%) | 0 (0.0%) |
| Food Preparation & Serving | 0 (0.0%) | 14 (100.0%) |
| Cleaning & Maintenance | 14 (100.0%) | 0 (0.0%) |
| Personal Care & Service | 12 (44.4%) | 15 (55.6%) |
| Total (Category) | 46 (41.4%) | 65 (58.6%) |
| Total (Overall) | 566 (52.4%) | 514 (47.6%) |
Sales and Office Occupations
The most common Sales and Office occupations in Ridgeway are Office & Administration (103 | 9.5%), and Sales & Related (91 | 8.4%).
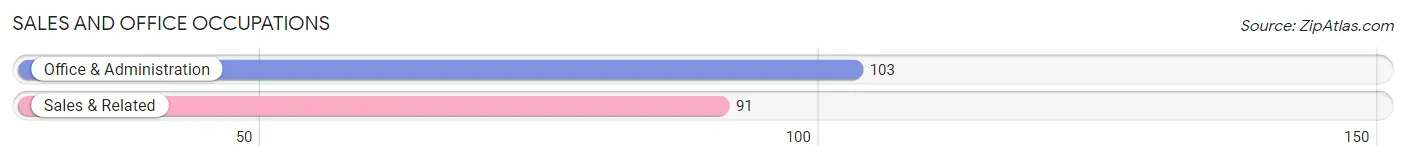
Sales and Office Occupations by Sex
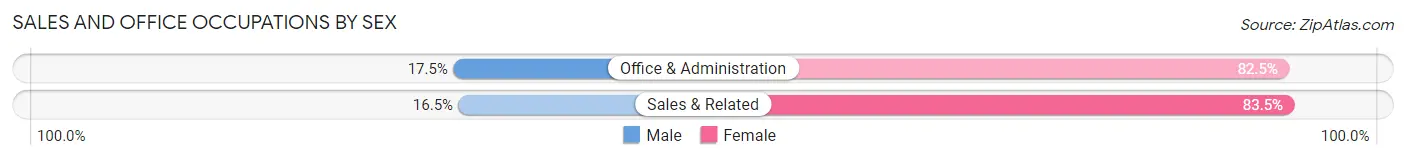
| Occupation | Male | Female |
| Sales & Related | 15 (16.5%) | 76 (83.5%) |
| Office & Administration | 18 (17.5%) | 85 (82.5%) |
| Total (Category) | 33 (17.0%) | 161 (83.0%) |
| Total (Overall) | 566 (52.4%) | 514 (47.6%) |
Natural Resources, Construction and Maintenance Occupations
The most common Natural Resources, Construction and Maintenance occupations in Ridgeway are Construction & Extraction (95 | 8.8%), Farming, Fishing & Forestry (45 | 4.2%), and Installation, Maintenance & Repair (39 | 3.6%).
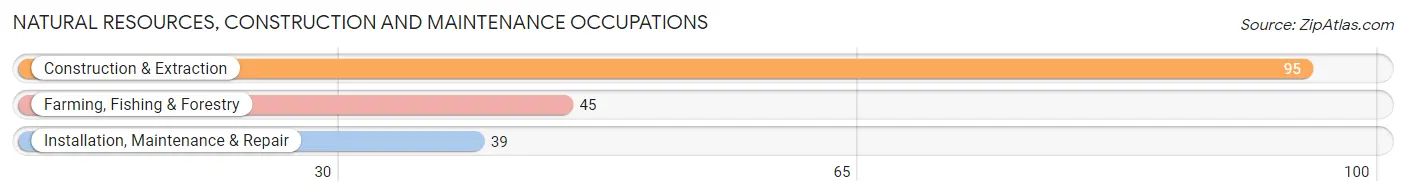
Natural Resources, Construction and Maintenance Occupations by Sex
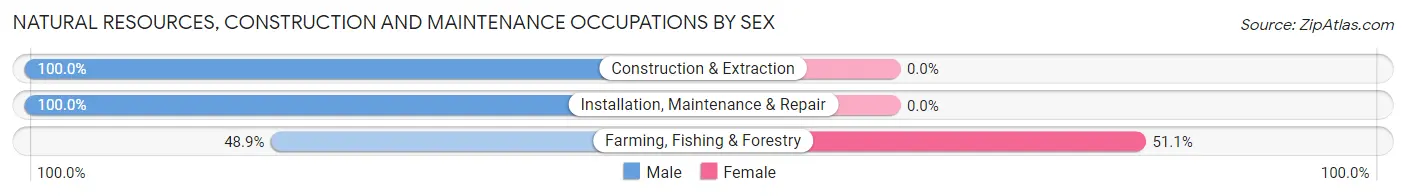
| Occupation | Male | Female |
| Farming, Fishing & Forestry | 22 (48.9%) | 23 (51.1%) |
| Construction & Extraction | 95 (100.0%) | 0 (0.0%) |
| Installation, Maintenance & Repair | 39 (100.0%) | 0 (0.0%) |
| Total (Category) | 156 (87.2%) | 23 (12.9%) |
| Total (Overall) | 566 (52.4%) | 514 (47.6%) |
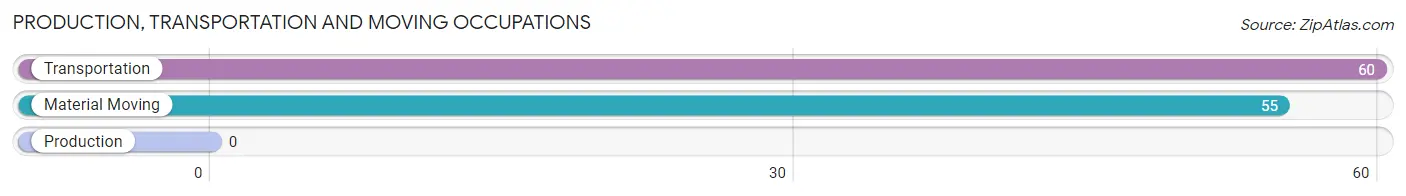
Production, Transportation and Moving Occupations
The most common Production, Transportation and Moving occupations in Ridgeway are Transportation (60 | 5.6%), and Material Moving (55 | 5.1%).
Production, Transportation and Moving Occupations by Sex
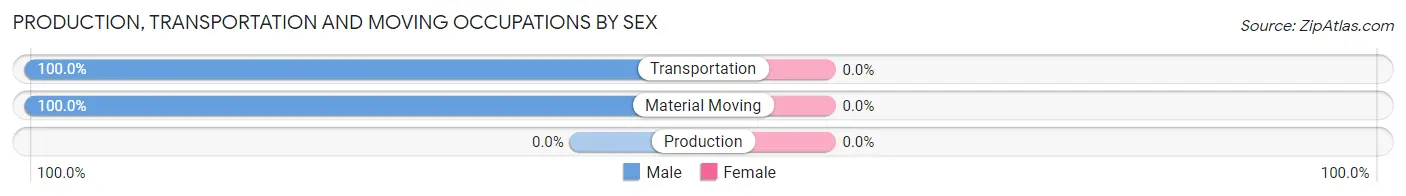
| Occupation | Male | Female |
| Production | 0 (0.0%) | 0 (0.0%) |
| Transportation | 60 (100.0%) | 0 (0.0%) |
| Material Moving | 55 (100.0%) | 0 (0.0%) |
| Total (Category) | 115 (100.0%) | 0 (0.0%) |
| Total (Overall) | 566 (52.4%) | 514 (47.6%) |
Employment Industries by Sex in Ridgeway
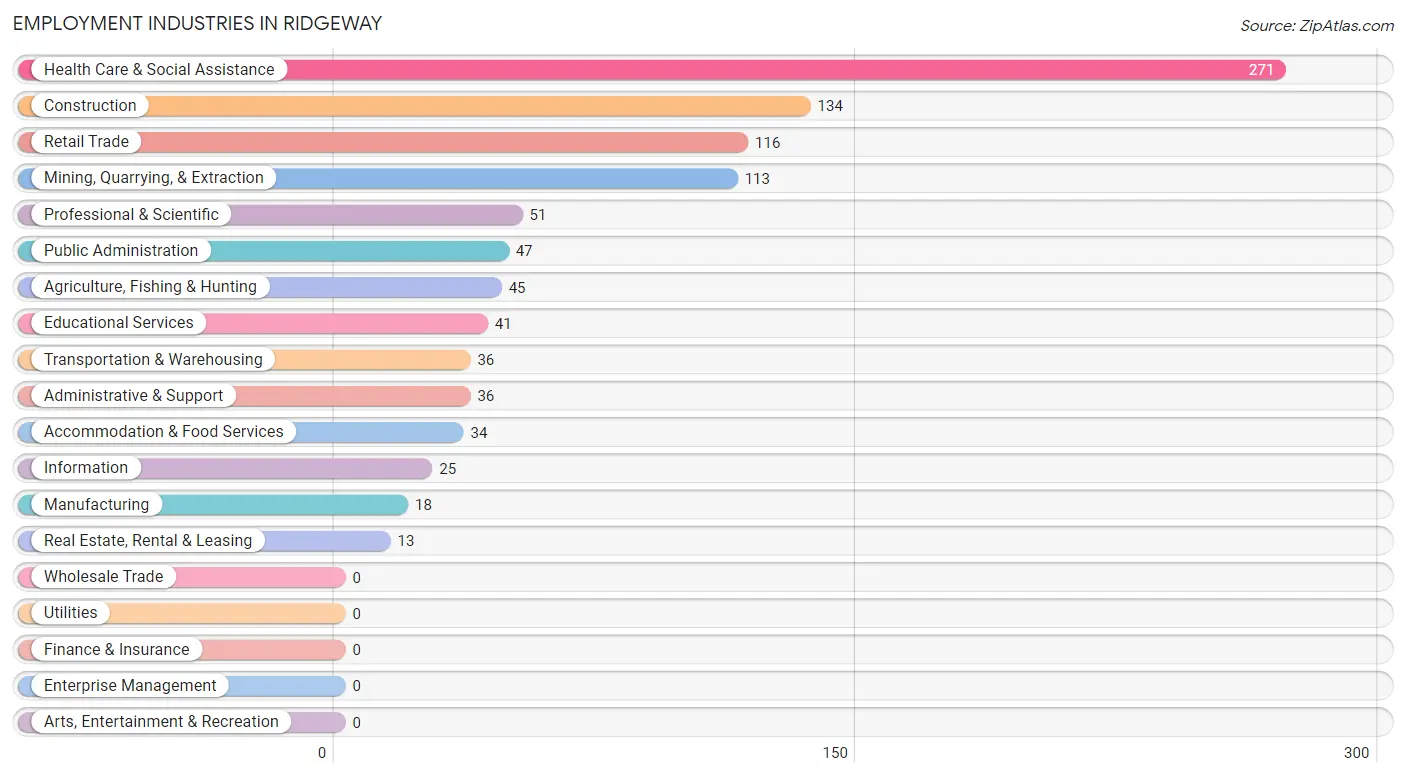
Employment Industries in Ridgeway
The major employment industries in Ridgeway include Health Care & Social Assistance (271 | 25.1%), Construction (134 | 12.4%), Retail Trade (116 | 10.7%), Mining, Quarrying, & Extraction (113 | 10.5%), and Professional & Scientific (51 | 4.7%).
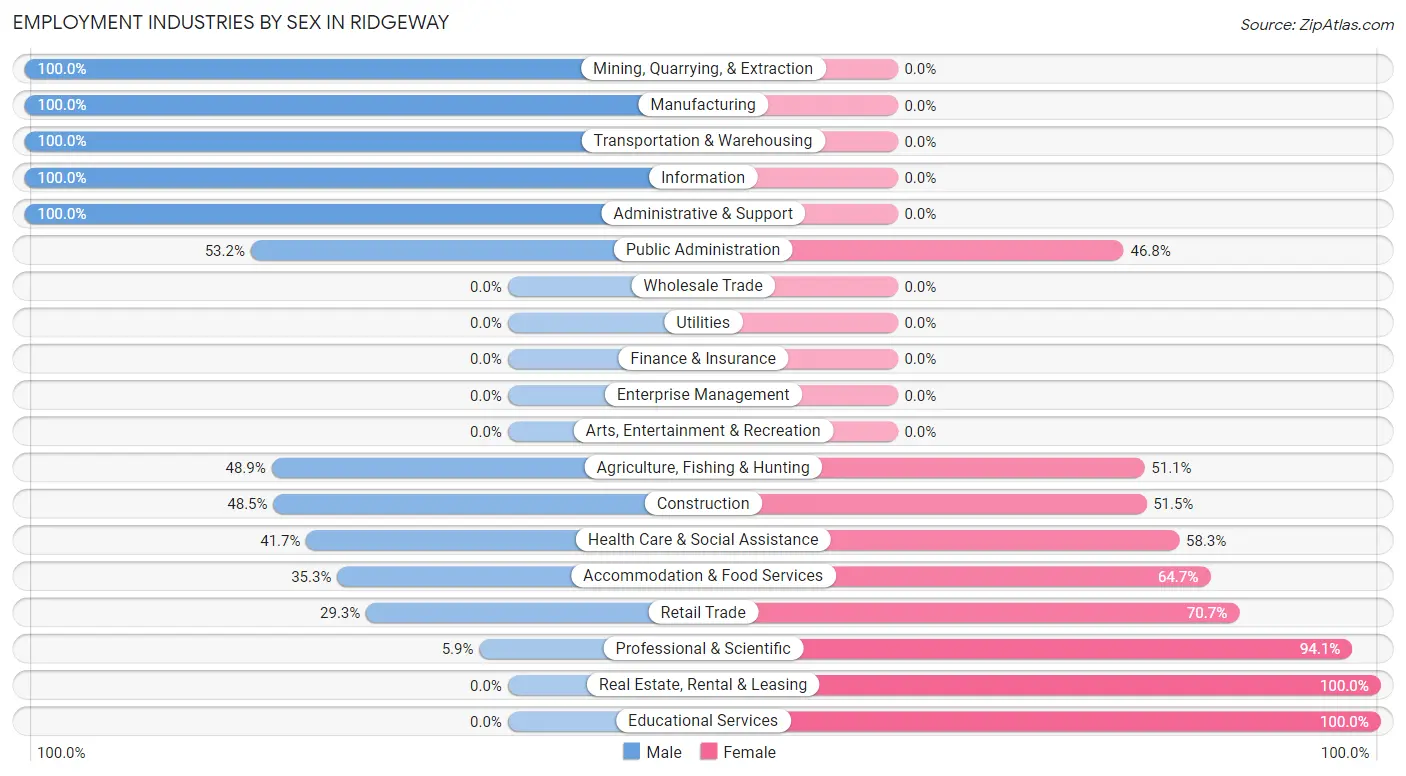
Employment Industries by Sex in Ridgeway
The Ridgeway industries that see more men than women are Mining, Quarrying, & Extraction (100.0%), Manufacturing (100.0%), and Transportation & Warehousing (100.0%), whereas the industries that tend to have a higher number of women are Real Estate, Rental & Leasing (100.0%), Educational Services (100.0%), and Professional & Scientific (94.1%).
| Industry | Male | Female |
| Agriculture, Fishing & Hunting | 22 (48.9%) | 23 (51.1%) |
| Mining, Quarrying, & Extraction | 113 (100.0%) | 0 (0.0%) |
| Construction | 65 (48.5%) | 69 (51.5%) |
| Manufacturing | 18 (100.0%) | 0 (0.0%) |
| Wholesale Trade | 0 (0.0%) | 0 (0.0%) |
| Retail Trade | 34 (29.3%) | 82 (70.7%) |
| Transportation & Warehousing | 36 (100.0%) | 0 (0.0%) |
| Utilities | 0 (0.0%) | 0 (0.0%) |
| Information | 25 (100.0%) | 0 (0.0%) |
| Finance & Insurance | 0 (0.0%) | 0 (0.0%) |
| Real Estate, Rental & Leasing | 0 (0.0%) | 13 (100.0%) |
| Professional & Scientific | 3 (5.9%) | 48 (94.1%) |
| Enterprise Management | 0 (0.0%) | 0 (0.0%) |
| Administrative & Support | 36 (100.0%) | 0 (0.0%) |
| Educational Services | 0 (0.0%) | 41 (100.0%) |
| Health Care & Social Assistance | 113 (41.7%) | 158 (58.3%) |
| Arts, Entertainment & Recreation | 0 (0.0%) | 0 (0.0%) |
| Accommodation & Food Services | 12 (35.3%) | 22 (64.7%) |
| Public Administration | 25 (53.2%) | 22 (46.8%) |
| Total | 566 (52.4%) | 514 (47.6%) |
Education in Ridgeway
School Enrollment in Ridgeway
The most common levels of schooling among the 614 students in Ridgeway are middle school (206 | 33.6%), high school (202 | 32.9%), and elementary school (94 | 15.3%).
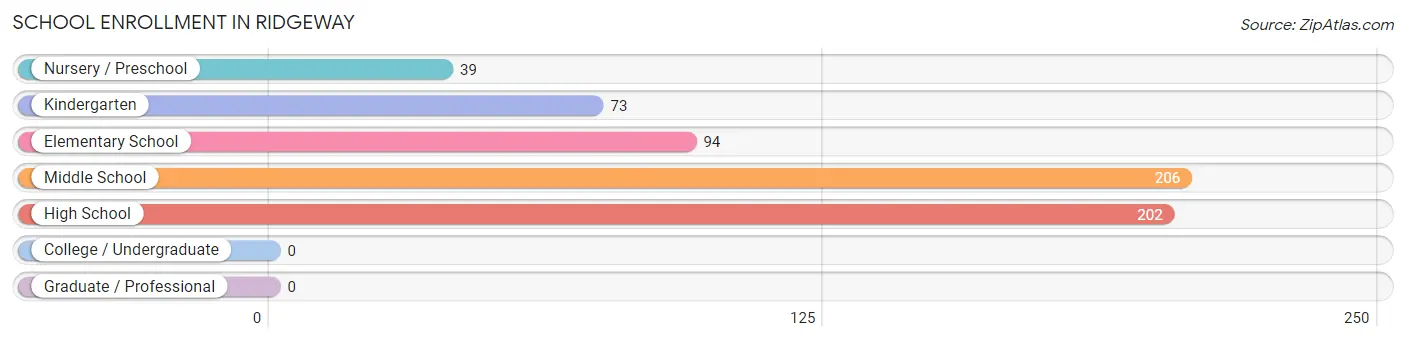
| School Level | # Students | % Students |
| Nursery / Preschool | 39 | 6.4% |
| Kindergarten | 73 | 11.9% |
| Elementary School | 94 | 15.3% |
| Middle School | 206 | 33.6% |
| High School | 202 | 32.9% |
| College / Undergraduate | 0 | 0.0% |
| Graduate / Professional | 0 | 0.0% |
| Total | 614 | 100.0% |
School Enrollment by Age by Funding Source in Ridgeway
Out of a total of 614 students who are enrolled in schools in Ridgeway, 129 (21.0%) attend a private institution, while the remaining 485 (79.0%) are enrolled in public schools. The age group of 3 to 4 year olds has the highest likelihood of being enrolled in private schools, with 39 (100.0% in the age bracket) enrolled. Conversely, the age group of 35 years and over has the lowest likelihood of being enrolled in a private school, with 8 (100.0% in the age bracket) attending a public institution.
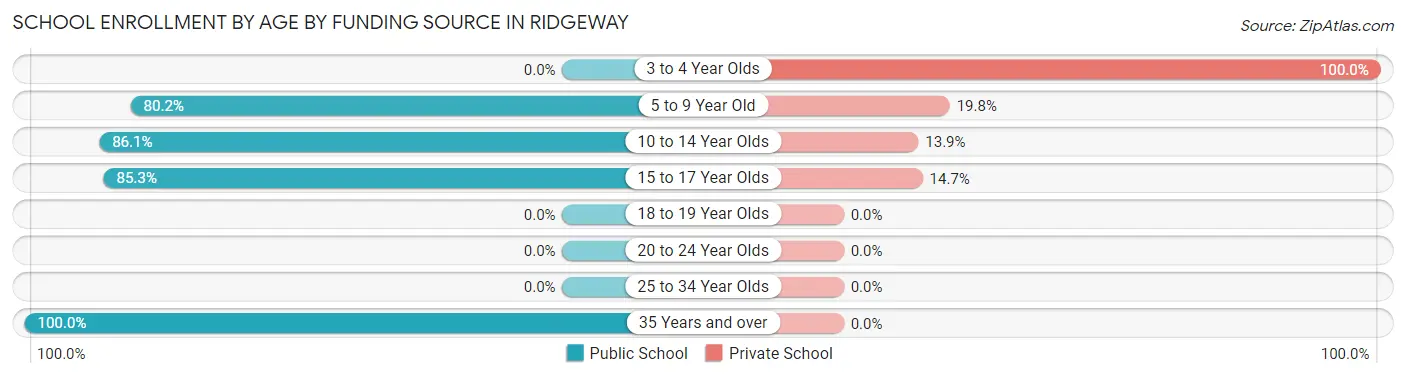
| Age Bracket | Public School | Private School |
| 3 to 4 Year Olds | 0 (0.0%) | 39 (100.0%) |
| 5 to 9 Year Old | 134 (80.2%) | 33 (19.8%) |
| 10 to 14 Year Olds | 198 (86.1%) | 32 (13.9%) |
| 15 to 17 Year Olds | 145 (85.3%) | 25 (14.7%) |
| 18 to 19 Year Olds | 0 (0.0%) | 0 (0.0%) |
| 20 to 24 Year Olds | 0 (0.0%) | 0 (0.0%) |
| 25 to 34 Year Olds | 0 (0.0%) | 0 (0.0%) |
| 35 Years and over | 8 (100.0%) | 0 (0.0%) |
| Total | 485 (79.0%) | 129 (21.0%) |
Educational Attainment by Field of Study in Ridgeway
Bio, nature & agricultural (179 | 23.0%), science & technology (136 | 17.4%), education (110 | 14.1%), business (56 | 7.2%), and social sciences (55 | 7.0%) are the most common fields of study among 780 individuals in Ridgeway who have obtained a bachelor's degree or higher.
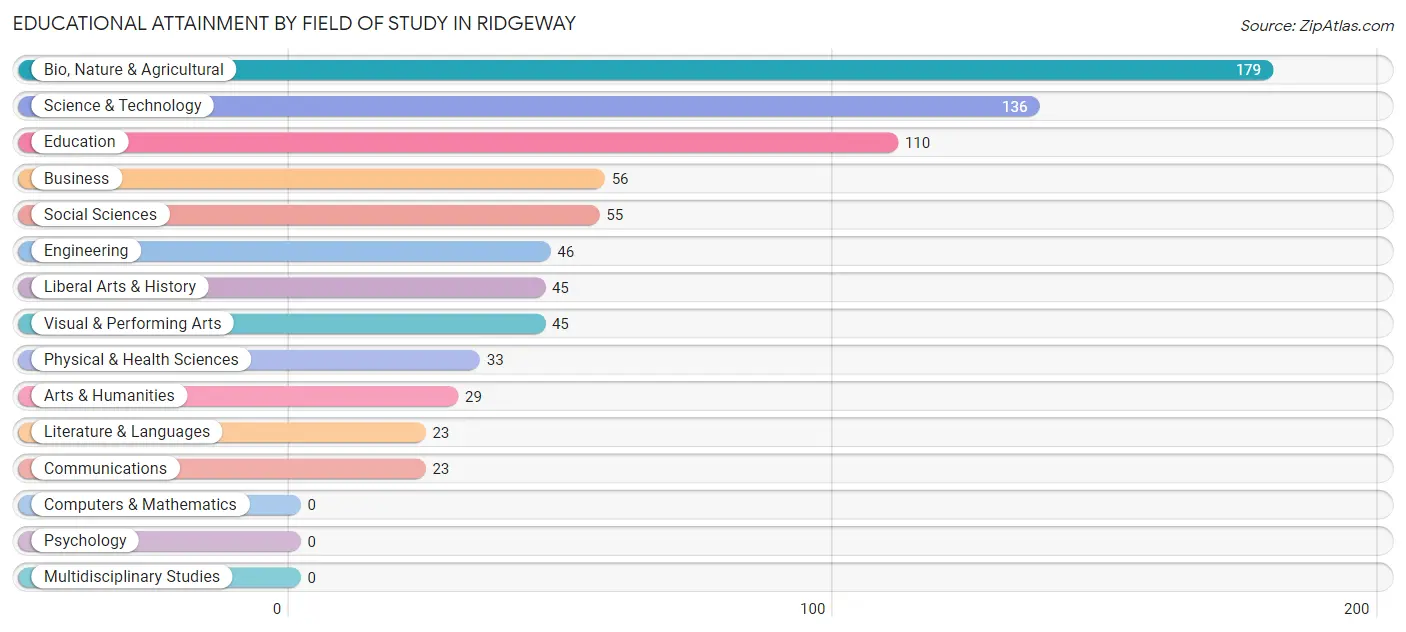
| Field of Study | # Graduates | % Graduates |
| Computers & Mathematics | 0 | 0.0% |
| Bio, Nature & Agricultural | 179 | 23.0% |
| Physical & Health Sciences | 33 | 4.2% |
| Psychology | 0 | 0.0% |
| Social Sciences | 55 | 7.0% |
| Engineering | 46 | 5.9% |
| Multidisciplinary Studies | 0 | 0.0% |
| Science & Technology | 136 | 17.4% |
| Business | 56 | 7.2% |
| Education | 110 | 14.1% |
| Literature & Languages | 23 | 2.9% |
| Liberal Arts & History | 45 | 5.8% |
| Visual & Performing Arts | 45 | 5.8% |
| Communications | 23 | 2.9% |
| Arts & Humanities | 29 | 3.7% |
| Total | 780 | 100.0% |
Transportation & Commute in Ridgeway
Vehicle Availability by Sex in Ridgeway
The most prevalent vehicle ownership categories in Ridgeway are males with 2 vehicles (266, accounting for 55.8%) and females with 2 vehicles (264, making up 51.7%).
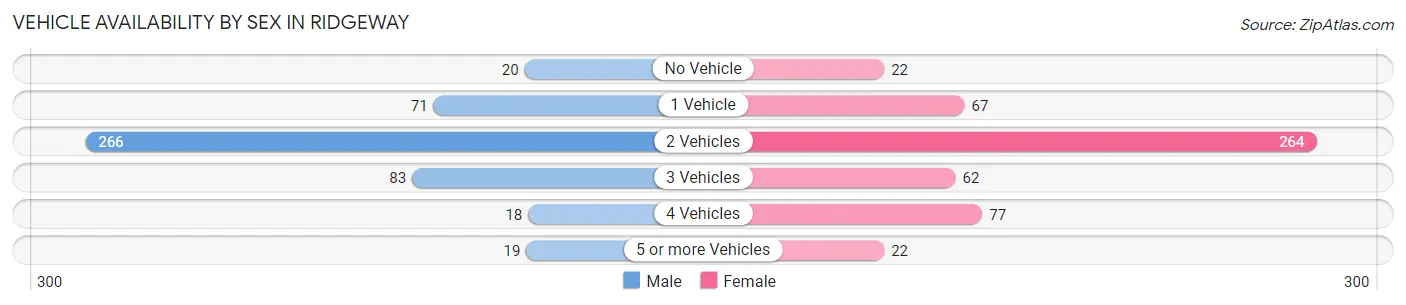
| Vehicles Available | Male | Female |
| No Vehicle | 20 (4.2%) | 22 (4.3%) |
| 1 Vehicle | 71 (14.9%) | 67 (13.0%) |
| 2 Vehicles | 266 (55.8%) | 264 (51.4%) |
| 3 Vehicles | 83 (17.4%) | 62 (12.1%) |
| 4 Vehicles | 18 (3.8%) | 77 (15.0%) |
| 5 or more Vehicles | 19 (4.0%) | 22 (4.3%) |
| Total | 477 (100.0%) | 514 (100.0%) |
Commute Time in Ridgeway
The most frequently occuring commute durations in Ridgeway are 5 to 9 minutes (221 commuters, 28.6%), 15 to 19 minutes (156 commuters, 20.2%), and 10 to 14 minutes (134 commuters, 17.3%).
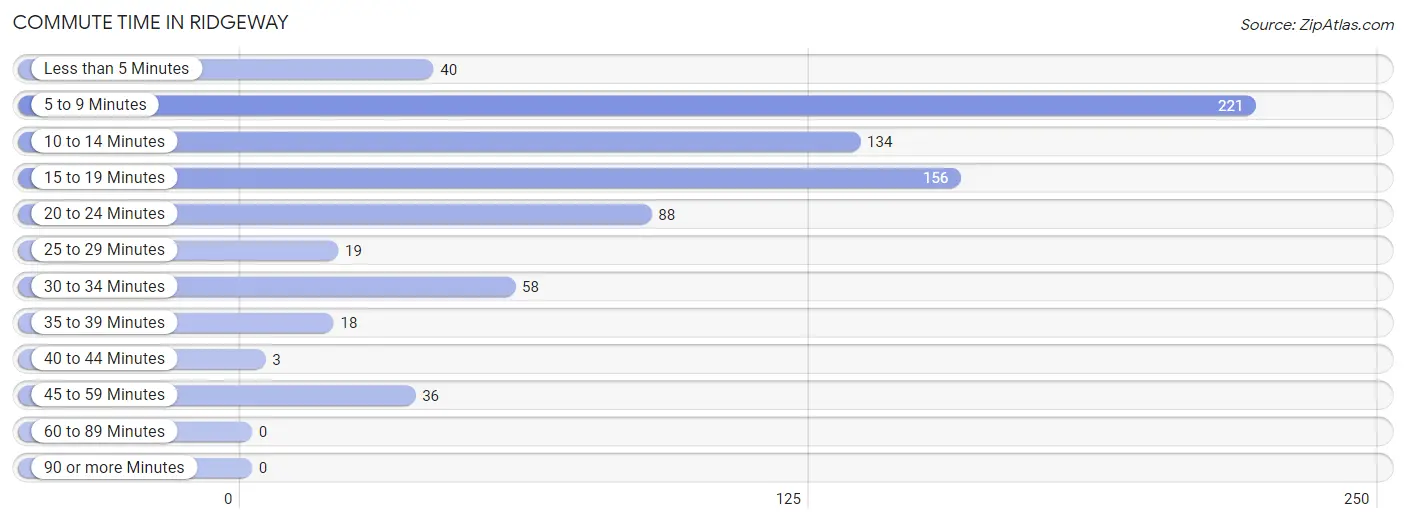
| Commute Time | # Commuters | % Commuters |
| Less than 5 Minutes | 40 | 5.2% |
| 5 to 9 Minutes | 221 | 28.6% |
| 10 to 14 Minutes | 134 | 17.3% |
| 15 to 19 Minutes | 156 | 20.2% |
| 20 to 24 Minutes | 88 | 11.4% |
| 25 to 29 Minutes | 19 | 2.5% |
| 30 to 34 Minutes | 58 | 7.5% |
| 35 to 39 Minutes | 18 | 2.3% |
| 40 to 44 Minutes | 3 | 0.4% |
| 45 to 59 Minutes | 36 | 4.7% |
| 60 to 89 Minutes | 0 | 0.0% |
| 90 or more Minutes | 0 | 0.0% |
Commute Time by Sex in Ridgeway
The most common commute times in Ridgeway are 5 to 9 minutes (140 commuters, 32.2%) for males and 5 to 9 minutes (81 commuters, 24.0%) for females.
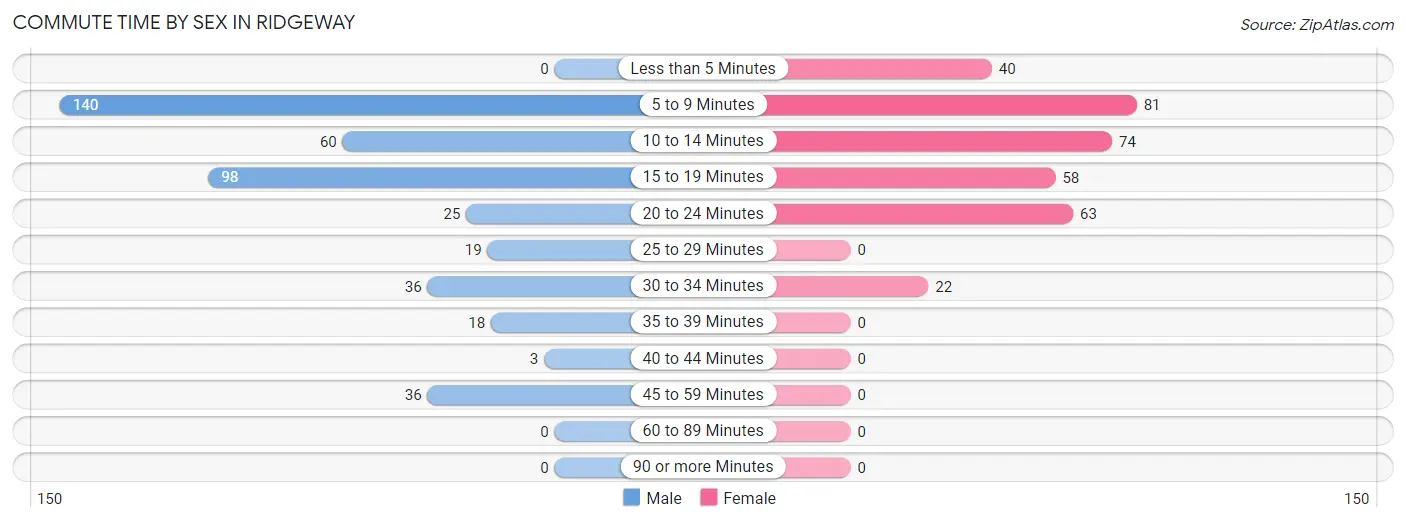
| Commute Time | Male | Female |
| Less than 5 Minutes | 0 (0.0%) | 40 (11.8%) |
| 5 to 9 Minutes | 140 (32.2%) | 81 (24.0%) |
| 10 to 14 Minutes | 60 (13.8%) | 74 (21.9%) |
| 15 to 19 Minutes | 98 (22.5%) | 58 (17.2%) |
| 20 to 24 Minutes | 25 (5.8%) | 63 (18.6%) |
| 25 to 29 Minutes | 19 (4.4%) | 0 (0.0%) |
| 30 to 34 Minutes | 36 (8.3%) | 22 (6.5%) |
| 35 to 39 Minutes | 18 (4.1%) | 0 (0.0%) |
| 40 to 44 Minutes | 3 (0.7%) | 0 (0.0%) |
| 45 to 59 Minutes | 36 (8.3%) | 0 (0.0%) |
| 60 to 89 Minutes | 0 (0.0%) | 0 (0.0%) |
| 90 or more Minutes | 0 (0.0%) | 0 (0.0%) |
Time of Departure to Work by Sex in Ridgeway
The most frequent times of departure to work in Ridgeway are 6:30 AM to 6:59 AM (112, 25.8%) for males and 7:00 AM to 7:29 AM (106, 31.4%) for females.
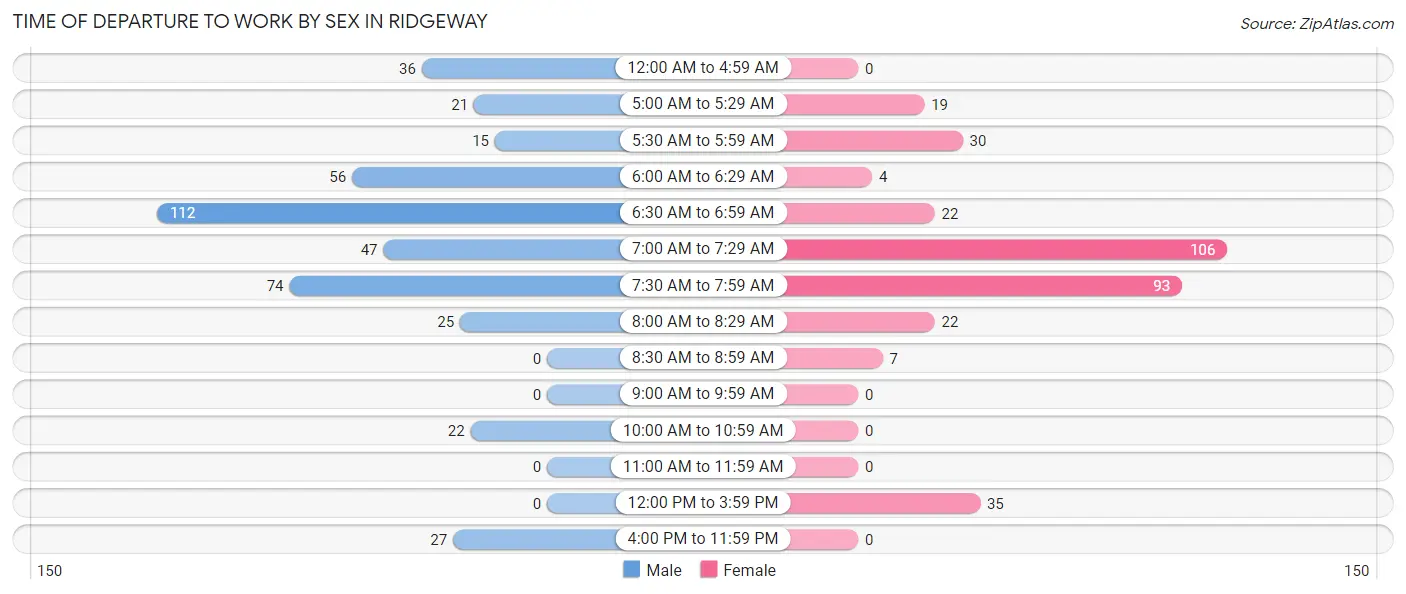
| Time of Departure | Male | Female |
| 12:00 AM to 4:59 AM | 36 (8.3%) | 0 (0.0%) |
| 5:00 AM to 5:29 AM | 21 (4.8%) | 19 (5.6%) |
| 5:30 AM to 5:59 AM | 15 (3.5%) | 30 (8.9%) |
| 6:00 AM to 6:29 AM | 56 (12.9%) | 4 (1.2%) |
| 6:30 AM to 6:59 AM | 112 (25.8%) | 22 (6.5%) |
| 7:00 AM to 7:29 AM | 47 (10.8%) | 106 (31.4%) |
| 7:30 AM to 7:59 AM | 74 (17.0%) | 93 (27.5%) |
| 8:00 AM to 8:29 AM | 25 (5.8%) | 22 (6.5%) |
| 8:30 AM to 8:59 AM | 0 (0.0%) | 7 (2.1%) |
| 9:00 AM to 9:59 AM | 0 (0.0%) | 0 (0.0%) |
| 10:00 AM to 10:59 AM | 22 (5.1%) | 0 (0.0%) |
| 11:00 AM to 11:59 AM | 0 (0.0%) | 0 (0.0%) |
| 12:00 PM to 3:59 PM | 0 (0.0%) | 35 (10.4%) |
| 4:00 PM to 11:59 PM | 27 (6.2%) | 0 (0.0%) |
| Total | 435 (100.0%) | 338 (100.0%) |
Housing Occupancy in Ridgeway
Occupancy by Ownership in Ridgeway
Of the total 1,021 dwellings in Ridgeway, owner-occupied units account for 796 (78.0%), while renter-occupied units make up 225 (22.0%).
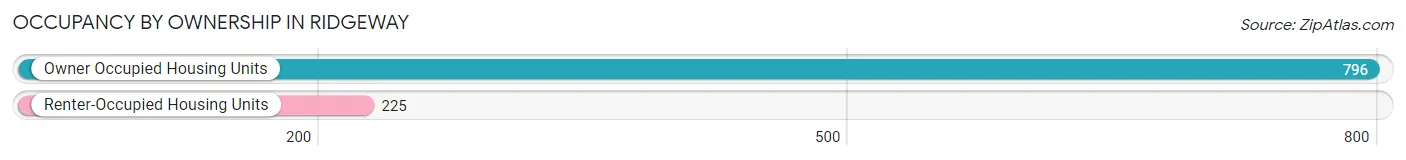
| Occupancy | # Housing Units | % Housing Units |
| Owner Occupied Housing Units | 796 | 78.0% |
| Renter-Occupied Housing Units | 225 | 22.0% |
| Total Occupied Housing Units | 1,021 | 100.0% |
Occupancy by Household Size in Ridgeway
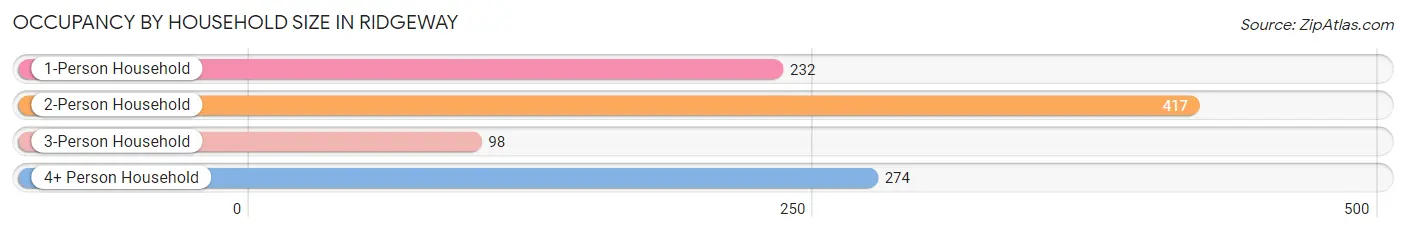
| Household Size | # Housing Units | % Housing Units |
| 1-Person Household | 232 | 22.7% |
| 2-Person Household | 417 | 40.8% |
| 3-Person Household | 98 | 9.6% |
| 4+ Person Household | 274 | 26.8% |
| Total Housing Units | 1,021 | 100.0% |
Occupancy by Ownership by Household Size in Ridgeway
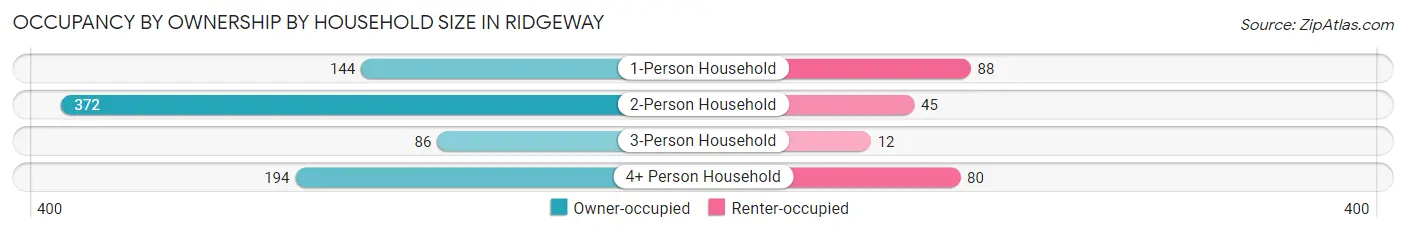
| Household Size | Owner-occupied | Renter-occupied |
| 1-Person Household | 144 (62.1%) | 88 (37.9%) |
| 2-Person Household | 372 (89.2%) | 45 (10.8%) |
| 3-Person Household | 86 (87.8%) | 12 (12.2%) |
| 4+ Person Household | 194 (70.8%) | 80 (29.2%) |
| Total Housing Units | 796 (78.0%) | 225 (22.0%) |
Occupancy by Educational Attainment in Ridgeway
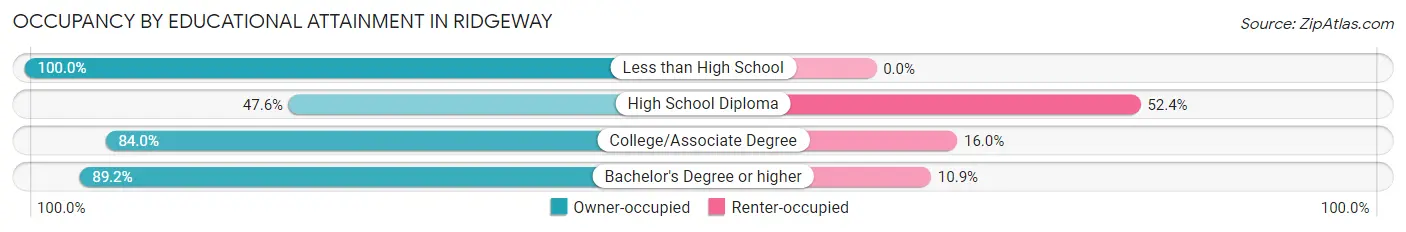
| Household Size | Owner-occupied | Renter-occupied |
| Less than High School | 45 (100.0%) | 0 (0.0%) |
| High School Diploma | 119 (47.6%) | 131 (52.4%) |
| College/Associate Degree | 246 (84.0%) | 47 (16.0%) |
| Bachelor's Degree or higher | 386 (89.1%) | 47 (10.8%) |
Occupancy by Age of Householder in Ridgeway
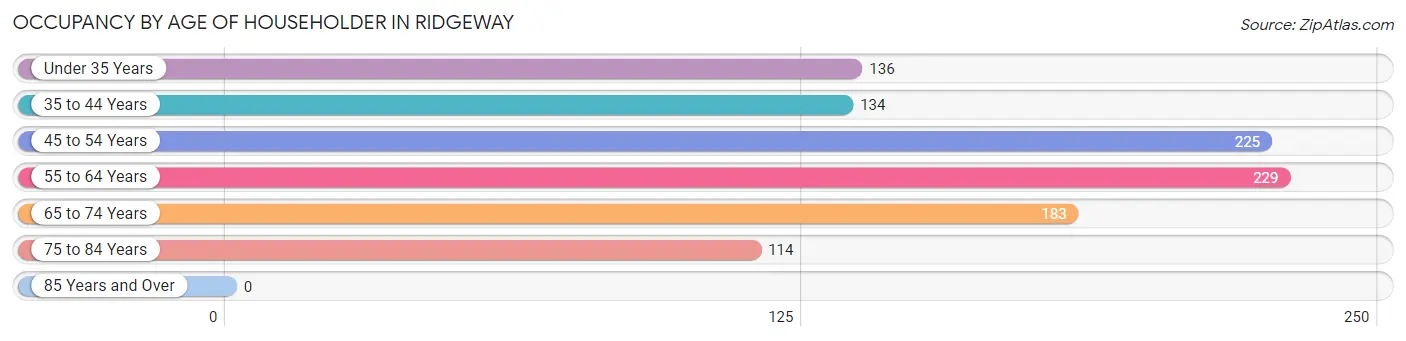
| Age Bracket | # Households | % Households |
| Under 35 Years | 136 | 13.3% |
| 35 to 44 Years | 134 | 13.1% |
| 45 to 54 Years | 225 | 22.0% |
| 55 to 64 Years | 229 | 22.4% |
| 65 to 74 Years | 183 | 17.9% |
| 75 to 84 Years | 114 | 11.2% |
| 85 Years and Over | 0 | 0.0% |
| Total | 1,021 | 100.0% |
Housing Finances in Ridgeway
Median Income by Occupancy in Ridgeway
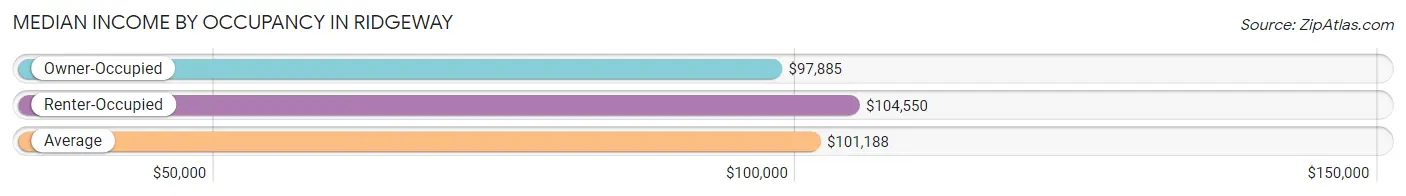
| Occupancy Type | # Households | Median Income |
| Owner-Occupied | 796 (78.0%) | $97,885 |
| Renter-Occupied | 225 (22.0%) | $104,550 |
| Average | 1,021 (100.0%) | $101,188 |
Occupancy by Householder Income Bracket in Ridgeway
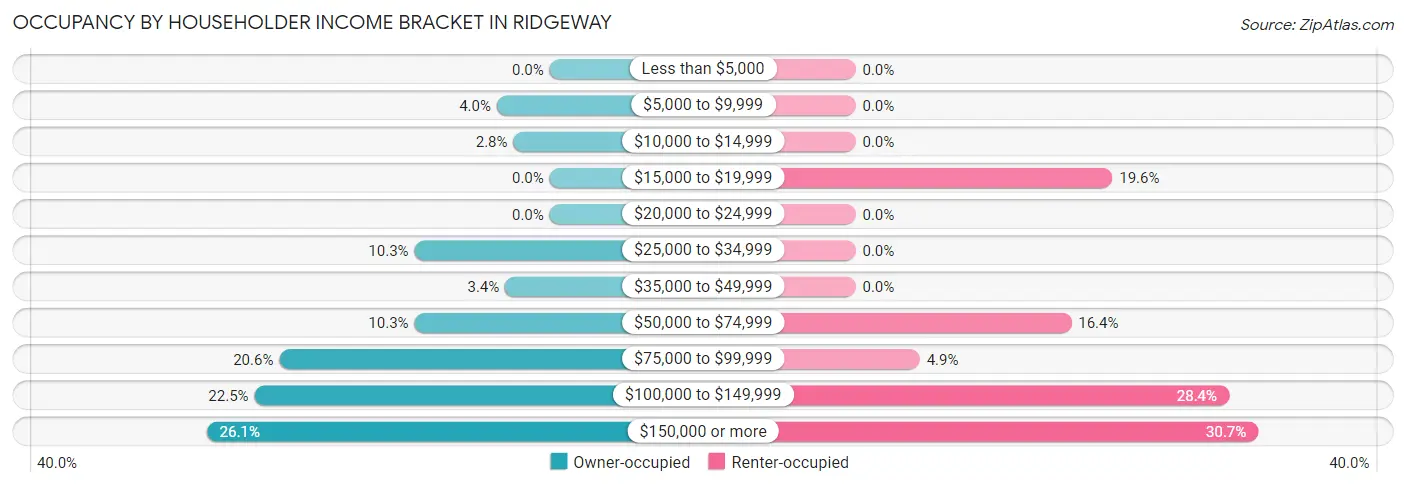
| Income Bracket | Owner-occupied | Renter-occupied |
| Less than $5,000 | 0 (0.0%) | 0 (0.0%) |
| $5,000 to $9,999 | 32 (4.0%) | 0 (0.0%) |
| $10,000 to $14,999 | 22 (2.8%) | 0 (0.0%) |
| $15,000 to $19,999 | 0 (0.0%) | 44 (19.6%) |
| $20,000 to $24,999 | 0 (0.0%) | 0 (0.0%) |
| $25,000 to $34,999 | 82 (10.3%) | 0 (0.0%) |
| $35,000 to $49,999 | 27 (3.4%) | 0 (0.0%) |
| $50,000 to $74,999 | 82 (10.3%) | 37 (16.4%) |
| $75,000 to $99,999 | 164 (20.6%) | 11 (4.9%) |
| $100,000 to $149,999 | 179 (22.5%) | 64 (28.4%) |
| $150,000 or more | 208 (26.1%) | 69 (30.7%) |
| Total | 796 (100.0%) | 225 (100.0%) |
Monthly Housing Cost Tiers in Ridgeway
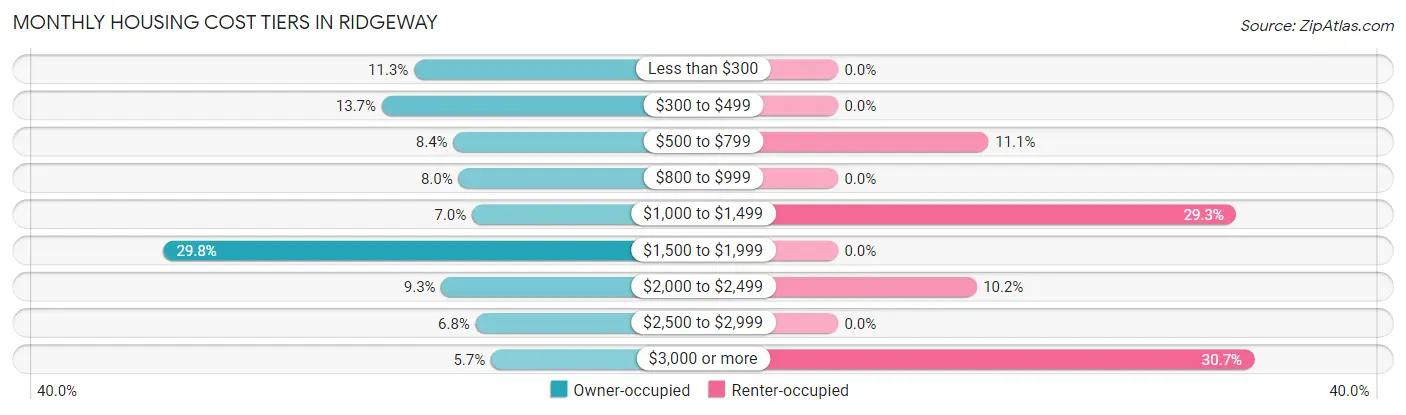
| Monthly Cost | Owner-occupied | Renter-occupied |
| Less than $300 | 90 (11.3%) | 0 (0.0%) |
| $300 to $499 | 109 (13.7%) | 0 (0.0%) |
| $500 to $799 | 67 (8.4%) | 25 (11.1%) |
| $800 to $999 | 64 (8.0%) | 0 (0.0%) |
| $1,000 to $1,499 | 56 (7.0%) | 66 (29.3%) |
| $1,500 to $1,999 | 237 (29.8%) | 0 (0.0%) |
| $2,000 to $2,499 | 74 (9.3%) | 23 (10.2%) |
| $2,500 to $2,999 | 54 (6.8%) | 0 (0.0%) |
| $3,000 or more | 45 (5.7%) | 69 (30.7%) |
| Total | 796 (100.0%) | 225 (100.0%) |
Physical Housing Characteristics in Ridgeway
Housing Structures in Ridgeway
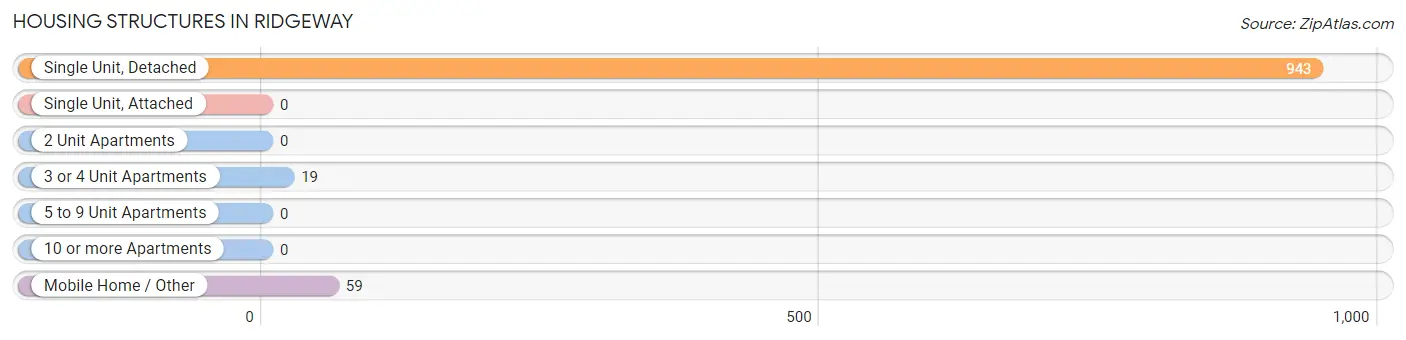
| Structure Type | # Housing Units | % Housing Units |
| Single Unit, Detached | 943 | 92.4% |
| Single Unit, Attached | 0 | 0.0% |
| 2 Unit Apartments | 0 | 0.0% |
| 3 or 4 Unit Apartments | 19 | 1.9% |
| 5 to 9 Unit Apartments | 0 | 0.0% |
| 10 or more Apartments | 0 | 0.0% |
| Mobile Home / Other | 59 | 5.8% |
| Total | 1,021 | 100.0% |
Housing Structures by Occupancy in Ridgeway
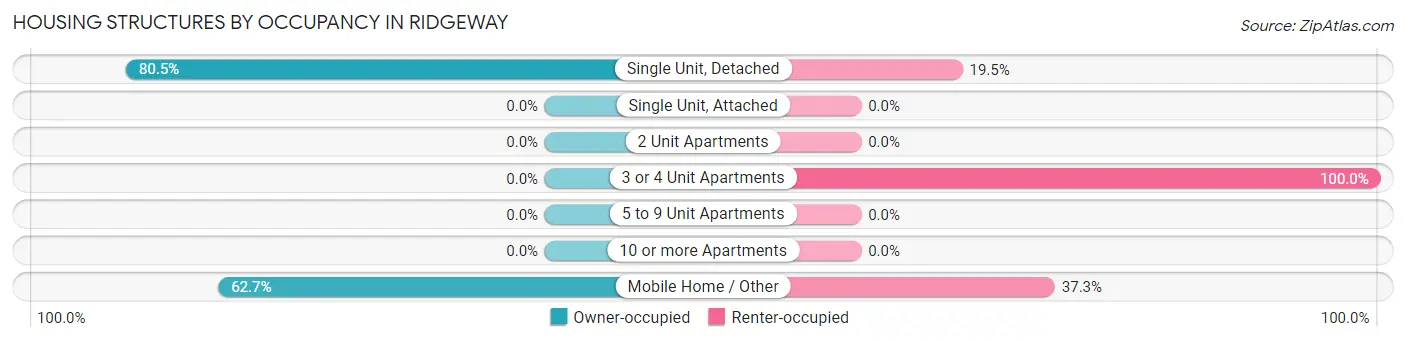
| Structure Type | Owner-occupied | Renter-occupied |
| Single Unit, Detached | 759 (80.5%) | 184 (19.5%) |
| Single Unit, Attached | 0 (0.0%) | 0 (0.0%) |
| 2 Unit Apartments | 0 (0.0%) | 0 (0.0%) |
| 3 or 4 Unit Apartments | 0 (0.0%) | 19 (100.0%) |
| 5 to 9 Unit Apartments | 0 (0.0%) | 0 (0.0%) |
| 10 or more Apartments | 0 (0.0%) | 0 (0.0%) |
| Mobile Home / Other | 37 (62.7%) | 22 (37.3%) |
| Total | 796 (78.0%) | 225 (22.0%) |
Housing Structures by Number of Rooms in Ridgeway
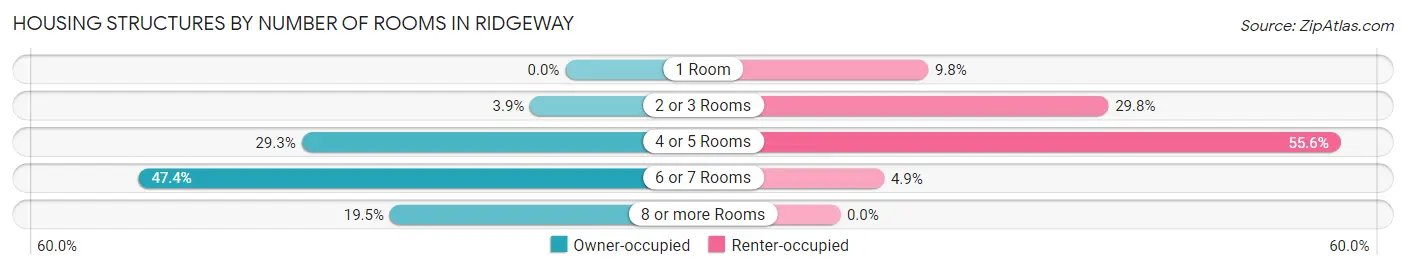
| Number of Rooms | Owner-occupied | Renter-occupied |
| 1 Room | 0 (0.0%) | 22 (9.8%) |
| 2 or 3 Rooms | 31 (3.9%) | 67 (29.8%) |
| 4 or 5 Rooms | 233 (29.3%) | 125 (55.6%) |
| 6 or 7 Rooms | 377 (47.4%) | 11 (4.9%) |
| 8 or more Rooms | 155 (19.5%) | 0 (0.0%) |
| Total | 796 (100.0%) | 225 (100.0%) |
Housing Structure by Heating Type in Ridgeway
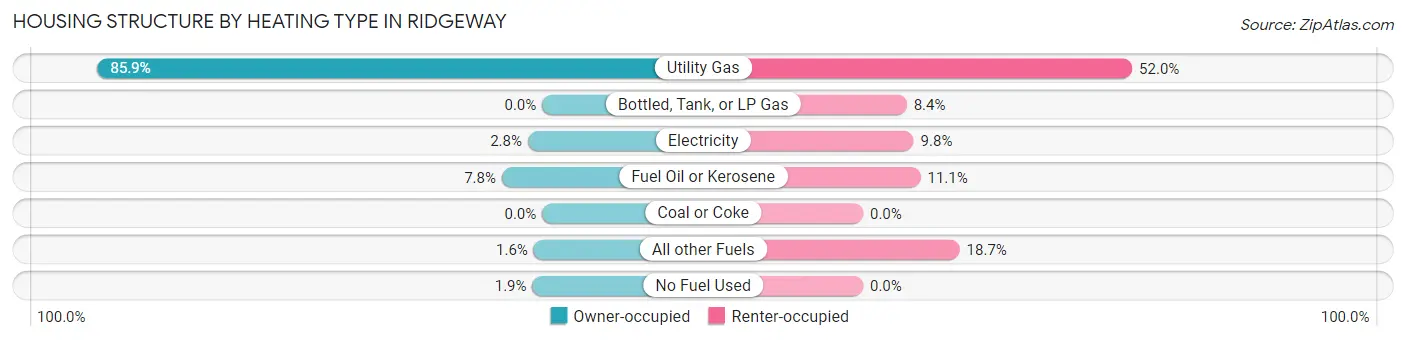
| Heating Type | Owner-occupied | Renter-occupied |
| Utility Gas | 684 (85.9%) | 117 (52.0%) |
| Bottled, Tank, or LP Gas | 0 (0.0%) | 19 (8.4%) |
| Electricity | 22 (2.8%) | 22 (9.8%) |
| Fuel Oil or Kerosene | 62 (7.8%) | 25 (11.1%) |
| Coal or Coke | 0 (0.0%) | 0 (0.0%) |
| All other Fuels | 13 (1.6%) | 42 (18.7%) |
| No Fuel Used | 15 (1.9%) | 0 (0.0%) |
| Total | 796 (100.0%) | 225 (100.0%) |
Household Vehicle Usage in Ridgeway
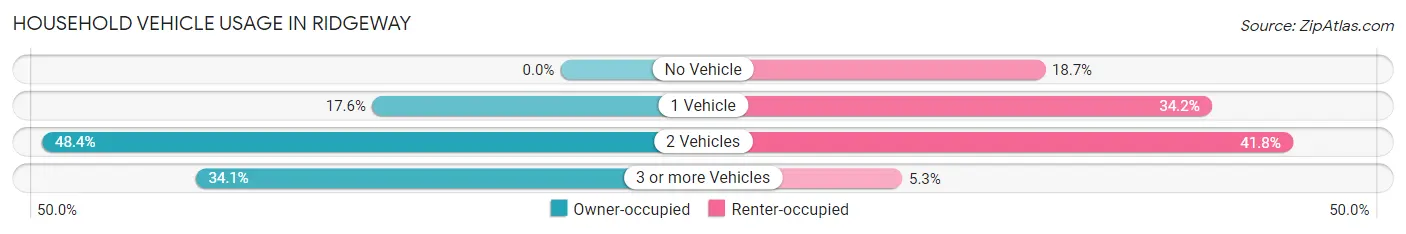
| Vehicles per Household | Owner-occupied | Renter-occupied |
| No Vehicle | 0 (0.0%) | 42 (18.7%) |
| 1 Vehicle | 140 (17.6%) | 77 (34.2%) |
| 2 Vehicles | 385 (48.4%) | 94 (41.8%) |
| 3 or more Vehicles | 271 (34.1%) | 12 (5.3%) |
| Total | 796 (100.0%) | 225 (100.0%) |
Real Estate & Mortgages in Ridgeway
Real Estate and Mortgage Overview in Ridgeway
| Characteristic | Without Mortgage | With Mortgage |
| Housing Units | 334 | 462 |
| Median Property Value | - | - |
| Median Household Income | $94,444 | $148 |
| Monthly Housing Costs | $471 | $45 |
| Real Estate Taxes | $2,809 | $43 |
Property Value by Mortgage Status in Ridgeway
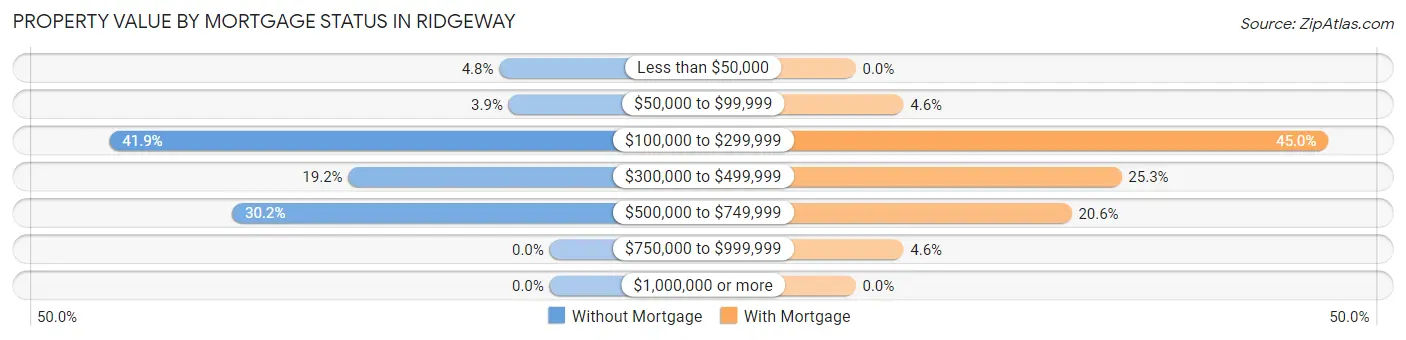
| Property Value | Without Mortgage | With Mortgage |
| Less than $50,000 | 16 (4.8%) | 0 (0.0%) |
| $50,000 to $99,999 | 13 (3.9%) | 21 (4.5%) |
| $100,000 to $299,999 | 140 (41.9%) | 208 (45.0%) |
| $300,000 to $499,999 | 64 (19.2%) | 117 (25.3%) |
| $500,000 to $749,999 | 101 (30.2%) | 95 (20.6%) |
| $750,000 to $999,999 | 0 (0.0%) | 21 (4.5%) |
| $1,000,000 or more | 0 (0.0%) | 0 (0.0%) |
| Total | 334 (100.0%) | 462 (100.0%) |
Household Income by Mortgage Status in Ridgeway
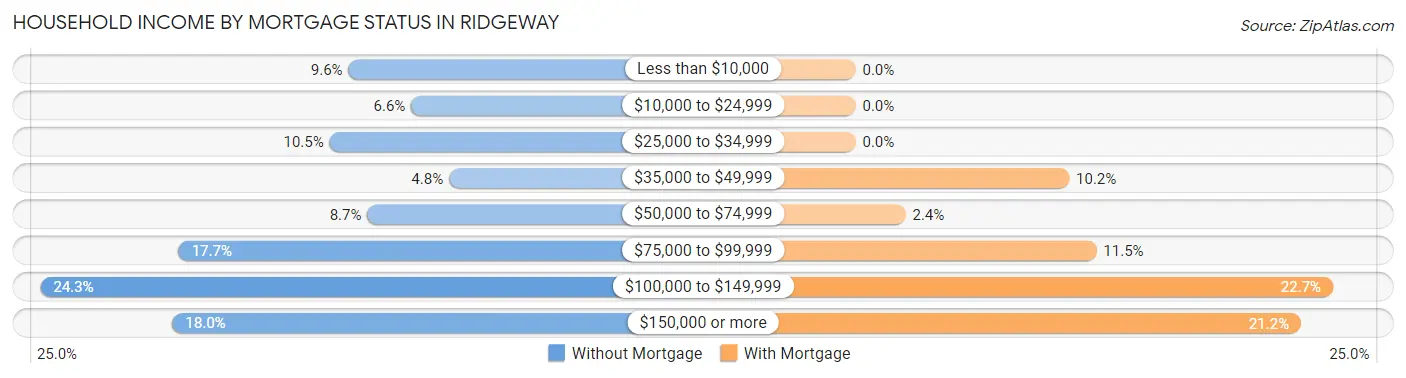
| Household Income | Without Mortgage | With Mortgage |
| Less than $10,000 | 32 (9.6%) | 0 (0.0%) |
| $10,000 to $24,999 | 22 (6.6%) | 0 (0.0%) |
| $25,000 to $34,999 | 35 (10.5%) | 0 (0.0%) |
| $35,000 to $49,999 | 16 (4.8%) | 47 (10.2%) |
| $50,000 to $74,999 | 29 (8.7%) | 11 (2.4%) |
| $75,000 to $99,999 | 59 (17.7%) | 53 (11.5%) |
| $100,000 to $149,999 | 81 (24.2%) | 105 (22.7%) |
| $150,000 or more | 60 (18.0%) | 98 (21.2%) |
| Total | 334 (100.0%) | 462 (100.0%) |
Property Value to Household Income Ratio in Ridgeway
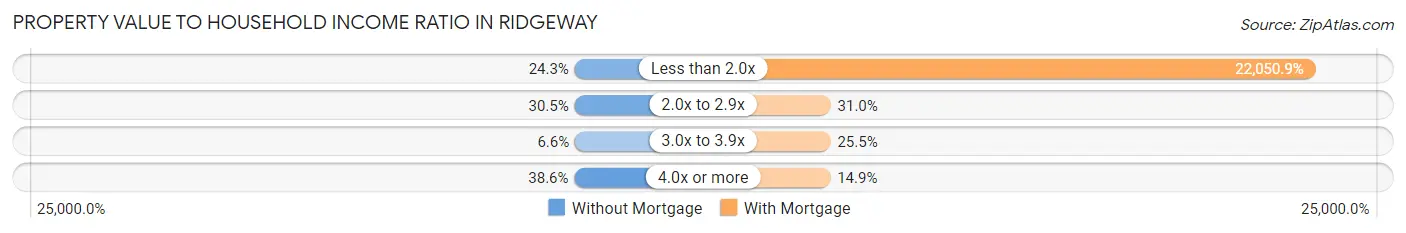
| Value-to-Income Ratio | Without Mortgage | With Mortgage |
| Less than 2.0x | 81 (24.2%) | 101,875 (22,050.9%) |
| 2.0x to 2.9x | 102 (30.5%) | 143 (30.9%) |
| 3.0x to 3.9x | 22 (6.6%) | 118 (25.5%) |
| 4.0x or more | 129 (38.6%) | 69 (14.9%) |
| Total | 334 (100.0%) | 462 (100.0%) |
Real Estate Taxes by Mortgage Status in Ridgeway
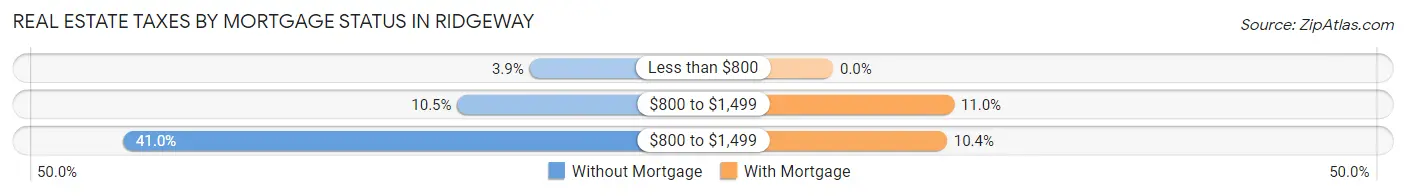
| Property Taxes | Without Mortgage | With Mortgage |
| Less than $800 | 13 (3.9%) | 0 (0.0%) |
| $800 to $1,499 | 35 (10.5%) | 51 (11.0%) |
| $800 to $1,499 | 137 (41.0%) | 48 (10.4%) |
| Total | 334 (100.0%) | 462 (100.0%) |
Health & Disability in Ridgeway
Health Insurance Coverage by Age in Ridgeway
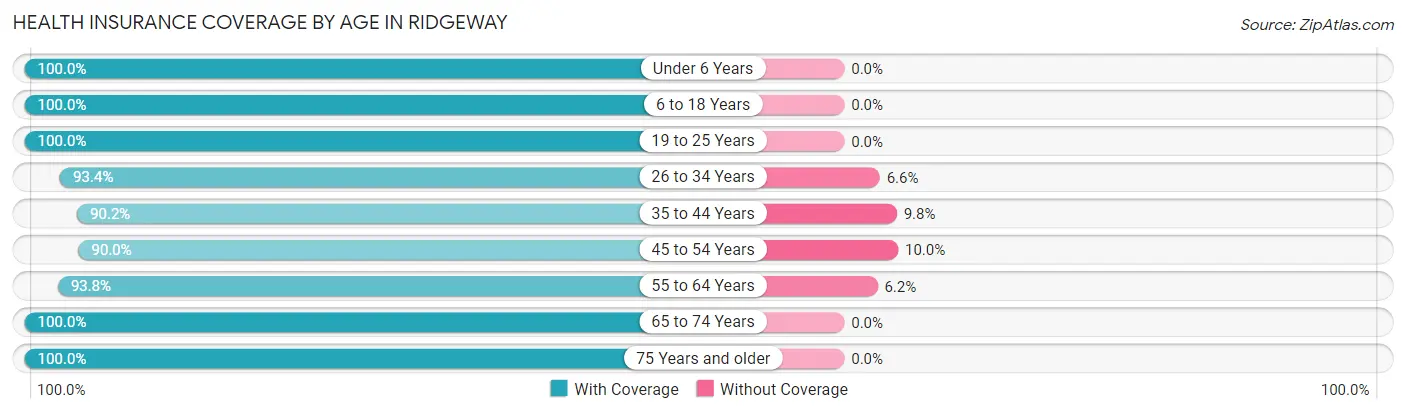
| Age Bracket | With Coverage | Without Coverage |
| Under 6 Years | 271 (100.0%) | 0 (0.0%) |
| 6 to 18 Years | 555 (100.0%) | 0 (0.0%) |
| 19 to 25 Years | 84 (100.0%) | 0 (0.0%) |
| 26 to 34 Years | 269 (93.4%) | 19 (6.6%) |
| 35 to 44 Years | 240 (90.2%) | 26 (9.8%) |
| 45 to 54 Years | 359 (90.0%) | 40 (10.0%) |
| 55 to 64 Years | 410 (93.8%) | 27 (6.2%) |
| 65 to 74 Years | 260 (100.0%) | 0 (0.0%) |
| 75 Years and older | 189 (100.0%) | 0 (0.0%) |
| Total | 2,637 (95.9%) | 112 (4.1%) |
Health Insurance Coverage by Citizenship Status in Ridgeway
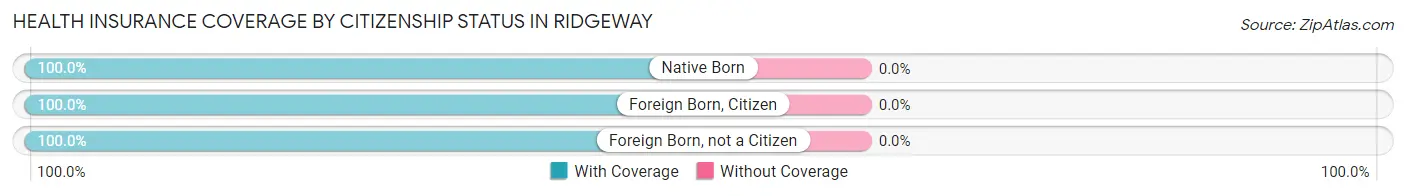
| Citizenship Status | With Coverage | Without Coverage |
| Native Born | 271 (100.0%) | 0 (0.0%) |
| Foreign Born, Citizen | 555 (100.0%) | 0 (0.0%) |
| Foreign Born, not a Citizen | 84 (100.0%) | 0 (0.0%) |
Health Insurance Coverage by Household Income in Ridgeway
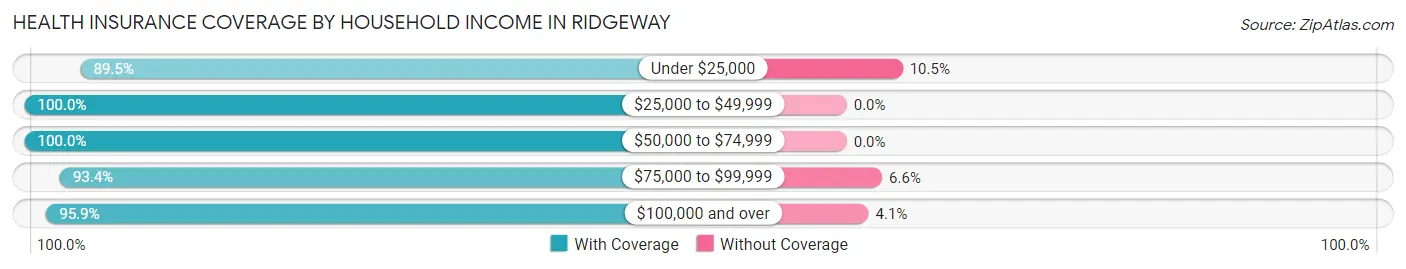
| Household Income | With Coverage | Without Coverage |
| Under $25,000 | 111 (89.5%) | 13 (10.5%) |
| $25,000 to $49,999 | 196 (100.0%) | 0 (0.0%) |
| $50,000 to $74,999 | 363 (100.0%) | 0 (0.0%) |
| $75,000 to $99,999 | 564 (93.4%) | 40 (6.6%) |
| $100,000 and over | 1,387 (95.9%) | 59 (4.1%) |
Public vs Private Health Insurance Coverage by Age in Ridgeway
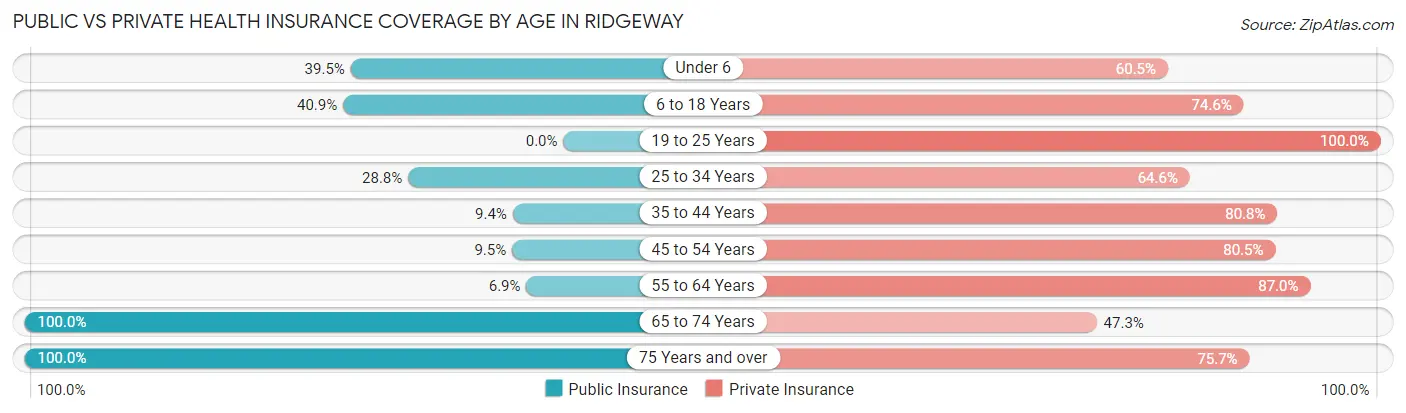
| Age Bracket | Public Insurance | Private Insurance |
| Under 6 | 107 (39.5%) | 164 (60.5%) |
| 6 to 18 Years | 227 (40.9%) | 414 (74.6%) |
| 19 to 25 Years | 0 (0.0%) | 84 (100.0%) |
| 25 to 34 Years | 83 (28.8%) | 186 (64.6%) |
| 35 to 44 Years | 25 (9.4%) | 215 (80.8%) |
| 45 to 54 Years | 38 (9.5%) | 321 (80.4%) |
| 55 to 64 Years | 30 (6.9%) | 380 (87.0%) |
| 65 to 74 Years | 260 (100.0%) | 123 (47.3%) |
| 75 Years and over | 189 (100.0%) | 143 (75.7%) |
| Total | 959 (34.9%) | 2,030 (73.9%) |
Disability Status by Sex by Age in Ridgeway
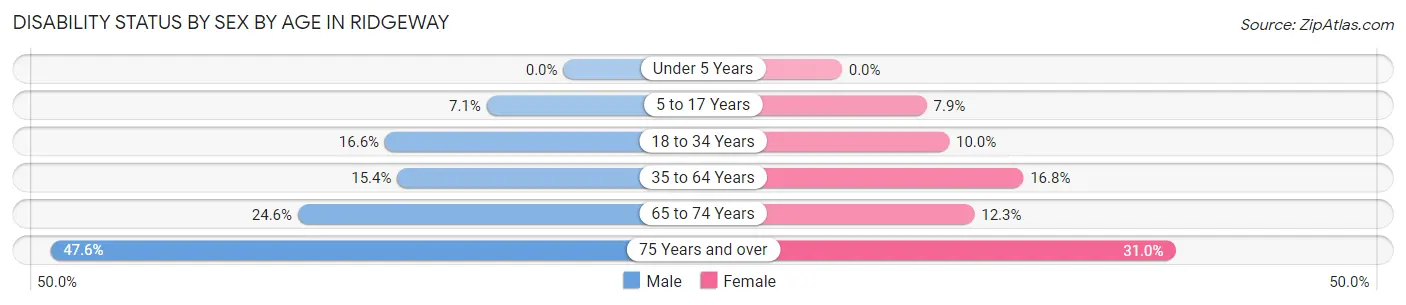
| Age Bracket | Male | Female |
| Under 5 Years | 0 (0.0%) | 0 (0.0%) |
| 5 to 17 Years | 24 (7.1%) | 20 (7.9%) |
| 18 to 34 Years | 25 (16.6%) | 22 (10.0%) |
| 35 to 64 Years | 82 (15.4%) | 96 (16.8%) |
| 65 to 74 Years | 34 (24.6%) | 15 (12.3%) |
| 75 Years and over | 50 (47.6%) | 26 (30.9%) |
Disability Class by Sex by Age in Ridgeway
Disability Class: Hearing Difficulty
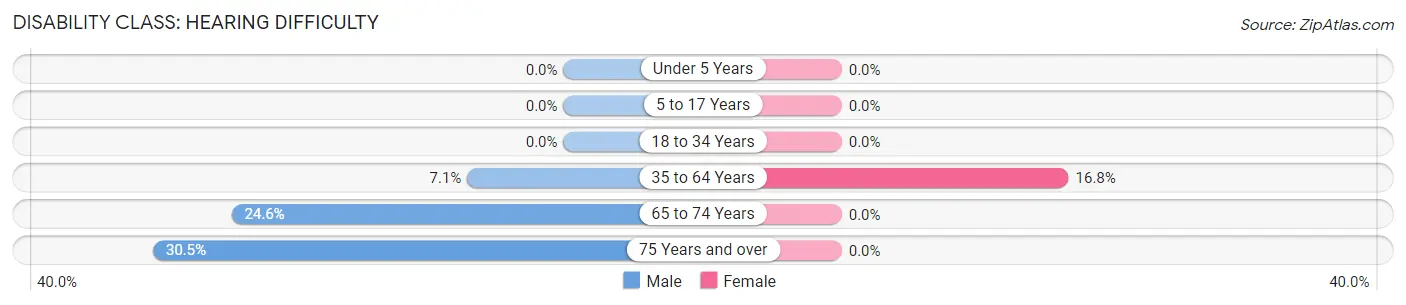
| Age Bracket | Male | Female |
| Under 5 Years | 0 (0.0%) | 0 (0.0%) |
| 5 to 17 Years | 0 (0.0%) | 0 (0.0%) |
| 18 to 34 Years | 0 (0.0%) | 0 (0.0%) |
| 35 to 64 Years | 38 (7.1%) | 96 (16.8%) |
| 65 to 74 Years | 34 (24.6%) | 0 (0.0%) |
| 75 Years and over | 32 (30.5%) | 0 (0.0%) |
Disability Class: Vision Difficulty
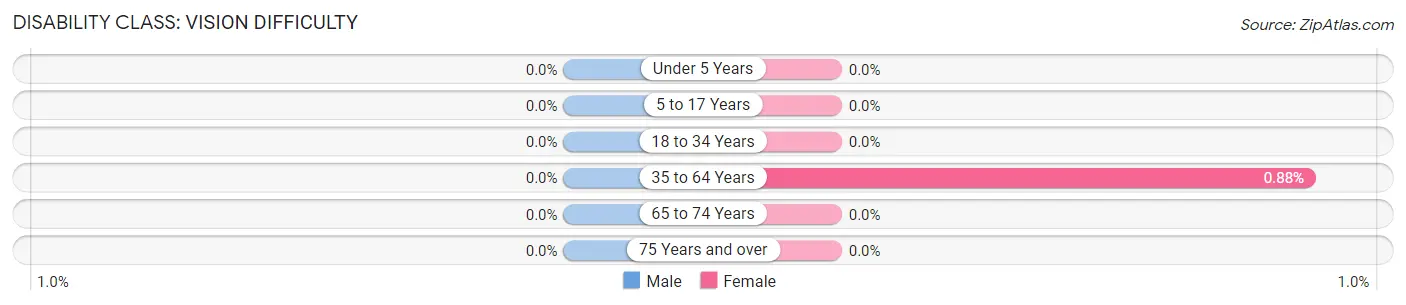
| Age Bracket | Male | Female |
| Under 5 Years | 0 (0.0%) | 0 (0.0%) |
| 5 to 17 Years | 0 (0.0%) | 0 (0.0%) |
| 18 to 34 Years | 0 (0.0%) | 0 (0.0%) |
| 35 to 64 Years | 0 (0.0%) | 5 (0.9%) |
| 65 to 74 Years | 0 (0.0%) | 0 (0.0%) |
| 75 Years and over | 0 (0.0%) | 0 (0.0%) |
Disability Class: Cognitive Difficulty
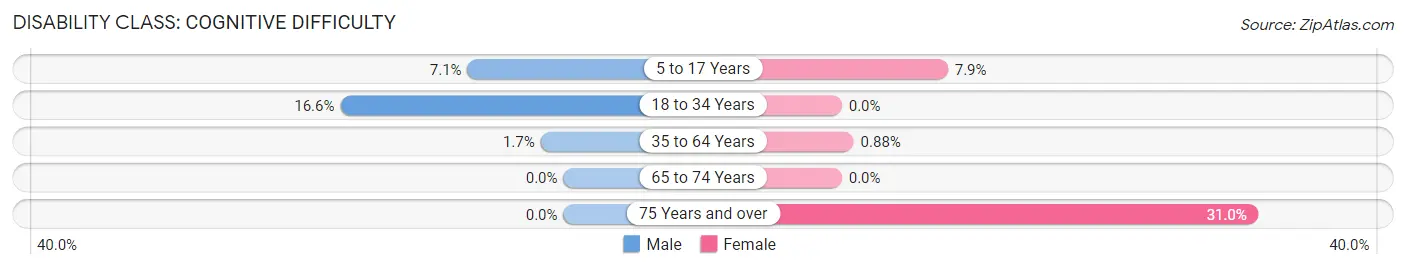
| Age Bracket | Male | Female |
| 5 to 17 Years | 24 (7.1%) | 20 (7.9%) |
| 18 to 34 Years | 25 (16.6%) | 0 (0.0%) |
| 35 to 64 Years | 9 (1.7%) | 5 (0.9%) |
| 65 to 74 Years | 0 (0.0%) | 0 (0.0%) |
| 75 Years and over | 0 (0.0%) | 26 (30.9%) |
Disability Class: Ambulatory Difficulty
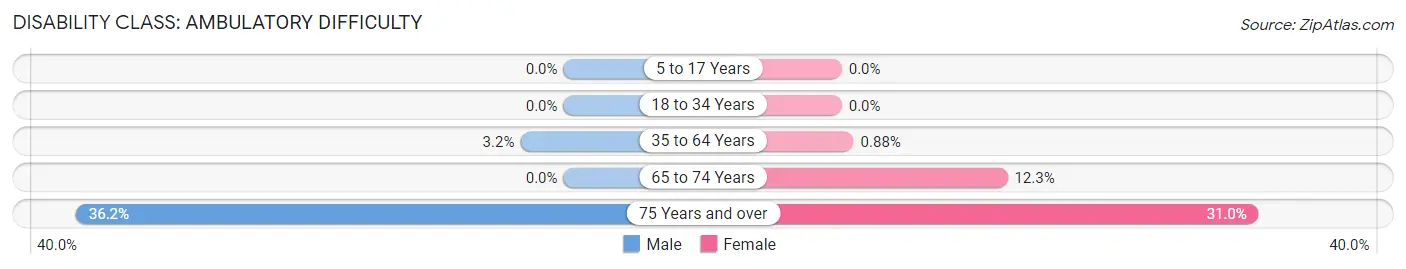
| Age Bracket | Male | Female |
| 5 to 17 Years | 0 (0.0%) | 0 (0.0%) |
| 18 to 34 Years | 0 (0.0%) | 0 (0.0%) |
| 35 to 64 Years | 17 (3.2%) | 5 (0.9%) |
| 65 to 74 Years | 0 (0.0%) | 15 (12.3%) |
| 75 Years and over | 38 (36.2%) | 26 (30.9%) |
Disability Class: Self-Care Difficulty
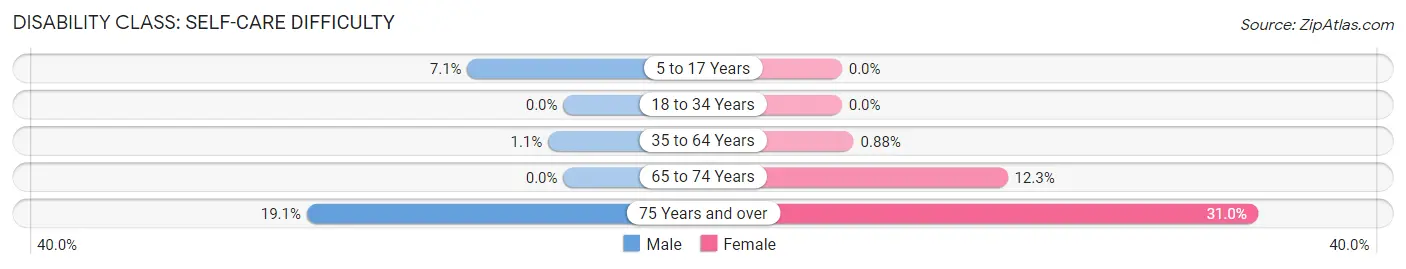
| Age Bracket | Male | Female |
| 5 to 17 Years | 24 (7.1%) | 0 (0.0%) |
| 18 to 34 Years | 0 (0.0%) | 0 (0.0%) |
| 35 to 64 Years | 6 (1.1%) | 5 (0.9%) |
| 65 to 74 Years | 0 (0.0%) | 15 (12.3%) |
| 75 Years and over | 20 (19.1%) | 26 (30.9%) |
Technology Access in Ridgeway
Computing Device Access in Ridgeway
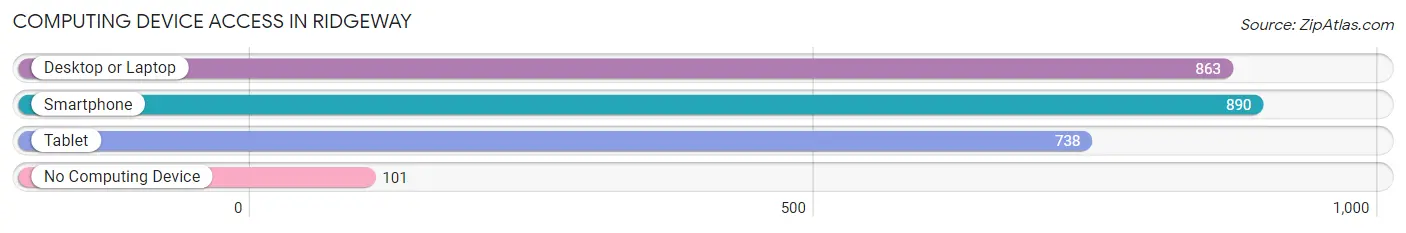
| Device Type | # Households | % Households |
| Desktop or Laptop | 863 | 84.5% |
| Smartphone | 890 | 87.2% |
| Tablet | 738 | 72.3% |
| No Computing Device | 101 | 9.9% |
| Total | 1,021 | 100.0% |
Internet Access in Ridgeway
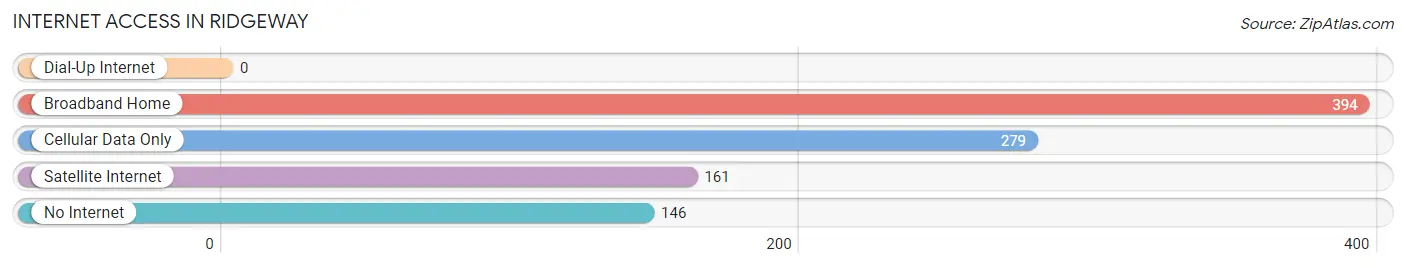
| Internet Type | # Households | % Households |
| Dial-Up Internet | 0 | 0.0% |
| Broadband Home | 394 | 38.6% |
| Cellular Data Only | 279 | 27.3% |
| Satellite Internet | 161 | 15.8% |
| No Internet | 146 | 14.3% |
| Total | 1,021 | 100.0% |
Ridgeway Summary
Ridgeway is a small unincorporated community located in the Matanuska-Susitna Borough of Alaska. It is situated on the south bank of the Susitna River, approximately 25 miles northeast of Wasilla. The community is home to approximately 200 people, and is primarily a residential area.
History
Ridgeway was first settled in the early 1900s by homesteaders who were attracted to the area by its abundant natural resources. The community was named after the nearby ridges, which provided a natural barrier from the harsh winter winds. The first post office was established in Ridgeway in 1915, and the community was officially incorporated in 1921.
In the early years, the economy of Ridgeway was largely based on subsistence farming and trapping. The community was also home to a number of small businesses, including a general store, a blacksmith shop, and a sawmill.
In the 1950s, the economy of Ridgeway began to shift towards tourism. The community was a popular destination for hunters and fishermen, and the local economy was bolstered by the construction of a number of lodges and cabins.
Geography
Ridgeway is located in the Matanuska-Susitna Borough of Alaska, approximately 25 miles northeast of Wasilla. The community is situated on the south bank of the Susitna River, and is surrounded by the Talkeetna Mountains to the north and the Chugach Mountains to the south.
The climate of Ridgeway is generally mild, with temperatures ranging from -20°F in the winter to 70°F in the summer. The area receives an average of 20 inches of precipitation per year, with most of it falling in the form of snow.
Economy
The economy of Ridgeway is largely based on tourism. The community is a popular destination for hunters and fishermen, and the local economy is bolstered by the construction of a number of lodges and cabins.
In addition to tourism, the economy of Ridgeway is also supported by subsistence farming and trapping. The community is home to a number of small businesses, including a general store, a blacksmith shop, and a sawmill.
Demographics
As of the 2010 census, the population of Ridgeway was approximately 200 people. The racial makeup of the community was 95.5% White, 0.5% Native American, 0.5% Asian, and 3.5% from other races.
The median household income in Ridgeway was $50,000, and the median family income was $55,000. The per capita income was $20,000. Approximately 10% of the population was below the poverty line.
Common Questions
What is Per Capita Income in Ridgeway?
Per Capita income in Ridgeway is $42,951.
What is the Median Family Income in Ridgeway?
Median Family Income in Ridgeway is $125,185.
What is the Median Household income in Ridgeway?
Median Household Income in Ridgeway is $101,188.
What is Income or Wage Gap in Ridgeway?
Income or Wage Gap in Ridgeway is 53.3%.
Women in Ridgeway earn 46.7 cents for every dollar earned by a man.
What is Inequality or Gini Index in Ridgeway?
Inequality or Gini Index in Ridgeway is 0.39.
What is the Total Population of Ridgeway?
Total Population of Ridgeway is 2,749.
What is the Total Male Population of Ridgeway?
Total Male Population of Ridgeway is 1,383.
What is the Total Female Population of Ridgeway?
Total Female Population of Ridgeway is 1,366.
What is the Ratio of Males per 100 Females in Ridgeway?
There are 101.24 Males per 100 Females in Ridgeway.
What is the Ratio of Females per 100 Males in Ridgeway?
There are 98.77 Females per 100 Males in Ridgeway.
What is the Median Population Age in Ridgeway?
Median Population Age in Ridgeway is 42.8 Years.
What is the Average Family Size in Ridgeway
Average Family Size in Ridgeway is 3.3 People.
What is the Average Household Size in Ridgeway
Average Household Size in Ridgeway is 2.7 People.
How Large is the Labor Force in Ridgeway?
There are 1,158 People in the Labor Forcein in Ridgeway.
What is the Percentage of People in the Labor Force in Ridgeway?
56.6% of People are in the Labor Force in Ridgeway.
What is the Unemployment Rate in Ridgeway?
Unemployment Rate in Ridgeway is 6.7%.