Steele Creek, AK Map & Demographics
Steele Creek Map
Steele Creek Overview
$53,582
PER CAPITA INCOME
$161,458
AVG FAMILY INCOME
$118,934
AVG HOUSEHOLD INCOME
43.9%
WAGE / INCOME GAP [ % ]
56.1¢/ $1
WAGE / INCOME GAP [ $ ]
0.35
INEQUALITY / GINI INDEX
6,542
TOTAL POPULATION
3,458
MALE POPULATION
3,084
FEMALE POPULATION
112.13
MALES / 100 FEMALES
89.18
FEMALES / 100 MALES
39.1
MEDIAN AGE
3.4
AVG FAMILY SIZE
2.9
AVG HOUSEHOLD SIZE
3,854
LABOR FORCE [ PEOPLE ]
69.6%
PERCENT IN LABOR FORCE
2.8%
UNEMPLOYMENT RATE
Income in Steele Creek
Income Overview in Steele Creek
Per Capita Income in Steele Creek is $53,582, while median incomes of families and households are $161,458 and $118,934 respectively.
| Characteristic | Number | Measure |
| Per Capita Income | 6,542 | $53,582 |
| Median Family Income | 1,525 | $161,458 |
| Mean Family Income | 1,525 | $172,936 |
| Median Household Income | 2,244 | $118,934 |
| Mean Household Income | 2,244 | $152,786 |
| Income Deficit | 1,525 | $0 |
| Wage / Income Gap (%) | 6,542 | 43.86% |
| Wage / Income Gap ($) | 6,542 | 56.14¢ per $1 |
| Gini / Inequality Index | 6,542 | 0.35 |
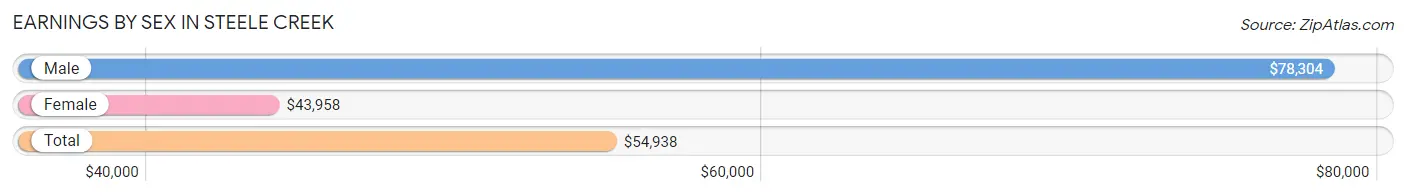
Earnings by Sex in Steele Creek
Average Earnings in Steele Creek are $54,938, $78,304 for men and $43,958 for women, a difference of 43.9%.
| Sex | Number | Average Earnings |
| Male | 2,102 (50.7%) | $78,304 |
| Female | 2,040 (49.2%) | $43,958 |
| Total | 4,142 (100.0%) | $54,938 |
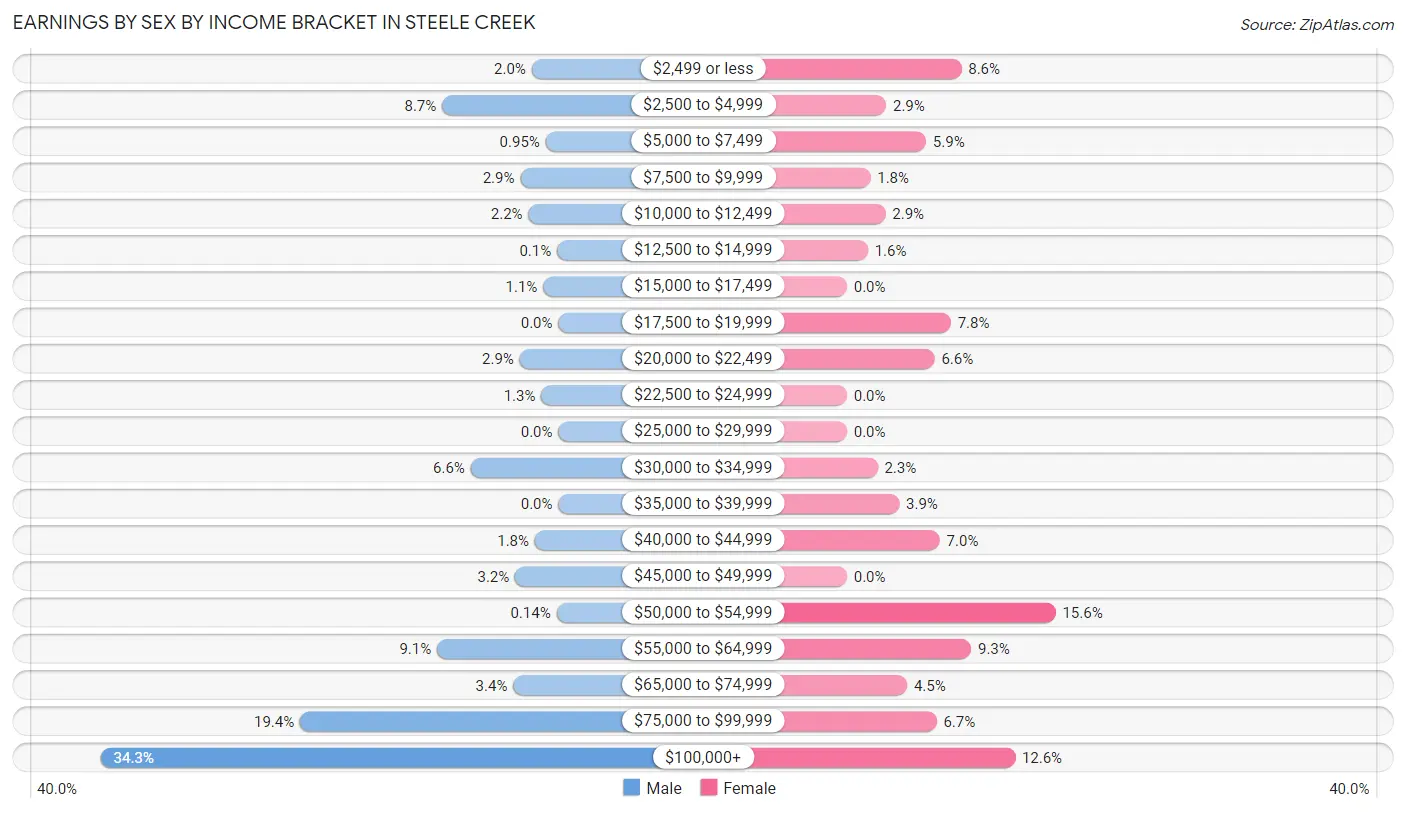
Earnings by Sex by Income Bracket in Steele Creek
The most common earnings brackets in Steele Creek are $100,000+ for men (721 | 34.3%) and $50,000 to $54,999 for women (319 | 15.6%).
| Income | Male | Female |
| $2,499 or less | 42 (2.0%) | 175 (8.6%) |
| $2,500 to $4,999 | 183 (8.7%) | 60 (2.9%) |
| $5,000 to $7,499 | 20 (0.9%) | 121 (5.9%) |
| $7,500 to $9,999 | 60 (2.9%) | 36 (1.8%) |
| $10,000 to $12,499 | 47 (2.2%) | 59 (2.9%) |
| $12,500 to $14,999 | 2 (0.1%) | 32 (1.6%) |
| $15,000 to $17,499 | 24 (1.1%) | 0 (0.0%) |
| $17,500 to $19,999 | 0 (0.0%) | 159 (7.8%) |
| $20,000 to $22,499 | 61 (2.9%) | 134 (6.6%) |
| $22,500 to $24,999 | 27 (1.3%) | 0 (0.0%) |
| $25,000 to $29,999 | 0 (0.0%) | 0 (0.0%) |
| $30,000 to $34,999 | 138 (6.6%) | 47 (2.3%) |
| $35,000 to $39,999 | 0 (0.0%) | 80 (3.9%) |
| $40,000 to $44,999 | 37 (1.8%) | 142 (7.0%) |
| $45,000 to $49,999 | 68 (3.2%) | 0 (0.0%) |
| $50,000 to $54,999 | 3 (0.1%) | 319 (15.6%) |
| $55,000 to $64,999 | 191 (9.1%) | 190 (9.3%) |
| $65,000 to $74,999 | 71 (3.4%) | 92 (4.5%) |
| $75,000 to $99,999 | 407 (19.4%) | 137 (6.7%) |
| $100,000+ | 721 (34.3%) | 257 (12.6%) |
| Total | 2,102 (100.0%) | 2,040 (100.0%) |
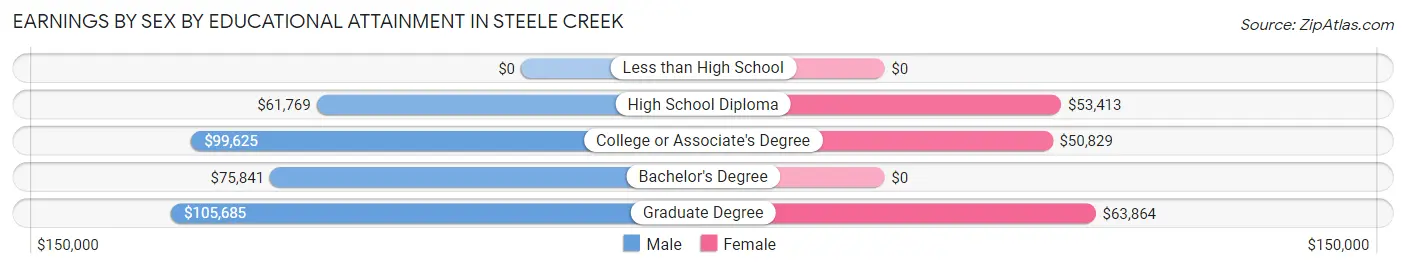
Earnings by Sex by Educational Attainment in Steele Creek
Average earnings in Steele Creek are $94,531 for men and $51,166 for women, a difference of 45.9%. Men with an educational attainment of graduate degree enjoy the highest average annual earnings of $105,685, while those with high school diploma education earn the least with $61,769. Women with an educational attainment of graduate degree earn the most with the average annual earnings of $63,864, while those with college or associate's degree education have the smallest earnings of $50,829.
| Educational Attainment | Male Income | Female Income |
| Less than High School | - | - |
| High School Diploma | $61,769 | $53,413 |
| College or Associate's Degree | $99,625 | $50,829 |
| Bachelor's Degree | $75,841 | $0 |
| Graduate Degree | $105,685 | $63,864 |
| Total | $94,531 | $51,166 |
Family Income in Steele Creek
Family Income Brackets in Steele Creek
According to the Steele Creek family income data, there are 476 families falling into the $200,000+ income range, which is the most common income bracket and makes up 31.2% of all families.
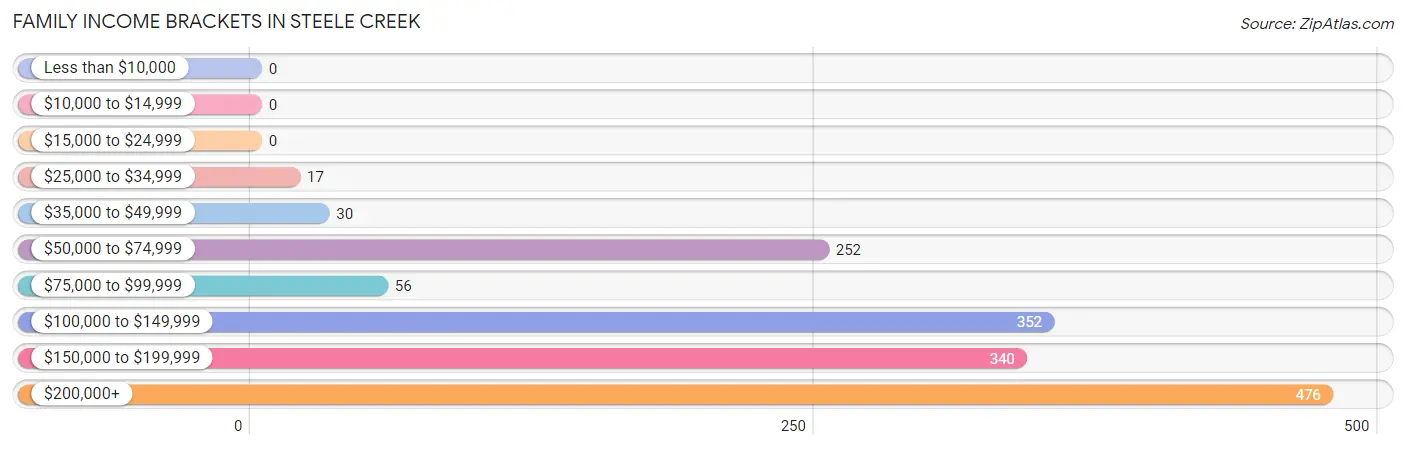
| Income Bracket | # Families | % Families |
| Less than $10,000 | 0 | 0.0% |
| $10,000 to $14,999 | 0 | 0.0% |
| $15,000 to $24,999 | 0 | 0.0% |
| $25,000 to $34,999 | 17 | 1.1% |
| $35,000 to $49,999 | 30 | 2.0% |
| $50,000 to $74,999 | 252 | 16.5% |
| $75,000 to $99,999 | 56 | 3.7% |
| $100,000 to $149,999 | 352 | 23.1% |
| $150,000 to $199,999 | 340 | 22.3% |
| $200,000+ | 476 | 31.2% |
Family Income by Famaliy Size in Steele Creek
3-person families (523 | 34.3%) account for the highest median family income in Steele Creek with $178,628 per family, while 3-person families (523 | 34.3%) have the highest median income of $59,543 per family member.
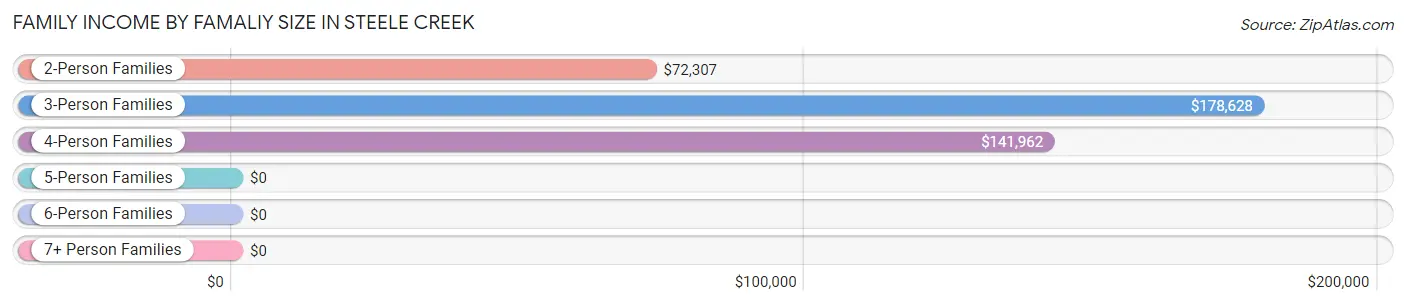
| Income Bracket | # Families | Median Income |
| 2-Person Families | 511 (33.5%) | $72,307 |
| 3-Person Families | 523 (34.3%) | $178,628 |
| 4-Person Families | 345 (22.6%) | $141,962 |
| 5-Person Families | 45 (2.9%) | $0 |
| 6-Person Families | 92 (6.0%) | $0 |
| 7+ Person Families | 9 (0.6%) | $0 |
| Total | 1,525 (100.0%) | $161,458 |
Family Income by Number of Earners in Steele Creek
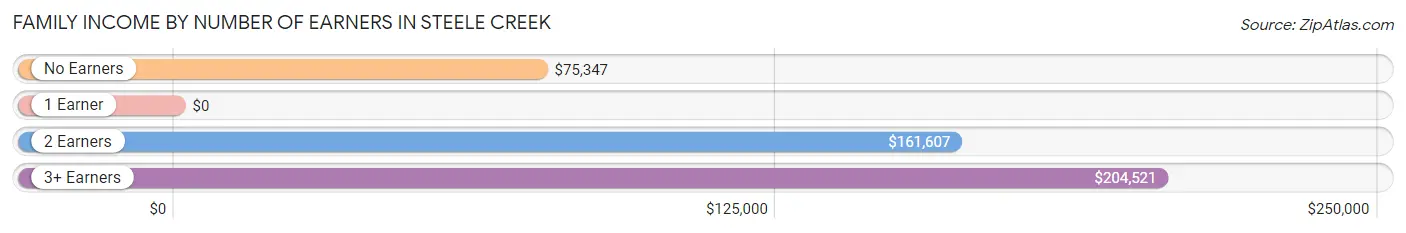
| Number of Earners | # Families | Median Income |
| No Earners | 109 (7.1%) | $75,347 |
| 1 Earner | 221 (14.5%) | $0 |
| 2 Earners | 780 (51.1%) | $161,607 |
| 3+ Earners | 415 (27.2%) | $204,521 |
| Total | 1,525 (100.0%) | $161,458 |
Household Income in Steele Creek
Household Income Brackets in Steele Creek
With 644 households falling in the category, the $200,000+ income range is the most frequent in Steele Creek, accounting for 28.7% of all households.
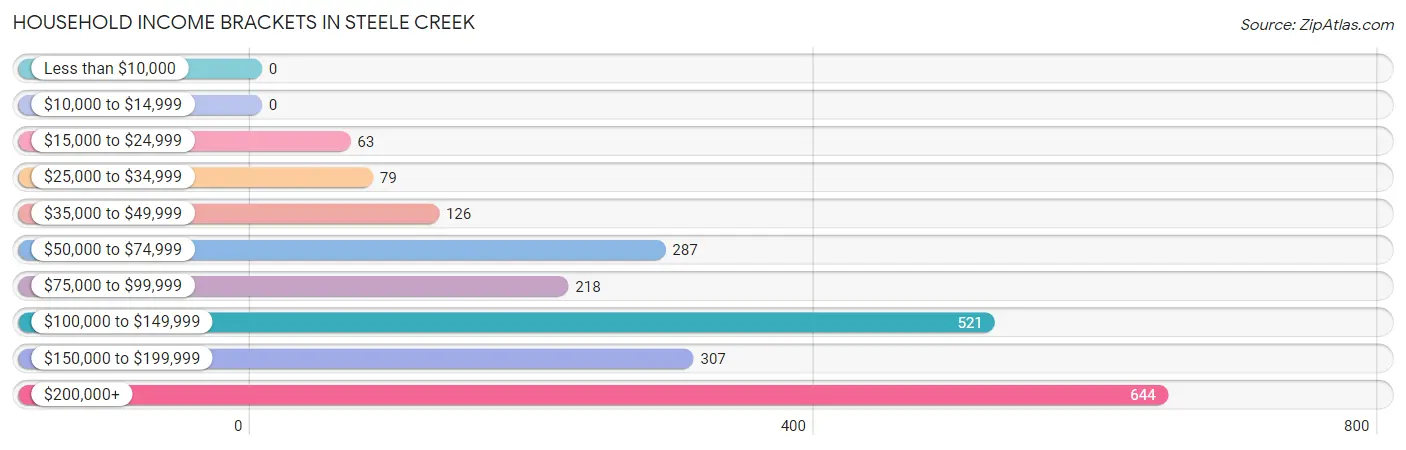
| Income Bracket | # Households | % Households |
| Less than $10,000 | 0 | 0.0% |
| $10,000 to $14,999 | 0 | 0.0% |
| $15,000 to $24,999 | 63 | 2.8% |
| $25,000 to $34,999 | 79 | 3.5% |
| $35,000 to $49,999 | 126 | 5.6% |
| $50,000 to $74,999 | 287 | 12.8% |
| $75,000 to $99,999 | 218 | 9.7% |
| $100,000 to $149,999 | 521 | 23.2% |
| $150,000 to $199,999 | 307 | 13.7% |
| $200,000+ | 644 | 28.7% |
Household Income by Householder Age in Steele Creek
The median household income in Steele Creek is $118,934, with the highest median household income of $159,813 found in the 45 to 64 years age bracket for the primary householder. A total of 1,089 households (48.5%) fall into this category. Meanwhile, the 15 to 24 years age bracket for the primary householder has the lowest median household income of $0, with 113 households (5.0%) in this group.
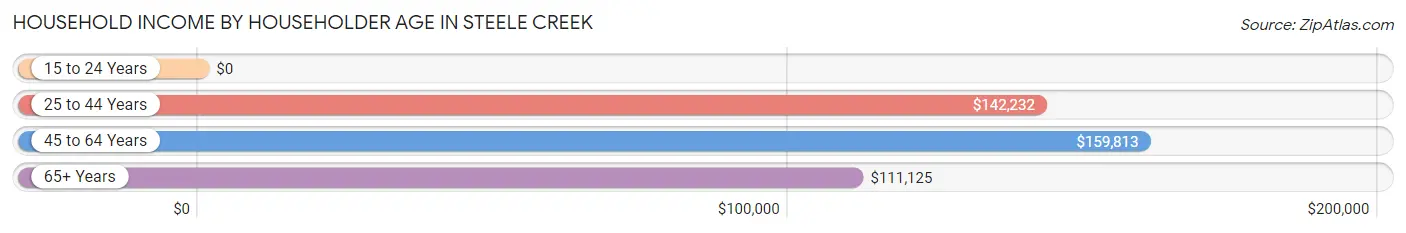
| Income Bracket | # Households | Median Income |
| 15 to 24 Years | 113 (5.0%) | $0 |
| 25 to 44 Years | 578 (25.8%) | $142,232 |
| 45 to 64 Years | 1,089 (48.5%) | $159,813 |
| 65+ Years | 464 (20.7%) | $111,125 |
| Total | 2,244 (100.0%) | $118,934 |
Poverty in Steele Creek
Income Below Poverty by Sex and Age in Steele Creek
With 1.4% poverty level for males and 0.8% for females among the residents of Steele Creek, 18 to 24 year old males and 16 and 17 year old females are the most vulnerable to poverty, with 46 males (7.0%) and 24 females (21.8%) in their respective age groups living below the poverty level.
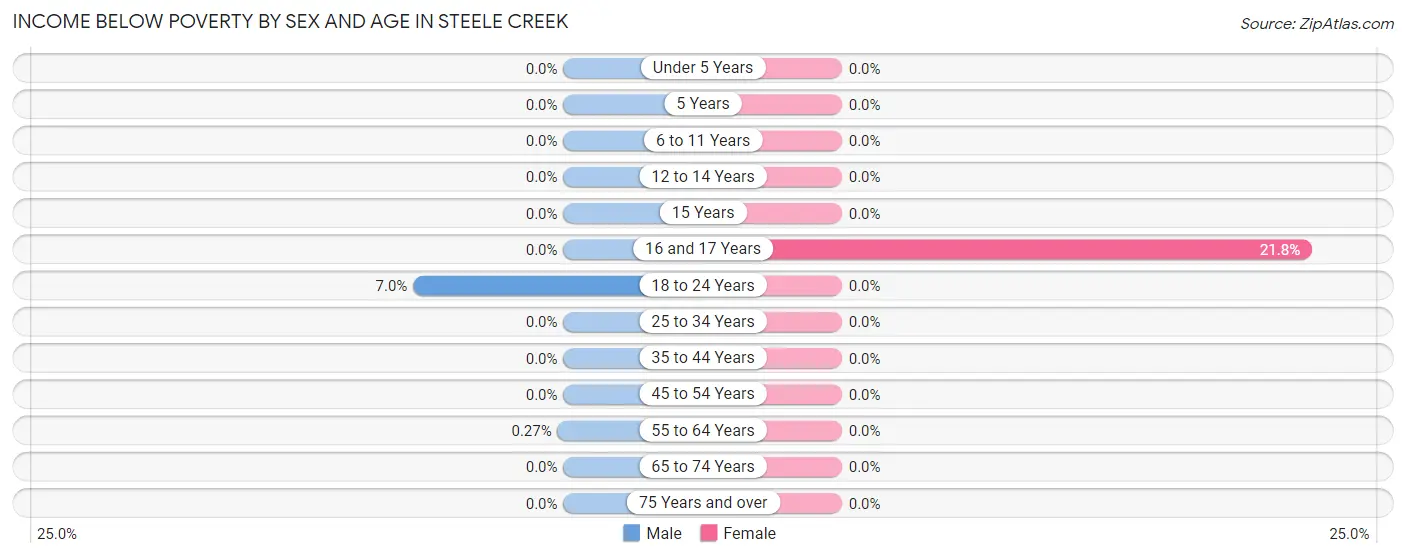
| Age Bracket | Male | Female |
| Under 5 Years | 0 (0.0%) | 0 (0.0%) |
| 5 Years | 0 (0.0%) | 0 (0.0%) |
| 6 to 11 Years | 0 (0.0%) | 0 (0.0%) |
| 12 to 14 Years | 0 (0.0%) | 0 (0.0%) |
| 15 Years | 0 (0.0%) | 0 (0.0%) |
| 16 and 17 Years | 0 (0.0%) | 24 (21.8%) |
| 18 to 24 Years | 46 (7.0%) | 0 (0.0%) |
| 25 to 34 Years | 0 (0.0%) | 0 (0.0%) |
| 35 to 44 Years | 0 (0.0%) | 0 (0.0%) |
| 45 to 54 Years | 0 (0.0%) | 0 (0.0%) |
| 55 to 64 Years | 1 (0.3%) | 0 (0.0%) |
| 65 to 74 Years | 0 (0.0%) | 0 (0.0%) |
| 75 Years and over | 0 (0.0%) | 0 (0.0%) |
| Total | 47 (1.4%) | 24 (0.8%) |
Income Above Poverty by Sex and Age in Steele Creek
According to the poverty statistics in Steele Creek, males aged under 5 years and females aged under 5 years are the age groups that are most secure financially, with 100.0% of males and 100.0% of females in these age groups living above the poverty line.
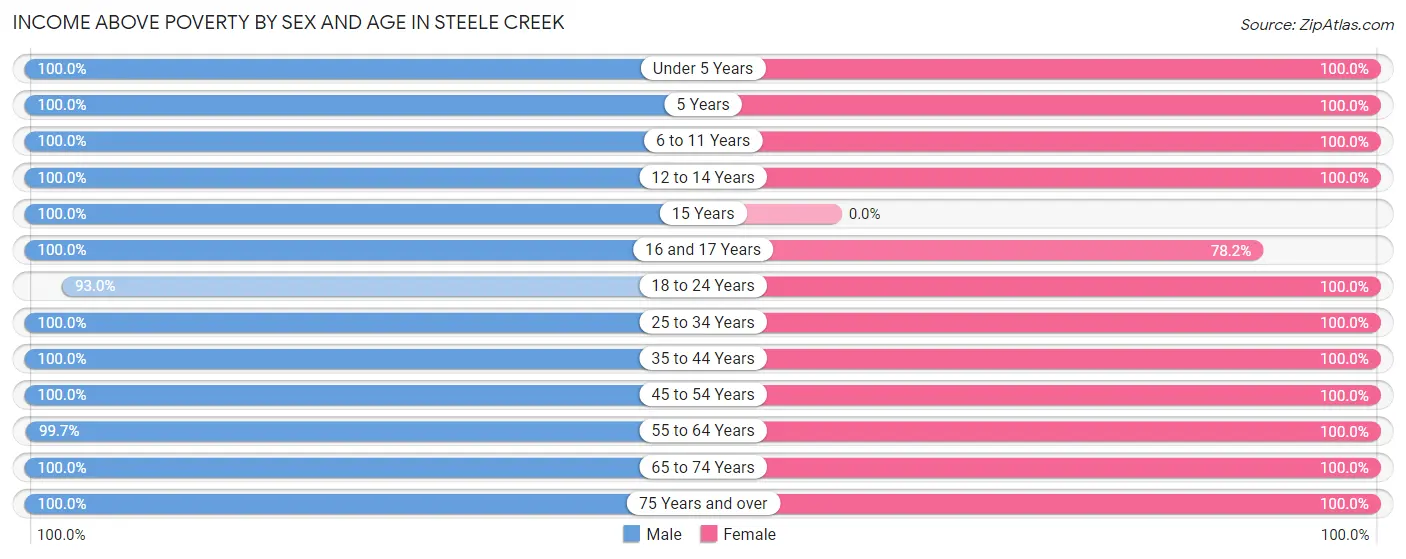
| Age Bracket | Male | Female |
| Under 5 Years | 125 (100.0%) | 96 (100.0%) |
| 5 Years | 10 (100.0%) | 125 (100.0%) |
| 6 to 11 Years | 134 (100.0%) | 240 (100.0%) |
| 12 to 14 Years | 57 (100.0%) | 35 (100.0%) |
| 15 Years | 85 (100.0%) | 0 (0.0%) |
| 16 and 17 Years | 136 (100.0%) | 86 (78.2%) |
| 18 to 24 Years | 614 (93.0%) | 393 (100.0%) |
| 25 to 34 Years | 136 (100.0%) | 260 (100.0%) |
| 35 to 44 Years | 558 (100.0%) | 420 (100.0%) |
| 45 to 54 Years | 647 (100.0%) | 423 (100.0%) |
| 55 to 64 Years | 368 (99.7%) | 680 (100.0%) |
| 65 to 74 Years | 278 (100.0%) | 242 (100.0%) |
| 75 Years and over | 164 (100.0%) | 60 (100.0%) |
| Total | 3,312 (98.6%) | 3,060 (99.2%) |
Income Below Poverty Among Married-Couple Families in Steele Creek
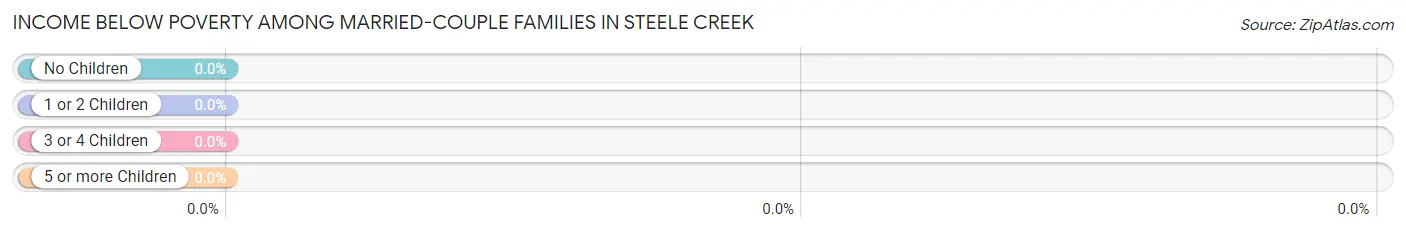
| Children | Above Poverty | Below Poverty |
| No Children | 730 (100.0%) | 0 (0.0%) |
| 1 or 2 Children | 686 (100.0%) | 0 (0.0%) |
| 3 or 4 Children | 60 (100.0%) | 0 (0.0%) |
| 5 or more Children | 0 (0.0%) | 0 (0.0%) |
| Total | 1,476 (100.0%) | 0 (0.0%) |
Income Below Poverty Among Single-Parent Households in Steele Creek
| Children | Single Father | Single Mother |
| No Children | 0 (0.0%) | 0 (0.0%) |
| 1 or 2 Children | 0 (0.0%) | 0 (0.0%) |
| 3 or 4 Children | 0 (0.0%) | 0 (0.0%) |
| 5 or more Children | 0 (0.0%) | 0 (0.0%) |
| Total | 0 (0.0%) | 0 (0.0%) |
Income Below Poverty Among Married-Couple vs Single-Parent Households in Steele Creek
| Children | Married-Couple Families | Single-Parent Households |
| No Children | 0 (0.0%) | 0 (0.0%) |
| 1 or 2 Children | 0 (0.0%) | 0 (0.0%) |
| 3 or 4 Children | 0 (0.0%) | 0 (0.0%) |
| 5 or more Children | 0 (0.0%) | 0 (0.0%) |
| Total | 0 (0.0%) | 0 (0.0%) |
Race in Steele Creek
The most populous races in Steele Creek are White / Caucasian (5,363 | 82.0%), Two or more Races (599 | 9.2%), and Native / Alaskan (377 | 5.8%).
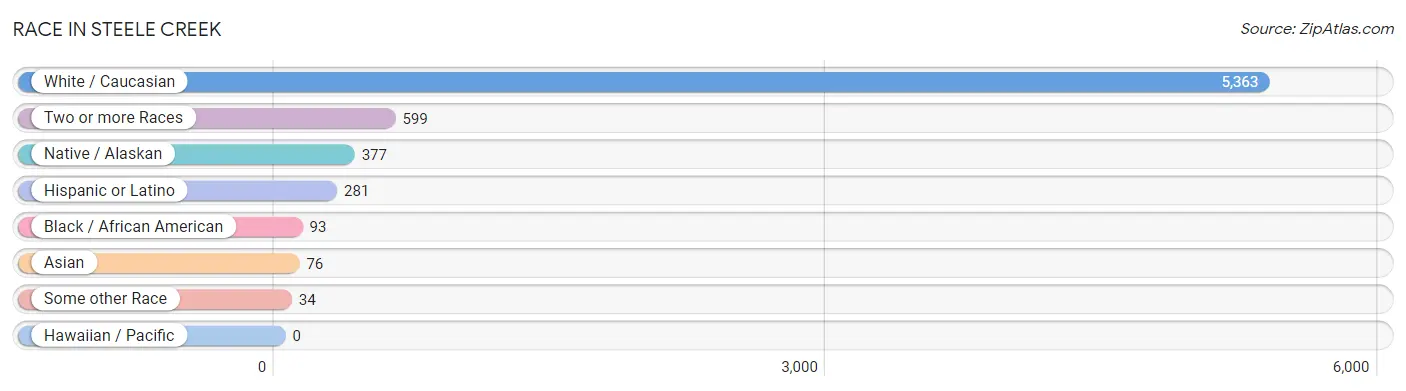
| Race | # Population | % Population |
| Asian | 76 | 1.2% |
| Black / African American | 93 | 1.4% |
| Hawaiian / Pacific | 0 | 0.0% |
| Hispanic or Latino | 281 | 4.3% |
| Native / Alaskan | 377 | 5.8% |
| White / Caucasian | 5,363 | 82.0% |
| Two or more Races | 599 | 9.2% |
| Some other Race | 34 | 0.5% |
| Total | 6,542 | 100.0% |
Ancestry in Steele Creek
The most populous ancestries reported in Steele Creek are German (1,312 | 20.1%), Irish (1,206 | 18.4%), English (1,149 | 17.6%), Alaskan Athabascan (671 | 10.3%), and Hungarian (326 | 5.0%), together accounting for 71.3% of all Steele Creek residents.
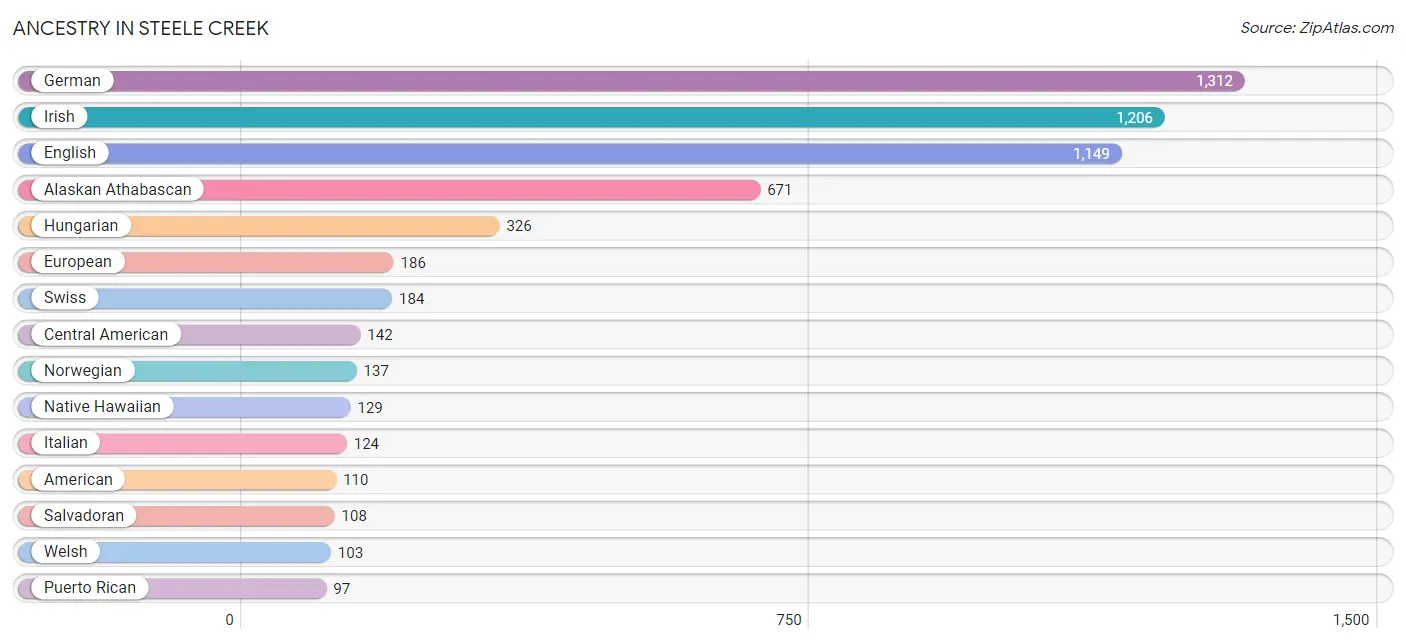
| Ancestry | # Population | % Population |
| African | 65 | 1.0% |
| Alaska Native | 73 | 1.1% |
| Alaskan Athabascan | 671 | 10.3% |
| Aleut | 61 | 0.9% |
| American | 110 | 1.7% |
| Armenian | 22 | 0.3% |
| Bangladeshi | 76 | 1.2% |
| Belgian | 22 | 0.3% |
| Central American | 142 | 2.2% |
| Costa Rican | 34 | 0.5% |
| Croatian | 19 | 0.3% |
| Czech | 16 | 0.2% |
| Danish | 85 | 1.3% |
| Dutch | 16 | 0.2% |
| Eastern European | 58 | 0.9% |
| English | 1,149 | 17.6% |
| European | 186 | 2.8% |
| French | 16 | 0.2% |
| French American Indian | 60 | 0.9% |
| French Canadian | 26 | 0.4% |
| German | 1,312 | 20.1% |
| Hungarian | 326 | 5.0% |
| Inupiat | 1 | 0.0% |
| Irish | 1,206 | 18.4% |
| Italian | 124 | 1.9% |
| Korean | 76 | 1.2% |
| Mexican | 24 | 0.4% |
| Native Hawaiian | 129 | 2.0% |
| Northern European | 1 | 0.0% |
| Norwegian | 137 | 2.1% |
| Polish | 74 | 1.1% |
| Puerto Rican | 97 | 1.5% |
| Salvadoran | 108 | 1.7% |
| Scotch-Irish | 2 | 0.0% |
| Scottish | 94 | 1.4% |
| Slovak | 38 | 0.6% |
| Spanish | 18 | 0.3% |
| Subsaharan African | 65 | 1.0% |
| Swedish | 79 | 1.2% |
| Swiss | 184 | 2.8% |
| Welsh | 103 | 1.6% | View All 41 Rows |
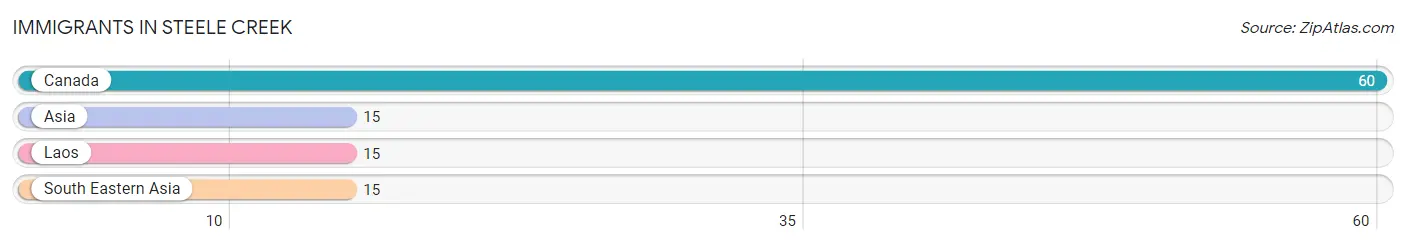
Immigrants in Steele Creek
The most numerous immigrant groups reported in Steele Creek came from Canada (60 | 0.9%), Asia (15 | 0.2%), Laos (15 | 0.2%), and South Eastern Asia (15 | 0.2%), together accounting for 1.6% of all Steele Creek residents.
| Immigration Origin | # Population | % Population |
| Asia | 15 | 0.2% |
| Canada | 60 | 0.9% |
| Laos | 15 | 0.2% |
| South Eastern Asia | 15 | 0.2% | View All 4 Rows |
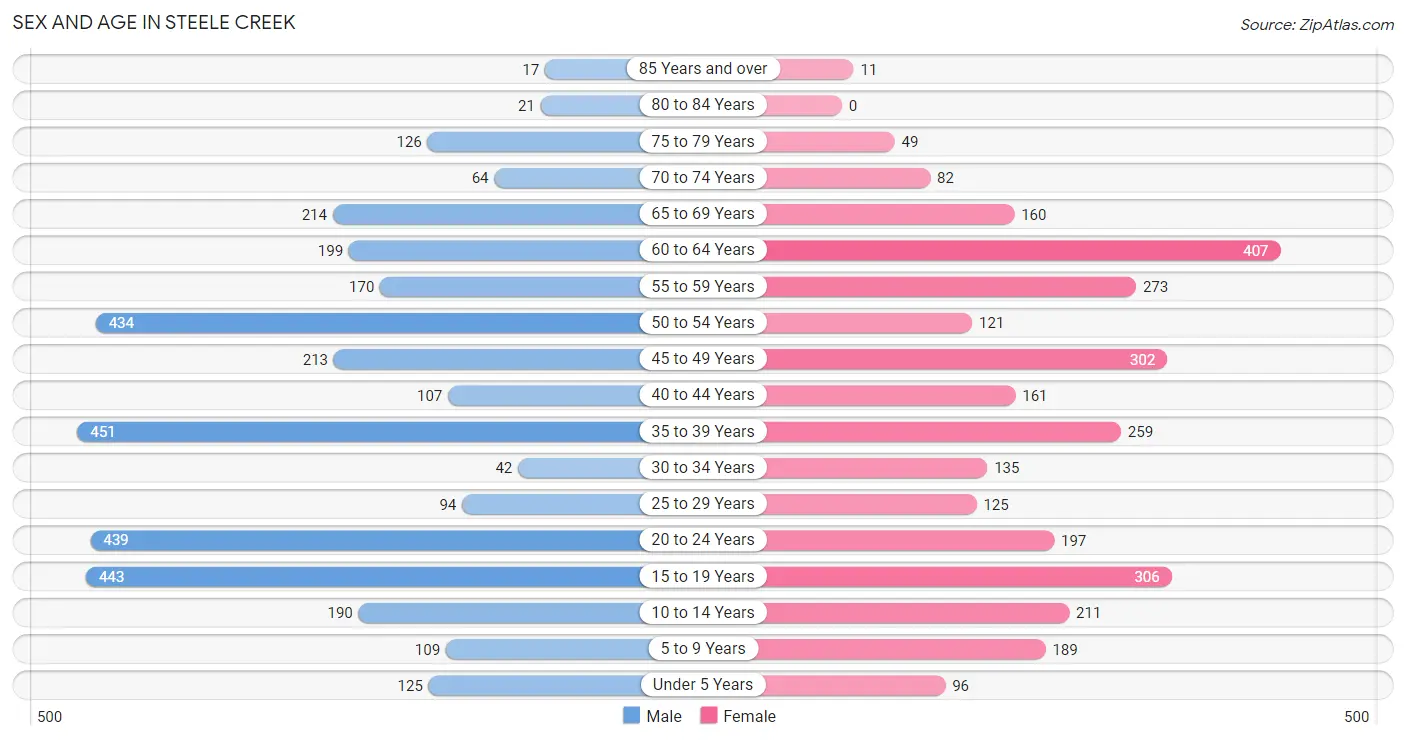
Sex and Age in Steele Creek
Sex and Age in Steele Creek
The most populous age groups in Steele Creek are 35 to 39 Years (451 | 13.0%) for men and 60 to 64 Years (407 | 13.2%) for women.
| Age Bracket | Male | Female |
| Under 5 Years | 125 (3.6%) | 96 (3.1%) |
| 5 to 9 Years | 109 (3.2%) | 189 (6.1%) |
| 10 to 14 Years | 190 (5.5%) | 211 (6.8%) |
| 15 to 19 Years | 443 (12.8%) | 306 (9.9%) |
| 20 to 24 Years | 439 (12.7%) | 197 (6.4%) |
| 25 to 29 Years | 94 (2.7%) | 125 (4.1%) |
| 30 to 34 Years | 42 (1.2%) | 135 (4.4%) |
| 35 to 39 Years | 451 (13.0%) | 259 (8.4%) |
| 40 to 44 Years | 107 (3.1%) | 161 (5.2%) |
| 45 to 49 Years | 213 (6.2%) | 302 (9.8%) |
| 50 to 54 Years | 434 (12.6%) | 121 (3.9%) |
| 55 to 59 Years | 170 (4.9%) | 273 (8.8%) |
| 60 to 64 Years | 199 (5.8%) | 407 (13.2%) |
| 65 to 69 Years | 214 (6.2%) | 160 (5.2%) |
| 70 to 74 Years | 64 (1.8%) | 82 (2.7%) |
| 75 to 79 Years | 126 (3.6%) | 49 (1.6%) |
| 80 to 84 Years | 21 (0.6%) | 0 (0.0%) |
| 85 Years and over | 17 (0.5%) | 11 (0.4%) |
| Total | 3,458 (100.0%) | 3,084 (100.0%) |
Families and Households in Steele Creek
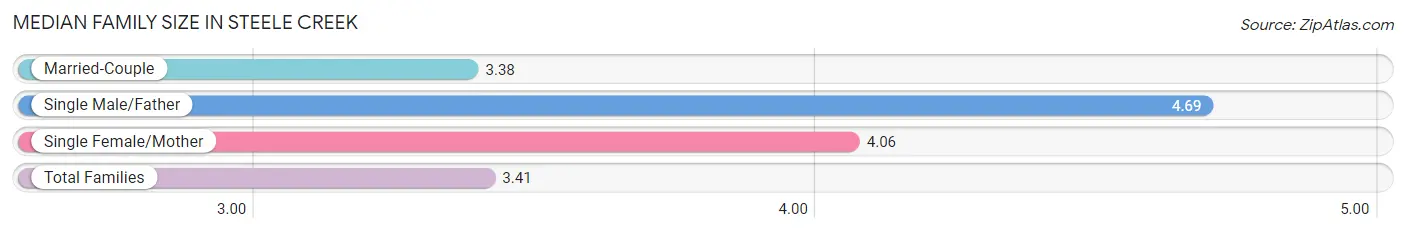
Median Family Size in Steele Creek
The median family size in Steele Creek is 3.41 persons per family, with single male/father families (16 | 1.1%) accounting for the largest median family size of 4.69 persons per family. On the other hand, married-couple families (1,476 | 96.8%) represent the smallest median family size with 3.38 persons per family.
| Family Type | # Families | Family Size |
| Married-Couple | 1,476 (96.8%) | 3.38 |
| Single Male/Father | 16 (1.1%) | 4.69 |
| Single Female/Mother | 33 (2.2%) | 4.06 |
| Total Families | 1,525 (100.0%) | 3.41 |
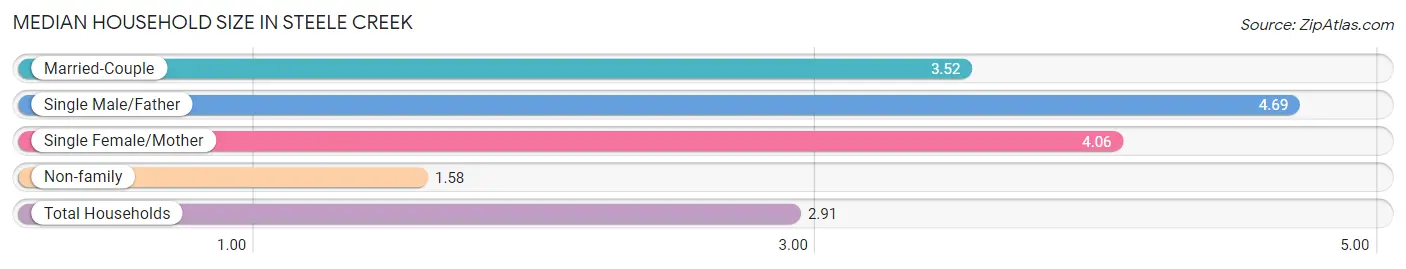
Median Household Size in Steele Creek
The median household size in Steele Creek is 2.91 persons per household, with single male/father households (16 | 0.7%) accounting for the largest median household size of 4.69 persons per household. non-family households (719 | 32.0%) represent the smallest median household size with 1.58 persons per household.
| Household Type | # Households | Household Size |
| Married-Couple | 1,476 (65.8%) | 3.52 |
| Single Male/Father | 16 (0.7%) | 4.69 |
| Single Female/Mother | 33 (1.5%) | 4.06 |
| Non-family | 719 (32.0%) | 1.58 |
| Total Households | 2,244 (100.0%) | 2.91 |
Household Size by Marriage Status in Steele Creek
Out of a total of 2,244 households in Steele Creek, 1,525 (68.0%) are family households, while 719 (32.0%) are nonfamily households. The most numerous type of family households are 3-person households, comprising 520, and the most common type of nonfamily households are 1-person households, comprising 484.
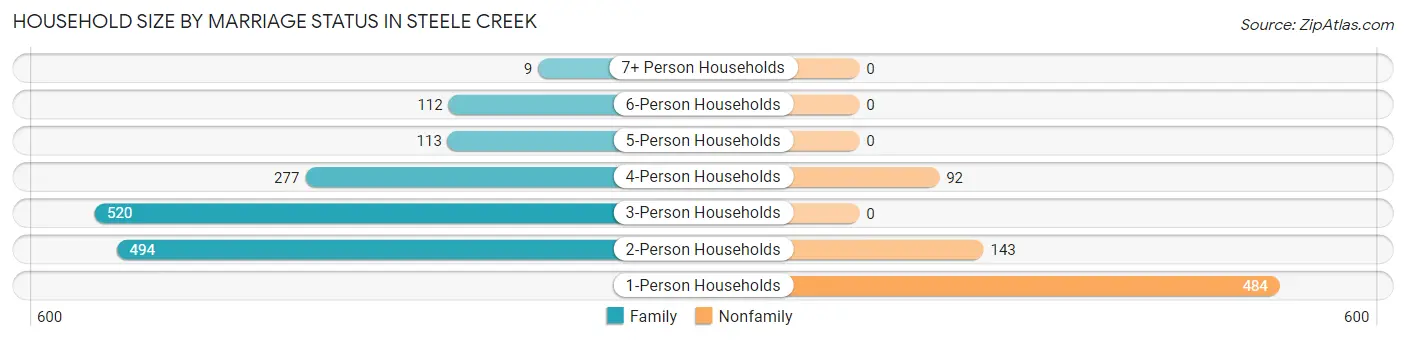
| Household Size | Family Households | Nonfamily Households |
| 1-Person Households | - | 484 (21.6%) |
| 2-Person Households | 494 (22.0%) | 143 (6.4%) |
| 3-Person Households | 520 (23.2%) | 0 (0.0%) |
| 4-Person Households | 277 (12.3%) | 92 (4.1%) |
| 5-Person Households | 113 (5.0%) | 0 (0.0%) |
| 6-Person Households | 112 (5.0%) | 0 (0.0%) |
| 7+ Person Households | 9 (0.4%) | 0 (0.0%) |
| Total | 1,525 (68.0%) | 719 (32.0%) |
Female Fertility in Steele Creek
Fertility by Age in Steele Creek
| Age Bracket | Women with Births | Births / 1,000 Women |
| 15 to 19 years | 0 (0.0%) | 0.0 |
| 20 to 34 years | 0 (0.0%) | 0.0 |
| 35 to 50 years | 0 (0.0%) | 0.0 |
| Total | 0 (0.0%) | 0.0 |
Fertility by Age by Marriage Status in Steele Creek
| Age Bracket | Married | Unmarried |
| 15 to 19 years | 0 (0.0%) | 0 (0.0%) |
| 20 to 34 years | 0 (0.0%) | 0 (0.0%) |
| 35 to 50 years | 0 (0.0%) | 0 (0.0%) |
| Total | 0 (0.0%) | 0 (0.0%) |
Fertility by Education in Steele Creek
| Educational Attainment | Women with Births | Births / 1,000 Women |
| Less than High School | 0 (0.0%) | 0.0 |
| High School Diploma | 0 (0.0%) | 0.0 |
| College or Associate's Degree | 0 (0.0%) | 0.0 |
| Bachelor's Degree | 0 (0.0%) | 0.0 |
| Graduate Degree | 0 (0.0%) | 0.0 |
| Total | 0 (0.0%) | 0.0 |
Fertility by Education by Marriage Status in Steele Creek
| Educational Attainment | Married | Unmarried |
| Less than High School | 0 (0.0%) | 0 (0.0%) |
| High School Diploma | 0 (0.0%) | 0 (0.0%) |
| College or Associate's Degree | 0 (0.0%) | 0 (0.0%) |
| Bachelor's Degree | 0 (0.0%) | 0 (0.0%) |
| Graduate Degree | 0 (0.0%) | 0 (0.0%) |
| Total | 0 (0.0%) | 0 (0.0%) |
Employment Characteristics in Steele Creek
Employment by Class of Employer in Steele Creek
Among the 3,512 employed individuals in Steele Creek, private company employees (1,621 | 46.2%), state government employees (468 | 13.3%), and self-employed (incorporated) (404 | 11.5%) make up the most common classes of employment.
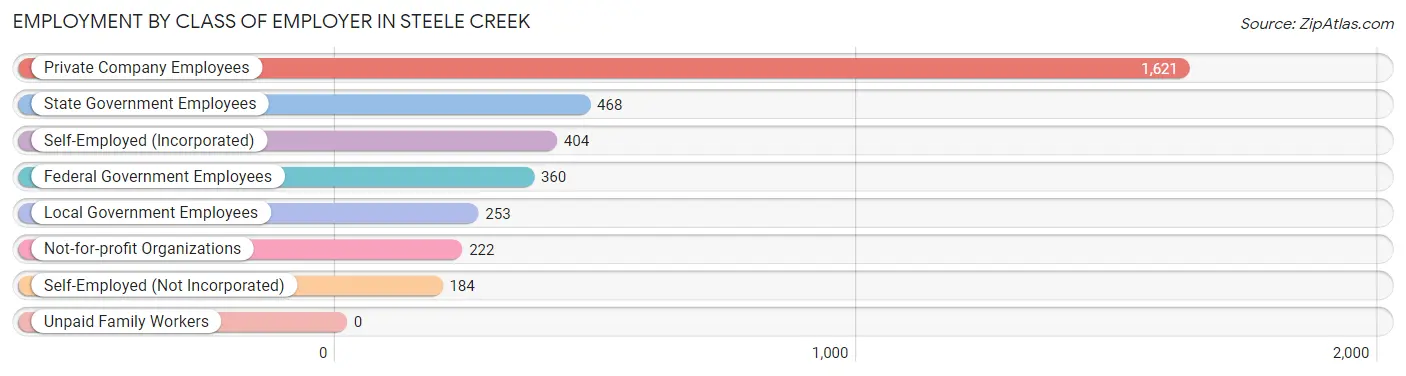
| Employer Class | # Employees | % Employees |
| Private Company Employees | 1,621 | 46.2% |
| Self-Employed (Incorporated) | 404 | 11.5% |
| Self-Employed (Not Incorporated) | 184 | 5.2% |
| Not-for-profit Organizations | 222 | 6.3% |
| Local Government Employees | 253 | 7.2% |
| State Government Employees | 468 | 13.3% |
| Federal Government Employees | 360 | 10.2% |
| Unpaid Family Workers | 0 | 0.0% |
| Total | 3,512 | 100.0% |
Employment Status by Age in Steele Creek
According to the labor force statistics for Steele Creek, out of the total population over 16 years of age (5,537), 69.6% or 3,854 individuals are in the labor force, with 2.8% or 108 of them unemployed. The age group with the highest labor force participation rate is 30 to 34 years, with 100.0% or 177 individuals in the labor force. Within the labor force, the 16 to 19 years age range has the highest percentage of unemployed individuals, with 13.3% or 46 of them being unemployed.
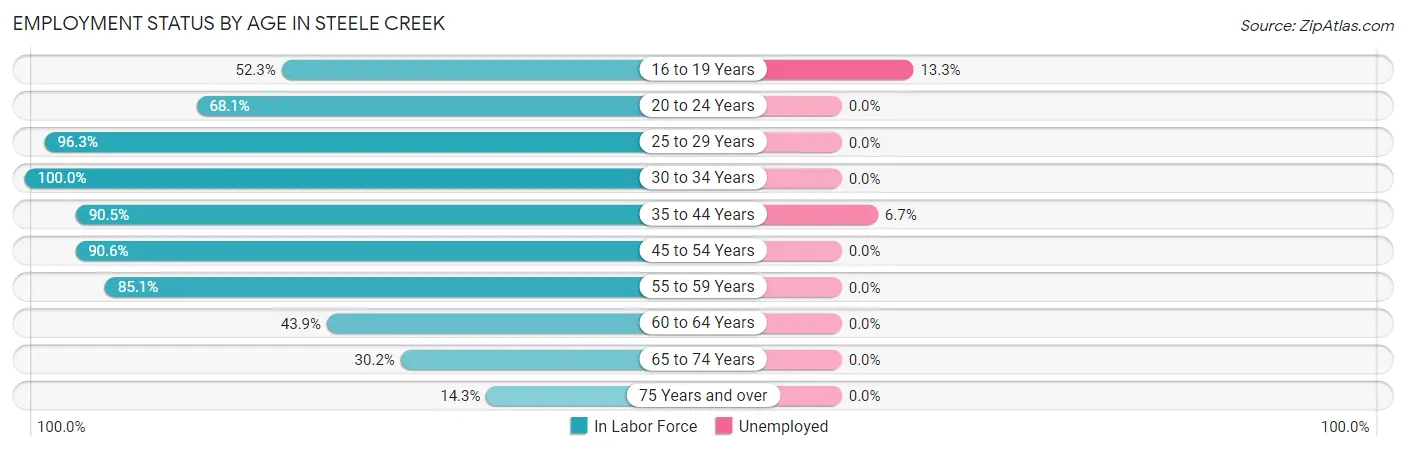
| Age Bracket | In Labor Force | Unemployed |
| 16 to 19 Years | 347 (52.3%) | 46 (13.3%) |
| 20 to 24 Years | 433 (68.1%) | 0 (0.0%) |
| 25 to 29 Years | 211 (96.3%) | 0 (0.0%) |
| 30 to 34 Years | 177 (100.0%) | 0 (0.0%) |
| 35 to 44 Years | 885 (90.5%) | 59 (6.7%) |
| 45 to 54 Years | 969 (90.6%) | 0 (0.0%) |
| 55 to 59 Years | 377 (85.1%) | 0 (0.0%) |
| 60 to 64 Years | 266 (43.9%) | 0 (0.0%) |
| 65 to 74 Years | 157 (30.2%) | 0 (0.0%) |
| 75 Years and over | 32 (14.3%) | 0 (0.0%) |
| Total | 3,854 (69.6%) | 108 (2.8%) |
Employment Status by Educational Attainment in Steele Creek
According to labor force statistics for Steele Creek, 82.6% of individuals (2,885) out of the total population between 25 and 64 years of age (3,493) are in the labor force, with 2.0% or 58 of them being unemployed. The group with the highest labor force participation rate are those with the educational attainment of college / associate degree, with 88.0% or 1,170 individuals in the labor force. Within the labor force, individuals with high school diploma education have the highest percentage of unemployment, with 14.0% or 55 of them being unemployed.
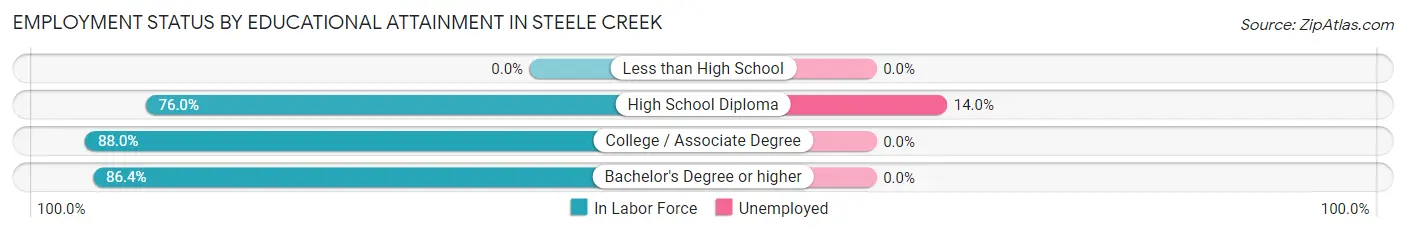
| Educational Attainment | In Labor Force | Unemployed |
| Less than High School | 0 (0.0%) | 0 (0.0%) |
| High School Diploma | 393 (76.0%) | 72 (14.0%) |
| College / Associate Degree | 1,170 (88.0%) | 0 (0.0%) |
| Bachelor's Degree or higher | 1,324 (86.4%) | 0 (0.0%) |
| Total | 2,885 (82.6%) | 70 (2.0%) |
Employment Occupations by Sex in Steele Creek
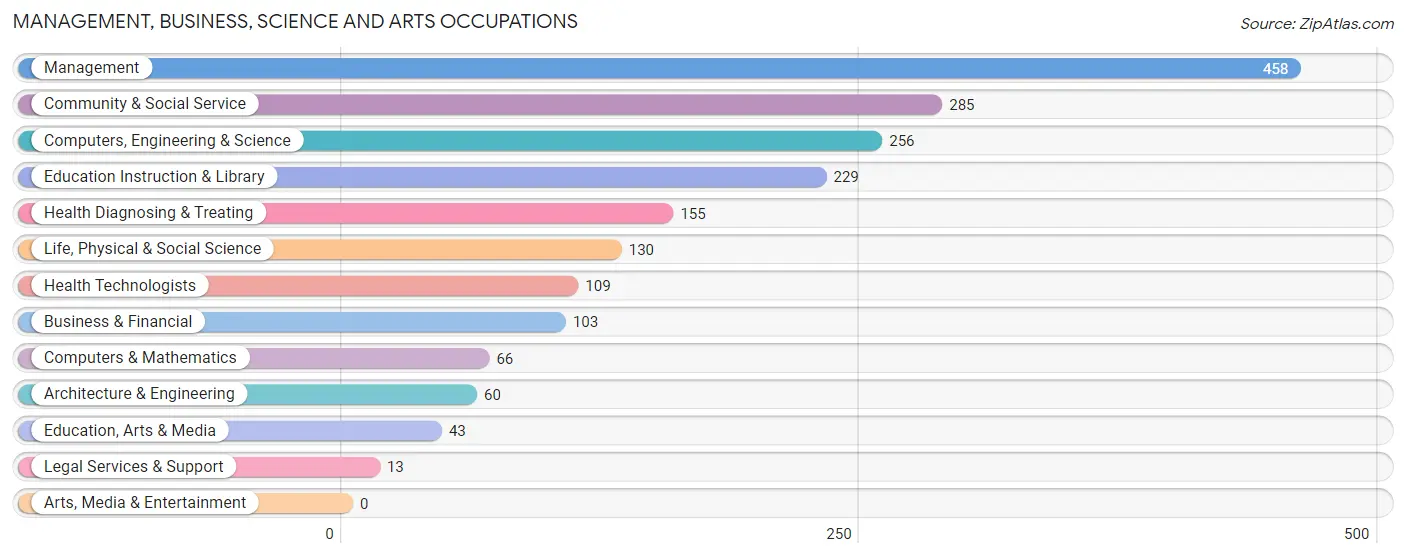
Management, Business, Science and Arts Occupations
The most common Management, Business, Science and Arts occupations in Steele Creek are Management (458 | 12.9%), Community & Social Service (285 | 8.1%), Computers, Engineering & Science (256 | 7.2%), Education Instruction & Library (229 | 6.5%), and Health Diagnosing & Treating (155 | 4.4%).
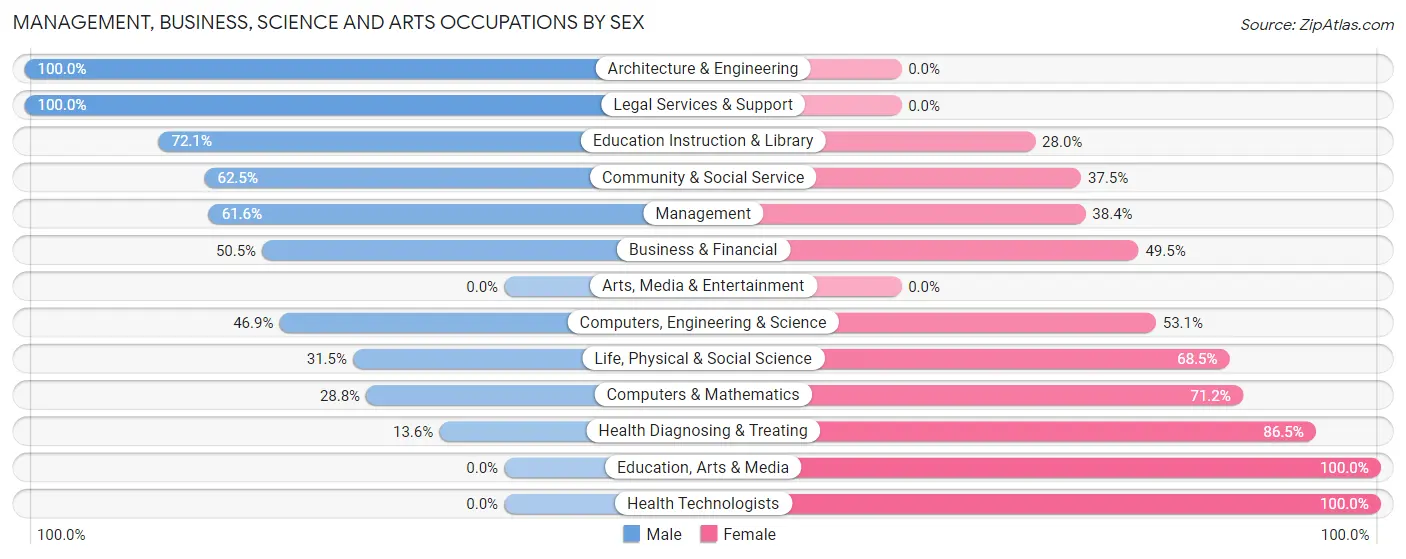
Management, Business, Science and Arts Occupations by Sex
Within the Management, Business, Science and Arts occupations in Steele Creek, the most male-oriented occupations are Architecture & Engineering (100.0%), Legal Services & Support (100.0%), and Education Instruction & Library (72.1%), while the most female-oriented occupations are Education, Arts & Media (100.0%), Health Technologists (100.0%), and Health Diagnosing & Treating (86.5%).
| Occupation | Male | Female |
| Management | 282 (61.6%) | 176 (38.4%) |
| Business & Financial | 52 (50.5%) | 51 (49.5%) |
| Computers, Engineering & Science | 120 (46.9%) | 136 (53.1%) |
| Computers & Mathematics | 19 (28.8%) | 47 (71.2%) |
| Architecture & Engineering | 60 (100.0%) | 0 (0.0%) |
| Life, Physical & Social Science | 41 (31.5%) | 89 (68.5%) |
| Community & Social Service | 178 (62.5%) | 107 (37.5%) |
| Education, Arts & Media | 0 (0.0%) | 43 (100.0%) |
| Legal Services & Support | 13 (100.0%) | 0 (0.0%) |
| Education Instruction & Library | 165 (72.1%) | 64 (28.0%) |
| Arts, Media & Entertainment | 0 (0.0%) | 0 (0.0%) |
| Health Diagnosing & Treating | 21 (13.6%) | 134 (86.5%) |
| Health Technologists | 0 (0.0%) | 109 (100.0%) |
| Total (Category) | 653 (51.9%) | 604 (48.0%) |
| Total (Overall) | 1,717 (48.5%) | 1,823 (51.5%) |
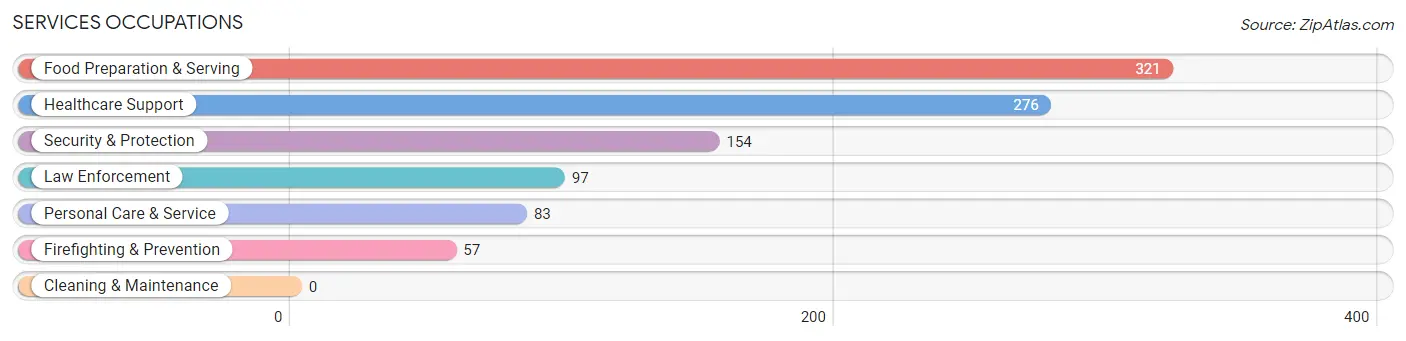
Services Occupations
The most common Services occupations in Steele Creek are Food Preparation & Serving (321 | 9.1%), Healthcare Support (276 | 7.8%), Security & Protection (154 | 4.3%), Law Enforcement (97 | 2.7%), and Personal Care & Service (83 | 2.3%).
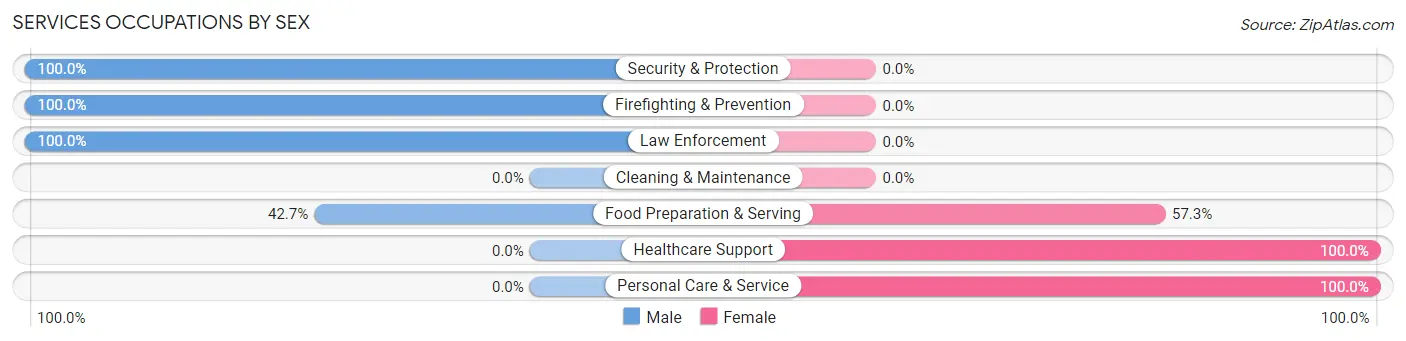
Services Occupations by Sex
Within the Services occupations in Steele Creek, the most male-oriented occupations are Security & Protection (100.0%), Firefighting & Prevention (100.0%), and Law Enforcement (100.0%), while the most female-oriented occupations are Healthcare Support (100.0%), Personal Care & Service (100.0%), and Food Preparation & Serving (57.3%).
| Occupation | Male | Female |
| Healthcare Support | 0 (0.0%) | 276 (100.0%) |
| Security & Protection | 154 (100.0%) | 0 (0.0%) |
| Firefighting & Prevention | 57 (100.0%) | 0 (0.0%) |
| Law Enforcement | 97 (100.0%) | 0 (0.0%) |
| Food Preparation & Serving | 137 (42.7%) | 184 (57.3%) |
| Cleaning & Maintenance | 0 (0.0%) | 0 (0.0%) |
| Personal Care & Service | 0 (0.0%) | 83 (100.0%) |
| Total (Category) | 291 (34.9%) | 543 (65.1%) |
| Total (Overall) | 1,717 (48.5%) | 1,823 (51.5%) |
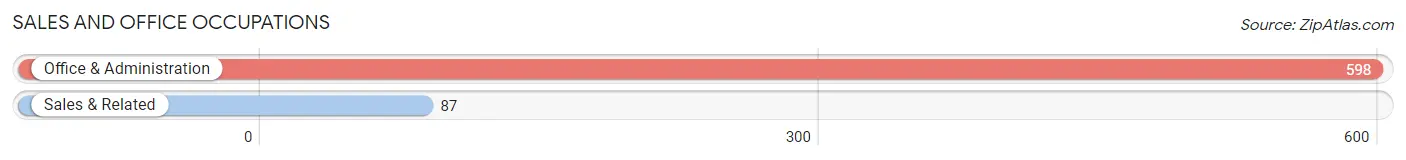
Sales and Office Occupations
The most common Sales and Office occupations in Steele Creek are Office & Administration (598 | 16.9%), and Sales & Related (87 | 2.5%).
Sales and Office Occupations by Sex
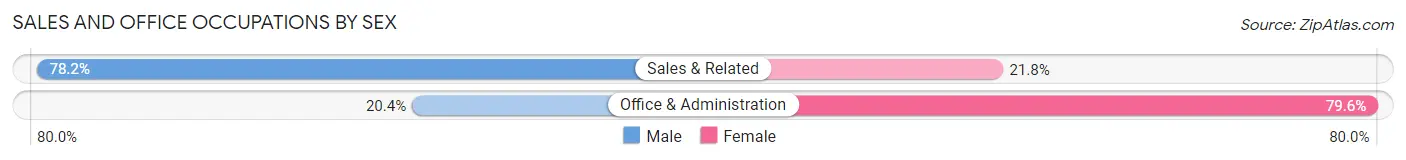
| Occupation | Male | Female |
| Sales & Related | 68 (78.2%) | 19 (21.8%) |
| Office & Administration | 122 (20.4%) | 476 (79.6%) |
| Total (Category) | 190 (27.7%) | 495 (72.3%) |
| Total (Overall) | 1,717 (48.5%) | 1,823 (51.5%) |
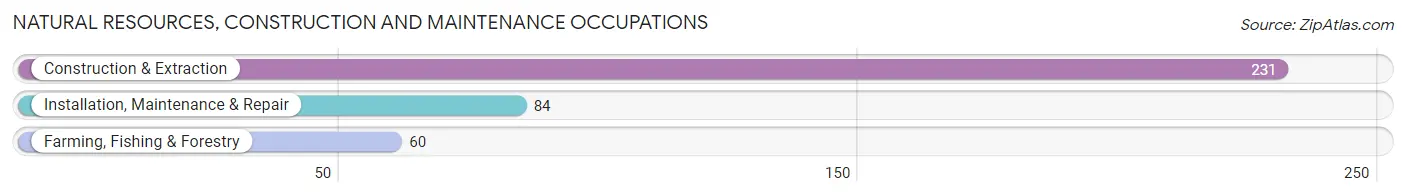
Natural Resources, Construction and Maintenance Occupations
The most common Natural Resources, Construction and Maintenance occupations in Steele Creek are Construction & Extraction (231 | 6.5%), Installation, Maintenance & Repair (84 | 2.4%), and Farming, Fishing & Forestry (60 | 1.7%).
Natural Resources, Construction and Maintenance Occupations by Sex
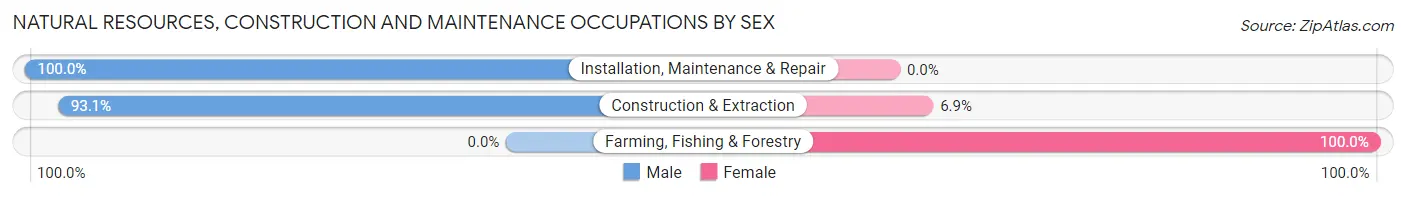
| Occupation | Male | Female |
| Farming, Fishing & Forestry | 0 (0.0%) | 60 (100.0%) |
| Construction & Extraction | 215 (93.1%) | 16 (6.9%) |
| Installation, Maintenance & Repair | 84 (100.0%) | 0 (0.0%) |
| Total (Category) | 299 (79.7%) | 76 (20.3%) |
| Total (Overall) | 1,717 (48.5%) | 1,823 (51.5%) |
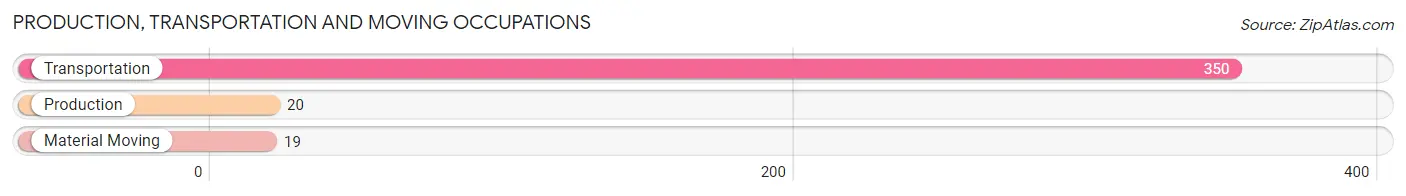
Production, Transportation and Moving Occupations
The most common Production, Transportation and Moving occupations in Steele Creek are Transportation (350 | 9.9%), Production (20 | 0.6%), and Material Moving (19 | 0.5%).
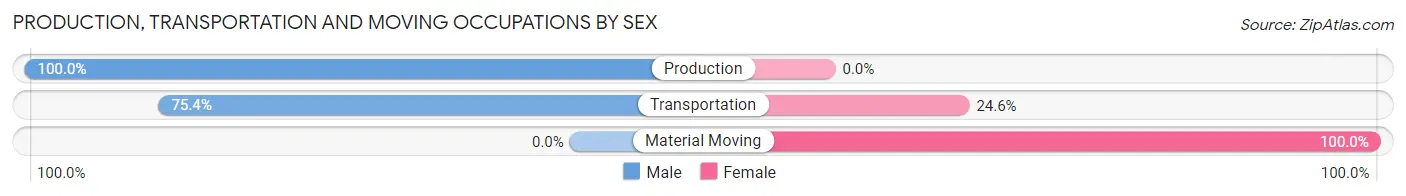
Production, Transportation and Moving Occupations by Sex
| Occupation | Male | Female |
| Production | 20 (100.0%) | 0 (0.0%) |
| Transportation | 264 (75.4%) | 86 (24.6%) |
| Material Moving | 0 (0.0%) | 19 (100.0%) |
| Total (Category) | 284 (73.0%) | 105 (27.0%) |
| Total (Overall) | 1,717 (48.5%) | 1,823 (51.5%) |
Employment Industries by Sex in Steele Creek
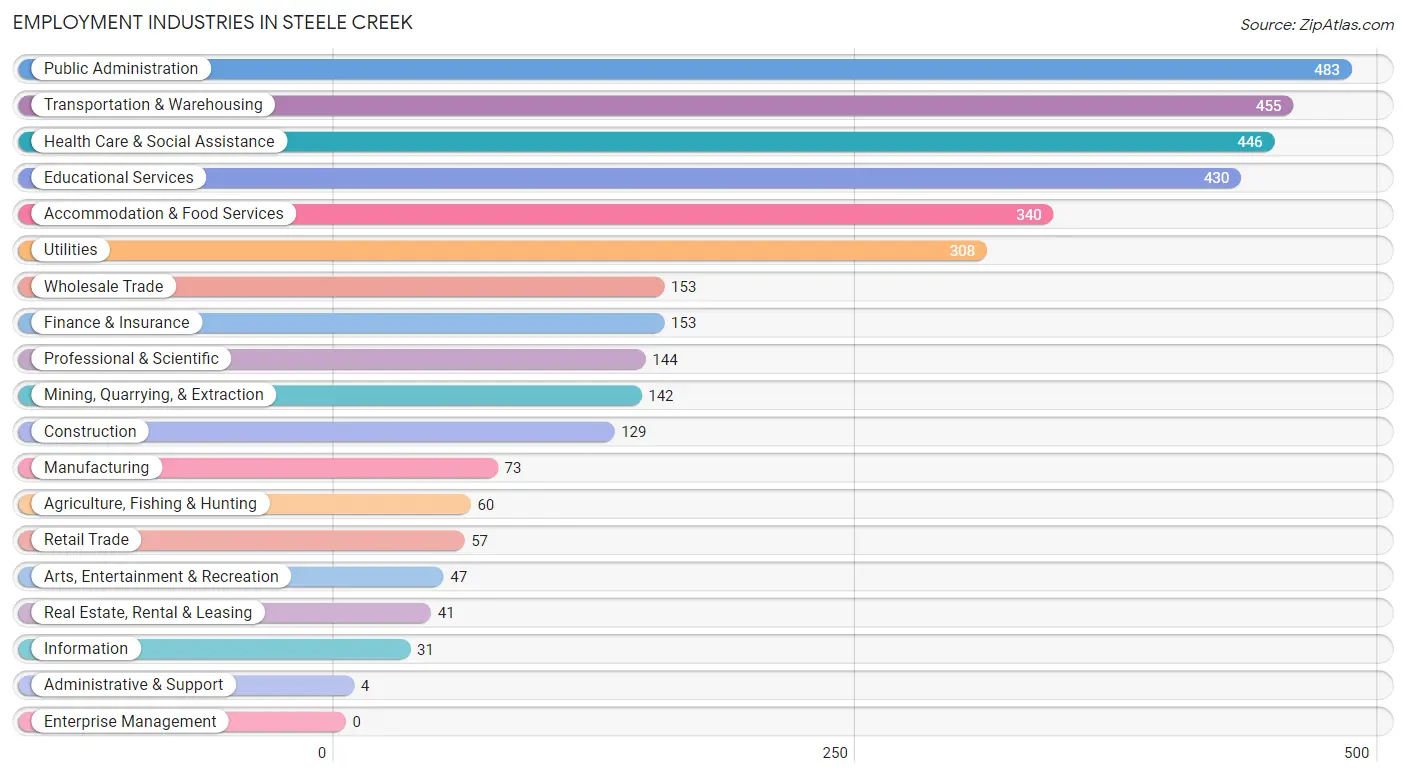
Employment Industries in Steele Creek
The major employment industries in Steele Creek include Public Administration (483 | 13.6%), Transportation & Warehousing (455 | 12.9%), Health Care & Social Assistance (446 | 12.6%), Educational Services (430 | 12.1%), and Accommodation & Food Services (340 | 9.6%).
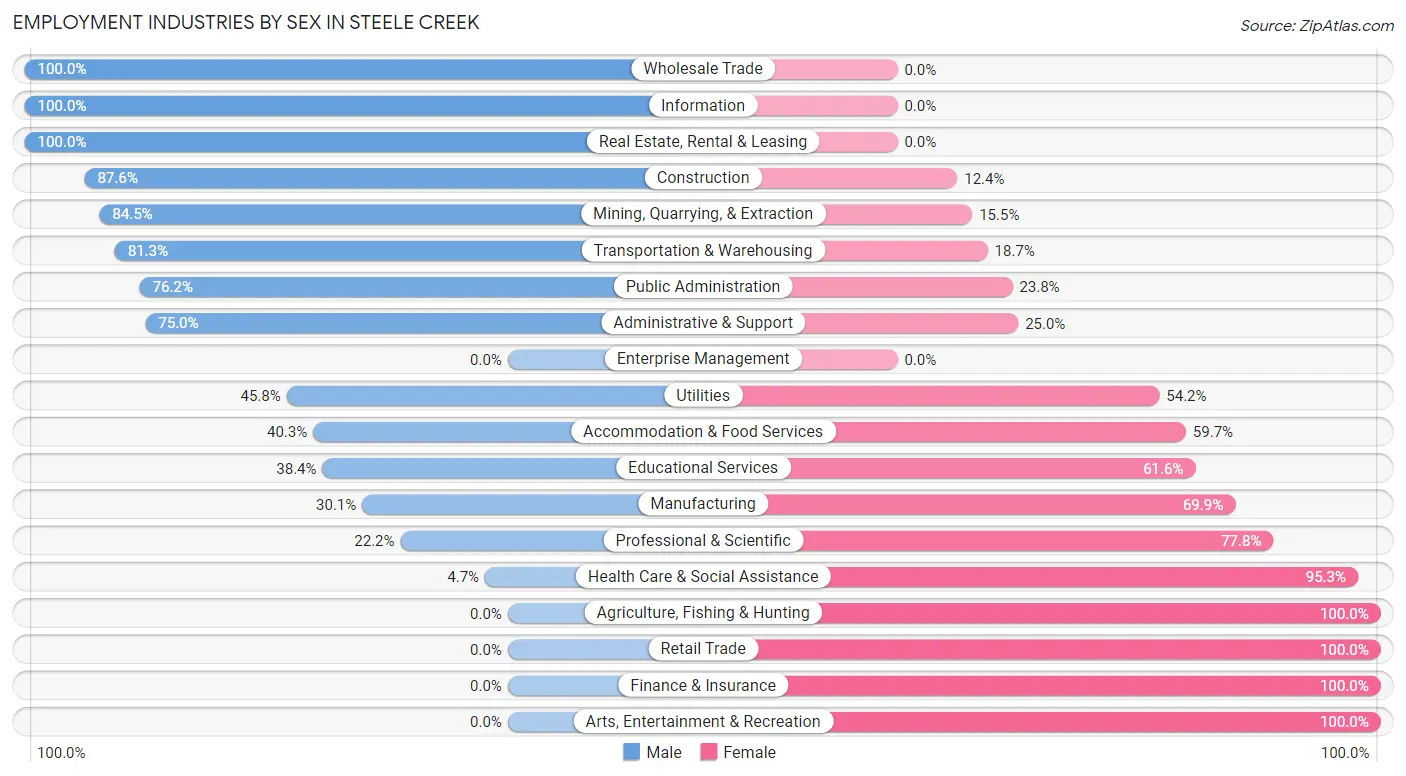
Employment Industries by Sex in Steele Creek
The Steele Creek industries that see more men than women are Wholesale Trade (100.0%), Information (100.0%), and Real Estate, Rental & Leasing (100.0%), whereas the industries that tend to have a higher number of women are Agriculture, Fishing & Hunting (100.0%), Retail Trade (100.0%), and Finance & Insurance (100.0%).
| Industry | Male | Female |
| Agriculture, Fishing & Hunting | 0 (0.0%) | 60 (100.0%) |
| Mining, Quarrying, & Extraction | 120 (84.5%) | 22 (15.5%) |
| Construction | 113 (87.6%) | 16 (12.4%) |
| Manufacturing | 22 (30.1%) | 51 (69.9%) |
| Wholesale Trade | 153 (100.0%) | 0 (0.0%) |
| Retail Trade | 0 (0.0%) | 57 (100.0%) |
| Transportation & Warehousing | 370 (81.3%) | 85 (18.7%) |
| Utilities | 141 (45.8%) | 167 (54.2%) |
| Information | 31 (100.0%) | 0 (0.0%) |
| Finance & Insurance | 0 (0.0%) | 153 (100.0%) |
| Real Estate, Rental & Leasing | 41 (100.0%) | 0 (0.0%) |
| Professional & Scientific | 32 (22.2%) | 112 (77.8%) |
| Enterprise Management | 0 (0.0%) | 0 (0.0%) |
| Administrative & Support | 3 (75.0%) | 1 (25.0%) |
| Educational Services | 165 (38.4%) | 265 (61.6%) |
| Health Care & Social Assistance | 21 (4.7%) | 425 (95.3%) |
| Arts, Entertainment & Recreation | 0 (0.0%) | 47 (100.0%) |
| Accommodation & Food Services | 137 (40.3%) | 203 (59.7%) |
| Public Administration | 368 (76.2%) | 115 (23.8%) |
| Total | 1,717 (48.5%) | 1,823 (51.5%) |
Education in Steele Creek
School Enrollment in Steele Creek
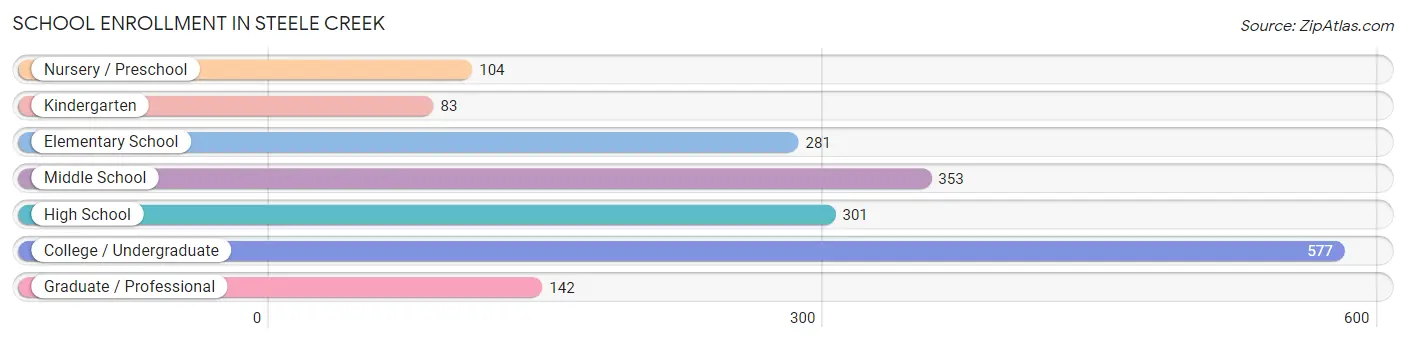
The most common levels of schooling among the 1,841 students in Steele Creek are college / undergraduate (577 | 31.3%), middle school (353 | 19.2%), and high school (301 | 16.4%).
| School Level | # Students | % Students |
| Nursery / Preschool | 104 | 5.7% |
| Kindergarten | 83 | 4.5% |
| Elementary School | 281 | 15.3% |
| Middle School | 353 | 19.2% |
| High School | 301 | 16.4% |
| College / Undergraduate | 577 | 31.3% |
| Graduate / Professional | 142 | 7.7% |
| Total | 1,841 | 100.0% |
School Enrollment by Age by Funding Source in Steele Creek
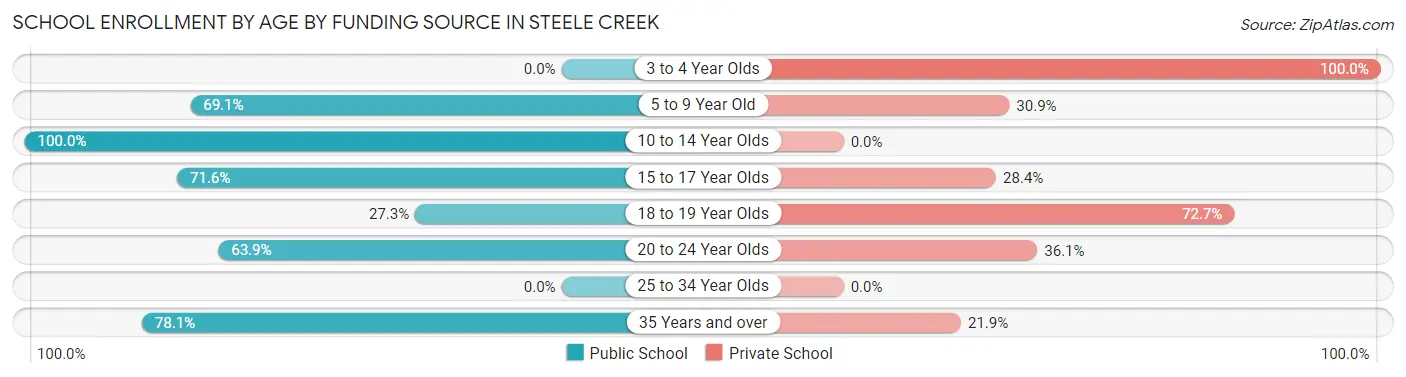
Out of a total of 1,841 students who are enrolled in schools in Steele Creek, 550 (29.9%) attend a private institution, while the remaining 1,291 (70.1%) are enrolled in public schools. The age group of 3 to 4 year olds has the highest likelihood of being enrolled in private schools, with 46 (100.0% in the age bracket) enrolled. Conversely, the age group of 10 to 14 year olds has the lowest likelihood of being enrolled in a private school, with 401 (100.0% in the age bracket) attending a public institution.
| Age Bracket | Public School | Private School |
| 3 to 4 Year Olds | 0 (0.0%) | 46 (100.0%) |
| 5 to 9 Year Old | 206 (69.1%) | 92 (30.9%) |
| 10 to 14 Year Olds | 401 (100.0%) | 0 (0.0%) |
| 15 to 17 Year Olds | 237 (71.6%) | 94 (28.4%) |
| 18 to 19 Year Olds | 54 (27.3%) | 144 (72.7%) |
| 20 to 24 Year Olds | 225 (63.9%) | 127 (36.1%) |
| 25 to 34 Year Olds | 0 (0.0%) | 0 (0.0%) |
| 35 Years and over | 168 (78.1%) | 47 (21.9%) |
| Total | 1,291 (70.1%) | 550 (29.9%) |
Educational Attainment by Field of Study in Steele Creek
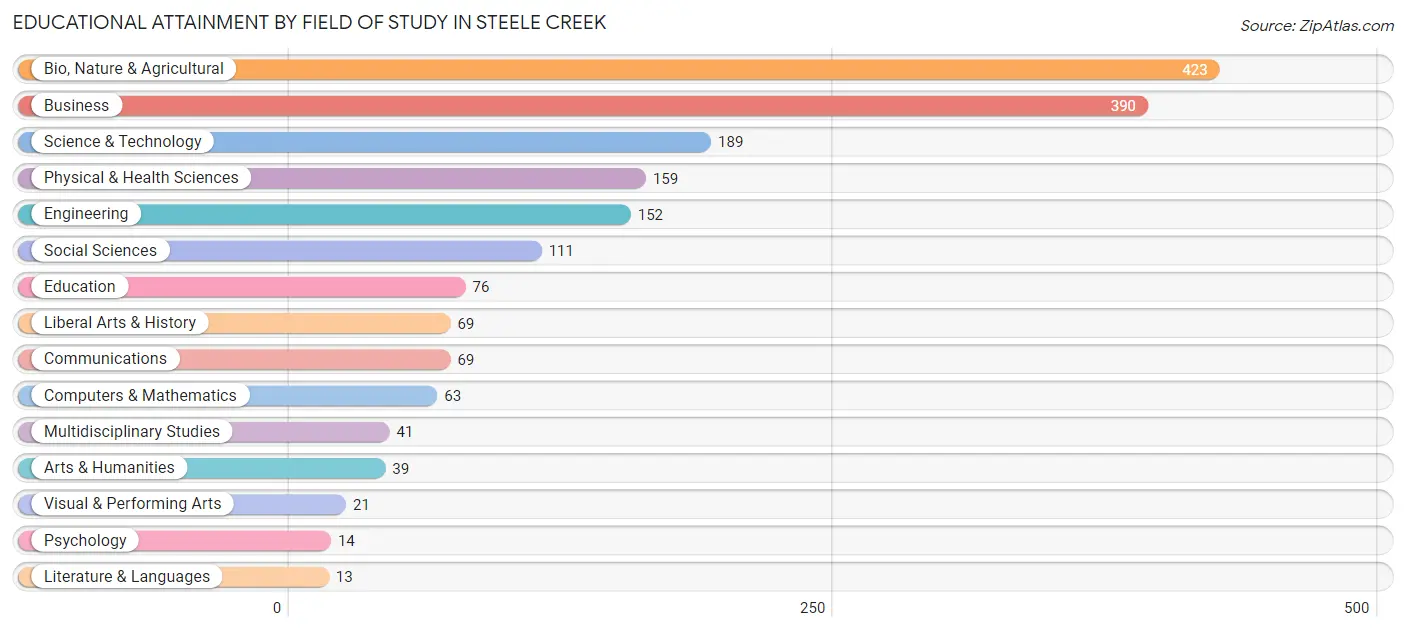
Bio, nature & agricultural (423 | 23.1%), business (390 | 21.3%), science & technology (189 | 10.3%), physical & health sciences (159 | 8.7%), and engineering (152 | 8.3%) are the most common fields of study among 1,829 individuals in Steele Creek who have obtained a bachelor's degree or higher.
| Field of Study | # Graduates | % Graduates |
| Computers & Mathematics | 63 | 3.4% |
| Bio, Nature & Agricultural | 423 | 23.1% |
| Physical & Health Sciences | 159 | 8.7% |
| Psychology | 14 | 0.8% |
| Social Sciences | 111 | 6.1% |
| Engineering | 152 | 8.3% |
| Multidisciplinary Studies | 41 | 2.2% |
| Science & Technology | 189 | 10.3% |
| Business | 390 | 21.3% |
| Education | 76 | 4.2% |
| Literature & Languages | 13 | 0.7% |
| Liberal Arts & History | 69 | 3.8% |
| Visual & Performing Arts | 21 | 1.1% |
| Communications | 69 | 3.8% |
| Arts & Humanities | 39 | 2.1% |
| Total | 1,829 | 100.0% |
Transportation & Commute in Steele Creek
Vehicle Availability by Sex in Steele Creek
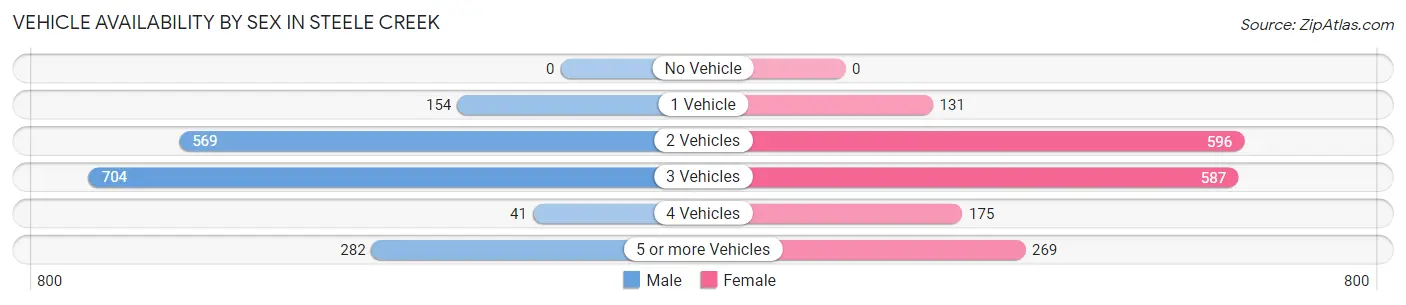
The most prevalent vehicle ownership categories in Steele Creek are males with 3 vehicles (704, accounting for 40.2%) and females with 3 vehicles (587, making up 40.1%).
| Vehicles Available | Male | Female |
| No Vehicle | 0 (0.0%) | 0 (0.0%) |
| 1 Vehicle | 154 (8.8%) | 131 (7.4%) |
| 2 Vehicles | 569 (32.5%) | 596 (33.9%) |
| 3 Vehicles | 704 (40.2%) | 587 (33.4%) |
| 4 Vehicles | 41 (2.3%) | 175 (10.0%) |
| 5 or more Vehicles | 282 (16.1%) | 269 (15.3%) |
| Total | 1,750 (100.0%) | 1,758 (100.0%) |
Commute Time in Steele Creek
The most frequently occuring commute durations in Steele Creek are 20 to 24 minutes (915 commuters, 30.2%), 15 to 19 minutes (793 commuters, 26.2%), and 25 to 29 minutes (343 commuters, 11.3%).
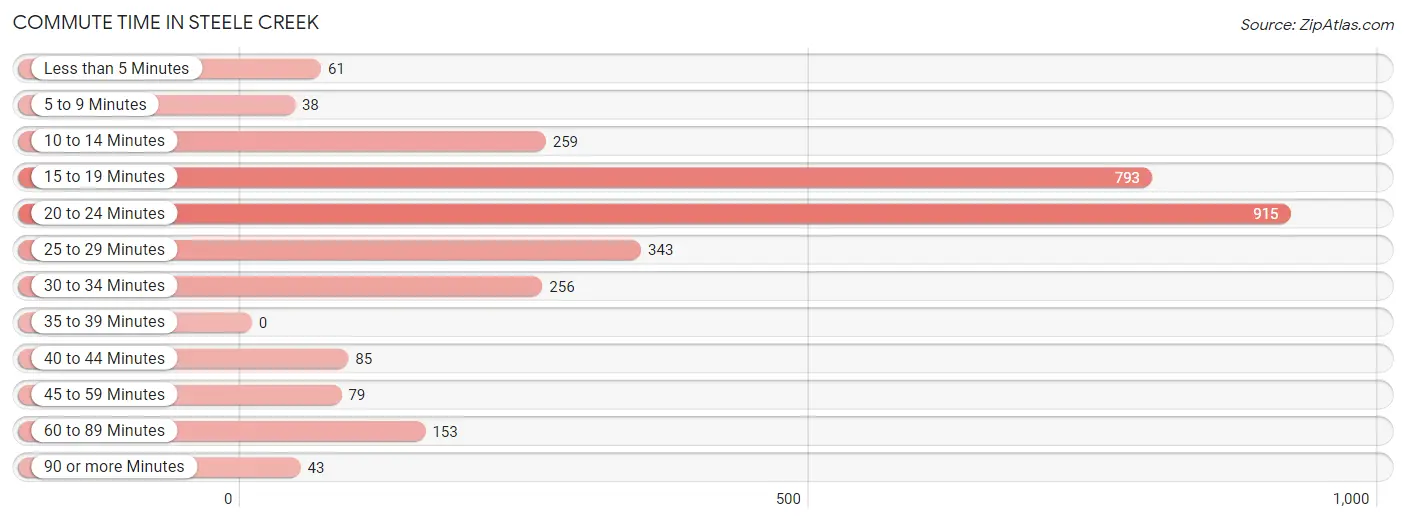
| Commute Time | # Commuters | % Commuters |
| Less than 5 Minutes | 61 | 2.0% |
| 5 to 9 Minutes | 38 | 1.3% |
| 10 to 14 Minutes | 259 | 8.6% |
| 15 to 19 Minutes | 793 | 26.2% |
| 20 to 24 Minutes | 915 | 30.2% |
| 25 to 29 Minutes | 343 | 11.3% |
| 30 to 34 Minutes | 256 | 8.5% |
| 35 to 39 Minutes | 0 | 0.0% |
| 40 to 44 Minutes | 85 | 2.8% |
| 45 to 59 Minutes | 79 | 2.6% |
| 60 to 89 Minutes | 153 | 5.1% |
| 90 or more Minutes | 43 | 1.4% |
Commute Time by Sex in Steele Creek
The most common commute times in Steele Creek are 20 to 24 minutes (505 commuters, 29.9%) for males and 15 to 19 minutes (430 commuters, 32.1%) for females.
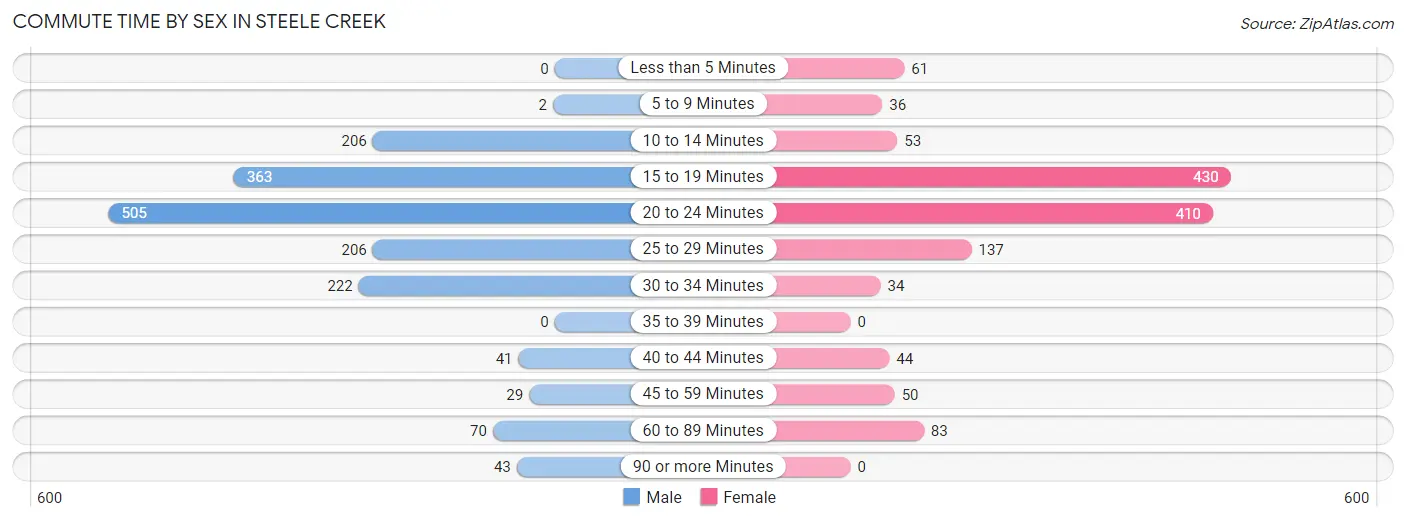
| Commute Time | Male | Female |
| Less than 5 Minutes | 0 (0.0%) | 61 (4.6%) |
| 5 to 9 Minutes | 2 (0.1%) | 36 (2.7%) |
| 10 to 14 Minutes | 206 (12.2%) | 53 (4.0%) |
| 15 to 19 Minutes | 363 (21.5%) | 430 (32.1%) |
| 20 to 24 Minutes | 505 (29.9%) | 410 (30.6%) |
| 25 to 29 Minutes | 206 (12.2%) | 137 (10.2%) |
| 30 to 34 Minutes | 222 (13.2%) | 34 (2.5%) |
| 35 to 39 Minutes | 0 (0.0%) | 0 (0.0%) |
| 40 to 44 Minutes | 41 (2.4%) | 44 (3.3%) |
| 45 to 59 Minutes | 29 (1.7%) | 50 (3.7%) |
| 60 to 89 Minutes | 70 (4.2%) | 83 (6.2%) |
| 90 or more Minutes | 43 (2.5%) | 0 (0.0%) |
Time of Departure to Work by Sex in Steele Creek
The most frequent times of departure to work in Steele Creek are 12:00 PM to 3:59 PM (324, 19.2%) for males and 5:30 AM to 5:59 AM (270, 20.2%) for females.
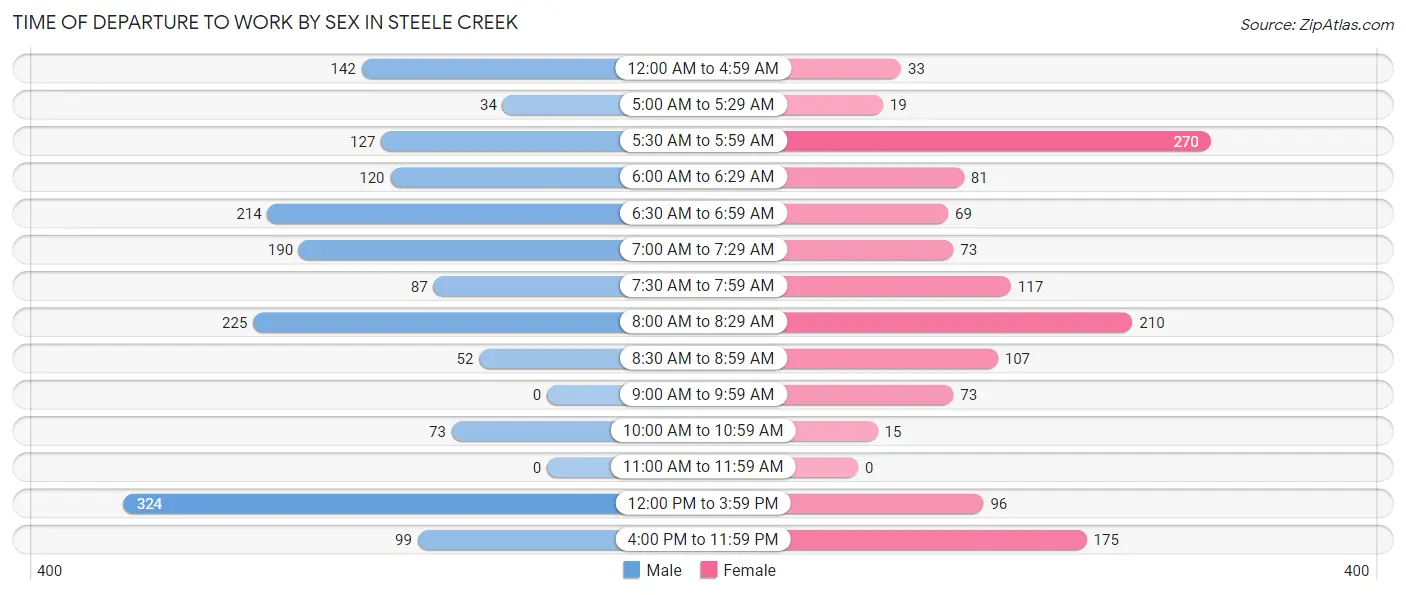
| Time of Departure | Male | Female |
| 12:00 AM to 4:59 AM | 142 (8.4%) | 33 (2.5%) |
| 5:00 AM to 5:29 AM | 34 (2.0%) | 19 (1.4%) |
| 5:30 AM to 5:59 AM | 127 (7.5%) | 270 (20.2%) |
| 6:00 AM to 6:29 AM | 120 (7.1%) | 81 (6.0%) |
| 6:30 AM to 6:59 AM | 214 (12.7%) | 69 (5.2%) |
| 7:00 AM to 7:29 AM | 190 (11.3%) | 73 (5.5%) |
| 7:30 AM to 7:59 AM | 87 (5.2%) | 117 (8.7%) |
| 8:00 AM to 8:29 AM | 225 (13.3%) | 210 (15.7%) |
| 8:30 AM to 8:59 AM | 52 (3.1%) | 107 (8.0%) |
| 9:00 AM to 9:59 AM | 0 (0.0%) | 73 (5.5%) |
| 10:00 AM to 10:59 AM | 73 (4.3%) | 15 (1.1%) |
| 11:00 AM to 11:59 AM | 0 (0.0%) | 0 (0.0%) |
| 12:00 PM to 3:59 PM | 324 (19.2%) | 96 (7.2%) |
| 4:00 PM to 11:59 PM | 99 (5.9%) | 175 (13.1%) |
| Total | 1,687 (100.0%) | 1,338 (100.0%) |
Housing Occupancy in Steele Creek
Occupancy by Ownership in Steele Creek
Of the total 2,244 dwellings in Steele Creek, owner-occupied units account for 1,924 (85.7%), while renter-occupied units make up 320 (14.3%).
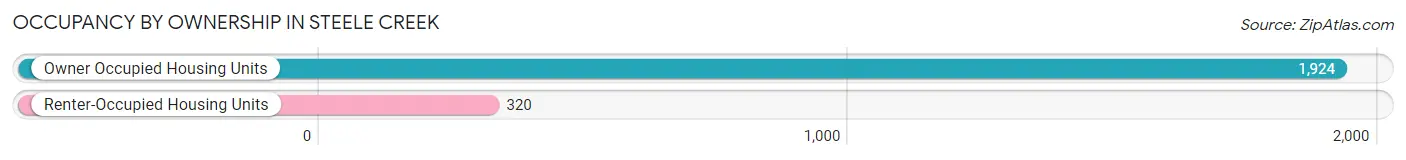
| Occupancy | # Housing Units | % Housing Units |
| Owner Occupied Housing Units | 1,924 | 85.7% |
| Renter-Occupied Housing Units | 320 | 14.3% |
| Total Occupied Housing Units | 2,244 | 100.0% |
Occupancy by Household Size in Steele Creek
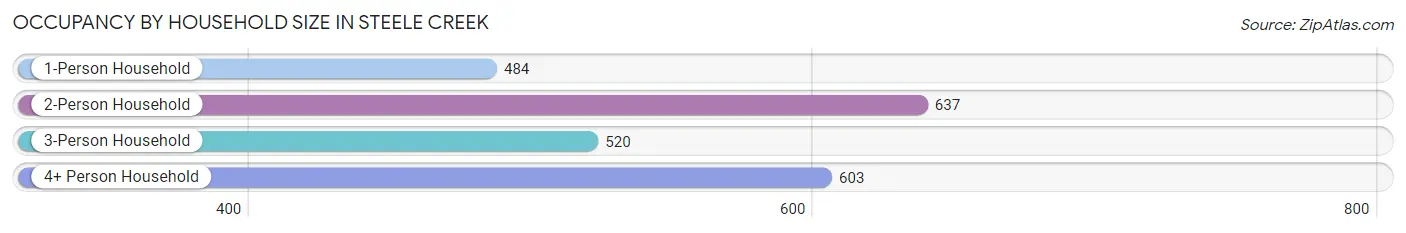
| Household Size | # Housing Units | % Housing Units |
| 1-Person Household | 484 | 21.6% |
| 2-Person Household | 637 | 28.4% |
| 3-Person Household | 520 | 23.2% |
| 4+ Person Household | 603 | 26.9% |
| Total Housing Units | 2,244 | 100.0% |
Occupancy by Ownership by Household Size in Steele Creek
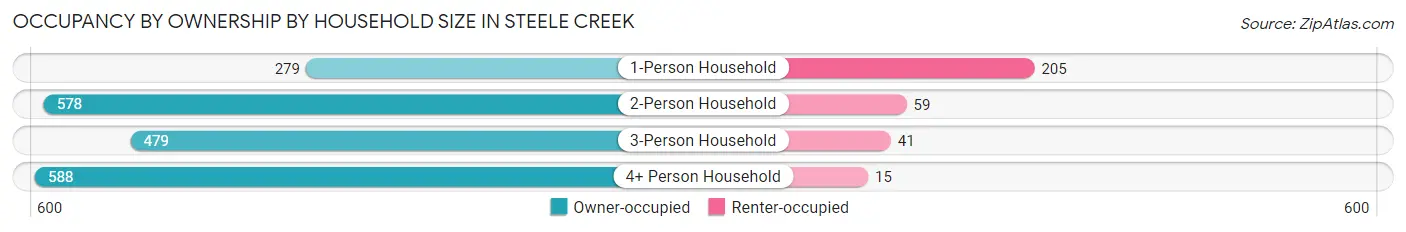
| Household Size | Owner-occupied | Renter-occupied |
| 1-Person Household | 279 (57.6%) | 205 (42.4%) |
| 2-Person Household | 578 (90.7%) | 59 (9.3%) |
| 3-Person Household | 479 (92.1%) | 41 (7.9%) |
| 4+ Person Household | 588 (97.5%) | 15 (2.5%) |
| Total Housing Units | 1,924 (85.7%) | 320 (14.3%) |
Occupancy by Educational Attainment in Steele Creek
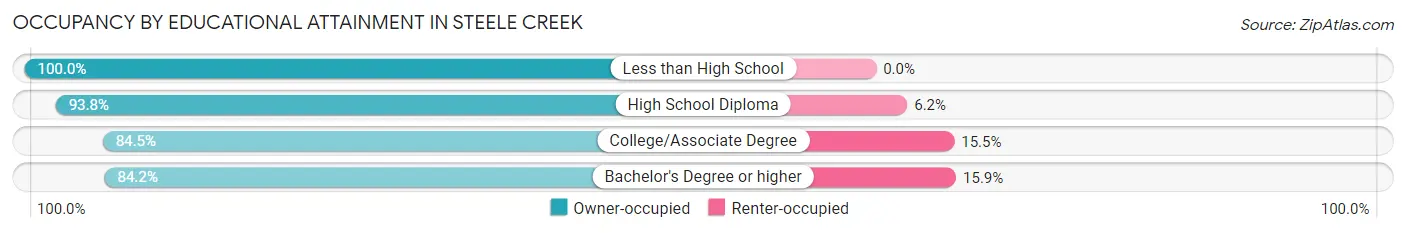
| Household Size | Owner-occupied | Renter-occupied |
| Less than High School | 58 (100.0%) | 0 (0.0%) |
| High School Diploma | 228 (93.8%) | 15 (6.2%) |
| College/Associate Degree | 693 (84.5%) | 127 (15.5%) |
| Bachelor's Degree or higher | 945 (84.2%) | 178 (15.9%) |
Occupancy by Age of Householder in Steele Creek
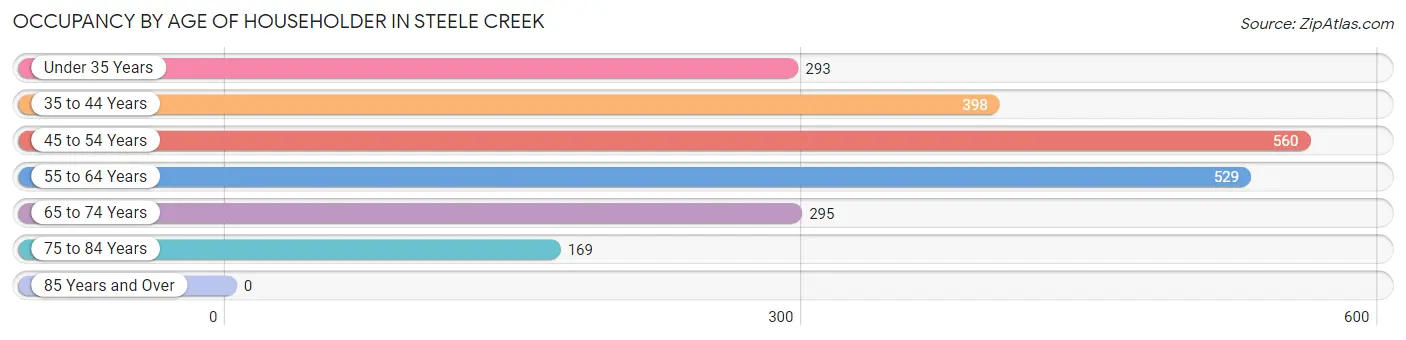
| Age Bracket | # Households | % Households |
| Under 35 Years | 293 | 13.1% |
| 35 to 44 Years | 398 | 17.7% |
| 45 to 54 Years | 560 | 25.0% |
| 55 to 64 Years | 529 | 23.6% |
| 65 to 74 Years | 295 | 13.2% |
| 75 to 84 Years | 169 | 7.5% |
| 85 Years and Over | 0 | 0.0% |
| Total | 2,244 | 100.0% |
Housing Finances in Steele Creek
Median Income by Occupancy in Steele Creek
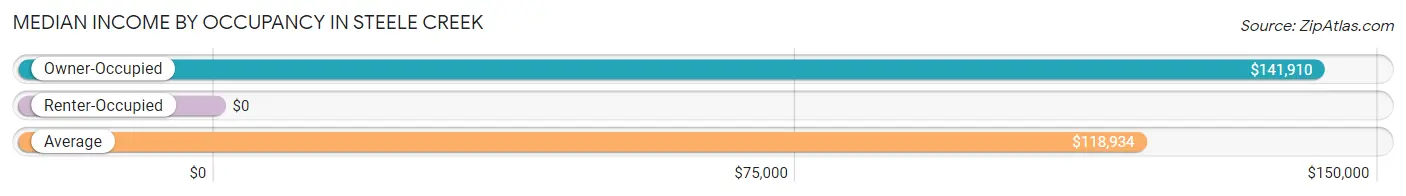
| Occupancy Type | # Households | Median Income |
| Owner-Occupied | 1,924 (85.7%) | $141,910 |
| Renter-Occupied | 320 (14.3%) | $0 |
| Average | 2,244 (100.0%) | $118,934 |
Occupancy by Householder Income Bracket in Steele Creek
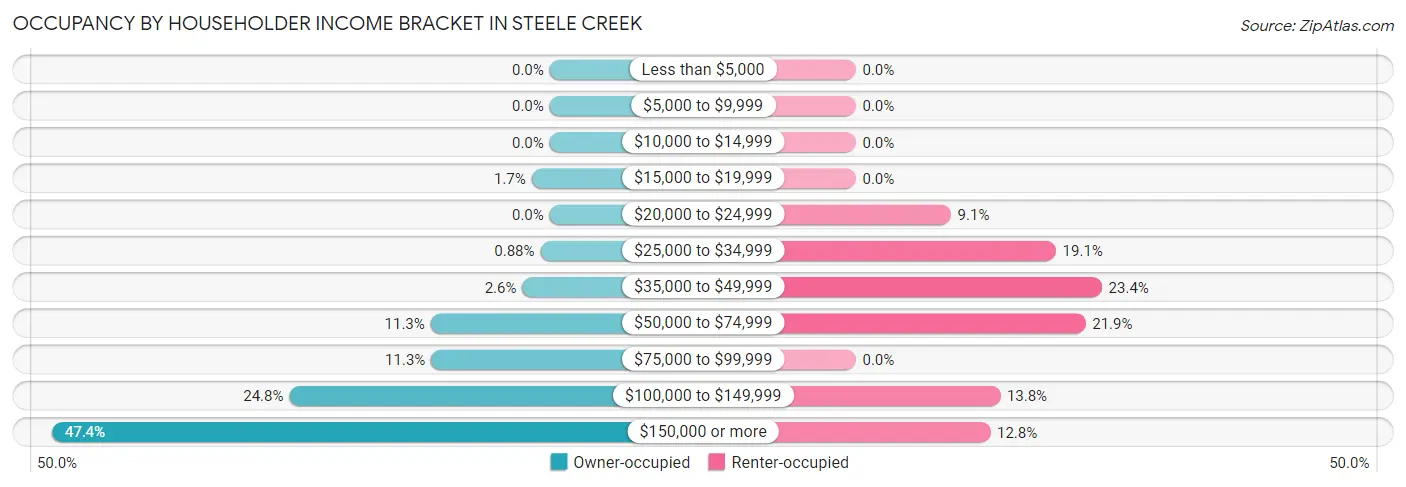
| Income Bracket | Owner-occupied | Renter-occupied |
| Less than $5,000 | 0 (0.0%) | 0 (0.0%) |
| $5,000 to $9,999 | 0 (0.0%) | 0 (0.0%) |
| $10,000 to $14,999 | 0 (0.0%) | 0 (0.0%) |
| $15,000 to $19,999 | 33 (1.7%) | 0 (0.0%) |
| $20,000 to $24,999 | 0 (0.0%) | 29 (9.1%) |
| $25,000 to $34,999 | 17 (0.9%) | 61 (19.1%) |
| $35,000 to $49,999 | 50 (2.6%) | 75 (23.4%) |
| $50,000 to $74,999 | 218 (11.3%) | 70 (21.9%) |
| $75,000 to $99,999 | 217 (11.3%) | 0 (0.0%) |
| $100,000 to $149,999 | 477 (24.8%) | 44 (13.8%) |
| $150,000 or more | 912 (47.4%) | 41 (12.8%) |
| Total | 1,924 (100.0%) | 320 (100.0%) |
Monthly Housing Cost Tiers in Steele Creek
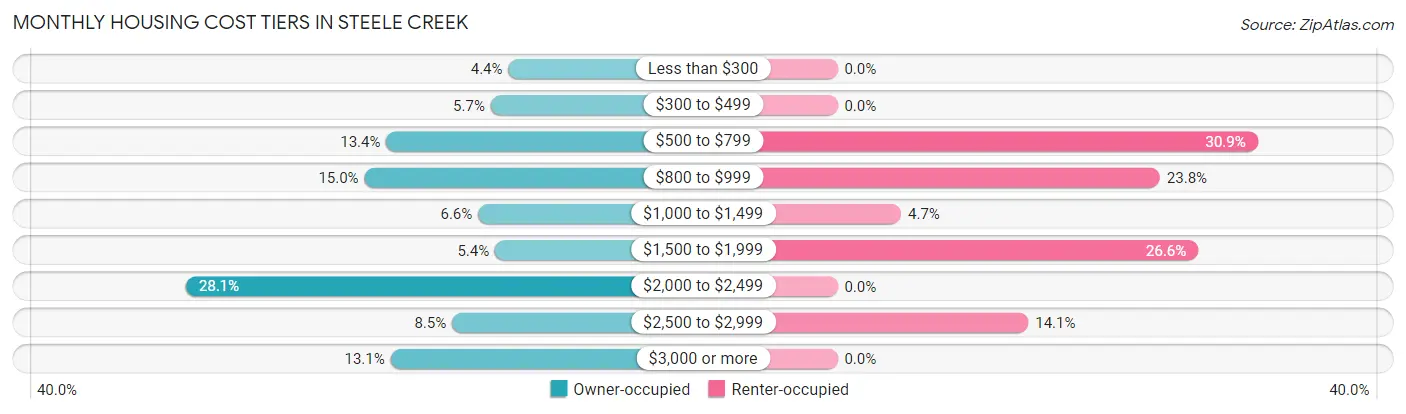
| Monthly Cost | Owner-occupied | Renter-occupied |
| Less than $300 | 84 (4.4%) | 0 (0.0%) |
| $300 to $499 | 109 (5.7%) | 0 (0.0%) |
| $500 to $799 | 257 (13.4%) | 99 (30.9%) |
| $800 to $999 | 288 (15.0%) | 76 (23.7%) |
| $1,000 to $1,499 | 127 (6.6%) | 15 (4.7%) |
| $1,500 to $1,999 | 103 (5.3%) | 85 (26.6%) |
| $2,000 to $2,499 | 541 (28.1%) | 0 (0.0%) |
| $2,500 to $2,999 | 164 (8.5%) | 45 (14.1%) |
| $3,000 or more | 251 (13.1%) | 0 (0.0%) |
| Total | 1,924 (100.0%) | 320 (100.0%) |
Physical Housing Characteristics in Steele Creek
Housing Structures in Steele Creek
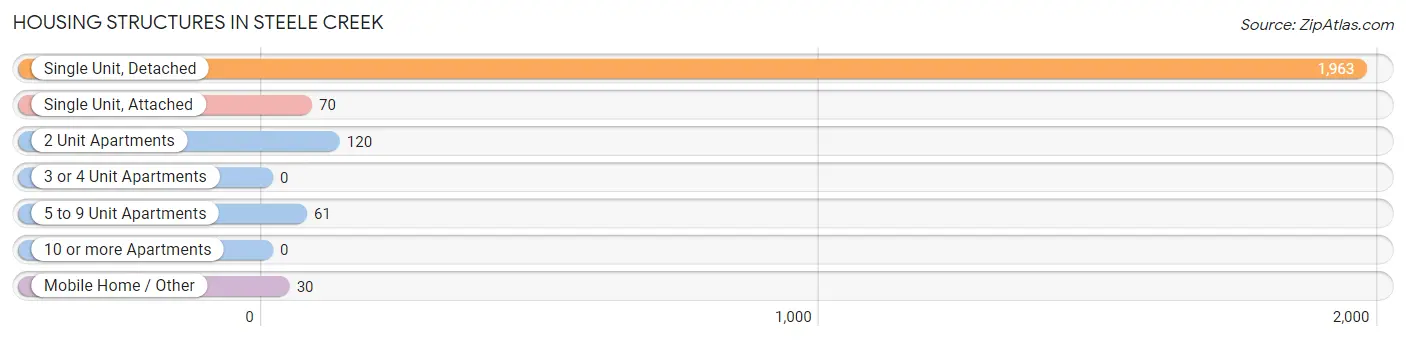
| Structure Type | # Housing Units | % Housing Units |
| Single Unit, Detached | 1,963 | 87.5% |
| Single Unit, Attached | 70 | 3.1% |
| 2 Unit Apartments | 120 | 5.3% |
| 3 or 4 Unit Apartments | 0 | 0.0% |
| 5 to 9 Unit Apartments | 61 | 2.7% |
| 10 or more Apartments | 0 | 0.0% |
| Mobile Home / Other | 30 | 1.3% |
| Total | 2,244 | 100.0% |
Housing Structures by Occupancy in Steele Creek
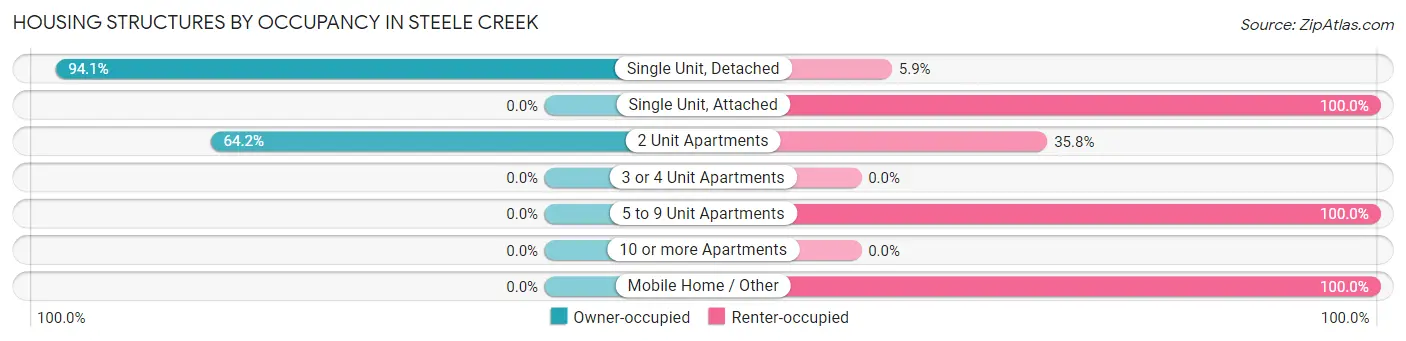
| Structure Type | Owner-occupied | Renter-occupied |
| Single Unit, Detached | 1,847 (94.1%) | 116 (5.9%) |
| Single Unit, Attached | 0 (0.0%) | 70 (100.0%) |
| 2 Unit Apartments | 77 (64.2%) | 43 (35.8%) |
| 3 or 4 Unit Apartments | 0 (0.0%) | 0 (0.0%) |
| 5 to 9 Unit Apartments | 0 (0.0%) | 61 (100.0%) |
| 10 or more Apartments | 0 (0.0%) | 0 (0.0%) |
| Mobile Home / Other | 0 (0.0%) | 30 (100.0%) |
| Total | 1,924 (85.7%) | 320 (14.3%) |
Housing Structures by Number of Rooms in Steele Creek
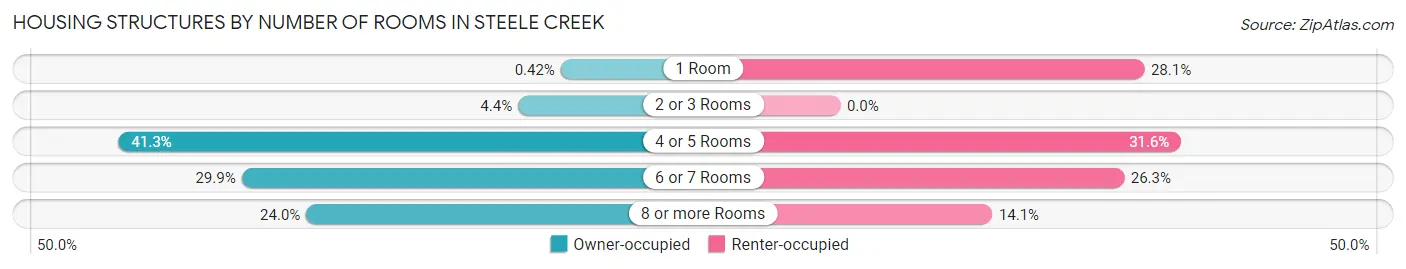
| Number of Rooms | Owner-occupied | Renter-occupied |
| 1 Room | 8 (0.4%) | 90 (28.1%) |
| 2 or 3 Rooms | 84 (4.4%) | 0 (0.0%) |
| 4 or 5 Rooms | 795 (41.3%) | 101 (31.6%) |
| 6 or 7 Rooms | 576 (29.9%) | 84 (26.3%) |
| 8 or more Rooms | 461 (24.0%) | 45 (14.1%) |
| Total | 1,924 (100.0%) | 320 (100.0%) |
Housing Structure by Heating Type in Steele Creek
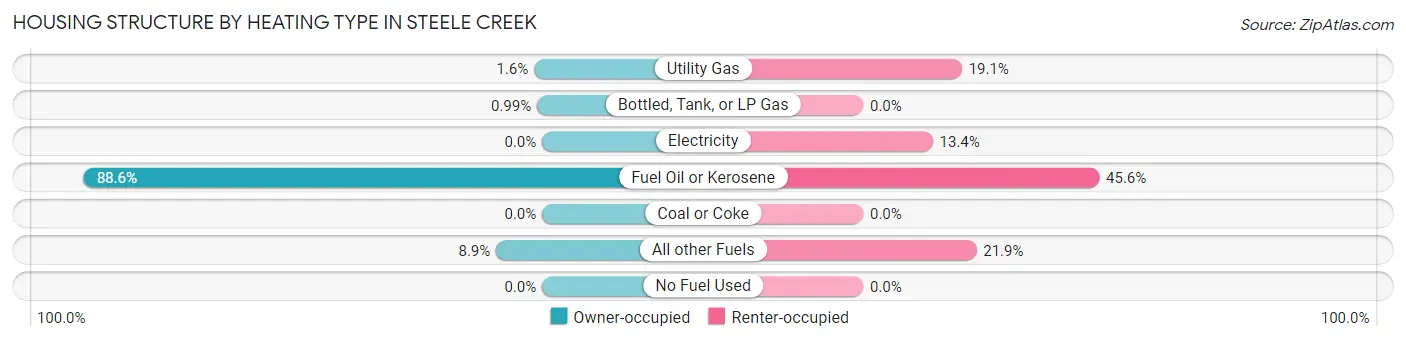
| Heating Type | Owner-occupied | Renter-occupied |
| Utility Gas | 30 (1.6%) | 61 (19.1%) |
| Bottled, Tank, or LP Gas | 19 (1.0%) | 0 (0.0%) |
| Electricity | 0 (0.0%) | 43 (13.4%) |
| Fuel Oil or Kerosene | 1,704 (88.6%) | 146 (45.6%) |
| Coal or Coke | 0 (0.0%) | 0 (0.0%) |
| All other Fuels | 171 (8.9%) | 70 (21.9%) |
| No Fuel Used | 0 (0.0%) | 0 (0.0%) |
| Total | 1,924 (100.0%) | 320 (100.0%) |
Household Vehicle Usage in Steele Creek
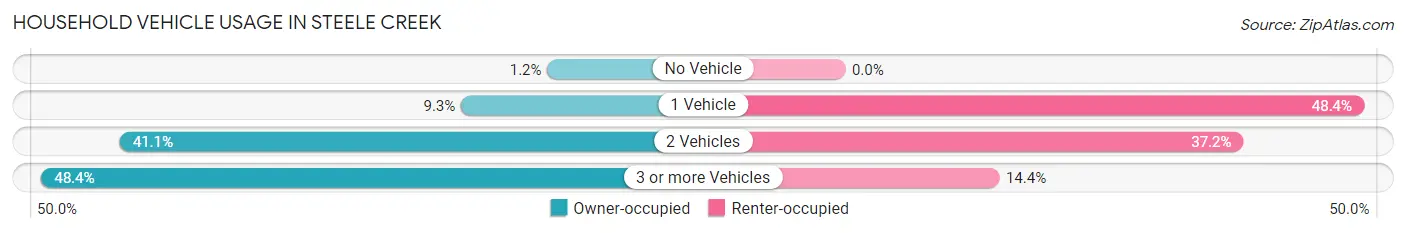
| Vehicles per Household | Owner-occupied | Renter-occupied |
| No Vehicle | 23 (1.2%) | 0 (0.0%) |
| 1 Vehicle | 178 (9.2%) | 155 (48.4%) |
| 2 Vehicles | 791 (41.1%) | 119 (37.2%) |
| 3 or more Vehicles | 932 (48.4%) | 46 (14.4%) |
| Total | 1,924 (100.0%) | 320 (100.0%) |
Real Estate & Mortgages in Steele Creek
Real Estate and Mortgage Overview in Steele Creek
| Characteristic | Without Mortgage | With Mortgage |
| Housing Units | 705 | 1,219 |
| Median Property Value | $264,200 | $337,500 |
| Median Household Income | $113,544 | $718 |
| Monthly Housing Costs | $736 | $251 |
| Real Estate Taxes | $3,859 | $19 |
Property Value by Mortgage Status in Steele Creek
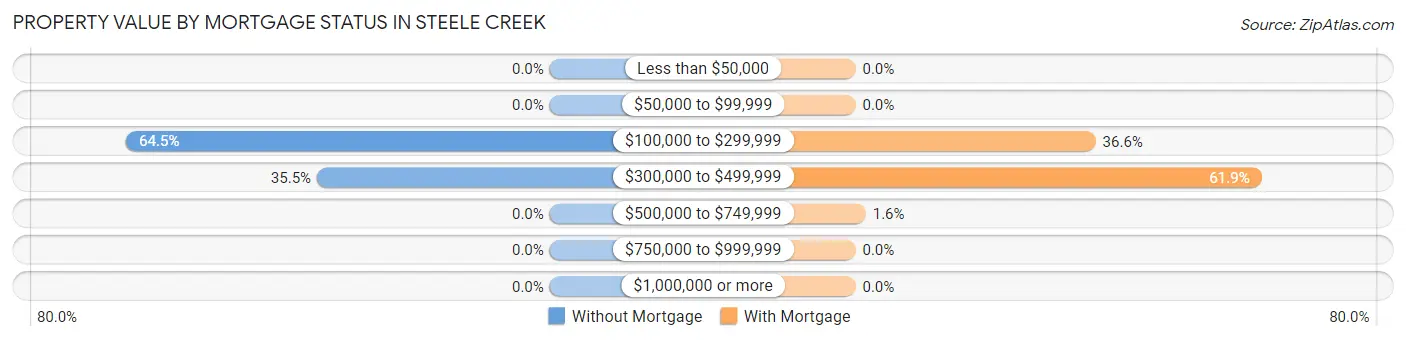
| Property Value | Without Mortgage | With Mortgage |
| Less than $50,000 | 0 (0.0%) | 0 (0.0%) |
| $50,000 to $99,999 | 0 (0.0%) | 0 (0.0%) |
| $100,000 to $299,999 | 455 (64.5%) | 446 (36.6%) |
| $300,000 to $499,999 | 250 (35.5%) | 754 (61.9%) |
| $500,000 to $749,999 | 0 (0.0%) | 19 (1.6%) |
| $750,000 to $999,999 | 0 (0.0%) | 0 (0.0%) |
| $1,000,000 or more | 0 (0.0%) | 0 (0.0%) |
| Total | 705 (100.0%) | 1,219 (100.0%) |
Household Income by Mortgage Status in Steele Creek
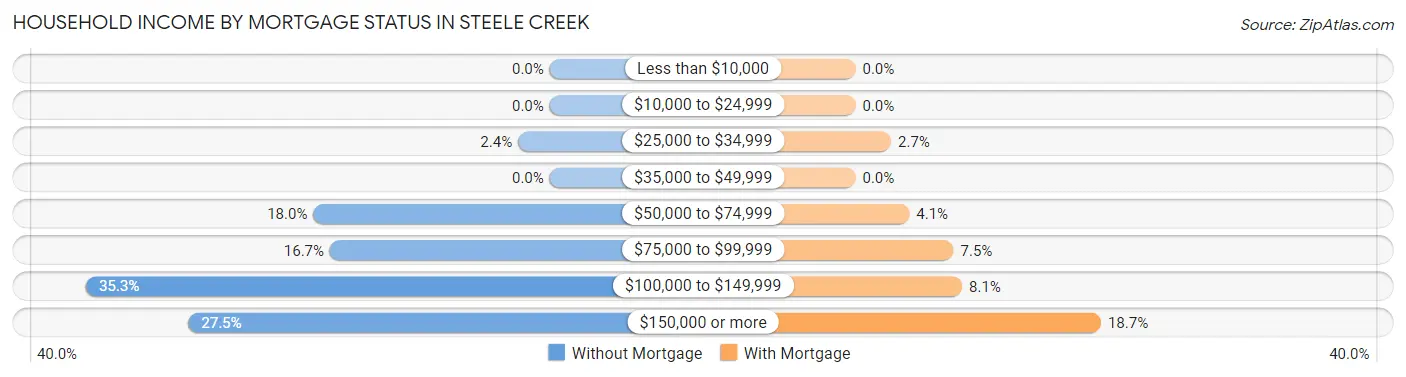
| Household Income | Without Mortgage | With Mortgage |
| Less than $10,000 | 0 (0.0%) | 0 (0.0%) |
| $10,000 to $24,999 | 0 (0.0%) | 0 (0.0%) |
| $25,000 to $34,999 | 17 (2.4%) | 33 (2.7%) |
| $35,000 to $49,999 | 0 (0.0%) | 0 (0.0%) |
| $50,000 to $74,999 | 127 (18.0%) | 50 (4.1%) |
| $75,000 to $99,999 | 118 (16.7%) | 91 (7.5%) |
| $100,000 to $149,999 | 249 (35.3%) | 99 (8.1%) |
| $150,000 or more | 194 (27.5%) | 228 (18.7%) |
| Total | 705 (100.0%) | 1,219 (100.0%) |
Property Value to Household Income Ratio in Steele Creek
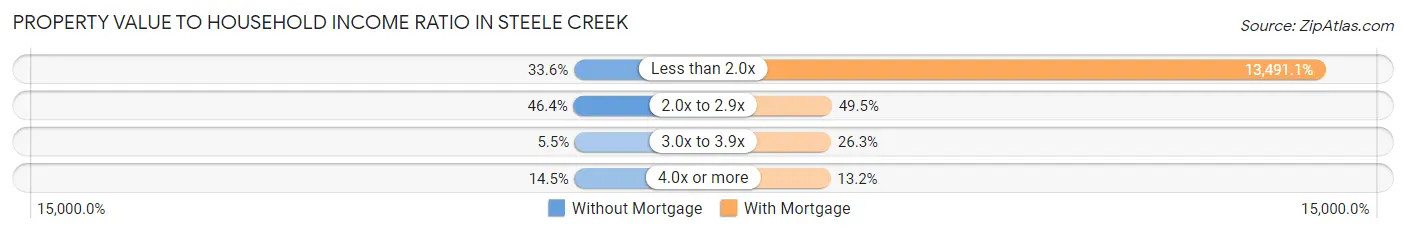
| Value-to-Income Ratio | Without Mortgage | With Mortgage |
| Less than 2.0x | 237 (33.6%) | 164,457 (13,491.1%) |
| 2.0x to 2.9x | 327 (46.4%) | 603 (49.5%) |
| 3.0x to 3.9x | 39 (5.5%) | 321 (26.3%) |
| 4.0x or more | 102 (14.5%) | 161 (13.2%) |
| Total | 705 (100.0%) | 1,219 (100.0%) |
Real Estate Taxes by Mortgage Status in Steele Creek
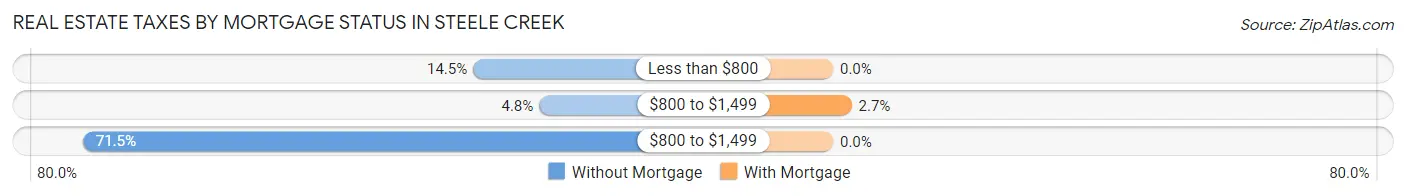
| Property Taxes | Without Mortgage | With Mortgage |
| Less than $800 | 102 (14.5%) | 0 (0.0%) |
| $800 to $1,499 | 34 (4.8%) | 33 (2.7%) |
| $800 to $1,499 | 504 (71.5%) | 0 (0.0%) |
| Total | 705 (100.0%) | 1,219 (100.0%) |
Health & Disability in Steele Creek
Health Insurance Coverage by Age in Steele Creek
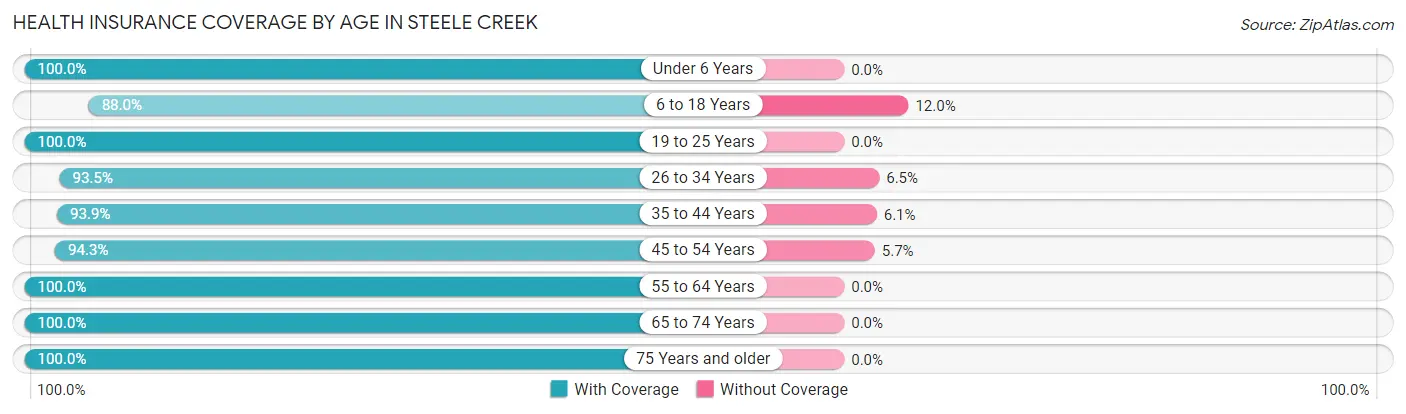
| Age Bracket | With Coverage | Without Coverage |
| Under 6 Years | 356 (100.0%) | 0 (0.0%) |
| 6 to 18 Years | 949 (88.0%) | 129 (12.0%) |
| 19 to 25 Years | 771 (100.0%) | 0 (0.0%) |
| 26 to 34 Years | 329 (93.5%) | 23 (6.5%) |
| 35 to 44 Years | 853 (93.9%) | 55 (6.1%) |
| 45 to 54 Years | 1,009 (94.3%) | 61 (5.7%) |
| 55 to 64 Years | 1,049 (100.0%) | 0 (0.0%) |
| 65 to 74 Years | 520 (100.0%) | 0 (0.0%) |
| 75 Years and older | 224 (100.0%) | 0 (0.0%) |
| Total | 6,060 (95.8%) | 268 (4.2%) |
Health Insurance Coverage by Citizenship Status in Steele Creek
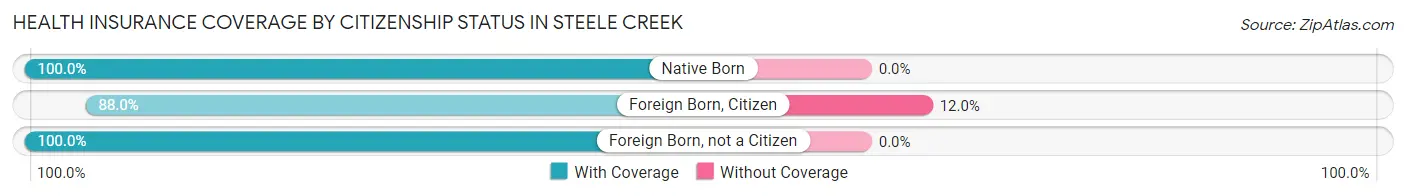
| Citizenship Status | With Coverage | Without Coverage |
| Native Born | 356 (100.0%) | 0 (0.0%) |
| Foreign Born, Citizen | 949 (88.0%) | 129 (12.0%) |
| Foreign Born, not a Citizen | 771 (100.0%) | 0 (0.0%) |
Health Insurance Coverage by Household Income in Steele Creek
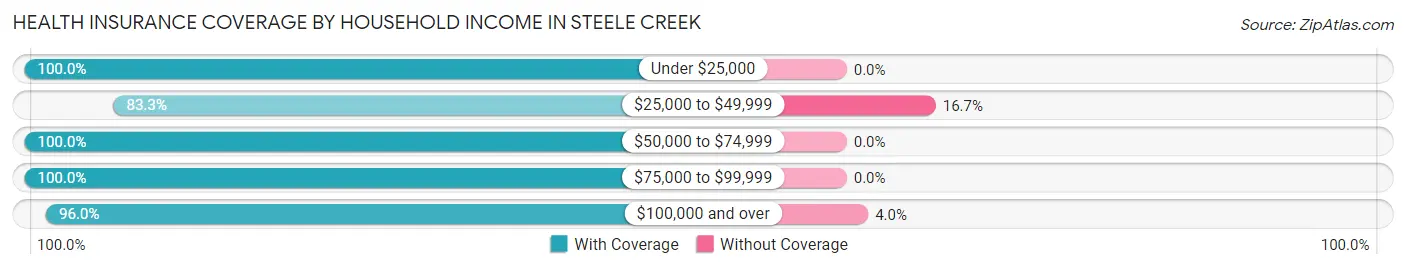
| Household Income | With Coverage | Without Coverage |
| Under $25,000 | 62 (100.0%) | 0 (0.0%) |
| $25,000 to $49,999 | 305 (83.3%) | 61 (16.7%) |
| $50,000 to $74,999 | 382 (100.0%) | 0 (0.0%) |
| $75,000 to $99,999 | 367 (100.0%) | 0 (0.0%) |
| $100,000 and over | 4,939 (96.0%) | 207 (4.0%) |
Public vs Private Health Insurance Coverage by Age in Steele Creek
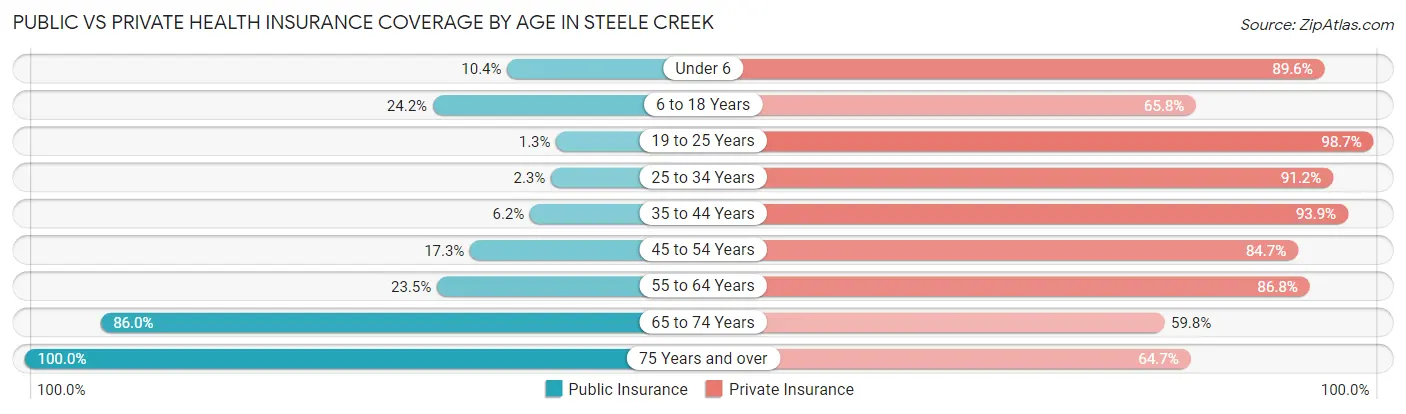
| Age Bracket | Public Insurance | Private Insurance |
| Under 6 | 37 (10.4%) | 319 (89.6%) |
| 6 to 18 Years | 261 (24.2%) | 709 (65.8%) |
| 19 to 25 Years | 10 (1.3%) | 761 (98.7%) |
| 25 to 34 Years | 8 (2.3%) | 321 (91.2%) |
| 35 to 44 Years | 56 (6.2%) | 853 (93.9%) |
| 45 to 54 Years | 185 (17.3%) | 906 (84.7%) |
| 55 to 64 Years | 246 (23.4%) | 911 (86.8%) |
| 65 to 74 Years | 447 (86.0%) | 311 (59.8%) |
| 75 Years and over | 224 (100.0%) | 145 (64.7%) |
| Total | 1,474 (23.3%) | 5,236 (82.7%) |
Disability Status by Sex by Age in Steele Creek
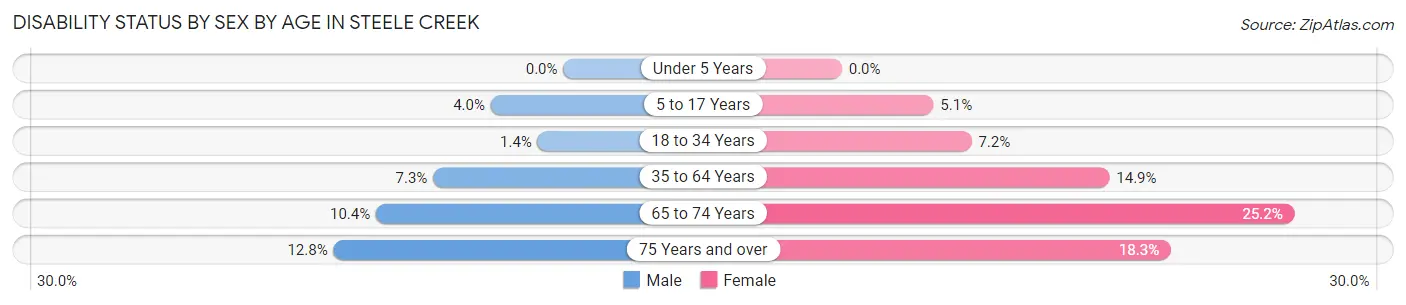
| Age Bracket | Male | Female |
| Under 5 Years | 0 (0.0%) | 0 (0.0%) |
| 5 to 17 Years | 21 (4.0%) | 26 (5.1%) |
| 18 to 34 Years | 10 (1.4%) | 44 (7.2%) |
| 35 to 64 Years | 109 (7.2%) | 227 (14.9%) |
| 65 to 74 Years | 29 (10.4%) | 61 (25.2%) |
| 75 Years and over | 21 (12.8%) | 11 (18.3%) |
Disability Class by Sex by Age in Steele Creek
Disability Class: Hearing Difficulty
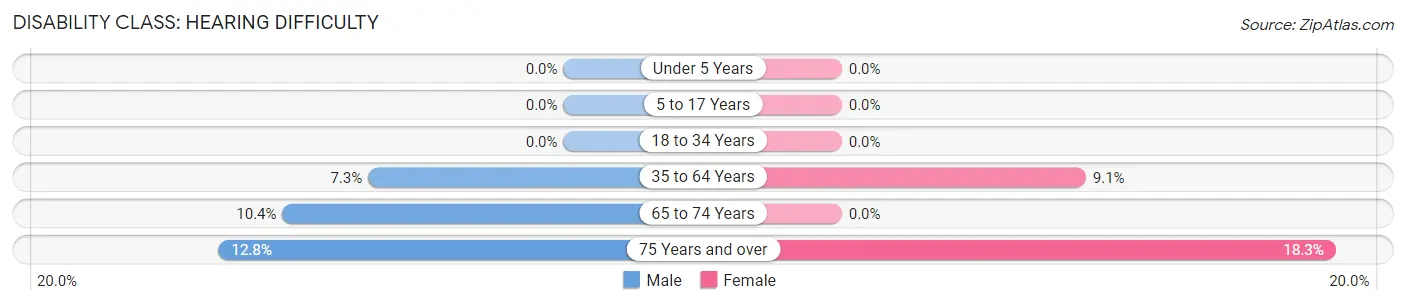
| Age Bracket | Male | Female |
| Under 5 Years | 0 (0.0%) | 0 (0.0%) |
| 5 to 17 Years | 0 (0.0%) | 0 (0.0%) |
| 18 to 34 Years | 0 (0.0%) | 0 (0.0%) |
| 35 to 64 Years | 109 (7.2%) | 138 (9.1%) |
| 65 to 74 Years | 29 (10.4%) | 0 (0.0%) |
| 75 Years and over | 21 (12.8%) | 11 (18.3%) |
Disability Class: Vision Difficulty
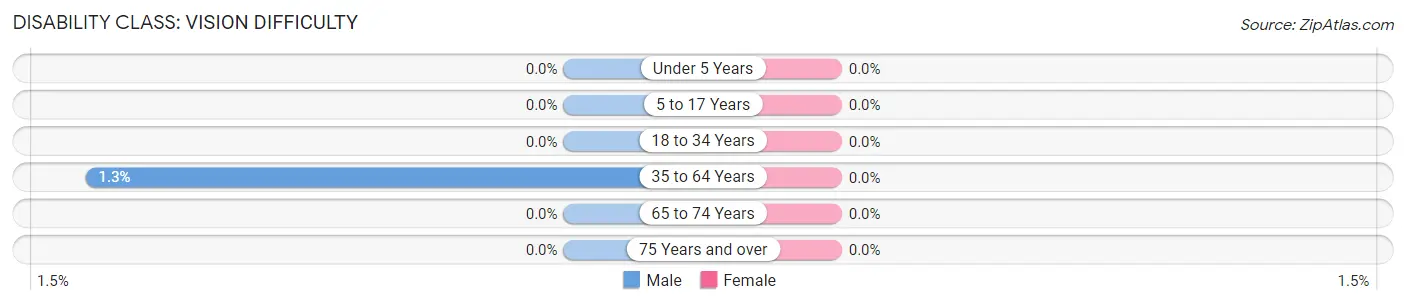
| Age Bracket | Male | Female |
| Under 5 Years | 0 (0.0%) | 0 (0.0%) |
| 5 to 17 Years | 0 (0.0%) | 0 (0.0%) |
| 18 to 34 Years | 0 (0.0%) | 0 (0.0%) |
| 35 to 64 Years | 20 (1.3%) | 0 (0.0%) |
| 65 to 74 Years | 0 (0.0%) | 0 (0.0%) |
| 75 Years and over | 0 (0.0%) | 0 (0.0%) |
Disability Class: Cognitive Difficulty
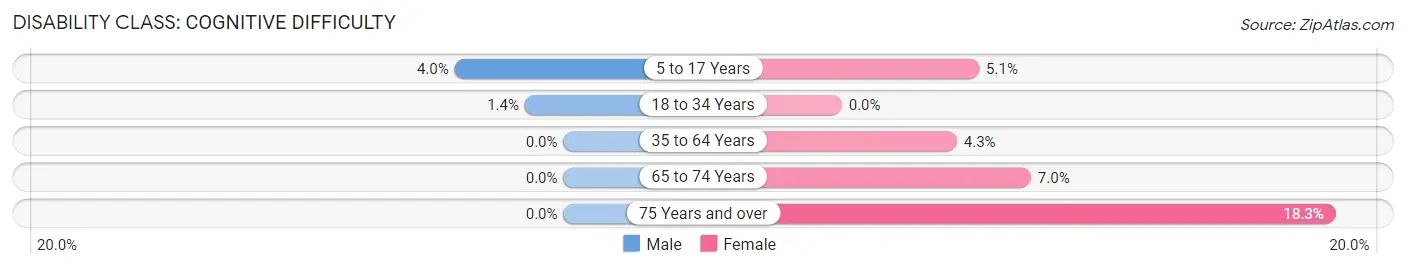
| Age Bracket | Male | Female |
| 5 to 17 Years | 21 (4.0%) | 26 (5.1%) |
| 18 to 34 Years | 10 (1.4%) | 0 (0.0%) |
| 35 to 64 Years | 0 (0.0%) | 65 (4.3%) |
| 65 to 74 Years | 0 (0.0%) | 17 (7.0%) |
| 75 Years and over | 0 (0.0%) | 11 (18.3%) |
Disability Class: Ambulatory Difficulty
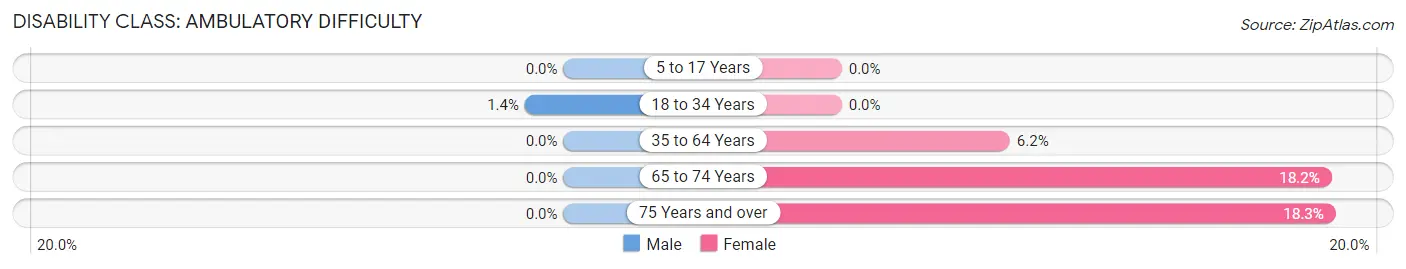
| Age Bracket | Male | Female |
| 5 to 17 Years | 0 (0.0%) | 0 (0.0%) |
| 18 to 34 Years | 10 (1.4%) | 0 (0.0%) |
| 35 to 64 Years | 0 (0.0%) | 95 (6.2%) |
| 65 to 74 Years | 0 (0.0%) | 44 (18.2%) |
| 75 Years and over | 0 (0.0%) | 11 (18.3%) |
Disability Class: Self-Care Difficulty
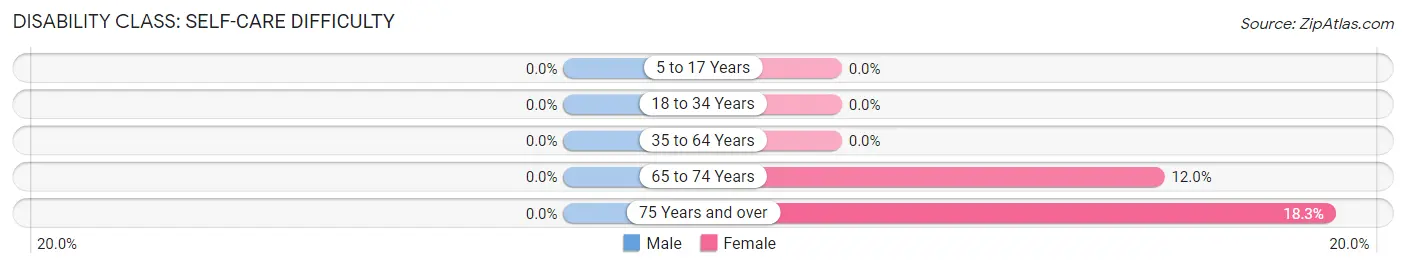
| Age Bracket | Male | Female |
| 5 to 17 Years | 0 (0.0%) | 0 (0.0%) |
| 18 to 34 Years | 0 (0.0%) | 0 (0.0%) |
| 35 to 64 Years | 0 (0.0%) | 0 (0.0%) |
| 65 to 74 Years | 0 (0.0%) | 29 (12.0%) |
| 75 Years and over | 0 (0.0%) | 11 (18.3%) |
Technology Access in Steele Creek
Computing Device Access in Steele Creek
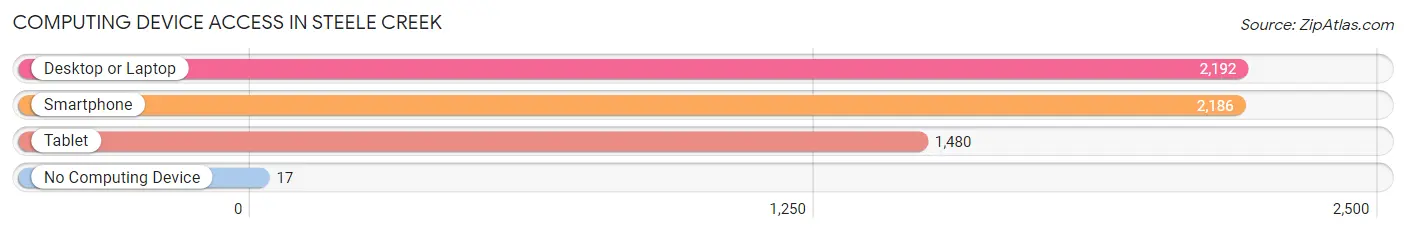
| Device Type | # Households | % Households |
| Desktop or Laptop | 2,192 | 97.7% |
| Smartphone | 2,186 | 97.4% |
| Tablet | 1,480 | 65.9% |
| No Computing Device | 17 | 0.8% |
| Total | 2,244 | 100.0% |
Internet Access in Steele Creek
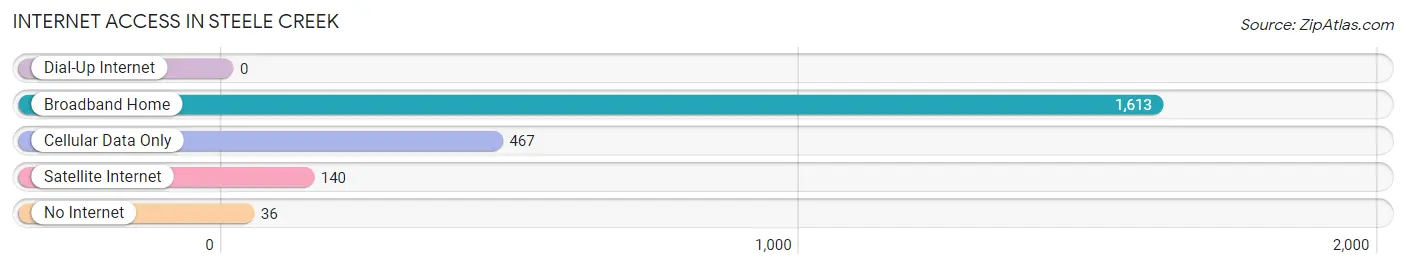
| Internet Type | # Households | % Households |
| Dial-Up Internet | 0 | 0.0% |
| Broadband Home | 1,613 | 71.9% |
| Cellular Data Only | 467 | 20.8% |
| Satellite Internet | 140 | 6.2% |
| No Internet | 36 | 1.6% |
| Total | 2,244 | 100.0% |
Steele Creek Summary
Steele Creek is a small unincorporated community located in the Matanuska-Susitna Borough of Alaska. It is situated on the south bank of the Susitna River, approximately 25 miles northeast of Anchorage. The community is named after the Steele Creek, which flows through the area.
History
The area around Steele Creek has been inhabited for thousands of years by the Dena’ina Athabascan people. The Dena’ina were semi-nomadic, living off the land and relying on the resources of the Susitna River and its tributaries.
The first non-Native settlers arrived in the area in the early 1900s. The first homesteaders were miners who were attracted to the area by the gold rush. The first post office was established in Steele Creek in 1915.
In the 1950s, the Alaska Railroad was extended to the area, bringing more settlers and businesses to the area. The railroad also provided access to the nearby town of Wasilla, which became the commercial center of the region.
Geography
Steele Creek is located in the Matanuska-Susitna Borough of Alaska. It is situated on the south bank of the Susitna River, approximately 25 miles northeast of Anchorage. The community is surrounded by the Chugach National Forest and the Talkeetna Mountains.
The climate in Steele Creek is generally mild, with temperatures ranging from the mid-30s in the winter to the mid-60s in the summer. The area receives an average of 40 inches of precipitation per year, with most of it falling in the form of snow.
Economy
The economy of Steele Creek is largely based on tourism and recreation. The area is popular with hikers, campers, and fishermen, and there are several lodges and cabins in the area. The nearby town of Wasilla is the commercial center of the region, and provides employment opportunities for residents of Steele Creek.
Demographics
As of the 2010 census, the population of Steele Creek was 1,072. The racial makeup of the community was 95.3% White, 0.7% Native American, 0.3% Asian, 0.2% Pacific Islander, and 3.5% from other races. The median household income was $50,000, and the median age was 37.
Conclusion
Steele Creek is a small unincorporated community located in the Matanuska-Susitna Borough of Alaska. It has a long history of settlement, and is surrounded by the Chugach National Forest and the Talkeetna Mountains. The economy of Steele Creek is largely based on tourism and recreation, and the population is mostly White.
Common Questions
What is Per Capita Income in Steele Creek?
Per Capita income in Steele Creek is $53,582.
What is the Median Family Income in Steele Creek?
Median Family Income in Steele Creek is $161,458.
What is the Median Household income in Steele Creek?
Median Household Income in Steele Creek is $118,934.
What is Income or Wage Gap in Steele Creek?
Income or Wage Gap in Steele Creek is 43.9%.
Women in Steele Creek earn 56.1 cents for every dollar earned by a man.
What is Inequality or Gini Index in Steele Creek?
Inequality or Gini Index in Steele Creek is 0.35.
What is the Total Population of Steele Creek?
Total Population of Steele Creek is 6,542.
What is the Total Male Population of Steele Creek?
Total Male Population of Steele Creek is 3,458.
What is the Total Female Population of Steele Creek?
Total Female Population of Steele Creek is 3,084.
What is the Ratio of Males per 100 Females in Steele Creek?
There are 112.13 Males per 100 Females in Steele Creek.
What is the Ratio of Females per 100 Males in Steele Creek?
There are 89.18 Females per 100 Males in Steele Creek.
What is the Median Population Age in Steele Creek?
Median Population Age in Steele Creek is 39.1 Years.
What is the Average Family Size in Steele Creek
Average Family Size in Steele Creek is 3.4 People.
What is the Average Household Size in Steele Creek
Average Household Size in Steele Creek is 2.9 People.
How Large is the Labor Force in Steele Creek?
There are 3,854 People in the Labor Forcein in Steele Creek.
What is the Percentage of People in the Labor Force in Steele Creek?
69.6% of People are in the Labor Force in Steele Creek.
What is the Unemployment Rate in Steele Creek?
Unemployment Rate in Steele Creek is 2.8%.