Helena Valley Southeast, MT Map & Demographics
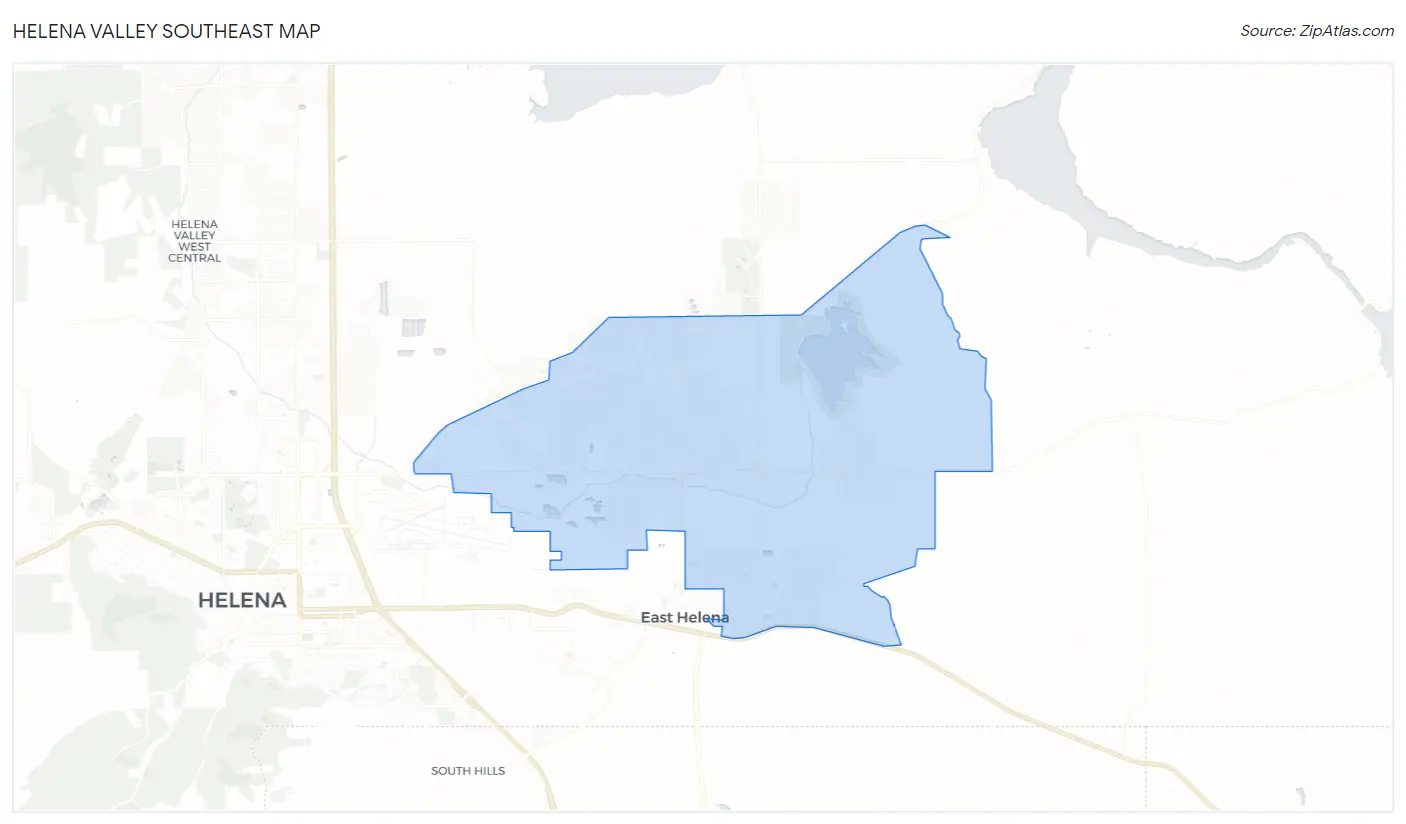
Helena Valley Southeast Map
Helena Valley Southeast Overview
$31,521
PER CAPITA INCOME
$72,149
AVG FAMILY INCOME
$68,512
AVG HOUSEHOLD INCOME
20.4%
WAGE / INCOME GAP [ % ]
79.6¢/ $1
WAGE / INCOME GAP [ $ ]
0.37
INEQUALITY / GINI INDEX
9,374
TOTAL POPULATION
4,960
MALE POPULATION
4,414
FEMALE POPULATION
112.37
MALES / 100 FEMALES
88.99
FEMALES / 100 MALES
39.3
MEDIAN AGE
2.9
AVG FAMILY SIZE
2.6
AVG HOUSEHOLD SIZE
4,672
LABOR FORCE [ PEOPLE ]
66.7%
PERCENT IN LABOR FORCE
5.1%
UNEMPLOYMENT RATE
Income in Helena Valley Southeast
Income Overview in Helena Valley Southeast
Per Capita Income in Helena Valley Southeast is $31,521, while median incomes of families and households are $72,149 and $68,512 respectively.
| Characteristic | Number | Measure |
| Per Capita Income | 9,374 | $31,521 |
| Median Family Income | 2,671 | $72,149 |
| Mean Family Income | 2,671 | $86,458 |
| Median Household Income | 3,582 | $68,512 |
| Mean Household Income | 3,582 | $81,505 |
| Income Deficit | 2,671 | $0 |
| Wage / Income Gap (%) | 9,374 | 20.42% |
| Wage / Income Gap ($) | 9,374 | 79.58¢ per $1 |
| Gini / Inequality Index | 9,374 | 0.37 |
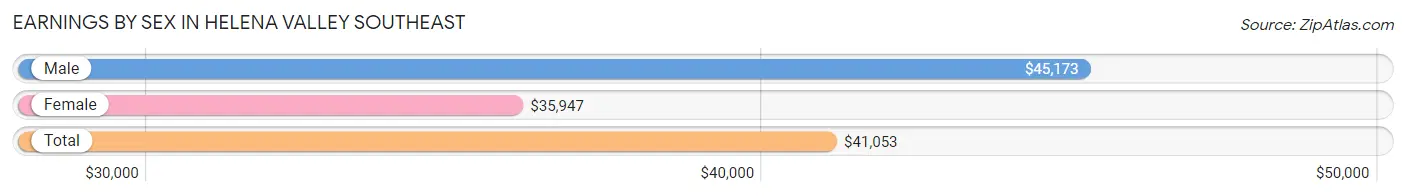
Earnings by Sex in Helena Valley Southeast
Average Earnings in Helena Valley Southeast are $41,053, $45,173 for men and $35,947 for women, a difference of 20.4%.
| Sex | Number | Average Earnings |
| Male | 2,777 (57.0%) | $45,173 |
| Female | 2,095 (43.0%) | $35,947 |
| Total | 4,872 (100.0%) | $41,053 |
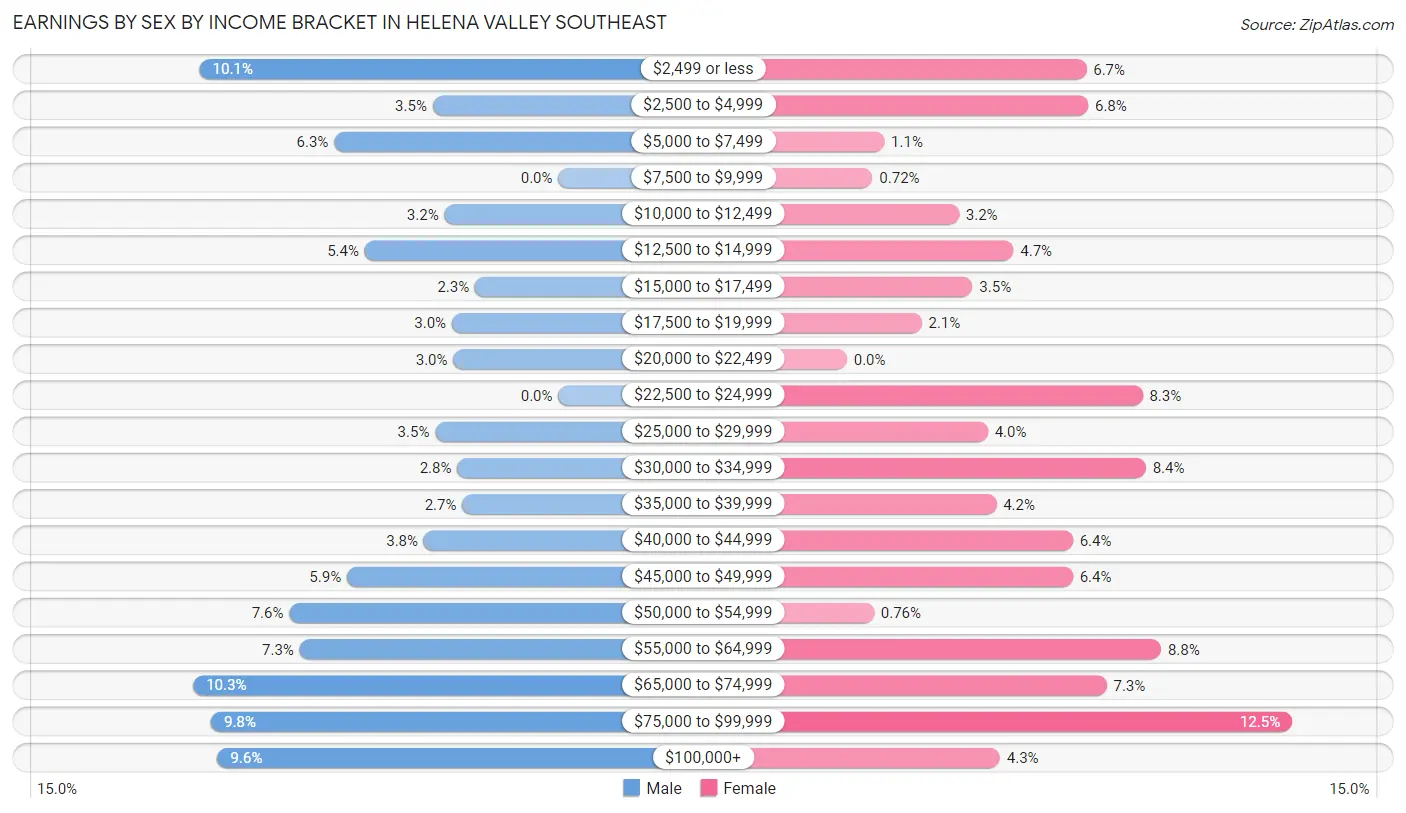
Earnings by Sex by Income Bracket in Helena Valley Southeast
The most common earnings brackets in Helena Valley Southeast are $65,000 to $74,999 for men (285 | 10.3%) and $75,000 to $99,999 for women (262 | 12.5%).
| Income | Male | Female |
| $2,499 or less | 280 (10.1%) | 141 (6.7%) |
| $2,500 to $4,999 | 98 (3.5%) | 142 (6.8%) |
| $5,000 to $7,499 | 175 (6.3%) | 22 (1.1%) |
| $7,500 to $9,999 | 0 (0.0%) | 15 (0.7%) |
| $10,000 to $12,499 | 89 (3.2%) | 66 (3.2%) |
| $12,500 to $14,999 | 151 (5.4%) | 98 (4.7%) |
| $15,000 to $17,499 | 65 (2.3%) | 74 (3.5%) |
| $17,500 to $19,999 | 83 (3.0%) | 44 (2.1%) |
| $20,000 to $22,499 | 82 (2.9%) | 0 (0.0%) |
| $22,500 to $24,999 | 0 (0.0%) | 174 (8.3%) |
| $25,000 to $29,999 | 96 (3.5%) | 83 (4.0%) |
| $30,000 to $34,999 | 79 (2.8%) | 176 (8.4%) |
| $35,000 to $39,999 | 75 (2.7%) | 88 (4.2%) |
| $40,000 to $44,999 | 105 (3.8%) | 133 (6.4%) |
| $45,000 to $49,999 | 165 (5.9%) | 133 (6.4%) |
| $50,000 to $54,999 | 210 (7.6%) | 16 (0.8%) |
| $55,000 to $64,999 | 202 (7.3%) | 185 (8.8%) |
| $65,000 to $74,999 | 285 (10.3%) | 153 (7.3%) |
| $75,000 to $99,999 | 271 (9.8%) | 262 (12.5%) |
| $100,000+ | 266 (9.6%) | 90 (4.3%) |
| Total | 2,777 (100.0%) | 2,095 (100.0%) |
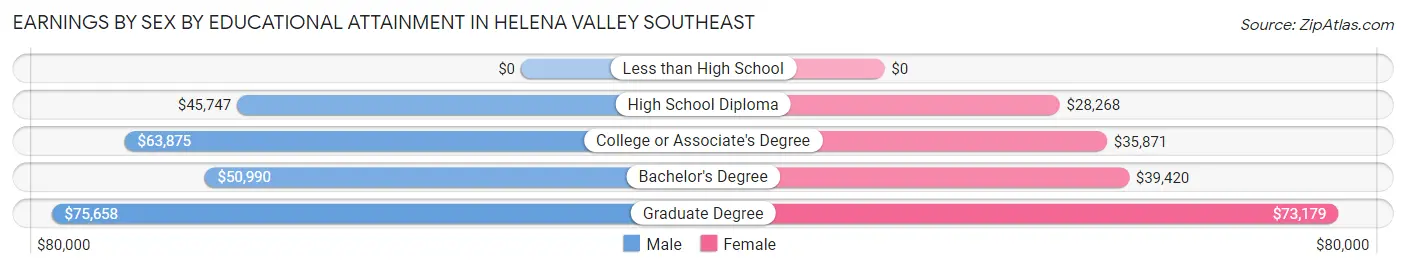
Earnings by Sex by Educational Attainment in Helena Valley Southeast
Average earnings in Helena Valley Southeast are $50,363 for men and $39,795 for women, a difference of 21.0%. Men with an educational attainment of graduate degree enjoy the highest average annual earnings of $75,658, while those with high school diploma education earn the least with $45,747. Women with an educational attainment of graduate degree earn the most with the average annual earnings of $73,179, while those with high school diploma education have the smallest earnings of $28,268.
| Educational Attainment | Male Income | Female Income |
| Less than High School | - | - |
| High School Diploma | $45,747 | $28,268 |
| College or Associate's Degree | $63,875 | $35,871 |
| Bachelor's Degree | $50,990 | $39,420 |
| Graduate Degree | $75,658 | $73,179 |
| Total | $50,363 | $39,795 |
Family Income in Helena Valley Southeast
Family Income Brackets in Helena Valley Southeast
According to the Helena Valley Southeast family income data, there are 737 families falling into the $100,000 to $149,999 income range, which is the most common income bracket and makes up 27.6% of all families.
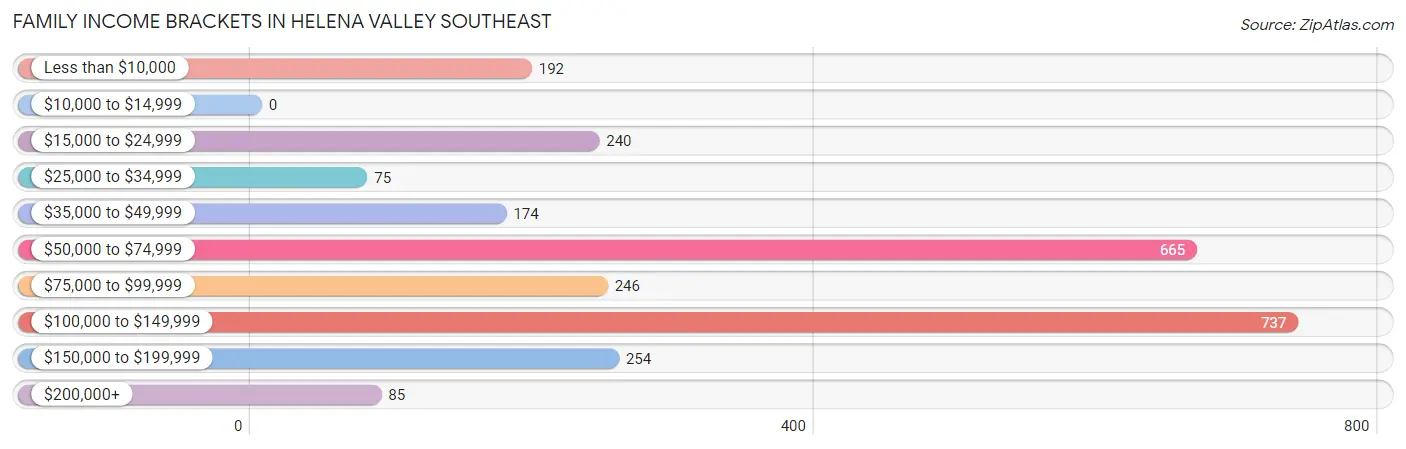
| Income Bracket | # Families | % Families |
| Less than $10,000 | 192 | 7.2% |
| $10,000 to $14,999 | 0 | 0.0% |
| $15,000 to $24,999 | 240 | 9.0% |
| $25,000 to $34,999 | 75 | 2.8% |
| $35,000 to $49,999 | 174 | 6.5% |
| $50,000 to $74,999 | 665 | 24.9% |
| $75,000 to $99,999 | 246 | 9.2% |
| $100,000 to $149,999 | 737 | 27.6% |
| $150,000 to $199,999 | 254 | 9.5% |
| $200,000+ | 85 | 3.2% |
Family Income by Famaliy Size in Helena Valley Southeast
2-person families (1,498 | 56.1%) account for the highest median family income in Helena Valley Southeast with $81,356 per family, while 2-person families (1,498 | 56.1%) have the highest median income of $40,678 per family member.
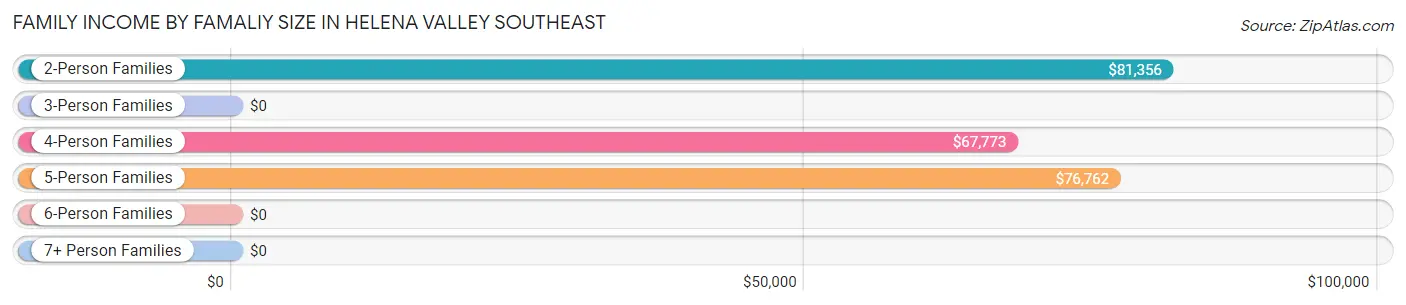
| Income Bracket | # Families | Median Income |
| 2-Person Families | 1,498 (56.1%) | $81,356 |
| 3-Person Families | 504 (18.9%) | $0 |
| 4-Person Families | 515 (19.3%) | $67,773 |
| 5-Person Families | 110 (4.1%) | $76,762 |
| 6-Person Families | 26 (1.0%) | $0 |
| 7+ Person Families | 18 (0.7%) | $0 |
| Total | 2,671 (100.0%) | $72,149 |
Family Income by Number of Earners in Helena Valley Southeast
The median family income in Helena Valley Southeast is $72,149, with families comprising 3+ earners (171) having the highest median family income of $110,655, while families with 1 earner (929) have the lowest median family income of $51,302, accounting for 6.4% and 34.8% of families, respectively.
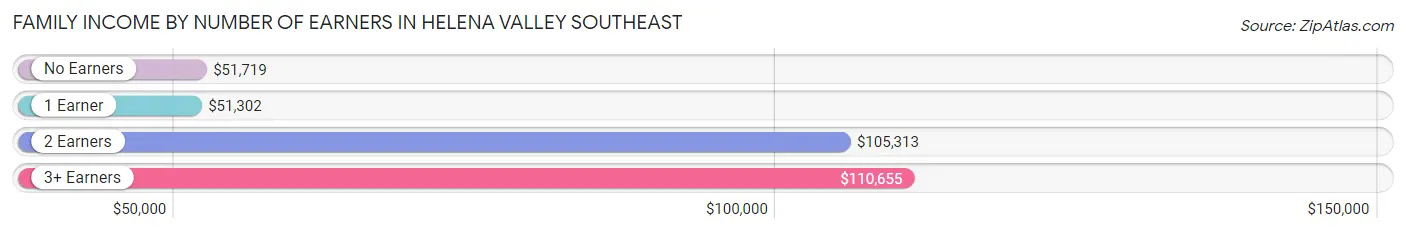
| Number of Earners | # Families | Median Income |
| No Earners | 432 (16.2%) | $51,719 |
| 1 Earner | 929 (34.8%) | $51,302 |
| 2 Earners | 1,139 (42.6%) | $105,313 |
| 3+ Earners | 171 (6.4%) | $110,655 |
| Total | 2,671 (100.0%) | $72,149 |
Household Income in Helena Valley Southeast
Household Income Brackets in Helena Valley Southeast
With 827 households falling in the category, the $100,000 to $149,999 income range is the most frequent in Helena Valley Southeast, accounting for 23.1% of all households. In contrast, only 57 households (1.6%) fall into the $10,000 to $14,999 income bracket, making it the least populous group.
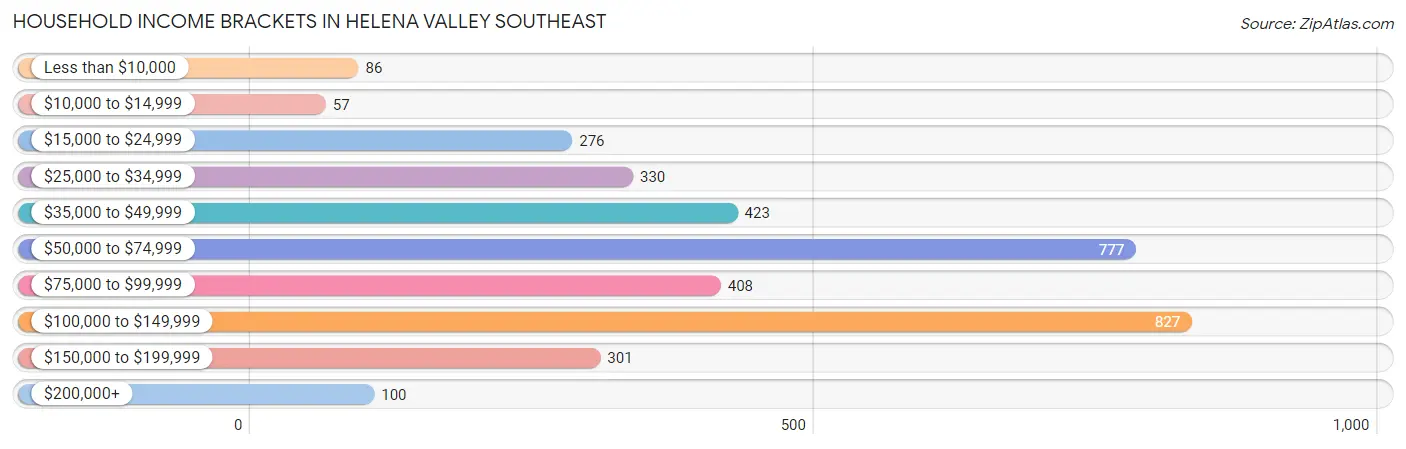
| Income Bracket | # Households | % Households |
| Less than $10,000 | 86 | 2.4% |
| $10,000 to $14,999 | 57 | 1.6% |
| $15,000 to $24,999 | 276 | 7.7% |
| $25,000 to $34,999 | 330 | 9.2% |
| $35,000 to $49,999 | 423 | 11.8% |
| $50,000 to $74,999 | 777 | 21.7% |
| $75,000 to $99,999 | 408 | 11.4% |
| $100,000 to $149,999 | 827 | 23.1% |
| $150,000 to $199,999 | 301 | 8.4% |
| $200,000+ | 100 | 2.8% |
Household Income by Householder Age in Helena Valley Southeast
The median household income in Helena Valley Southeast is $68,512, with the highest median household income of $103,517 found in the 45 to 64 years age bracket for the primary householder. A total of 1,367 households (38.2%) fall into this category. Meanwhile, the 65+ years age bracket for the primary householder has the lowest median household income of $53,829, with 877 households (24.5%) in this group.
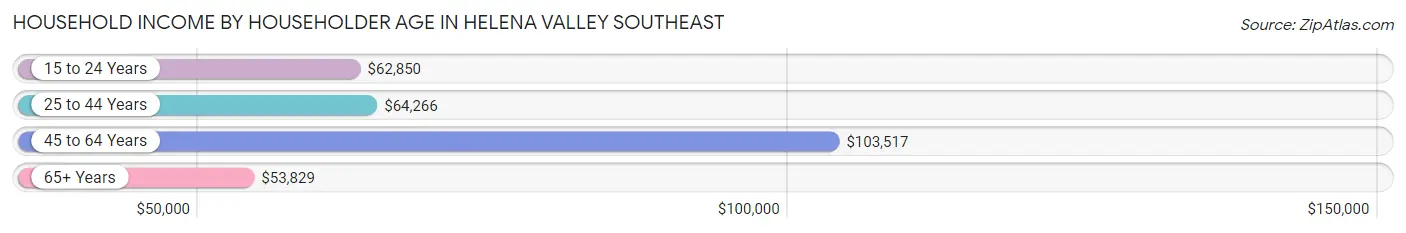
| Income Bracket | # Households | Median Income |
| 15 to 24 Years | 103 (2.9%) | $62,850 |
| 25 to 44 Years | 1,235 (34.5%) | $64,266 |
| 45 to 64 Years | 1,367 (38.2%) | $103,517 |
| 65+ Years | 877 (24.5%) | $53,829 |
| Total | 3,582 (100.0%) | $68,512 |
Poverty in Helena Valley Southeast
Income Below Poverty by Sex and Age in Helena Valley Southeast
With 16.9% poverty level for males and 18.1% for females among the residents of Helena Valley Southeast, under 5 year old males and 18 to 24 year old females are the most vulnerable to poverty, with 228 males (60.0%) and 124 females (53.4%) in their respective age groups living below the poverty level.
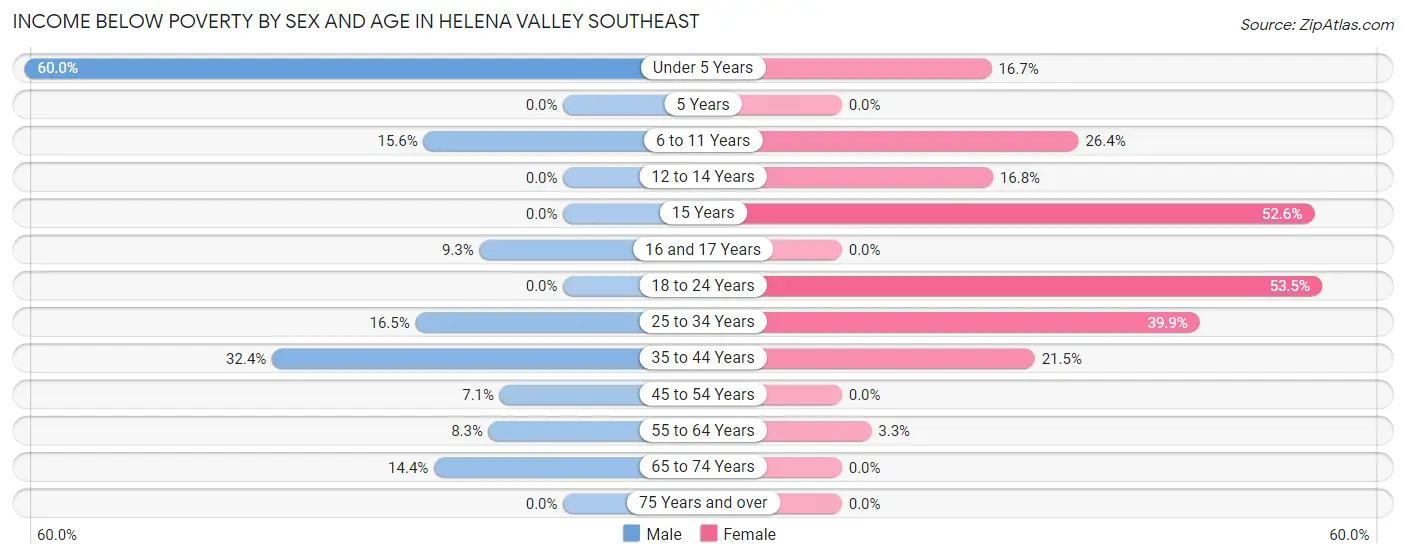
| Age Bracket | Male | Female |
| Under 5 Years | 228 (60.0%) | 29 (16.7%) |
| 5 Years | 0 (0.0%) | 0 (0.0%) |
| 6 to 11 Years | 83 (15.6%) | 92 (26.4%) |
| 12 to 14 Years | 0 (0.0%) | 52 (16.8%) |
| 15 Years | 0 (0.0%) | 152 (52.6%) |
| 16 and 17 Years | 18 (9.3%) | 0 (0.0%) |
| 18 to 24 Years | 0 (0.0%) | 124 (53.4%) |
| 25 to 34 Years | 79 (16.5%) | 169 (39.9%) |
| 35 to 44 Years | 239 (32.4%) | 156 (21.5%) |
| 45 to 54 Years | 37 (7.1%) | 0 (0.0%) |
| 55 to 64 Years | 55 (8.3%) | 26 (3.3%) |
| 65 to 74 Years | 98 (14.4%) | 0 (0.0%) |
| 75 Years and over | 0 (0.0%) | 0 (0.0%) |
| Total | 837 (16.9%) | 800 (18.1%) |
Income Above Poverty by Sex and Age in Helena Valley Southeast
According to the poverty statistics in Helena Valley Southeast, males aged 5 years and females aged 5 years are the age groups that are most secure financially, with 100.0% of males and 100.0% of females in these age groups living above the poverty line.
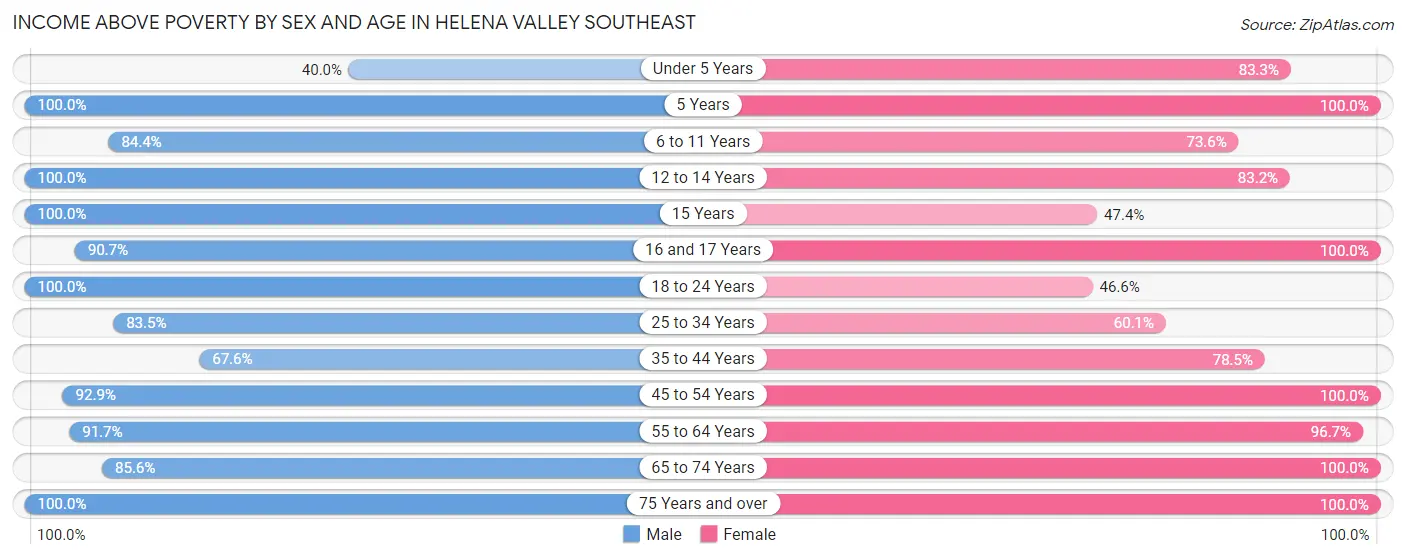
| Age Bracket | Male | Female |
| Under 5 Years | 152 (40.0%) | 145 (83.3%) |
| 5 Years | 64 (100.0%) | 26 (100.0%) |
| 6 to 11 Years | 450 (84.4%) | 257 (73.6%) |
| 12 to 14 Years | 176 (100.0%) | 257 (83.2%) |
| 15 Years | 69 (100.0%) | 137 (47.4%) |
| 16 and 17 Years | 175 (90.7%) | 45 (100.0%) |
| 18 to 24 Years | 302 (100.0%) | 108 (46.6%) |
| 25 to 34 Years | 401 (83.5%) | 255 (60.1%) |
| 35 to 44 Years | 498 (67.6%) | 570 (78.5%) |
| 45 to 54 Years | 486 (92.9%) | 351 (100.0%) |
| 55 to 64 Years | 608 (91.7%) | 764 (96.7%) |
| 65 to 74 Years | 583 (85.6%) | 616 (100.0%) |
| 75 Years and over | 159 (100.0%) | 83 (100.0%) |
| Total | 4,123 (83.1%) | 3,614 (81.9%) |
Income Below Poverty Among Married-Couple Families in Helena Valley Southeast
The poverty statistics for married-couple families in Helena Valley Southeast show that 1.5% or 26 of the total 1,795 families live below the poverty line. Families with no children have the highest poverty rate of 2.0%, comprising of 26 families. On the other hand, families with 1 or 2 children have the lowest poverty rate of 0.0%, which includes 0 families.
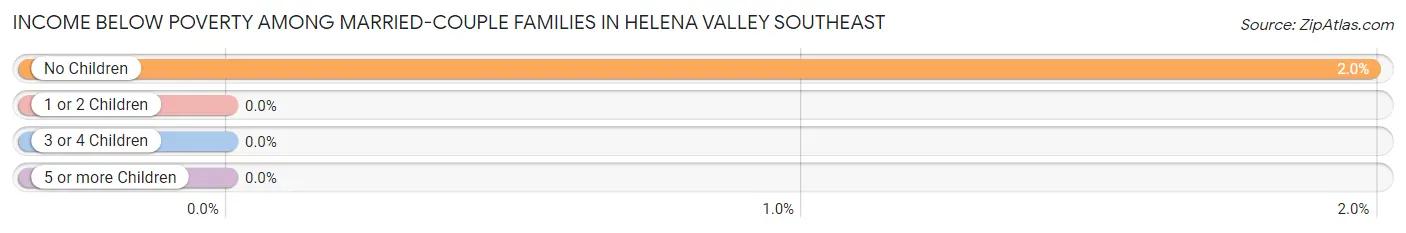
| Children | Above Poverty | Below Poverty |
| No Children | 1,279 (98.0%) | 26 (2.0%) |
| 1 or 2 Children | 373 (100.0%) | 0 (0.0%) |
| 3 or 4 Children | 117 (100.0%) | 0 (0.0%) |
| 5 or more Children | 0 (0.0%) | 0 (0.0%) |
| Total | 1,769 (98.6%) | 26 (1.5%) |
Income Below Poverty Among Single-Parent Households in Helena Valley Southeast
According to the poverty data in Helena Valley Southeast, 32.6% or 117 single-father households and 31.5% or 163 single-mother households are living below the poverty line. Among single-father households, those with 1 or 2 children have the highest poverty rate, with 117 households (53.9%) experiencing poverty. Likewise, among single-mother households, those with 3 or 4 children have the highest poverty rate, with 76 households (45.8%) falling below the poverty line.
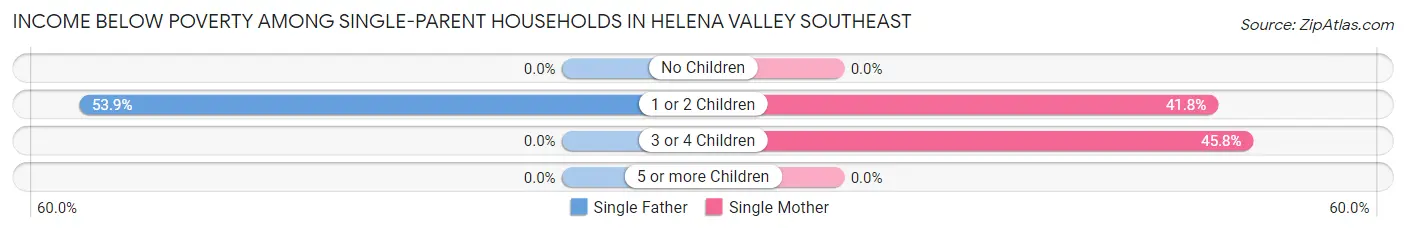
| Children | Single Father | Single Mother |
| No Children | 0 (0.0%) | 0 (0.0%) |
| 1 or 2 Children | 117 (53.9%) | 87 (41.8%) |
| 3 or 4 Children | 0 (0.0%) | 76 (45.8%) |
| 5 or more Children | 0 (0.0%) | 0 (0.0%) |
| Total | 117 (32.6%) | 163 (31.5%) |
Income Below Poverty Among Married-Couple vs Single-Parent Households in Helena Valley Southeast
The poverty data for Helena Valley Southeast shows that 26 of the married-couple family households (1.5%) and 280 of the single-parent households (32.0%) are living below the poverty level. Within the married-couple family households, those with no children have the highest poverty rate, with 26 households (2.0%) falling below the poverty line. Among the single-parent households, those with 1 or 2 children have the highest poverty rate, with 204 household (48.0%) living below poverty.
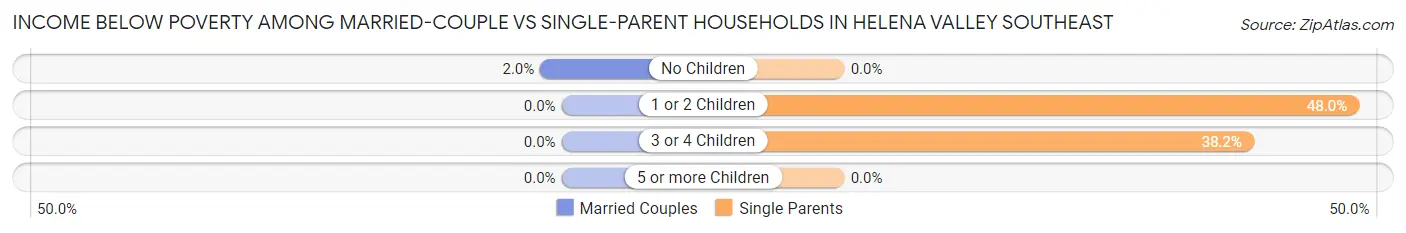
| Children | Married-Couple Families | Single-Parent Households |
| No Children | 26 (2.0%) | 0 (0.0%) |
| 1 or 2 Children | 0 (0.0%) | 204 (48.0%) |
| 3 or 4 Children | 0 (0.0%) | 76 (38.2%) |
| 5 or more Children | 0 (0.0%) | 0 (0.0%) |
| Total | 26 (1.5%) | 280 (32.0%) |
Race in Helena Valley Southeast
The most populous races in Helena Valley Southeast are White / Caucasian (8,740 | 93.2%), Two or more Races (350 | 3.7%), and Hispanic or Latino (148 | 1.6%).
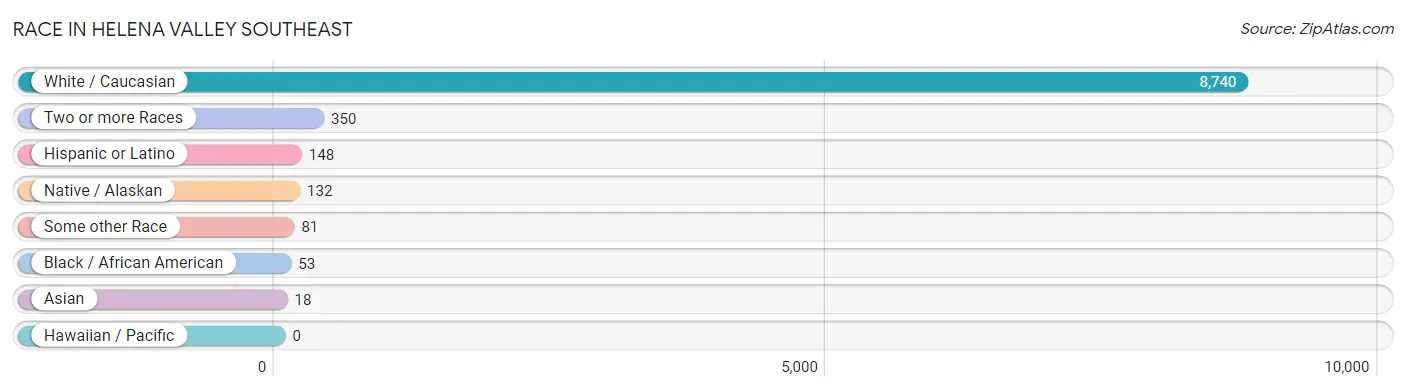
| Race | # Population | % Population |
| Asian | 18 | 0.2% |
| Black / African American | 53 | 0.6% |
| Hawaiian / Pacific | 0 | 0.0% |
| Hispanic or Latino | 148 | 1.6% |
| Native / Alaskan | 132 | 1.4% |
| White / Caucasian | 8,740 | 93.2% |
| Two or more Races | 350 | 3.7% |
| Some other Race | 81 | 0.9% |
| Total | 9,374 | 100.0% |
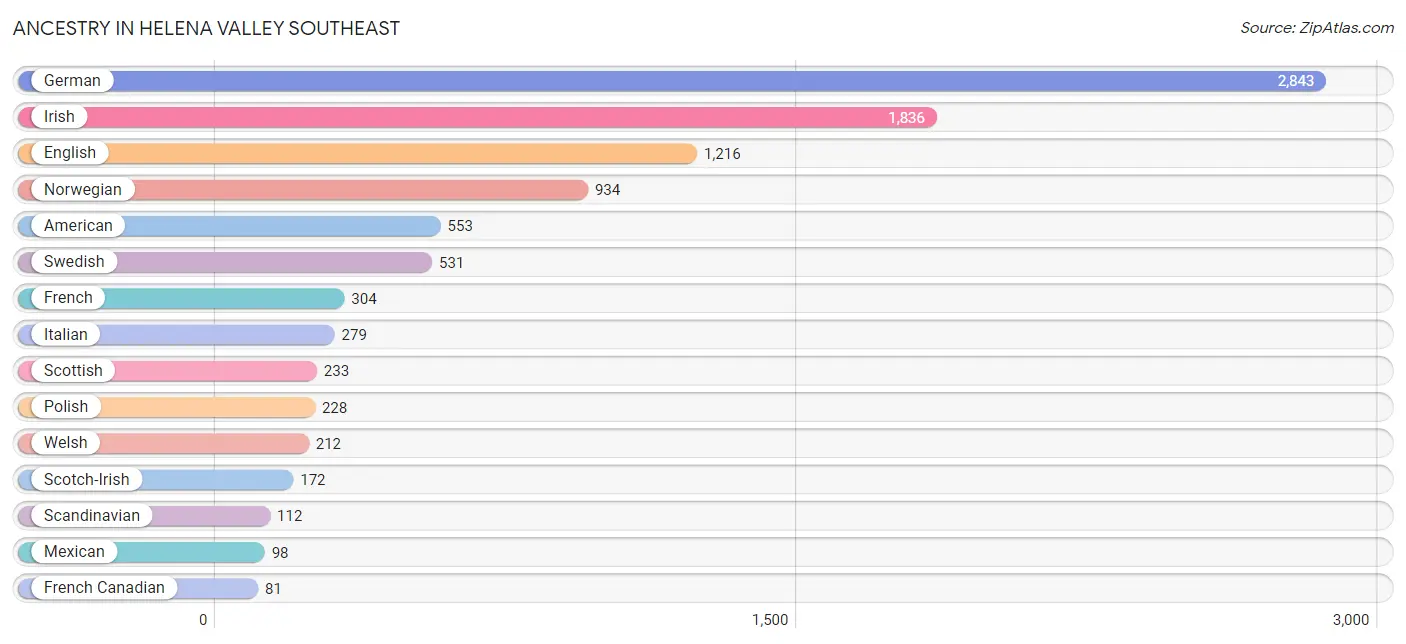
Ancestry in Helena Valley Southeast
The most populous ancestries reported in Helena Valley Southeast are German (2,843 | 30.3%), Irish (1,836 | 19.6%), English (1,216 | 13.0%), Norwegian (934 | 10.0%), and American (553 | 5.9%), together accounting for 78.8% of all Helena Valley Southeast residents.
| Ancestry | # Population | % Population |
| Aleut | 75 | 0.8% |
| American | 553 | 5.9% |
| Austrian | 21 | 0.2% |
| Belgian | 19 | 0.2% |
| Bhutanese | 44 | 0.5% |
| Blackfeet | 12 | 0.1% |
| Cherokee | 42 | 0.4% |
| Chippewa | 34 | 0.4% |
| Creek | 54 | 0.6% |
| Czech | 28 | 0.3% |
| Danish | 50 | 0.5% |
| Dutch | 76 | 0.8% |
| English | 1,216 | 13.0% |
| European | 70 | 0.7% |
| Finnish | 49 | 0.5% |
| French | 304 | 3.2% |
| French Canadian | 81 | 0.9% |
| German | 2,843 | 30.3% |
| Greek | 44 | 0.5% |
| Irish | 1,836 | 19.6% |
| Italian | 279 | 3.0% |
| Korean | 8 | 0.1% |
| Lithuanian | 20 | 0.2% |
| Mexican | 98 | 1.1% |
| Native Hawaiian | 13 | 0.1% |
| Navajo | 53 | 0.6% |
| Northern European | 18 | 0.2% |
| Norwegian | 934 | 10.0% |
| Pennsylvania German | 19 | 0.2% |
| Polish | 228 | 2.4% |
| Russian | 15 | 0.2% |
| Scandinavian | 112 | 1.2% |
| Scotch-Irish | 172 | 1.8% |
| Scottish | 233 | 2.5% |
| Slavic | 14 | 0.2% |
| Slovene | 10 | 0.1% |
| Spanish | 22 | 0.2% |
| Swedish | 531 | 5.7% |
| Swiss | 31 | 0.3% |
| Welsh | 212 | 2.3% | View All 40 Rows |
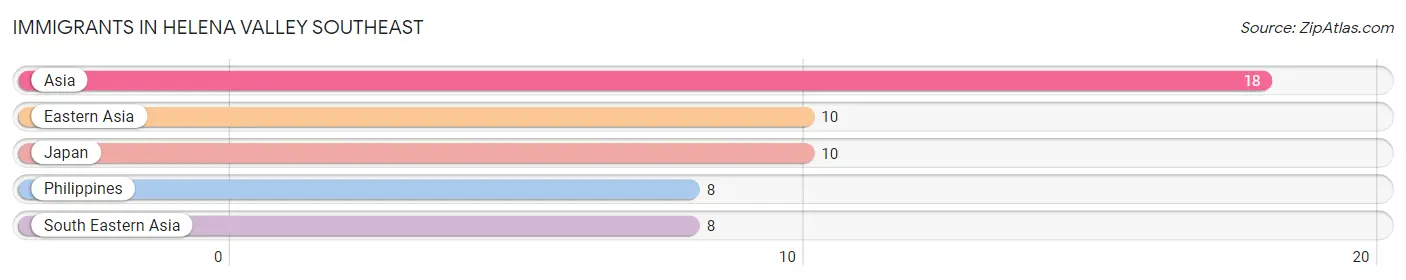
Immigrants in Helena Valley Southeast
The most numerous immigrant groups reported in Helena Valley Southeast came from Asia (18 | 0.2%), Eastern Asia (10 | 0.1%), Japan (10 | 0.1%), Philippines (8 | 0.1%), and South Eastern Asia (8 | 0.1%), together accounting for 0.6% of all Helena Valley Southeast residents.
| Immigration Origin | # Population | % Population |
| Asia | 18 | 0.2% |
| Eastern Asia | 10 | 0.1% |
| Japan | 10 | 0.1% |
| Philippines | 8 | 0.1% |
| South Eastern Asia | 8 | 0.1% | View All 5 Rows |
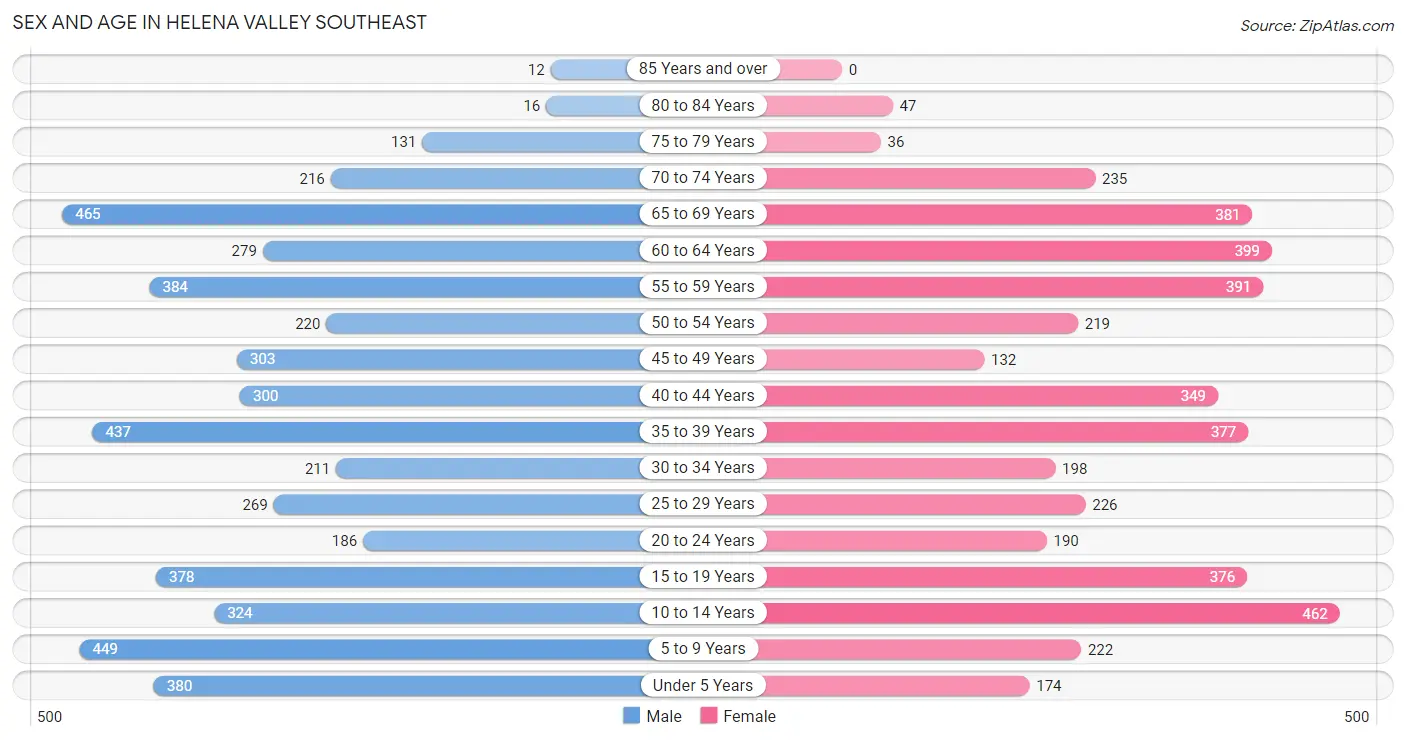
Sex and Age in Helena Valley Southeast
Sex and Age in Helena Valley Southeast
The most populous age groups in Helena Valley Southeast are 65 to 69 Years (465 | 9.4%) for men and 10 to 14 Years (462 | 10.5%) for women.
| Age Bracket | Male | Female |
| Under 5 Years | 380 (7.7%) | 174 (3.9%) |
| 5 to 9 Years | 449 (9.0%) | 222 (5.0%) |
| 10 to 14 Years | 324 (6.5%) | 462 (10.5%) |
| 15 to 19 Years | 378 (7.6%) | 376 (8.5%) |
| 20 to 24 Years | 186 (3.7%) | 190 (4.3%) |
| 25 to 29 Years | 269 (5.4%) | 226 (5.1%) |
| 30 to 34 Years | 211 (4.3%) | 198 (4.5%) |
| 35 to 39 Years | 437 (8.8%) | 377 (8.5%) |
| 40 to 44 Years | 300 (6.0%) | 349 (7.9%) |
| 45 to 49 Years | 303 (6.1%) | 132 (3.0%) |
| 50 to 54 Years | 220 (4.4%) | 219 (5.0%) |
| 55 to 59 Years | 384 (7.7%) | 391 (8.9%) |
| 60 to 64 Years | 279 (5.6%) | 399 (9.0%) |
| 65 to 69 Years | 465 (9.4%) | 381 (8.6%) |
| 70 to 74 Years | 216 (4.3%) | 235 (5.3%) |
| 75 to 79 Years | 131 (2.6%) | 36 (0.8%) |
| 80 to 84 Years | 16 (0.3%) | 47 (1.1%) |
| 85 Years and over | 12 (0.2%) | 0 (0.0%) |
| Total | 4,960 (100.0%) | 4,414 (100.0%) |
Families and Households in Helena Valley Southeast
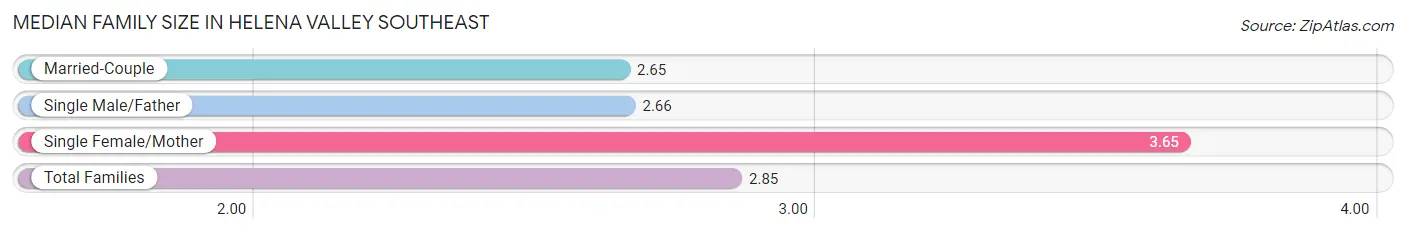
Median Family Size in Helena Valley Southeast
The median family size in Helena Valley Southeast is 2.85 persons per family, with single female/mother families (517 | 19.4%) accounting for the largest median family size of 3.65 persons per family. On the other hand, married-couple families (1,795 | 67.2%) represent the smallest median family size with 2.65 persons per family.
| Family Type | # Families | Family Size |
| Married-Couple | 1,795 (67.2%) | 2.65 |
| Single Male/Father | 359 (13.4%) | 2.66 |
| Single Female/Mother | 517 (19.4%) | 3.65 |
| Total Families | 2,671 (100.0%) | 2.85 |
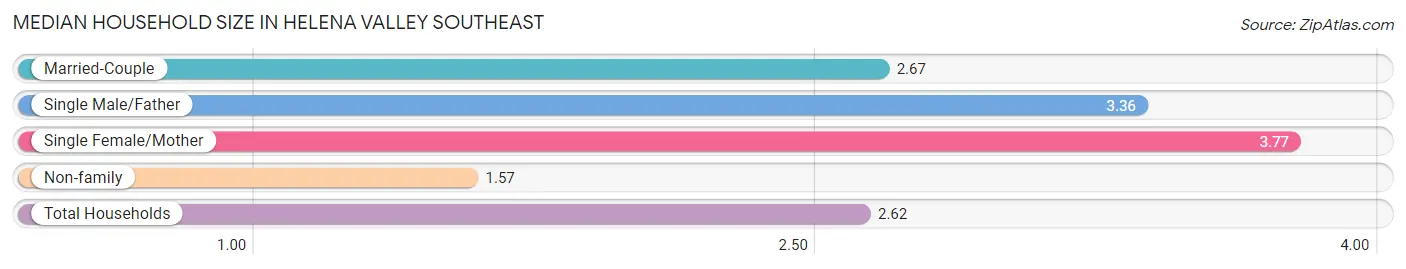
Median Household Size in Helena Valley Southeast
The median household size in Helena Valley Southeast is 2.62 persons per household, with single female/mother households (517 | 14.4%) accounting for the largest median household size of 3.77 persons per household. non-family households (911 | 25.4%) represent the smallest median household size with 1.57 persons per household.
| Household Type | # Households | Household Size |
| Married-Couple | 1,795 (50.1%) | 2.67 |
| Single Male/Father | 359 (10.0%) | 3.36 |
| Single Female/Mother | 517 (14.4%) | 3.77 |
| Non-family | 911 (25.4%) | 1.57 |
| Total Households | 3,582 (100.0%) | 2.62 |
Household Size by Marriage Status in Helena Valley Southeast
Out of a total of 3,582 households in Helena Valley Southeast, 2,671 (74.6%) are family households, while 911 (25.4%) are nonfamily households. The most numerous type of family households are 2-person households, comprising 1,427, and the most common type of nonfamily households are 1-person households, comprising 537.
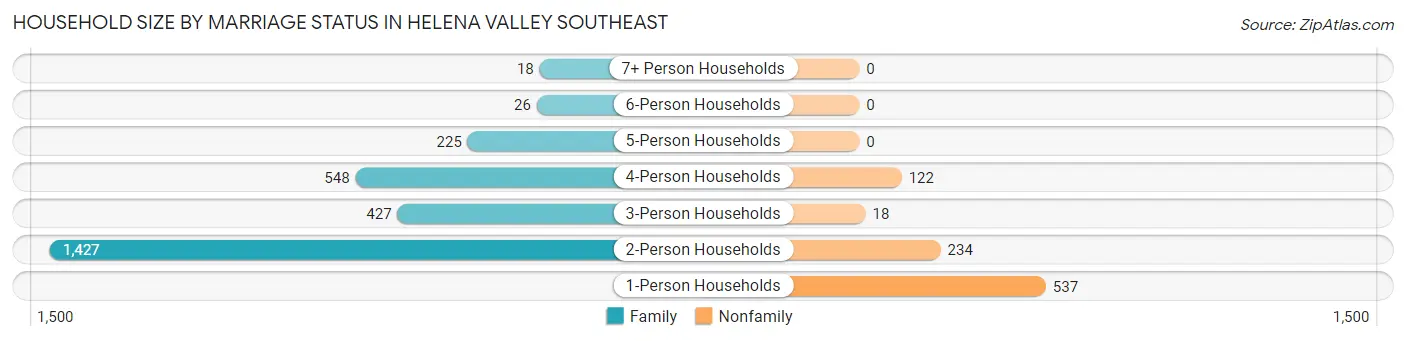
| Household Size | Family Households | Nonfamily Households |
| 1-Person Households | - | 537 (15.0%) |
| 2-Person Households | 1,427 (39.8%) | 234 (6.5%) |
| 3-Person Households | 427 (11.9%) | 18 (0.5%) |
| 4-Person Households | 548 (15.3%) | 122 (3.4%) |
| 5-Person Households | 225 (6.3%) | 0 (0.0%) |
| 6-Person Households | 26 (0.7%) | 0 (0.0%) |
| 7+ Person Households | 18 (0.5%) | 0 (0.0%) |
| Total | 2,671 (74.6%) | 911 (25.4%) |
Female Fertility in Helena Valley Southeast
Fertility by Age in Helena Valley Southeast
Average fertility rate in Helena Valley Southeast is 96.0 births per 1,000 women. Women in the age bracket of 20 to 34 years have the highest fertility rate with 241.0 births per 1,000 women. Women in the age bracket of 20 to 34 years acount for 81.8% of all women with births.
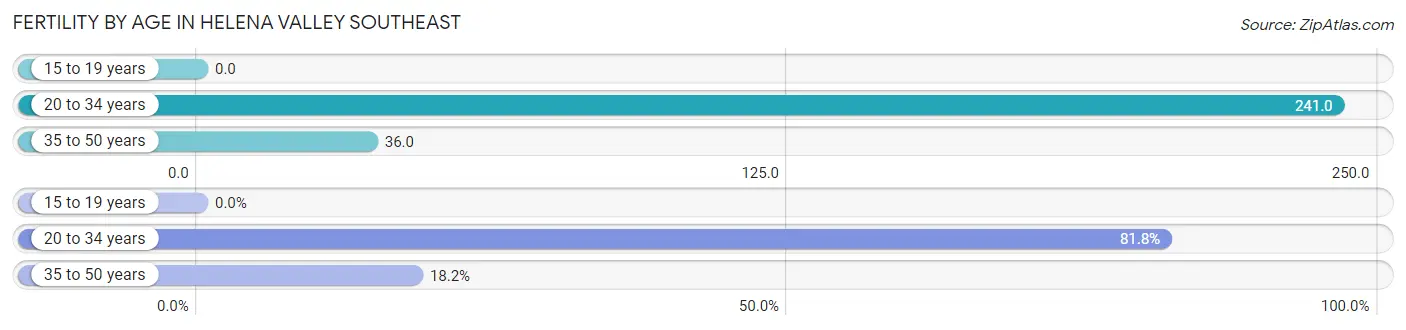
| Age Bracket | Women with Births | Births / 1,000 Women |
| 15 to 19 years | 0 (0.0%) | 0.0 |
| 20 to 34 years | 148 (81.8%) | 241.0 |
| 35 to 50 years | 33 (18.2%) | 36.0 |
| Total | 181 (100.0%) | 96.0 |
Fertility by Age by Marriage Status in Helena Valley Southeast
81.8% of women with births (181) in Helena Valley Southeast are married. The highest percentage of unmarried women with births falls into 20 to 34 years age bracket with 22.3% of them unmarried at the time of birth, while the lowest percentage of unmarried women with births belong to 35 to 50 years age bracket with 0.0% of them unmarried.
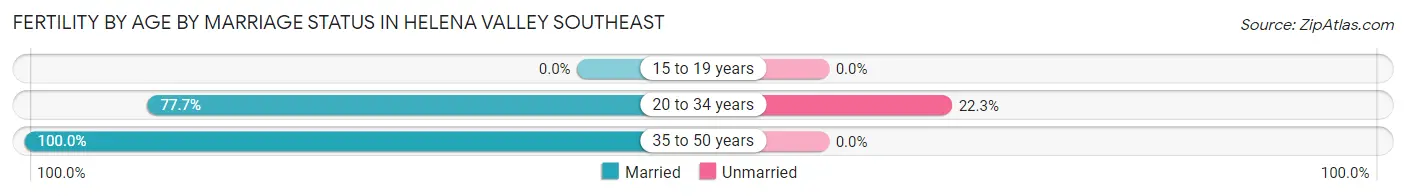
| Age Bracket | Married | Unmarried |
| 15 to 19 years | 0 (0.0%) | 0 (0.0%) |
| 20 to 34 years | 115 (77.7%) | 33 (22.3%) |
| 35 to 50 years | 33 (100.0%) | 0 (0.0%) |
| Total | 148 (81.8%) | 33 (18.2%) |
Fertility by Education in Helena Valley Southeast
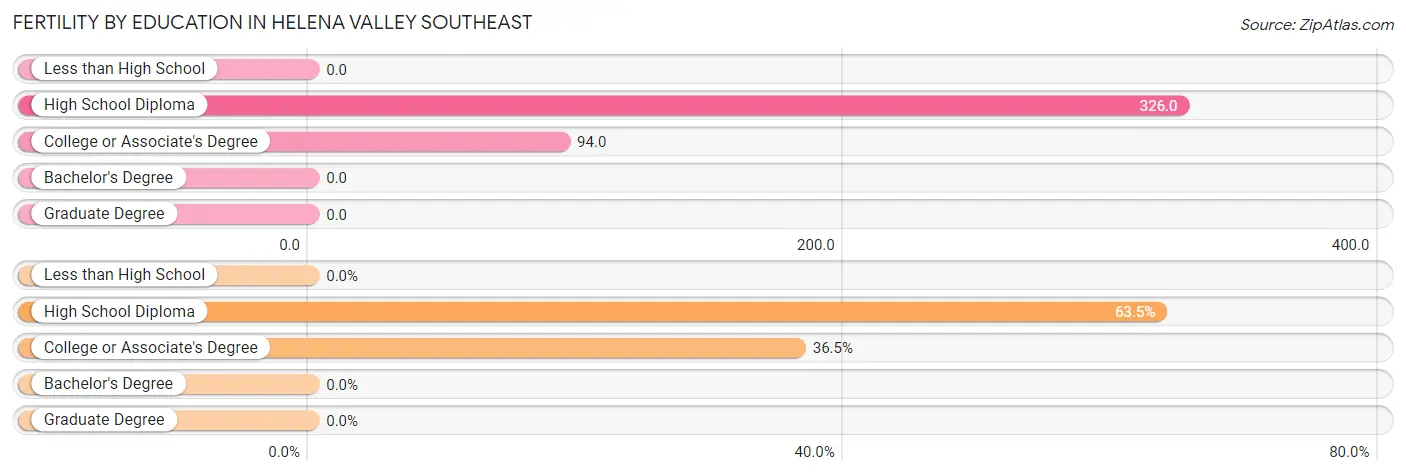
| Educational Attainment | Women with Births | Births / 1,000 Women |
| Less than High School | 0 (0.0%) | 0.0 |
| High School Diploma | 115 (63.5%) | 326.0 |
| College or Associate's Degree | 66 (36.5%) | 94.0 |
| Bachelor's Degree | 0 (0.0%) | 0.0 |
| Graduate Degree | 0 (0.0%) | 0.0 |
| Total | 181 (100.0%) | 96.0 |
Fertility by Education by Marriage Status in Helena Valley Southeast
18.2% of women with births in Helena Valley Southeast are unmarried. Women with the educational attainment of high school diploma are most likely to be married with 100.0% of them married at childbirth, while women with the educational attainment of college or associate's degree are least likely to be married with 50.0% of them unmarried at childbirth.
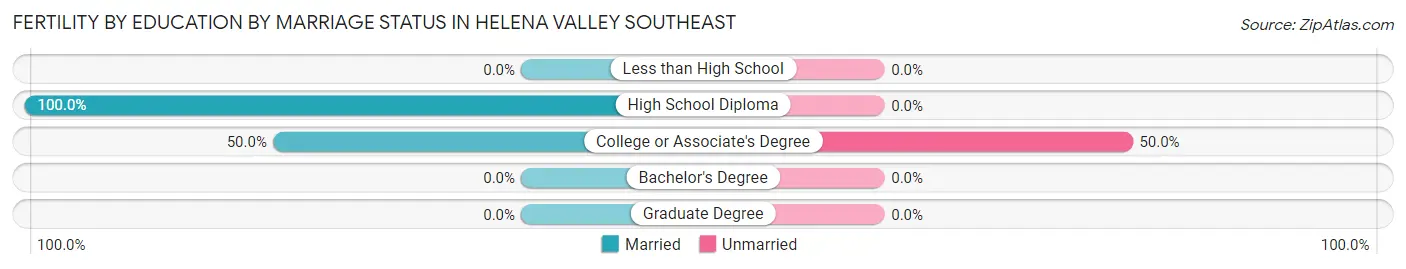
| Educational Attainment | Married | Unmarried |
| Less than High School | 0 (0.0%) | 0 (0.0%) |
| High School Diploma | 115 (100.0%) | 0 (0.0%) |
| College or Associate's Degree | 33 (50.0%) | 33 (50.0%) |
| Bachelor's Degree | 0 (0.0%) | 0 (0.0%) |
| Graduate Degree | 0 (0.0%) | 0 (0.0%) |
| Total | 148 (81.8%) | 33 (18.2%) |
Employment Characteristics in Helena Valley Southeast
Employment by Class of Employer in Helena Valley Southeast
Among the 4,339 employed individuals in Helena Valley Southeast, private company employees (2,357 | 54.3%), state government employees (674 | 15.5%), and federal government employees (368 | 8.5%) make up the most common classes of employment.
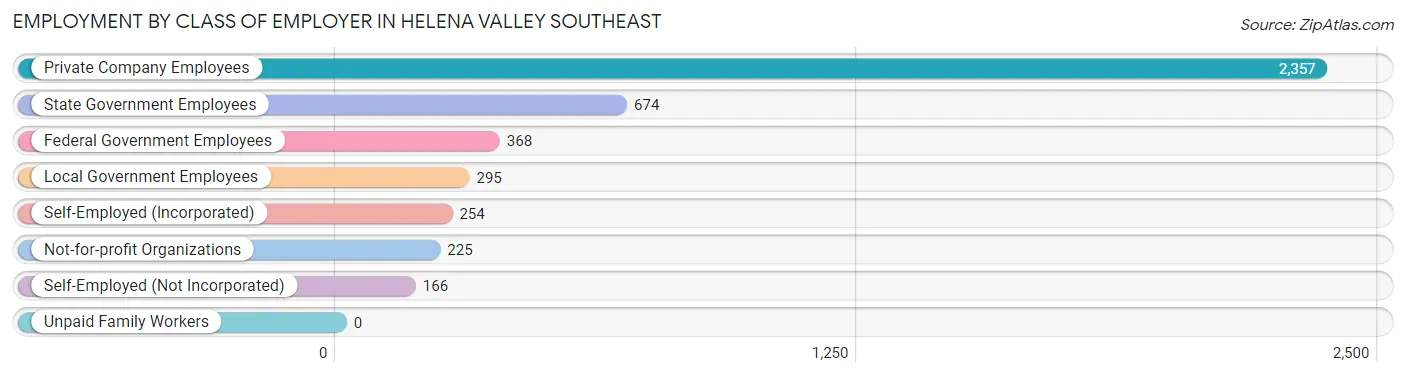
| Employer Class | # Employees | % Employees |
| Private Company Employees | 2,357 | 54.3% |
| Self-Employed (Incorporated) | 254 | 5.9% |
| Self-Employed (Not Incorporated) | 166 | 3.8% |
| Not-for-profit Organizations | 225 | 5.2% |
| Local Government Employees | 295 | 6.8% |
| State Government Employees | 674 | 15.5% |
| Federal Government Employees | 368 | 8.5% |
| Unpaid Family Workers | 0 | 0.0% |
| Total | 4,339 | 100.0% |
Employment Status by Age in Helena Valley Southeast
According to the labor force statistics for Helena Valley Southeast, out of the total population over 16 years of age (7,005), 66.7% or 4,672 individuals are in the labor force, with 5.1% or 238 of them unemployed. The age group with the highest labor force participation rate is 25 to 29 years, with 91.7% or 454 individuals in the labor force. Within the labor force, the 25 to 29 years age range has the highest percentage of unemployed individuals, with 18.3% or 83 of them being unemployed.
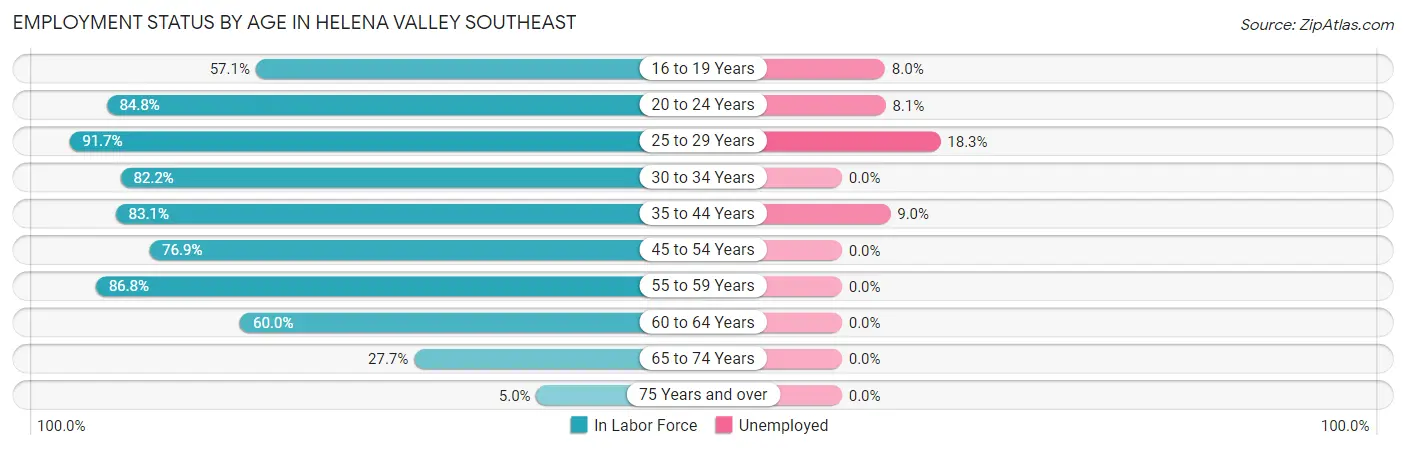
| Age Bracket | In Labor Force | Unemployed |
| 16 to 19 Years | 226 (57.1%) | 18 (8.0%) |
| 20 to 24 Years | 319 (84.8%) | 26 (8.1%) |
| 25 to 29 Years | 454 (91.7%) | 83 (18.3%) |
| 30 to 34 Years | 336 (82.2%) | 0 (0.0%) |
| 35 to 44 Years | 1,216 (83.1%) | 109 (9.0%) |
| 45 to 54 Years | 672 (76.9%) | 0 (0.0%) |
| 55 to 59 Years | 673 (86.8%) | 0 (0.0%) |
| 60 to 64 Years | 407 (60.0%) | 0 (0.0%) |
| 65 to 74 Years | 359 (27.7%) | 0 (0.0%) |
| 75 Years and over | 12 (5.0%) | 0 (0.0%) |
| Total | 4,672 (66.7%) | 238 (5.1%) |
Employment Status by Educational Attainment in Helena Valley Southeast
According to labor force statistics for Helena Valley Southeast, 80.1% of individuals (3,760) out of the total population between 25 and 64 years of age (4,694) are in the labor force, with 5.2% or 196 of them being unemployed. The group with the highest labor force participation rate are those with the educational attainment of bachelor's degree or higher, with 89.1% or 828 individuals in the labor force. Within the labor force, individuals with less than high school education have the highest percentage of unemployment, with 18.2% or 52 of them being unemployed.
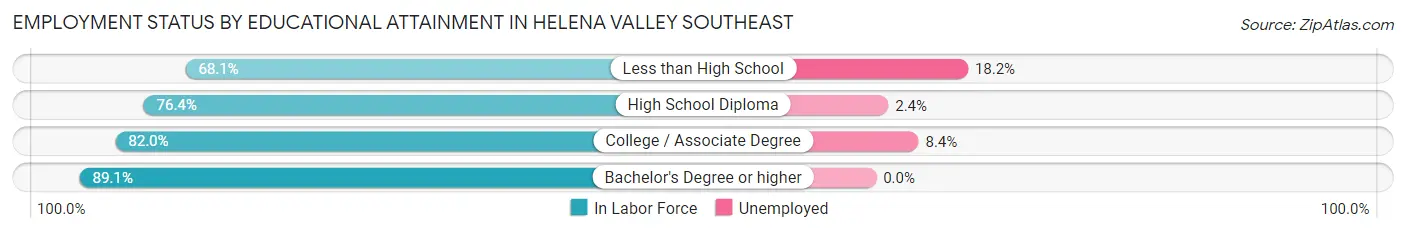
| Educational Attainment | In Labor Force | Unemployed |
| Less than High School | 286 (68.1%) | 76 (18.2%) |
| High School Diploma | 1,336 (76.4%) | 42 (2.4%) |
| College / Associate Degree | 1,309 (82.0%) | 134 (8.4%) |
| Bachelor's Degree or higher | 828 (89.1%) | 0 (0.0%) |
| Total | 3,760 (80.1%) | 244 (5.2%) |
Employment Occupations by Sex in Helena Valley Southeast
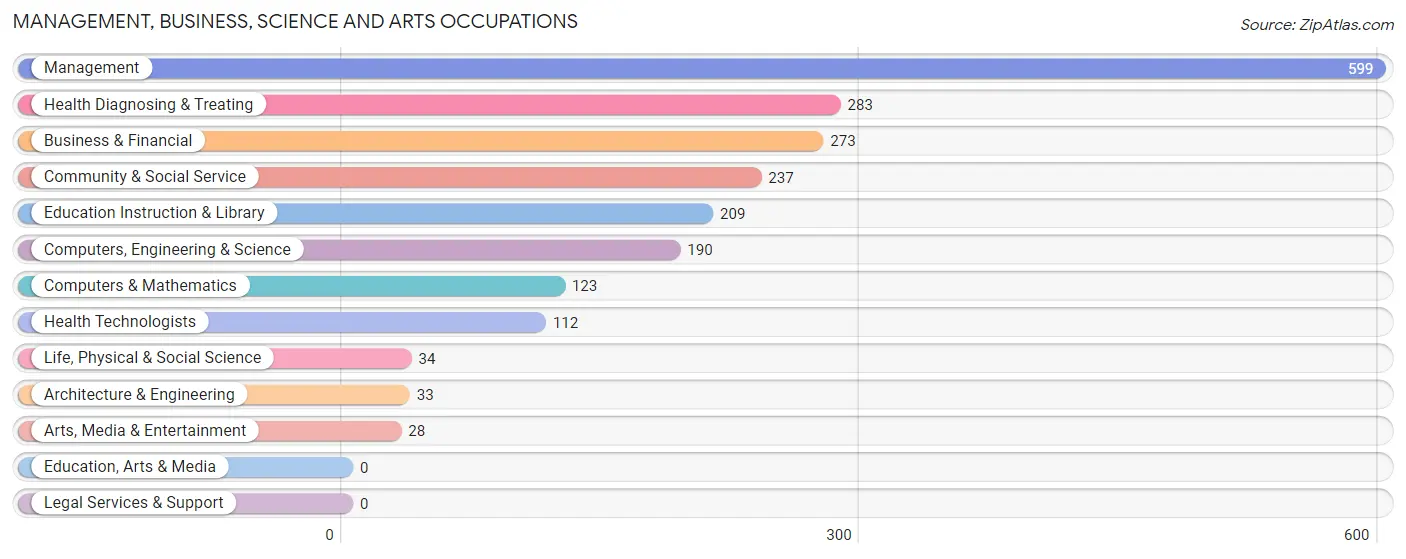
Management, Business, Science and Arts Occupations
The most common Management, Business, Science and Arts occupations in Helena Valley Southeast are Management (599 | 13.6%), Health Diagnosing & Treating (283 | 6.4%), Business & Financial (273 | 6.2%), Community & Social Service (237 | 5.4%), and Education Instruction & Library (209 | 4.8%).
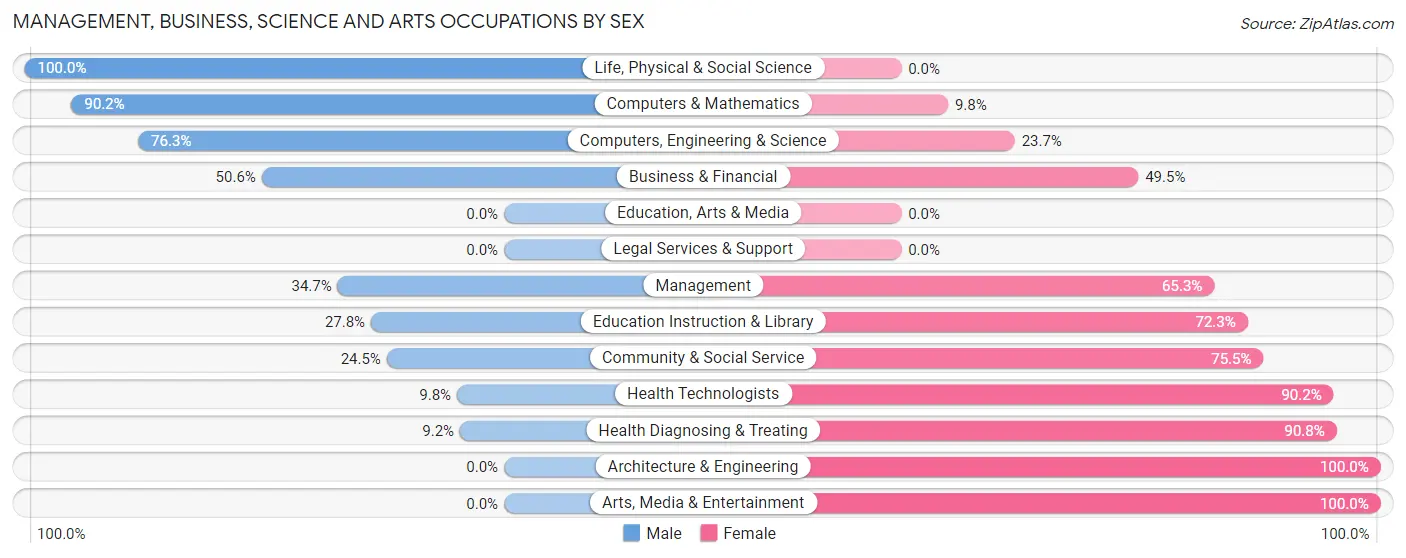
Management, Business, Science and Arts Occupations by Sex
Within the Management, Business, Science and Arts occupations in Helena Valley Southeast, the most male-oriented occupations are Life, Physical & Social Science (100.0%), Computers & Mathematics (90.2%), and Computers, Engineering & Science (76.3%), while the most female-oriented occupations are Architecture & Engineering (100.0%), Arts, Media & Entertainment (100.0%), and Health Diagnosing & Treating (90.8%).
| Occupation | Male | Female |
| Management | 208 (34.7%) | 391 (65.3%) |
| Business & Financial | 138 (50.5%) | 135 (49.4%) |
| Computers, Engineering & Science | 145 (76.3%) | 45 (23.7%) |
| Computers & Mathematics | 111 (90.2%) | 12 (9.8%) |
| Architecture & Engineering | 0 (0.0%) | 33 (100.0%) |
| Life, Physical & Social Science | 34 (100.0%) | 0 (0.0%) |
| Community & Social Service | 58 (24.5%) | 179 (75.5%) |
| Education, Arts & Media | 0 (0.0%) | 0 (0.0%) |
| Legal Services & Support | 0 (0.0%) | 0 (0.0%) |
| Education Instruction & Library | 58 (27.8%) | 151 (72.3%) |
| Arts, Media & Entertainment | 0 (0.0%) | 28 (100.0%) |
| Health Diagnosing & Treating | 26 (9.2%) | 257 (90.8%) |
| Health Technologists | 11 (9.8%) | 101 (90.2%) |
| Total (Category) | 575 (36.3%) | 1,007 (63.6%) |
| Total (Overall) | 2,507 (56.9%) | 1,897 (43.1%) |
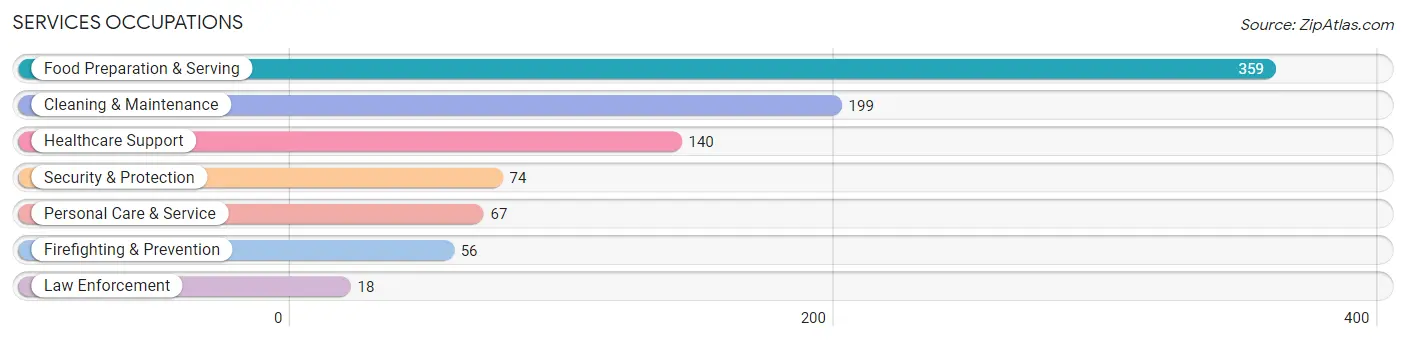
Services Occupations
The most common Services occupations in Helena Valley Southeast are Food Preparation & Serving (359 | 8.2%), Cleaning & Maintenance (199 | 4.5%), Healthcare Support (140 | 3.2%), Security & Protection (74 | 1.7%), and Personal Care & Service (67 | 1.5%).
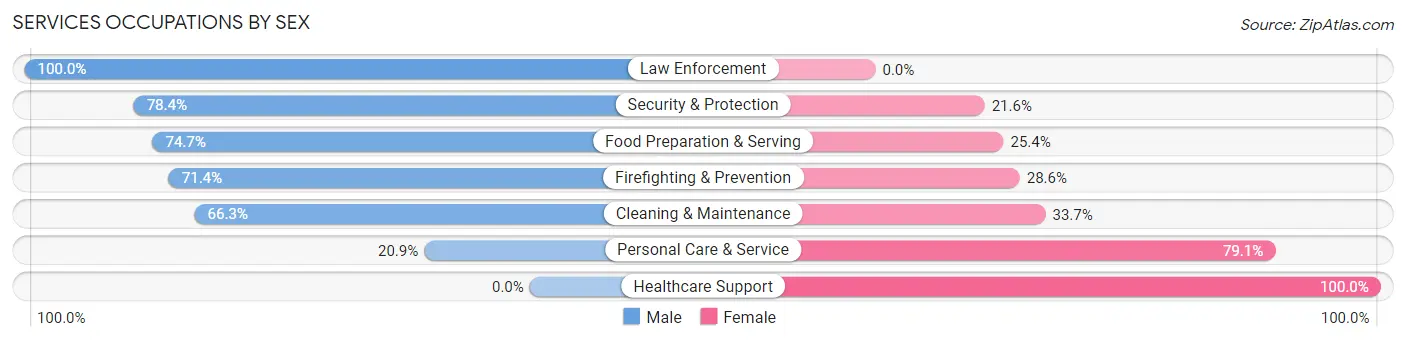
Services Occupations by Sex
Within the Services occupations in Helena Valley Southeast, the most male-oriented occupations are Law Enforcement (100.0%), Security & Protection (78.4%), and Food Preparation & Serving (74.7%), while the most female-oriented occupations are Healthcare Support (100.0%), Personal Care & Service (79.1%), and Cleaning & Maintenance (33.7%).
| Occupation | Male | Female |
| Healthcare Support | 0 (0.0%) | 140 (100.0%) |
| Security & Protection | 58 (78.4%) | 16 (21.6%) |
| Firefighting & Prevention | 40 (71.4%) | 16 (28.6%) |
| Law Enforcement | 18 (100.0%) | 0 (0.0%) |
| Food Preparation & Serving | 268 (74.7%) | 91 (25.4%) |
| Cleaning & Maintenance | 132 (66.3%) | 67 (33.7%) |
| Personal Care & Service | 14 (20.9%) | 53 (79.1%) |
| Total (Category) | 472 (56.3%) | 367 (43.7%) |
| Total (Overall) | 2,507 (56.9%) | 1,897 (43.1%) |
Sales and Office Occupations
The most common Sales and Office occupations in Helena Valley Southeast are Office & Administration (555 | 12.6%), and Sales & Related (271 | 6.1%).
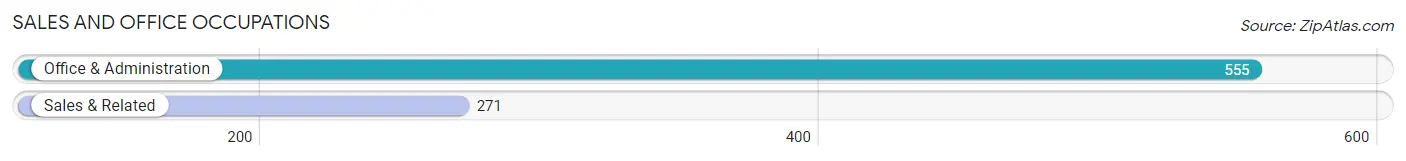
Sales and Office Occupations by Sex
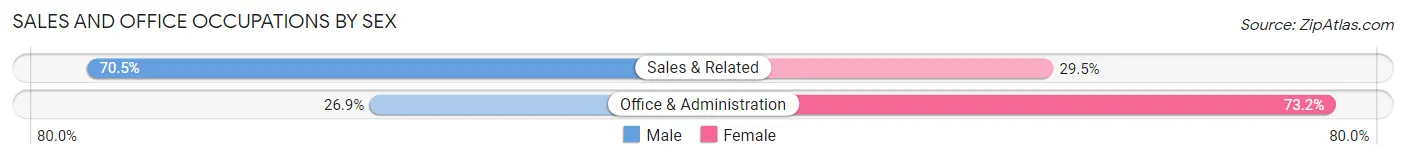
| Occupation | Male | Female |
| Sales & Related | 191 (70.5%) | 80 (29.5%) |
| Office & Administration | 149 (26.9%) | 406 (73.2%) |
| Total (Category) | 340 (41.2%) | 486 (58.8%) |
| Total (Overall) | 2,507 (56.9%) | 1,897 (43.1%) |
Natural Resources, Construction and Maintenance Occupations
The most common Natural Resources, Construction and Maintenance occupations in Helena Valley Southeast are Construction & Extraction (513 | 11.7%), Installation, Maintenance & Repair (99 | 2.2%), and Farming, Fishing & Forestry (32 | 0.7%).
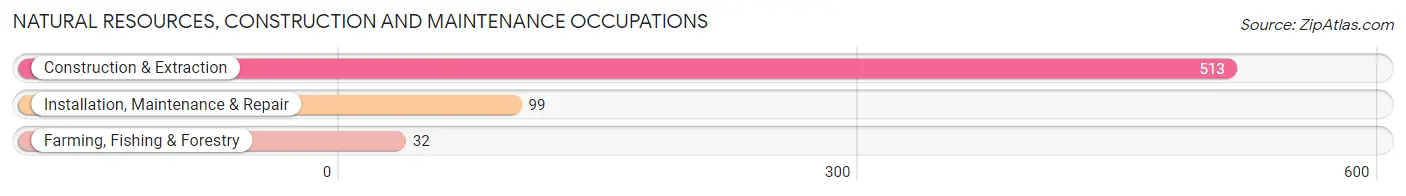
Natural Resources, Construction and Maintenance Occupations by Sex
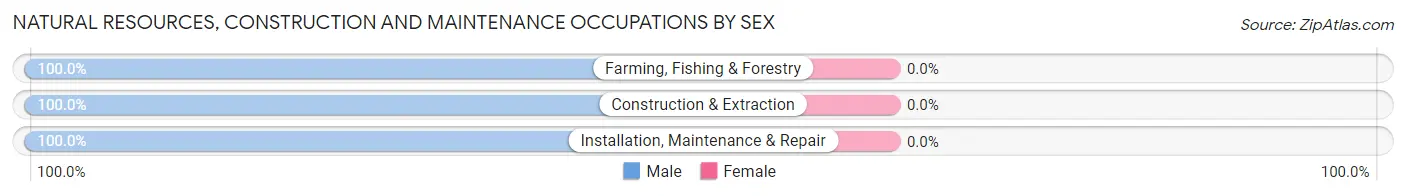
| Occupation | Male | Female |
| Farming, Fishing & Forestry | 32 (100.0%) | 0 (0.0%) |
| Construction & Extraction | 513 (100.0%) | 0 (0.0%) |
| Installation, Maintenance & Repair | 99 (100.0%) | 0 (0.0%) |
| Total (Category) | 644 (100.0%) | 0 (0.0%) |
| Total (Overall) | 2,507 (56.9%) | 1,897 (43.1%) |
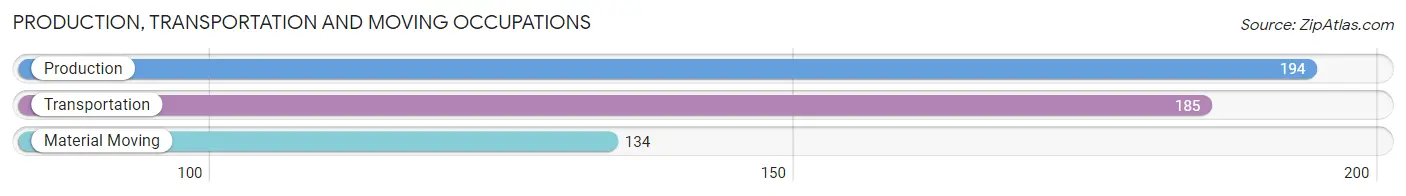
Production, Transportation and Moving Occupations
The most common Production, Transportation and Moving occupations in Helena Valley Southeast are Production (194 | 4.4%), Transportation (185 | 4.2%), and Material Moving (134 | 3.0%).
Production, Transportation and Moving Occupations by Sex
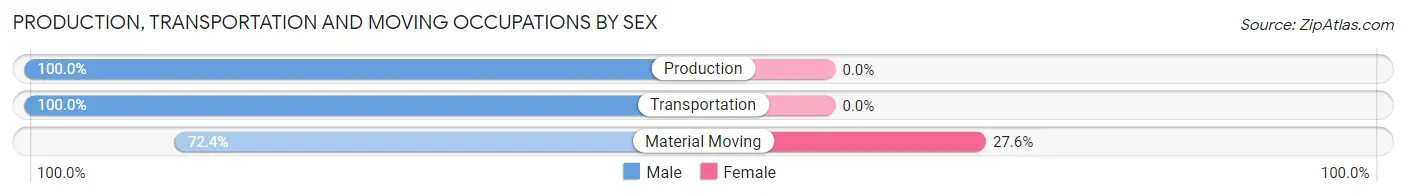
| Occupation | Male | Female |
| Production | 194 (100.0%) | 0 (0.0%) |
| Transportation | 185 (100.0%) | 0 (0.0%) |
| Material Moving | 97 (72.4%) | 37 (27.6%) |
| Total (Category) | 476 (92.8%) | 37 (7.2%) |
| Total (Overall) | 2,507 (56.9%) | 1,897 (43.1%) |
Employment Industries by Sex in Helena Valley Southeast
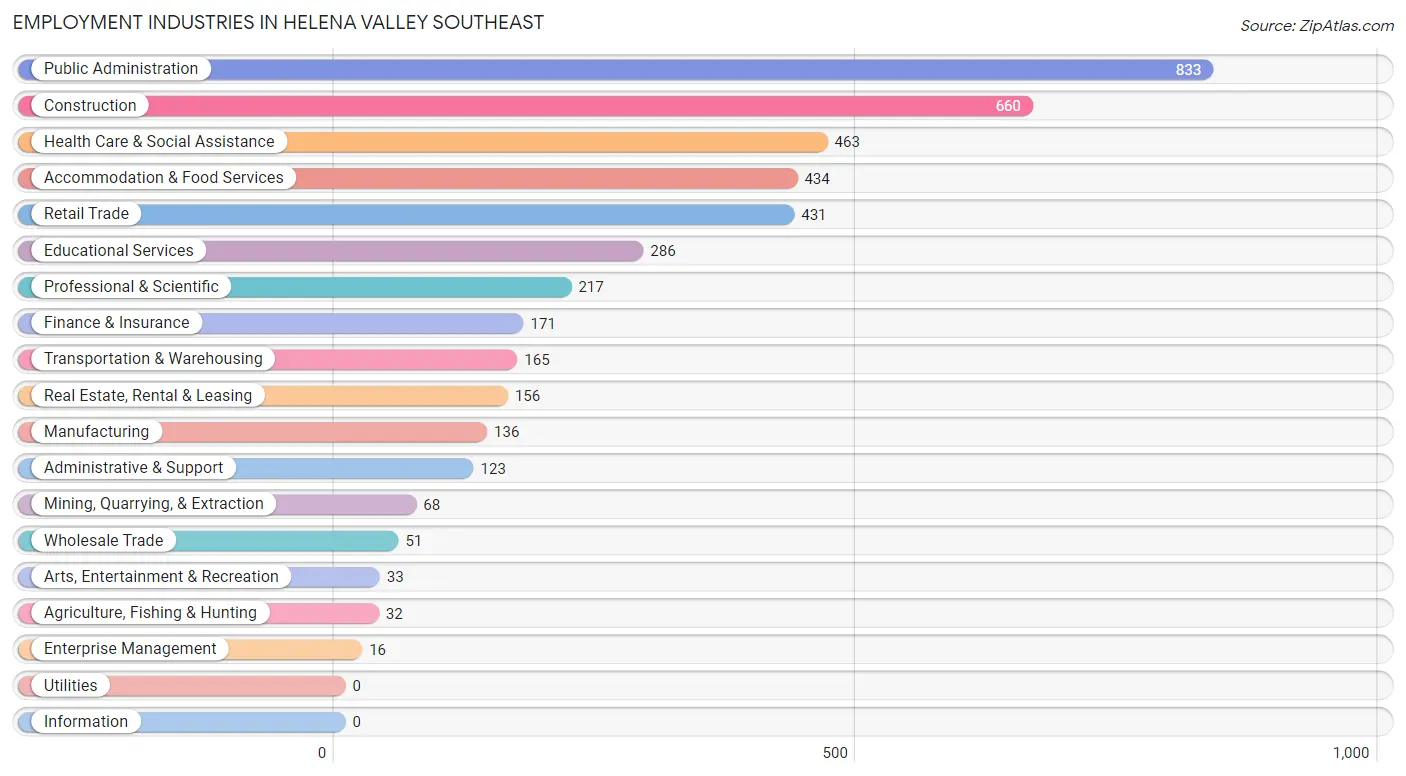
Employment Industries in Helena Valley Southeast
The major employment industries in Helena Valley Southeast include Public Administration (833 | 18.9%), Construction (660 | 15.0%), Health Care & Social Assistance (463 | 10.5%), Accommodation & Food Services (434 | 9.9%), and Retail Trade (431 | 9.8%).
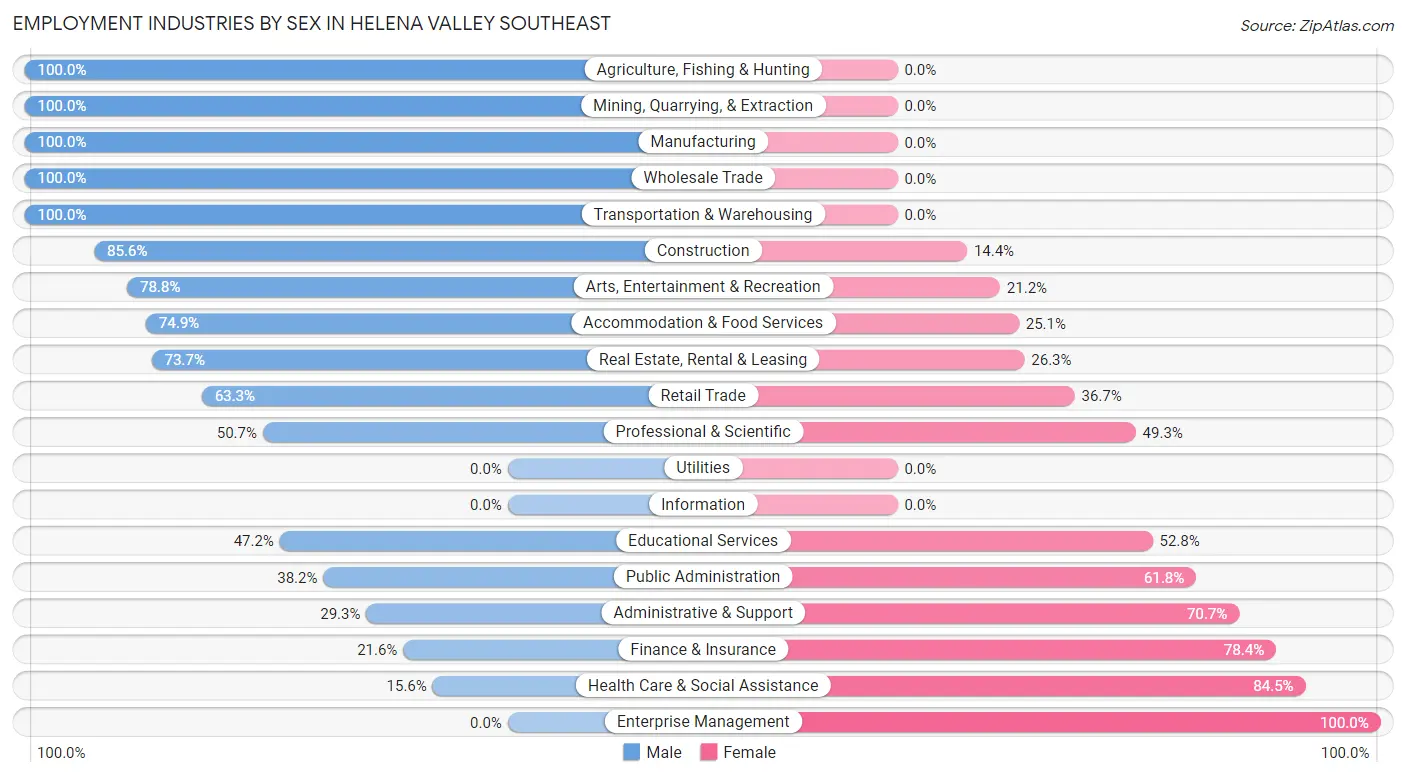
Employment Industries by Sex in Helena Valley Southeast
The Helena Valley Southeast industries that see more men than women are Agriculture, Fishing & Hunting (100.0%), Mining, Quarrying, & Extraction (100.0%), and Manufacturing (100.0%), whereas the industries that tend to have a higher number of women are Enterprise Management (100.0%), Health Care & Social Assistance (84.5%), and Finance & Insurance (78.4%).
| Industry | Male | Female |
| Agriculture, Fishing & Hunting | 32 (100.0%) | 0 (0.0%) |
| Mining, Quarrying, & Extraction | 68 (100.0%) | 0 (0.0%) |
| Construction | 565 (85.6%) | 95 (14.4%) |
| Manufacturing | 136 (100.0%) | 0 (0.0%) |
| Wholesale Trade | 51 (100.0%) | 0 (0.0%) |
| Retail Trade | 273 (63.3%) | 158 (36.7%) |
| Transportation & Warehousing | 165 (100.0%) | 0 (0.0%) |
| Utilities | 0 (0.0%) | 0 (0.0%) |
| Information | 0 (0.0%) | 0 (0.0%) |
| Finance & Insurance | 37 (21.6%) | 134 (78.4%) |
| Real Estate, Rental & Leasing | 115 (73.7%) | 41 (26.3%) |
| Professional & Scientific | 110 (50.7%) | 107 (49.3%) |
| Enterprise Management | 0 (0.0%) | 16 (100.0%) |
| Administrative & Support | 36 (29.3%) | 87 (70.7%) |
| Educational Services | 135 (47.2%) | 151 (52.8%) |
| Health Care & Social Assistance | 72 (15.5%) | 391 (84.5%) |
| Arts, Entertainment & Recreation | 26 (78.8%) | 7 (21.2%) |
| Accommodation & Food Services | 325 (74.9%) | 109 (25.1%) |
| Public Administration | 318 (38.2%) | 515 (61.8%) |
| Total | 2,507 (56.9%) | 1,897 (43.1%) |
Education in Helena Valley Southeast
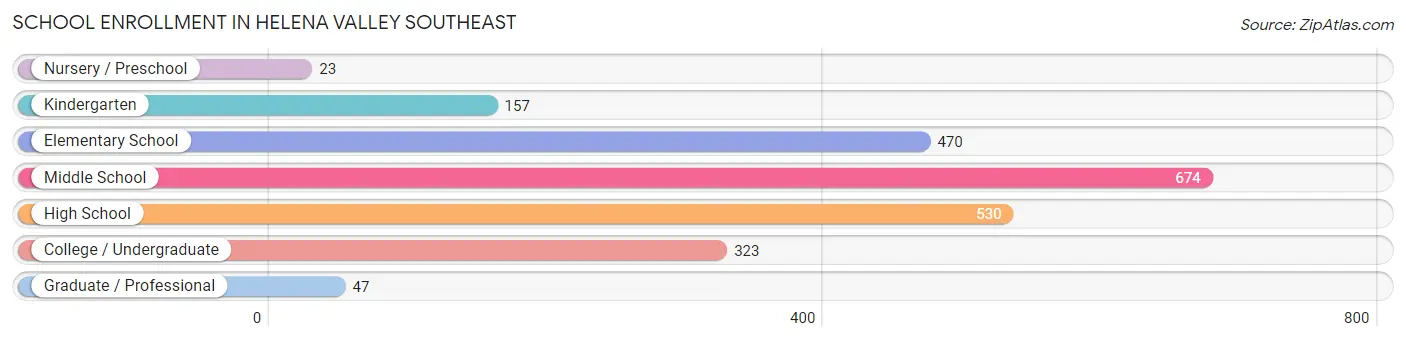
School Enrollment in Helena Valley Southeast
The most common levels of schooling among the 2,224 students in Helena Valley Southeast are middle school (674 | 30.3%), high school (530 | 23.8%), and elementary school (470 | 21.1%).
| School Level | # Students | % Students |
| Nursery / Preschool | 23 | 1.0% |
| Kindergarten | 157 | 7.1% |
| Elementary School | 470 | 21.1% |
| Middle School | 674 | 30.3% |
| High School | 530 | 23.8% |
| College / Undergraduate | 323 | 14.5% |
| Graduate / Professional | 47 | 2.1% |
| Total | 2,224 | 100.0% |
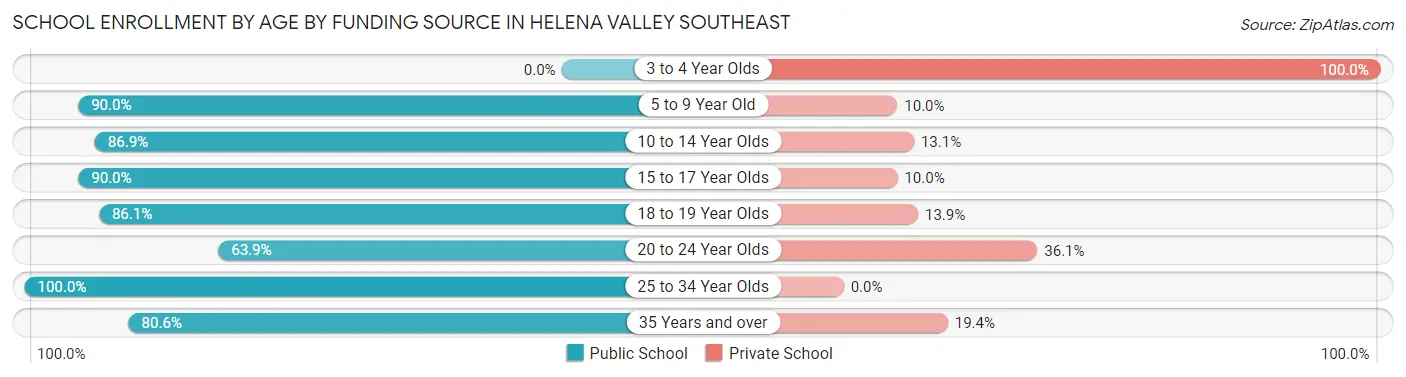
School Enrollment by Age by Funding Source in Helena Valley Southeast
Out of a total of 2,224 students who are enrolled in schools in Helena Valley Southeast, 311 (14.0%) attend a private institution, while the remaining 1,913 (86.0%) are enrolled in public schools. The age group of 3 to 4 year olds has the highest likelihood of being enrolled in private schools, with 23 (100.0% in the age bracket) enrolled. Conversely, the age group of 25 to 34 year olds has the lowest likelihood of being enrolled in a private school, with 32 (100.0% in the age bracket) attending a public institution.
| Age Bracket | Public School | Private School |
| 3 to 4 Year Olds | 0 (0.0%) | 23 (100.0%) |
| 5 to 9 Year Old | 513 (90.0%) | 57 (10.0%) |
| 10 to 14 Year Olds | 683 (86.9%) | 103 (13.1%) |
| 15 to 17 Year Olds | 377 (90.0%) | 42 (10.0%) |
| 18 to 19 Year Olds | 87 (86.1%) | 14 (13.9%) |
| 20 to 24 Year Olds | 62 (63.9%) | 35 (36.1%) |
| 25 to 34 Year Olds | 32 (100.0%) | 0 (0.0%) |
| 35 Years and over | 158 (80.6%) | 38 (19.4%) |
| Total | 1,913 (86.0%) | 311 (14.0%) |
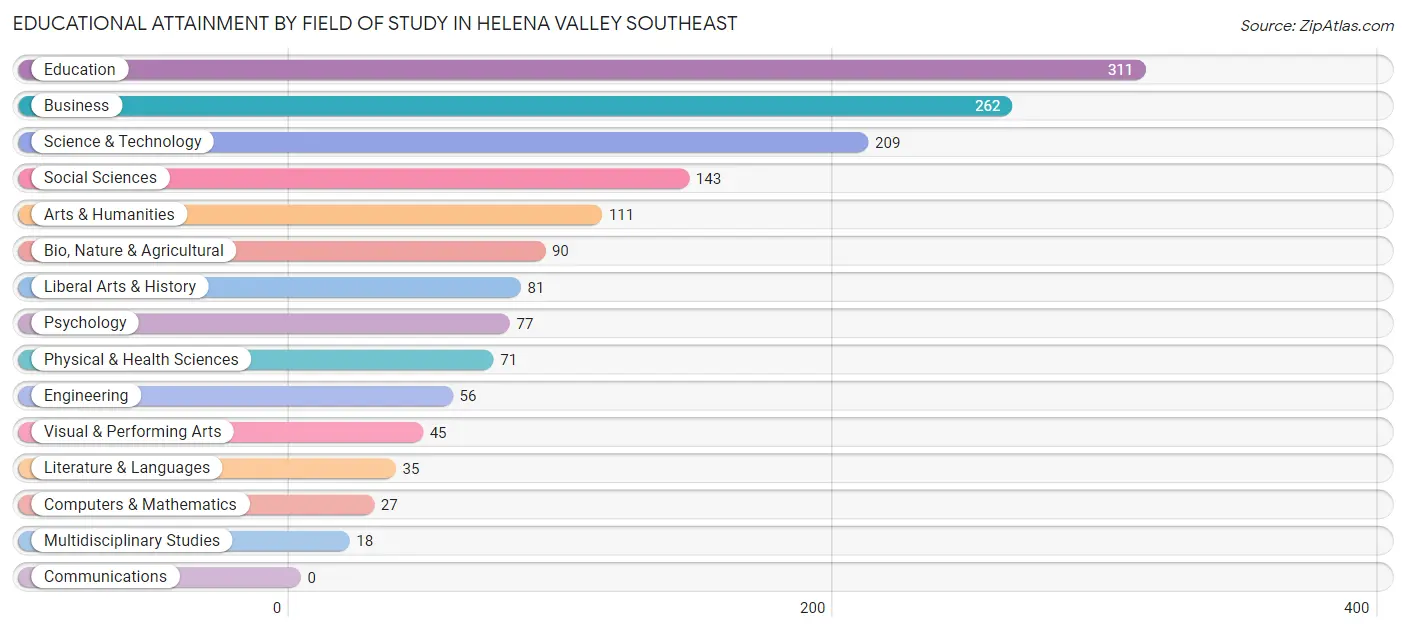
Educational Attainment by Field of Study in Helena Valley Southeast
Education (311 | 20.3%), business (262 | 17.1%), science & technology (209 | 13.6%), social sciences (143 | 9.3%), and arts & humanities (111 | 7.2%) are the most common fields of study among 1,536 individuals in Helena Valley Southeast who have obtained a bachelor's degree or higher.
| Field of Study | # Graduates | % Graduates |
| Computers & Mathematics | 27 | 1.8% |
| Bio, Nature & Agricultural | 90 | 5.9% |
| Physical & Health Sciences | 71 | 4.6% |
| Psychology | 77 | 5.0% |
| Social Sciences | 143 | 9.3% |
| Engineering | 56 | 3.6% |
| Multidisciplinary Studies | 18 | 1.2% |
| Science & Technology | 209 | 13.6% |
| Business | 262 | 17.1% |
| Education | 311 | 20.3% |
| Literature & Languages | 35 | 2.3% |
| Liberal Arts & History | 81 | 5.3% |
| Visual & Performing Arts | 45 | 2.9% |
| Communications | 0 | 0.0% |
| Arts & Humanities | 111 | 7.2% |
| Total | 1,536 | 100.0% |
Transportation & Commute in Helena Valley Southeast
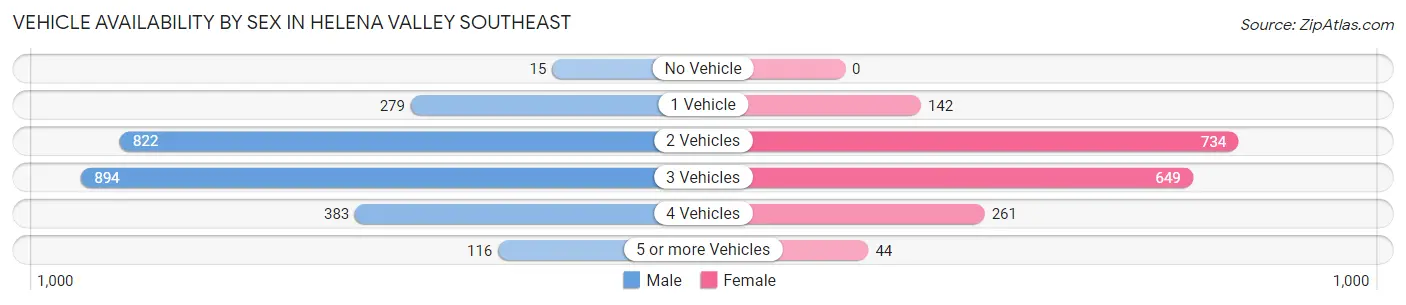
Vehicle Availability by Sex in Helena Valley Southeast
The most prevalent vehicle ownership categories in Helena Valley Southeast are males with 3 vehicles (894, accounting for 35.6%) and females with 3 vehicles (649, making up 48.8%).
| Vehicles Available | Male | Female |
| No Vehicle | 15 (0.6%) | 0 (0.0%) |
| 1 Vehicle | 279 (11.1%) | 142 (7.8%) |
| 2 Vehicles | 822 (32.8%) | 734 (40.1%) |
| 3 Vehicles | 894 (35.6%) | 649 (35.5%) |
| 4 Vehicles | 383 (15.3%) | 261 (14.3%) |
| 5 or more Vehicles | 116 (4.6%) | 44 (2.4%) |
| Total | 2,509 (100.0%) | 1,830 (100.0%) |
Commute Time in Helena Valley Southeast
The most frequently occuring commute durations in Helena Valley Southeast are 15 to 19 minutes (1,383 commuters, 34.6%), 20 to 24 minutes (876 commuters, 21.9%), and 10 to 14 minutes (737 commuters, 18.5%).
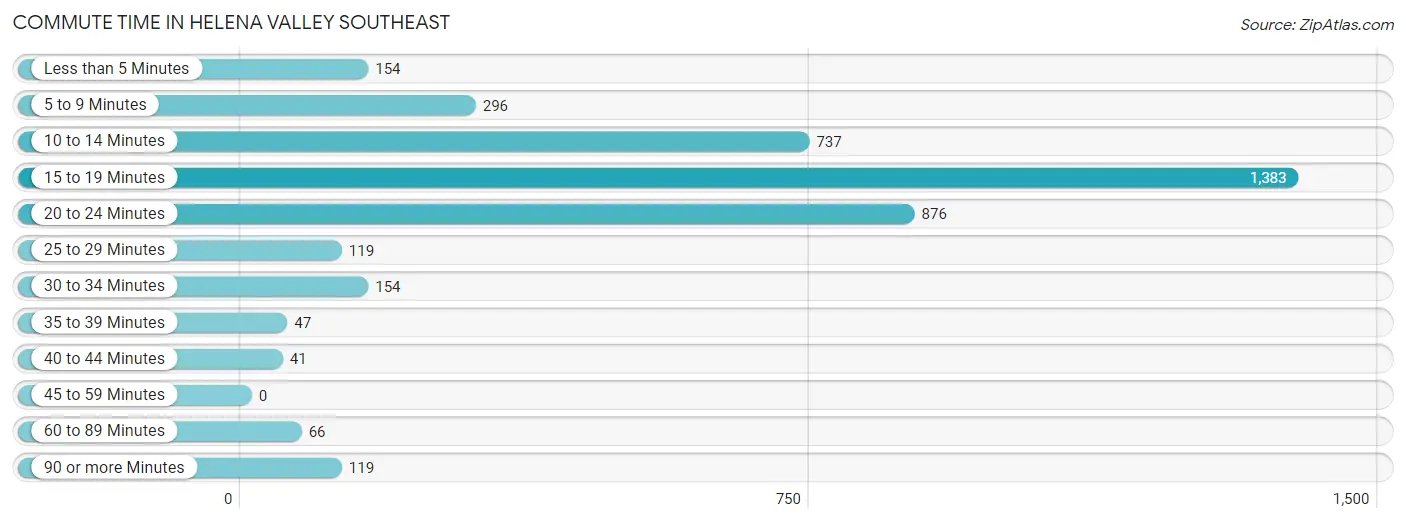
| Commute Time | # Commuters | % Commuters |
| Less than 5 Minutes | 154 | 3.9% |
| 5 to 9 Minutes | 296 | 7.4% |
| 10 to 14 Minutes | 737 | 18.5% |
| 15 to 19 Minutes | 1,383 | 34.6% |
| 20 to 24 Minutes | 876 | 21.9% |
| 25 to 29 Minutes | 119 | 3.0% |
| 30 to 34 Minutes | 154 | 3.9% |
| 35 to 39 Minutes | 47 | 1.2% |
| 40 to 44 Minutes | 41 | 1.0% |
| 45 to 59 Minutes | 0 | 0.0% |
| 60 to 89 Minutes | 66 | 1.7% |
| 90 or more Minutes | 119 | 3.0% |
Commute Time by Sex in Helena Valley Southeast
The most common commute times in Helena Valley Southeast are 15 to 19 minutes (868 commuters, 37.3%) for males and 20 to 24 minutes (582 commuters, 34.9%) for females.
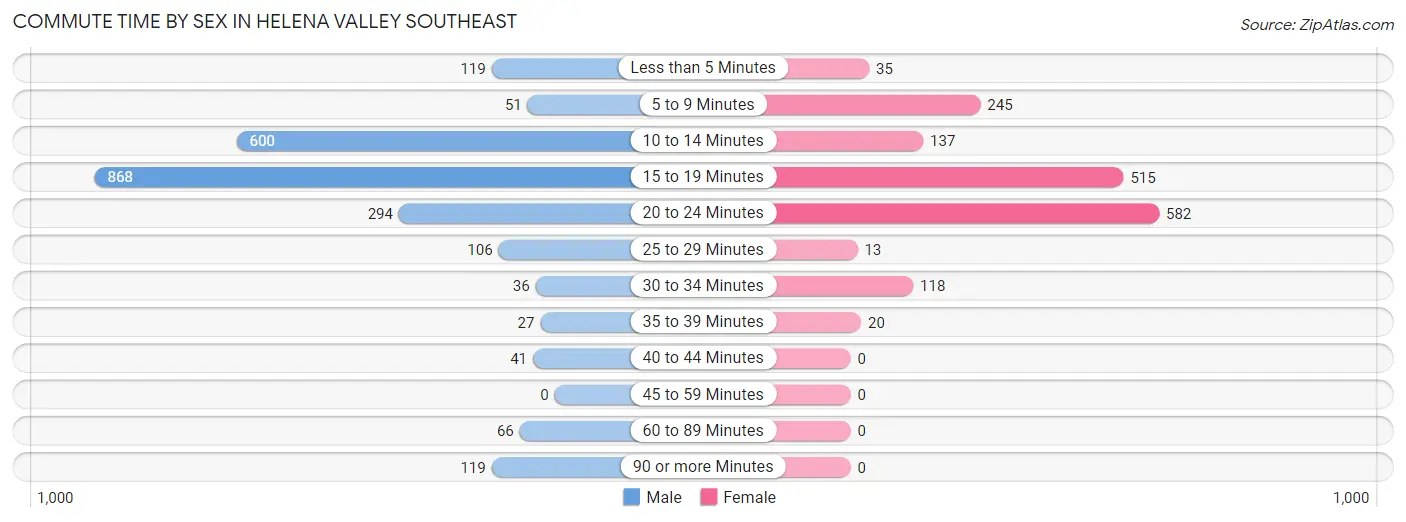
| Commute Time | Male | Female |
| Less than 5 Minutes | 119 (5.1%) | 35 (2.1%) |
| 5 to 9 Minutes | 51 (2.2%) | 245 (14.7%) |
| 10 to 14 Minutes | 600 (25.8%) | 137 (8.2%) |
| 15 to 19 Minutes | 868 (37.3%) | 515 (30.9%) |
| 20 to 24 Minutes | 294 (12.6%) | 582 (34.9%) |
| 25 to 29 Minutes | 106 (4.6%) | 13 (0.8%) |
| 30 to 34 Minutes | 36 (1.5%) | 118 (7.1%) |
| 35 to 39 Minutes | 27 (1.2%) | 20 (1.2%) |
| 40 to 44 Minutes | 41 (1.8%) | 0 (0.0%) |
| 45 to 59 Minutes | 0 (0.0%) | 0 (0.0%) |
| 60 to 89 Minutes | 66 (2.8%) | 0 (0.0%) |
| 90 or more Minutes | 119 (5.1%) | 0 (0.0%) |
Time of Departure to Work by Sex in Helena Valley Southeast
The most frequent times of departure to work in Helena Valley Southeast are 7:30 AM to 7:59 AM (602, 25.9%) for males and 7:30 AM to 7:59 AM (382, 22.9%) for females.
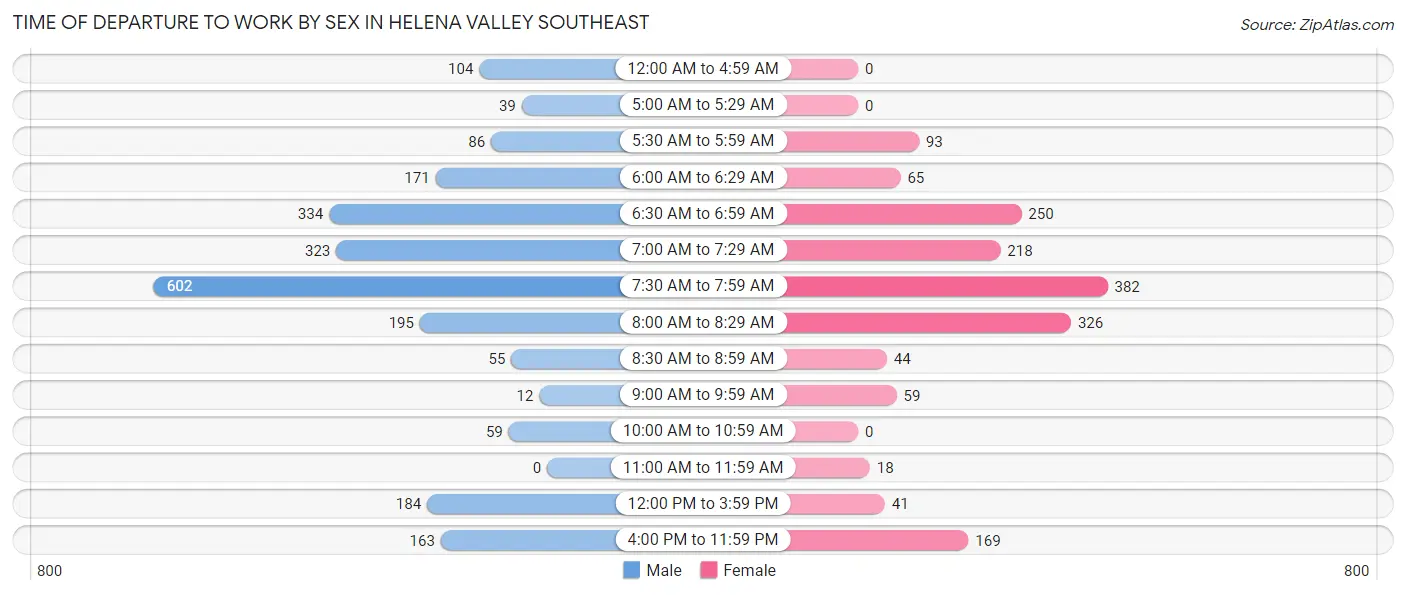
| Time of Departure | Male | Female |
| 12:00 AM to 4:59 AM | 104 (4.5%) | 0 (0.0%) |
| 5:00 AM to 5:29 AM | 39 (1.7%) | 0 (0.0%) |
| 5:30 AM to 5:59 AM | 86 (3.7%) | 93 (5.6%) |
| 6:00 AM to 6:29 AM | 171 (7.3%) | 65 (3.9%) |
| 6:30 AM to 6:59 AM | 334 (14.3%) | 250 (15.0%) |
| 7:00 AM to 7:29 AM | 323 (13.9%) | 218 (13.1%) |
| 7:30 AM to 7:59 AM | 602 (25.9%) | 382 (22.9%) |
| 8:00 AM to 8:29 AM | 195 (8.4%) | 326 (19.6%) |
| 8:30 AM to 8:59 AM | 55 (2.4%) | 44 (2.6%) |
| 9:00 AM to 9:59 AM | 12 (0.5%) | 59 (3.5%) |
| 10:00 AM to 10:59 AM | 59 (2.5%) | 0 (0.0%) |
| 11:00 AM to 11:59 AM | 0 (0.0%) | 18 (1.1%) |
| 12:00 PM to 3:59 PM | 184 (7.9%) | 41 (2.5%) |
| 4:00 PM to 11:59 PM | 163 (7.0%) | 169 (10.2%) |
| Total | 2,327 (100.0%) | 1,665 (100.0%) |
Housing Occupancy in Helena Valley Southeast
Occupancy by Ownership in Helena Valley Southeast
Of the total 3,582 dwellings in Helena Valley Southeast, owner-occupied units account for 3,055 (85.3%), while renter-occupied units make up 527 (14.7%).
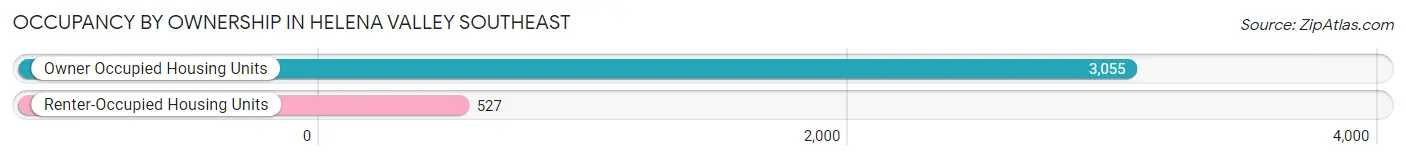
| Occupancy | # Housing Units | % Housing Units |
| Owner Occupied Housing Units | 3,055 | 85.3% |
| Renter-Occupied Housing Units | 527 | 14.7% |
| Total Occupied Housing Units | 3,582 | 100.0% |
Occupancy by Household Size in Helena Valley Southeast
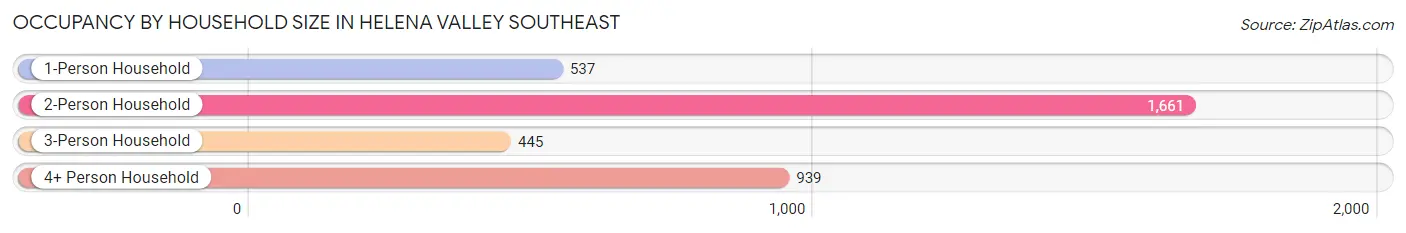
| Household Size | # Housing Units | % Housing Units |
| 1-Person Household | 537 | 15.0% |
| 2-Person Household | 1,661 | 46.4% |
| 3-Person Household | 445 | 12.4% |
| 4+ Person Household | 939 | 26.2% |
| Total Housing Units | 3,582 | 100.0% |
Occupancy by Ownership by Household Size in Helena Valley Southeast
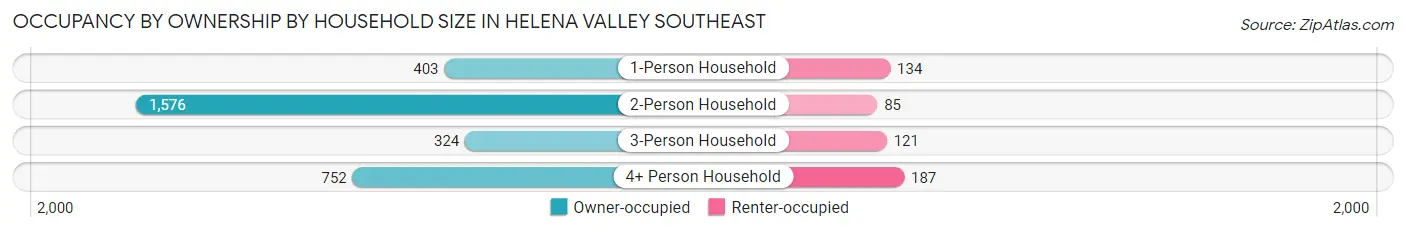
| Household Size | Owner-occupied | Renter-occupied |
| 1-Person Household | 403 (75.0%) | 134 (24.9%) |
| 2-Person Household | 1,576 (94.9%) | 85 (5.1%) |
| 3-Person Household | 324 (72.8%) | 121 (27.2%) |
| 4+ Person Household | 752 (80.1%) | 187 (19.9%) |
| Total Housing Units | 3,055 (85.3%) | 527 (14.7%) |
Occupancy by Educational Attainment in Helena Valley Southeast
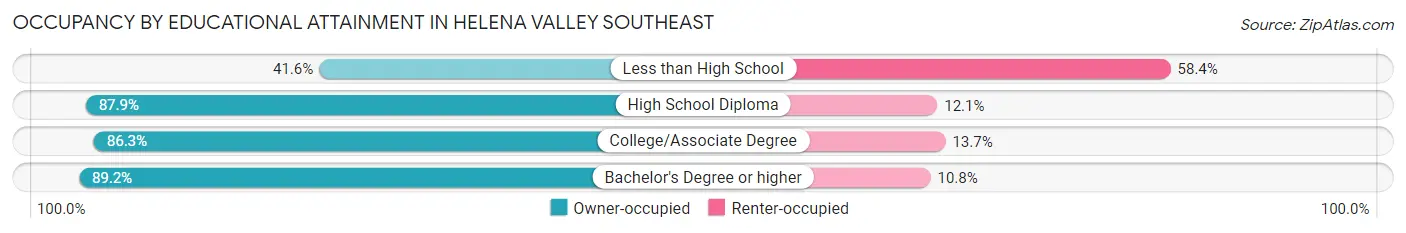
| Household Size | Owner-occupied | Renter-occupied |
| Less than High School | 77 (41.6%) | 108 (58.4%) |
| High School Diploma | 1,247 (87.9%) | 172 (12.1%) |
| College/Associate Degree | 986 (86.3%) | 157 (13.7%) |
| Bachelor's Degree or higher | 745 (89.2%) | 90 (10.8%) |
Occupancy by Age of Householder in Helena Valley Southeast
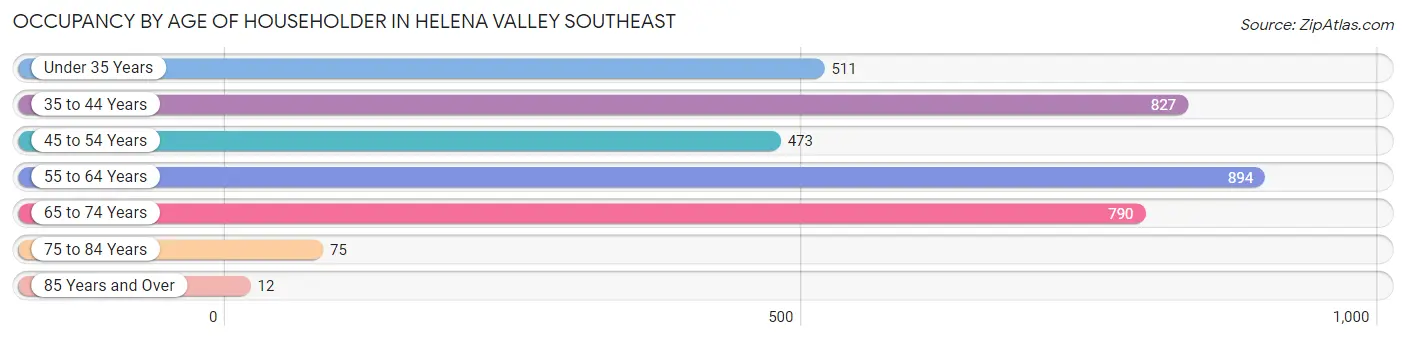
| Age Bracket | # Households | % Households |
| Under 35 Years | 511 | 14.3% |
| 35 to 44 Years | 827 | 23.1% |
| 45 to 54 Years | 473 | 13.2% |
| 55 to 64 Years | 894 | 25.0% |
| 65 to 74 Years | 790 | 22.1% |
| 75 to 84 Years | 75 | 2.1% |
| 85 Years and Over | 12 | 0.3% |
| Total | 3,582 | 100.0% |
Housing Finances in Helena Valley Southeast
Median Income by Occupancy in Helena Valley Southeast
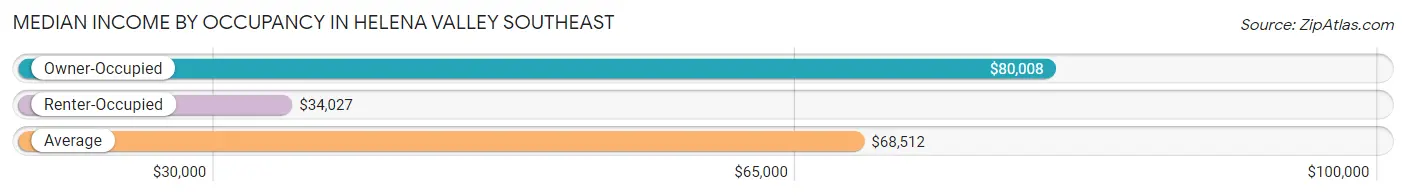
| Occupancy Type | # Households | Median Income |
| Owner-Occupied | 3,055 (85.3%) | $80,008 |
| Renter-Occupied | 527 (14.7%) | $34,027 |
| Average | 3,582 (100.0%) | $68,512 |
Occupancy by Householder Income Bracket in Helena Valley Southeast
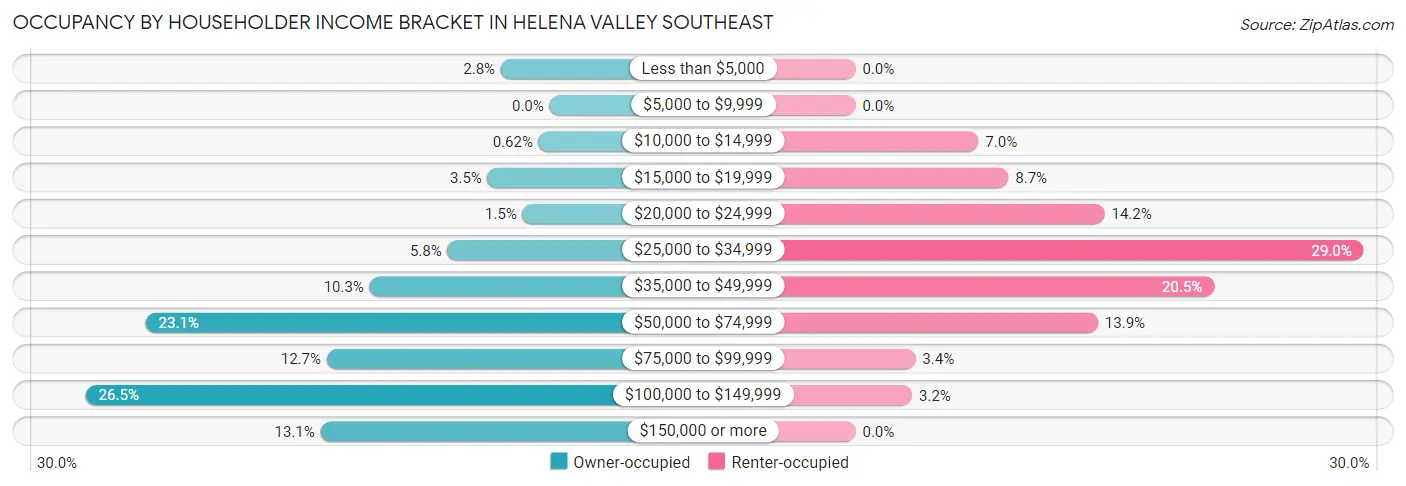
| Income Bracket | Owner-occupied | Renter-occupied |
| Less than $5,000 | 85 (2.8%) | 0 (0.0%) |
| $5,000 to $9,999 | 0 (0.0%) | 0 (0.0%) |
| $10,000 to $14,999 | 19 (0.6%) | 37 (7.0%) |
| $15,000 to $19,999 | 108 (3.5%) | 46 (8.7%) |
| $20,000 to $24,999 | 47 (1.5%) | 75 (14.2%) |
| $25,000 to $34,999 | 178 (5.8%) | 153 (29.0%) |
| $35,000 to $49,999 | 314 (10.3%) | 108 (20.5%) |
| $50,000 to $74,999 | 705 (23.1%) | 73 (13.9%) |
| $75,000 to $99,999 | 389 (12.7%) | 18 (3.4%) |
| $100,000 to $149,999 | 810 (26.5%) | 17 (3.2%) |
| $150,000 or more | 400 (13.1%) | 0 (0.0%) |
| Total | 3,055 (100.0%) | 527 (100.0%) |
Monthly Housing Cost Tiers in Helena Valley Southeast
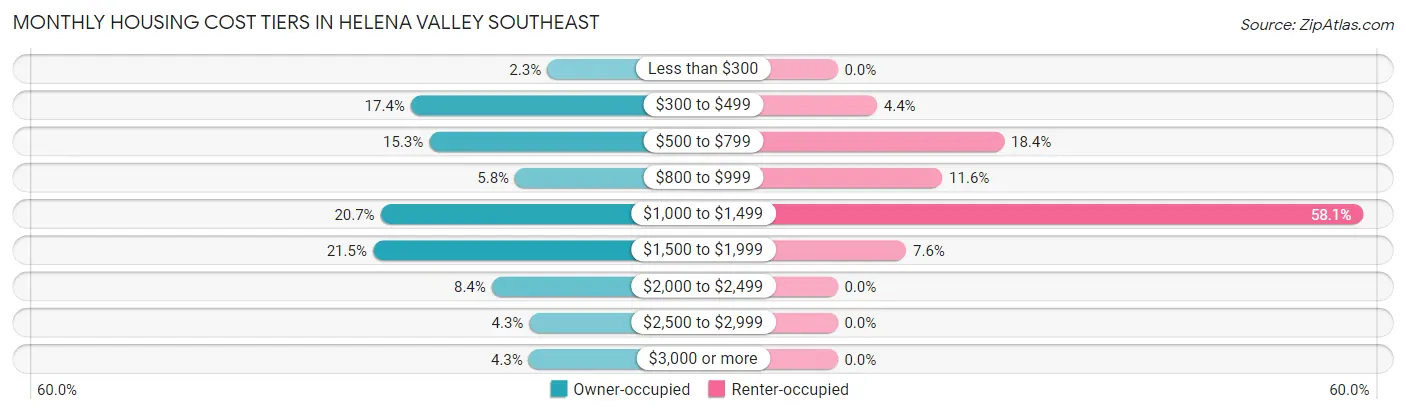
| Monthly Cost | Owner-occupied | Renter-occupied |
| Less than $300 | 70 (2.3%) | 0 (0.0%) |
| $300 to $499 | 530 (17.3%) | 23 (4.4%) |
| $500 to $799 | 468 (15.3%) | 97 (18.4%) |
| $800 to $999 | 178 (5.8%) | 61 (11.6%) |
| $1,000 to $1,499 | 632 (20.7%) | 306 (58.1%) |
| $1,500 to $1,999 | 658 (21.5%) | 40 (7.6%) |
| $2,000 to $2,499 | 257 (8.4%) | 0 (0.0%) |
| $2,500 to $2,999 | 130 (4.3%) | 0 (0.0%) |
| $3,000 or more | 132 (4.3%) | 0 (0.0%) |
| Total | 3,055 (100.0%) | 527 (100.0%) |
Physical Housing Characteristics in Helena Valley Southeast
Housing Structures in Helena Valley Southeast
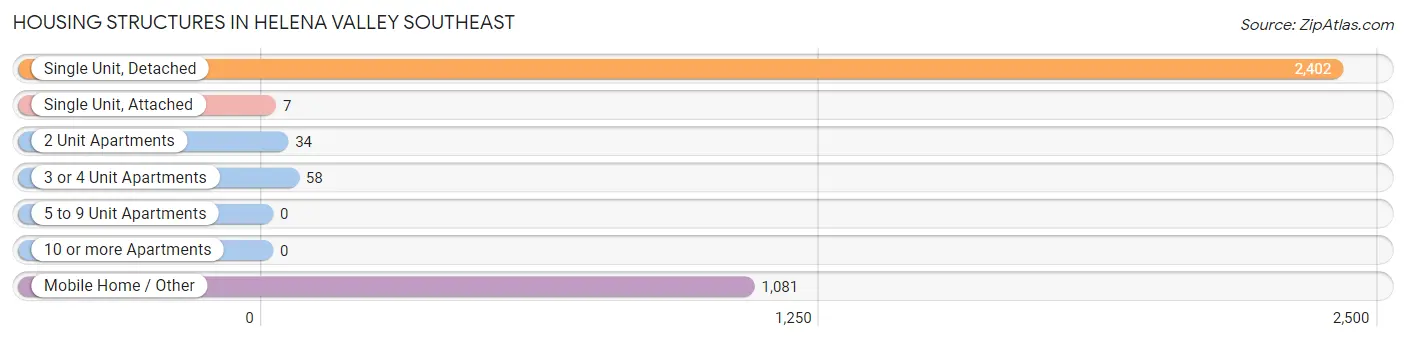
| Structure Type | # Housing Units | % Housing Units |
| Single Unit, Detached | 2,402 | 67.1% |
| Single Unit, Attached | 7 | 0.2% |
| 2 Unit Apartments | 34 | 0.9% |
| 3 or 4 Unit Apartments | 58 | 1.6% |
| 5 to 9 Unit Apartments | 0 | 0.0% |
| 10 or more Apartments | 0 | 0.0% |
| Mobile Home / Other | 1,081 | 30.2% |
| Total | 3,582 | 100.0% |
Housing Structures by Occupancy in Helena Valley Southeast
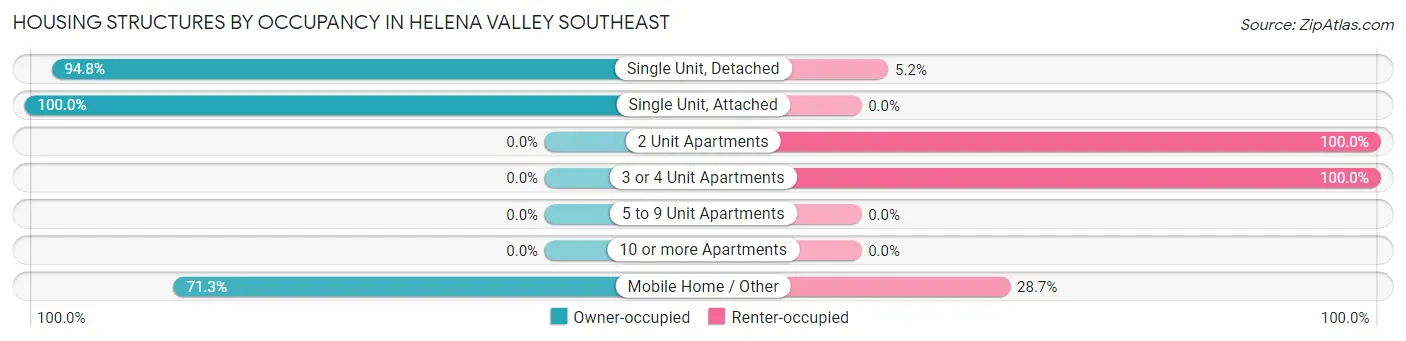
| Structure Type | Owner-occupied | Renter-occupied |
| Single Unit, Detached | 2,277 (94.8%) | 125 (5.2%) |
| Single Unit, Attached | 7 (100.0%) | 0 (0.0%) |
| 2 Unit Apartments | 0 (0.0%) | 34 (100.0%) |
| 3 or 4 Unit Apartments | 0 (0.0%) | 58 (100.0%) |
| 5 to 9 Unit Apartments | 0 (0.0%) | 0 (0.0%) |
| 10 or more Apartments | 0 (0.0%) | 0 (0.0%) |
| Mobile Home / Other | 771 (71.3%) | 310 (28.7%) |
| Total | 3,055 (85.3%) | 527 (14.7%) |
Housing Structures by Number of Rooms in Helena Valley Southeast
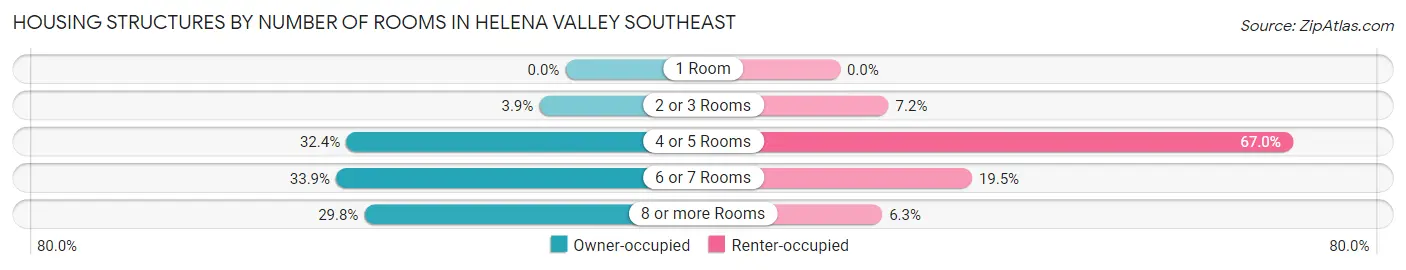
| Number of Rooms | Owner-occupied | Renter-occupied |
| 1 Room | 0 (0.0%) | 0 (0.0%) |
| 2 or 3 Rooms | 118 (3.9%) | 38 (7.2%) |
| 4 or 5 Rooms | 991 (32.4%) | 353 (67.0%) |
| 6 or 7 Rooms | 1,037 (33.9%) | 103 (19.5%) |
| 8 or more Rooms | 909 (29.7%) | 33 (6.3%) |
| Total | 3,055 (100.0%) | 527 (100.0%) |
Housing Structure by Heating Type in Helena Valley Southeast
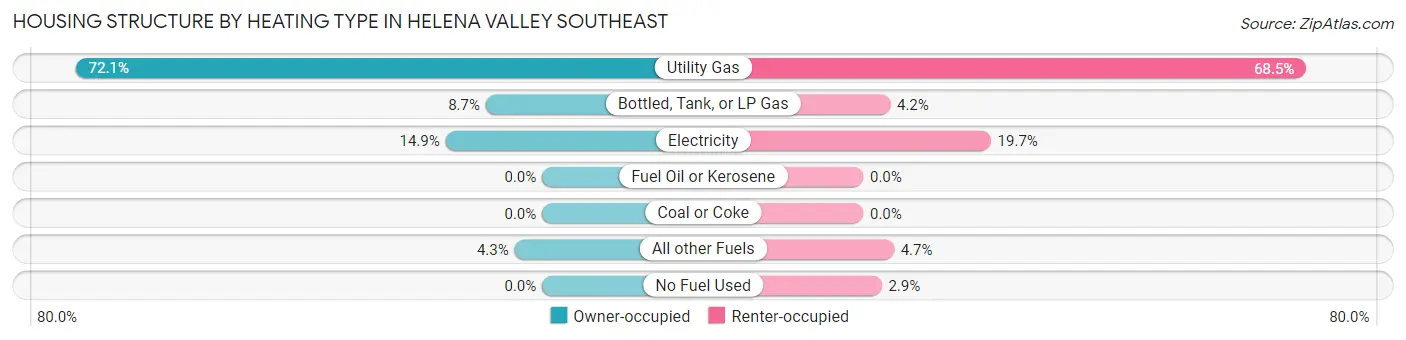
| Heating Type | Owner-occupied | Renter-occupied |
| Utility Gas | 2,203 (72.1%) | 361 (68.5%) |
| Bottled, Tank, or LP Gas | 266 (8.7%) | 22 (4.2%) |
| Electricity | 456 (14.9%) | 104 (19.7%) |
| Fuel Oil or Kerosene | 0 (0.0%) | 0 (0.0%) |
| Coal or Coke | 0 (0.0%) | 0 (0.0%) |
| All other Fuels | 130 (4.3%) | 25 (4.7%) |
| No Fuel Used | 0 (0.0%) | 15 (2.9%) |
| Total | 3,055 (100.0%) | 527 (100.0%) |
Household Vehicle Usage in Helena Valley Southeast
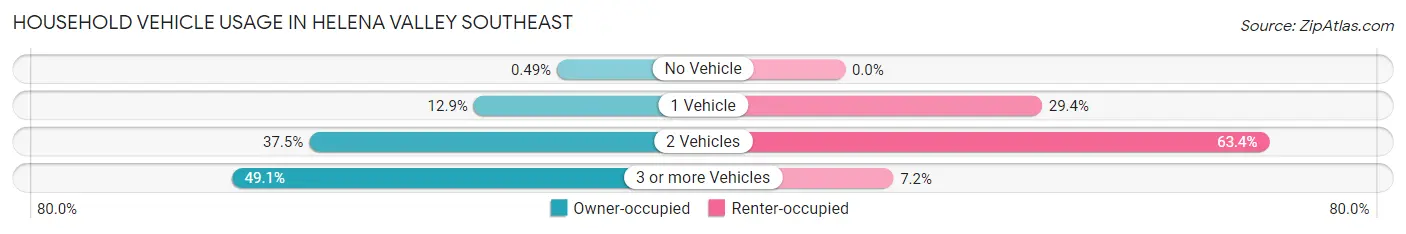
| Vehicles per Household | Owner-occupied | Renter-occupied |
| No Vehicle | 15 (0.5%) | 0 (0.0%) |
| 1 Vehicle | 395 (12.9%) | 155 (29.4%) |
| 2 Vehicles | 1,146 (37.5%) | 334 (63.4%) |
| 3 or more Vehicles | 1,499 (49.1%) | 38 (7.2%) |
| Total | 3,055 (100.0%) | 527 (100.0%) |
Real Estate & Mortgages in Helena Valley Southeast
Real Estate and Mortgage Overview in Helena Valley Southeast
| Characteristic | Without Mortgage | With Mortgage |
| Housing Units | 1,138 | 1,917 |
| Median Property Value | $229,400 | $305,000 |
| Median Household Income | $55,851 | $314 |
| Monthly Housing Costs | $488 | $132 |
| Real Estate Taxes | $2,073 | $69 |
Property Value by Mortgage Status in Helena Valley Southeast
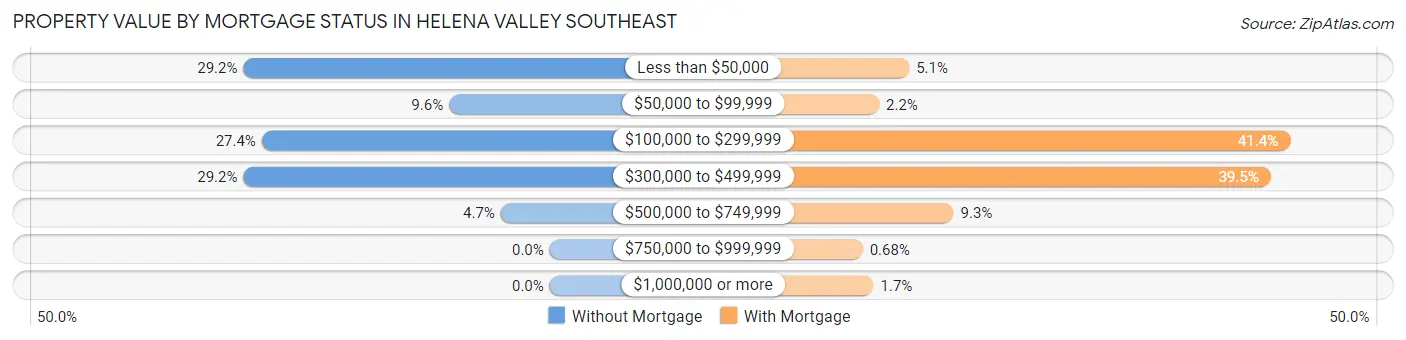
| Property Value | Without Mortgage | With Mortgage |
| Less than $50,000 | 332 (29.2%) | 98 (5.1%) |
| $50,000 to $99,999 | 109 (9.6%) | 43 (2.2%) |
| $100,000 to $299,999 | 312 (27.4%) | 793 (41.4%) |
| $300,000 to $499,999 | 332 (29.2%) | 758 (39.5%) |
| $500,000 to $749,999 | 53 (4.7%) | 179 (9.3%) |
| $750,000 to $999,999 | 0 (0.0%) | 13 (0.7%) |
| $1,000,000 or more | 0 (0.0%) | 33 (1.7%) |
| Total | 1,138 (100.0%) | 1,917 (100.0%) |
Household Income by Mortgage Status in Helena Valley Southeast
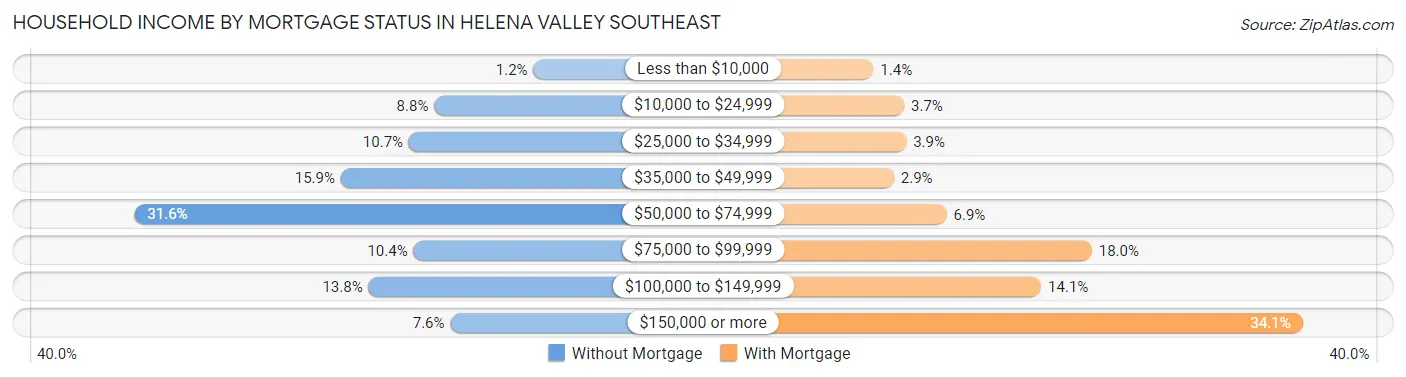
| Household Income | Without Mortgage | With Mortgage |
| Less than $10,000 | 14 (1.2%) | 26 (1.4%) |
| $10,000 to $24,999 | 100 (8.8%) | 71 (3.7%) |
| $25,000 to $34,999 | 122 (10.7%) | 74 (3.9%) |
| $35,000 to $49,999 | 181 (15.9%) | 56 (2.9%) |
| $50,000 to $74,999 | 360 (31.6%) | 133 (6.9%) |
| $75,000 to $99,999 | 118 (10.4%) | 345 (18.0%) |
| $100,000 to $149,999 | 157 (13.8%) | 271 (14.1%) |
| $150,000 or more | 86 (7.6%) | 653 (34.1%) |
| Total | 1,138 (100.0%) | 1,917 (100.0%) |
Property Value to Household Income Ratio in Helena Valley Southeast
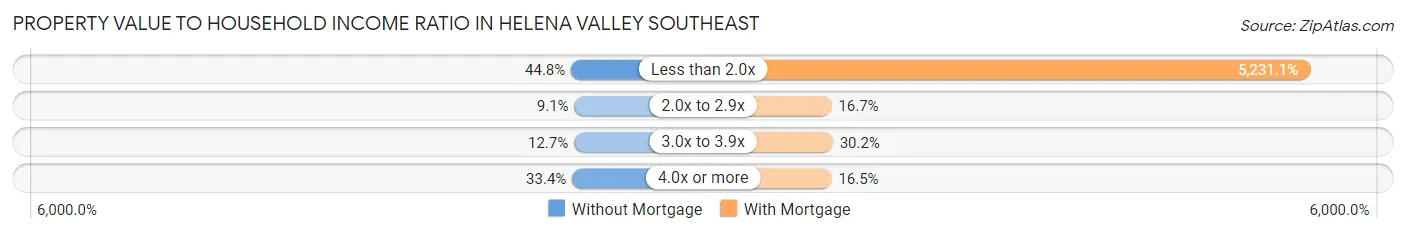
| Value-to-Income Ratio | Without Mortgage | With Mortgage |
| Less than 2.0x | 510 (44.8%) | 100,280 (5,231.1%) |
| 2.0x to 2.9x | 103 (9.0%) | 320 (16.7%) |
| 3.0x to 3.9x | 145 (12.7%) | 579 (30.2%) |
| 4.0x or more | 380 (33.4%) | 317 (16.5%) |
| Total | 1,138 (100.0%) | 1,917 (100.0%) |
Real Estate Taxes by Mortgage Status in Helena Valley Southeast
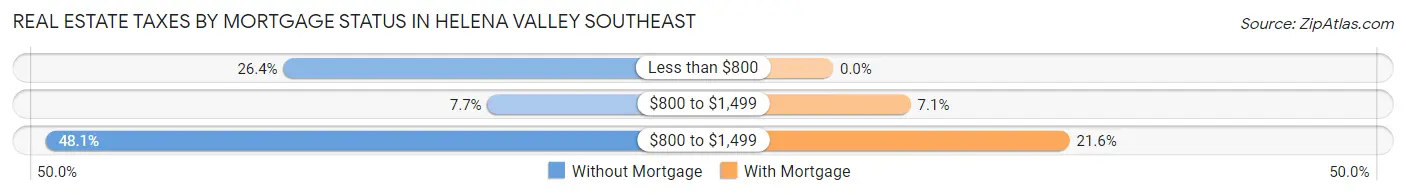
| Property Taxes | Without Mortgage | With Mortgage |
| Less than $800 | 300 (26.4%) | 0 (0.0%) |
| $800 to $1,499 | 88 (7.7%) | 136 (7.1%) |
| $800 to $1,499 | 547 (48.1%) | 414 (21.6%) |
| Total | 1,138 (100.0%) | 1,917 (100.0%) |
Health & Disability in Helena Valley Southeast
Health Insurance Coverage by Age in Helena Valley Southeast
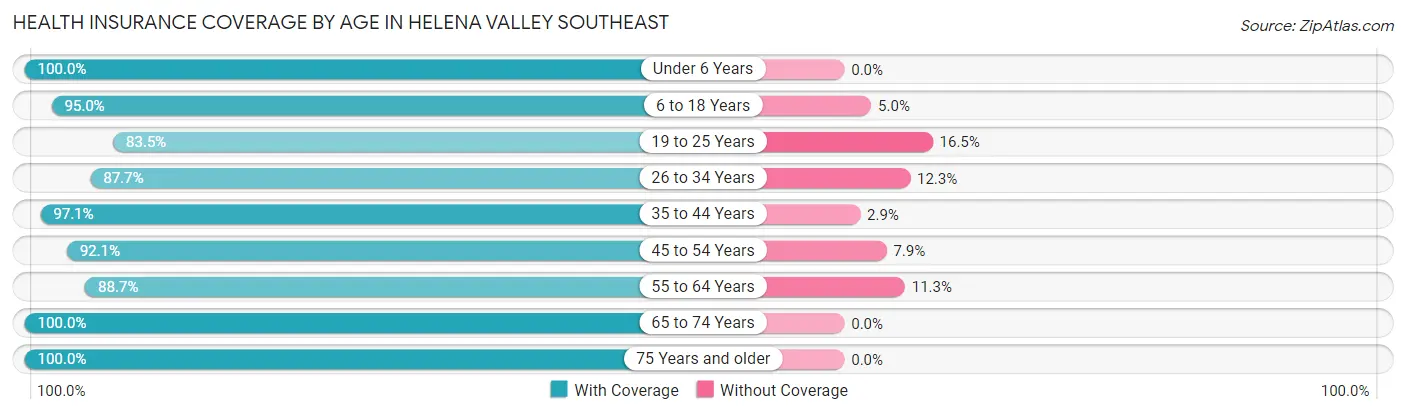
| Age Bracket | With Coverage | Without Coverage |
| Under 6 Years | 644 (100.0%) | 0 (0.0%) |
| 6 to 18 Years | 1,992 (95.0%) | 105 (5.0%) |
| 19 to 25 Years | 350 (83.5%) | 69 (16.5%) |
| 26 to 34 Years | 766 (87.7%) | 107 (12.3%) |
| 35 to 44 Years | 1,420 (97.1%) | 43 (2.9%) |
| 45 to 54 Years | 785 (92.1%) | 67 (7.9%) |
| 55 to 64 Years | 1,289 (88.7%) | 164 (11.3%) |
| 65 to 74 Years | 1,297 (100.0%) | 0 (0.0%) |
| 75 Years and older | 242 (100.0%) | 0 (0.0%) |
| Total | 8,785 (94.1%) | 555 (5.9%) |
Health Insurance Coverage by Citizenship Status in Helena Valley Southeast
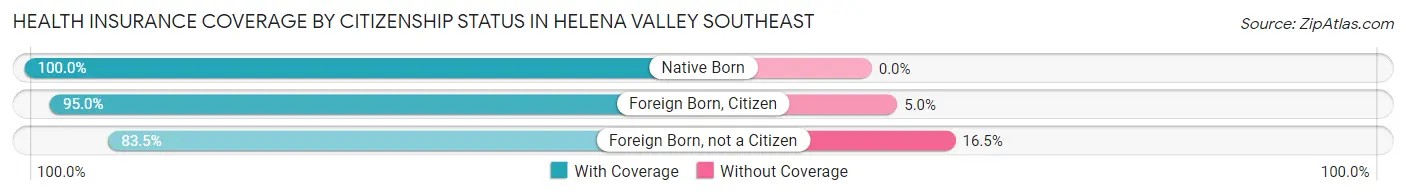
| Citizenship Status | With Coverage | Without Coverage |
| Native Born | 644 (100.0%) | 0 (0.0%) |
| Foreign Born, Citizen | 1,992 (95.0%) | 105 (5.0%) |
| Foreign Born, not a Citizen | 350 (83.5%) | 69 (16.5%) |
Health Insurance Coverage by Household Income in Helena Valley Southeast
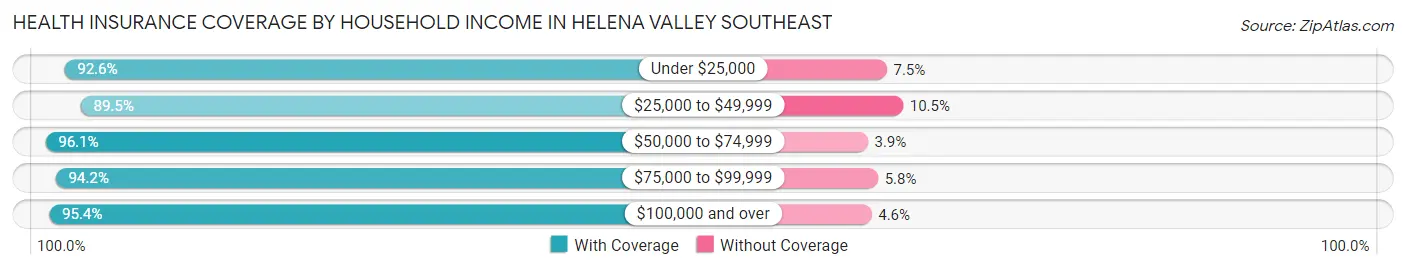
| Household Income | With Coverage | Without Coverage |
| Under $25,000 | 882 (92.5%) | 71 (7.4%) |
| $25,000 to $49,999 | 1,510 (89.5%) | 177 (10.5%) |
| $50,000 to $74,999 | 2,131 (96.1%) | 86 (3.9%) |
| $75,000 to $99,999 | 1,187 (94.2%) | 73 (5.8%) |
| $100,000 and over | 3,075 (95.4%) | 148 (4.6%) |
Public vs Private Health Insurance Coverage by Age in Helena Valley Southeast
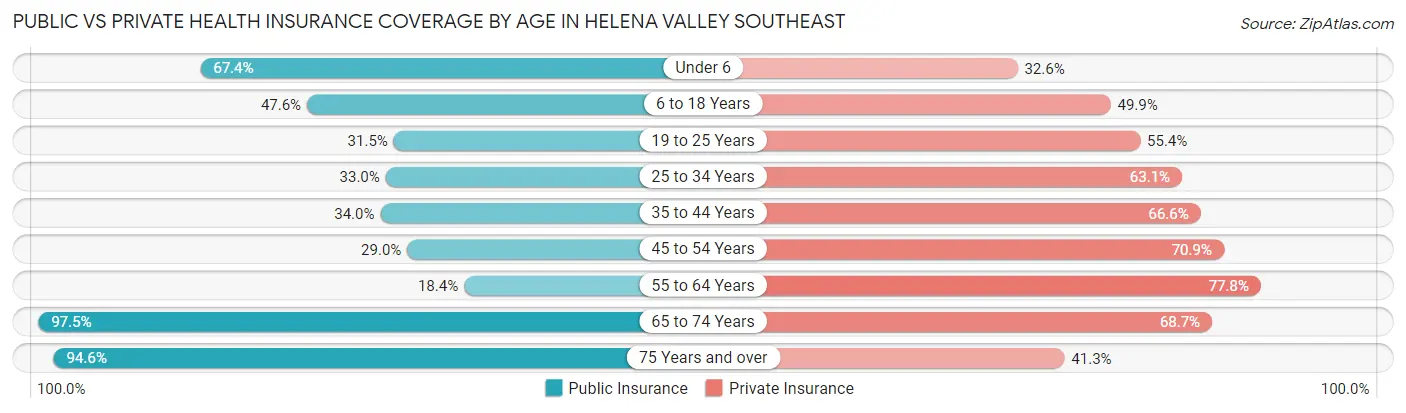
| Age Bracket | Public Insurance | Private Insurance |
| Under 6 | 434 (67.4%) | 210 (32.6%) |
| 6 to 18 Years | 998 (47.6%) | 1,046 (49.9%) |
| 19 to 25 Years | 132 (31.5%) | 232 (55.4%) |
| 25 to 34 Years | 288 (33.0%) | 551 (63.1%) |
| 35 to 44 Years | 497 (34.0%) | 974 (66.6%) |
| 45 to 54 Years | 247 (29.0%) | 604 (70.9%) |
| 55 to 64 Years | 268 (18.4%) | 1,130 (77.8%) |
| 65 to 74 Years | 1,264 (97.5%) | 891 (68.7%) |
| 75 Years and over | 229 (94.6%) | 100 (41.3%) |
| Total | 4,357 (46.7%) | 5,738 (61.4%) |
Disability Status by Sex by Age in Helena Valley Southeast
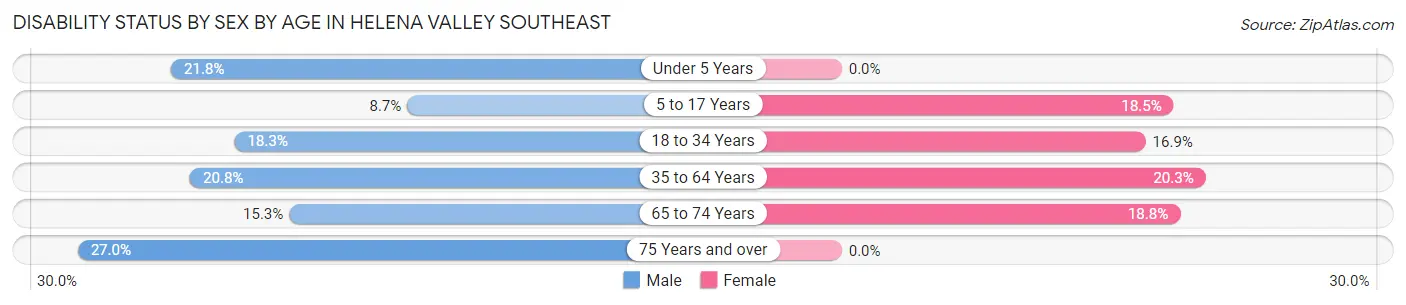
| Age Bracket | Male | Female |
| Under 5 Years | 83 (21.8%) | 0 (0.0%) |
| 5 to 17 Years | 90 (8.7%) | 188 (18.5%) |
| 18 to 34 Years | 141 (18.3%) | 111 (16.9%) |
| 35 to 64 Years | 395 (20.8%) | 378 (20.3%) |
| 65 to 74 Years | 104 (15.3%) | 116 (18.8%) |
| 75 Years and over | 43 (27.0%) | 0 (0.0%) |
Disability Class by Sex by Age in Helena Valley Southeast
Disability Class: Hearing Difficulty
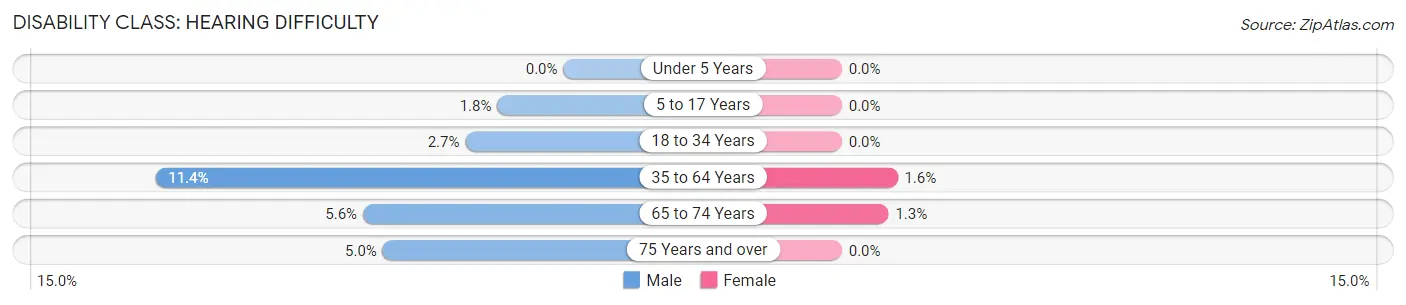
| Age Bracket | Male | Female |
| Under 5 Years | 0 (0.0%) | 0 (0.0%) |
| 5 to 17 Years | 19 (1.8%) | 0 (0.0%) |
| 18 to 34 Years | 21 (2.7%) | 0 (0.0%) |
| 35 to 64 Years | 216 (11.4%) | 29 (1.5%) |
| 65 to 74 Years | 38 (5.6%) | 8 (1.3%) |
| 75 Years and over | 8 (5.0%) | 0 (0.0%) |
Disability Class: Vision Difficulty
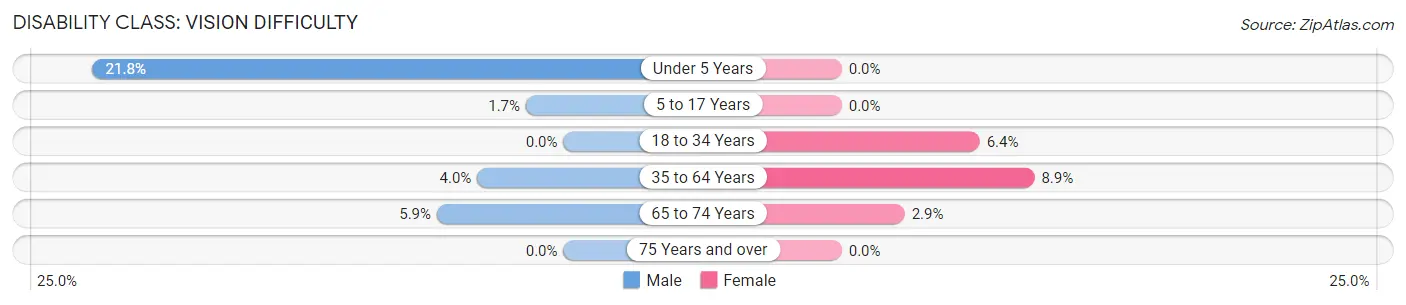
| Age Bracket | Male | Female |
| Under 5 Years | 83 (21.8%) | 0 (0.0%) |
| 5 to 17 Years | 18 (1.7%) | 0 (0.0%) |
| 18 to 34 Years | 0 (0.0%) | 42 (6.4%) |
| 35 to 64 Years | 76 (4.0%) | 167 (8.9%) |
| 65 to 74 Years | 40 (5.9%) | 18 (2.9%) |
| 75 Years and over | 0 (0.0%) | 0 (0.0%) |
Disability Class: Cognitive Difficulty
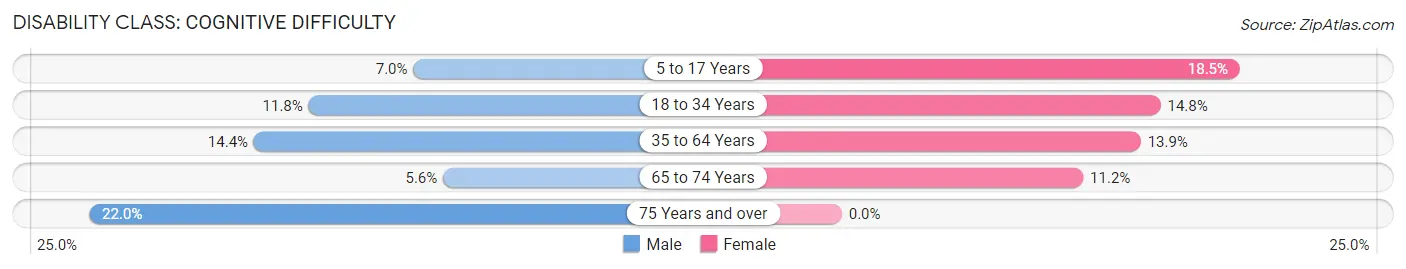
| Age Bracket | Male | Female |
| 5 to 17 Years | 72 (7.0%) | 188 (18.5%) |
| 18 to 34 Years | 91 (11.8%) | 97 (14.8%) |
| 35 to 64 Years | 273 (14.4%) | 259 (13.9%) |
| 65 to 74 Years | 38 (5.6%) | 69 (11.2%) |
| 75 Years and over | 35 (22.0%) | 0 (0.0%) |
Disability Class: Ambulatory Difficulty
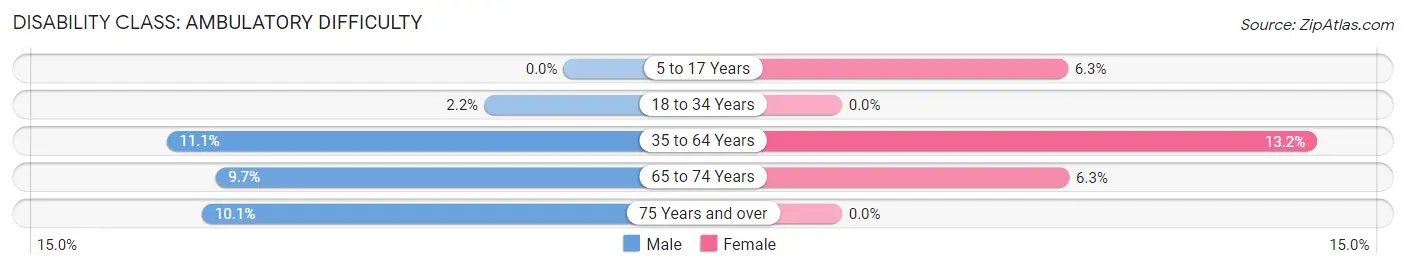
| Age Bracket | Male | Female |
| 5 to 17 Years | 0 (0.0%) | 64 (6.3%) |
| 18 to 34 Years | 17 (2.2%) | 0 (0.0%) |
| 35 to 64 Years | 210 (11.1%) | 247 (13.2%) |
| 65 to 74 Years | 66 (9.7%) | 39 (6.3%) |
| 75 Years and over | 16 (10.1%) | 0 (0.0%) |
Disability Class: Self-Care Difficulty
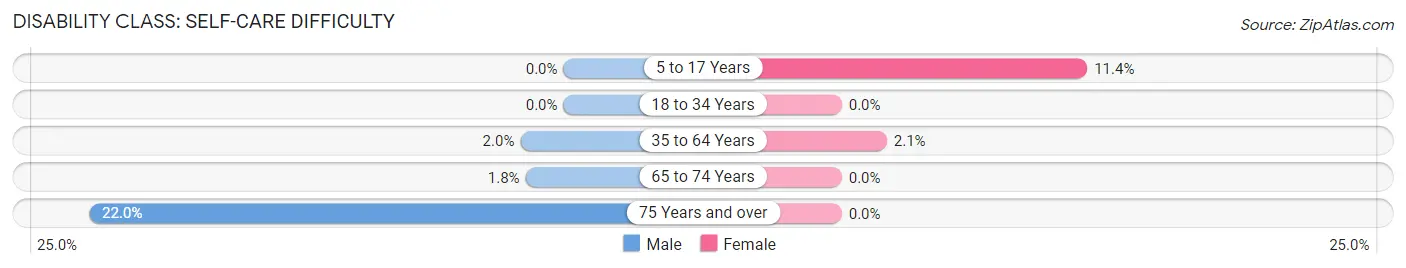
| Age Bracket | Male | Female |
| 5 to 17 Years | 0 (0.0%) | 116 (11.4%) |
| 18 to 34 Years | 0 (0.0%) | 0 (0.0%) |
| 35 to 64 Years | 38 (2.0%) | 39 (2.1%) |
| 65 to 74 Years | 12 (1.8%) | 0 (0.0%) |
| 75 Years and over | 35 (22.0%) | 0 (0.0%) |
Technology Access in Helena Valley Southeast
Computing Device Access in Helena Valley Southeast
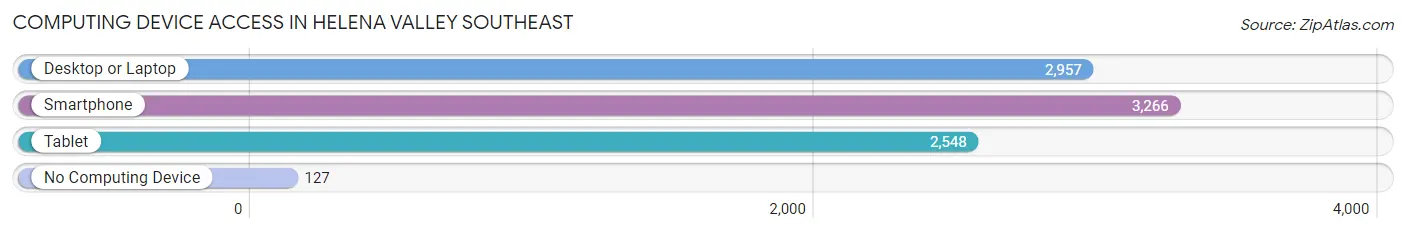
| Device Type | # Households | % Households |
| Desktop or Laptop | 2,957 | 82.6% |
| Smartphone | 3,266 | 91.2% |
| Tablet | 2,548 | 71.1% |
| No Computing Device | 127 | 3.5% |
| Total | 3,582 | 100.0% |
Internet Access in Helena Valley Southeast
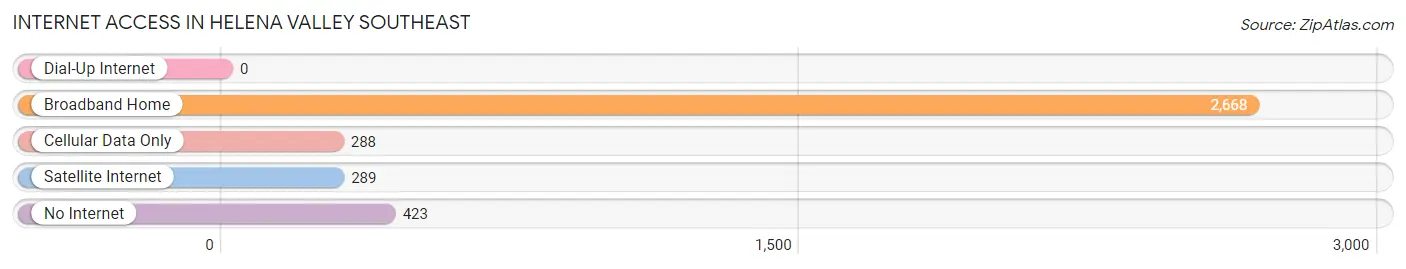
| Internet Type | # Households | % Households |
| Dial-Up Internet | 0 | 0.0% |
| Broadband Home | 2,668 | 74.5% |
| Cellular Data Only | 288 | 8.0% |
| Satellite Internet | 289 | 8.1% |
| No Internet | 423 | 11.8% |
| Total | 3,582 | 100.0% |
Helena Valley Southeast Summary
Helena Valley Southeast is a census-designated place located in Lewis and Clark County, Montana. It is situated in the Helena Valley, which is located in the southwestern part of the state. The population of Helena Valley Southeast was 1,845 at the 2010 census.
Geography
Helena Valley Southeast is located at 46°37'25"N 112°14'45"W (46.623750, -112.245833). It is situated in the Helena Valley, which is located in the southwestern part of the state. The area is surrounded by the Big Belt Mountains to the east, the Elkhorn Mountains to the west, and the Continental Divide to the north. The area is characterized by rolling hills and valleys, with the highest point in the area being the summit of Mount Helena at 8,000 feet.
Economy
The economy of Helena Valley Southeast is largely based on agriculture and tourism. The area is home to several farms and ranches, which produce a variety of crops and livestock. The area is also home to several tourist attractions, including the Lewis and Clark Caverns State Park, the Helena National Forest, and the Gates of the Mountains Wilderness Area.
Demographics
As of the 2010 census, there were 1,845 people, 745 households, and 486 families residing in Helena Valley Southeast. The population density was 5.2 people per square mile (2.0/km2). The racial makeup of the area was 94.2% White, 0.3% African American, 1.2% Native American, 0.3% Asian, 0.1% Pacific Islander, 1.2% from other races, and 2.7% from two or more races. Hispanic or Latino of any race were 3.2% of the population.
The median age in Helena Valley Southeast was 43.2 years. 24.2% of residents were under the age of 18; 6.2% were between the ages of 18 and 24; 22.2% were from 25 to 44; 33.2% were from 45 to 64; and 14.2% were 65 years of age or older. The gender makeup of the area was 48.2% male and 51.8% female.
The median income for a household in Helena Valley Southeast was $41,250, and the median income for a family was $50,000. Males had a median income of $36,250 versus $25,000 for females. The per capita income for the area was $20,945. About 8.2% of families and 11.2% of the population were below the poverty line, including 16.2% of those under age 18 and 6.2% of those age 65 or over.
Conclusion
Helena Valley Southeast is a census-designated place located in Lewis and Clark County, Montana. It is situated in the Helena Valley, which is located in the southwestern part of the state. The population of Helena Valley Southeast was 1,845 at the 2010 census. The economy of Helena Valley Southeast is largely based on agriculture and tourism. The area is home to several farms and ranches, which produce a variety of crops and livestock. The area is also home to several tourist attractions, including the Lewis and Clark Caverns State Park, the Helena National Forest, and the Gates of the Mountains Wilderness Area. As of the 2010 census, there were 1,845 people, 745 households, and 486 families residing in Helena Valley Southeast. The median income for a household in Helena Valley Southeast was $41,250, and the median income for a family was $50,000. Helena Valley Southeast is a unique area of Montana that offers a variety of economic and recreational opportunities.
Common Questions
What is Per Capita Income in Helena Valley Southeast?
Per Capita income in Helena Valley Southeast is $31,521.
What is the Median Family Income in Helena Valley Southeast?
Median Family Income in Helena Valley Southeast is $72,149.
What is the Median Household income in Helena Valley Southeast?
Median Household Income in Helena Valley Southeast is $68,512.
What is Income or Wage Gap in Helena Valley Southeast?
Income or Wage Gap in Helena Valley Southeast is 20.4%.
Women in Helena Valley Southeast earn 79.6 cents for every dollar earned by a man.
What is Inequality or Gini Index in Helena Valley Southeast?
Inequality or Gini Index in Helena Valley Southeast is 0.37.
What is the Total Population of Helena Valley Southeast?
Total Population of Helena Valley Southeast is 9,374.
What is the Total Male Population of Helena Valley Southeast?
Total Male Population of Helena Valley Southeast is 4,960.
What is the Total Female Population of Helena Valley Southeast?
Total Female Population of Helena Valley Southeast is 4,414.
What is the Ratio of Males per 100 Females in Helena Valley Southeast?
There are 112.37 Males per 100 Females in Helena Valley Southeast.
What is the Ratio of Females per 100 Males in Helena Valley Southeast?
There are 88.99 Females per 100 Males in Helena Valley Southeast.
What is the Median Population Age in Helena Valley Southeast?
Median Population Age in Helena Valley Southeast is 39.3 Years.
What is the Average Family Size in Helena Valley Southeast
Average Family Size in Helena Valley Southeast is 2.9 People.
What is the Average Household Size in Helena Valley Southeast
Average Household Size in Helena Valley Southeast is 2.6 People.
How Large is the Labor Force in Helena Valley Southeast?
There are 4,672 People in the Labor Forcein in Helena Valley Southeast.
What is the Percentage of People in the Labor Force in Helena Valley Southeast?
66.7% of People are in the Labor Force in Helena Valley Southeast.
What is the Unemployment Rate in Helena Valley Southeast?
Unemployment Rate in Helena Valley Southeast is 5.1%.