Chenega, AK Map & Demographics
Chenega Map
Chenega Overview
$31,955
PER CAPITA INCOME
$58,750
AVG HOUSEHOLD INCOME
0.33
INEQUALITY / GINI INDEX
58
TOTAL POPULATION
33
MALE POPULATION
25
FEMALE POPULATION
132.00
MALES / 100 FEMALES
75.76
FEMALES / 100 MALES
30.5
MEDIAN AGE
3.2
AVG FAMILY SIZE
2.6
AVG HOUSEHOLD SIZE
25
LABOR FORCE [ PEOPLE ]
59.5%
PERCENT IN LABOR FORCE
Income in Chenega
Income Overview in Chenega
| Characteristic | Number | Measure |
| Per Capita Income | 58 | $31,955 |
| Median Family Income | 13 | $0 |
| Mean Family Income | 13 | $77,523 |
| Median Household Income | 22 | $58,750 |
| Mean Household Income | 22 | $75,295 |
| Income Deficit | 13 | $0 |
| Wage / Income Gap (%) | 58 | 0.00% |
| Wage / Income Gap ($) | 58 | 100.00¢ per $1 |
| Gini / Inequality Index | 58 | 0.33 |
Earnings by Sex in Chenega
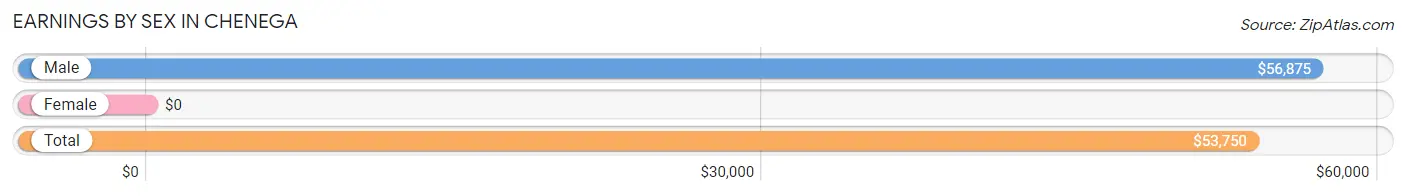
| Sex | Number | Average Earnings |
| Male | 16 (61.5%) | $56,875 |
| Female | 10 (38.5%) | $0 |
| Total | 26 (100.0%) | $53,750 |
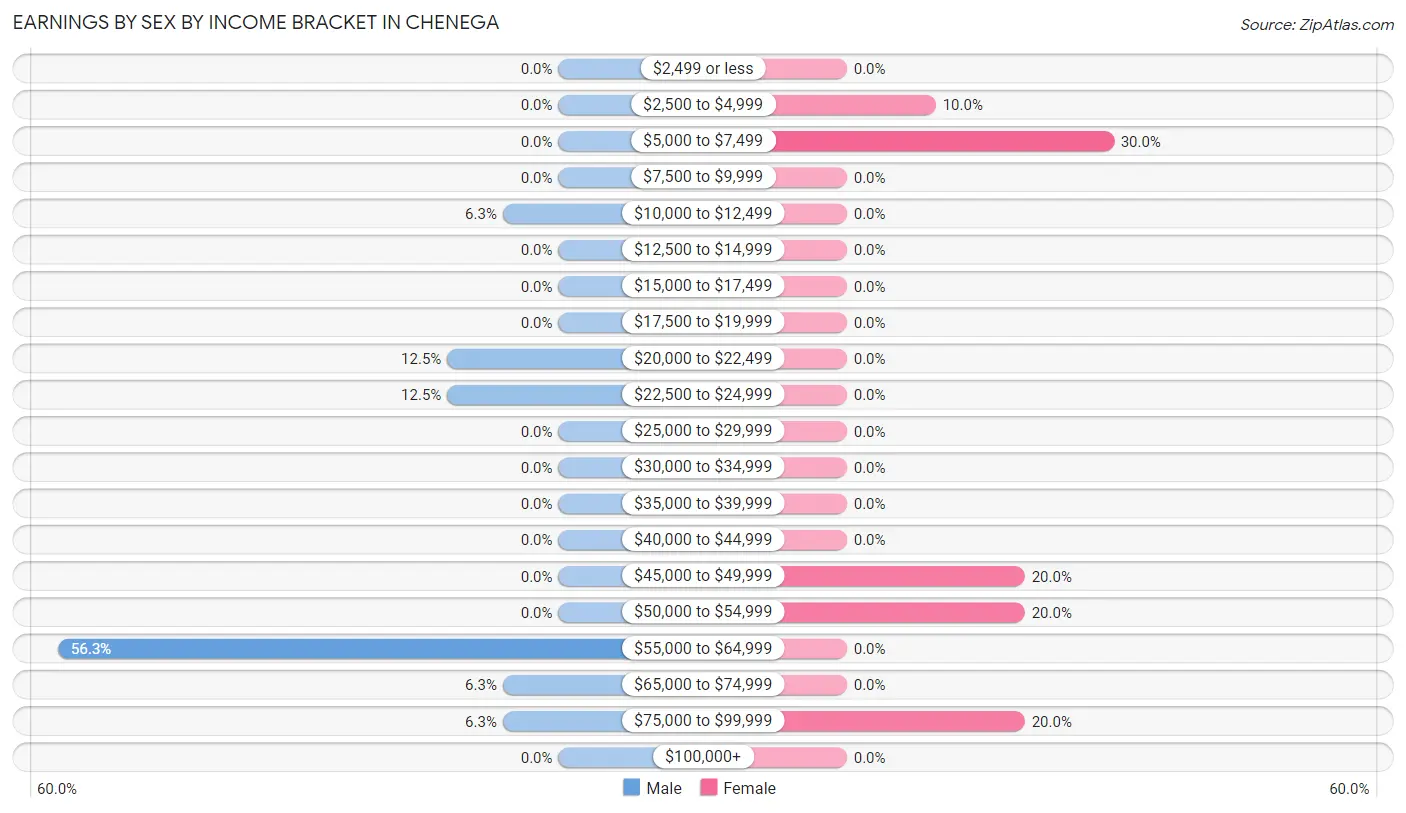
Earnings by Sex by Income Bracket in Chenega
The most common earnings brackets in Chenega are $55,000 to $64,999 for men (9 | 56.2%) and $5,000 to $7,499 for women (3 | 30.0%).
| Income | Male | Female |
| $2,499 or less | 0 (0.0%) | 0 (0.0%) |
| $2,500 to $4,999 | 0 (0.0%) | 1 (10.0%) |
| $5,000 to $7,499 | 0 (0.0%) | 3 (30.0%) |
| $7,500 to $9,999 | 0 (0.0%) | 0 (0.0%) |
| $10,000 to $12,499 | 1 (6.2%) | 0 (0.0%) |
| $12,500 to $14,999 | 0 (0.0%) | 0 (0.0%) |
| $15,000 to $17,499 | 0 (0.0%) | 0 (0.0%) |
| $17,500 to $19,999 | 0 (0.0%) | 0 (0.0%) |
| $20,000 to $22,499 | 2 (12.5%) | 0 (0.0%) |
| $22,500 to $24,999 | 2 (12.5%) | 0 (0.0%) |
| $25,000 to $29,999 | 0 (0.0%) | 0 (0.0%) |
| $30,000 to $34,999 | 0 (0.0%) | 0 (0.0%) |
| $35,000 to $39,999 | 0 (0.0%) | 0 (0.0%) |
| $40,000 to $44,999 | 0 (0.0%) | 0 (0.0%) |
| $45,000 to $49,999 | 0 (0.0%) | 2 (20.0%) |
| $50,000 to $54,999 | 0 (0.0%) | 2 (20.0%) |
| $55,000 to $64,999 | 9 (56.2%) | 0 (0.0%) |
| $65,000 to $74,999 | 1 (6.2%) | 0 (0.0%) |
| $75,000 to $99,999 | 1 (6.2%) | 2 (20.0%) |
| $100,000+ | 0 (0.0%) | 0 (0.0%) |
| Total | 16 (100.0%) | 10 (100.0%) |
Earnings by Sex by Educational Attainment in Chenega
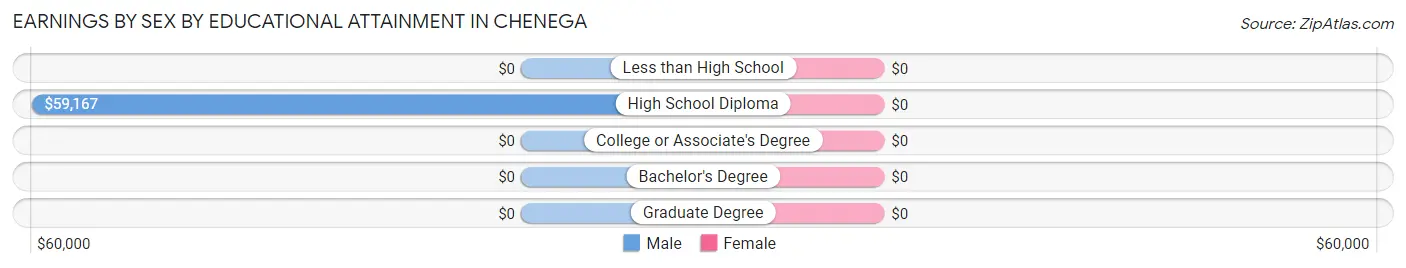
| Educational Attainment | Male Income | Female Income |
| Less than High School | - | - |
| High School Diploma | $59,167 | $0 |
| College or Associate's Degree | - | - |
| Bachelor's Degree | - | - |
| Graduate Degree | - | - |
| Total | $58,000 | $50,625 |
Family Income in Chenega
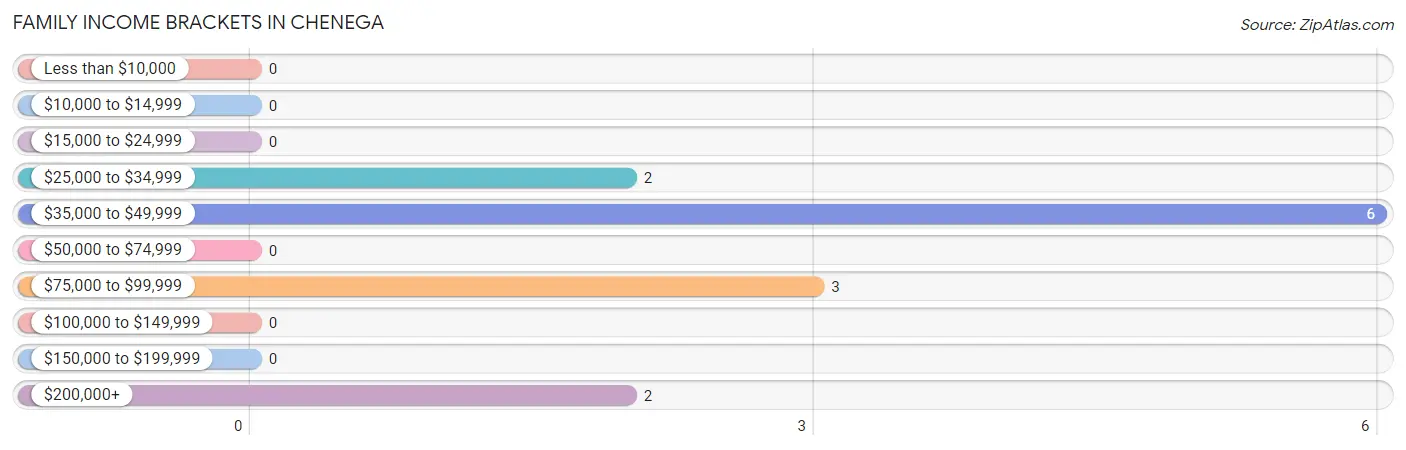
Family Income Brackets in Chenega
According to the Chenega family income data, there are 6 families falling into the $35,000 to $49,999 income range, which is the most common income bracket and makes up 46.2% of all families.
| Income Bracket | # Families | % Families |
| Less than $10,000 | 0 | 0.0% |
| $10,000 to $14,999 | 0 | 0.0% |
| $15,000 to $24,999 | 0 | 0.0% |
| $25,000 to $34,999 | 2 | 15.4% |
| $35,000 to $49,999 | 6 | 46.2% |
| $50,000 to $74,999 | 0 | 0.0% |
| $75,000 to $99,999 | 3 | 23.1% |
| $100,000 to $149,999 | 0 | 0.0% |
| $150,000 to $199,999 | 0 | 0.0% |
| $200,000+ | 2 | 15.4% |
Family Income by Famaliy Size in Chenega
| Income Bracket | # Families | Median Income |
| 2-Person Families | 8 (61.5%) | $0 |
| 3-Person Families | 2 (15.4%) | $0 |
| 4-Person Families | 1 (7.7%) | $0 |
| 5-Person Families | 1 (7.7%) | $0 |
| 6-Person Families | 1 (7.7%) | $0 |
| 7+ Person Families | 0 (0.0%) | $0 |
| Total | 13 (100.0%) | $0 |
Family Income by Number of Earners in Chenega
| Number of Earners | # Families | Median Income |
| No Earners | 6 (46.2%) | $0 |
| 1 Earner | 5 (38.5%) | $0 |
| 2 Earners | 2 (15.4%) | $0 |
| 3+ Earners | 0 (0.0%) | $0 |
| Total | 13 (100.0%) | $0 |
Household Income in Chenega
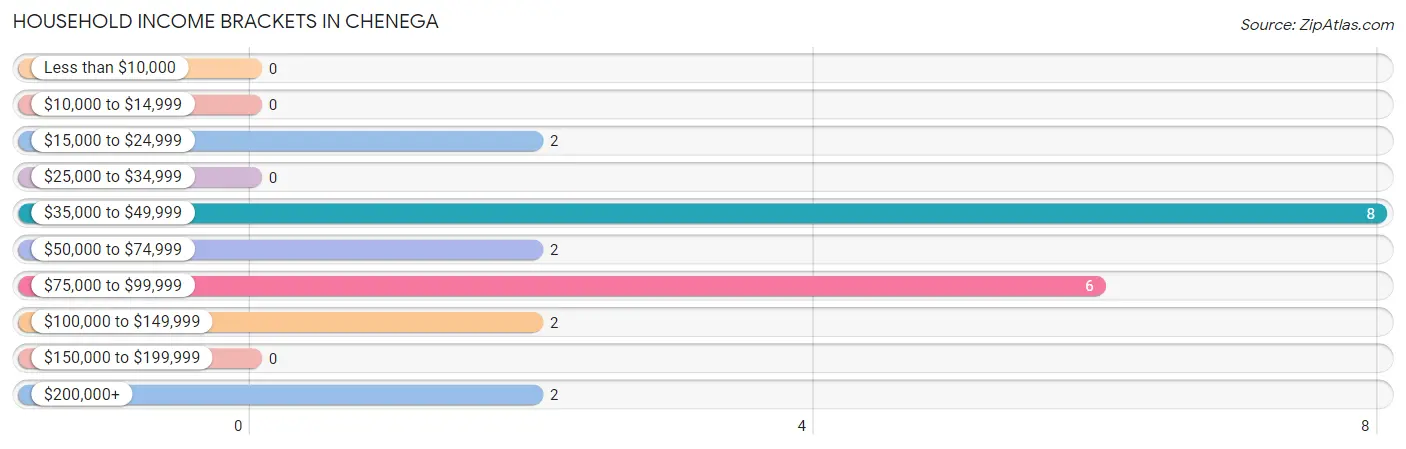
Household Income Brackets in Chenega
With 8 households falling in the category, the $35,000 to $49,999 income range is the most frequent in Chenega, accounting for 36.4% of all households.
| Income Bracket | # Households | % Households |
| Less than $10,000 | 0 | 0.0% |
| $10,000 to $14,999 | 0 | 0.0% |
| $15,000 to $24,999 | 2 | 9.1% |
| $25,000 to $34,999 | 0 | 0.0% |
| $35,000 to $49,999 | 8 | 36.4% |
| $50,000 to $74,999 | 2 | 9.1% |
| $75,000 to $99,999 | 6 | 27.3% |
| $100,000 to $149,999 | 2 | 9.1% |
| $150,000 to $199,999 | 0 | 0.0% |
| $200,000+ | 2 | 9.1% |
Household Income by Householder Age in Chenega
The median household income in Chenega is $58,750, with the highest median household income of $90,000 found in the 25 to 44 years age bracket for the primary householder. A total of 6 households (27.3%) fall into this category.
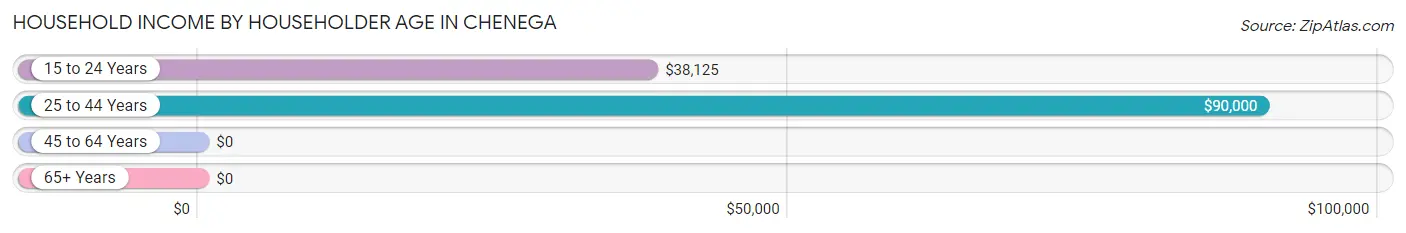
| Income Bracket | # Households | Median Income |
| 15 to 24 Years | 5 (22.7%) | $38,125 |
| 25 to 44 Years | 6 (27.3%) | $90,000 |
| 45 to 64 Years | 0 (0.0%) | $0 |
| 65+ Years | 11 (50.0%) | $0 |
| Total | 22 (100.0%) | $58,750 |
Poverty in Chenega
Income Below Poverty by Sex and Age in Chenega
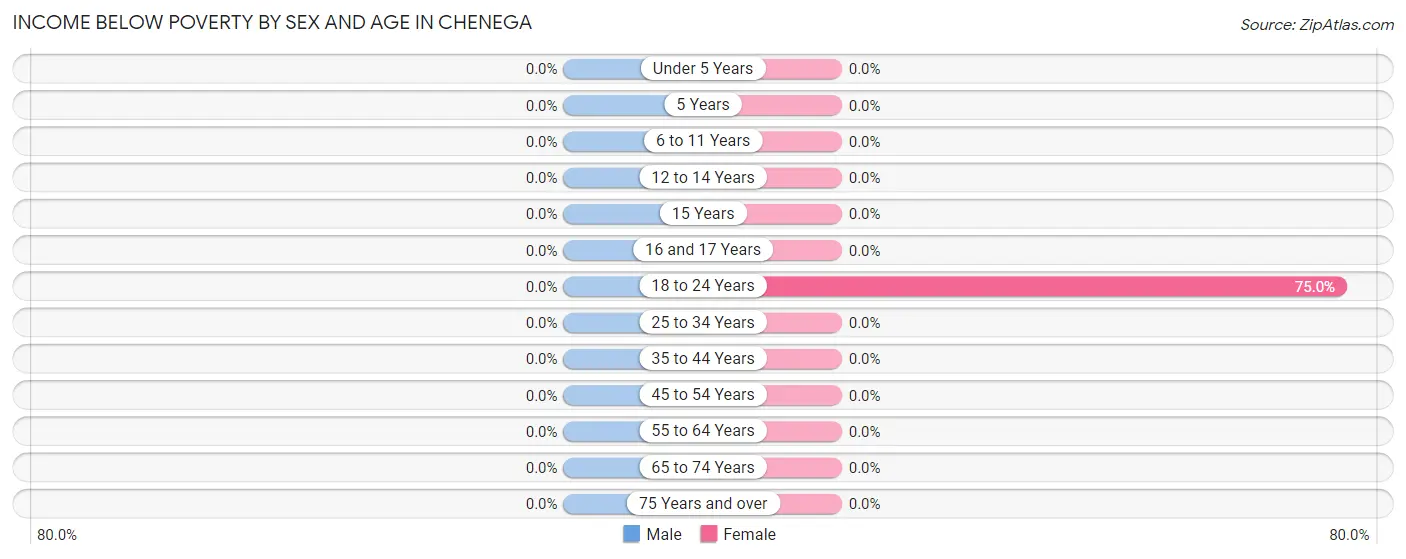
| Age Bracket | Male | Female |
| Under 5 Years | 0 (0.0%) | 0 (0.0%) |
| 5 Years | 0 (0.0%) | 0 (0.0%) |
| 6 to 11 Years | 0 (0.0%) | 0 (0.0%) |
| 12 to 14 Years | 0 (0.0%) | 0 (0.0%) |
| 15 Years | 0 (0.0%) | 0 (0.0%) |
| 16 and 17 Years | 0 (0.0%) | 0 (0.0%) |
| 18 to 24 Years | 0 (0.0%) | 3 (75.0%) |
| 25 to 34 Years | 0 (0.0%) | 0 (0.0%) |
| 35 to 44 Years | 0 (0.0%) | 0 (0.0%) |
| 45 to 54 Years | 0 (0.0%) | 0 (0.0%) |
| 55 to 64 Years | 0 (0.0%) | 0 (0.0%) |
| 65 to 74 Years | 0 (0.0%) | 0 (0.0%) |
| 75 Years and over | 0 (0.0%) | 0 (0.0%) |
| Total | 0 (0.0%) | 3 (12.0%) |
Income Above Poverty by Sex and Age in Chenega
According to the poverty statistics in Chenega, males aged under 5 years and females aged under 5 years are the age groups that are most secure financially, with 100.0% of males and 100.0% of females in these age groups living above the poverty line.
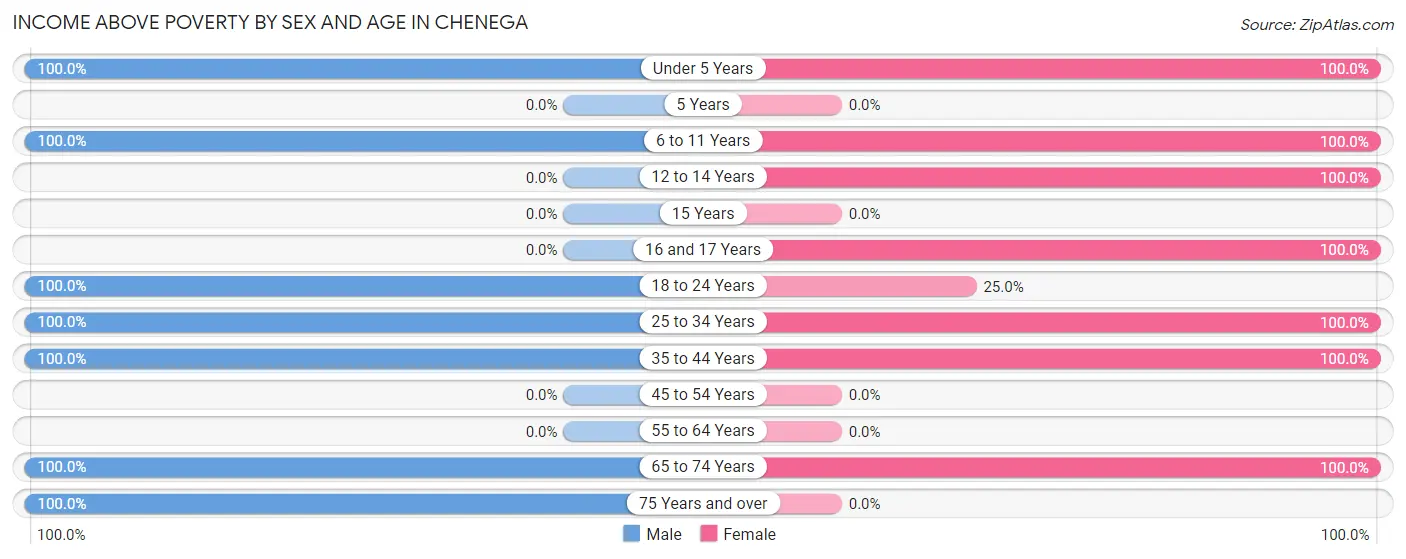
| Age Bracket | Male | Female |
| Under 5 Years | 2 (100.0%) | 4 (100.0%) |
| 5 Years | 0 (0.0%) | 0 (0.0%) |
| 6 to 11 Years | 4 (100.0%) | 5 (100.0%) |
| 12 to 14 Years | 0 (0.0%) | 1 (100.0%) |
| 15 Years | 0 (0.0%) | 0 (0.0%) |
| 16 and 17 Years | 0 (0.0%) | 1 (100.0%) |
| 18 to 24 Years | 4 (100.0%) | 1 (25.0%) |
| 25 to 34 Years | 10 (100.0%) | 4 (100.0%) |
| 35 to 44 Years | 2 (100.0%) | 1 (100.0%) |
| 45 to 54 Years | 0 (0.0%) | 0 (0.0%) |
| 55 to 64 Years | 0 (0.0%) | 0 (0.0%) |
| 65 to 74 Years | 5 (100.0%) | 5 (100.0%) |
| 75 Years and over | 6 (100.0%) | 0 (0.0%) |
| Total | 33 (100.0%) | 22 (88.0%) |
Income Below Poverty Among Married-Couple Families in Chenega
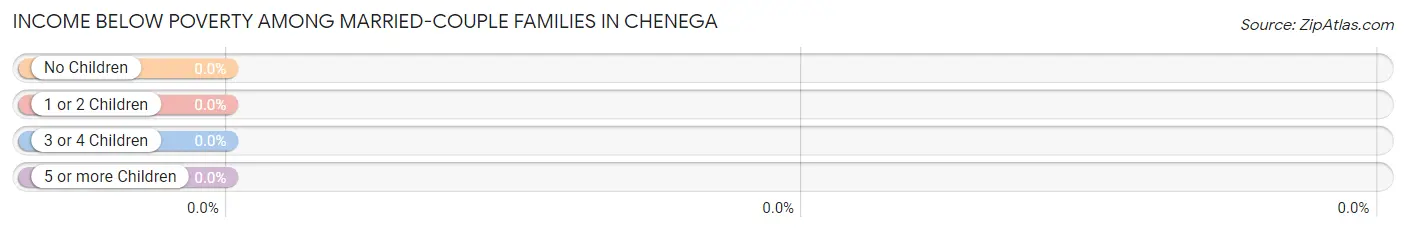
| Children | Above Poverty | Below Poverty |
| No Children | 8 (100.0%) | 0 (0.0%) |
| 1 or 2 Children | 1 (100.0%) | 0 (0.0%) |
| 3 or 4 Children | 2 (100.0%) | 0 (0.0%) |
| 5 or more Children | 0 (0.0%) | 0 (0.0%) |
| Total | 11 (100.0%) | 0 (0.0%) |
Income Below Poverty Among Single-Parent Households in Chenega
| Children | Single Father | Single Mother |
| No Children | 0 (0.0%) | 0 (0.0%) |
| 1 or 2 Children | 0 (0.0%) | 0 (0.0%) |
| 3 or 4 Children | 0 (0.0%) | 0 (0.0%) |
| 5 or more Children | 0 (0.0%) | 0 (0.0%) |
| Total | 0 (0.0%) | 0 (0.0%) |
Income Below Poverty Among Married-Couple vs Single-Parent Households in Chenega
| Children | Married-Couple Families | Single-Parent Households |
| No Children | 0 (0.0%) | 0 (0.0%) |
| 1 or 2 Children | 0 (0.0%) | 0 (0.0%) |
| 3 or 4 Children | 0 (0.0%) | 0 (0.0%) |
| 5 or more Children | 0 (0.0%) | 0 (0.0%) |
| Total | 0 (0.0%) | 0 (0.0%) |
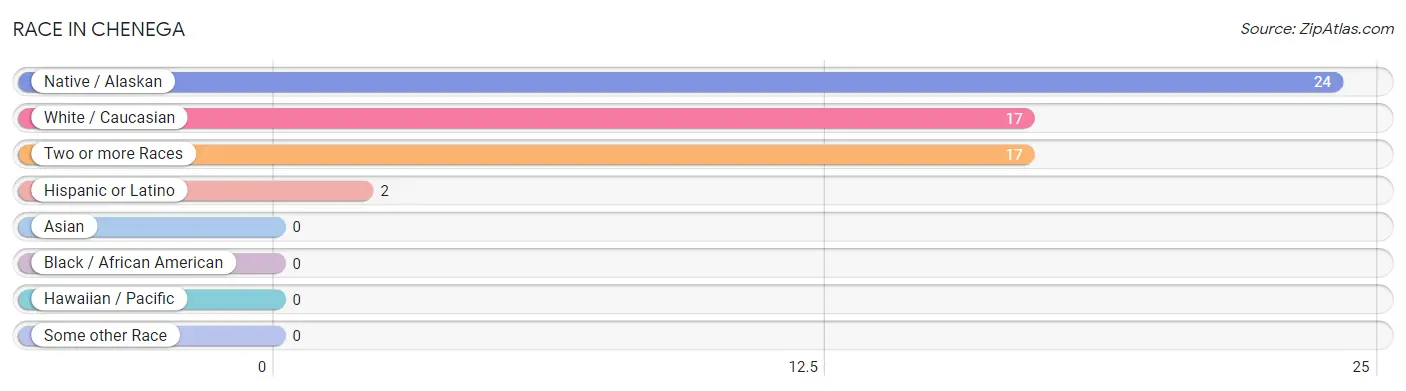
Race in Chenega
The most populous races in Chenega are Native / Alaskan (24 | 41.4%), White / Caucasian (17 | 29.3%), and Two or more Races (17 | 29.3%).
| Race | # Population | % Population |
| Asian | 0 | 0.0% |
| Black / African American | 0 | 0.0% |
| Hawaiian / Pacific | 0 | 0.0% |
| Hispanic or Latino | 2 | 3.5% |
| Native / Alaskan | 24 | 41.4% |
| White / Caucasian | 17 | 29.3% |
| Two or more Races | 17 | 29.3% |
| Some other Race | 0 | 0.0% |
| Total | 58 | 100.0% |
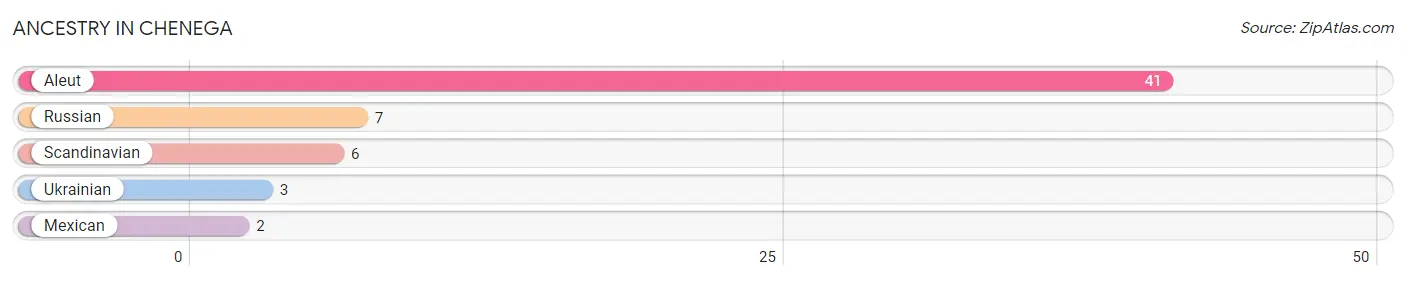
Ancestry in Chenega
The most populous ancestries reported in Chenega are Aleut (41 | 70.7%), Russian (7 | 12.1%), Scandinavian (6 | 10.3%), Ukrainian (3 | 5.2%), and Mexican (2 | 3.5%), together accounting for 101.7% of all Chenega residents.
| Ancestry | # Population | % Population |
| Aleut | 41 | 70.7% |
| Mexican | 2 | 3.5% |
| Russian | 7 | 12.1% |
| Scandinavian | 6 | 10.3% |
| Ukrainian | 3 | 5.2% | View All 5 Rows |
Immigrants in Chenega

| Immigration Origin | # Population | % Population | View All 0 Rows |
Sex and Age in Chenega
Sex and Age in Chenega
The most populous age groups in Chenega are 30 to 34 Years (8 | 24.2%) for men and 65 to 69 Years (5 | 20.0%) for women.
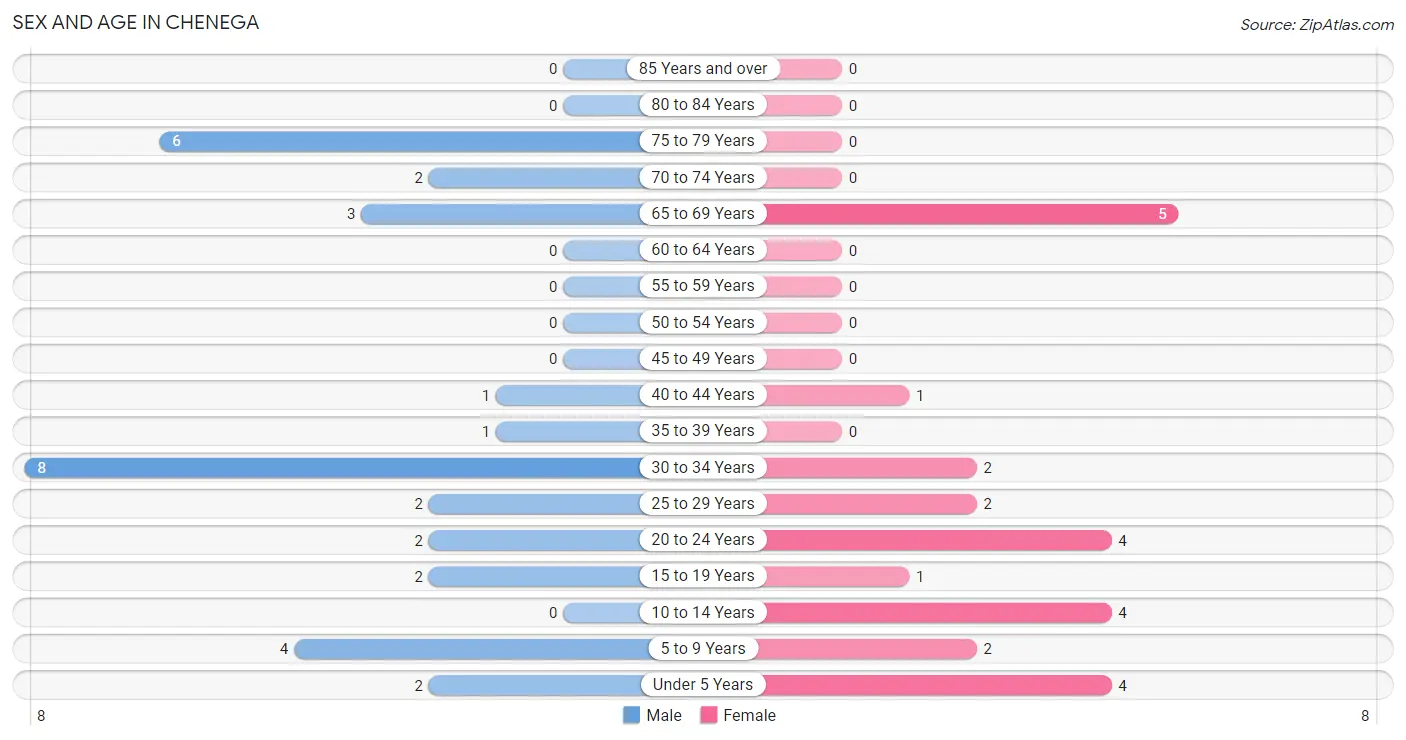
| Age Bracket | Male | Female |
| Under 5 Years | 2 (6.1%) | 4 (16.0%) |
| 5 to 9 Years | 4 (12.1%) | 2 (8.0%) |
| 10 to 14 Years | 0 (0.0%) | 4 (16.0%) |
| 15 to 19 Years | 2 (6.1%) | 1 (4.0%) |
| 20 to 24 Years | 2 (6.1%) | 4 (16.0%) |
| 25 to 29 Years | 2 (6.1%) | 2 (8.0%) |
| 30 to 34 Years | 8 (24.2%) | 2 (8.0%) |
| 35 to 39 Years | 1 (3.0%) | 0 (0.0%) |
| 40 to 44 Years | 1 (3.0%) | 1 (4.0%) |
| 45 to 49 Years | 0 (0.0%) | 0 (0.0%) |
| 50 to 54 Years | 0 (0.0%) | 0 (0.0%) |
| 55 to 59 Years | 0 (0.0%) | 0 (0.0%) |
| 60 to 64 Years | 0 (0.0%) | 0 (0.0%) |
| 65 to 69 Years | 3 (9.1%) | 5 (20.0%) |
| 70 to 74 Years | 2 (6.1%) | 0 (0.0%) |
| 75 to 79 Years | 6 (18.2%) | 0 (0.0%) |
| 80 to 84 Years | 0 (0.0%) | 0 (0.0%) |
| 85 Years and over | 0 (0.0%) | 0 (0.0%) |
| Total | 33 (100.0%) | 25 (100.0%) |
Families and Households in Chenega
Median Family Size in Chenega
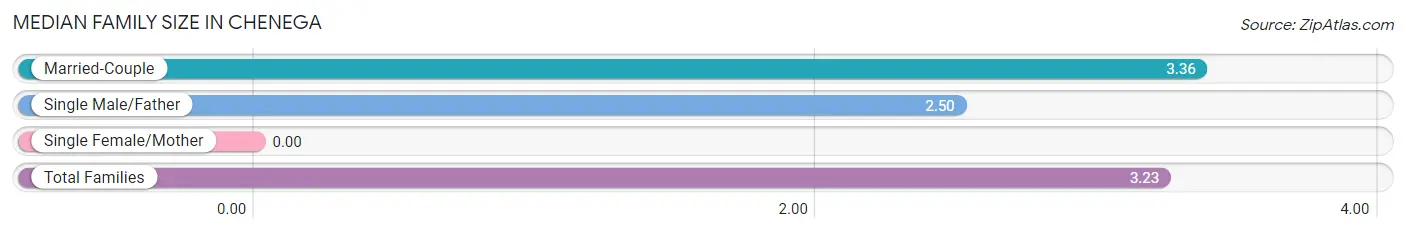
| Family Type | # Families | Family Size |
| Married-Couple | 11 (84.6%) | 3.36 |
| Single Male/Father | 2 (15.4%) | 2.50 |
| Single Female/Mother | 0 (0.0%) | - |
| Total Families | 13 (100.0%) | 3.23 |
Median Household Size in Chenega
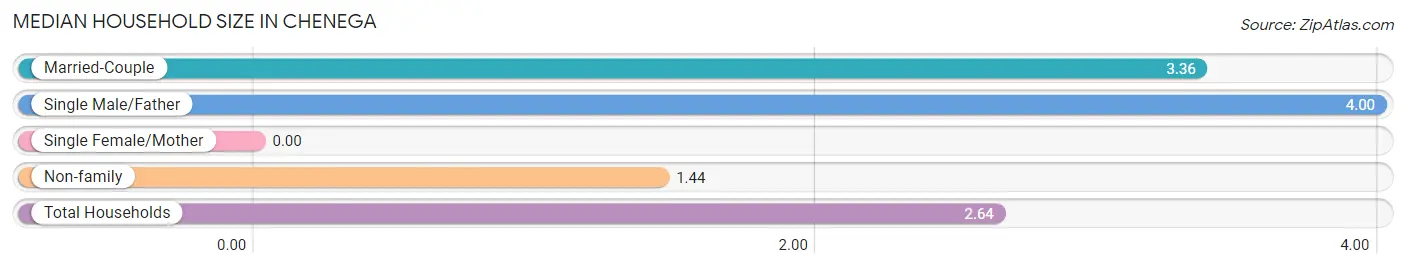
| Household Type | # Households | Household Size |
| Married-Couple | 11 (50.0%) | 3.36 |
| Single Male/Father | 2 (9.1%) | 4.00 |
| Single Female/Mother | 0 (0.0%) | - |
| Non-family | 9 (40.9%) | 1.44 |
| Total Households | 22 (100.0%) | 2.64 |
Household Size by Marriage Status in Chenega
Out of a total of 22 households in Chenega, 13 (59.1%) are family households, while 9 (40.9%) are nonfamily households. The most numerous type of family households are 2-person households, comprising 6, and the most common type of nonfamily households are 1-person households, comprising 7.
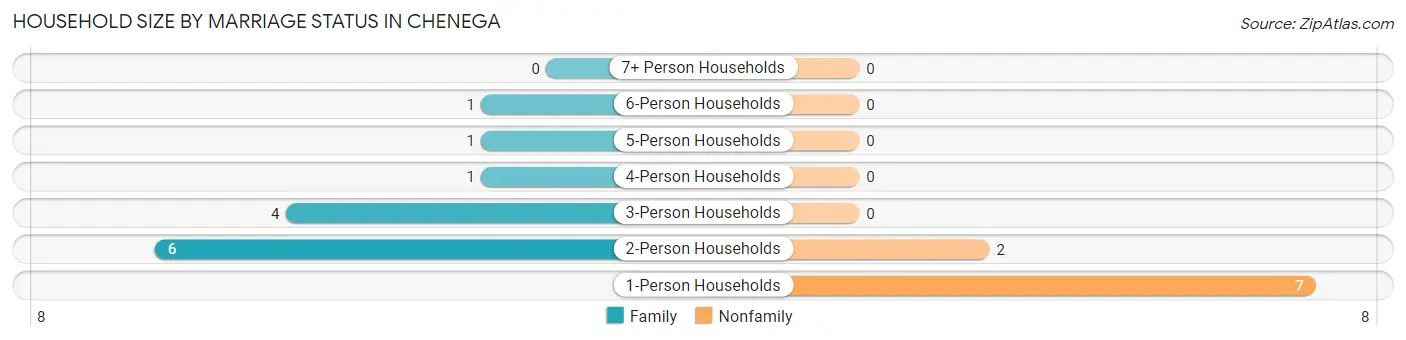
| Household Size | Family Households | Nonfamily Households |
| 1-Person Households | - | 7 (31.8%) |
| 2-Person Households | 6 (27.3%) | 2 (9.1%) |
| 3-Person Households | 4 (18.2%) | 0 (0.0%) |
| 4-Person Households | 1 (4.5%) | 0 (0.0%) |
| 5-Person Households | 1 (4.5%) | 0 (0.0%) |
| 6-Person Households | 1 (4.5%) | 0 (0.0%) |
| 7+ Person Households | 0 (0.0%) | 0 (0.0%) |
| Total | 13 (59.1%) | 9 (40.9%) |
Female Fertility in Chenega
Fertility by Age in Chenega
Average fertility rate in Chenega is 300.0 births per 1,000 women. Women in the age bracket of 20 to 34 years have the highest fertility rate with 375.0 births per 1,000 women. Women in the age bracket of 20 to 34 years acount for 100.0% of all women with births.
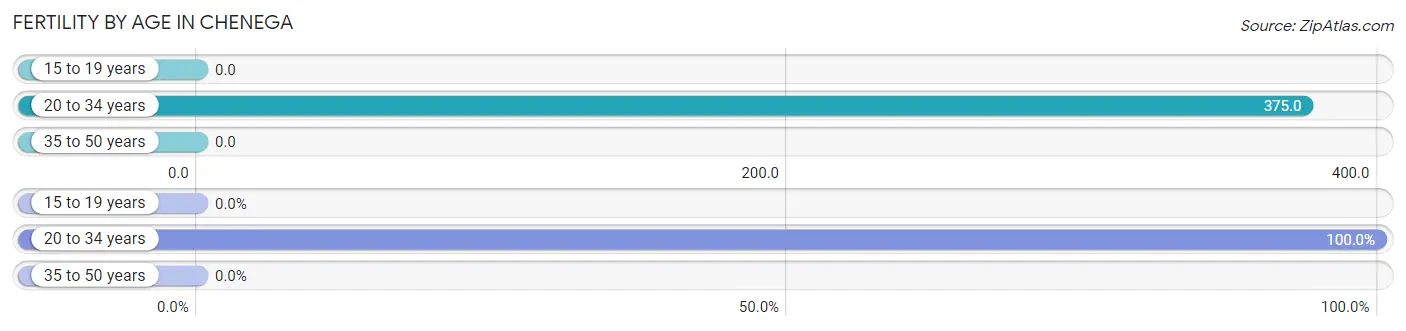
| Age Bracket | Women with Births | Births / 1,000 Women |
| 15 to 19 years | 0 (0.0%) | 0.0 |
| 20 to 34 years | 3 (100.0%) | 375.0 |
| 35 to 50 years | 0 (0.0%) | 0.0 |
| Total | 3 (100.0%) | 300.0 |
Fertility by Age by Marriage Status in Chenega
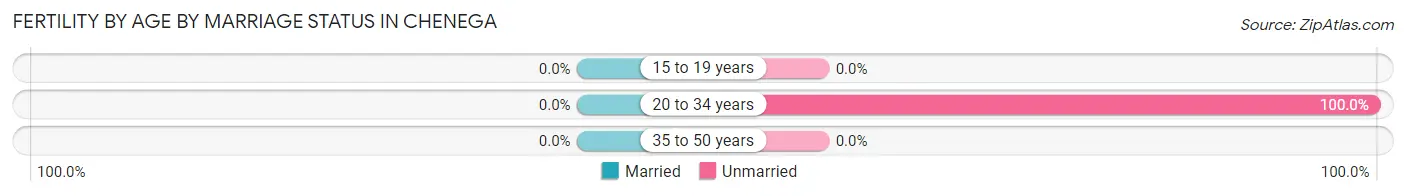
| Age Bracket | Married | Unmarried |
| 15 to 19 years | 0 (0.0%) | 0 (0.0%) |
| 20 to 34 years | 0 (0.0%) | 3 (100.0%) |
| 35 to 50 years | 0 (0.0%) | 0 (0.0%) |
| Total | 0 (0.0%) | 3 (100.0%) |
Fertility by Education in Chenega
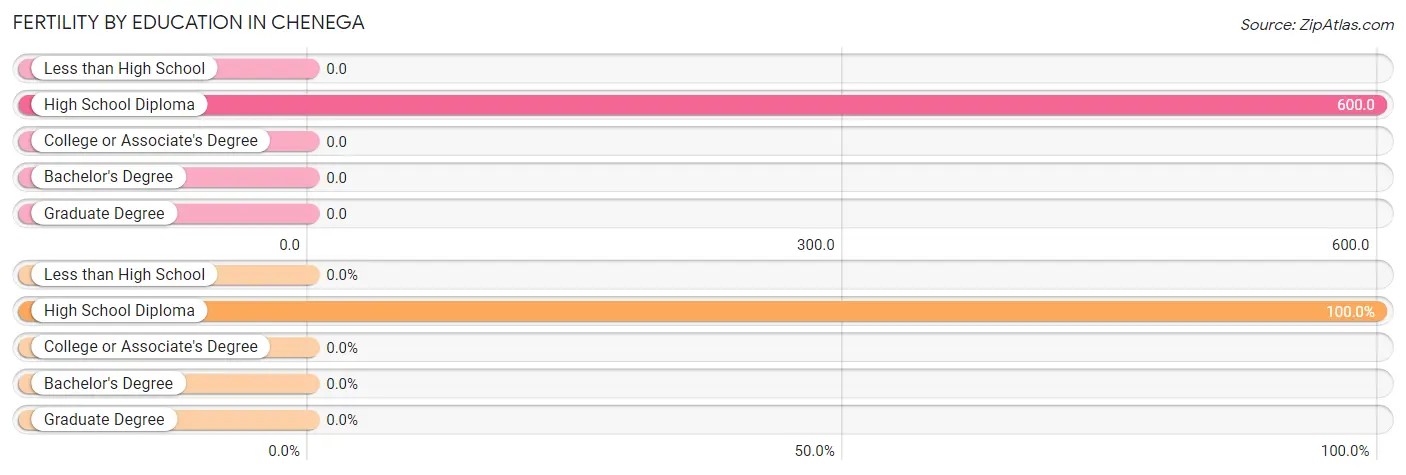
| Educational Attainment | Women with Births | Births / 1,000 Women |
| Less than High School | 0 (0.0%) | 0.0 |
| High School Diploma | 3 (100.0%) | 600.0 |
| College or Associate's Degree | 0 (0.0%) | 0.0 |
| Bachelor's Degree | 0 (0.0%) | 0.0 |
| Graduate Degree | 0 (0.0%) | 0.0 |
| Total | 3 (100.0%) | 300.0 |
Fertility by Education by Marriage Status in Chenega
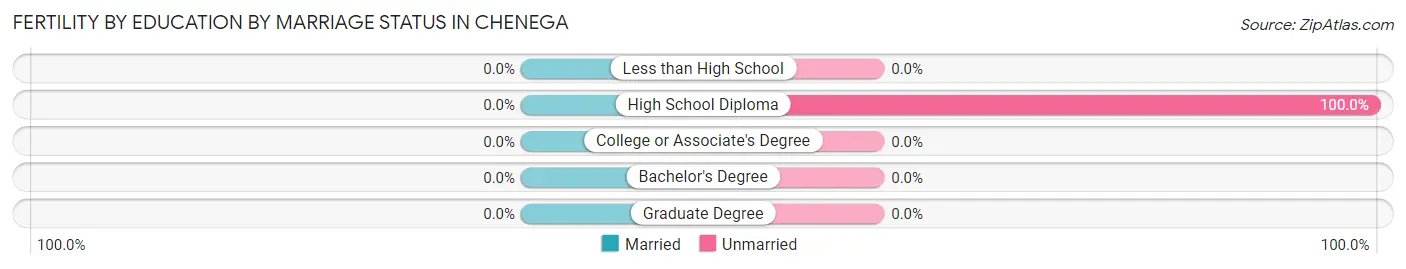
| Educational Attainment | Married | Unmarried |
| Less than High School | 0 (0.0%) | 0 (0.0%) |
| High School Diploma | 0 (0.0%) | 3 (100.0%) |
| College or Associate's Degree | 0 (0.0%) | 0 (0.0%) |
| Bachelor's Degree | 0 (0.0%) | 0 (0.0%) |
| Graduate Degree | 0 (0.0%) | 0 (0.0%) |
| Total | 0 (0.0%) | 3 (100.0%) |
Employment Characteristics in Chenega
Employment by Class of Employer in Chenega
Among the 25 employed individuals in Chenega, local government employees (13 | 52.0%), not-for-profit organizations (8 | 32.0%), and private company employees (3 | 12.0%) make up the most common classes of employment.
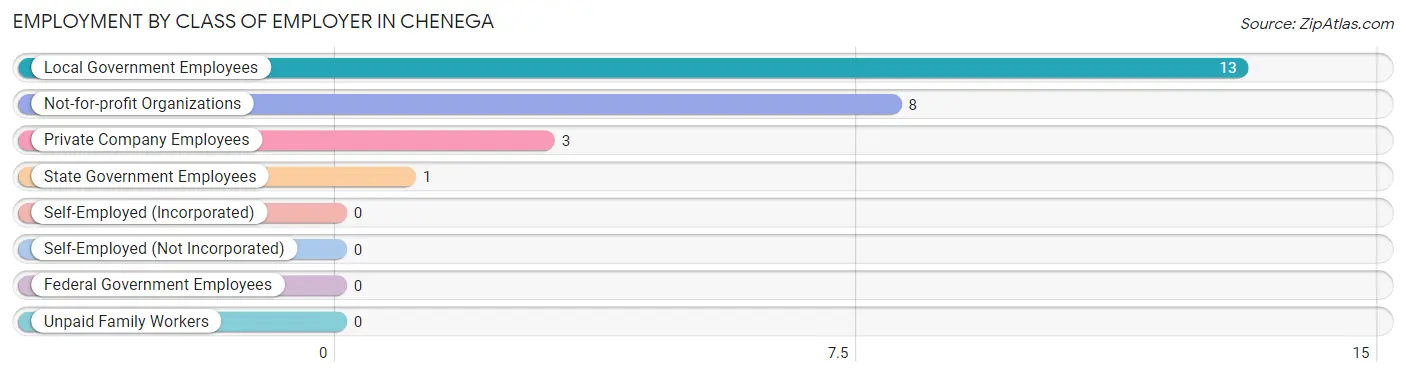
| Employer Class | # Employees | % Employees |
| Private Company Employees | 3 | 12.0% |
| Self-Employed (Incorporated) | 0 | 0.0% |
| Self-Employed (Not Incorporated) | 0 | 0.0% |
| Not-for-profit Organizations | 8 | 32.0% |
| Local Government Employees | 13 | 52.0% |
| State Government Employees | 1 | 4.0% |
| Federal Government Employees | 0 | 0.0% |
| Unpaid Family Workers | 0 | 0.0% |
| Total | 25 | 100.0% |
Employment Status by Age in Chenega
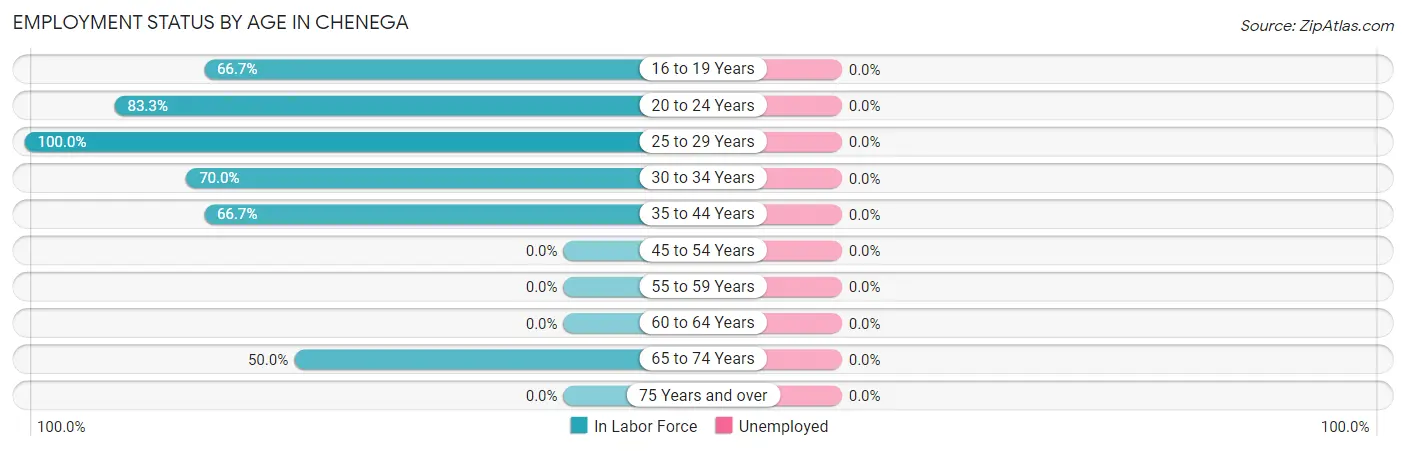
| Age Bracket | In Labor Force | Unemployed |
| 16 to 19 Years | 2 (66.7%) | 0 (0.0%) |
| 20 to 24 Years | 5 (83.3%) | 0 (0.0%) |
| 25 to 29 Years | 4 (100.0%) | 0 (0.0%) |
| 30 to 34 Years | 7 (70.0%) | 0 (0.0%) |
| 35 to 44 Years | 2 (66.7%) | 0 (0.0%) |
| 45 to 54 Years | 0 (0.0%) | 0 (0.0%) |
| 55 to 59 Years | 0 (0.0%) | 0 (0.0%) |
| 60 to 64 Years | 0 (0.0%) | 0 (0.0%) |
| 65 to 74 Years | 5 (50.0%) | 0 (0.0%) |
| 75 Years and over | 0 (0.0%) | 0 (0.0%) |
| Total | 25 (59.5%) | 0 (0.0%) |
Employment Status by Educational Attainment in Chenega
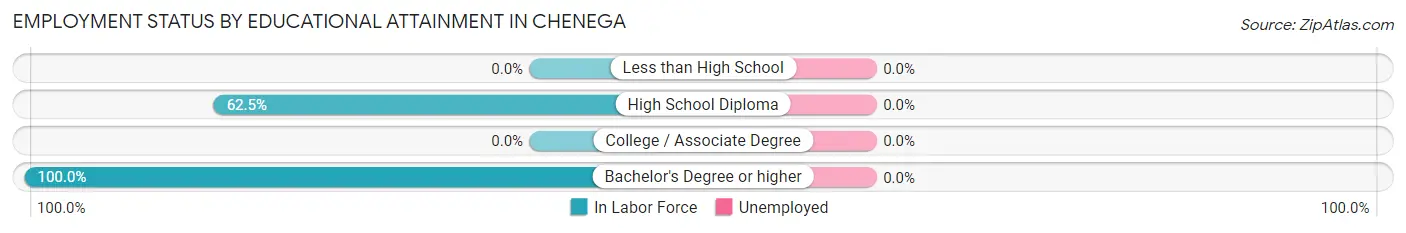
| Educational Attainment | In Labor Force | Unemployed |
| Less than High School | 0 (0.0%) | 0 (0.0%) |
| High School Diploma | 5 (62.5%) | 0 (0.0%) |
| College / Associate Degree | 0 (0.0%) | 0 (0.0%) |
| Bachelor's Degree or higher | 8 (100.0%) | 0 (0.0%) |
| Total | 13 (76.5%) | 0 (0.0%) |
Employment Occupations by Sex in Chenega
Management, Business, Science and Arts Occupations
The most common Management, Business, Science and Arts occupations in Chenega are Management (9 | 36.0%), Community & Social Service (2 | 8.0%), Education, Arts & Media (2 | 8.0%), Computers, Engineering & Science (1 | 4.0%), and Computers & Mathematics (1 | 4.0%).
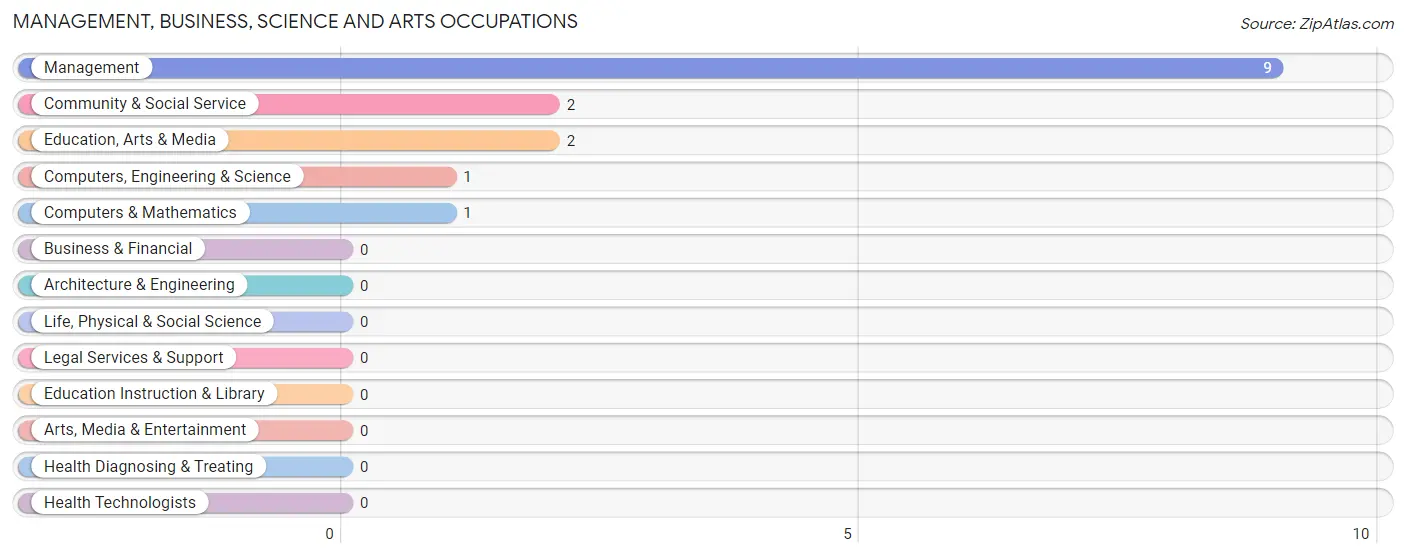
Management, Business, Science and Arts Occupations by Sex
Within the Management, Business, Science and Arts occupations in Chenega, the most male-oriented occupations are Computers, Engineering & Science (100.0%), Computers & Mathematics (100.0%), and Management (77.8%), while the most female-oriented occupations are Community & Social Service (100.0%), Education, Arts & Media (100.0%), and Management (22.2%).
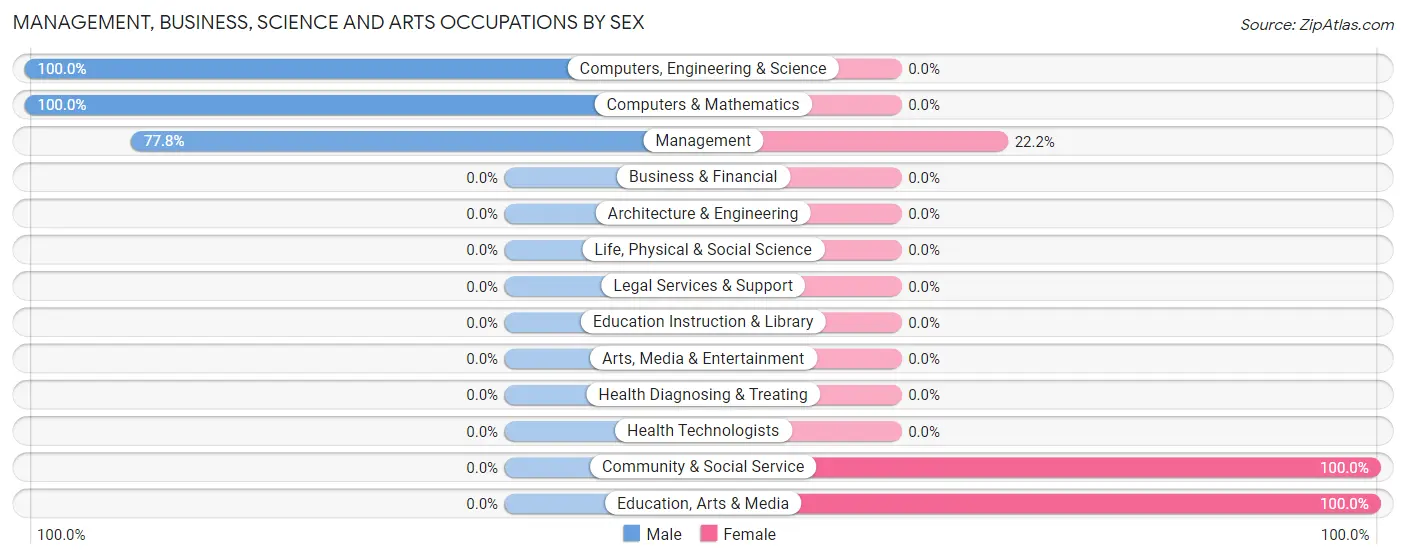
| Occupation | Male | Female |
| Management | 7 (77.8%) | 2 (22.2%) |
| Business & Financial | 0 (0.0%) | 0 (0.0%) |
| Computers, Engineering & Science | 1 (100.0%) | 0 (0.0%) |
| Computers & Mathematics | 1 (100.0%) | 0 (0.0%) |
| Architecture & Engineering | 0 (0.0%) | 0 (0.0%) |
| Life, Physical & Social Science | 0 (0.0%) | 0 (0.0%) |
| Community & Social Service | 0 (0.0%) | 2 (100.0%) |
| Education, Arts & Media | 0 (0.0%) | 2 (100.0%) |
| Legal Services & Support | 0 (0.0%) | 0 (0.0%) |
| Education Instruction & Library | 0 (0.0%) | 0 (0.0%) |
| Arts, Media & Entertainment | 0 (0.0%) | 0 (0.0%) |
| Health Diagnosing & Treating | 0 (0.0%) | 0 (0.0%) |
| Health Technologists | 0 (0.0%) | 0 (0.0%) |
| Total (Category) | 8 (66.7%) | 4 (33.3%) |
| Total (Overall) | 16 (64.0%) | 9 (36.0%) |
Services Occupations
The most common Services occupations in Chenega are , and Healthcare Support (2 | 8.0%).
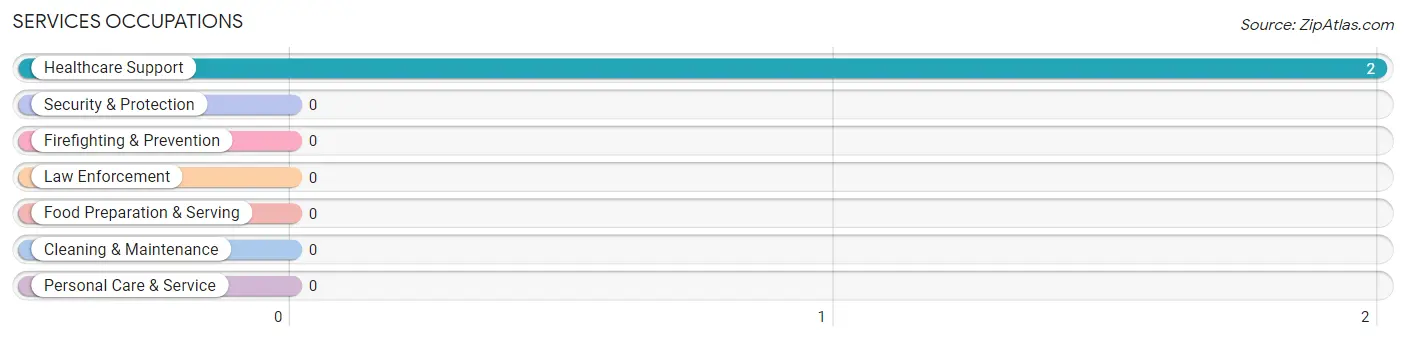
Services Occupations by Sex
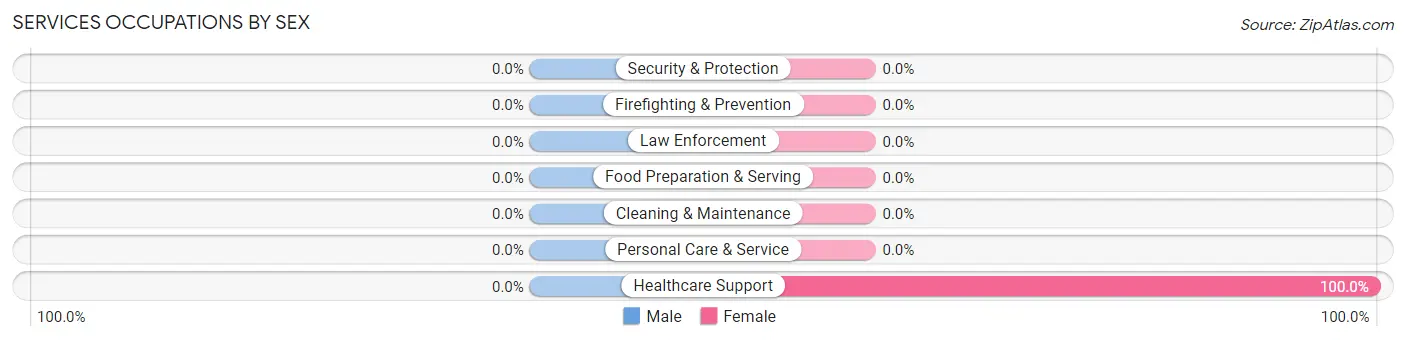
| Occupation | Male | Female |
| Healthcare Support | 0 (0.0%) | 2 (100.0%) |
| Security & Protection | 0 (0.0%) | 0 (0.0%) |
| Firefighting & Prevention | 0 (0.0%) | 0 (0.0%) |
| Law Enforcement | 0 (0.0%) | 0 (0.0%) |
| Food Preparation & Serving | 0 (0.0%) | 0 (0.0%) |
| Cleaning & Maintenance | 0 (0.0%) | 0 (0.0%) |
| Personal Care & Service | 0 (0.0%) | 0 (0.0%) |
| Total (Category) | 0 (0.0%) | 2 (100.0%) |
| Total (Overall) | 16 (64.0%) | 9 (36.0%) |
Sales and Office Occupations
The most common Sales and Office occupations in Chenega are , and Office & Administration (4 | 16.0%).

Sales and Office Occupations by Sex
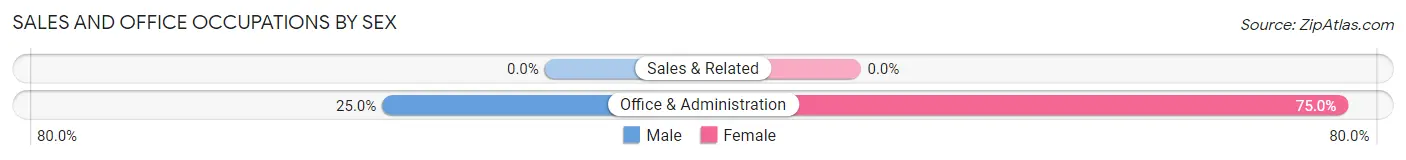
| Occupation | Male | Female |
| Sales & Related | 0 (0.0%) | 0 (0.0%) |
| Office & Administration | 1 (25.0%) | 3 (75.0%) |
| Total (Category) | 1 (25.0%) | 3 (75.0%) |
| Total (Overall) | 16 (64.0%) | 9 (36.0%) |
Natural Resources, Construction and Maintenance Occupations
The most common Natural Resources, Construction and Maintenance occupations in Chenega are Installation, Maintenance & Repair (3 | 12.0%), and Construction & Extraction (2 | 8.0%).
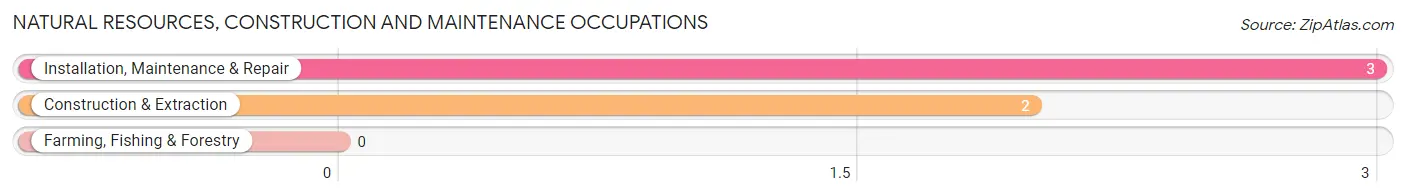
Natural Resources, Construction and Maintenance Occupations by Sex
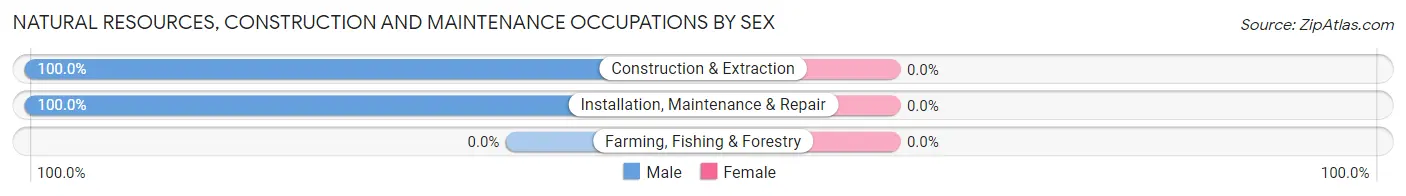
| Occupation | Male | Female |
| Farming, Fishing & Forestry | 0 (0.0%) | 0 (0.0%) |
| Construction & Extraction | 2 (100.0%) | 0 (0.0%) |
| Installation, Maintenance & Repair | 3 (100.0%) | 0 (0.0%) |
| Total (Category) | 5 (100.0%) | 0 (0.0%) |
| Total (Overall) | 16 (64.0%) | 9 (36.0%) |
Production, Transportation and Moving Occupations
The most common Production, Transportation and Moving occupations in Chenega are , and Material Moving (2 | 8.0%).
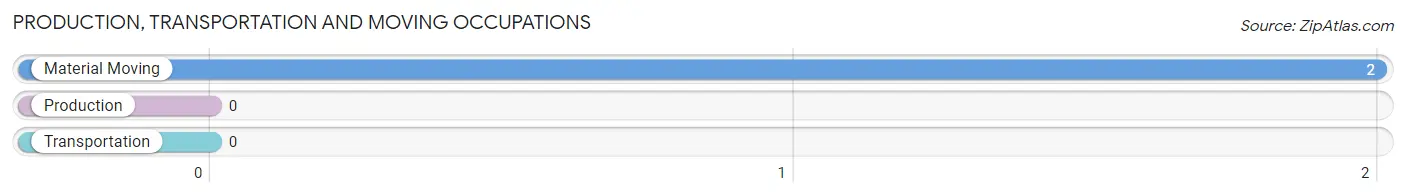
Production, Transportation and Moving Occupations by Sex
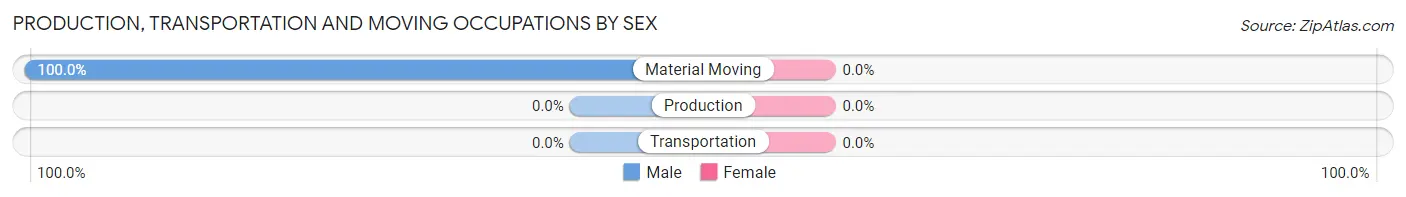
| Occupation | Male | Female |
| Production | 0 (0.0%) | 0 (0.0%) |
| Transportation | 0 (0.0%) | 0 (0.0%) |
| Material Moving | 2 (100.0%) | 0 (0.0%) |
| Total (Category) | 2 (100.0%) | 0 (0.0%) |
| Total (Overall) | 16 (64.0%) | 9 (36.0%) |
Employment Industries by Sex in Chenega
Employment Industries in Chenega
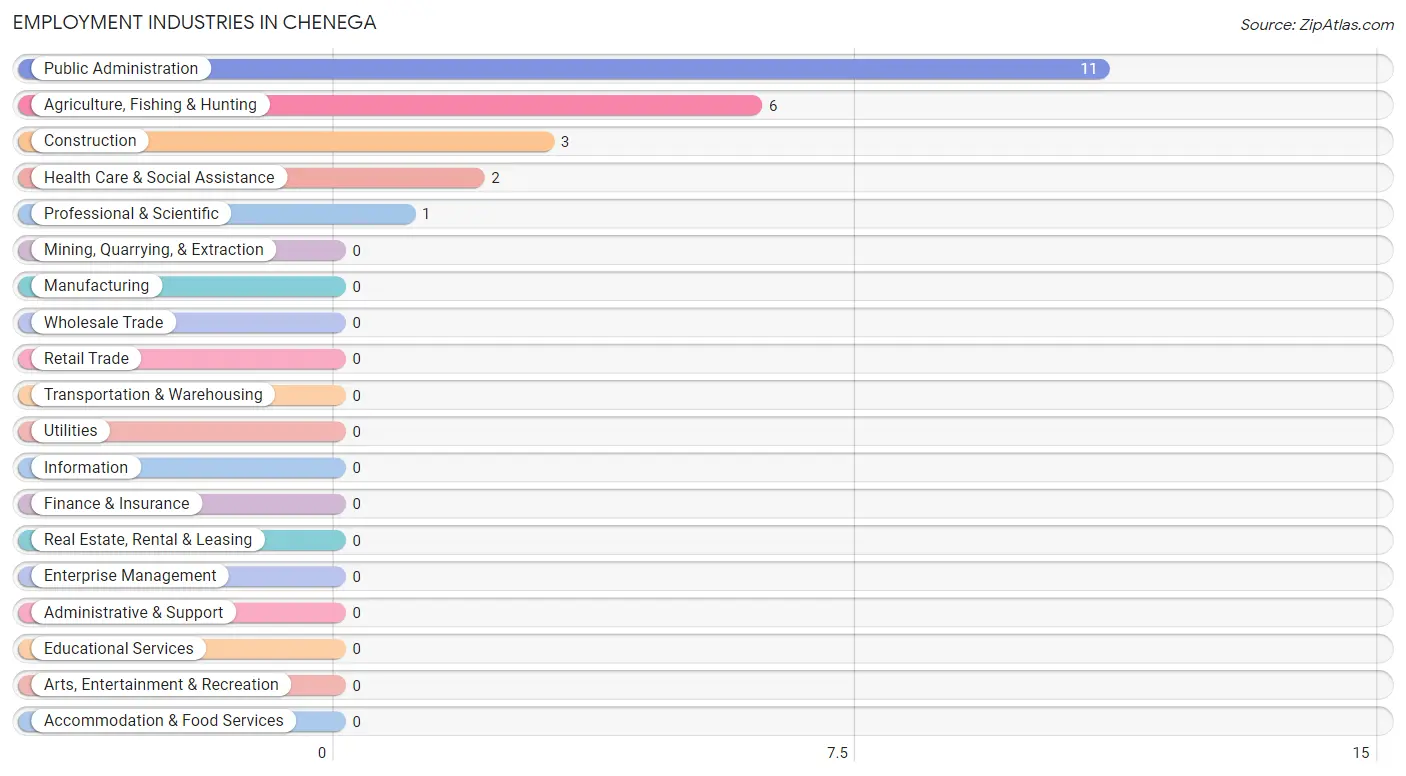
The major employment industries in Chenega include Public Administration (11 | 44.0%), Agriculture, Fishing & Hunting (6 | 24.0%), Construction (3 | 12.0%), Health Care & Social Assistance (2 | 8.0%), and Professional & Scientific (1 | 4.0%).
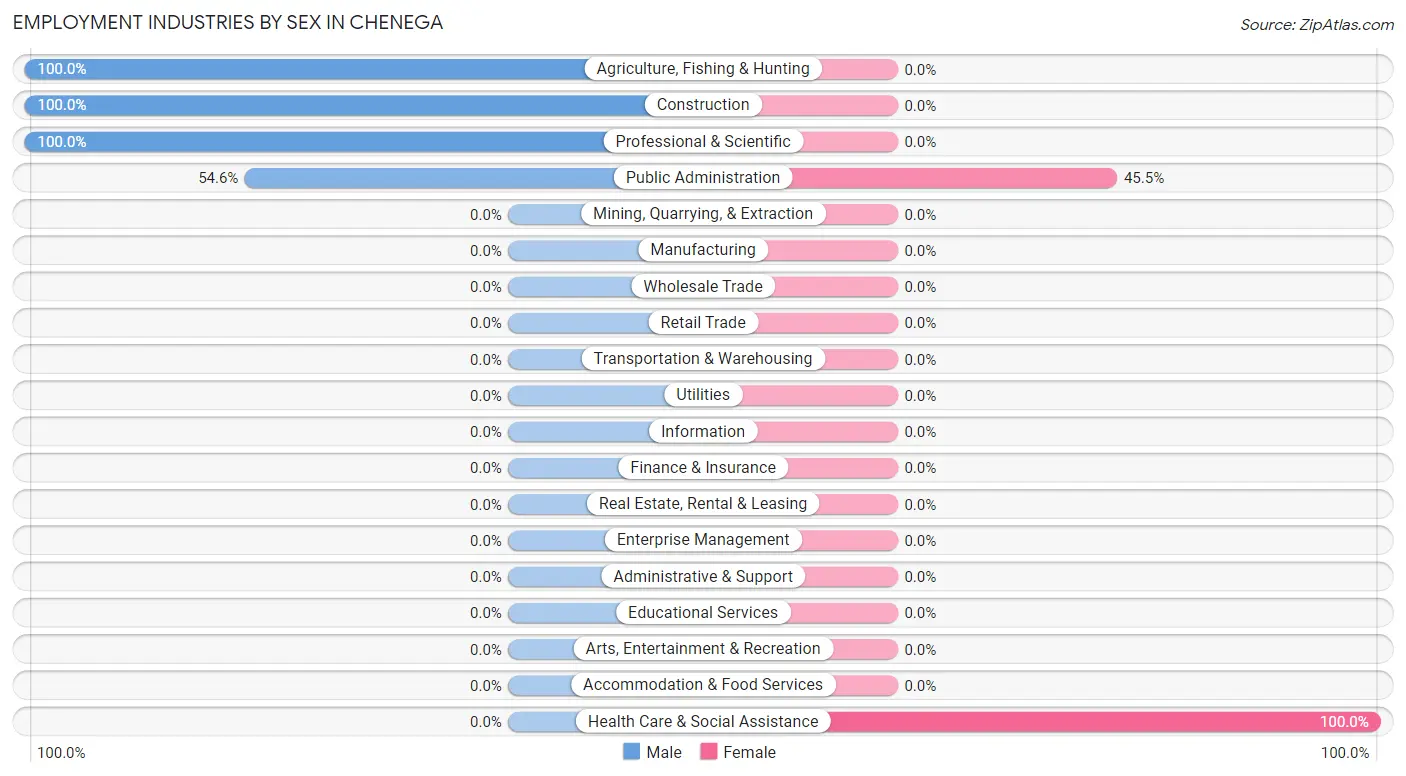
Employment Industries by Sex in Chenega
The Chenega industries that see more men than women are Agriculture, Fishing & Hunting (100.0%), Construction (100.0%), and Professional & Scientific (100.0%), whereas the industries that tend to have a higher number of women are Health Care & Social Assistance (100.0%), and Public Administration (45.5%).
| Industry | Male | Female |
| Agriculture, Fishing & Hunting | 6 (100.0%) | 0 (0.0%) |
| Mining, Quarrying, & Extraction | 0 (0.0%) | 0 (0.0%) |
| Construction | 3 (100.0%) | 0 (0.0%) |
| Manufacturing | 0 (0.0%) | 0 (0.0%) |
| Wholesale Trade | 0 (0.0%) | 0 (0.0%) |
| Retail Trade | 0 (0.0%) | 0 (0.0%) |
| Transportation & Warehousing | 0 (0.0%) | 0 (0.0%) |
| Utilities | 0 (0.0%) | 0 (0.0%) |
| Information | 0 (0.0%) | 0 (0.0%) |
| Finance & Insurance | 0 (0.0%) | 0 (0.0%) |
| Real Estate, Rental & Leasing | 0 (0.0%) | 0 (0.0%) |
| Professional & Scientific | 1 (100.0%) | 0 (0.0%) |
| Enterprise Management | 0 (0.0%) | 0 (0.0%) |
| Administrative & Support | 0 (0.0%) | 0 (0.0%) |
| Educational Services | 0 (0.0%) | 0 (0.0%) |
| Health Care & Social Assistance | 0 (0.0%) | 2 (100.0%) |
| Arts, Entertainment & Recreation | 0 (0.0%) | 0 (0.0%) |
| Accommodation & Food Services | 0 (0.0%) | 0 (0.0%) |
| Public Administration | 6 (54.5%) | 5 (45.5%) |
| Total | 16 (64.0%) | 9 (36.0%) |
Education in Chenega
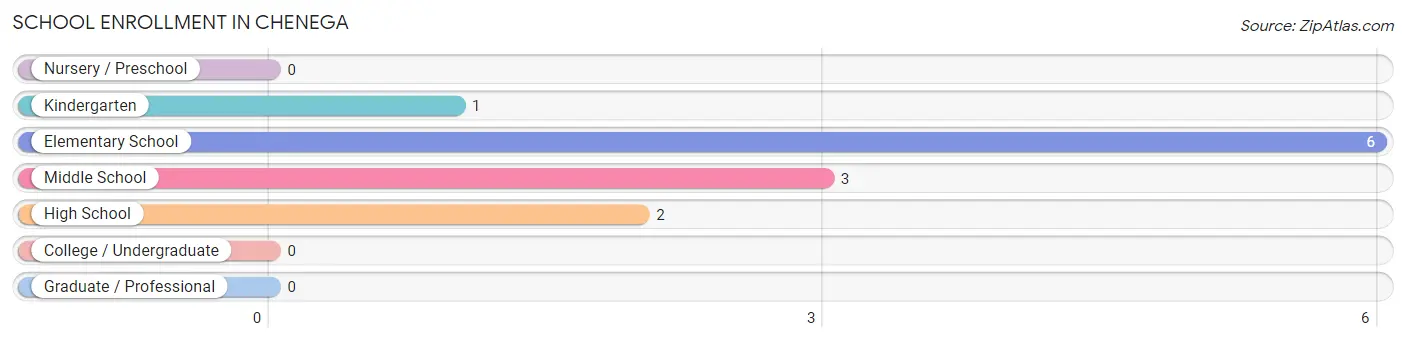
School Enrollment in Chenega
The most common levels of schooling among the 12 students in Chenega are elementary school (6 | 50.0%), middle school (3 | 25.0%), and high school (2 | 16.7%).
| School Level | # Students | % Students |
| Nursery / Preschool | 0 | 0.0% |
| Kindergarten | 1 | 8.3% |
| Elementary School | 6 | 50.0% |
| Middle School | 3 | 25.0% |
| High School | 2 | 16.7% |
| College / Undergraduate | 0 | 0.0% |
| Graduate / Professional | 0 | 0.0% |
| Total | 12 | 100.0% |
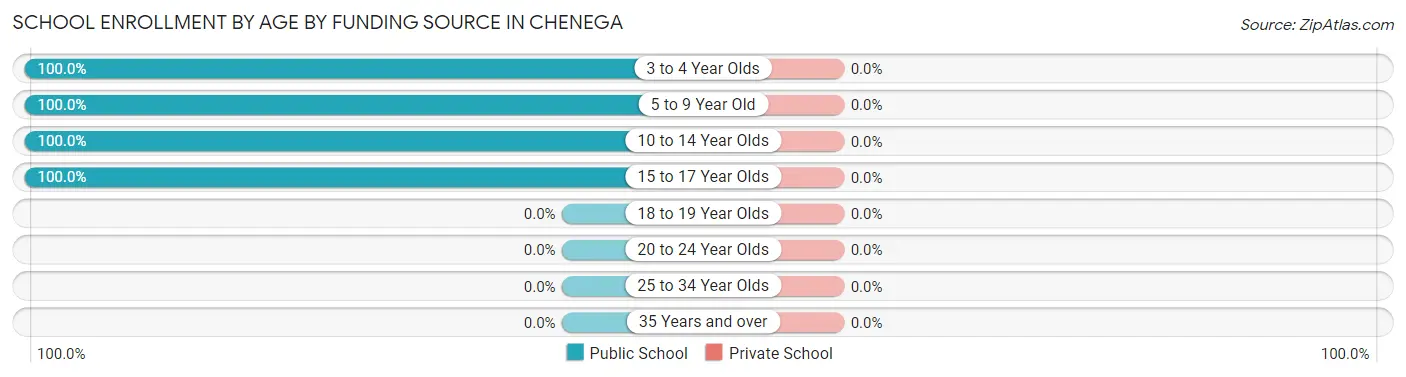
School Enrollment by Age by Funding Source in Chenega
| Age Bracket | Public School | Private School |
| 3 to 4 Year Olds | 1 (100.0%) | 0 (0.0%) |
| 5 to 9 Year Old | 6 (100.0%) | 0 (0.0%) |
| 10 to 14 Year Olds | 4 (100.0%) | 0 (0.0%) |
| 15 to 17 Year Olds | 1 (100.0%) | 0 (0.0%) |
| 18 to 19 Year Olds | 0 (0.0%) | 0 (0.0%) |
| 20 to 24 Year Olds | 0 (0.0%) | 0 (0.0%) |
| 25 to 34 Year Olds | 0 (0.0%) | 0 (0.0%) |
| 35 Years and over | 0 (0.0%) | 0 (0.0%) |
| Total | 12 (100.0%) | 0 (0.0%) |
Educational Attainment by Field of Study in Chenega
Bio, nature & agricultural (8 | 80.0%), and arts & humanities (2 | 20.0%) are the most common fields of study among 10 individuals in Chenega who have obtained a bachelor's degree or higher.
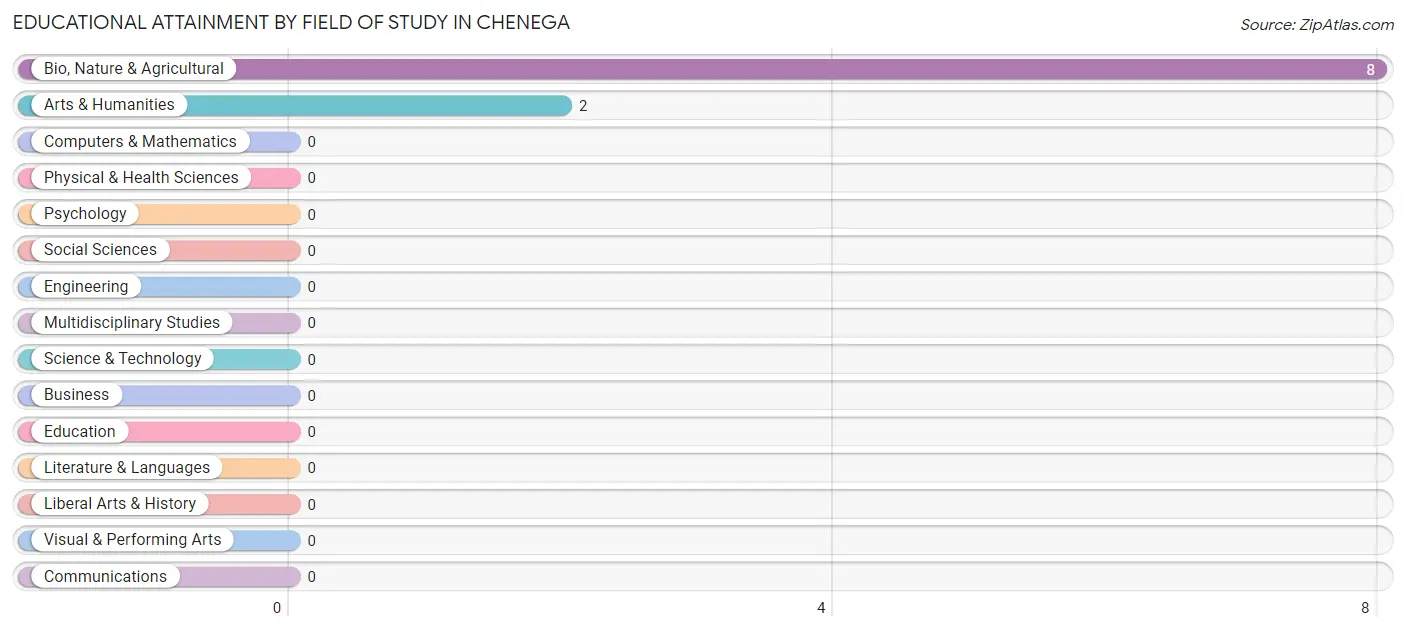
| Field of Study | # Graduates | % Graduates |
| Computers & Mathematics | 0 | 0.0% |
| Bio, Nature & Agricultural | 8 | 80.0% |
| Physical & Health Sciences | 0 | 0.0% |
| Psychology | 0 | 0.0% |
| Social Sciences | 0 | 0.0% |
| Engineering | 0 | 0.0% |
| Multidisciplinary Studies | 0 | 0.0% |
| Science & Technology | 0 | 0.0% |
| Business | 0 | 0.0% |
| Education | 0 | 0.0% |
| Literature & Languages | 0 | 0.0% |
| Liberal Arts & History | 0 | 0.0% |
| Visual & Performing Arts | 0 | 0.0% |
| Communications | 0 | 0.0% |
| Arts & Humanities | 2 | 20.0% |
| Total | 10 | 100.0% |
Transportation & Commute in Chenega
Vehicle Availability by Sex in Chenega
The most prevalent vehicle ownership categories in Chenega are males with no vehicle (12, accounting for 75.0%) and females with no vehicle (7, making up 133.3%).
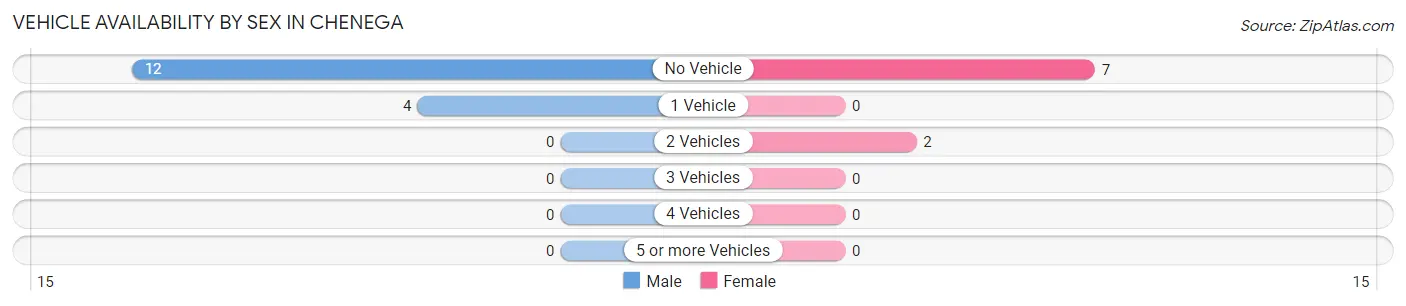
| Vehicles Available | Male | Female |
| No Vehicle | 12 (75.0%) | 7 (77.8%) |
| 1 Vehicle | 4 (25.0%) | 0 (0.0%) |
| 2 Vehicles | 0 (0.0%) | 2 (22.2%) |
| 3 Vehicles | 0 (0.0%) | 0 (0.0%) |
| 4 Vehicles | 0 (0.0%) | 0 (0.0%) |
| 5 or more Vehicles | 0 (0.0%) | 0 (0.0%) |
| Total | 16 (100.0%) | 9 (100.0%) |
Commute Time in Chenega
The most frequently occuring commute durations in Chenega are less than 5 minutes (22 commuters, 95.7%), 90 or more minutes (1 commuters, 4.3%), and 5 to 9 minutes (0 commuters, 0.0%).
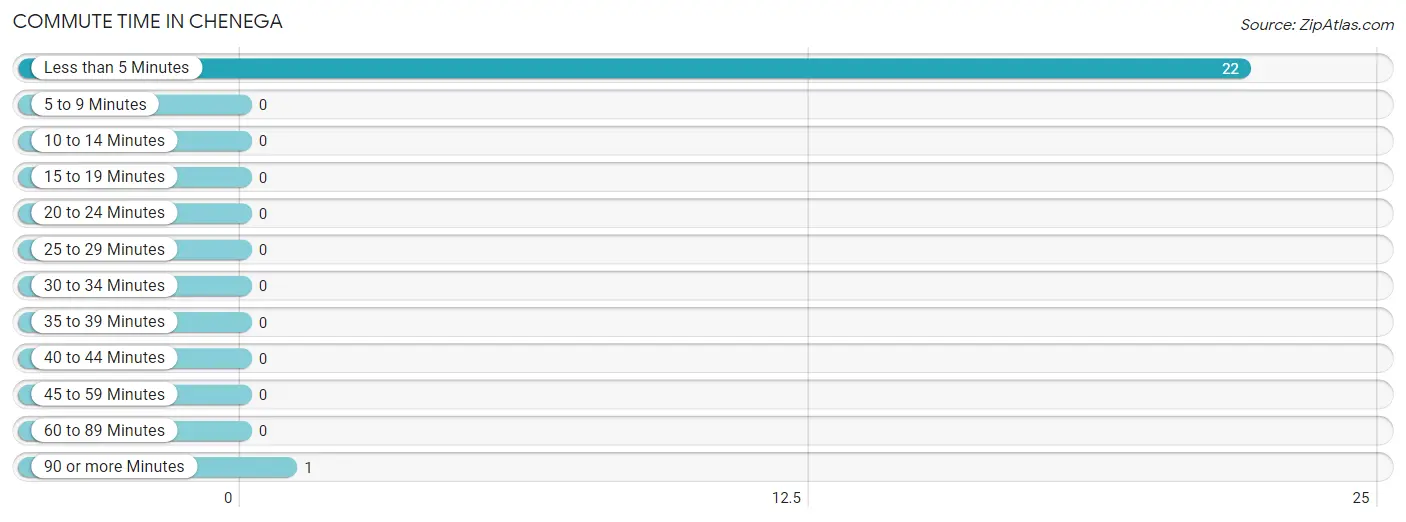
| Commute Time | # Commuters | % Commuters |
| Less than 5 Minutes | 22 | 95.7% |
| 5 to 9 Minutes | 0 | 0.0% |
| 10 to 14 Minutes | 0 | 0.0% |
| 15 to 19 Minutes | 0 | 0.0% |
| 20 to 24 Minutes | 0 | 0.0% |
| 25 to 29 Minutes | 0 | 0.0% |
| 30 to 34 Minutes | 0 | 0.0% |
| 35 to 39 Minutes | 0 | 0.0% |
| 40 to 44 Minutes | 0 | 0.0% |
| 45 to 59 Minutes | 0 | 0.0% |
| 60 to 89 Minutes | 0 | 0.0% |
| 90 or more Minutes | 1 | 4.3% |
Commute Time by Sex in Chenega
The most common commute times in Chenega are less than 5 minutes (13 commuters, 92.9%) for males and less than 5 minutes (9 commuters, 100.0%) for females.
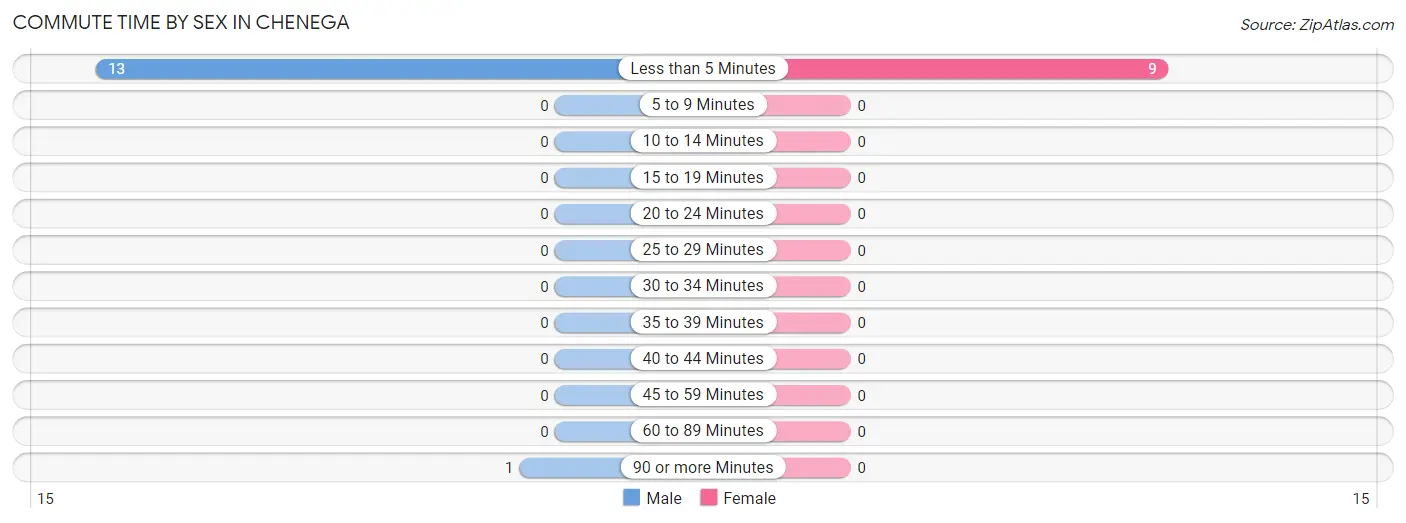
| Commute Time | Male | Female |
| Less than 5 Minutes | 13 (92.9%) | 9 (100.0%) |
| 5 to 9 Minutes | 0 (0.0%) | 0 (0.0%) |
| 10 to 14 Minutes | 0 (0.0%) | 0 (0.0%) |
| 15 to 19 Minutes | 0 (0.0%) | 0 (0.0%) |
| 20 to 24 Minutes | 0 (0.0%) | 0 (0.0%) |
| 25 to 29 Minutes | 0 (0.0%) | 0 (0.0%) |
| 30 to 34 Minutes | 0 (0.0%) | 0 (0.0%) |
| 35 to 39 Minutes | 0 (0.0%) | 0 (0.0%) |
| 40 to 44 Minutes | 0 (0.0%) | 0 (0.0%) |
| 45 to 59 Minutes | 0 (0.0%) | 0 (0.0%) |
| 60 to 89 Minutes | 0 (0.0%) | 0 (0.0%) |
| 90 or more Minutes | 1 (7.1%) | 0 (0.0%) |
Time of Departure to Work by Sex in Chenega
The most frequent times of departure to work in Chenega are 6:30 AM to 6:59 AM (5, 35.7%) for males and 8:00 AM to 8:29 AM (4, 44.4%) for females.
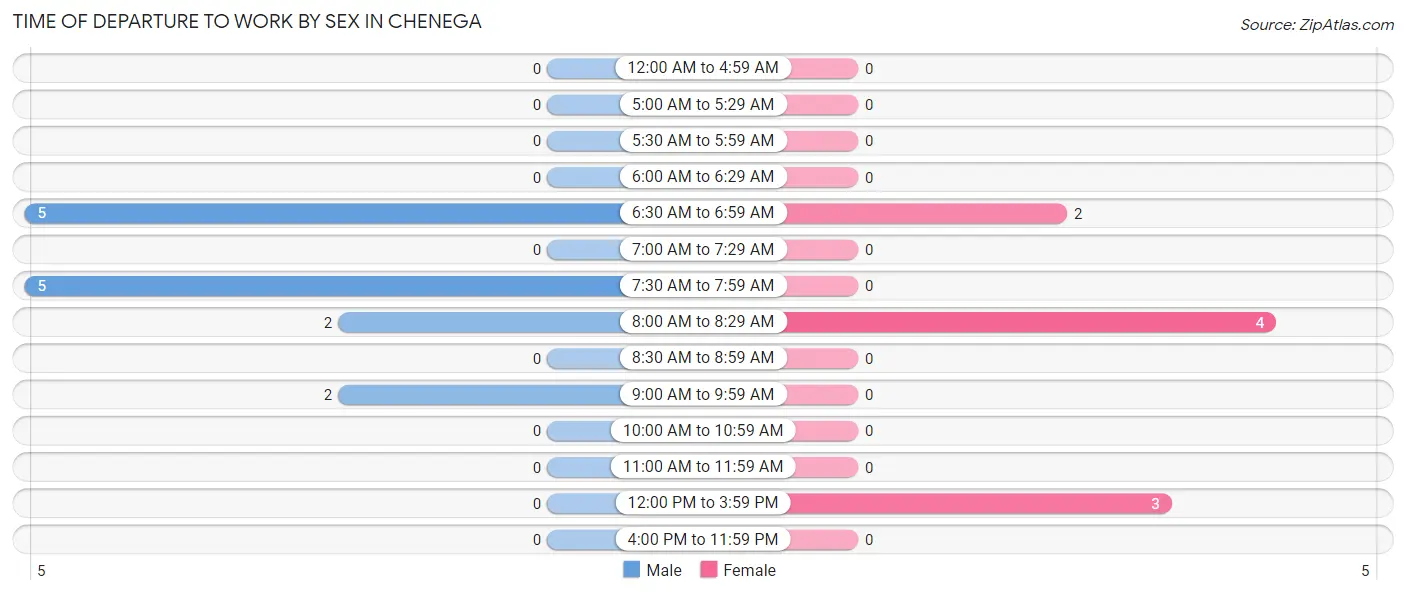
| Time of Departure | Male | Female |
| 12:00 AM to 4:59 AM | 0 (0.0%) | 0 (0.0%) |
| 5:00 AM to 5:29 AM | 0 (0.0%) | 0 (0.0%) |
| 5:30 AM to 5:59 AM | 0 (0.0%) | 0 (0.0%) |
| 6:00 AM to 6:29 AM | 0 (0.0%) | 0 (0.0%) |
| 6:30 AM to 6:59 AM | 5 (35.7%) | 2 (22.2%) |
| 7:00 AM to 7:29 AM | 0 (0.0%) | 0 (0.0%) |
| 7:30 AM to 7:59 AM | 5 (35.7%) | 0 (0.0%) |
| 8:00 AM to 8:29 AM | 2 (14.3%) | 4 (44.4%) |
| 8:30 AM to 8:59 AM | 0 (0.0%) | 0 (0.0%) |
| 9:00 AM to 9:59 AM | 2 (14.3%) | 0 (0.0%) |
| 10:00 AM to 10:59 AM | 0 (0.0%) | 0 (0.0%) |
| 11:00 AM to 11:59 AM | 0 (0.0%) | 0 (0.0%) |
| 12:00 PM to 3:59 PM | 0 (0.0%) | 3 (33.3%) |
| 4:00 PM to 11:59 PM | 0 (0.0%) | 0 (0.0%) |
| Total | 14 (100.0%) | 9 (100.0%) |
Housing Occupancy in Chenega
Occupancy by Ownership in Chenega
Of the total 22 dwellings in Chenega, owner-occupied units account for 8 (36.4%), while renter-occupied units make up 14 (63.6%).
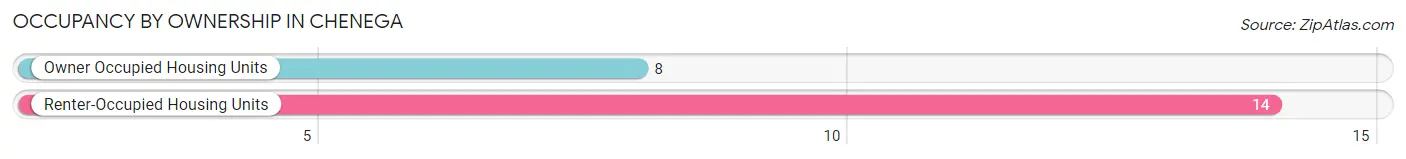
| Occupancy | # Housing Units | % Housing Units |
| Owner Occupied Housing Units | 8 | 36.4% |
| Renter-Occupied Housing Units | 14 | 63.6% |
| Total Occupied Housing Units | 22 | 100.0% |
Occupancy by Household Size in Chenega
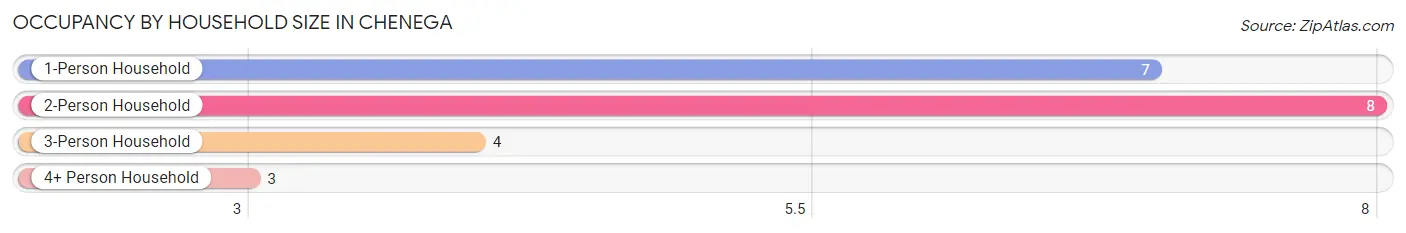
| Household Size | # Housing Units | % Housing Units |
| 1-Person Household | 7 | 31.8% |
| 2-Person Household | 8 | 36.4% |
| 3-Person Household | 4 | 18.2% |
| 4+ Person Household | 3 | 13.6% |
| Total Housing Units | 22 | 100.0% |
Occupancy by Ownership by Household Size in Chenega
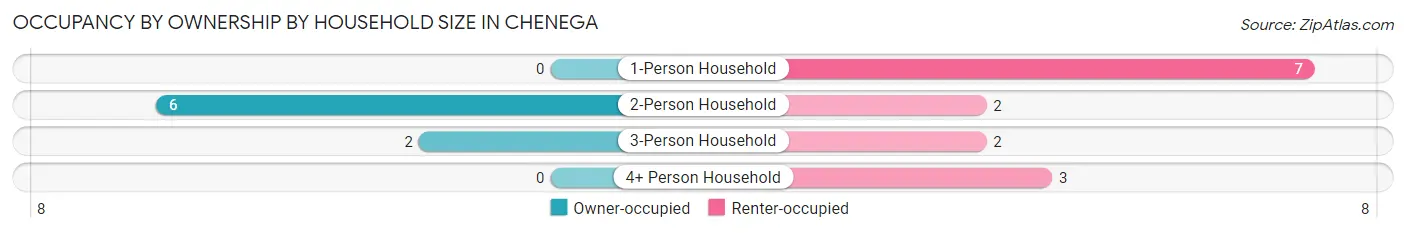
| Household Size | Owner-occupied | Renter-occupied |
| 1-Person Household | 0 (0.0%) | 7 (100.0%) |
| 2-Person Household | 6 (75.0%) | 2 (25.0%) |
| 3-Person Household | 2 (50.0%) | 2 (50.0%) |
| 4+ Person Household | 0 (0.0%) | 3 (100.0%) |
| Total Housing Units | 8 (36.4%) | 14 (63.6%) |
Occupancy by Educational Attainment in Chenega
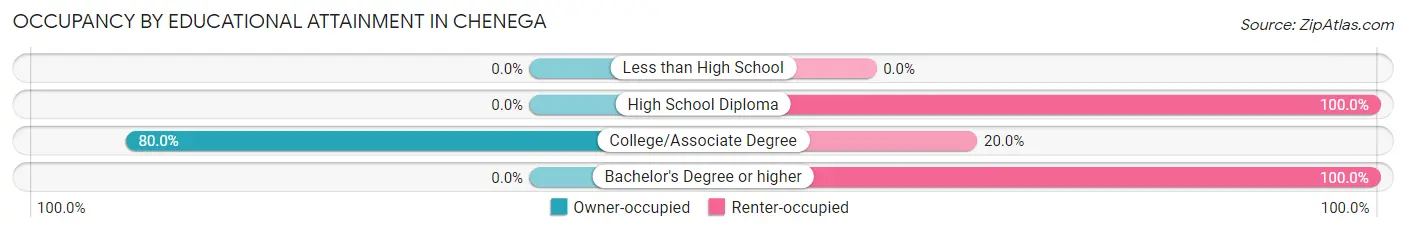
| Household Size | Owner-occupied | Renter-occupied |
| Less than High School | 0 (0.0%) | 0 (0.0%) |
| High School Diploma | 0 (0.0%) | 8 (100.0%) |
| College/Associate Degree | 8 (80.0%) | 2 (20.0%) |
| Bachelor's Degree or higher | 0 (0.0%) | 4 (100.0%) |
Occupancy by Age of Householder in Chenega
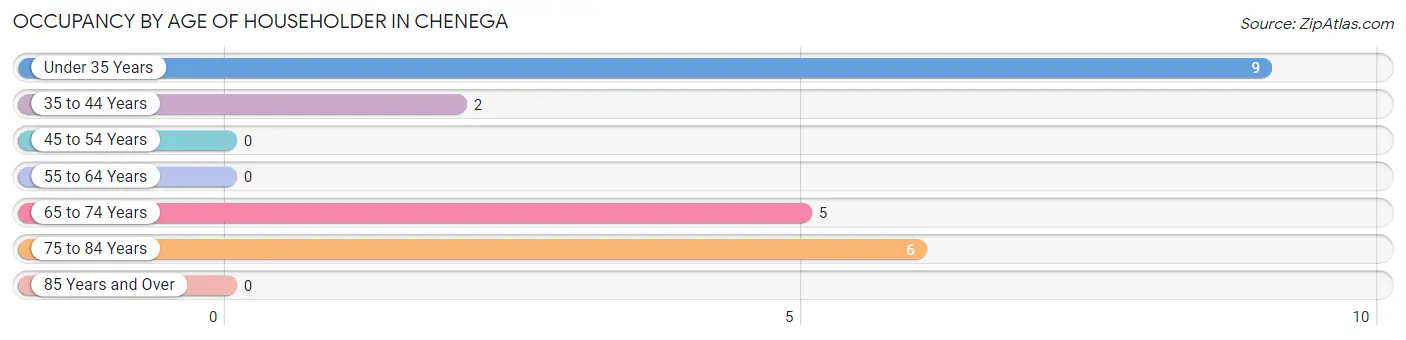
| Age Bracket | # Households | % Households |
| Under 35 Years | 9 | 40.9% |
| 35 to 44 Years | 2 | 9.1% |
| 45 to 54 Years | 0 | 0.0% |
| 55 to 64 Years | 0 | 0.0% |
| 65 to 74 Years | 5 | 22.7% |
| 75 to 84 Years | 6 | 27.3% |
| 85 Years and Over | 0 | 0.0% |
| Total | 22 | 100.0% |
Housing Finances in Chenega
Median Income by Occupancy in Chenega
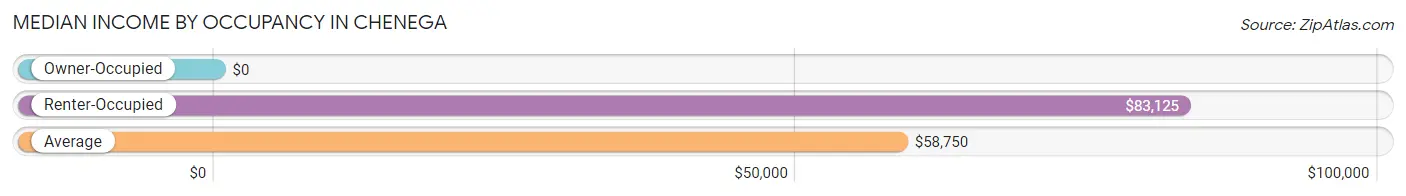
| Occupancy Type | # Households | Median Income |
| Owner-Occupied | 8 (36.4%) | $0 |
| Renter-Occupied | 14 (63.6%) | $83,125 |
| Average | 22 (100.0%) | $58,750 |
Occupancy by Householder Income Bracket in Chenega
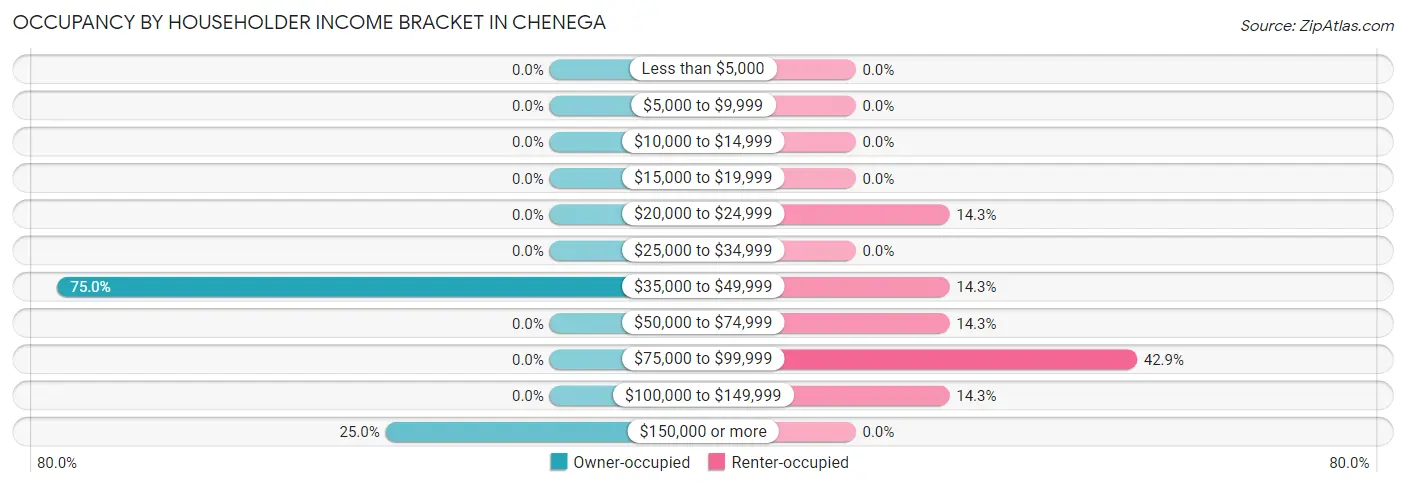
| Income Bracket | Owner-occupied | Renter-occupied |
| Less than $5,000 | 0 (0.0%) | 0 (0.0%) |
| $5,000 to $9,999 | 0 (0.0%) | 0 (0.0%) |
| $10,000 to $14,999 | 0 (0.0%) | 0 (0.0%) |
| $15,000 to $19,999 | 0 (0.0%) | 0 (0.0%) |
| $20,000 to $24,999 | 0 (0.0%) | 2 (14.3%) |
| $25,000 to $34,999 | 0 (0.0%) | 0 (0.0%) |
| $35,000 to $49,999 | 6 (75.0%) | 2 (14.3%) |
| $50,000 to $74,999 | 0 (0.0%) | 2 (14.3%) |
| $75,000 to $99,999 | 0 (0.0%) | 6 (42.9%) |
| $100,000 to $149,999 | 0 (0.0%) | 2 (14.3%) |
| $150,000 or more | 2 (25.0%) | 0 (0.0%) |
| Total | 8 (100.0%) | 14 (100.0%) |
Monthly Housing Cost Tiers in Chenega
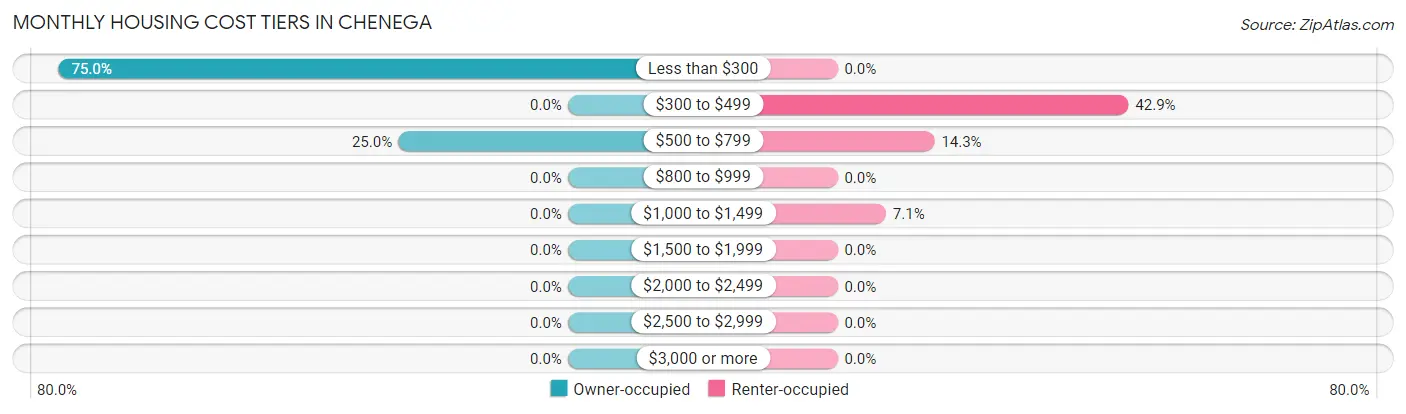
| Monthly Cost | Owner-occupied | Renter-occupied |
| Less than $300 | 6 (75.0%) | 0 (0.0%) |
| $300 to $499 | 0 (0.0%) | 6 (42.9%) |
| $500 to $799 | 2 (25.0%) | 2 (14.3%) |
| $800 to $999 | 0 (0.0%) | 0 (0.0%) |
| $1,000 to $1,499 | 0 (0.0%) | 1 (7.1%) |
| $1,500 to $1,999 | 0 (0.0%) | 0 (0.0%) |
| $2,000 to $2,499 | 0 (0.0%) | 0 (0.0%) |
| $2,500 to $2,999 | 0 (0.0%) | 0 (0.0%) |
| $3,000 or more | 0 (0.0%) | 0 (0.0%) |
| Total | 8 (100.0%) | 14 (100.0%) |
Physical Housing Characteristics in Chenega
Housing Structures in Chenega
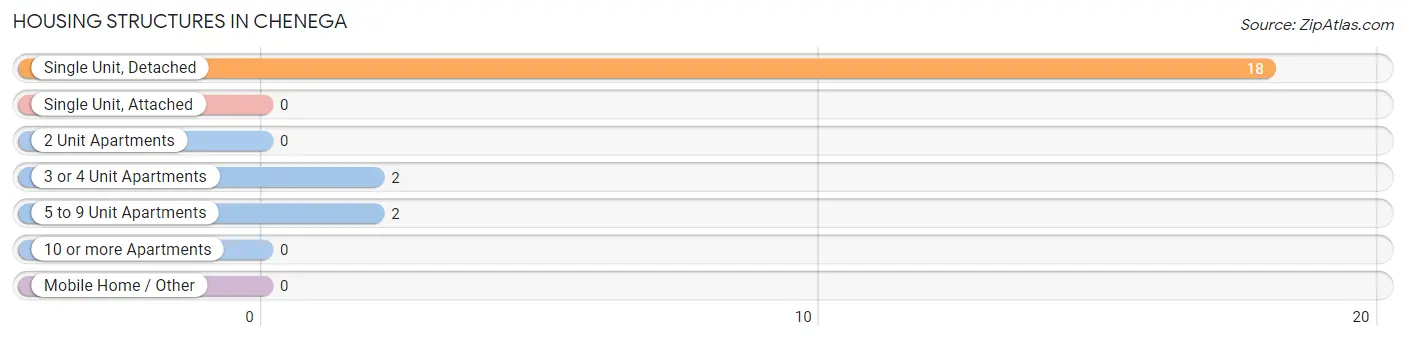
| Structure Type | # Housing Units | % Housing Units |
| Single Unit, Detached | 18 | 81.8% |
| Single Unit, Attached | 0 | 0.0% |
| 2 Unit Apartments | 0 | 0.0% |
| 3 or 4 Unit Apartments | 2 | 9.1% |
| 5 to 9 Unit Apartments | 2 | 9.1% |
| 10 or more Apartments | 0 | 0.0% |
| Mobile Home / Other | 0 | 0.0% |
| Total | 22 | 100.0% |
Housing Structures by Occupancy in Chenega
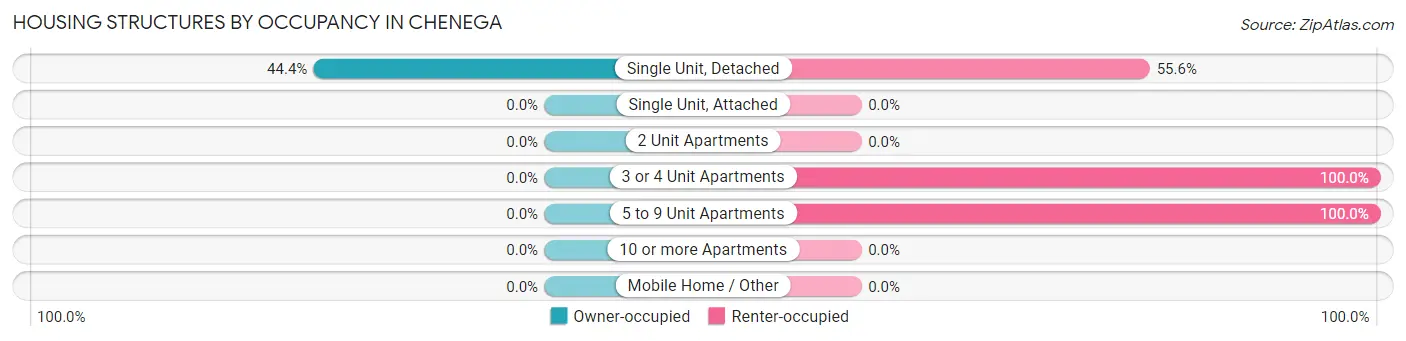
| Structure Type | Owner-occupied | Renter-occupied |
| Single Unit, Detached | 8 (44.4%) | 10 (55.6%) |
| Single Unit, Attached | 0 (0.0%) | 0 (0.0%) |
| 2 Unit Apartments | 0 (0.0%) | 0 (0.0%) |
| 3 or 4 Unit Apartments | 0 (0.0%) | 2 (100.0%) |
| 5 to 9 Unit Apartments | 0 (0.0%) | 2 (100.0%) |
| 10 or more Apartments | 0 (0.0%) | 0 (0.0%) |
| Mobile Home / Other | 0 (0.0%) | 0 (0.0%) |
| Total | 8 (36.4%) | 14 (63.6%) |
Housing Structures by Number of Rooms in Chenega
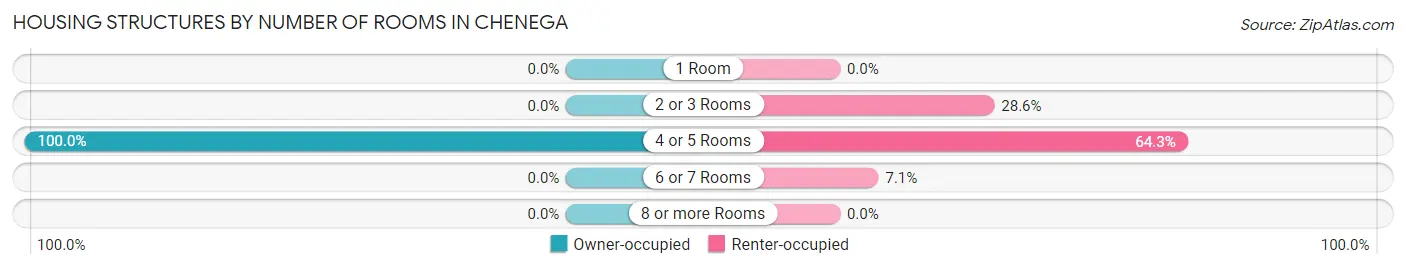
| Number of Rooms | Owner-occupied | Renter-occupied |
| 1 Room | 0 (0.0%) | 0 (0.0%) |
| 2 or 3 Rooms | 0 (0.0%) | 4 (28.6%) |
| 4 or 5 Rooms | 8 (100.0%) | 9 (64.3%) |
| 6 or 7 Rooms | 0 (0.0%) | 1 (7.1%) |
| 8 or more Rooms | 0 (0.0%) | 0 (0.0%) |
| Total | 8 (100.0%) | 14 (100.0%) |
Housing Structure by Heating Type in Chenega
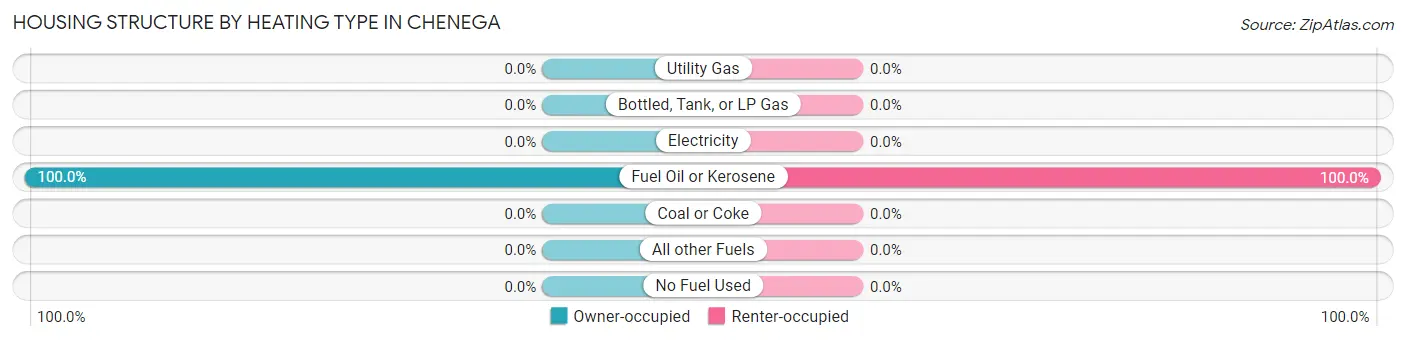
| Heating Type | Owner-occupied | Renter-occupied |
| Utility Gas | 0 (0.0%) | 0 (0.0%) |
| Bottled, Tank, or LP Gas | 0 (0.0%) | 0 (0.0%) |
| Electricity | 0 (0.0%) | 0 (0.0%) |
| Fuel Oil or Kerosene | 8 (100.0%) | 14 (100.0%) |
| Coal or Coke | 0 (0.0%) | 0 (0.0%) |
| All other Fuels | 0 (0.0%) | 0 (0.0%) |
| No Fuel Used | 0 (0.0%) | 0 (0.0%) |
| Total | 8 (100.0%) | 14 (100.0%) |
Household Vehicle Usage in Chenega
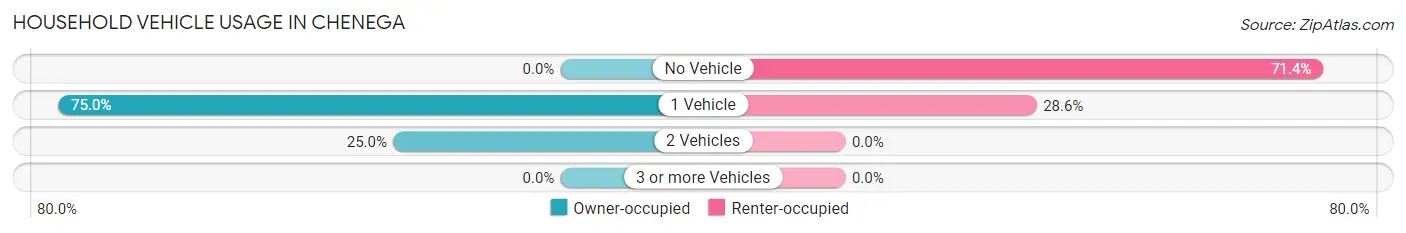
| Vehicles per Household | Owner-occupied | Renter-occupied |
| No Vehicle | 0 (0.0%) | 10 (71.4%) |
| 1 Vehicle | 6 (75.0%) | 4 (28.6%) |
| 2 Vehicles | 2 (25.0%) | 0 (0.0%) |
| 3 or more Vehicles | 0 (0.0%) | 0 (0.0%) |
| Total | 8 (100.0%) | 14 (100.0%) |
Real Estate & Mortgages in Chenega
Real Estate and Mortgage Overview in Chenega
| Characteristic | Without Mortgage | With Mortgage |
| Housing Units | 8 | 0 |
| Median Property Value | - | - |
| Median Household Income | - | - |
| Monthly Housing Costs | - | - |
| Real Estate Taxes | - | - |
Property Value by Mortgage Status in Chenega
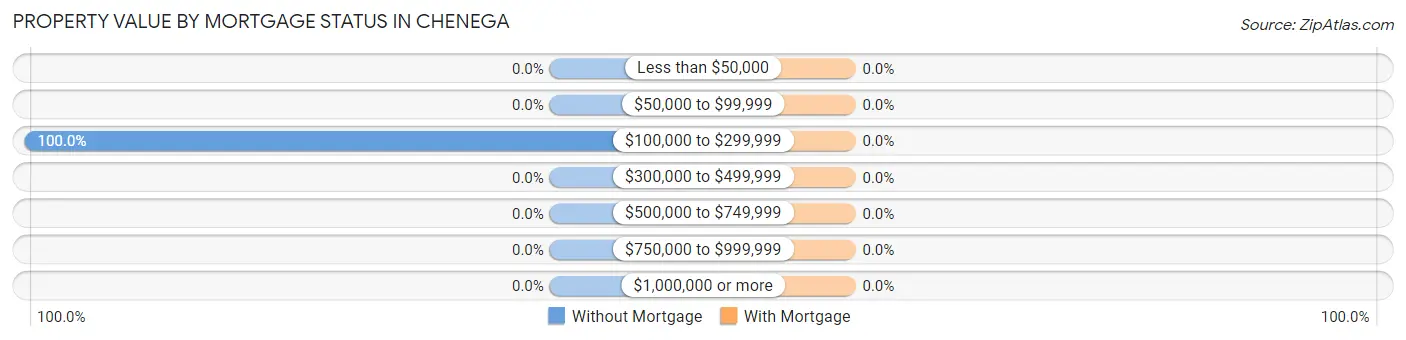
| Property Value | Without Mortgage | With Mortgage |
| Less than $50,000 | 0 (0.0%) | 0 (0.0%) |
| $50,000 to $99,999 | 0 (0.0%) | 0 (0.0%) |
| $100,000 to $299,999 | 8 (100.0%) | 0 (0.0%) |
| $300,000 to $499,999 | 0 (0.0%) | 0 (0.0%) |
| $500,000 to $749,999 | 0 (0.0%) | 0 (0.0%) |
| $750,000 to $999,999 | 0 (0.0%) | 0 (0.0%) |
| $1,000,000 or more | 0 (0.0%) | 0 (0.0%) |
| Total | 8 (100.0%) | 0 (0.0%) |
Household Income by Mortgage Status in Chenega
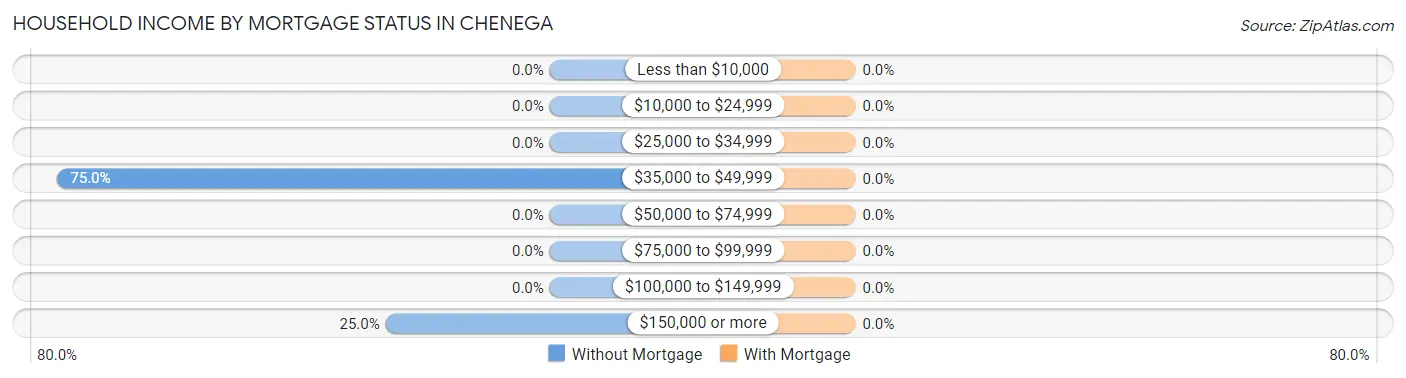
| Household Income | Without Mortgage | With Mortgage |
| Less than $10,000 | 0 (0.0%) | 0 (0.0%) |
| $10,000 to $24,999 | 0 (0.0%) | 0 (0.0%) |
| $25,000 to $34,999 | 0 (0.0%) | 0 (0.0%) |
| $35,000 to $49,999 | 6 (75.0%) | 0 (0.0%) |
| $50,000 to $74,999 | 0 (0.0%) | 0 (0.0%) |
| $75,000 to $99,999 | 0 (0.0%) | 0 (0.0%) |
| $100,000 to $149,999 | 0 (0.0%) | 0 (0.0%) |
| $150,000 or more | 2 (25.0%) | 0 (0.0%) |
| Total | 8 (100.0%) | 0 (0.0%) |
Property Value to Household Income Ratio in Chenega
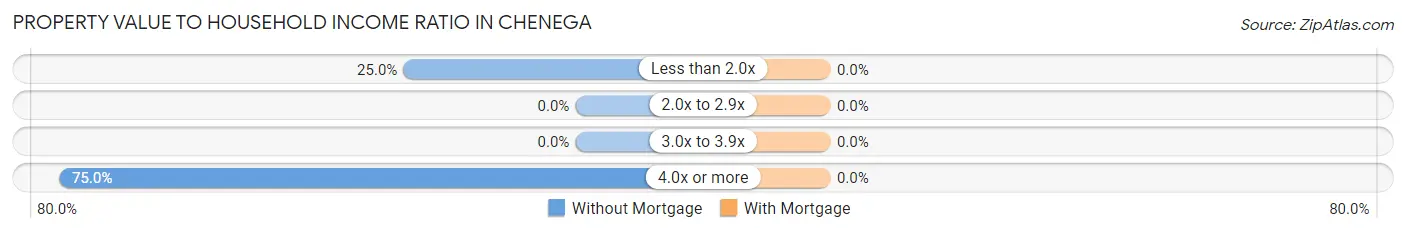
| Value-to-Income Ratio | Without Mortgage | With Mortgage |
| Less than 2.0x | 2 (25.0%) | 0 (0.0%) |
| 2.0x to 2.9x | 0 (0.0%) | 0 (0.0%) |
| 3.0x to 3.9x | 0 (0.0%) | 0 (0.0%) |
| 4.0x or more | 6 (75.0%) | 0 (0.0%) |
| Total | 8 (100.0%) | 0 (0.0%) |
Real Estate Taxes by Mortgage Status in Chenega
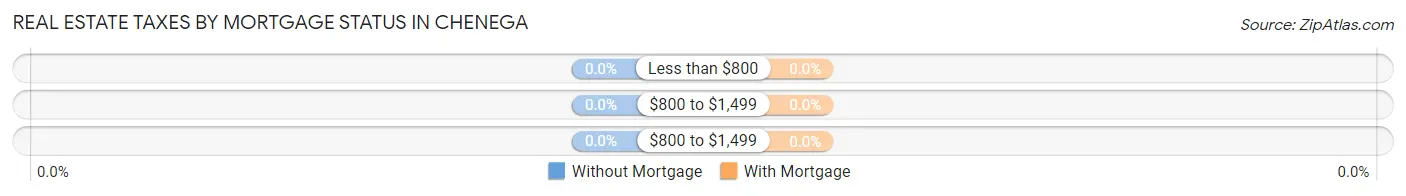
| Property Taxes | Without Mortgage | With Mortgage |
| Less than $800 | 0 (0.0%) | 0 (0.0%) |
| $800 to $1,499 | 0 (0.0%) | 0 (0.0%) |
| $800 to $1,499 | 0 (0.0%) | 0 (0.0%) |
| Total | 8 (100.0%) | 0 (0.0%) |
Health & Disability in Chenega
Health Insurance Coverage by Age in Chenega
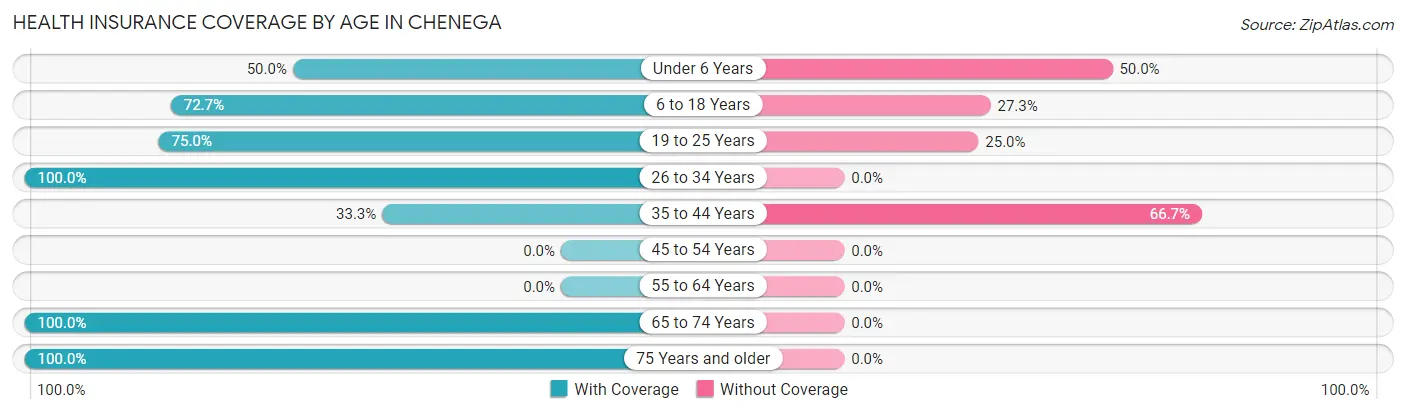
| Age Bracket | With Coverage | Without Coverage |
| Under 6 Years | 3 (50.0%) | 3 (50.0%) |
| 6 to 18 Years | 8 (72.7%) | 3 (27.3%) |
| 19 to 25 Years | 6 (75.0%) | 2 (25.0%) |
| 26 to 34 Years | 14 (100.0%) | 0 (0.0%) |
| 35 to 44 Years | 1 (33.3%) | 2 (66.7%) |
| 45 to 54 Years | 0 (0.0%) | 0 (0.0%) |
| 55 to 64 Years | 0 (0.0%) | 0 (0.0%) |
| 65 to 74 Years | 10 (100.0%) | 0 (0.0%) |
| 75 Years and older | 6 (100.0%) | 0 (0.0%) |
| Total | 48 (82.8%) | 10 (17.2%) |
Health Insurance Coverage by Citizenship Status in Chenega
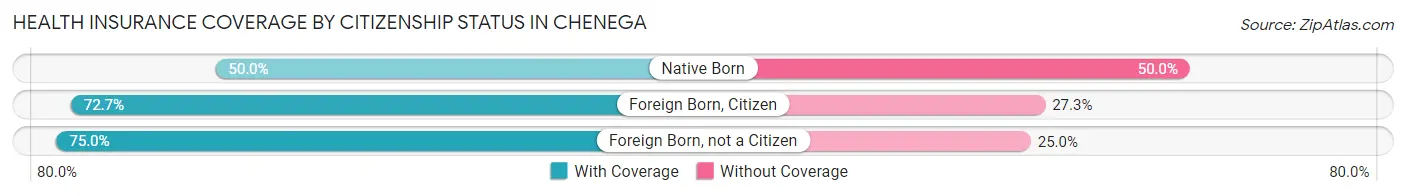
| Citizenship Status | With Coverage | Without Coverage |
| Native Born | 3 (50.0%) | 3 (50.0%) |
| Foreign Born, Citizen | 8 (72.7%) | 3 (27.3%) |
| Foreign Born, not a Citizen | 6 (75.0%) | 2 (25.0%) |
Health Insurance Coverage by Household Income in Chenega
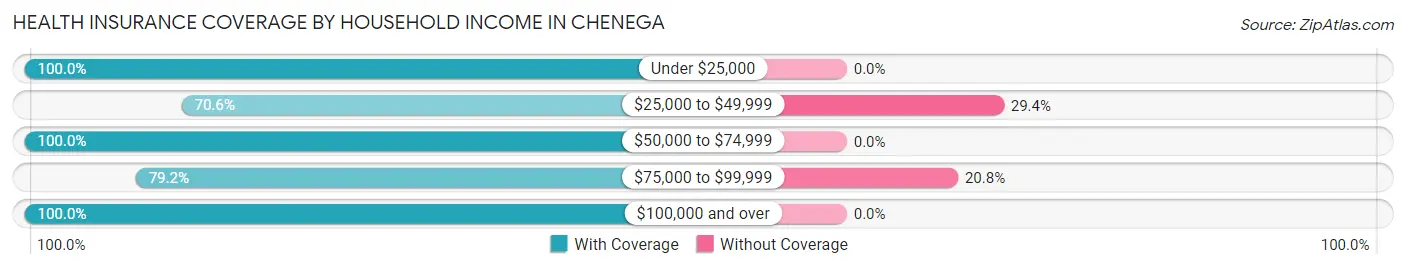
| Household Income | With Coverage | Without Coverage |
| Under $25,000 | 2 (100.0%) | 0 (0.0%) |
| $25,000 to $49,999 | 12 (70.6%) | 5 (29.4%) |
| $50,000 to $74,999 | 2 (100.0%) | 0 (0.0%) |
| $75,000 to $99,999 | 19 (79.2%) | 5 (20.8%) |
| $100,000 and over | 13 (100.0%) | 0 (0.0%) |
Public vs Private Health Insurance Coverage by Age in Chenega
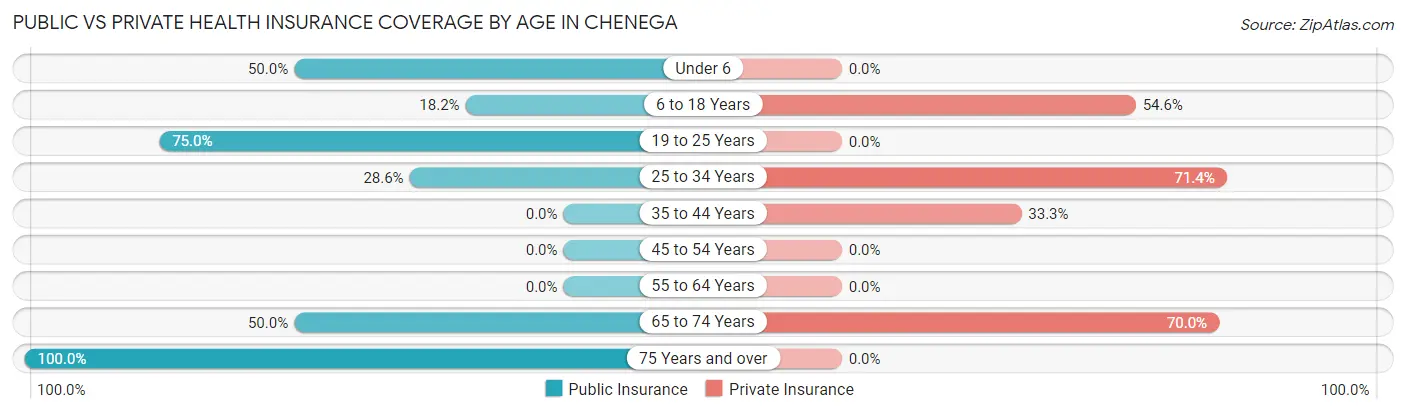
| Age Bracket | Public Insurance | Private Insurance |
| Under 6 | 3 (50.0%) | 0 (0.0%) |
| 6 to 18 Years | 2 (18.2%) | 6 (54.5%) |
| 19 to 25 Years | 6 (75.0%) | 0 (0.0%) |
| 25 to 34 Years | 4 (28.6%) | 10 (71.4%) |
| 35 to 44 Years | 0 (0.0%) | 1 (33.3%) |
| 45 to 54 Years | 0 (0.0%) | 0 (0.0%) |
| 55 to 64 Years | 0 (0.0%) | 0 (0.0%) |
| 65 to 74 Years | 5 (50.0%) | 7 (70.0%) |
| 75 Years and over | 6 (100.0%) | 0 (0.0%) |
| Total | 26 (44.8%) | 24 (41.4%) |
Disability Status by Sex by Age in Chenega
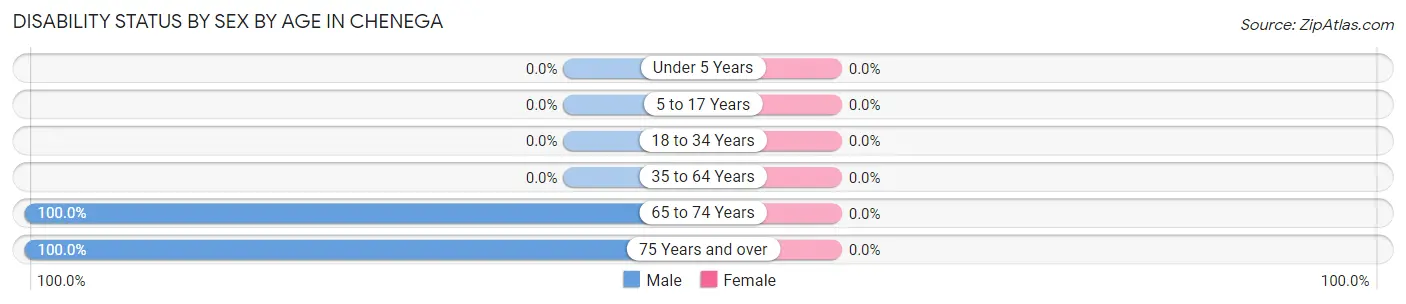
| Age Bracket | Male | Female |
| Under 5 Years | 0 (0.0%) | 0 (0.0%) |
| 5 to 17 Years | 0 (0.0%) | 0 (0.0%) |
| 18 to 34 Years | 0 (0.0%) | 0 (0.0%) |
| 35 to 64 Years | 0 (0.0%) | 0 (0.0%) |
| 65 to 74 Years | 5 (100.0%) | 0 (0.0%) |
| 75 Years and over | 6 (100.0%) | 0 (0.0%) |
Disability Class by Sex by Age in Chenega
Disability Class: Hearing Difficulty

| Age Bracket | Male | Female |
| Under 5 Years | 0 (0.0%) | 0 (0.0%) |
| 5 to 17 Years | 0 (0.0%) | 0 (0.0%) |
| 18 to 34 Years | 0 (0.0%) | 0 (0.0%) |
| 35 to 64 Years | 0 (0.0%) | 0 (0.0%) |
| 65 to 74 Years | 5 (100.0%) | 0 (0.0%) |
| 75 Years and over | 0 (0.0%) | 0 (0.0%) |
Disability Class: Vision Difficulty
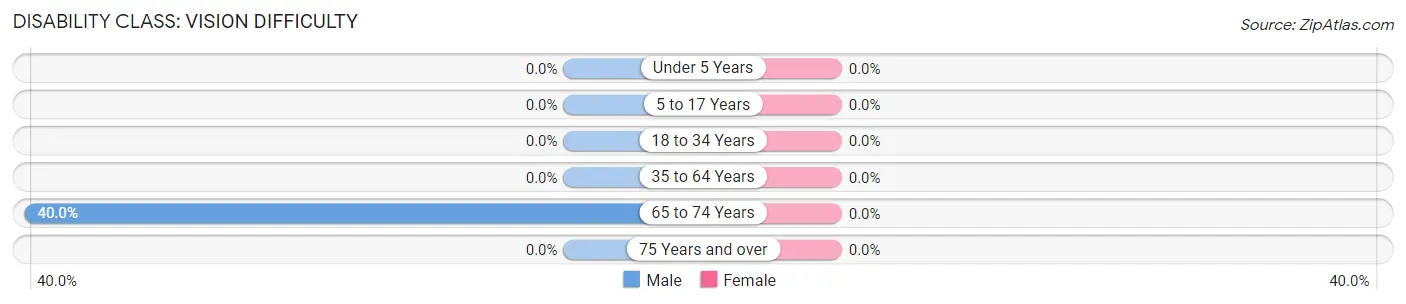
| Age Bracket | Male | Female |
| Under 5 Years | 0 (0.0%) | 0 (0.0%) |
| 5 to 17 Years | 0 (0.0%) | 0 (0.0%) |
| 18 to 34 Years | 0 (0.0%) | 0 (0.0%) |
| 35 to 64 Years | 0 (0.0%) | 0 (0.0%) |
| 65 to 74 Years | 2 (40.0%) | 0 (0.0%) |
| 75 Years and over | 0 (0.0%) | 0 (0.0%) |
Disability Class: Cognitive Difficulty
| Age Bracket | Male | Female |
| 5 to 17 Years | 0 (0.0%) | 0 (0.0%) |
| 18 to 34 Years | 0 (0.0%) | 0 (0.0%) |
| 35 to 64 Years | 0 (0.0%) | 0 (0.0%) |
| 65 to 74 Years | 0 (0.0%) | 0 (0.0%) |
| 75 Years and over | 0 (0.0%) | 0 (0.0%) |
Disability Class: Ambulatory Difficulty
| Age Bracket | Male | Female |
| 5 to 17 Years | 0 (0.0%) | 0 (0.0%) |
| 18 to 34 Years | 0 (0.0%) | 0 (0.0%) |
| 35 to 64 Years | 0 (0.0%) | 0 (0.0%) |
| 65 to 74 Years | 2 (40.0%) | 0 (0.0%) |
| 75 Years and over | 0 (0.0%) | 0 (0.0%) |
Disability Class: Self-Care Difficulty
| Age Bracket | Male | Female |
| 5 to 17 Years | 0 (0.0%) | 0 (0.0%) |
| 18 to 34 Years | 0 (0.0%) | 0 (0.0%) |
| 35 to 64 Years | 0 (0.0%) | 0 (0.0%) |
| 65 to 74 Years | 0 (0.0%) | 0 (0.0%) |
| 75 Years and over | 0 (0.0%) | 0 (0.0%) |
Technology Access in Chenega
Computing Device Access in Chenega
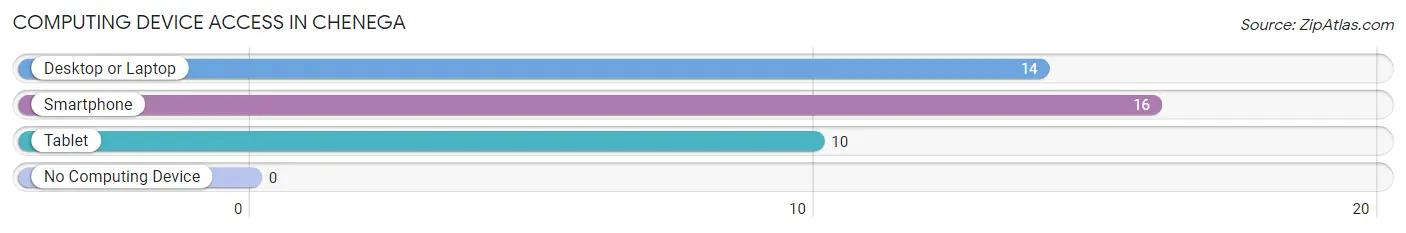
| Device Type | # Households | % Households |
| Desktop or Laptop | 14 | 63.6% |
| Smartphone | 16 | 72.7% |
| Tablet | 10 | 45.5% |
| No Computing Device | 0 | 0.0% |
| Total | 22 | 100.0% |
Internet Access in Chenega
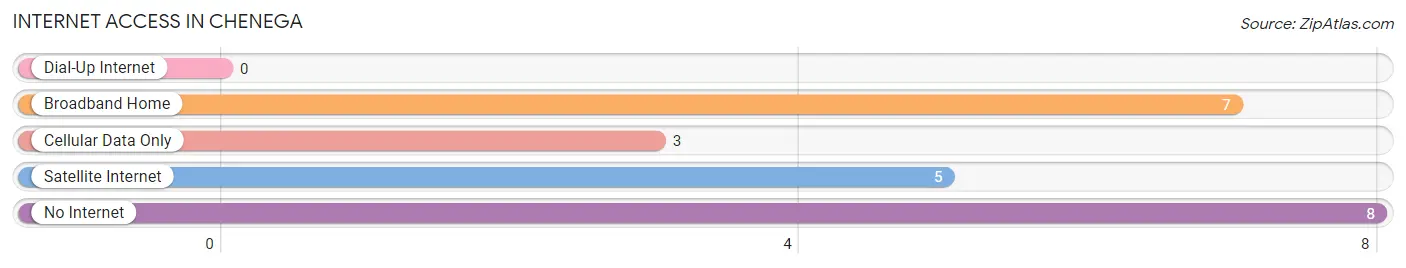
| Internet Type | # Households | % Households |
| Dial-Up Internet | 0 | 0.0% |
| Broadband Home | 7 | 31.8% |
| Cellular Data Only | 3 | 13.6% |
| Satellite Internet | 5 | 22.7% |
| No Internet | 8 | 36.4% |
| Total | 22 | 100.0% |
Chenega Summary
Chenega, Alaska is a small, unincorporated community located on the western side of Prince William Sound in the state of Alaska. It is located on the eastern shore of Chenega Bay, approximately 60 miles southeast of Anchorage. The community is home to the Chenega Corporation, a federally recognized Alaska Native village corporation.
History
Chenega has a long and rich history. The area was first inhabited by the Chugach people, who have lived in the area for thousands of years. The Chugach people were a semi-nomadic people who lived off the land and sea. They were known for their fishing and hunting skills, as well as their knowledge of the local environment.
In the late 1800s, the area was explored by Russian fur traders and missionaries. In 1867, the United States purchased Alaska from Russia, and the area became part of the United States. In the early 1900s, the area was settled by homesteaders, who established a small fishing village.
In the late 1960s, the Alaska Native Claims Settlement Act (ANCSA) was passed, which allowed Alaska Native tribes to form corporations and receive land and money from the federal government. The Chenega Corporation was formed in 1971, and the village of Chenega was established in 1972.
Geography
Chenega is located on the eastern shore of Chenega Bay, approximately 60 miles southeast of Anchorage. The area is surrounded by mountains and is home to a variety of wildlife, including moose, bears, and bald eagles. The bay is a popular destination for fishing, kayaking, and other outdoor activities.
The climate in Chenega is mild and temperate. Summers are generally warm and sunny, with temperatures ranging from the mid-50s to the mid-70s. Winters are cold and snowy, with temperatures ranging from the mid-20s to the mid-30s.
Economy
The economy of Chenega is largely based on fishing and tourism. The Chenega Corporation owns and operates a fish processing plant, which processes salmon, halibut, and other fish for sale in local markets. The village also has a small tourism industry, with visitors coming to the area to fish, hunt, and enjoy the natural beauty of the area.
The Chenega Corporation also owns and operates a number of businesses, including a grocery store, a gas station, and a restaurant. The village also has a small school, a post office, and a health clinic.
Demographics
As of the 2010 census, the population of Chenega was 97. The population is primarily Alaska Native, with the majority of residents being of Chugach descent. The median age of the population is 37.5, and the median household income is $45,000.
Chenega is a small, close-knit community. The village is home to a variety of organizations and events, including a community center, a library, and an annual festival. The village also has a strong sense of community and pride, with residents working together to maintain the village and its traditions.
Common Questions
What is Per Capita Income in Chenega?
Per Capita income in Chenega is $31,955.
What is the Median Household income in Chenega?
Median Household Income in Chenega is $58,750.
What is Inequality or Gini Index in Chenega?
Inequality or Gini Index in Chenega is 0.33.
What is the Total Population of Chenega?
Total Population of Chenega is 58.
What is the Total Male Population of Chenega?
Total Male Population of Chenega is 33.
What is the Total Female Population of Chenega?
Total Female Population of Chenega is 25.
What is the Ratio of Males per 100 Females in Chenega?
There are 132.00 Males per 100 Females in Chenega.
What is the Ratio of Females per 100 Males in Chenega?
There are 75.76 Females per 100 Males in Chenega.
What is the Median Population Age in Chenega?
Median Population Age in Chenega is 30.5 Years.
What is the Average Family Size in Chenega
Average Family Size in Chenega is 3.2 People.
What is the Average Household Size in Chenega
Average Household Size in Chenega is 2.6 People.
How Large is the Labor Force in Chenega?
There are 25 People in the Labor Forcein in Chenega.
What is the Percentage of People in the Labor Force in Chenega?
59.5% of People are in the Labor Force in Chenega.