Ouzinkie, AK Map & Demographics
Ouzinkie Map
Ouzinkie Overview
$36,480
PER CAPITA INCOME
$53,750
AVG HOUSEHOLD INCOME
0.42
INEQUALITY / GINI INDEX
90
TOTAL POPULATION
44
MALE POPULATION
46
FEMALE POPULATION
95.65
MALES / 100 FEMALES
104.55
FEMALES / 100 MALES
54.0
MEDIAN AGE
2.4
AVG FAMILY SIZE
2.2
AVG HOUSEHOLD SIZE
58
LABOR FORCE [ PEOPLE ]
77.3%
PERCENT IN LABOR FORCE
20.7%
UNEMPLOYMENT RATE
Ouzinkie Zip Codes
Ouzinkie Area Codes
Income in Ouzinkie
Income Overview in Ouzinkie
| Characteristic | Number | Measure |
| Per Capita Income | 90 | $36,480 |
| Median Family Income | 32 | $0 |
| Mean Family Income | 32 | $80,731 |
| Median Household Income | 40 | $53,750 |
| Mean Household Income | 40 | $77,250 |
| Income Deficit | 32 | $0 |
| Wage / Income Gap (%) | 90 | 0.00% |
| Wage / Income Gap ($) | 90 | 100.00¢ per $1 |
| Gini / Inequality Index | 90 | 0.42 |
Earnings by Sex in Ouzinkie
| Sex | Number | Average Earnings |
| Male | 27 (46.6%) | $0 |
| Female | 31 (53.4%) | $0 |
| Total | 58 (100.0%) | $0 |
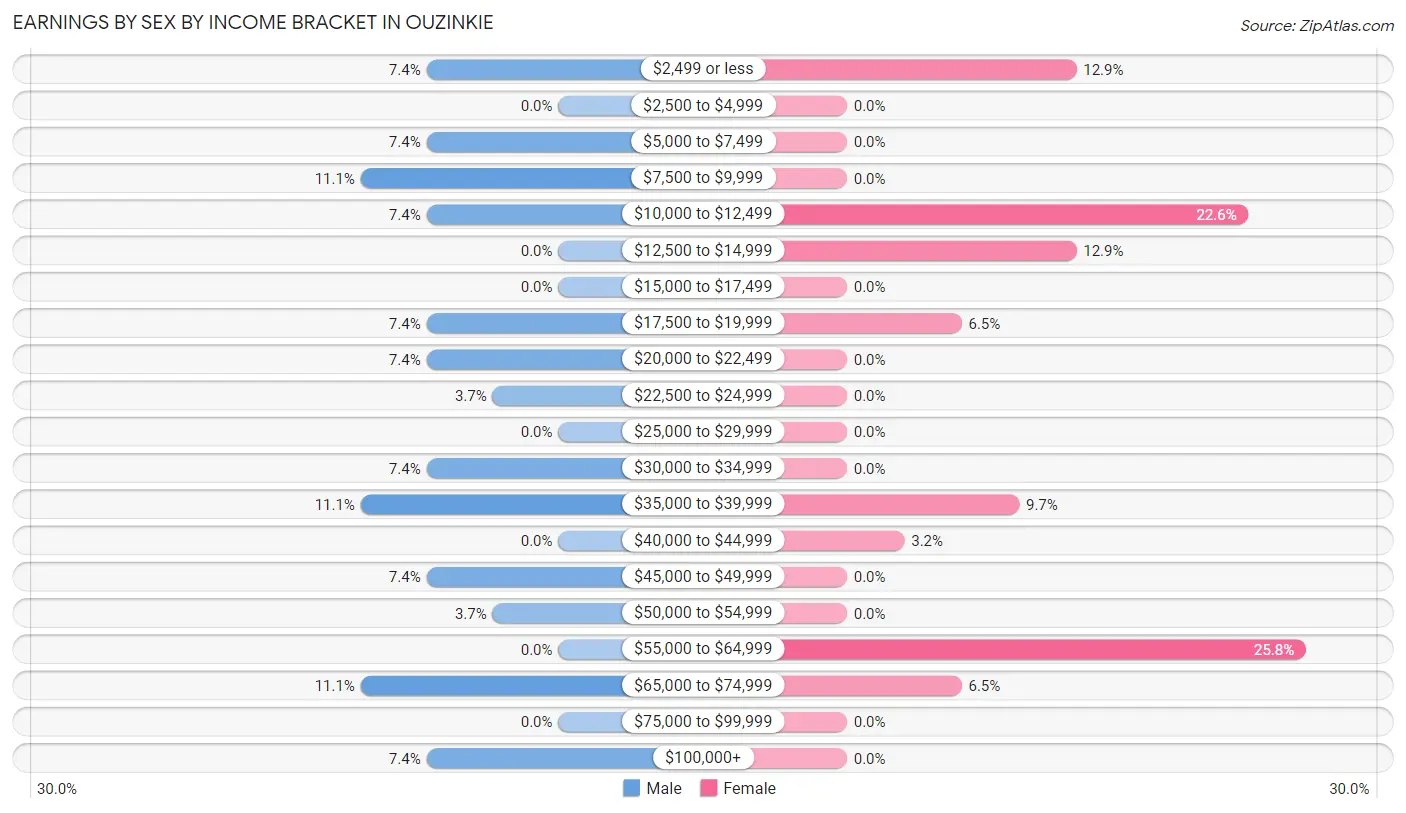
Earnings by Sex by Income Bracket in Ouzinkie
The most common earnings brackets in Ouzinkie are $7,500 to $9,999 for men (3 | 11.1%) and $55,000 to $64,999 for women (8 | 25.8%).
| Income | Male | Female |
| $2,499 or less | 2 (7.4%) | 4 (12.9%) |
| $2,500 to $4,999 | 0 (0.0%) | 0 (0.0%) |
| $5,000 to $7,499 | 2 (7.4%) | 0 (0.0%) |
| $7,500 to $9,999 | 3 (11.1%) | 0 (0.0%) |
| $10,000 to $12,499 | 2 (7.4%) | 7 (22.6%) |
| $12,500 to $14,999 | 0 (0.0%) | 4 (12.9%) |
| $15,000 to $17,499 | 0 (0.0%) | 0 (0.0%) |
| $17,500 to $19,999 | 2 (7.4%) | 2 (6.5%) |
| $20,000 to $22,499 | 2 (7.4%) | 0 (0.0%) |
| $22,500 to $24,999 | 1 (3.7%) | 0 (0.0%) |
| $25,000 to $29,999 | 0 (0.0%) | 0 (0.0%) |
| $30,000 to $34,999 | 2 (7.4%) | 0 (0.0%) |
| $35,000 to $39,999 | 3 (11.1%) | 3 (9.7%) |
| $40,000 to $44,999 | 0 (0.0%) | 1 (3.2%) |
| $45,000 to $49,999 | 2 (7.4%) | 0 (0.0%) |
| $50,000 to $54,999 | 1 (3.7%) | 0 (0.0%) |
| $55,000 to $64,999 | 0 (0.0%) | 8 (25.8%) |
| $65,000 to $74,999 | 3 (11.1%) | 2 (6.5%) |
| $75,000 to $99,999 | 0 (0.0%) | 0 (0.0%) |
| $100,000+ | 2 (7.4%) | 0 (0.0%) |
| Total | 27 (100.0%) | 31 (100.0%) |
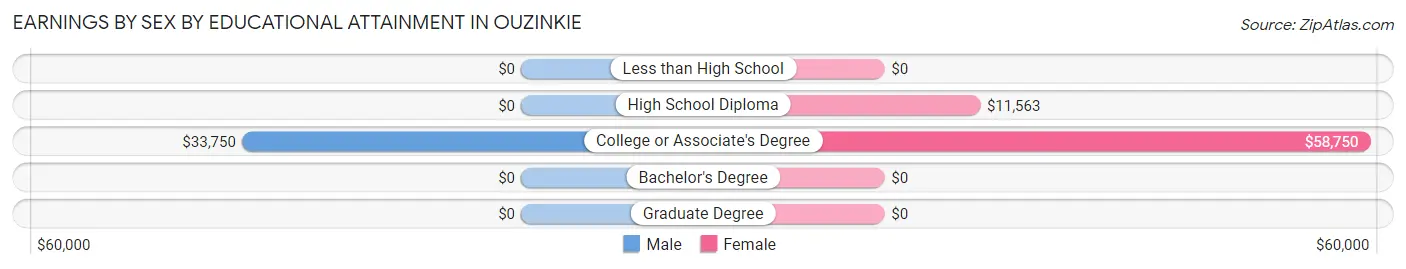
Earnings by Sex by Educational Attainment in Ouzinkie
| Educational Attainment | Male Income | Female Income |
| Less than High School | - | - |
| High School Diploma | - | - |
| College or Associate's Degree | $33,750 | $58,750 |
| Bachelor's Degree | - | - |
| Graduate Degree | - | - |
| Total | $30,625 | $0 |
Family Income in Ouzinkie
Family Income Brackets in Ouzinkie
According to the Ouzinkie family income data, there are 10 families falling into the $100,000 to $149,999 income range, which is the most common income bracket and makes up 31.2% of all families.
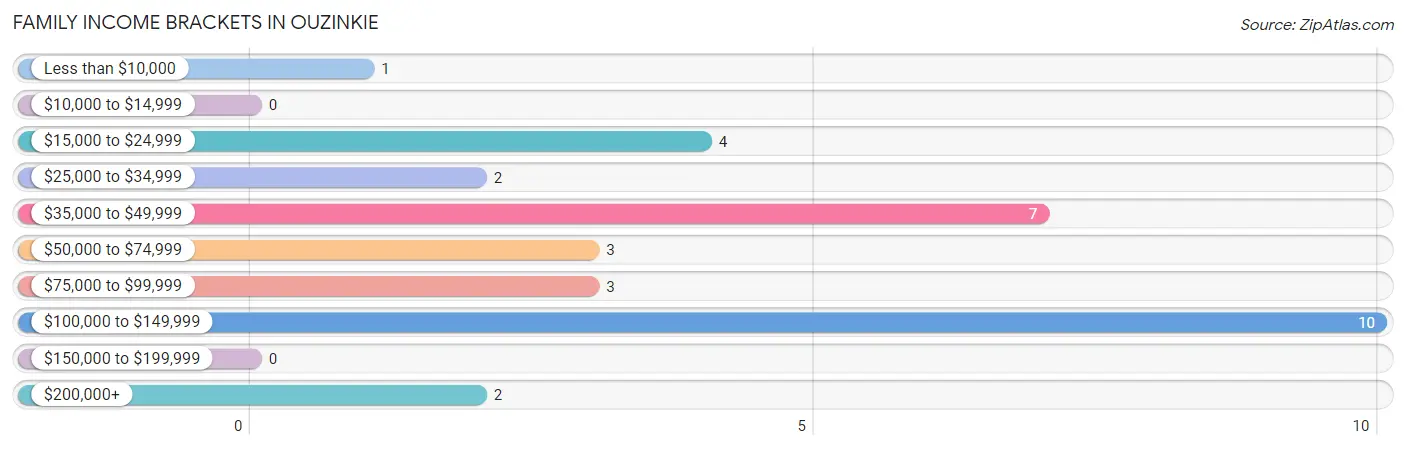
| Income Bracket | # Families | % Families |
| Less than $10,000 | 1 | 3.1% |
| $10,000 to $14,999 | 0 | 0.0% |
| $15,000 to $24,999 | 4 | 12.5% |
| $25,000 to $34,999 | 2 | 6.3% |
| $35,000 to $49,999 | 7 | 21.9% |
| $50,000 to $74,999 | 3 | 9.4% |
| $75,000 to $99,999 | 3 | 9.4% |
| $100,000 to $149,999 | 10 | 31.3% |
| $150,000 to $199,999 | 0 | 0.0% |
| $200,000+ | 2 | 6.3% |
Family Income by Famaliy Size in Ouzinkie
3-person families (6 | 18.8%) account for the highest median family income in Ouzinkie with $37,500 per family, while 3-person families (6 | 18.8%) have the highest median income of $12,500 per family member.
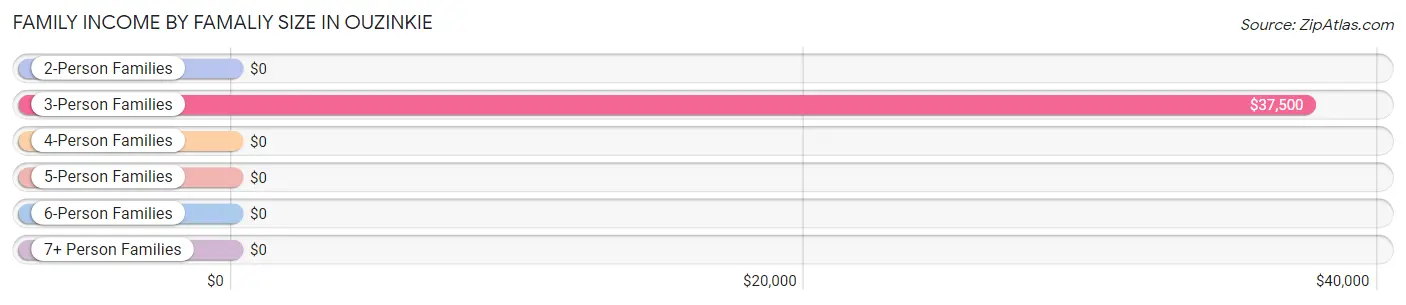
| Income Bracket | # Families | Median Income |
| 2-Person Families | 21 (65.6%) | $0 |
| 3-Person Families | 6 (18.8%) | $37,500 |
| 4-Person Families | 5 (15.6%) | $0 |
| 5-Person Families | 0 (0.0%) | $0 |
| 6-Person Families | 0 (0.0%) | $0 |
| 7+ Person Families | 0 (0.0%) | $0 |
| Total | 32 (100.0%) | $0 |
Family Income by Number of Earners in Ouzinkie
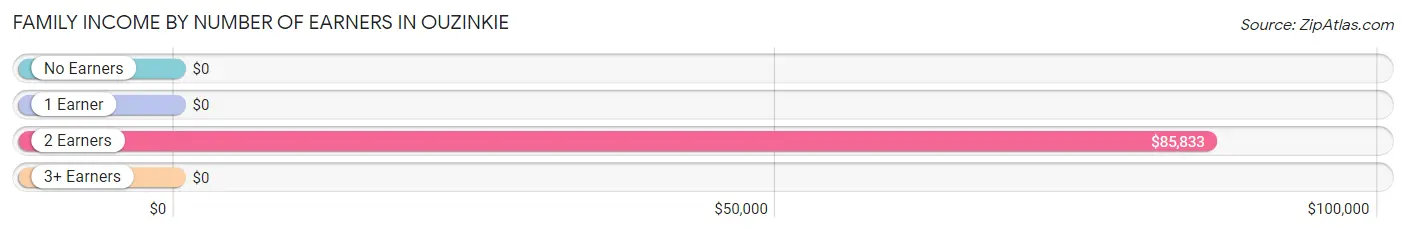
| Number of Earners | # Families | Median Income |
| No Earners | 0 (0.0%) | $0 |
| 1 Earner | 18 (56.2%) | $0 |
| 2 Earners | 14 (43.8%) | $85,833 |
| 3+ Earners | 0 (0.0%) | $0 |
| Total | 32 (100.0%) | $0 |
Household Income in Ouzinkie
Household Income Brackets in Ouzinkie
With 7 households falling in the category, the $15,000 to $24,999 income range is the most frequent in Ouzinkie, accounting for 17.5% of all households.
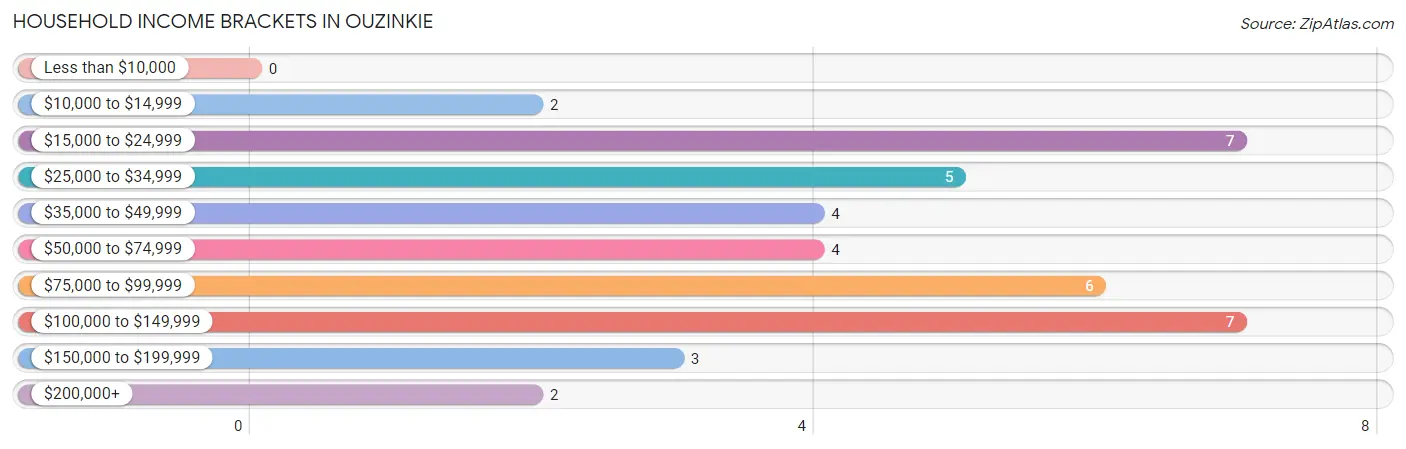
| Income Bracket | # Households | % Households |
| Less than $10,000 | 0 | 0.0% |
| $10,000 to $14,999 | 2 | 5.0% |
| $15,000 to $24,999 | 7 | 17.5% |
| $25,000 to $34,999 | 5 | 12.5% |
| $35,000 to $49,999 | 4 | 10.0% |
| $50,000 to $74,999 | 4 | 10.0% |
| $75,000 to $99,999 | 6 | 15.0% |
| $100,000 to $149,999 | 7 | 17.5% |
| $150,000 to $199,999 | 3 | 7.5% |
| $200,000+ | 2 | 5.0% |
Household Income by Householder Age in Ouzinkie
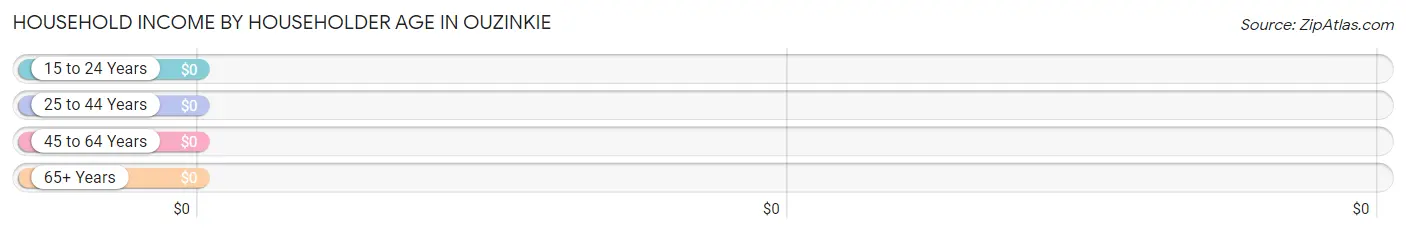
| Income Bracket | # Households | Median Income |
| 15 to 24 Years | 0 (0.0%) | $0 |
| 25 to 44 Years | 12 (30.0%) | $0 |
| 45 to 64 Years | 11 (27.5%) | $0 |
| 65+ Years | 17 (42.5%) | $0 |
| Total | 40 (100.0%) | $53,750 |
Poverty in Ouzinkie
Income Below Poverty by Sex and Age in Ouzinkie
With 9.1% poverty level for males and 13.0% for females among the residents of Ouzinkie, 5 year old males and 12 to 14 year old females are the most vulnerable to poverty, with 1 males (100.0%) and 1 females (100.0%) in their respective age groups living below the poverty level.
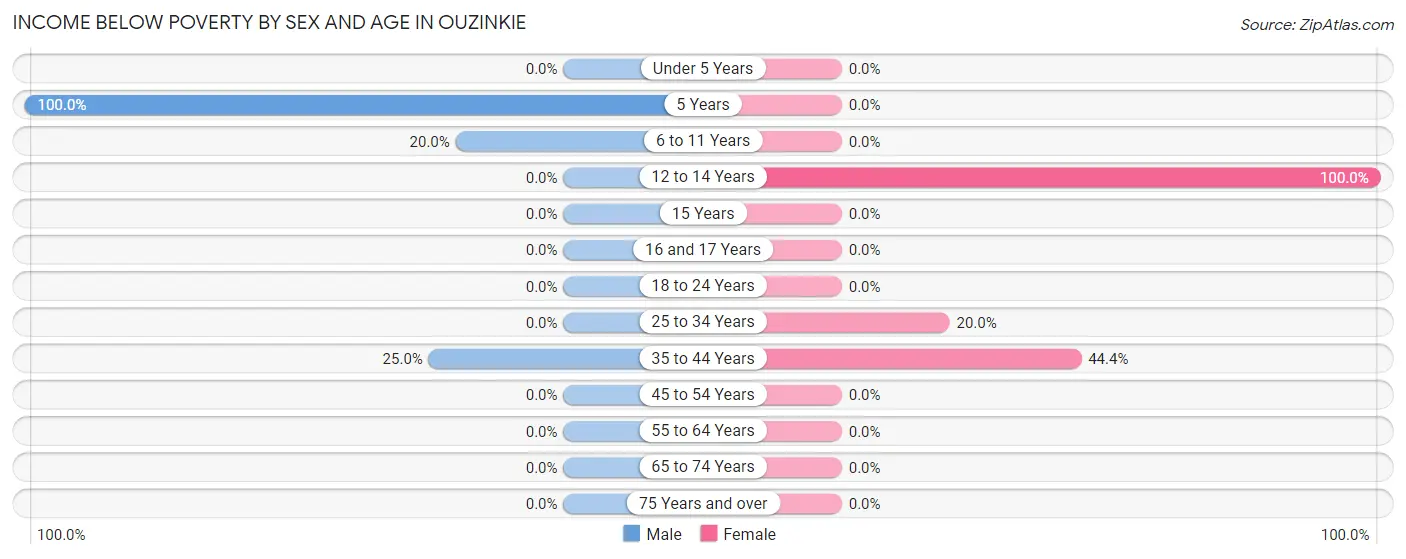
| Age Bracket | Male | Female |
| Under 5 Years | 0 (0.0%) | 0 (0.0%) |
| 5 Years | 1 (100.0%) | 0 (0.0%) |
| 6 to 11 Years | 1 (20.0%) | 0 (0.0%) |
| 12 to 14 Years | 0 (0.0%) | 1 (100.0%) |
| 15 Years | 0 (0.0%) | 0 (0.0%) |
| 16 and 17 Years | 0 (0.0%) | 0 (0.0%) |
| 18 to 24 Years | 0 (0.0%) | 0 (0.0%) |
| 25 to 34 Years | 0 (0.0%) | 1 (20.0%) |
| 35 to 44 Years | 2 (25.0%) | 4 (44.4%) |
| 45 to 54 Years | 0 (0.0%) | 0 (0.0%) |
| 55 to 64 Years | 0 (0.0%) | 0 (0.0%) |
| 65 to 74 Years | 0 (0.0%) | 0 (0.0%) |
| 75 Years and over | 0 (0.0%) | 0 (0.0%) |
| Total | 4 (9.1%) | 6 (13.0%) |
Income Above Poverty by Sex and Age in Ouzinkie
According to the poverty statistics in Ouzinkie, males aged 15 years and females aged under 5 years are the age groups that are most secure financially, with 100.0% of males and 100.0% of females in these age groups living above the poverty line.
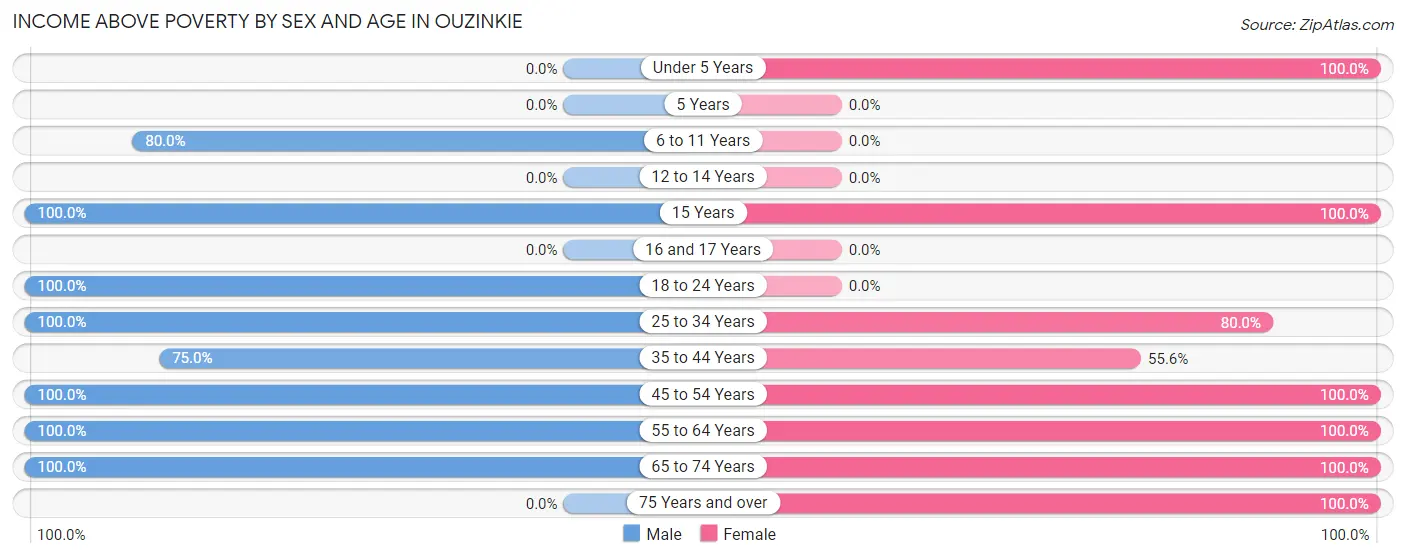
| Age Bracket | Male | Female |
| Under 5 Years | 0 (0.0%) | 1 (100.0%) |
| 5 Years | 0 (0.0%) | 0 (0.0%) |
| 6 to 11 Years | 4 (80.0%) | 0 (0.0%) |
| 12 to 14 Years | 0 (0.0%) | 0 (0.0%) |
| 15 Years | 5 (100.0%) | 2 (100.0%) |
| 16 and 17 Years | 0 (0.0%) | 0 (0.0%) |
| 18 to 24 Years | 2 (100.0%) | 0 (0.0%) |
| 25 to 34 Years | 3 (100.0%) | 4 (80.0%) |
| 35 to 44 Years | 6 (75.0%) | 5 (55.6%) |
| 45 to 54 Years | 2 (100.0%) | 3 (100.0%) |
| 55 to 64 Years | 9 (100.0%) | 14 (100.0%) |
| 65 to 74 Years | 9 (100.0%) | 5 (100.0%) |
| 75 Years and over | 0 (0.0%) | 6 (100.0%) |
| Total | 40 (90.9%) | 40 (87.0%) |
Income Below Poverty Among Married-Couple Families in Ouzinkie
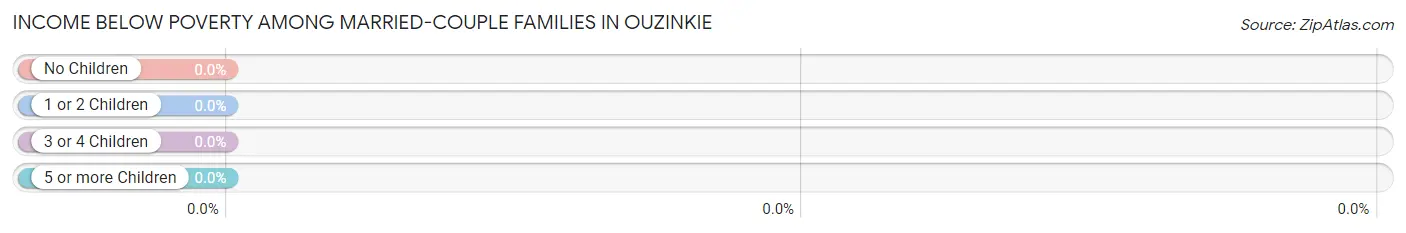
| Children | Above Poverty | Below Poverty |
| No Children | 11 (100.0%) | 0 (0.0%) |
| 1 or 2 Children | 1 (100.0%) | 0 (0.0%) |
| 3 or 4 Children | 0 (0.0%) | 0 (0.0%) |
| 5 or more Children | 0 (0.0%) | 0 (0.0%) |
| Total | 12 (100.0%) | 0 (0.0%) |
Income Below Poverty Among Single-Parent Households in Ouzinkie
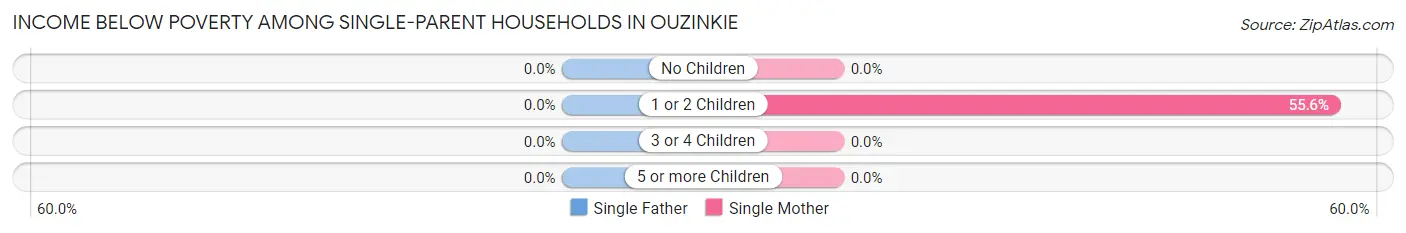
| Children | Single Father | Single Mother |
| No Children | 0 (0.0%) | 0 (0.0%) |
| 1 or 2 Children | 0 (0.0%) | 5 (55.6%) |
| 3 or 4 Children | 0 (0.0%) | 0 (0.0%) |
| 5 or more Children | 0 (0.0%) | 0 (0.0%) |
| Total | 0 (0.0%) | 5 (33.3%) |
Income Below Poverty Among Married-Couple vs Single-Parent Households in Ouzinkie
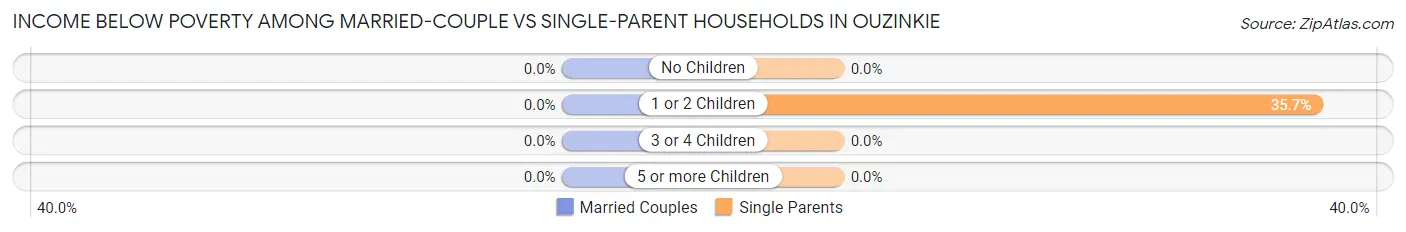
| Children | Married-Couple Families | Single-Parent Households |
| No Children | 0 (0.0%) | 0 (0.0%) |
| 1 or 2 Children | 0 (0.0%) | 5 (35.7%) |
| 3 or 4 Children | 0 (0.0%) | 0 (0.0%) |
| 5 or more Children | 0 (0.0%) | 0 (0.0%) |
| Total | 0 (0.0%) | 5 (25.0%) |
Race in Ouzinkie
The most populous races in Ouzinkie are Two or more Races (44 | 48.9%), Native / Alaskan (42 | 46.7%), and Hispanic or Latino (9 | 10.0%).
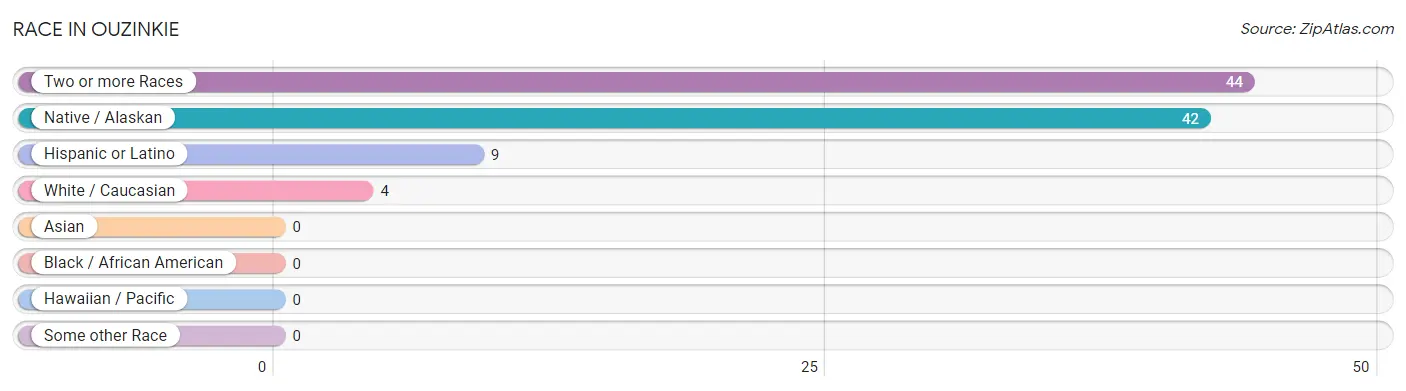
| Race | # Population | % Population |
| Asian | 0 | 0.0% |
| Black / African American | 0 | 0.0% |
| Hawaiian / Pacific | 0 | 0.0% |
| Hispanic or Latino | 9 | 10.0% |
| Native / Alaskan | 42 | 46.7% |
| White / Caucasian | 4 | 4.4% |
| Two or more Races | 44 | 48.9% |
| Some other Race | 0 | 0.0% |
| Total | 90 | 100.0% |
Ancestry in Ouzinkie
The most populous ancestries reported in Ouzinkie are Aleut (68 | 75.6%), Russian (34 | 37.8%), Yup'ik (16 | 17.8%), Mexican (9 | 10.0%), and Irish (4 | 4.4%), together accounting for 145.6% of all Ouzinkie residents.
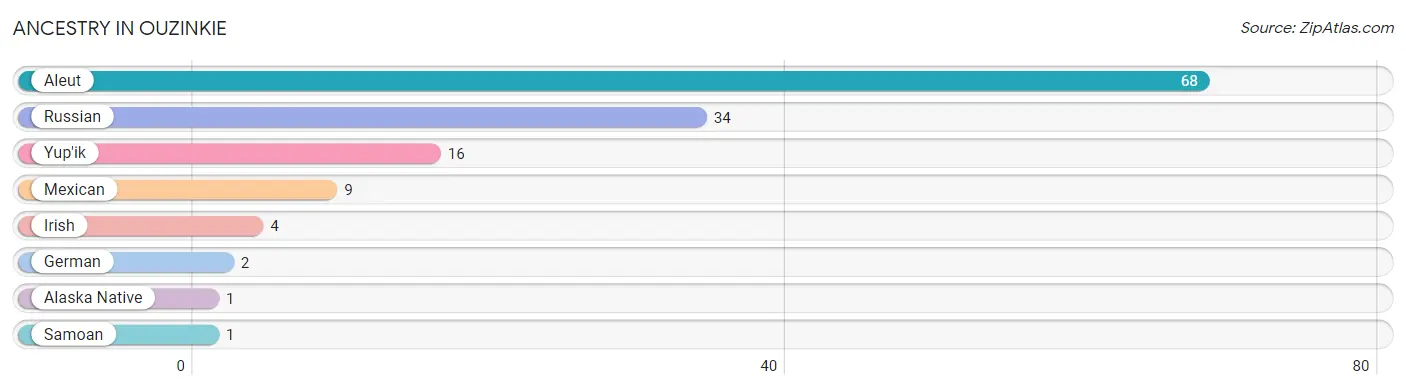
| Ancestry | # Population | % Population |
| Alaska Native | 1 | 1.1% |
| Aleut | 68 | 75.6% |
| German | 2 | 2.2% |
| Irish | 4 | 4.4% |
| Mexican | 9 | 10.0% |
| Russian | 34 | 37.8% |
| Samoan | 1 | 1.1% |
| Yup'ik | 16 | 17.8% | View All 8 Rows |
Immigrants in Ouzinkie

| Immigration Origin | # Population | % Population | View All 0 Rows |
Sex and Age in Ouzinkie
Sex and Age in Ouzinkie
The most populous age groups in Ouzinkie are 60 to 64 Years (9 | 20.4%) for men and 55 to 59 Years (14 | 30.4%) for women.
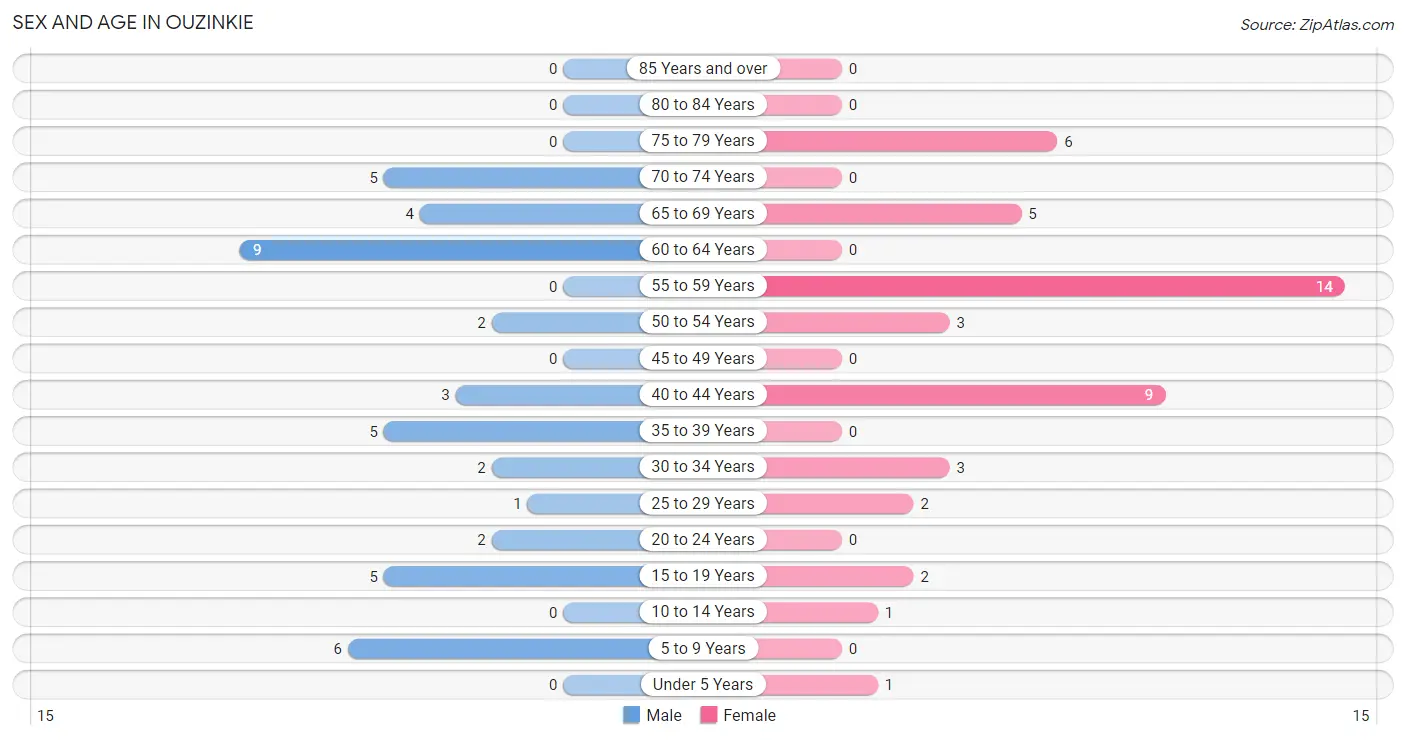
| Age Bracket | Male | Female |
| Under 5 Years | 0 (0.0%) | 1 (2.2%) |
| 5 to 9 Years | 6 (13.6%) | 0 (0.0%) |
| 10 to 14 Years | 0 (0.0%) | 1 (2.2%) |
| 15 to 19 Years | 5 (11.4%) | 2 (4.3%) |
| 20 to 24 Years | 2 (4.5%) | 0 (0.0%) |
| 25 to 29 Years | 1 (2.3%) | 2 (4.3%) |
| 30 to 34 Years | 2 (4.5%) | 3 (6.5%) |
| 35 to 39 Years | 5 (11.4%) | 0 (0.0%) |
| 40 to 44 Years | 3 (6.8%) | 9 (19.6%) |
| 45 to 49 Years | 0 (0.0%) | 0 (0.0%) |
| 50 to 54 Years | 2 (4.5%) | 3 (6.5%) |
| 55 to 59 Years | 0 (0.0%) | 14 (30.4%) |
| 60 to 64 Years | 9 (20.4%) | 0 (0.0%) |
| 65 to 69 Years | 4 (9.1%) | 5 (10.9%) |
| 70 to 74 Years | 5 (11.4%) | 0 (0.0%) |
| 75 to 79 Years | 0 (0.0%) | 6 (13.0%) |
| 80 to 84 Years | 0 (0.0%) | 0 (0.0%) |
| 85 Years and over | 0 (0.0%) | 0 (0.0%) |
| Total | 44 (100.0%) | 46 (100.0%) |
Families and Households in Ouzinkie
Median Family Size in Ouzinkie
The median family size in Ouzinkie is 2.44 persons per family, with single male/father families (5 | 15.6%) accounting for the largest median family size of 3.2 persons per family. On the other hand, single female/mother families (15 | 46.9%) represent the smallest median family size with 2.27 persons per family.
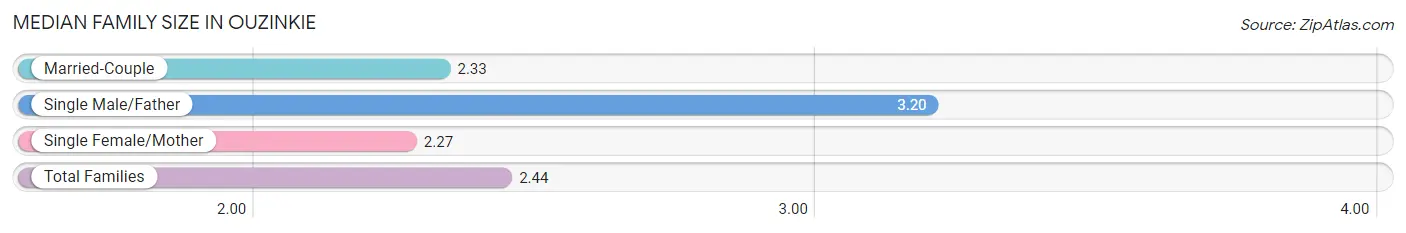
| Family Type | # Families | Family Size |
| Married-Couple | 12 (37.5%) | 2.33 |
| Single Male/Father | 5 (15.6%) | 3.20 |
| Single Female/Mother | 15 (46.9%) | 2.27 |
| Total Families | 32 (100.0%) | 2.44 |
Median Household Size in Ouzinkie
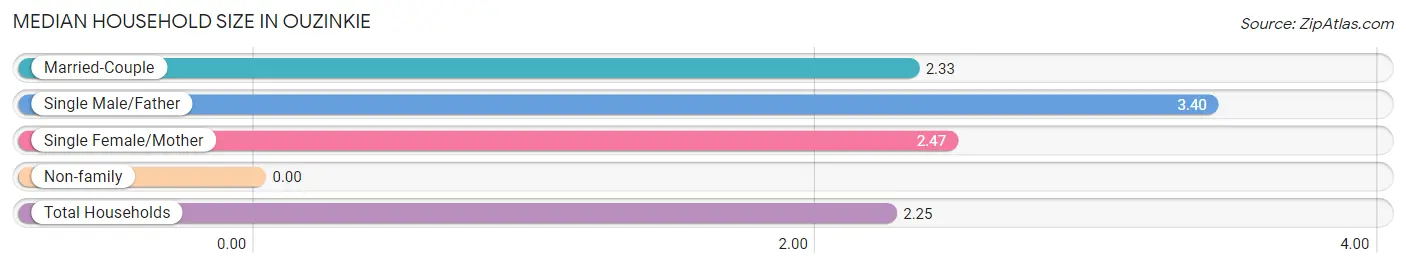
| Household Type | # Households | Household Size |
| Married-Couple | 12 (30.0%) | 2.33 |
| Single Male/Father | 5 (12.5%) | 3.40 |
| Single Female/Mother | 15 (37.5%) | 2.47 |
| Non-family | 8 (20.0%) | - |
| Total Households | 40 (100.0%) | 2.25 |
Household Size by Marriage Status in Ouzinkie
Out of a total of 40 households in Ouzinkie, 32 (80.0%) are family households, while 8 (20.0%) are nonfamily households. The most numerous type of family households are 2-person households, comprising 18, and the most common type of nonfamily households are 1-person households, comprising 8.
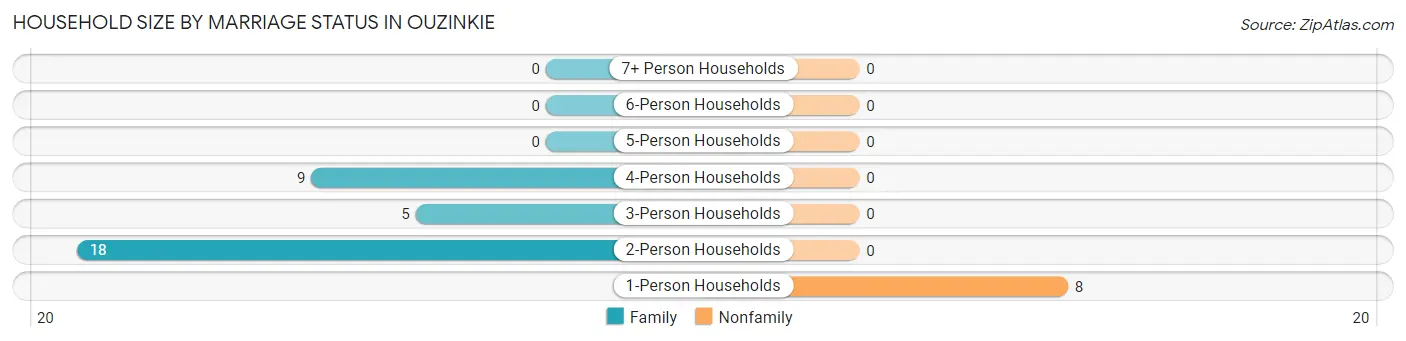
| Household Size | Family Households | Nonfamily Households |
| 1-Person Households | - | 8 (20.0%) |
| 2-Person Households | 18 (45.0%) | 0 (0.0%) |
| 3-Person Households | 5 (12.5%) | 0 (0.0%) |
| 4-Person Households | 9 (22.5%) | 0 (0.0%) |
| 5-Person Households | 0 (0.0%) | 0 (0.0%) |
| 6-Person Households | 0 (0.0%) | 0 (0.0%) |
| 7+ Person Households | 0 (0.0%) | 0 (0.0%) |
| Total | 32 (80.0%) | 8 (20.0%) |
Female Fertility in Ouzinkie
Fertility by Age in Ouzinkie
Average fertility rate in Ouzinkie is 125.0 births per 1,000 women. Women in the age bracket of 20 to 34 years have the highest fertility rate with 400.0 births per 1,000 women. Women in the age bracket of 20 to 34 years acount for 100.0% of all women with births.
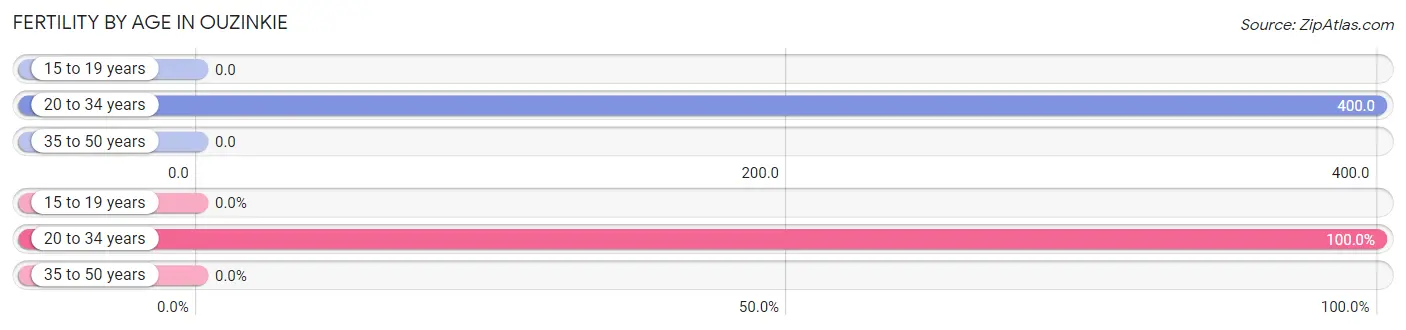
| Age Bracket | Women with Births | Births / 1,000 Women |
| 15 to 19 years | 0 (0.0%) | 0.0 |
| 20 to 34 years | 2 (100.0%) | 400.0 |
| 35 to 50 years | 0 (0.0%) | 0.0 |
| Total | 2 (100.0%) | 125.0 |
Fertility by Age by Marriage Status in Ouzinkie
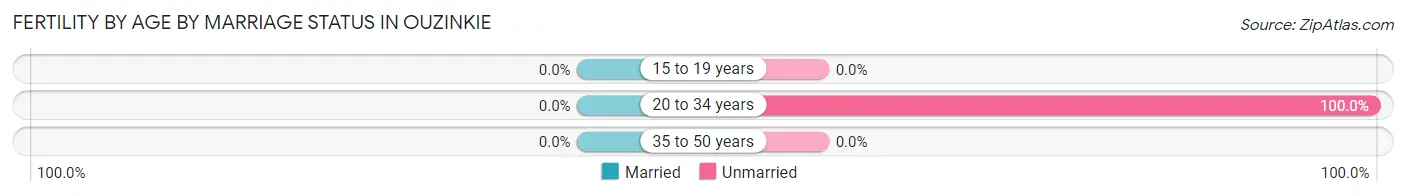
| Age Bracket | Married | Unmarried |
| 15 to 19 years | 0 (0.0%) | 0 (0.0%) |
| 20 to 34 years | 0 (0.0%) | 2 (100.0%) |
| 35 to 50 years | 0 (0.0%) | 0 (0.0%) |
| Total | 0 (0.0%) | 2 (100.0%) |
Fertility by Education in Ouzinkie
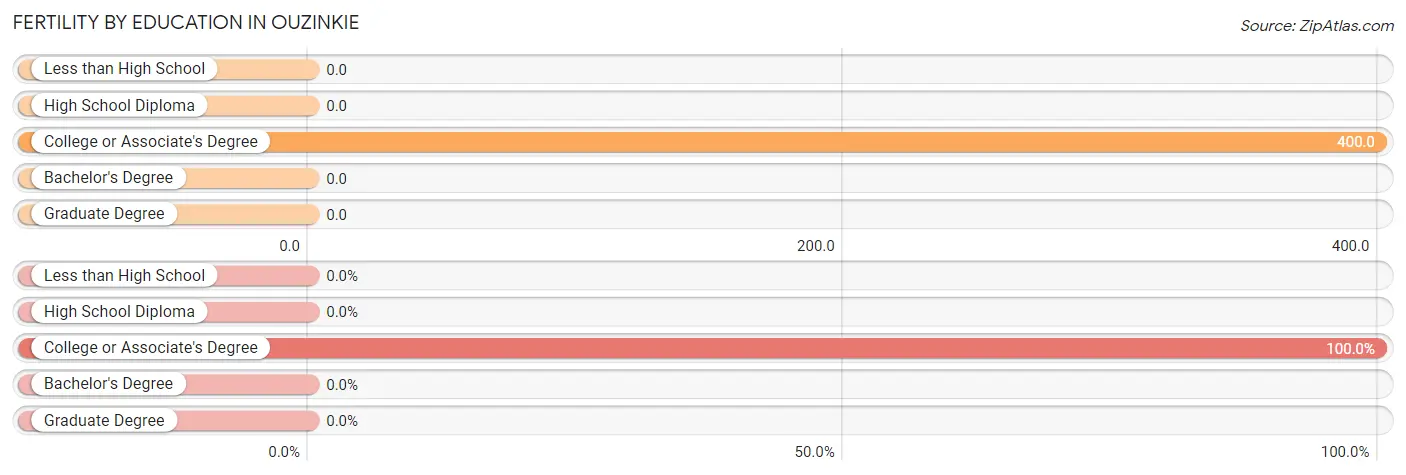
| Educational Attainment | Women with Births | Births / 1,000 Women |
| Less than High School | 0 (0.0%) | 0.0 |
| High School Diploma | 0 (0.0%) | 0.0 |
| College or Associate's Degree | 2 (100.0%) | 400.0 |
| Bachelor's Degree | 0 (0.0%) | 0.0 |
| Graduate Degree | 0 (0.0%) | 0.0 |
| Total | 2 (100.0%) | 125.0 |
Fertility by Education by Marriage Status in Ouzinkie
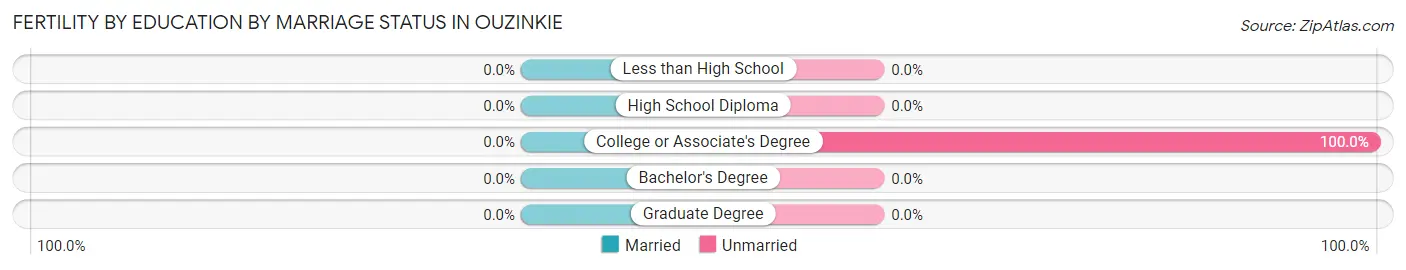
| Educational Attainment | Married | Unmarried |
| Less than High School | 0 (0.0%) | 0 (0.0%) |
| High School Diploma | 0 (0.0%) | 0 (0.0%) |
| College or Associate's Degree | 0 (0.0%) | 2 (100.0%) |
| Bachelor's Degree | 0 (0.0%) | 0 (0.0%) |
| Graduate Degree | 0 (0.0%) | 0 (0.0%) |
| Total | 0 (0.0%) | 2 (100.0%) |
Employment Characteristics in Ouzinkie
Employment by Class of Employer in Ouzinkie
Among the 37 employed individuals in Ouzinkie, local government employees (20 | 54.0%), federal government employees (12 | 32.4%), and state government employees (4 | 10.8%) make up the most common classes of employment.
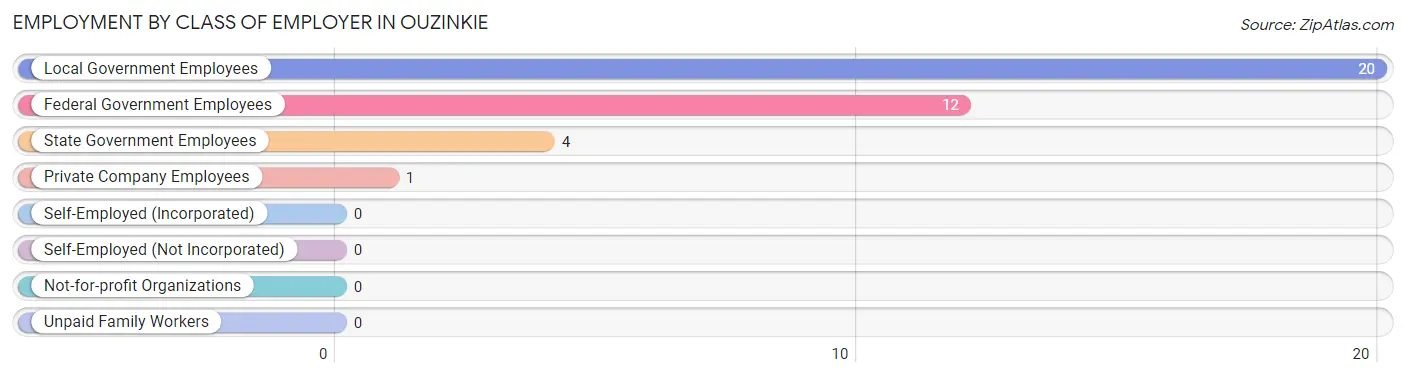
| Employer Class | # Employees | % Employees |
| Private Company Employees | 1 | 2.7% |
| Self-Employed (Incorporated) | 0 | 0.0% |
| Self-Employed (Not Incorporated) | 0 | 0.0% |
| Not-for-profit Organizations | 0 | 0.0% |
| Local Government Employees | 20 | 54.0% |
| State Government Employees | 4 | 10.8% |
| Federal Government Employees | 12 | 32.4% |
| Unpaid Family Workers | 0 | 0.0% |
| Total | 37 | 100.0% |
Employment Status by Age in Ouzinkie
According to the labor force statistics for Ouzinkie, out of the total population over 16 years of age (75), 77.3% or 58 individuals are in the labor force, with 20.7% or 12 of them unemployed. The age group with the highest labor force participation rate is 20 to 24 years, with 100.0% or 2 individuals in the labor force. Within the labor force, the 20 to 24 years age range has the highest percentage of unemployed individuals, with 100.0% or 2 of them being unemployed.
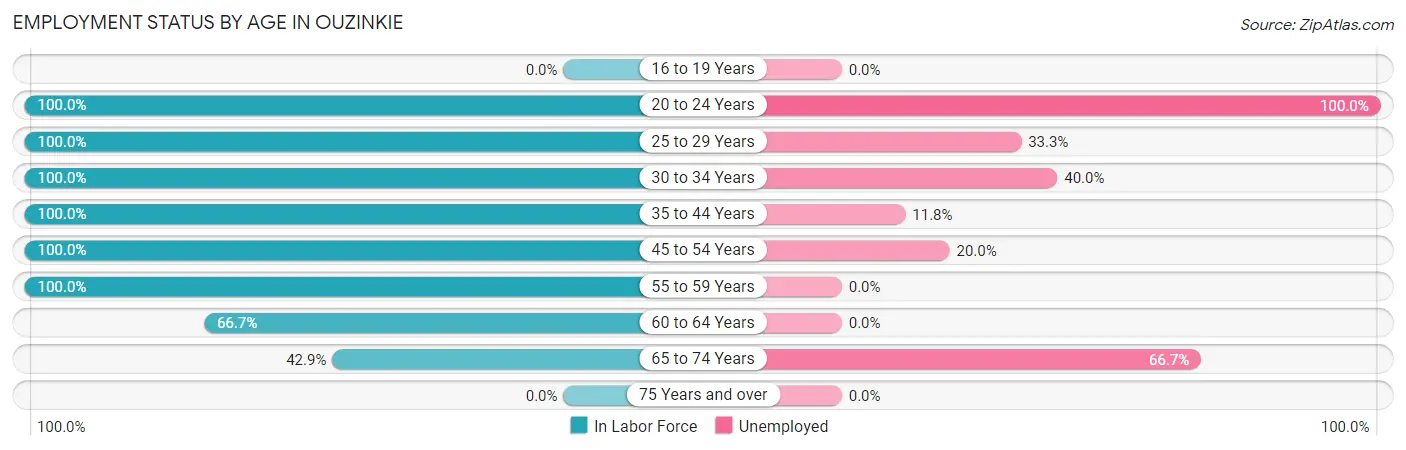
| Age Bracket | In Labor Force | Unemployed |
| 16 to 19 Years | 0 (0.0%) | 0 (0.0%) |
| 20 to 24 Years | 2 (100.0%) | 2 (100.0%) |
| 25 to 29 Years | 3 (100.0%) | 1 (33.3%) |
| 30 to 34 Years | 5 (100.0%) | 2 (40.0%) |
| 35 to 44 Years | 17 (100.0%) | 2 (11.8%) |
| 45 to 54 Years | 5 (100.0%) | 1 (20.0%) |
| 55 to 59 Years | 14 (100.0%) | 0 (0.0%) |
| 60 to 64 Years | 6 (66.7%) | 0 (0.0%) |
| 65 to 74 Years | 6 (42.9%) | 4 (66.7%) |
| 75 Years and over | 0 (0.0%) | 0 (0.0%) |
| Total | 58 (77.3%) | 12 (20.7%) |
Employment Status by Educational Attainment in Ouzinkie
According to labor force statistics for Ouzinkie, 94.3% of individuals (50) out of the total population between 25 and 64 years of age (53) are in the labor force, with 12.0% or 6 of them being unemployed. The group with the highest labor force participation rate are those with the educational attainment of less than high school, with 100.0% or 5 individuals in the labor force. Within the labor force, individuals with college / associate degree education have the highest percentage of unemployment, with 19.2% or 5 of them being unemployed.
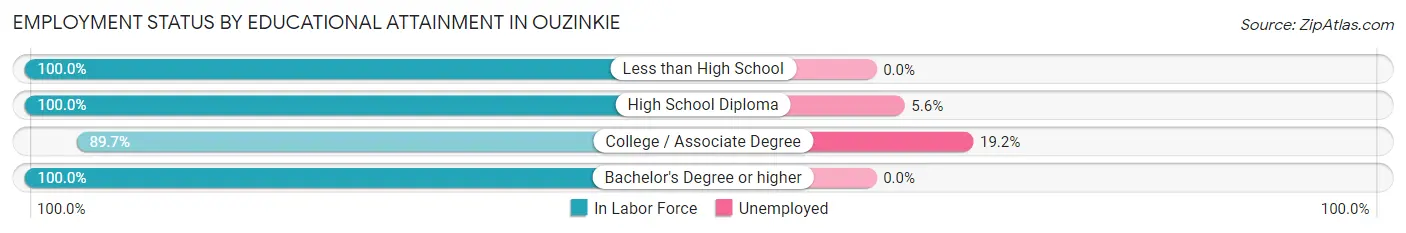
| Educational Attainment | In Labor Force | Unemployed |
| Less than High School | 5 (100.0%) | 0 (0.0%) |
| High School Diploma | 18 (100.0%) | 1 (5.6%) |
| College / Associate Degree | 26 (89.7%) | 6 (19.2%) |
| Bachelor's Degree or higher | 1 (100.0%) | 0 (0.0%) |
| Total | 50 (94.3%) | 6 (12.0%) |
Employment Occupations by Sex in Ouzinkie
Management, Business, Science and Arts Occupations
The most common Management, Business, Science and Arts occupations in Ouzinkie are Management (8 | 17.4%), Community & Social Service (5 | 10.9%), Arts, Media & Entertainment (4 | 8.7%), and Education Instruction & Library (1 | 2.2%).
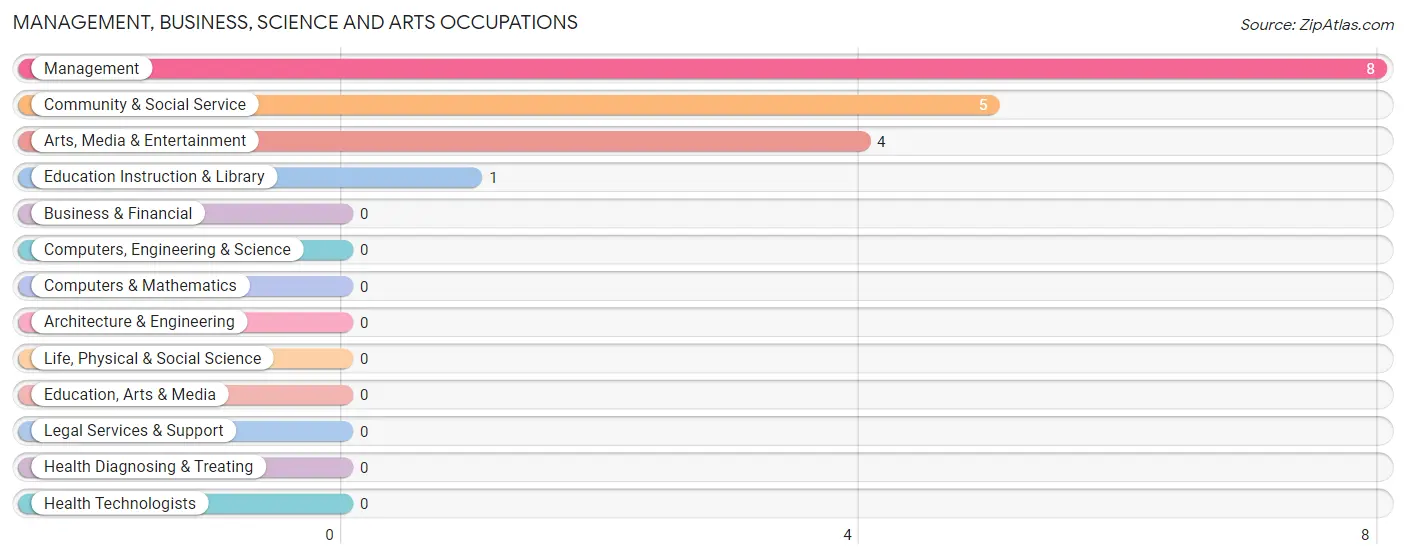
Management, Business, Science and Arts Occupations by Sex
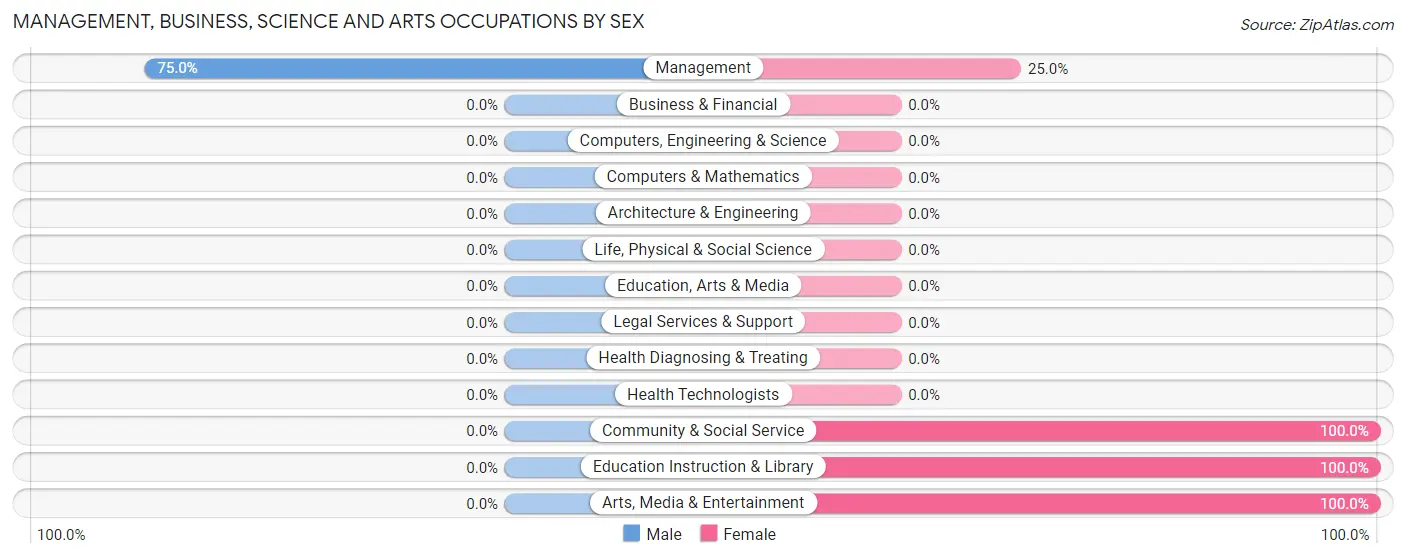
| Occupation | Male | Female |
| Management | 6 (75.0%) | 2 (25.0%) |
| Business & Financial | 0 (0.0%) | 0 (0.0%) |
| Computers, Engineering & Science | 0 (0.0%) | 0 (0.0%) |
| Computers & Mathematics | 0 (0.0%) | 0 (0.0%) |
| Architecture & Engineering | 0 (0.0%) | 0 (0.0%) |
| Life, Physical & Social Science | 0 (0.0%) | 0 (0.0%) |
| Community & Social Service | 0 (0.0%) | 5 (100.0%) |
| Education, Arts & Media | 0 (0.0%) | 0 (0.0%) |
| Legal Services & Support | 0 (0.0%) | 0 (0.0%) |
| Education Instruction & Library | 0 (0.0%) | 1 (100.0%) |
| Arts, Media & Entertainment | 0 (0.0%) | 4 (100.0%) |
| Health Diagnosing & Treating | 0 (0.0%) | 0 (0.0%) |
| Health Technologists | 0 (0.0%) | 0 (0.0%) |
| Total (Category) | 6 (46.2%) | 7 (53.8%) |
| Total (Overall) | 16 (34.8%) | 30 (65.2%) |
Services Occupations
The most common Services occupations in Ouzinkie are Security & Protection (4 | 8.7%), Firefighting & Prevention (4 | 8.7%), and Healthcare Support (2 | 4.3%).
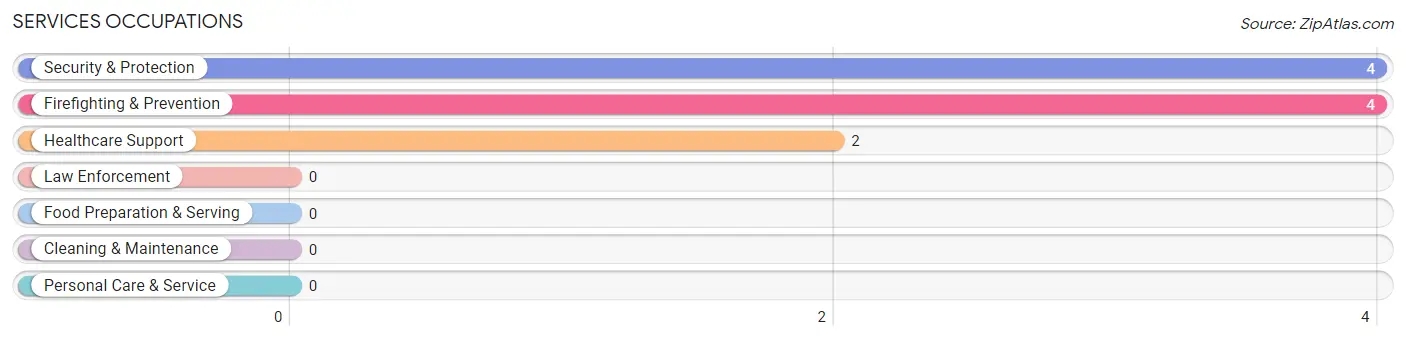
Services Occupations by Sex
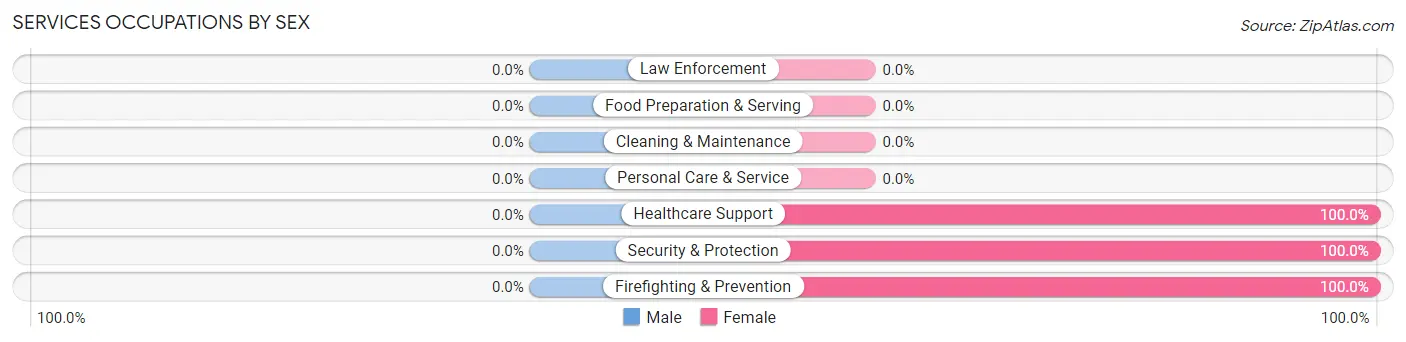
| Occupation | Male | Female |
| Healthcare Support | 0 (0.0%) | 2 (100.0%) |
| Security & Protection | 0 (0.0%) | 4 (100.0%) |
| Firefighting & Prevention | 0 (0.0%) | 4 (100.0%) |
| Law Enforcement | 0 (0.0%) | 0 (0.0%) |
| Food Preparation & Serving | 0 (0.0%) | 0 (0.0%) |
| Cleaning & Maintenance | 0 (0.0%) | 0 (0.0%) |
| Personal Care & Service | 0 (0.0%) | 0 (0.0%) |
| Total (Category) | 0 (0.0%) | 6 (100.0%) |
| Total (Overall) | 16 (34.8%) | 30 (65.2%) |
Sales and Office Occupations
The most common Sales and Office occupations in Ouzinkie are , and Office & Administration (17 | 37.0%).
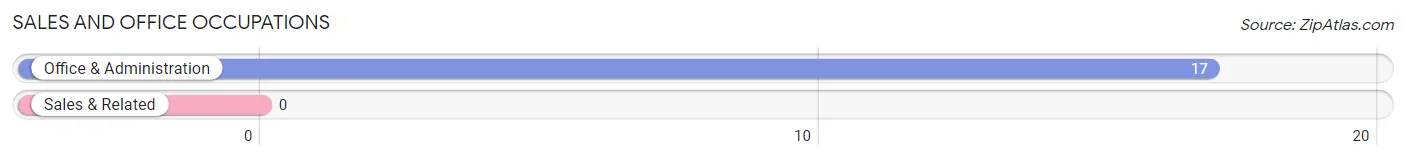
Sales and Office Occupations by Sex
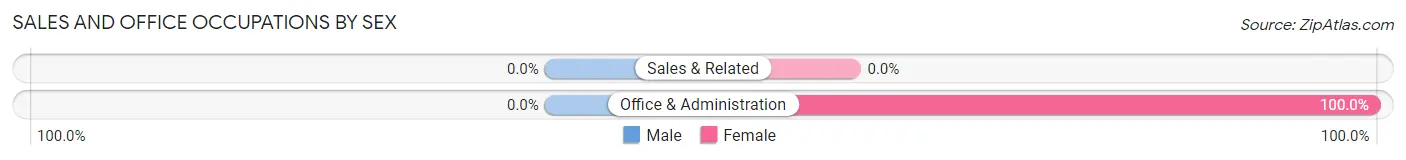
| Occupation | Male | Female |
| Sales & Related | 0 (0.0%) | 0 (0.0%) |
| Office & Administration | 0 (0.0%) | 17 (100.0%) |
| Total (Category) | 0 (0.0%) | 17 (100.0%) |
| Total (Overall) | 16 (34.8%) | 30 (65.2%) |
Natural Resources, Construction and Maintenance Occupations
The most common Natural Resources, Construction and Maintenance occupations in Ouzinkie are Construction & Extraction (5 | 10.9%), and Installation, Maintenance & Repair (2 | 4.3%).
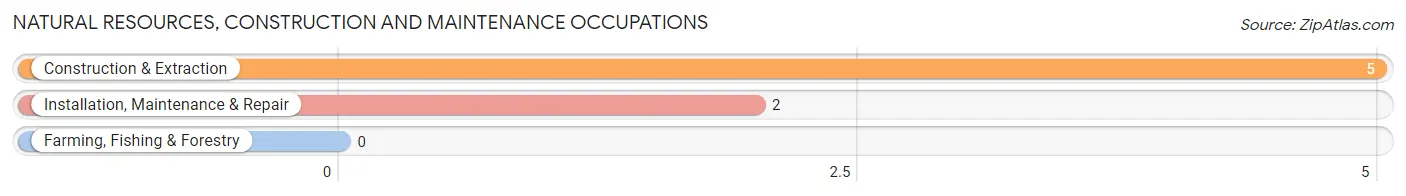
Natural Resources, Construction and Maintenance Occupations by Sex
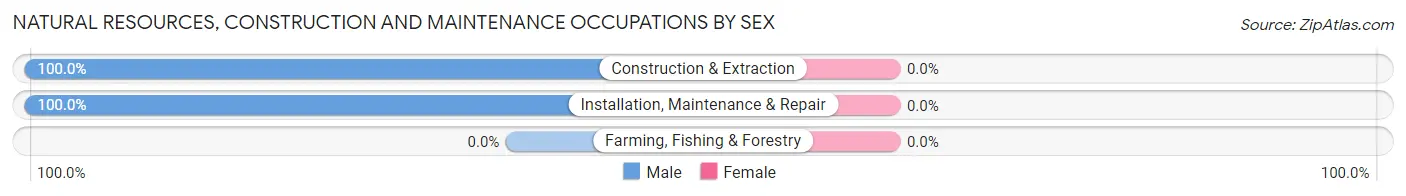
| Occupation | Male | Female |
| Farming, Fishing & Forestry | 0 (0.0%) | 0 (0.0%) |
| Construction & Extraction | 5 (100.0%) | 0 (0.0%) |
| Installation, Maintenance & Repair | 2 (100.0%) | 0 (0.0%) |
| Total (Category) | 7 (100.0%) | 0 (0.0%) |
| Total (Overall) | 16 (34.8%) | 30 (65.2%) |
Production, Transportation and Moving Occupations
The most common Production, Transportation and Moving occupations in Ouzinkie are , and Material Moving (3 | 6.5%).
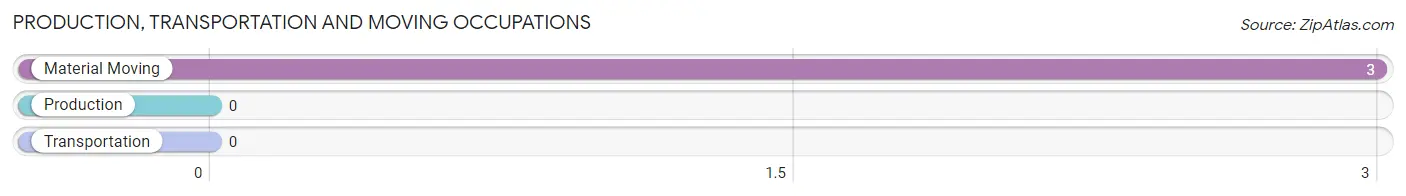
Production, Transportation and Moving Occupations by Sex
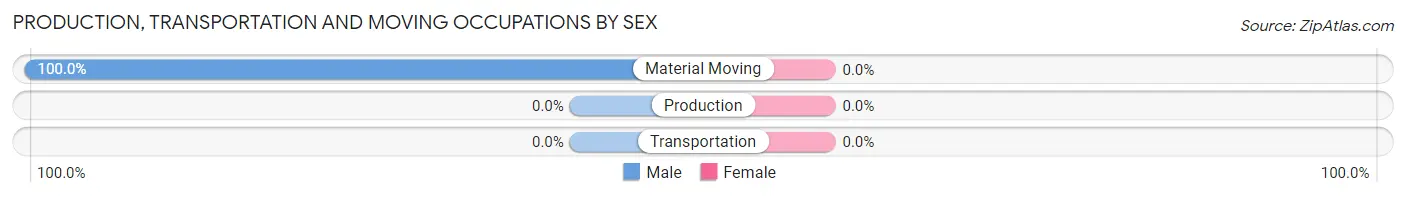
| Occupation | Male | Female |
| Production | 0 (0.0%) | 0 (0.0%) |
| Transportation | 0 (0.0%) | 0 (0.0%) |
| Material Moving | 3 (100.0%) | 0 (0.0%) |
| Total (Category) | 3 (100.0%) | 0 (0.0%) |
| Total (Overall) | 16 (34.8%) | 30 (65.2%) |
Employment Industries by Sex in Ouzinkie
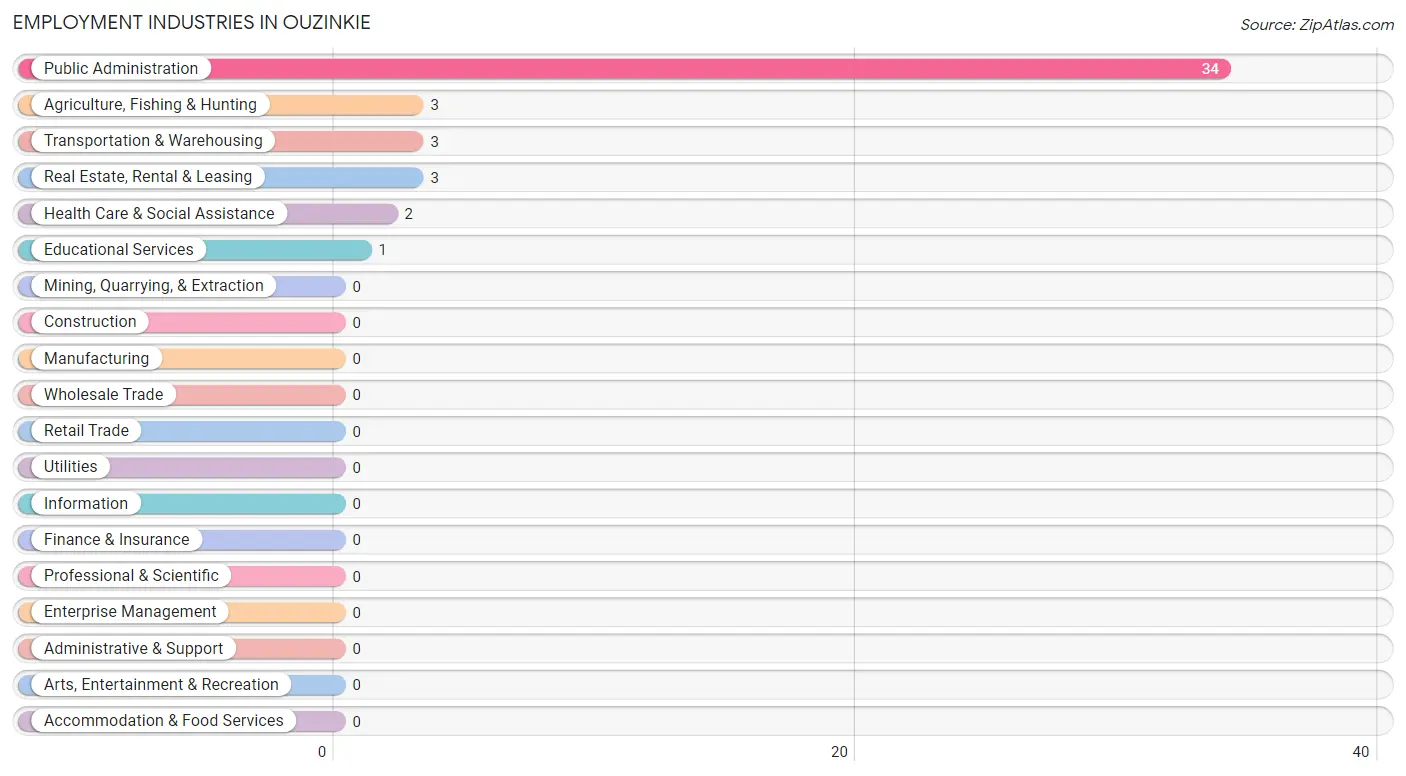
Employment Industries in Ouzinkie
The major employment industries in Ouzinkie include Public Administration (34 | 73.9%), Agriculture, Fishing & Hunting (3 | 6.5%), Transportation & Warehousing (3 | 6.5%), Real Estate, Rental & Leasing (3 | 6.5%), and Health Care & Social Assistance (2 | 4.3%).
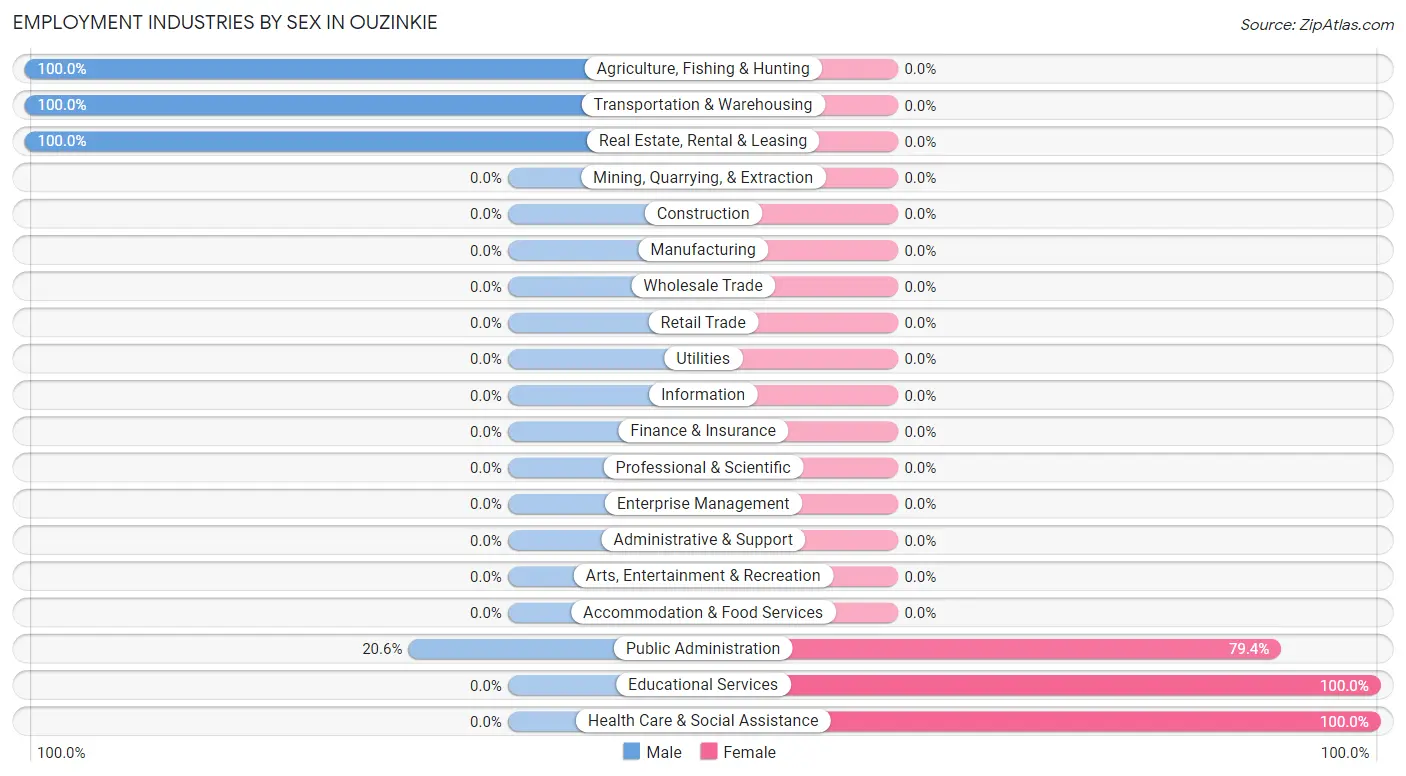
Employment Industries by Sex in Ouzinkie
The Ouzinkie industries that see more men than women are Agriculture, Fishing & Hunting (100.0%), Transportation & Warehousing (100.0%), and Real Estate, Rental & Leasing (100.0%), whereas the industries that tend to have a higher number of women are Educational Services (100.0%), Health Care & Social Assistance (100.0%), and Public Administration (79.4%).
| Industry | Male | Female |
| Agriculture, Fishing & Hunting | 3 (100.0%) | 0 (0.0%) |
| Mining, Quarrying, & Extraction | 0 (0.0%) | 0 (0.0%) |
| Construction | 0 (0.0%) | 0 (0.0%) |
| Manufacturing | 0 (0.0%) | 0 (0.0%) |
| Wholesale Trade | 0 (0.0%) | 0 (0.0%) |
| Retail Trade | 0 (0.0%) | 0 (0.0%) |
| Transportation & Warehousing | 3 (100.0%) | 0 (0.0%) |
| Utilities | 0 (0.0%) | 0 (0.0%) |
| Information | 0 (0.0%) | 0 (0.0%) |
| Finance & Insurance | 0 (0.0%) | 0 (0.0%) |
| Real Estate, Rental & Leasing | 3 (100.0%) | 0 (0.0%) |
| Professional & Scientific | 0 (0.0%) | 0 (0.0%) |
| Enterprise Management | 0 (0.0%) | 0 (0.0%) |
| Administrative & Support | 0 (0.0%) | 0 (0.0%) |
| Educational Services | 0 (0.0%) | 1 (100.0%) |
| Health Care & Social Assistance | 0 (0.0%) | 2 (100.0%) |
| Arts, Entertainment & Recreation | 0 (0.0%) | 0 (0.0%) |
| Accommodation & Food Services | 0 (0.0%) | 0 (0.0%) |
| Public Administration | 7 (20.6%) | 27 (79.4%) |
| Total | 16 (34.8%) | 30 (65.2%) |
Education in Ouzinkie
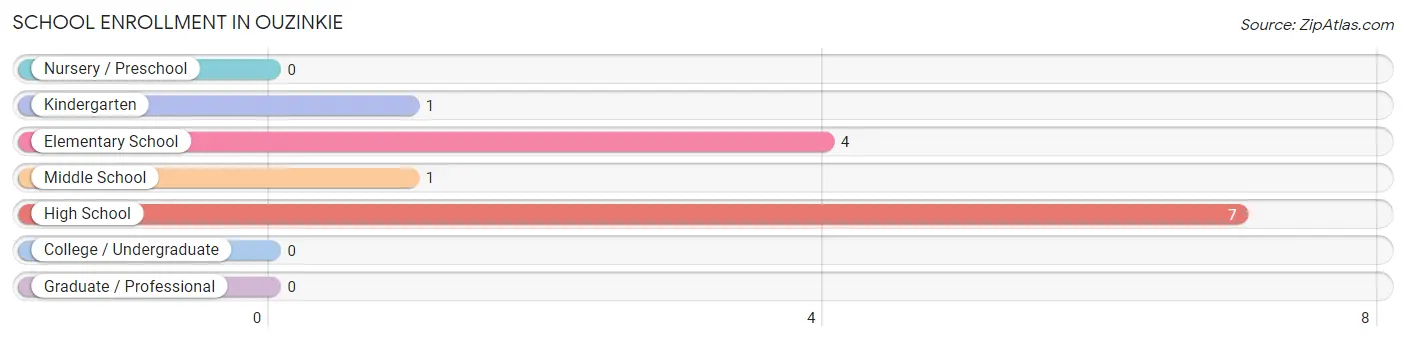
School Enrollment in Ouzinkie
The most common levels of schooling among the 13 students in Ouzinkie are high school (7 | 53.8%), elementary school (4 | 30.8%), and kindergarten (1 | 7.7%).
| School Level | # Students | % Students |
| Nursery / Preschool | 0 | 0.0% |
| Kindergarten | 1 | 7.7% |
| Elementary School | 4 | 30.8% |
| Middle School | 1 | 7.7% |
| High School | 7 | 53.8% |
| College / Undergraduate | 0 | 0.0% |
| Graduate / Professional | 0 | 0.0% |
| Total | 13 | 100.0% |
School Enrollment by Age by Funding Source in Ouzinkie
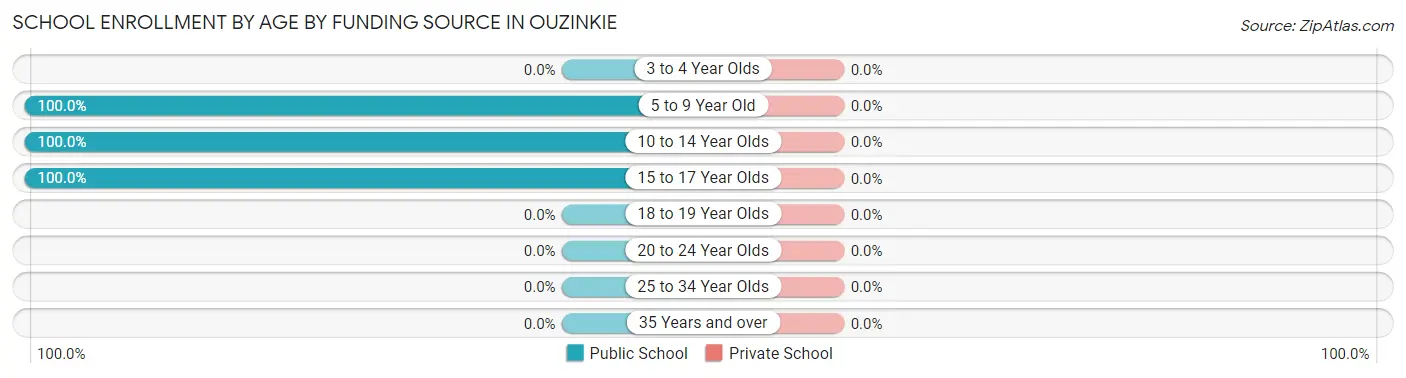
| Age Bracket | Public School | Private School |
| 3 to 4 Year Olds | 0 (0.0%) | 0 (0.0%) |
| 5 to 9 Year Old | 5 (100.0%) | 0 (0.0%) |
| 10 to 14 Year Olds | 1 (100.0%) | 0 (0.0%) |
| 15 to 17 Year Olds | 7 (100.0%) | 0 (0.0%) |
| 18 to 19 Year Olds | 0 (0.0%) | 0 (0.0%) |
| 20 to 24 Year Olds | 0 (0.0%) | 0 (0.0%) |
| 25 to 34 Year Olds | 0 (0.0%) | 0 (0.0%) |
| 35 Years and over | 0 (0.0%) | 0 (0.0%) |
| Total | 13 (100.0%) | 0 (0.0%) |
Educational Attainment by Field of Study in Ouzinkie
, and arts & humanities (1 | 100.0%) are the most common fields of study among 1 individuals in Ouzinkie who have obtained a bachelor's degree or higher.
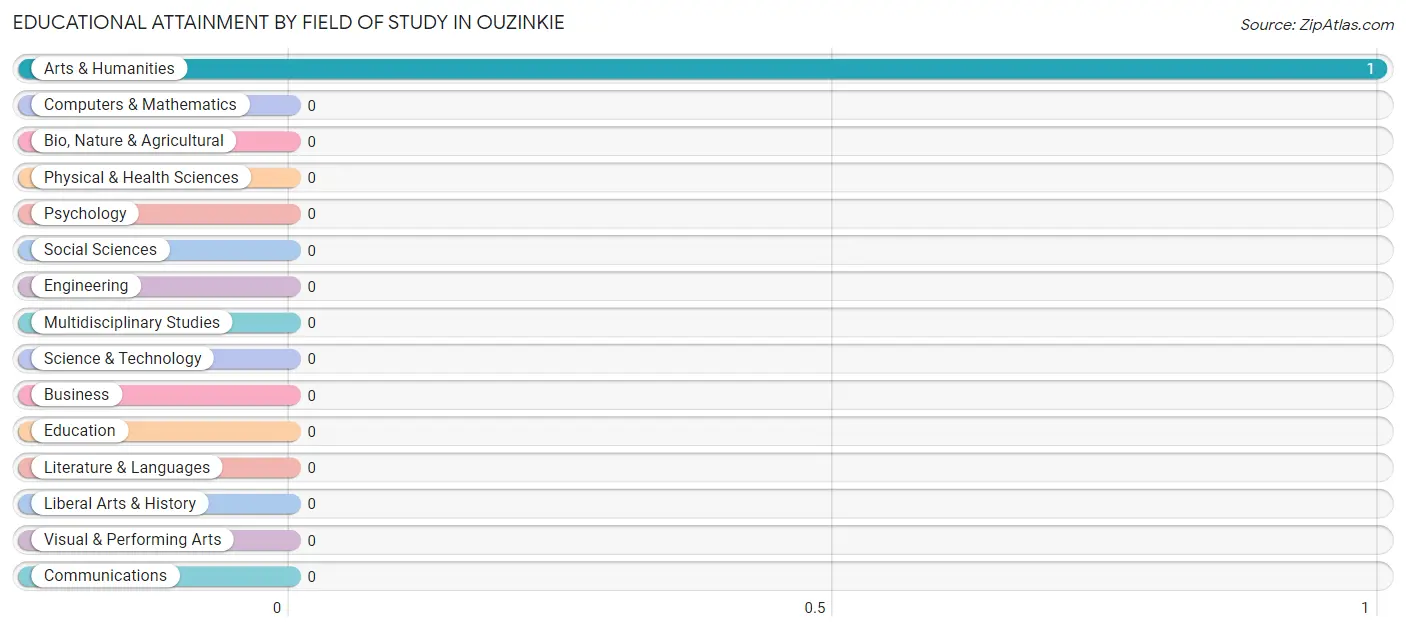
| Field of Study | # Graduates | % Graduates |
| Computers & Mathematics | 0 | 0.0% |
| Bio, Nature & Agricultural | 0 | 0.0% |
| Physical & Health Sciences | 0 | 0.0% |
| Psychology | 0 | 0.0% |
| Social Sciences | 0 | 0.0% |
| Engineering | 0 | 0.0% |
| Multidisciplinary Studies | 0 | 0.0% |
| Science & Technology | 0 | 0.0% |
| Business | 0 | 0.0% |
| Education | 0 | 0.0% |
| Literature & Languages | 0 | 0.0% |
| Liberal Arts & History | 0 | 0.0% |
| Visual & Performing Arts | 0 | 0.0% |
| Communications | 0 | 0.0% |
| Arts & Humanities | 1 | 100.0% |
| Total | 1 | 100.0% |
Transportation & Commute in Ouzinkie
Vehicle Availability by Sex in Ouzinkie
The most prevalent vehicle ownership categories in Ouzinkie are males with 1 vehicle (7, accounting for 77.8%) and females with 1 vehicle (11, making up 25.0%).
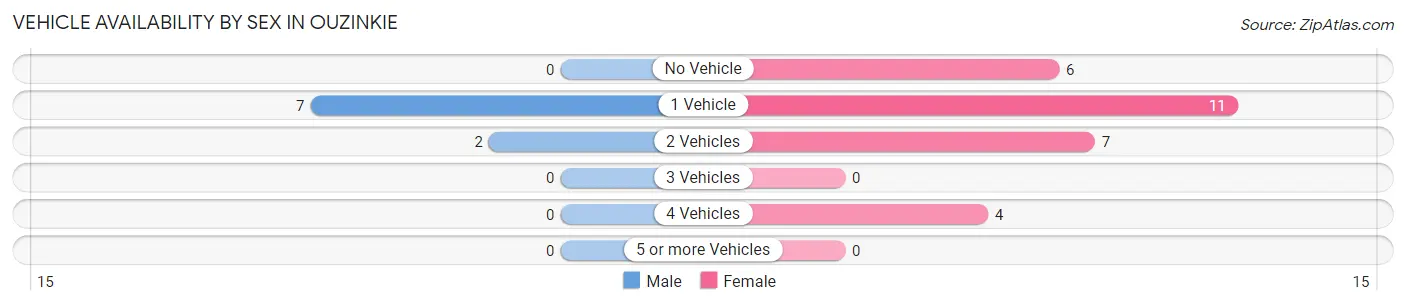
| Vehicles Available | Male | Female |
| No Vehicle | 0 (0.0%) | 6 (21.4%) |
| 1 Vehicle | 7 (77.8%) | 11 (39.3%) |
| 2 Vehicles | 2 (22.2%) | 7 (25.0%) |
| 3 Vehicles | 0 (0.0%) | 0 (0.0%) |
| 4 Vehicles | 0 (0.0%) | 4 (14.3%) |
| 5 or more Vehicles | 0 (0.0%) | 0 (0.0%) |
| Total | 9 (100.0%) | 28 (100.0%) |
Commute Time in Ouzinkie
The most frequently occuring commute durations in Ouzinkie are less than 5 minutes (24 commuters, 64.9%), 5 to 9 minutes (13 commuters, 35.1%), and 10 to 14 minutes (0 commuters, 0.0%).
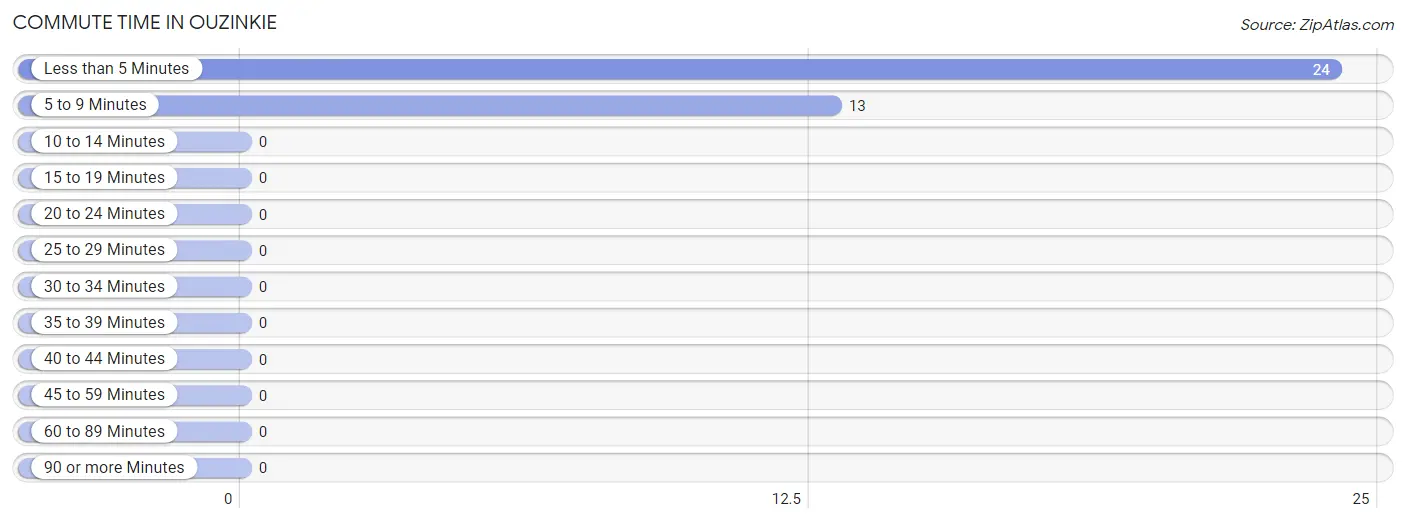
| Commute Time | # Commuters | % Commuters |
| Less than 5 Minutes | 24 | 64.9% |
| 5 to 9 Minutes | 13 | 35.1% |
| 10 to 14 Minutes | 0 | 0.0% |
| 15 to 19 Minutes | 0 | 0.0% |
| 20 to 24 Minutes | 0 | 0.0% |
| 25 to 29 Minutes | 0 | 0.0% |
| 30 to 34 Minutes | 0 | 0.0% |
| 35 to 39 Minutes | 0 | 0.0% |
| 40 to 44 Minutes | 0 | 0.0% |
| 45 to 59 Minutes | 0 | 0.0% |
| 60 to 89 Minutes | 0 | 0.0% |
| 90 or more Minutes | 0 | 0.0% |
Commute Time by Sex in Ouzinkie
The most common commute times in Ouzinkie are 5 to 9 minutes (5 commuters, 55.6%) for males and less than 5 minutes (20 commuters, 71.4%) for females.
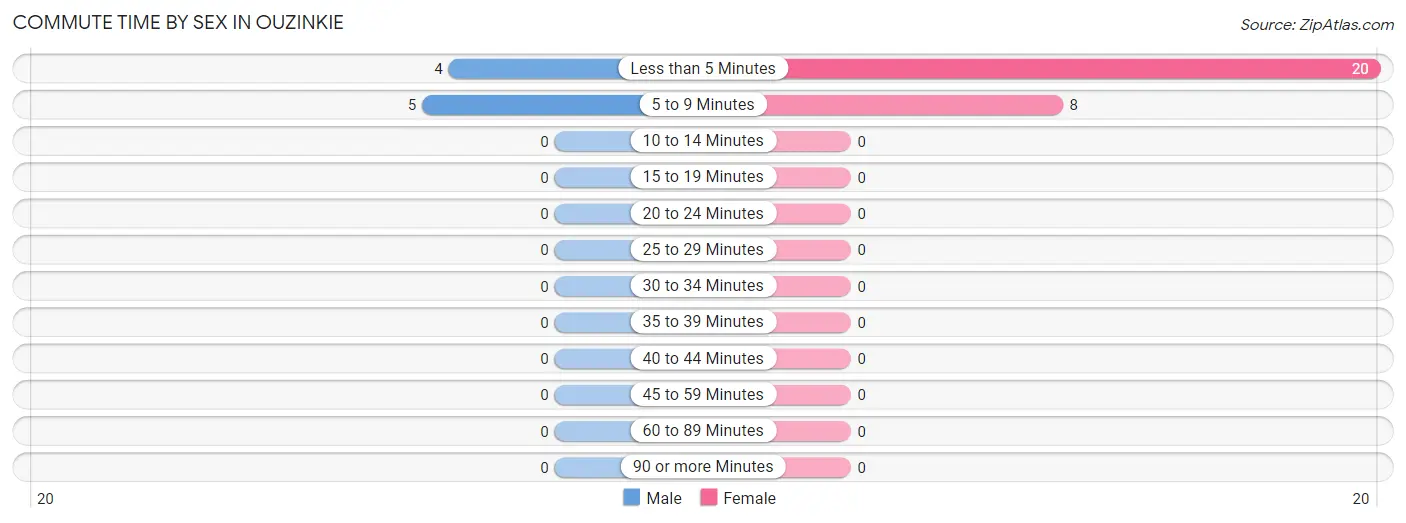
| Commute Time | Male | Female |
| Less than 5 Minutes | 4 (44.4%) | 20 (71.4%) |
| 5 to 9 Minutes | 5 (55.6%) | 8 (28.6%) |
| 10 to 14 Minutes | 0 (0.0%) | 0 (0.0%) |
| 15 to 19 Minutes | 0 (0.0%) | 0 (0.0%) |
| 20 to 24 Minutes | 0 (0.0%) | 0 (0.0%) |
| 25 to 29 Minutes | 0 (0.0%) | 0 (0.0%) |
| 30 to 34 Minutes | 0 (0.0%) | 0 (0.0%) |
| 35 to 39 Minutes | 0 (0.0%) | 0 (0.0%) |
| 40 to 44 Minutes | 0 (0.0%) | 0 (0.0%) |
| 45 to 59 Minutes | 0 (0.0%) | 0 (0.0%) |
| 60 to 89 Minutes | 0 (0.0%) | 0 (0.0%) |
| 90 or more Minutes | 0 (0.0%) | 0 (0.0%) |
Time of Departure to Work by Sex in Ouzinkie
The most frequent times of departure to work in Ouzinkie are 8:00 AM to 8:29 AM (8, 88.9%) for males and 8:30 AM to 8:59 AM (17, 60.7%) for females.
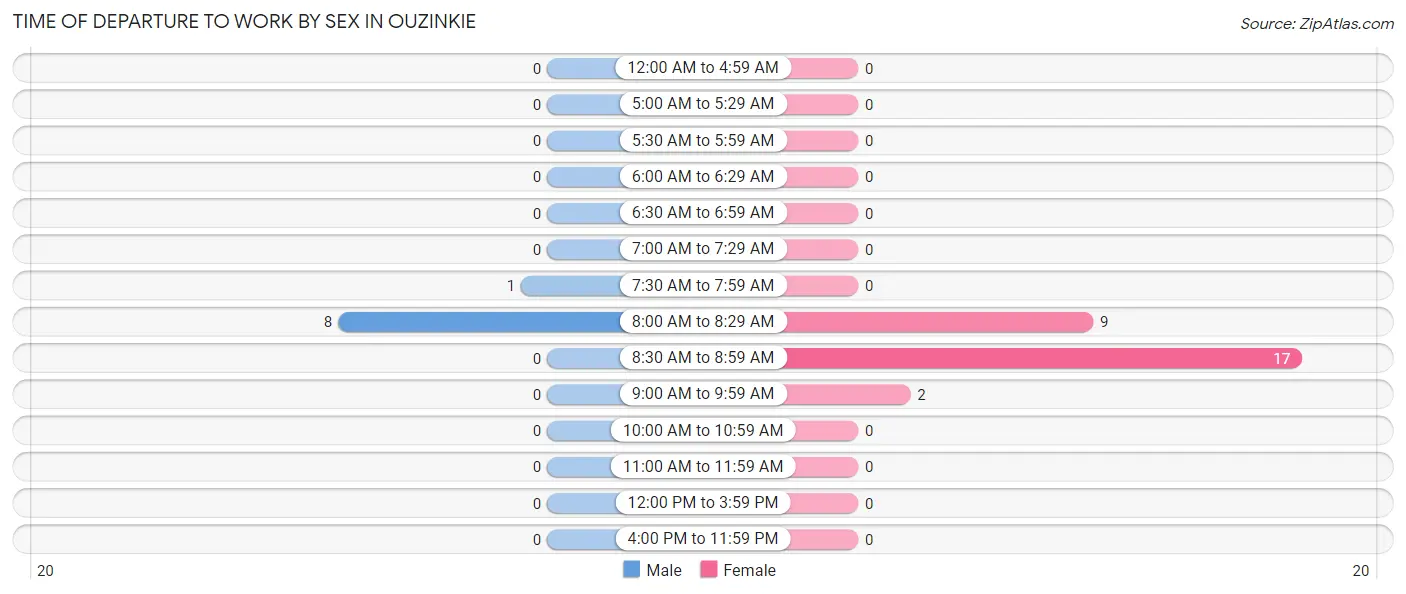
| Time of Departure | Male | Female |
| 12:00 AM to 4:59 AM | 0 (0.0%) | 0 (0.0%) |
| 5:00 AM to 5:29 AM | 0 (0.0%) | 0 (0.0%) |
| 5:30 AM to 5:59 AM | 0 (0.0%) | 0 (0.0%) |
| 6:00 AM to 6:29 AM | 0 (0.0%) | 0 (0.0%) |
| 6:30 AM to 6:59 AM | 0 (0.0%) | 0 (0.0%) |
| 7:00 AM to 7:29 AM | 0 (0.0%) | 0 (0.0%) |
| 7:30 AM to 7:59 AM | 1 (11.1%) | 0 (0.0%) |
| 8:00 AM to 8:29 AM | 8 (88.9%) | 9 (32.1%) |
| 8:30 AM to 8:59 AM | 0 (0.0%) | 17 (60.7%) |
| 9:00 AM to 9:59 AM | 0 (0.0%) | 2 (7.1%) |
| 10:00 AM to 10:59 AM | 0 (0.0%) | 0 (0.0%) |
| 11:00 AM to 11:59 AM | 0 (0.0%) | 0 (0.0%) |
| 12:00 PM to 3:59 PM | 0 (0.0%) | 0 (0.0%) |
| 4:00 PM to 11:59 PM | 0 (0.0%) | 0 (0.0%) |
| Total | 9 (100.0%) | 28 (100.0%) |
Housing Occupancy in Ouzinkie
Occupancy by Ownership in Ouzinkie
Of the total 40 dwellings in Ouzinkie, owner-occupied units account for 31 (77.5%), while renter-occupied units make up 9 (22.5%).
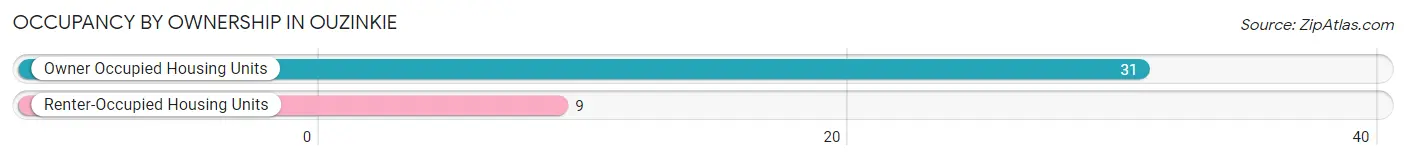
| Occupancy | # Housing Units | % Housing Units |
| Owner Occupied Housing Units | 31 | 77.5% |
| Renter-Occupied Housing Units | 9 | 22.5% |
| Total Occupied Housing Units | 40 | 100.0% |
Occupancy by Household Size in Ouzinkie
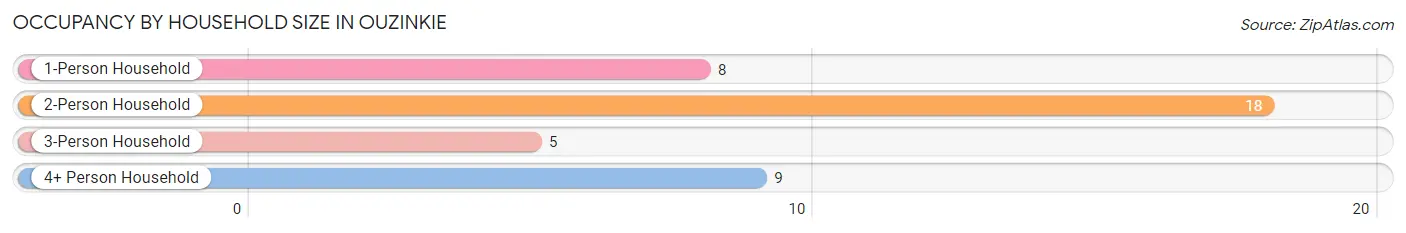
| Household Size | # Housing Units | % Housing Units |
| 1-Person Household | 8 | 20.0% |
| 2-Person Household | 18 | 45.0% |
| 3-Person Household | 5 | 12.5% |
| 4+ Person Household | 9 | 22.5% |
| Total Housing Units | 40 | 100.0% |
Occupancy by Ownership by Household Size in Ouzinkie
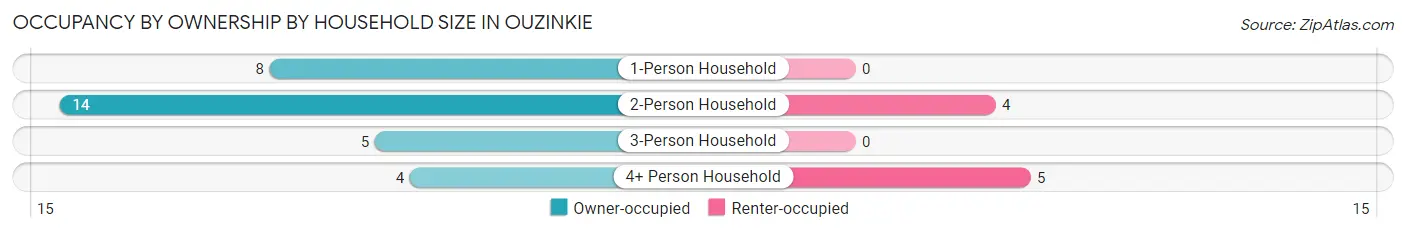
| Household Size | Owner-occupied | Renter-occupied |
| 1-Person Household | 8 (100.0%) | 0 (0.0%) |
| 2-Person Household | 14 (77.8%) | 4 (22.2%) |
| 3-Person Household | 5 (100.0%) | 0 (0.0%) |
| 4+ Person Household | 4 (44.4%) | 5 (55.6%) |
| Total Housing Units | 31 (77.5%) | 9 (22.5%) |
Occupancy by Educational Attainment in Ouzinkie
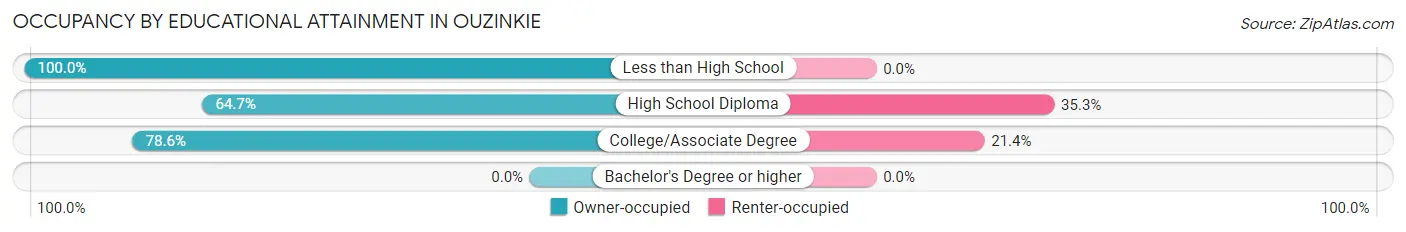
| Household Size | Owner-occupied | Renter-occupied |
| Less than High School | 9 (100.0%) | 0 (0.0%) |
| High School Diploma | 11 (64.7%) | 6 (35.3%) |
| College/Associate Degree | 11 (78.6%) | 3 (21.4%) |
| Bachelor's Degree or higher | 0 (0.0%) | 0 (0.0%) |
Occupancy by Age of Householder in Ouzinkie
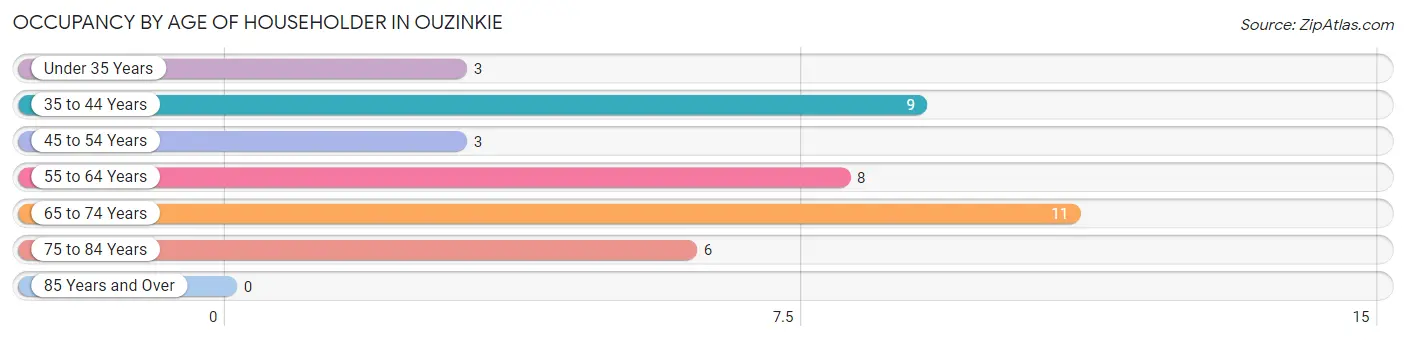
| Age Bracket | # Households | % Households |
| Under 35 Years | 3 | 7.5% |
| 35 to 44 Years | 9 | 22.5% |
| 45 to 54 Years | 3 | 7.5% |
| 55 to 64 Years | 8 | 20.0% |
| 65 to 74 Years | 11 | 27.5% |
| 75 to 84 Years | 6 | 15.0% |
| 85 Years and Over | 0 | 0.0% |
| Total | 40 | 100.0% |
Housing Finances in Ouzinkie
Median Income by Occupancy in Ouzinkie
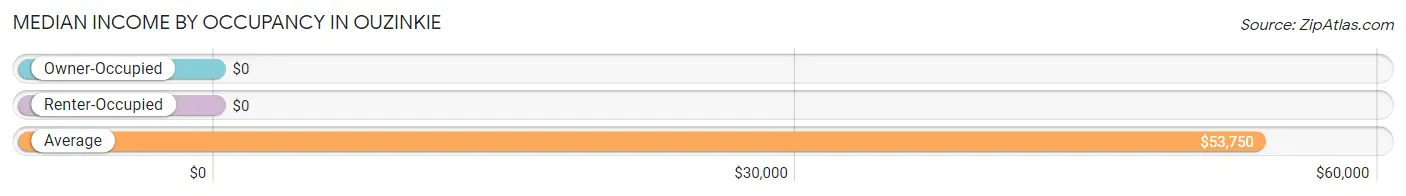
| Occupancy Type | # Households | Median Income |
| Owner-Occupied | 31 (77.5%) | $0 |
| Renter-Occupied | 9 (22.5%) | $0 |
| Average | 40 (100.0%) | $53,750 |
Occupancy by Householder Income Bracket in Ouzinkie
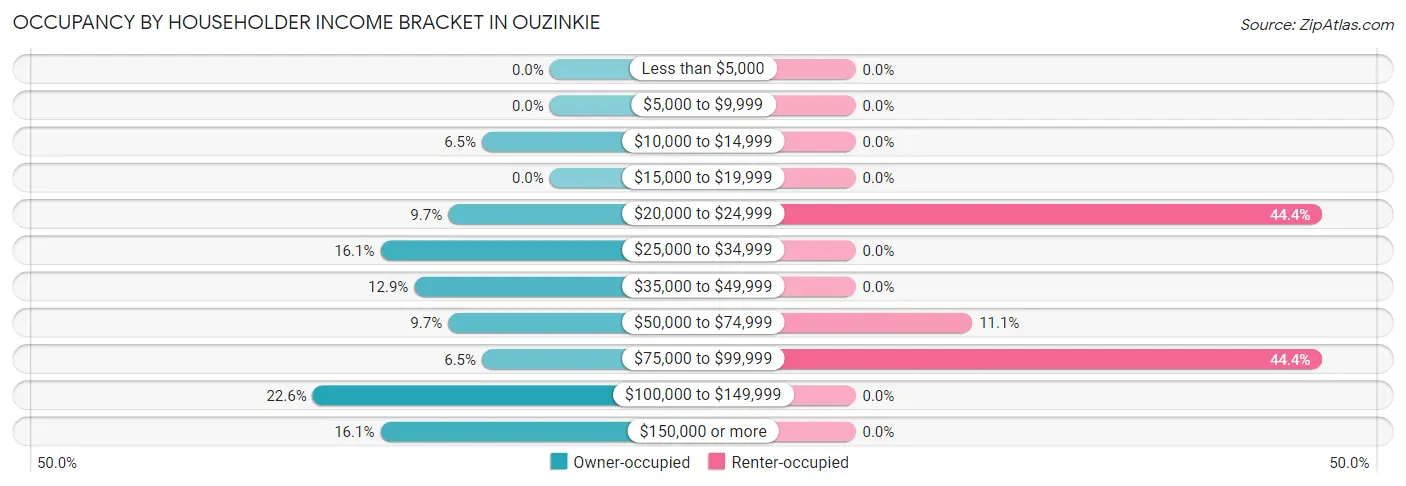
| Income Bracket | Owner-occupied | Renter-occupied |
| Less than $5,000 | 0 (0.0%) | 0 (0.0%) |
| $5,000 to $9,999 | 0 (0.0%) | 0 (0.0%) |
| $10,000 to $14,999 | 2 (6.5%) | 0 (0.0%) |
| $15,000 to $19,999 | 0 (0.0%) | 0 (0.0%) |
| $20,000 to $24,999 | 3 (9.7%) | 4 (44.4%) |
| $25,000 to $34,999 | 5 (16.1%) | 0 (0.0%) |
| $35,000 to $49,999 | 4 (12.9%) | 0 (0.0%) |
| $50,000 to $74,999 | 3 (9.7%) | 1 (11.1%) |
| $75,000 to $99,999 | 2 (6.5%) | 4 (44.4%) |
| $100,000 to $149,999 | 7 (22.6%) | 0 (0.0%) |
| $150,000 or more | 5 (16.1%) | 0 (0.0%) |
| Total | 31 (100.0%) | 9 (100.0%) |
Monthly Housing Cost Tiers in Ouzinkie
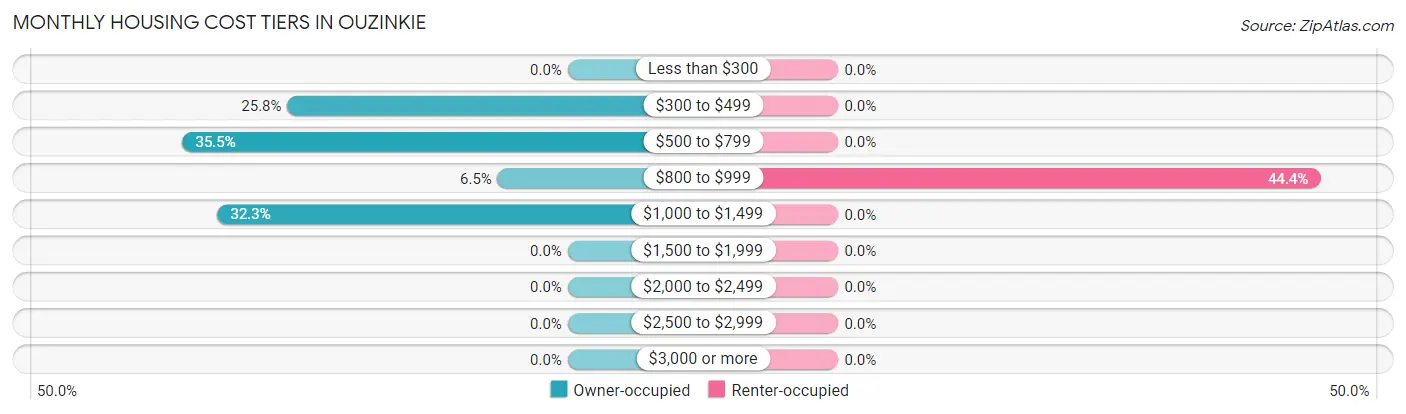
| Monthly Cost | Owner-occupied | Renter-occupied |
| Less than $300 | 0 (0.0%) | 0 (0.0%) |
| $300 to $499 | 8 (25.8%) | 0 (0.0%) |
| $500 to $799 | 11 (35.5%) | 0 (0.0%) |
| $800 to $999 | 2 (6.5%) | 4 (44.4%) |
| $1,000 to $1,499 | 10 (32.3%) | 0 (0.0%) |
| $1,500 to $1,999 | 0 (0.0%) | 0 (0.0%) |
| $2,000 to $2,499 | 0 (0.0%) | 0 (0.0%) |
| $2,500 to $2,999 | 0 (0.0%) | 0 (0.0%) |
| $3,000 or more | 0 (0.0%) | 0 (0.0%) |
| Total | 31 (100.0%) | 9 (100.0%) |
Physical Housing Characteristics in Ouzinkie
Housing Structures in Ouzinkie
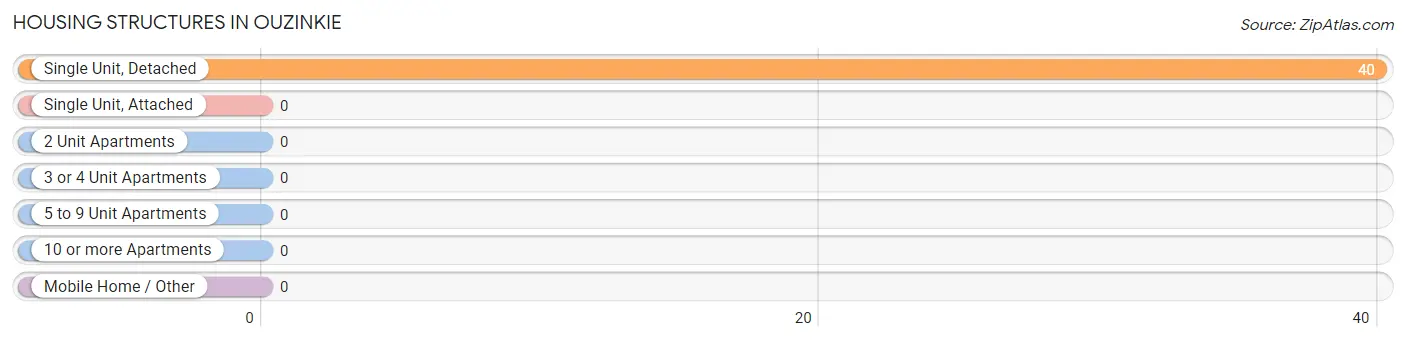
| Structure Type | # Housing Units | % Housing Units |
| Single Unit, Detached | 40 | 100.0% |
| Single Unit, Attached | 0 | 0.0% |
| 2 Unit Apartments | 0 | 0.0% |
| 3 or 4 Unit Apartments | 0 | 0.0% |
| 5 to 9 Unit Apartments | 0 | 0.0% |
| 10 or more Apartments | 0 | 0.0% |
| Mobile Home / Other | 0 | 0.0% |
| Total | 40 | 100.0% |
Housing Structures by Occupancy in Ouzinkie
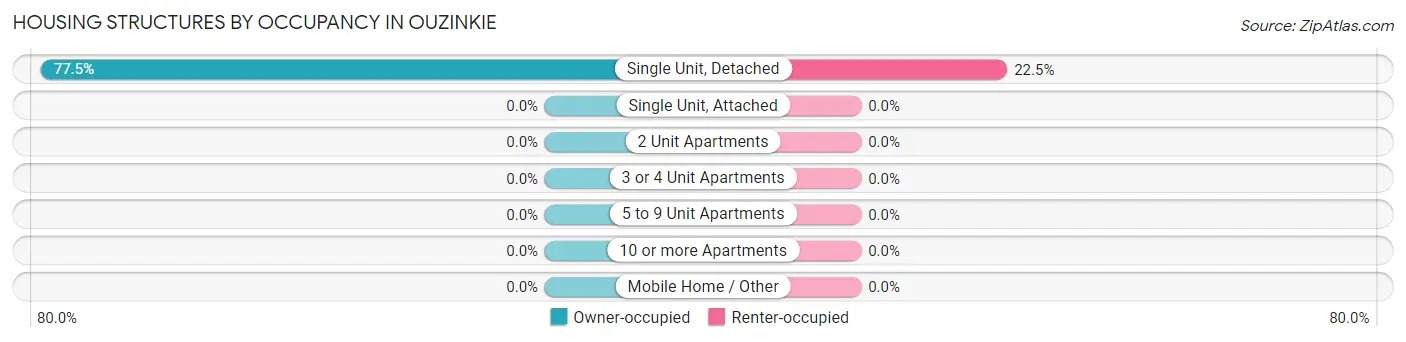
| Structure Type | Owner-occupied | Renter-occupied |
| Single Unit, Detached | 31 (77.5%) | 9 (22.5%) |
| Single Unit, Attached | 0 (0.0%) | 0 (0.0%) |
| 2 Unit Apartments | 0 (0.0%) | 0 (0.0%) |
| 3 or 4 Unit Apartments | 0 (0.0%) | 0 (0.0%) |
| 5 to 9 Unit Apartments | 0 (0.0%) | 0 (0.0%) |
| 10 or more Apartments | 0 (0.0%) | 0 (0.0%) |
| Mobile Home / Other | 0 (0.0%) | 0 (0.0%) |
| Total | 31 (77.5%) | 9 (22.5%) |
Housing Structures by Number of Rooms in Ouzinkie
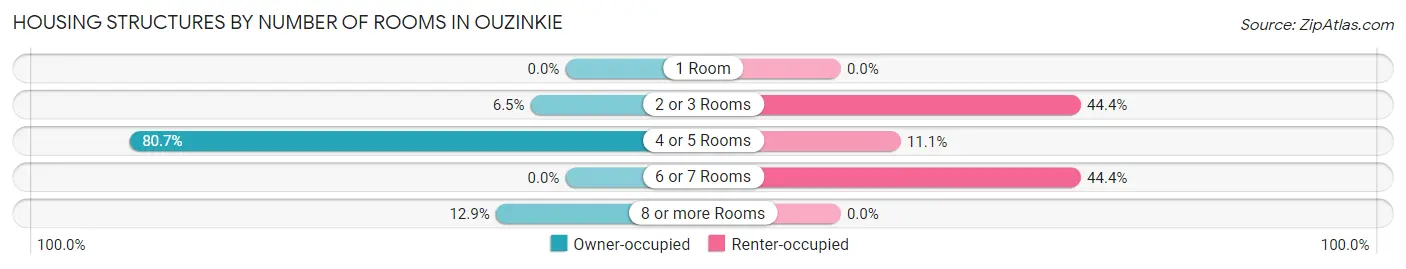
| Number of Rooms | Owner-occupied | Renter-occupied |
| 1 Room | 0 (0.0%) | 0 (0.0%) |
| 2 or 3 Rooms | 2 (6.5%) | 4 (44.4%) |
| 4 or 5 Rooms | 25 (80.6%) | 1 (11.1%) |
| 6 or 7 Rooms | 0 (0.0%) | 4 (44.4%) |
| 8 or more Rooms | 4 (12.9%) | 0 (0.0%) |
| Total | 31 (100.0%) | 9 (100.0%) |
Housing Structure by Heating Type in Ouzinkie
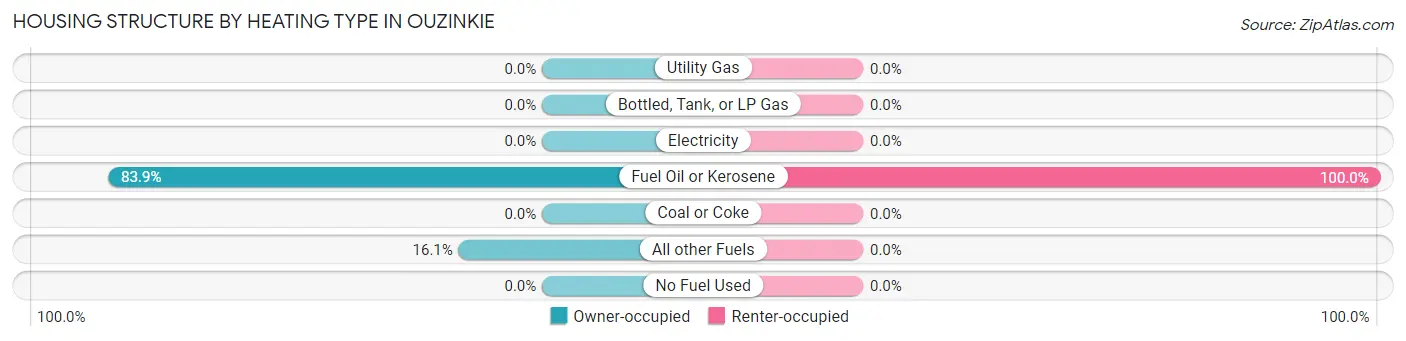
| Heating Type | Owner-occupied | Renter-occupied |
| Utility Gas | 0 (0.0%) | 0 (0.0%) |
| Bottled, Tank, or LP Gas | 0 (0.0%) | 0 (0.0%) |
| Electricity | 0 (0.0%) | 0 (0.0%) |
| Fuel Oil or Kerosene | 26 (83.9%) | 9 (100.0%) |
| Coal or Coke | 0 (0.0%) | 0 (0.0%) |
| All other Fuels | 5 (16.1%) | 0 (0.0%) |
| No Fuel Used | 0 (0.0%) | 0 (0.0%) |
| Total | 31 (100.0%) | 9 (100.0%) |
Household Vehicle Usage in Ouzinkie
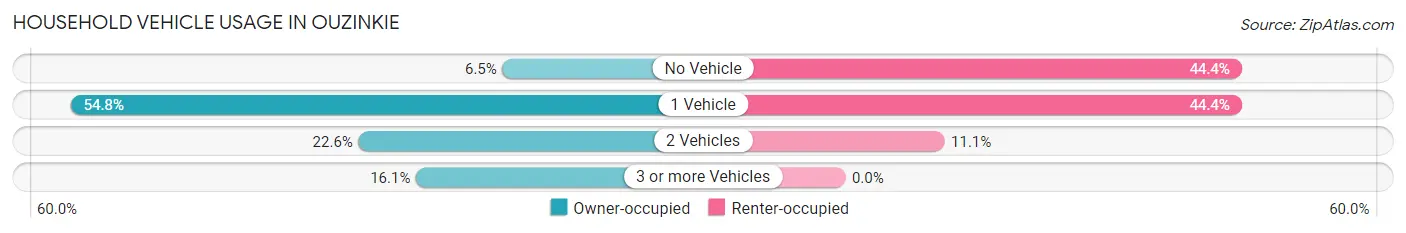
| Vehicles per Household | Owner-occupied | Renter-occupied |
| No Vehicle | 2 (6.5%) | 4 (44.4%) |
| 1 Vehicle | 17 (54.8%) | 4 (44.4%) |
| 2 Vehicles | 7 (22.6%) | 1 (11.1%) |
| 3 or more Vehicles | 5 (16.1%) | 0 (0.0%) |
| Total | 31 (100.0%) | 9 (100.0%) |
Real Estate & Mortgages in Ouzinkie
Real Estate and Mortgage Overview in Ouzinkie
| Characteristic | Without Mortgage | With Mortgage |
| Housing Units | 25 | 6 |
| Median Property Value | - | - |
| Median Household Income | - | - |
| Monthly Housing Costs | $550 | $0 |
| Real Estate Taxes | $800 | $2 |
Property Value by Mortgage Status in Ouzinkie
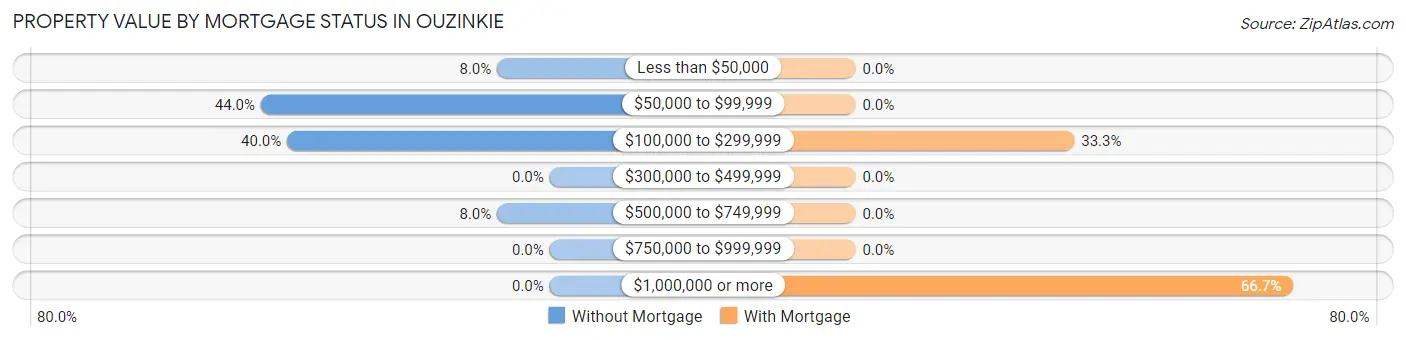
| Property Value | Without Mortgage | With Mortgage |
| Less than $50,000 | 2 (8.0%) | 0 (0.0%) |
| $50,000 to $99,999 | 11 (44.0%) | 0 (0.0%) |
| $100,000 to $299,999 | 10 (40.0%) | 2 (33.3%) |
| $300,000 to $499,999 | 0 (0.0%) | 0 (0.0%) |
| $500,000 to $749,999 | 2 (8.0%) | 0 (0.0%) |
| $750,000 to $999,999 | 0 (0.0%) | 0 (0.0%) |
| $1,000,000 or more | 0 (0.0%) | 4 (66.7%) |
| Total | 25 (100.0%) | 6 (100.0%) |
Household Income by Mortgage Status in Ouzinkie
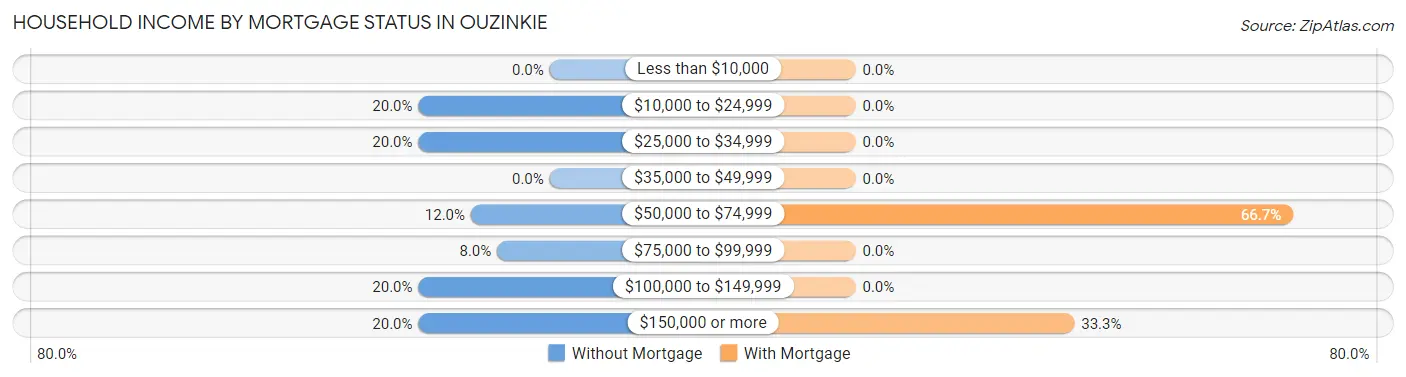
| Household Income | Without Mortgage | With Mortgage |
| Less than $10,000 | 0 (0.0%) | 0 (0.0%) |
| $10,000 to $24,999 | 5 (20.0%) | 0 (0.0%) |
| $25,000 to $34,999 | 5 (20.0%) | 0 (0.0%) |
| $35,000 to $49,999 | 0 (0.0%) | 0 (0.0%) |
| $50,000 to $74,999 | 3 (12.0%) | 4 (66.7%) |
| $75,000 to $99,999 | 2 (8.0%) | 0 (0.0%) |
| $100,000 to $149,999 | 5 (20.0%) | 0 (0.0%) |
| $150,000 or more | 5 (20.0%) | 2 (33.3%) |
| Total | 25 (100.0%) | 6 (100.0%) |
Property Value to Household Income Ratio in Ouzinkie
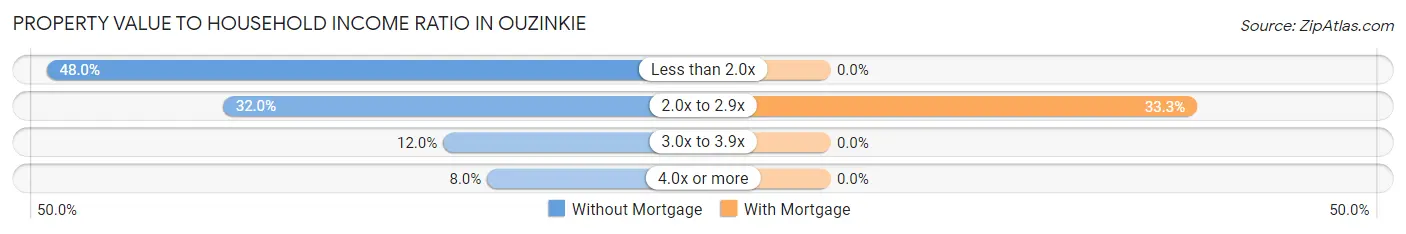
| Value-to-Income Ratio | Without Mortgage | With Mortgage |
| Less than 2.0x | 12 (48.0%) | 0 (0.0%) |
| 2.0x to 2.9x | 8 (32.0%) | 2 (33.3%) |
| 3.0x to 3.9x | 3 (12.0%) | 0 (0.0%) |
| 4.0x or more | 2 (8.0%) | 0 (0.0%) |
| Total | 25 (100.0%) | 6 (100.0%) |
Real Estate Taxes by Mortgage Status in Ouzinkie
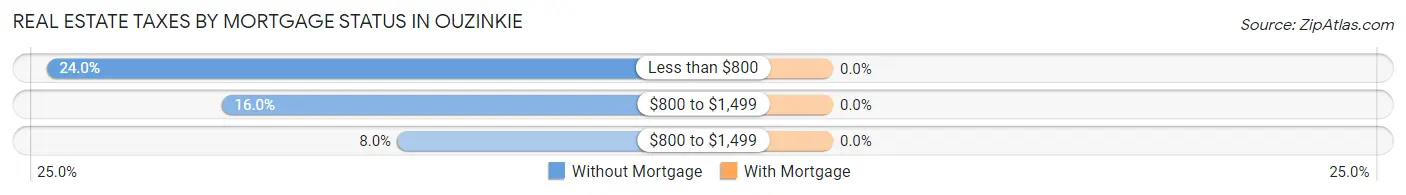
| Property Taxes | Without Mortgage | With Mortgage |
| Less than $800 | 6 (24.0%) | 0 (0.0%) |
| $800 to $1,499 | 4 (16.0%) | 0 (0.0%) |
| $800 to $1,499 | 2 (8.0%) | 0 (0.0%) |
| Total | 25 (100.0%) | 6 (100.0%) |
Health & Disability in Ouzinkie
Health Insurance Coverage by Age in Ouzinkie
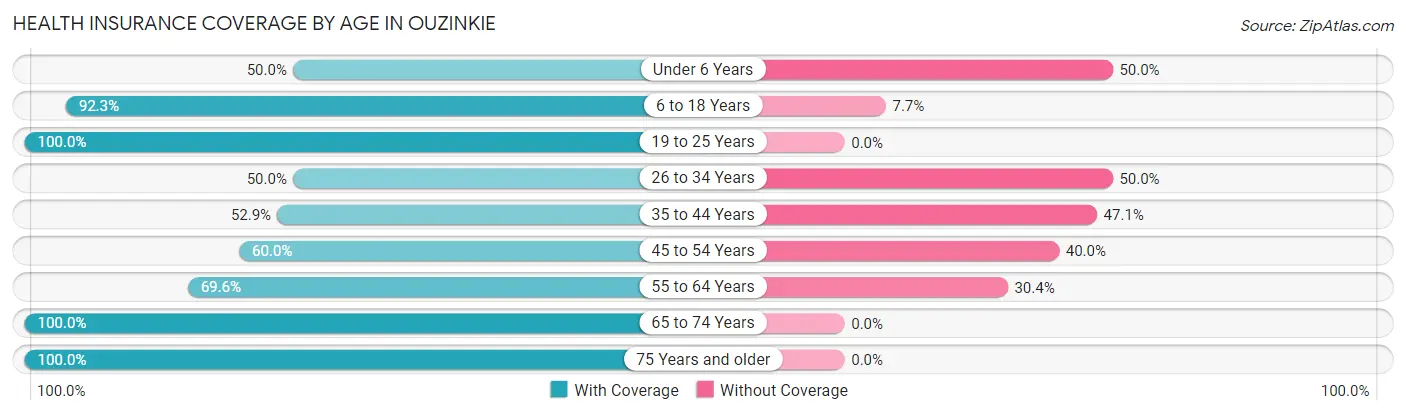
| Age Bracket | With Coverage | Without Coverage |
| Under 6 Years | 1 (50.0%) | 1 (50.0%) |
| 6 to 18 Years | 12 (92.3%) | 1 (7.7%) |
| 19 to 25 Years | 2 (100.0%) | 0 (0.0%) |
| 26 to 34 Years | 4 (50.0%) | 4 (50.0%) |
| 35 to 44 Years | 9 (52.9%) | 8 (47.1%) |
| 45 to 54 Years | 3 (60.0%) | 2 (40.0%) |
| 55 to 64 Years | 16 (69.6%) | 7 (30.4%) |
| 65 to 74 Years | 14 (100.0%) | 0 (0.0%) |
| 75 Years and older | 6 (100.0%) | 0 (0.0%) |
| Total | 67 (74.4%) | 23 (25.6%) |
Health Insurance Coverage by Citizenship Status in Ouzinkie
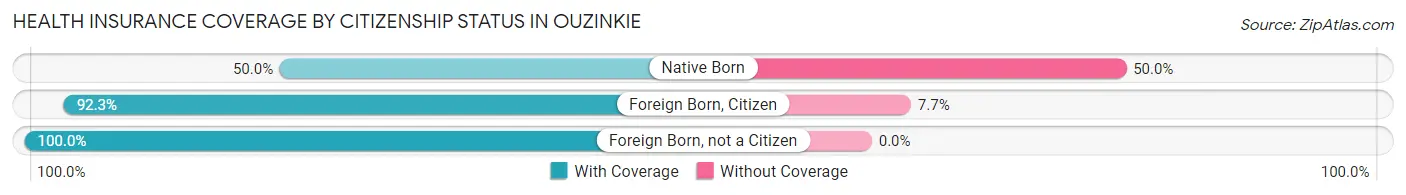
| Citizenship Status | With Coverage | Without Coverage |
| Native Born | 1 (50.0%) | 1 (50.0%) |
| Foreign Born, Citizen | 12 (92.3%) | 1 (7.7%) |
| Foreign Born, not a Citizen | 2 (100.0%) | 0 (0.0%) |
Health Insurance Coverage by Household Income in Ouzinkie
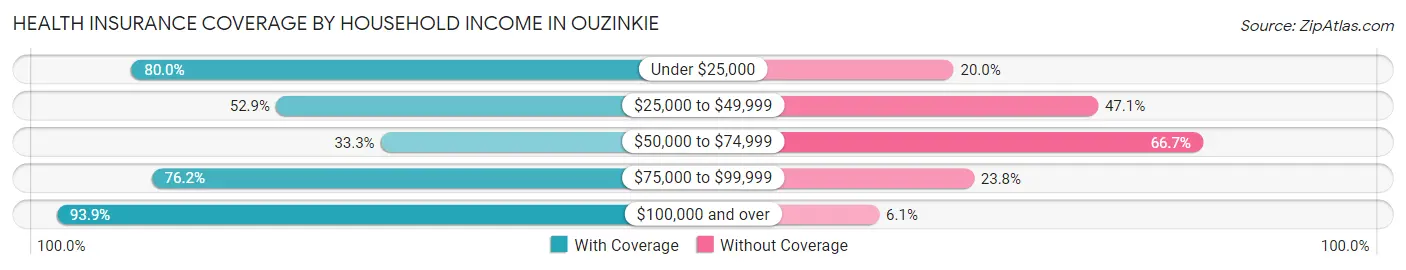
| Household Income | With Coverage | Without Coverage |
| Under $25,000 | 8 (80.0%) | 2 (20.0%) |
| $25,000 to $49,999 | 9 (52.9%) | 8 (47.1%) |
| $50,000 to $74,999 | 3 (33.3%) | 6 (66.7%) |
| $75,000 to $99,999 | 16 (76.2%) | 5 (23.8%) |
| $100,000 and over | 31 (93.9%) | 2 (6.1%) |
Public vs Private Health Insurance Coverage by Age in Ouzinkie
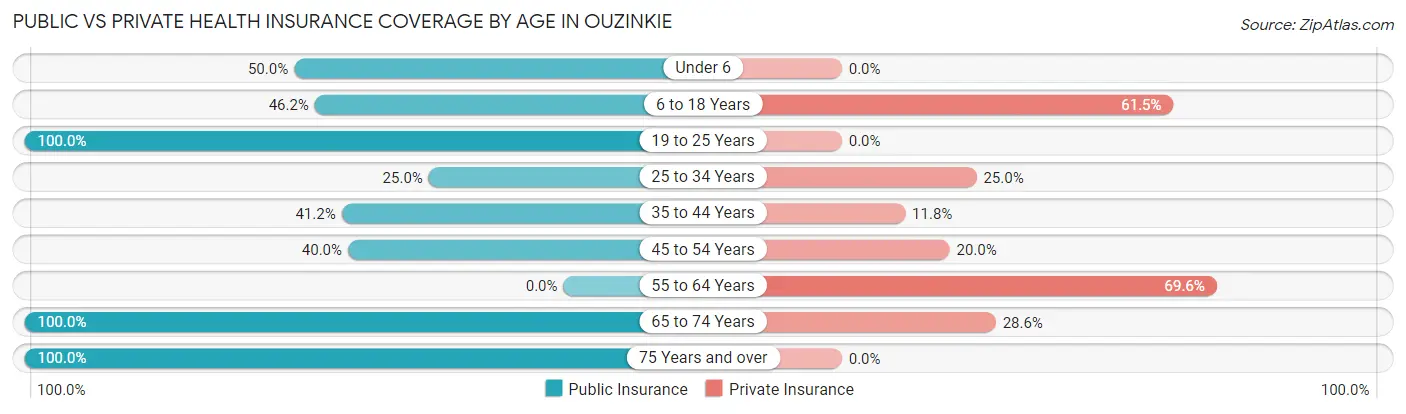
| Age Bracket | Public Insurance | Private Insurance |
| Under 6 | 1 (50.0%) | 0 (0.0%) |
| 6 to 18 Years | 6 (46.2%) | 8 (61.5%) |
| 19 to 25 Years | 2 (100.0%) | 0 (0.0%) |
| 25 to 34 Years | 2 (25.0%) | 2 (25.0%) |
| 35 to 44 Years | 7 (41.2%) | 2 (11.8%) |
| 45 to 54 Years | 2 (40.0%) | 1 (20.0%) |
| 55 to 64 Years | 0 (0.0%) | 16 (69.6%) |
| 65 to 74 Years | 14 (100.0%) | 4 (28.6%) |
| 75 Years and over | 6 (100.0%) | 0 (0.0%) |
| Total | 40 (44.4%) | 33 (36.7%) |
Disability Status by Sex by Age in Ouzinkie
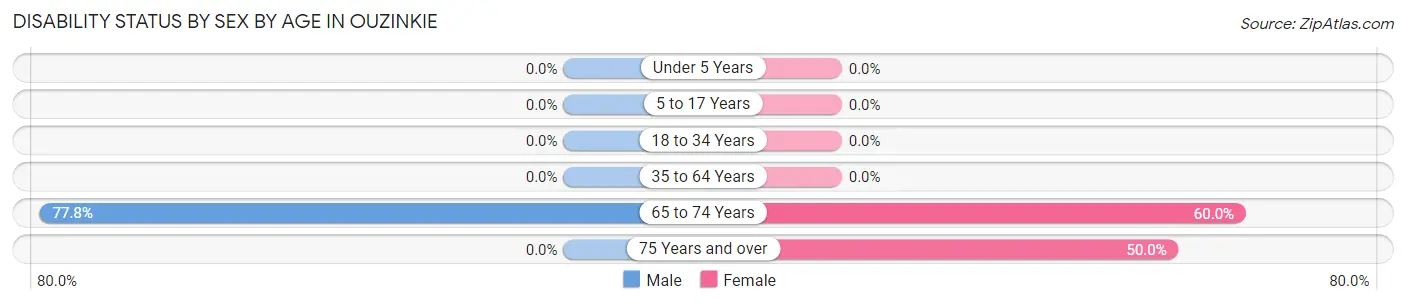
| Age Bracket | Male | Female |
| Under 5 Years | 0 (0.0%) | 0 (0.0%) |
| 5 to 17 Years | 0 (0.0%) | 0 (0.0%) |
| 18 to 34 Years | 0 (0.0%) | 0 (0.0%) |
| 35 to 64 Years | 0 (0.0%) | 0 (0.0%) |
| 65 to 74 Years | 7 (77.8%) | 3 (60.0%) |
| 75 Years and over | 0 (0.0%) | 3 (50.0%) |
Disability Class by Sex by Age in Ouzinkie
Disability Class: Hearing Difficulty
| Age Bracket | Male | Female |
| Under 5 Years | 0 (0.0%) | 0 (0.0%) |
| 5 to 17 Years | 0 (0.0%) | 0 (0.0%) |
| 18 to 34 Years | 0 (0.0%) | 0 (0.0%) |
| 35 to 64 Years | 0 (0.0%) | 0 (0.0%) |
| 65 to 74 Years | 0 (0.0%) | 0 (0.0%) |
| 75 Years and over | 0 (0.0%) | 0 (0.0%) |
Disability Class: Vision Difficulty
| Age Bracket | Male | Female |
| Under 5 Years | 0 (0.0%) | 0 (0.0%) |
| 5 to 17 Years | 0 (0.0%) | 0 (0.0%) |
| 18 to 34 Years | 0 (0.0%) | 0 (0.0%) |
| 35 to 64 Years | 0 (0.0%) | 0 (0.0%) |
| 65 to 74 Years | 2 (22.2%) | 0 (0.0%) |
| 75 Years and over | 0 (0.0%) | 0 (0.0%) |
Disability Class: Cognitive Difficulty
| Age Bracket | Male | Female |
| 5 to 17 Years | 0 (0.0%) | 0 (0.0%) |
| 18 to 34 Years | 0 (0.0%) | 0 (0.0%) |
| 35 to 64 Years | 0 (0.0%) | 0 (0.0%) |
| 65 to 74 Years | 0 (0.0%) | 0 (0.0%) |
| 75 Years and over | 0 (0.0%) | 3 (50.0%) |
Disability Class: Ambulatory Difficulty
| Age Bracket | Male | Female |
| 5 to 17 Years | 0 (0.0%) | 0 (0.0%) |
| 18 to 34 Years | 0 (0.0%) | 0 (0.0%) |
| 35 to 64 Years | 0 (0.0%) | 0 (0.0%) |
| 65 to 74 Years | 7 (77.8%) | 3 (60.0%) |
| 75 Years and over | 0 (0.0%) | 3 (50.0%) |
Disability Class: Self-Care Difficulty
| Age Bracket | Male | Female |
| 5 to 17 Years | 0 (0.0%) | 0 (0.0%) |
| 18 to 34 Years | 0 (0.0%) | 0 (0.0%) |
| 35 to 64 Years | 0 (0.0%) | 0 (0.0%) |
| 65 to 74 Years | 0 (0.0%) | 0 (0.0%) |
| 75 Years and over | 0 (0.0%) | 0 (0.0%) |
Technology Access in Ouzinkie
Computing Device Access in Ouzinkie
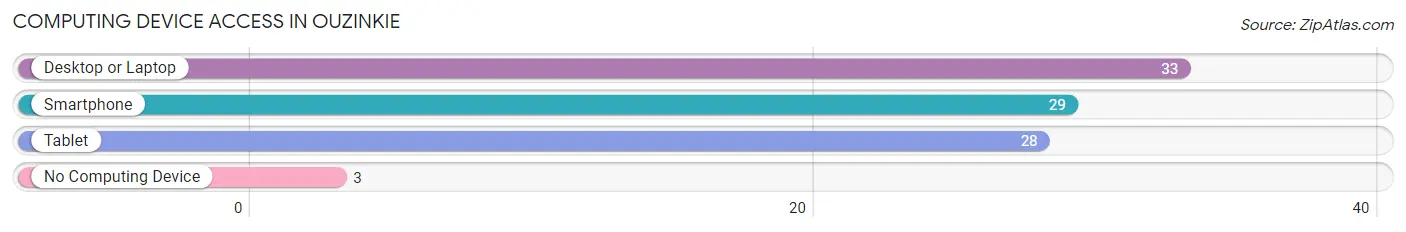
| Device Type | # Households | % Households |
| Desktop or Laptop | 33 | 82.5% |
| Smartphone | 29 | 72.5% |
| Tablet | 28 | 70.0% |
| No Computing Device | 3 | 7.5% |
| Total | 40 | 100.0% |
Internet Access in Ouzinkie
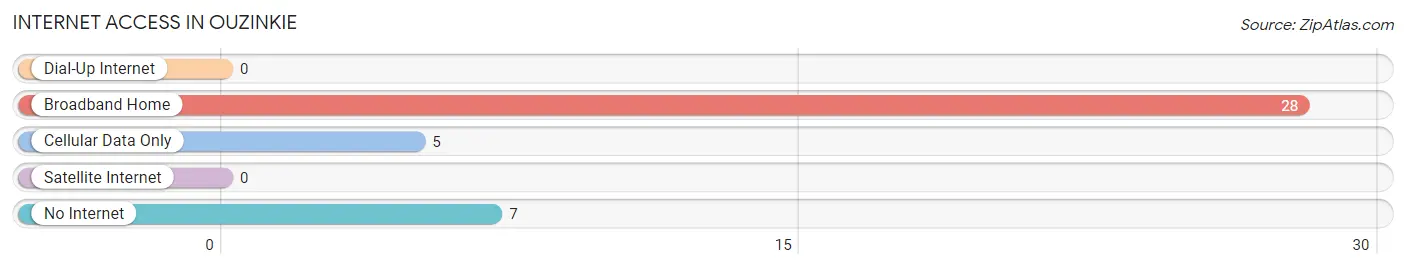
| Internet Type | # Households | % Households |
| Dial-Up Internet | 0 | 0.0% |
| Broadband Home | 28 | 70.0% |
| Cellular Data Only | 5 | 12.5% |
| Satellite Internet | 0 | 0.0% |
| No Internet | 7 | 17.5% |
| Total | 40 | 100.0% |
Ouzinkie Summary
Ouzinkie is a small unincorporated community located on the northern end of Spruce Island in the Kodiak Island Borough of Alaska. It is located approximately 8 miles southwest of the city of Kodiak and is accessible only by boat or plane. The population of Ouzinkie was estimated to be around 300 people in 2020.
History
Ouzinkie was first settled by the Sugpiaq people, who were the original inhabitants of the Kodiak Archipelago. The Sugpiaq people were a maritime people who relied on the sea for their livelihood. They were known for their skill in fishing, hunting, and gathering. The Sugpiaq people were also known for their potlatch ceremonies, which were held to celebrate important events and to redistribute wealth among the community.
The first recorded European contact with the Sugpiaq people of Ouzinkie was in 1784, when the Russian explorer Grigory Shelikhov arrived in the area. Shelikhov established a trading post in Ouzinkie and began trading with the Sugpiaq people. In 1804, the Russian-American Company was established and began to expand its operations in the area. The company built a fort in Ouzinkie and began to trade with the Sugpiaq people.
In 1867, the United States purchased Alaska from Russia and the area around Ouzinkie became part of the United States. In the late 1800s, the area around Ouzinkie began to be settled by non-Native Americans. The first non-Native American settlers in Ouzinkie were fishermen from Norway and Sweden. These settlers established a fishing village in Ouzinkie and began to fish for salmon and halibut.
In the early 1900s, the fishing industry in Ouzinkie began to decline due to overfishing and the introduction of new fishing technologies. In the 1920s, the canning industry began to move into the area and the canneries provided employment for many of the residents of Ouzinkie. The canneries also provided a market for the local fishermen to sell their catch.
In the 1950s, the canneries began to close and the fishing industry in Ouzinkie began to decline. In the 1960s, the Ouzinkie Native Corporation was established and the corporation began to purchase land in the area. The corporation also began to develop businesses in the area, such as a fish processing plant and a sawmill.
Geography
Ouzinkie is located on the northern end of Spruce Island in the Kodiak Island Borough of Alaska. The island is approximately 8 miles southwest of the city of Kodiak and is accessible only by boat or plane. The island is approximately 4 miles long and 1 mile wide and is surrounded by the Shelikof Strait. The island is mostly covered in dense forest and is home to a variety of wildlife, including bald eagles, sea otters, and sea lions.
Economy
The economy of Ouzinkie is largely based on fishing and tourism. The fishing industry in Ouzinkie is centered around the commercial fishing of salmon, halibut, and other fish species. The Ouzinkie Native Corporation also owns and operates a fish processing plant in the area.
Tourism is also an important part of the economy of Ouzinkie. The island is a popular destination for sport fishing, kayaking, and wildlife viewing. The island is also home to a variety of wildlife, including bald eagles, sea otters, and sea lions.
Demographics
The population of Ouzinkie was estimated to be around 300 people in 2020. The majority of the population is of Native American descent, with the majority being of Sugpiaq descent. The population is also composed of a small number of non-Native Americans, primarily of Norwegian and Swedish descent. The primary language spoken in Ouzinkie is English, although some residents also speak Sugpiaq.
Common Questions
What is Per Capita Income in Ouzinkie?
Per Capita income in Ouzinkie is $36,480.
What is the Median Household income in Ouzinkie?
Median Household Income in Ouzinkie is $53,750.
What is Inequality or Gini Index in Ouzinkie?
Inequality or Gini Index in Ouzinkie is 0.42.
What is the Total Population of Ouzinkie?
Total Population of Ouzinkie is 90.
What is the Total Male Population of Ouzinkie?
Total Male Population of Ouzinkie is 44.
What is the Total Female Population of Ouzinkie?
Total Female Population of Ouzinkie is 46.
What is the Ratio of Males per 100 Females in Ouzinkie?
There are 95.65 Males per 100 Females in Ouzinkie.
What is the Ratio of Females per 100 Males in Ouzinkie?
There are 104.55 Females per 100 Males in Ouzinkie.
What is the Median Population Age in Ouzinkie?
Median Population Age in Ouzinkie is 54.0 Years.
What is the Average Family Size in Ouzinkie
Average Family Size in Ouzinkie is 2.4 People.
What is the Average Household Size in Ouzinkie
Average Household Size in Ouzinkie is 2.2 People.
How Large is the Labor Force in Ouzinkie?
There are 58 People in the Labor Forcein in Ouzinkie.
What is the Percentage of People in the Labor Force in Ouzinkie?
77.3% of People are in the Labor Force in Ouzinkie.
What is the Unemployment Rate in Ouzinkie?
Unemployment Rate in Ouzinkie is 20.7%.